in utero and early life susceptibiity to carcinogens: the ... · a lifestage potency (lp) ratio...
TRANSCRIPT

SRP Draft
TECHNICAL SUPPORT DOCUMENT FOR CANCER POTENCY FACTORS
APPENDIX J
In Utero and Early Life Susceptibility to Carcinogens: The Derivation of Age-at-Exposure Sensitivity Measures

SRP Draft
g In Utero and Early Life Susceptibility to Carcinogens:
The Derivation of Age-at-Exposure Sensitivity Measures
December 2008
California Environmental Protection Agency Office of Environmental Health Hazard Assessment Reproductive and Cancer Hazard Assessment Branch
Deleted: October

SRP Draft
In Utero and Early Life Cancer i December 2008 Susceptibility: Age Sensitivity Measures OEHHA RCHAB
STUDY AUTHORS Martha S. Sandy, Ph.D., M.P.H., Chief Cancer Toxicology and Epidemiology Section Reproductive and Cancer Hazard Assessment Branch Claire D. Sherman, Ph.D. Biostatistician Cancer Toxicology and Epidemiology Section Reproductive and Cancer Hazard Assessment Branch Rajpal S. Tomar, Ph.D. Staff Toxicologist Cancer Toxicology and Epidemiology Section Reproductive and Cancer Hazard Assessment Branch Lauren Zeise, Ph.D., Chief Reproductive and Cancer Hazard Assessment Branch
STUDY REVIEWERS John Budroe, Ph.D. Staff Toxicologist Air Toxicology and Risk Assessment Section Air Toxicology and Epidemiology Branch Andy Salmon, M.A., D. Phil., Chief Air Toxicology and Risk Assessment Section Air Toxicology and Epidemiology Branch Melanie Marty, Ph.D., Chief Air Toxicology and Epidemiology Branch Robert Howd, Ph.D., Chief Water Toxicology Section Pesticide and Environmental Toxicology Branch George V. Alexeeff, Ph.D. Deputy Director for Scientific Affairs Allan Hirsch Chief Deputy Director
The contributions of Daniel Sultana, M.S. and Lindsey Roth, M.A. in preparing many of this report’s figures, and the contributions of Thomas McDonald, Ph.D., Kate MacGregor, M.P.H., Safie Yaghoubi, M.S., and Robert Schlag, M.S. to the identification and initial evaluation and analysis of animal cancer studies with early life exposure to carcinogens are gratefully acknowledged.
Deleted: October

SRP Draft
SRP Draft
In Utero and Early Life Cancer ii December 2008 Susceptibility: Age Sensitivity Measures OEHHA RCHAB
TABLE OF CONTENTS
Executive Summary.........................................................................................1
Background ......................................................................................................9
Animal Studies of Age Susceptibility............................................................11
Lifestage Exposure Periods ...................................................................11
Criteria for Study Inclusion ..................................................................13
Data Sources ........................................................................................ 14
An Experiment ......................................................................................15
Multi-Lifestage Exposure Studies ........................................................15
Chemical-Specific Case Studies Data: DEN and ENU ...................... 17
Methods..........................................................................................................19
Cancer Potency.......................................................................................19
Procedure to Estimate Cancer Potency ..................................................21
Use of ASFs to Address Early-Age Sensitivity in Estimating
Cancer Risk:.......................................................................................24
Deriving LP Ratios and ASFs for Multi-Lifestage Exposure Studies.. 25
Chemical-Specific Case Studies ............................................................26
Results ...........................................................................................................29
Prenatal Multi-Lifestage Exposure Studies ..........................................29
Postnatal Multi-Lifestage Exposure Studies..........................................37
Juvenile Multi-Lifestage Exposure Studies ...........................................42
DEN Case Study ....................................................................................48
ENU Case Study ....................................................................................57
Discussion ......................................................................................................66
References......................................................................................................75
Deleted: Windows
Deleted: Window
Deleted: ing
Deleted: Cancer
Deleted: Age Sensitivity Factors (ASFs)
Deleted: Sensitivity Factor
Deleted: window
Deleted: Window
Deleted: Window
Deleted: Window
Deleted: October

SRP Draft
In Utero and Early Life Cancer iii December 2008 Susceptibility: Age Sensitivity Measures OEHHA RCHAB
Appendices.................................................................................................. A-1
A. Default Body Weights for Rats and Mice During the First Six Months of Life ............................................................. A-2
B. Lifestage Potency (LP) Ratios for Multi-Lifestage Exposure
Studies .................................................................................... . A-15
Prenatal LP Ratios............................................................... A-16 Postnatal LP Ratios ............................................................ A-18 Juvenile LP Ratios .............................................................. A-22
C. Sensitivity Analyses: LP Ratio Mixture Frequency Distributions for Multi-Lifestage Exposure Studies ............... A-23
Prenatal ASF Mixture Frequency Distributions ................. A-23 Postnatal ASF Mixture Frequency Distributions............... A-28 Juvenile ASF Mixture Frequency Distributions................. A-30
D. DEN Case Study: Cancer Potency Distributions for DEN
Experiments ........................................................................ A-34
E. ENU Case Study: Cancer Potency Distributions for ENU Experiments ....................................................................... A-39
F. Early Life Across-Lifestage Exposure Studies of Two Non- Genotoxic Carcinogens ..................................................... A-43
Formatted: Portuguese (Brazil)
Formatted: Portuguese (Brazil)
Formatted: Numbered + Level: 1 +Numbering Style: A, B, C, … + Startat: 3 + Alignment: Left + Aligned at: 36 pt + Tab after: 56.25 pt + Indentat: 56.25 pt
Deleted: Unadjusted ASFs
Deleted: Wi
Deleted: Exposure Window
Deleted: Exposure Window
Deleted: Exposure Window
Deleted: ASF
Deleted: ¶ f
Deleted: Window
Deleted: Exposure Window
Deleted: Exposure Window
Deleted: Exposure Window
Deleted: Window
Deleted: October

SRP Draft

SRP Draft
In Utero and Early Life Cancer 1 December 2008 Susceptibility: Age Sensitivity Measures OEHHA RCHAB
Executive Summary Early-in-life susceptibility to carcinogens has long been recognized by the scientific community
and clinicians as a public health concern. Numerous scientific publications and symposia have
addressed this issue over the years and the scientific literature contains a number of human
clinical findings and epidemiological studies of early life cancer susceptibility. While there are
many indications of increased human cancer susceptibility in early life, the magnitude of the
impact has been difficult to gauge. Until recently risk assessment procedures have not in general
addressed the issue. The California legislature in 2000 recognized the need for a systematic
approach to develop scientifically based methods to address this concern so that in
environmental decision making special sensitivities of the developing fetus, and the young were
taken into account. The legislature directed the Office of Environmental Health Hazard
Assessment (OEHHA) to assess methodologies used in addressing early-in-life risk, compile
animal data to evaluate those methods, and develop methods to adequately address carcinogenic
exposures to the fetus, infants, and children (Children’s Environmental Health Initiative [AB
2872, Shelly]; California Health and Safety Code [HSC] section 901 [a] through [e]).
In 2001, OEHHA assessed cancer risk assessment methodologies, and concluded that the
existing risk assessment approaches did not adequately address the possibility that risk from
early-in-life exposures may differ from that associated with exposures occurring in adulthood.
OEHHA further concluded that there was a need for methodologies addressing early-in-life
cancer risk to be developed, tested, and validated.
Also in 2001, OEHHA began compiling animal cancer studies with early life exposure to
carcinogens, as a first step toward developing methods to address early-in-life cancer risk. Two
types of studies with early-in-life carcinogen exposures were compiled. The first type are
“multi-lifestage exposure studies.” These studies have at least two groups exposed during
different lifestages. The prenatal lifestage is defined as the period from conception to birth, the
postnatal lifestage is defined as the period from birth to weaning, the juvenile lifestage is defined
as the period from weaning to sexual maturity, and the adult lifestage is defined as beginning at
the time of sexual maturity. One dose group is exposed to a chemical only during one early
lifestage (prenatal, postnatal, or juvenile). The second dose group is exposed for some period of
Deleted:
Deleted: ,
Deleted: exposure window
Deleted: ,
Deleted: exposure
Deleted: in at least one of the following age groups
Deleted: October

SRP Draft
In Utero and Early Life Cancer 2 December 2008 Susceptibility: Age Sensitivity Measures OEHHA RCHAB
time at an older age, preferably during the adult lifestage. This group serves as the referent
group. In some cases where there was no adult exposure group, animals exposed as juveniles
served as the referent group. Multi-lifestage exposure studies are available for many
carcinogens, enabling the exploration of patterns in early-life susceptibility across chemicals.
The second type are “single-lifestage exposure experiments.” In these “single-lifestage exposure
experiments” dose groups were exposed to a carcinogen only during a particular lifestage and,
unlike the “multi-lifestage exposure studies,” there was no requirement that the same study also
include groups exposed during a different lifestage. Thus, single-lifestage exposure experiments
were identified as being either prenatal, postnatal, juvenile, or adult exposure studies. OEHHA
conducted “chemical-specific case studies” of early-life sensitivity for two specific carcinogens,
ethyl-N-nitrosoamine (DEN) and N-ethyl-N-nitrosourea (ENU). For each of the two chemicals,
there were many prenatal studies conducted that were compiled, analyzed, and grouped together.
Postnatal studies from different publications were similarly compiled, analyzed and grouped
together, as were juvenile studies. Adult studies were not available for either DEN or ENU, thus
for both chemicals juvenile exposure studies served as the referent for prenatal studies, and for
postnatal studies. These “chemical-specific case studies” were conducted to explore the
feasibility of analyzing chemical-specific data on age susceptibility from single-lifestage
exposure experiments.
This document presents 1) the statistical methods developed and used to systematically analyze
the data from multi-lifestage exposure studies and single-lifestage exposure experiments to
derive measures of early-life susceptibility; 2) the results of applying these analyses to multi-
lifestage exposure studies on 23 unique carcinogens and two chemical-specific case studies of
single-lifestage exposure experiments on diethylnitrosamine (DEN) and ethylnitrosourea (ENU);
and 3) conclusions regarding the sensitivity of the fetus, infants, and children to carcinogen
exposures.
Analytical Approach
Analysis of the data involved the derivation of a cancer potency, that is, the slope of the dose
response curve, for each of the experiments selected, using the linearized multistage model. This
model was chosen because of widespread use in risk assessment, and its flexibility in being able
Formatted: Space Before: 0 pt
Formatted: Normal, Space Before: 0 pt
Formatted: Line spacing: 1.5 lines
Deleted: − prenatal (from conception to birth), postnatal (from birth to weaning), juvenile (from weaning to sexual maturity)
Deleted: − along with an older age-at-exposure reference group. The second type, “chemical-specific case studies,” supports the study of age susceptibility for individual carcinogens. These chemical-specific case studies involve the compilation of experiments conducted with a specific carcinogen, in which groups of animals were exposed during any one of the exposure windows named above. 
Deleted: exposure window studies
Deleted: case
Deleted: studies
Deleted: exposure window studies
Deleted: October

SRP Draft
In Utero and Early Life Cancer 3 December 2008 Susceptibility: Age Sensitivity Measures OEHHA RCHAB
to fit many different data sets needed to evaluate the effect of lifestage-at-exposure on cancer
potency. To take into account uncertainty in potency estimation, cancer potencies are depicted
by a statistical distribution, generated using profile-likelihood methods, rather than by a single,
fixed value.
An “experiment” was defined as a study component consisting of a control group as well as a
treated group(s) exposed during the same lifestage and using the same experimental protocol
(e.g., route of exposure, strain, species, laboratory). When treatment-related tumors were
observed at multiple sites in an experiment, or at the same site, but arising from different cell
types, slopes from these different sites or types were statistically combined to create an overall
multisite cancer potency for that experiment. It is not uncommon that a carcinogen causes more
than one type of cancer or causes tumors at different sites depending on lifestage at exposure. In
order to account for this, all treatment-related tumors that were observed in a given lifestage
were taken into account in estimating cancer potency from that particular experiment.
OEHHA calculated the ratio of cancer potency derived from an early lifestage exposure
experiment to that derived from an experiment conducted in adult animals, referred to here as a
lifestage potency (LP) ratio. OEHHA used the potency distributions for the individual lifestage
exposures, rather than a point estimate, to derive the ratios. The lifestage cancer potency ratio is
then described as a distribution and one can select specific percentiles from the distribution to
better understand and bound the uncertainty.
A lifestage potency (LP) ratio distribution was derived for each multi-lifestage exposure study,
resulting in 22 prenatal ratio distributions representing 14 unique carcinogens, 55 postnatal LP
ratio distributions representing 18 unique carcinogens, and seven juvenile LP ratio distributions
representing five unique carcinogens. The LP ratio distributions for a given early lifestage were
combined into a single “LP ratio mixture distribution,” in order to show the range of
susceptibilities of that lifestage to the carcinogens studied.
LP ratio mixture distributions for a given early lifestage were developed by (1) obtaining a single
LP ratio distribution for each chemical (when a chemical is represented by more than one study)
and then (2) equally sampling across all chemicals. When a chemical is represented by more Formatted: Line spacing: 1.5 lines
Deleted: .
Deleted:
Deleted: T
Deleted: , referred to here as an age sensitivity factor (ASF), was taken as a measure of early-life susceptibility. Two types of ASFs are developed for each early life age window: An unadjusted and an adjusted ASF. The unadjusted ASF focuses on the inherent susceptibility of the young to the carcinogen and considers potencies for individuals followed for similar periods of time and similarly exposed but for the age window in which the exposure occurs. Thus the unadjusted ASF does not address the longer period of time that carcinogen exposure to the young has to manifest as cancer, also referred to as the longer “shelf-life” (or expected years of life remaining) of the carcinogen-exposed fetus, infant, or child, as compared to the shorter “shelf-life” of the carcinogen-exposed adult. Application of a time-of-dosing adjustment based on the Doll-Armitage model of carcinogenesis is then applied to address this issue of “shelf-life.” The resulting “adjusted ASF” addresses both the inherent susceptibility to the young to some carcinogens as well as the “shelf life” issue.
Deleted: October
SRP Draft
In Utero and Early Life Cancer 4 December 2008 Susceptibility: Age Sensitivity Measures OEHHA RCHAB
than one study, then the LP ratio distributions from all studies of that chemical were combined
by equally sampling from each LP ratio distribution via Monte Carlo methods to obtain a single
LP ratio distribution for that chemical. Sensitivity analyses were also conducted, employing
alternative sampling methods to obtain a single LP ratio distribution to represent each chemical
for which there were multiple studies. Once each chemical is represented by a single LP ratio
distribution, then the LP ratio mixture distribution for each early lifestage (prenatal, postnatal,
and juvenile) is obtained by equally sampling across all of the chemicals via Monte Carlo
methods.
The LP ratios characterize the inherent susceptibility of early lifestages to carcinogen exposure,
by comparing potencies for individuals followed for similar periods of time and similarly
exposed, but exposed during different lifestages. Cancer risk increases with age, or time since
first exposure, and age-specific adjustments to the cancer potency must also take this into
account. Thus, consistent with the approach used by the National Toxicology Program (NTP) in
analyzing rodent cancer bioassay data, the longer period of time that exposed young have to
develop tumors is addressed by taking into account time-of-dosing, and assuming that cancer risk
increases by the third power of age. This was done by multiplying the LP ratio by a time-of-
dosing factor, to yield an age sensitivity factor (ASF). Specifically, the prenatal LP ratio is
multiplied by a factor of 3.0, the postnatal LP ratio is multiplied by a factor of 2.9, and the
juvenile LP ratio is multiplied by 2.7. Thus, the ASF calculated for carcinogens includes both
inherent sensitivity of developing animals and the available time since exposure to develop
cancer.
Characteristics of the Chemicals Studied
Twenty of the 23 carcinogens included in the multi-lifestage exposure studies analyses are
considered to act via primarily genotoxic modes of action, with 15 thought to require metabolic
activation to the ultimate carcinogenic species. Fourteen carcinogens, including one thought to
act via primarily nongenotoxic modes of action, were included in the prenatal multi-lifestage
exposure studies. Eighteen carcinogens, including two thought to act via primarily nongenotoxic
modes of action, were included in the postnatal multi-lifestage exposure studies. Five
carcinogens were included in the juvenile multi-lifestage exposure studies. The chemical-
Formatted: Font: 13 pt
Formatted: Font: 13 pt, Not Bold,Not Italic
Formatted: Font: Not Bold, NotItalic
Formatted: Indent: First line: 0 pt
Deleted: Prenatal, postnatal and juvenile ASFs were developed for the 23 carcinogens with multi-window experiments and similarly, ratios of potencies for “early life” to “later life” exposures (e.g., prenatal:juvenile and postnatal:juvenile) were developed for the case studies.¶¶
Deleted: exposure window
Deleted: 6
Deleted: window studies with prenatal exposure group.
Deleted: window
Deleted: with postnatal exposure groups
Deleted: window
Deleted: with juvenile exposure groups
Deleted: October

SRP Draft
In Utero and Early Life Cancer 5 December 2008 Susceptibility: Age Sensitivity Measures OEHHA RCHAB
specific case study chemicals, DEN and ENU, are both genotoxic. ENU is a direct acting
alkylating agent, while DEN requires metabolic activation.
Results
The results of the multi-lifestage exposure studies and chemical-specific case study analyses
indicate that the prenatal, postnatal, and juvenile lifestages can be, but are not always, much
more susceptible to developing cancer than the adult lifestage. While there is a great deal of
variability across the chemicals studied in the prenatal ASFs, the potency associated with
prenatal carcinogen exposure is not zero. The median estimate of the prenatal ASF mixture
distribution from the multi-lifestage exposure studies analysis,was 2.9, and the mean estimate
was 21.0. The DEN and ENU case studies illustrate the variability across chemicals in the
sensitivity of the prenatal period, with results for DEN suggesting inherently less sensitivity than
older animals from in utero exposure, and for ENU just the opposite. ENU does not require
metabolic activation, whereas DEN does and cannot be metabolized to any significant extent by
fetal tissues until relatively late in gestation. This may explain the lower fetal susceptibility of
DEN. However, the multi-lifestage exposure studies illustrate that in utero metabolic status is
not the sole determinant of in utero susceptibility: benzidine and safrole require metabolic
activation and exhibit greater susceptibility from in utero exposure.
In the case of exposures occurring during the postnatal lifestage, the data indicate an inherently
greater susceptibility compared to the adult lifestage. The median estimate of the postnatal LP
ratio mixture distribution was 4.6 and the mean estimate was 27.1. The median estimate of the
postnatal ASF mixture distribution from the multi-lifestage exposure studies analysis was 13.4
and the mean estimate was 78.5. The DEN and ENU case studies also exhibit substantial
sensitivity during the postnatal lifestage.
While there were just five chemicals and seven studies, two of which were not independent,
available to examine susceptibility in the juvenile lifestage, significantly greater susceptibility
compared to the adult lifestage was observed in three of the six independent studies. The median
estimate of the juvenile ASF mixture distribution from the multi-lifestage exposure studies
analysis was 4.5 and the mean estimate was from 7.1.
Deleted: window M…s…s…window … adjusted to take into account the longer period for cancer to manifest after early life exposures, range from…8…to 7.5 s…from…16….6 to 37.1, depending on the method used to combine
Deleted: age window…period…M…unadjusted ASF…are …– 7.4…estimates …are… – 42.4, depending on the method used to combine studies… increased susceptibility appears even more pronounced once adjustments are made to take into account the long period cancer has to manifest when exposure occurs early in life. M…s…adjusted s…window …range from…to 21.6 s…from … to 123.1, depending on the method used to combine studies…period
Deleted: …period…period M…s…adjusted …s…window a…range from…to 5.5 …s… to 9.4, depending upon the method used to combine studies
Deleted: October
... [1]
... [3]
... [2]
SRP Draft
In Utero and Early Life Cancer 6 December 2008 Susceptibility: Age Sensitivity Measures OEHHA RCHAB
The multi-lifestage exposure studies and chemical-specific case studies exhibited considerable
variability across carcinogens in age-at-exposure related susceptibility. There is also variability
in age-at-exposure related susceptibility among studies of the same carcinogen. The sources of
variability evident in the analyzed studies include timing of exposure within a given lifestage,
and gender, strain, and species differences in tumor response. The set of studies identified and
analyzed in this document was not sufficiently robust to fully describe quantitatively the
variability. This variability raises concerns that selection of the median, that is the 50th
percentile, estimates for lifestage-specific ASFs may considerably underestimate effects for
certain carcinogens or population groups. Relatively large variability in humans in response to
carcinogens is expected to be common (Finkel, 1995; 2002).
Discussion
Taken together, these results indicate that early lifestages are generally more sensitive to
carcinogen exposure than adults, and that cancer risk assessment practices should take increased
sensitivity of the young into account. When data on age-at-exposure related susceptibility are
lacking for a specific carcinogen, these analyses indicate that increased susceptibility of the
young is a scientifically justifiable assumption. This early-life susceptibility can be addressed by
applying adjustments such as ASFs to the adult cancer potency slope factor when estimating
cancer risk associated with early life exposures.
Table 1 illustrates the effect of lifestage-specific ASFs on lifetime cancer risk. In this example,
exposure to the carcinogen is assumed to occur at a constant exposure rate over the entire
lifetime. Risk calculations were performed using the mean, 50th, 70th, and 95th percentile ASF
values. As shown in Table 1, when increased susceptibility of the fetus, infants, and children is
taken into account by applying 50th percentile ASF values, the total lifetime cancer risk is
increased two-fold; applying 70th percentile ASF values increases the estimate three-fold,
applying mean ASF values increases the estimate nearly five-fold, and applying 95th percentile
ASF values increases the estimate 16-fold above the risk estimated in the absence of age-specific
adjustments to the potency.
Deleted: window
Deleted: age window
Deleted:
Deleted: age window-
Deleted: age-window
Deleted: October

SRP Draft
In Utero and Early Life Cancer 7 December 2008 Susceptibility: Age Sensitivity Measures OEHHA RCHAB
Table 1. Comparison of cancer risk estimates1 for lifetime exposure to 0.0001 mg/kg-d of a carcinogen with potency 1 (mg/kg-d)-1 based on different parameters of ASF distributions, or U.S. EPA values.
No adjustment 50th percentile 70th percentile Mean 95th percentile U.S. EPA (2005) Lifestage Years of life
exposed ASF Risk ASF Risk ASF Risk ASF Risk ASF Risk Factor Risk
In utero 0.75 0 0.0 3 3.2 × 10⁻⁶ 10 1.1 × 10⁻⁵ 21 2.2 × 10⁻⁵ 115 1.2 × 10⁻⁴ 0 0.0 Birth to <2 yr 2 1 2.9 × 10⁻⁶ 13 3.7 × 10⁻⁵ 28 7.9 × 10⁻⁵ 79 2.3 × 10⁻⁴ 350 1.0 × 10⁻³ 10 2.9 × 10⁻⁵
2 to <16 yr 14 1 2 × 10⁻⁵ 5 1.0 × 10⁻⁴ 7 1.4 × 10⁻⁴ 7 1.4 × 10⁻⁴ 20 4.0 × 10⁻⁴ 3 6.0 × 10⁻⁵ 16 to 70 yr 55 1 7.9 × 10⁻⁵ 1 7.9 × 10⁻⁵ 1 7.9 × 10⁻⁵ 1 7.9 × 10⁻⁵ 1 7.9 × 10⁻⁵ 1 7.9 × 10⁻⁵
Total lifetime risk
1.0 × 10⁻⁴
2.2 × 10⁻⁴ 3.1 × 10⁻⁴
4.7 × 10⁻⁴ 1.6 × 10⁻³ 1.7 × 10⁻⁴
1 Risk accrued in age window = potency × ASF × exposure rate × (years exposed/70 years).
Formatted: Font: 13 pt
Deleted: 2
Deleted: Age window
Deleted: .¶2 ASF derived using equal weighting of studies within a chemical (i.e., Method 1 in main text)
Deleted:
Deleted: October
SRP Draft
8
Similar, albeit more limited conclusions regarding sensitivity of the young to carcinogens were
reached by the U.S. Environmental Protection Agency (U.S. EPA, 2005), in its Supplemental
Guidance for Assessing Susceptibility from Early-Life Exposure to Carcinogens. Specifically,
the U.S. EPA (2005) concluded that there is evidence of differential susceptibility for mutagenic
carcinogens and recommended adjustments to the adult cancer slope factor and to estimate
cancer risk from early life exposure. The U.S. EPA (2005) policy is to determine whether a
chemical operates by a mutagenic mode of action, and for those that do, apply a ten-fold
adjustment to the adult cancer slope factor for exposures occurring from birth up to two years of
age, and a three-fold adjustment for such exposures occurring from 2 up to 16 years of age. The
U.S. EPA (2005) does not adjust for increased susceptibility of the fetus to carcinogen
exposures, or for the full lifetime ahead for cancer to manifest following early life exposures. It
also does not apply any adjustments for non-mutagenic carcinogens, even though there is
increasing appreciation of the importance of epigenetic and other non-mutagenic mechanisms in
carcinogenesis, and recognition of epigenetic changes as early events in human carcinogenesis
(Baylin, 2005).
The U.S. EPA’s factor of 10 for postnatal exposures falls just below the median estimate for the
postnatal ASF (See Table 1). Thus, while it is consistent with the multi-lifestage exposure
studies analysis presented here, it may result in underestimates of risk for a reasonable fraction of
chemicals. The U.S. EPA’s factor of three for juvenile exposures is generally consistent with the
juvenile ASF derived from the multi-lifestage exposure studies, although it falls below the
median estimate. It is acknowledged that there are few data available on which to base an
estimate for the juvenile lifestage. A factor of three accounts for the long available time for
cancer to manifest when exposure occurs in this period, but would not fully account for inherent
differences in susceptibility to cancer, as is observed in breast tissue of pubescent girls exposed
to radiation.
The U.S. EPA and existing California practice does not estimate contributions from prenatal
carcinogen exposure when estimating lifetime cancer risk. This is an implicit assumption in risk
calculation that risk from prenatal exposure is zero. As shown in the multi-lifestage exposure
studies analysis presented here, this assumption is inconsistent with the available evidence.
Deleted: be
Deleted: derived for the postnatal window
Deleted: window
Deleted: range of estimate
Deleted: s
Deleted: window
Deleted: s
Deleted: period
Deleted: djusts
Deleted: window
Deleted: y

SRP Draft
9
Moreover, the analysis presented here suggests that a prenatal adjustment factor to the adult
potency is needed; a factor of 10 falls roughly at the 70th percentile for the prenatal multi-
lifestage exposure studies; the mean value is 21.
Table 1 shows how the application of the U.S. EPA’s adjustment factors to calculate lifetime
cancer risk compares with the use of the ASF values derived from the multi-lifestage exposure
studies here. For example, the use of 70th percentile ASF values as adjustments for the prenatal,
postnatal, and juvenile periods increases the lifetime cancer risk estimate almost two-fold above
that estimated using the U.S. EPA’s adjustment factors.
Concluding Remarks
OEHHA recognizes the limitations in the data and analyses presented, including limitations
associated with the number and types of carcinogens with multi-lifestage exposure data; the non-
homogeneous nature of the available multi-lifestage exposure studies; the focus on broadly
defined lifestages, without attempting to describe changes in susceptibility that occur within
those broadly defined lifestages; and the use for several studies of juvenile animals as the later
life exposure group in cases where no adult exposure group was included. In addition, the
assumption that the cancer hazard function increases with the third power of age may result in an
underestimation of the true sensitivity of these early lifestages, if the true rate of increase with
age is greater than that.
Still the analyses do provide some guidance on the extent risk may be over- or underestimated by
current risk assessment approaches. The analyses support the application of weighting factors to
address potential increased susceptibility to carcinogen exposures occurring prenatally and
during the postnatal and juvenile lifestages.
Deleted: window
Deleted: window
Deleted: age windows
Deleted: window exposure
Deleted: window
Deleted: age window
Deleted: a
Deleted: n
Deleted: age window
Deleted: in adjusting the ASF to take into account the longer period of time for early carcinogen exposures to manifest,
Deleted:
Deleted: age period

SRP Draft
10
Background Early-in-life susceptibility to carcinogens has long been recognized by the scientific community
and clinicians as a public health concern. Numerous scientific publications and symposia have
addressed this issue over the years (e.g., Toth, 1968; Rice, 1979; Napalkov et al., 1989; NRC,
1990; 1993; 1994; Anderson et al., 2000; Miller et al., 2002; Birnbaum and Fenton, 2003;
Ginsberg, 2003; Hattis et al., 2004; 2005; Barton et al., 2005). The scientific literature contains
a number of human clinical findings and epidemiological studies of early life cancer
susceptibility.
Table 2 provides examples of various human cases of early life cancer susceptibility. In the
early 1960’s, clear cell vaginal adenocarcinoma began appearing in teenagers and young women
whose mothers took the synthetic estrogen diethylstilbestrol (DES) to avoid pregnancy loss
(Herbst et al., 1971; Preston-Martin, 1989). Observations of marked differences in breast cancer
risk in teenage compared to pre-pubescent girls treated for Hodgkin’s disease with X-irradiation
(Bhatia et al., 1996) underscored the importance of considering life stage in assessing risks of
cancer treatment and follow-up to it. The susceptibility of the fetus, infants, and children to
thyroid carcinoma following exposure to radioactive iodine (Moysich et al., 2002) and of
children under 18 years of age to post-transplant lymphoma (Penn, 2000) has also been
recognized.
Formatted: Left

SRP Draft
11
Table 2. Examples of Early-Life Cancer Susceptibility in Humans
Agent (reference)
Susceptible Group Case
Diethylstilbestrol (DES) (Herbst et al., 1971; Preston-Martin, 1989)
Fetus In utero exposure arising from administration of DES during pregnancy resulted in an increased risk of adenocarcinoma of the vagina and cervix in the daughters, but not in mothers taking the drug
X-Irradiation treatment for Hodgkins lymphoma (Bhatia et al., 1996)
Girls with developing breast tissue (10-16 years old)
10-16 year old girls considerably much more likely to develop breast cancer than those under age 10 similarly treated. Risk of cancer by age 40: 35%
Radioactive iodine fallout from the 1986 Chernobyl accident (Moysich et al., 2002)
Fetus/children An increased risk of thyroid carcinoma was observed in children from Ukraine and Belarus exposed to radioactive iodine fallout. The greatest risk of thyroid carcinoma was observed in children aged five and under at the time of the accident.
Immunosuppressive drug treatment associated with organ allograft (Penn, 2000)
Children ages 18 years or less
Children are more prone to develop post-transplant lymphomas and lymphoproliferative disorders than adults (53% vs. 15%)
While there are many indications of increased human cancer susceptibility in early life, the
magnitude of the impact has been difficult to gauge, and until recently risk assessment
procedures have not in general addressed the issue. The California legislature in 2000
recognized the need for a systematic approach to develop scientifically based methods to address
this concern so that in environmental decision making special sensitivities of the developing
fetus and the young were taken into account. The legislature directed the Office of
Environmental Health Hazard Assessment (OEHHA) to assess methodologies used in addressing
early-in-life risk, compile animal data to evaluate those methods, and develop methods to
adequately address carcinogenic exposures to the fetus, infants, and children (Children’s
Environmental Health Initiative (AB 2872, Shelly); California Health and Safety Code [HSC]
section 901 (a) through (e)).

SRP Draft
12
Here the results of OEHHA’s quantitative analyses and synthesis of data from studies in animals
exposed to carcinogens during different lifestages are presented. First the compilation of data on
which the analysis relies is described. This is followed by a description of methods used to
analyze the data and derive measures of early-life susceptibility. The analytical approach first
evaluates differences in age sensitivity in terms of exposures in different lifestages for
individuals similarly exposed and followed for similar periods of time – characterizing the
inherent susceptibility of the young to the carcinogen. The second step of the analysis takes into
account the longer period of time that carcinogen exposure to the fetus, infant, or child has to
manifest as cancer, by taking into account time-of-dosing and assuming, in an approach
consistent with that used by the National Toxicology Program (NTP) in analyzing tumor
incidences in its chronic bioassays, that cancer risk increases with the third power of age.
Adjustment factors that would potentially account for early life exposures are then described.
These factors, referred to as age sensitivity factors (ASFs), address both inherent susceptibility of
the young and the available time since exposure to develop cancer (Figure 1). The work of other
bodies or researchers that have suggested or adopted methods to address early life exposure is
then described in the context of the analyses and adjustment factors presented here. The
document concludes by illustrating the impact of lifestage-specific ASFs on calculated lifetime
cancer risk, assuming in this example that carcinogen exposure occurs at a constant rate across
all lifestages, from conception through age 70.
Deleted:
Deleted: age windows
Deleted: thus it focuses on
Deleted: is
Deleted: part
Deleted: does not address
Deleted: those exposed as a
Deleted: ave
Deleted: , also referred to as the longer “shelf-life” (or expected years of life remaining), as compared to those exposed only as adults. Calculations are then presented to address this issue of “shelf-life,” the longer period of time for a carcinogenic exposure during youth to manifest compared to an adult exposure.
Deleted: would
Deleted: the
Deleted: to the young to some carcinogens
Deleted: as well as the “shelf life” issue.
Deleted: age-window
Deleted: age
Deleted: windows

SRP Draft
13
Figure 1. Issues addressed by the Age-Sensitivity Factor, or “ASF”
Step 1: Inherent Susceptibility of Different Lifestages
Dosing Observation
Postnatalexposure
Adultexposure
Dosing Observation sacrifice
deathprenatal
birth
postnatal juvenile adult
Lifestage
Step 2: Time for Cancer to Manifest for Exposures during Different Lifestages
Early Exposure – Longer Time to Manifest as Cancer
sacrifice
Older Exposure – Shorter Time to Manifest as Cancer
Animal Studies of Age Susceptibility
Lifestage Exposure Periods OEHHA has identified and compiled published animal cancer bioassays exploring age
susceptibility issues. Two types of studies with early life carcinogen exposures were included in
this effort. The first type are “multi-lifestage exposure studies.” These studies have at least two
Formatted: Font: 13 pt
Deleted: <sp>
Deleted: Windows
Deleted: is of studies –
Deleted: exposure window
Deleted: –
Deleted: that

SRP Draft
14
groups exposed during different lifestages. One dose group is exposed to a chemical only during
one of the following lifestages:
• prenatal: from conception to birth
• postnatal: from birth to weaning
• juvenile: from weaning to sexual maturity (Figure 2).
The second dose group is exposed for some period of time at an older age, preferably during the
adult lifestage, that is, after sexual maturity. This group served as the referent group. In some
cases where there was no adult exposure group, animals exposed as juveniles served as the
referent group. Studies or groups in which the exposure period for a given group spanned
multiple life stages were not included in this effort. Multi-lifestage exposure studies are
available for many chemicals, enabling the exploration of patterns in early-life susceptibility
across chemicals.
Figure 2. Definition of Rodent Lifestage Adopted in the OEHHA Analyses
Prenatal PostnatalAdult
Juvenile
conception birth day 22 ≈day 49 2 years//
The second type are “single-lifestage exposure experiments.” In these “single-lifestage exposure
experiments” dose groups were exposed to a carcinogen only during a particular lifestage and,
unlike the “multi-lifestage exposure studies,” there was no requirement that the same study also
include groups exposed during a different lifestage. Thus, single-lifestage exposure experiments
were identified as being either prenatal, postnatal, juvenile, or adult exposure studies. OEHHA
conducted “chemical-specific case studies” of early-life sensitivity for two specific carcinogens,
ethyl-N-nitrosoamine (DEN) and N-ethyl-N-nitrosourea (ENU). For each of the two chemicals,
Formatted: Indent: Left: 18 pt
Formatted: Font: 13 pt
Deleted: d exposure
Deleted: in at least
Deleted: age windows listed below, along with an older age-at-exposure reference group
Deleted: An adult exposure group was the
Deleted: red
Deleted: comparison or
Deleted: ce

SRP Draft
15
there were many prenatal studies conducted that were compiled, analyzed, and grouped together.
Postnatal studies from different publications were similarly compiled, analyzed and grouped
together, as were juvenile studies. Adult studies were not available for either DEN or ENU, thus
for both chemicals juvenile exposure studies served as the referent for prenatal studies, and for
postnatal studies. These “chemical-specific case studies” were conducted to explore the
feasibility of analyzing chemical-specific data on age susceptibility from single-lifestage
exposure experiments.
There is little question regarding whether or not a certain bioassay group should be identified as
receiving exposure for certain lifestages. For example, where exposure to dams ends at birth,
offspring can be considered exposed during the prenatal period. The line between the juvenile
and adult lifestages is less clear. Assumptions had to therefore be made to categorize exposures
used in the bioassays into the lifestages named above. These assumptions were based on
standard reference documents and consultation with developmental biologists and toxicologists.
Table 3 gives the ages assumed in establishing the postnatal, juvenile, and adult lifestages for the
species included in the compiled studies with early life exposure.
Table 3. Definition of Lifestages by Species1. Species Postnatal:
Birth to Weaning
Juvenile: Weaning to
sexual maturity
Adult: Sexual
maturity/breeding age
Rat ─ male Day 1-21 Day 22-76 ≥ Day 77 (10 wks)Rat ─ female Day 1-21 Day 22-55 ≥ Day 56 (8 wks) Mouse Day 1-21 Day 22-48 ≥ Day 49 (7 wks) Hamster Day 1-21 Day 22-48 ≥ Day 49 (7 wks) Gerbil Day 1-28 Day 29-55 ≥ Day 56 (8 wks) 1The prenatal lifestage is defined as the period from conception to birth for all species. References: Merck, 1998; Harder et al. 1993; Fox et al., 1995; Harkness and Wagner, 1995; Charles River, 1999.
Typical cancer bioassays such as those conducted in rats and mice by NTP involve exposing
animals starting at six to eight weeks of age, which is the time at which these animals reach
sexual maturity (late teenagers relative to humans). The experiments are run for two years,
ending when the animal is in late middle age. Thus, early and very late life exposures are not
Formatted: Left
Formatted Table
Formatted: Indent: Left: 0 pt
Deleted: For the purpose of this analysis, the adult exposure window was defined as the period from sexual maturity to death. A few studies with prenatal or postnatal window exposure groups, did not include an adult group, but did include a juvenile group. In these cases the juvenile group was the reference group used in the data analyses. Studies or groups in which the exposure period for a given group spanned multiple life stages were not included in this effort. ¶¶A second type of early life exposure study is used to examine age susceptibility for individual chemicals in depth. These studies support the “chemical-specific case study” of these individual carcinogens. For the case studies, there is at least one group of animals in a bioassay dosed during one of the four exposure windows named above, and there are multiple such bioassays available for each early life exposure window evaluated (e.g., prenatal, postnatal, juvenile). In the current report we present results for two case studies: diethylnitrosamine (DEN) and ethylnitrosourea (ENU). 
Deleted: exposure windows
Deleted: exposure window
Deleted: exposure windows
Deleted: age window
Deleted: Age-Specific
Deleted: Exposure Windows
Deleted: exposure window

SRP Draft
16
included in the typical rodent bioassay (see Figure 3). Thus OEHHA focused on finding studies
that evaluated early in life exposures
Figure 3. Dosing Period for Typical Rodent Bioassays
conception birth 6-8 wks
2 years 3 years
Typical bioassaydosing period
sacrifice
Criteria for Study Inclusion
Bioassays examining responses in particular lifestages were for the most part designed by
different researchers to explore issues related to age susceptibility of carcinogens. The research
community did not for the most part standardize protocols for these studies. There is therefore a
great deal of variation across studies in terms of dose selection, duration of exposure, number of
animals, and length of study duration. To be included in the compilation of studies with early
life exposure, a study or an experimental group in a study had to meet minimum requirements.
The criteria for study inclusion are as follows:
• Treated groups were exposed to a single chemical carcinogen or a single carcinogenic
chemical mixture.
• Study groups were not compromised by severe treatment-related non-cancer toxicity.
• Overall the duration of exposure period plus observation period exceeded 40 weeks,
unless animals died of tumor.
• For included dose groups, the study must report age at dosing, age at sacrifice, and site-
specific tumor incidence.
Formatted: Font: 13 pt
Deleted: age window
Deleted: as
Deleted: s

SRP Draft
17
• Each lifestage exposure treatment group has an appropriate concurrent control group, or,
for rare tumors only, an appropriate historical control.
• The studies were on mammals.
• Each treatment and control group consists of at least ten animals, unless the conduct and
design of the study was well done in all other aspects (e.g., the length of the study was
sufficiently long to observe treatment-related tumors) and tumor incidence was high in
treated groups and very low in controls.
• Site specific tumor data were reported, and not only total number of tumor bearing
animals.
• The test compound was administered in the diet, water, via gavage, or by intraperitoneal
(i.p.), intravenous (i.v.), or subcutaneous (s.c.) injection. For dermal and subcutaneous
injection studies, distal tumor findings are utilized (for dermal, other than skin tumors;
for injection, non-injection site tumors).
• While studies designed to histopathologically examine tumors at multiple sites were
preferred, studies that examined only a select set of organ/tissue sites were not excluded
if the sites examined were known with confidence to be the only target tissues for the
chemical and age exposure window in question in that particular strain of animal.
Data Sources Different approaches were taken to identify animal cancer studies that included groups of
animals exposed during early lifestages. First, MEDLINE and TOXLINE (National Library of
Medicine) databases were searched using combinations of various key words for cancer (e.g.,
tumor(s), neoplasm(s), cancer, neoplasia, cancerous, neoplasms-chemically induced) and for
early-life exposure (e.g., age, age-at-exposure, development (al), prenatal, in utero, gestation (al),
postnatal, neonatal, juvenile, weaning, weanling, adolescent, adolescence, young). Second, the
extensive compilation of bioassays in the Survey of Compounds which have been Tested for
Carcinogenic Activity, was reviewed. This survey, formerly maintained by the National Cancer
Institute as Public Health Service Publication Number 149, or PHS 149, is now available from a
private source electronically as CancerChem, 2000. Third, from bibliographies from relevant
published papers additional studies were identified. Finally the Single Dose Database developed
Formatted: Bullets and Numbering
Deleted: window
Deleted: For dermal and subcutaneous injection studies, distal tumor findings are utilized (for dermal, other than skin tumors; for injection, non-injection site tumors). While studies designed to histopathologically examine tumors at multiple sites were preferred, studies that examined only a select set of organ/tissue sites were not excluded if the sites examined were known with confidence to be the only target tissues for the chemical and age exposure window in question in that particular strain of animal.
Deleted:

SRP Draft
18
by Calabrese and Blain (1999) was obtained and utilized to identify additional publications that
appeared to contain potentially useful data. All of these publications were evaluated to
determine if the study dosed separate groups of animals early in life and at or near adulthood. A
total of 145 publications, providing data on 84 chemicals, were identified as meeting the criteria
for study inclusion. A subset of these met the criteria for inclusion in the multi-lifestage
exposure analysis.
An Experiment
Here we define an experiment as a study component consisting of a control group as well as a
treated group(s) exposed during the same lifestage (i.e., prenatal, postnatal, juvenile or adult),
and using the same experimental protocol (e.g., route of exposure, strain, species, laboratory).
One publication may be a report for multiple experiments.
Multi-Lifestage Exposure Studies
Thirty-six of the 145 publications containing studies that met the selection criteria described
above reported multi-lifestage exposure studies (Figure 2 and Table 3), that is, they included at
least one group dosed solely in a defined early lifestage (prenatal, postnatal or juvenile), a
control group and a comparison group of animals exposed only as adults (preferred) or in some
cases, juveniles. Thus a multi-lifestage exposure study contains multiple experiments – at least
one experiment with exposure in a prenatal, postnatal or juvenile lifestage, and another
experiment with exposure in an older group, preferably adults. The publications on the multi-
lifestage exposure studies are listed in Table 4.
As indicated in Table 4, sixteen of the 36 multi-lifestage exposure publications included groups
of animals dosed only during the prenatal period, providing data on 14 chemicals. Twenty-five
of the multi-lifestage exposure publications included groups of animals dosed only during the
postnatal period, providing data on 18 chemicals. Five of the multi-lifestage exposure
publications included groups of animals dosed only during the juvenile period, as well as groups
of animals dosed only during the adult period, and provided data on five chemicals.
Experimental animal species employed in these studies included rats, mice, gerbils, and
hamsters.
Deleted: window
Deleted: or groups of animals
Deleted: -
Deleted: exposure window
Deleted: Windo
Deleted: w
Deleted: window
Deleted: -
Deleted: window
Deleted: window
Deleted: exposure window
Deleted: an
Deleted: exposure window experiment
Deleted: window
Deleted: window
Deleted: window
Deleted: window
Deleted: window
Deleted: window
Deleted: window
Deleted: window
Deleted: 

SRP Draft
19
Table 4. Multi-Lifestage Exposure Studies
Exposure Lifestages1 Chemical, CAS Number Species
Pr Po Ju AdPublication
√ √ Vesselinovitch et al., 1975b Benzidine, 92-87-5 Mouse
√ √ √ Vesselinovitch et al., 1979a
√ √ Vesselinovitch et al., 1975a Benzo[a]pyrene, 50-33-9 Mouse
√ √ Truhaut et al., 1966 1,1-Bis(p-chlorophenol)-2,2,2-trichloroethane (DDT), 50-29-3 Mouse √ √ Vesselinovitch et al.,
1979a Butylnitrosourea, 869-01-2 Rat √ √ √ Zeller et al., 1978 Dibutylnitrosamine, 924-16-3 Mouse √ √ Wood et al., 1970
Mouse √ √ Rao and Vesselinovitch, 1973
Mousea √ √ Vesselinovitch et al., 1984
√ √ Mohr et al., 1975e
Diethylnitrosamine (DEN), 55-18-5
Hamster √ √ Mohr et al., 1995
Diethylstilbesterol (DES), 56-53-1 Mouse √ √ Turusov et al., 1992 Rat √ √ √ Meranze et al., 1969 7,12-Dimethylbenz[a]anthracene
(DMBA), 57-97-6 Mouse √ √ Walters, 1966 1,2-Dimethylhydrazine, 540-73-8 Rat √ √ Martin et al., 1974
Hamster √ √ Althoff et al., 1977 Dimethylnitrosamine (DMN), 62-75-9 Rat √ √ Noronha and Goodall,
1984 √ √ Althoff et al., 1977 Di-n-propylnitrosamine (DPN),
621-64-7 Hamster √ √
Althoff and Grandjean, 1979
1-Ethylnitrosobiuret, 32976-88-8 Rat √ √ √ Druckrey and Landschutz, 1971
Gerbil √ √ Naito et al., 1985 √ √ Bosch, 1977
√ √ √ Naito et al., 1981 Rat √ √ Tomatis et al., 1977
Ethylnitrosourea (ENU), 759-73-9
Mousea √ √ Vesselinovitch et al., 1974
2-Hydroxypropylnitrosamine, 39603-53-7 Hamster √ √
Althoff and Grandjean, 1979
3-Hydroxyxanthine, 13279-29-3 Rat √ √ √ Anderson et al., 1978
Deleted: Page Break
Deleted: Window
Deleted: Age
Deleted: Windows

SRP Draft
20
Table 4. Multi-Lifestage Exposure Studies (continued)
Exposure Lifestages1 Chemical, CAS Number Species
Pr Po Ju AdPublication
√ √ Tomatis et al., 1971 √ √ Klein, 1959 3-Methylcholanthrene (3-MC),
56-49-5 Mouse √ √ Turusov et al., 1973
4-(Methylnitrosamino)-1-(3-pyridyl)-1-butanone (NNK), 64091-91-4
Mouse √ √ Anderson et al., 1989
Rat √c √d Grubbs et al., 1983
√ √ Terracini and Testa, 1970
Methylnitrosourea (MNU), 684-93-5 Mouse
√ √ Terracini et al., 1976
β-Propiolactone, 57-57-8 Mouse √ √ Chernozemski and Warwick, 1970
√ √ √ Vesselinovitch et al., 1979a Safrole, 94-59-7 Mouse
√ √ √ Vesselinovitch et al.,
1979b Tetrachlorodibenzodioxin (TCDD), 1746-01-6 Mouse √b √ Della Porta et al., 1987
Urethane, 51-79-6 Rat √ √ √ √e Choudari Kommineni et al., 1970
Vinyl chloride, 75-01-4 Rat √ √ √ Maltoni et al., 1981 1 Abbreviations: prenatal, Pr; postnatal, Po; Juvenile, Ju; adult, Ad. a Conducted in two strains of mice. bPostnatal dosing extended slightly into the juvenile period. c Dosing initiated toward the end of juvenile period in female rats, from day 50 to 57. dThere were two adult female rat exposure groups, one exposed from day 80 to 87, and the other from day 140-147. eDosing initiated in later part of the juvenile period, from day 46 to 61.
Chemical-Specific Case Studies Data: DEN and ENU
DEN and ENU are two well-studied model carcinogens, and their modes of carcinogenic action
and pharmacokinetic behaviors are relatively well understood. They both are genotoxic, and
form DNA adducts. DEN requires metabolic activation, while ENU does not. They both cross
the placenta. There are numerous experiments on DEN and ENU included in the compilation of
studies with early life exposure. For these reasons, these chemicals were selected as case studies.
Cancer potencies, defined below, were derived using the data from single-lifestage exposure
studies. Only data in the mouse were used, as this was the species in which the largest numbers
of early life exposure experiments were conducted on DEN and ENU.
Deleted: Window
Deleted: Age
Deleted: Windows
Deleted: 
Deleted: also
Deleted:
Deleted: for different age groups
Deleted: 
Deleted: 

SRP Draft
21
DEN. Ten mouse publications on DEN were identified (See Table 5). Among these
publications, three included studies of mice exposed during the prenatal lifestage, seven included
studies of mice exposed during the postnatal lifestage, and two included studies of mice exposed
during the juvenile lifestage. These publications yielded a total of eight prenatal datasets, 18
postnatal datasets, and five juvenile datasets. No “adult only” exposure studies were identified in
mice for DEN. Thus the juvenile lifestage exposure studies were used as the older age at
exposure comparison group. If the juvenile lifestage is more susceptible to DEN exposures than
the adult, then the use of these juvenile exposure studies as the comparison group will result in
an underestimate of the early life susceptibility associated with prenatal and postnatal exposure
to DEN.
Table 5. DEN and ENU Mouse Single-Lifestage Exposure Experiments
Exposure Lifestages1 Chemical, CAS Number
Pr Po Ju AdPublication
√ Anderson et al. (1989) √ Boberg et al. (1983) √ Drinkwater and Ginsler (1986) √ Lai et al. (1985)
√ Mohr and Althoff (1965) √ √ Rao and Vesselinovitch (1973) √ Turusov et al. (1973) √ √ Vesselinovitch et al. (1984) √ Vesselinovitch (1980)
Diethylnitrosamine (DEN), 55-18-5
√ Vesselinovitch (1983) √ Anderson et al. (1989)
√ Diwan et al. (1974) √ Drinkwater and Ginsler (1986)
√ Kaufman (1976) √ Naito et al. (1982) √ Pereira et al. (1985) √ Schmahl (1988) √ Searle and Jones (1976) √ Vesselinovitch et al. (1973) √ √ Vesselinovitch et al. (1974)
√ Vesselinovitch et al. (1977) √ √ √ Vesselinovitch (1983)
Ethylnitrosourea (ENU), 759-73-9
√ Wiggenhauser and Schmahl (1987)
Formatted: Font: 13 pt
Deleted: window
Deleted: window
Deleted: window
Deleted: exposure
Deleted: age ratio distributions for prenatal and postnatal exposure
Deleted: Studies
Deleted: Age
Deleted: Windows1

SRP Draft
22
ENU. Thirteen mouse publications on ENU were included in the compilation of studies with
early life exposure (See Table 5). Of these, five had studies on mice exposed during the prenatal
period, eight during the postnatal period, and three during the juvenile period. These
publications yielded a total of 30 prenatal datasets, 27 postnatal datasets, and eight juvenile
datasets. As with DEN, no “adult only” exposure studies were identified, and if the juvenile
lifestage is more susceptible to ENU exposures than the adult, then the use of these juvenile
exposure studies as the comparison group will result in an underestimate of the early life
susceptibility associated with prenatal and postnatal exposure to ENU.
Methods
This section describes the methods used to analyze and compare the carcinogenic activities of
compounds in different lifestages. First a measure of carcinogenic activity, the cancer potency,
is defined. Methods for deriving it from animal studies are then described. The ratio of cancer
potency derived from an early lifestage exposure experiment to that derived from an experiment
conducted in adult animals, referred to as a lifestage potency (LP) ratio, was calculated for each
multi-lifestage exposure study. The LP ratio characterizes the inherent susceptibility of early
lifestages to carcinogen exposure, by comparing potencies for individuals followed for similar
periods of time and similarly exposed, but exposed during different lifestages. The longer period
of time that exposed young have to develop tumors is addressed by taking into account time-of-
dosing, and assuming that cancer risk increases by the third power of age. This was done by
multiplying the LP ratio by a time-of-dosing factor, to yield the ASF, thus taking into account the
overall sensitivity associated with early-life exposure. Cancer potencies, LP ratios, and ASFs are
estimated from data and not measured precisely. To describe this uncertainty, these measures are
described by probability distributions. Methods for the derivation of these distributions are also
explained below.
Cancer Potency
Mathematic Model. Cancer potency estimates were derived by applying a linearized multistage
(LMS) model to cancer dose-response data from studies in experimental animals. This model
Deleted: window
Deleted: window
Deleted: window
Deleted:
Deleted: age ratio distributions for prenatal and postnatal exposure
Deleted: age windows
Deleted: A
Deleted: n age
Deleted: factor, or “
Deleted: ,” measures the carcinogenic activity in an early lifestage exposure window compared to adult exposure. The ASF is defined simply as the ratio of the cancer potency in an early age window to the cancer potency in the adult age window.
Deleted: For the multi-window studies, ASFs are derived for each experiment, and also for the different chemicals. For the DEN and ENU case studies, cancer potency is derived for each experiment. These in turn are used to derive distributions of cancer potency within a given life stage exposure window. There are no “adult only” exposure experiments for DEN and ENU in mice. The ratios for prenatal to juvenile potencies and postnatal to juvenile potencies are instead derived. Statistical methods employed for this are explained below.
Deleted: 

SRP Draft
23
was chosen because of widespread use in risk assessment, and its flexibility in being able to fit
many different data sets needed to evaluate the effect of lifestage-at-exposure on cancer potency.
Assuming dose-response is linear at low doses, the LMS model provides a mechanism of
bounding the quantitative estimates of low-dose risk from exposures to carcinogenic agents
(Crump et al., 1976; Peto, 1978). The LMS model may be described by the following equation
p(d) =1− e− qi d i
i=0
k−1
∑, ,0≥iq (1)
where p(d) represents the lifetime probability of cancer at a lifetime dose rate, d, and qi are
model parameters that were estimated via maximum likelihood methods, as described below. At
low doses the above equation reduces to:
When q0 is small this reduces to the simple linear relationship:
)(dp = q0 + q1d.
where the probability of cancer is represented in the unexposed by intercept q0 and in the
exposed increases linearly with dose d. Here, cancer potency is defined as the parameter q1: At
low doses, it describes quantitatively the extent that cancer risk increases with an incremental
increase in dose.
Dose Metric. The work here is to compare cancer potencies from experiments utilizing the same
protocols but for the lifestage in which dosing occurred. The dose metric adopted for this work
is the cumulative dose normalized by bodyweight:
∑=t
i
idd
di, the dose given on ith day of the experiment, is expressed in units milligram amount
administered per kilogram animal bodyweight (mg/kg-bw). This results in potencies that are
comparable in terms of the initial internal concentration after administration of the compound,
and the overall exposure during the lifestage. The cancer potency q1 is expressed as the increase
in risk with increasing cumulative dose, in units mg/kg-bw.
)( 101)( dqqedp +−−=
Deleted: -
Deleted: window
Deleted: -
Deleted: window
SRP Draft
24
Experiments did not always report dose administered in units mg/kg-bw. When dose was
reported as a concentration administered in diet or water, it was converted to mg/kg-bw based on
the amount of food or water consumed, the concentration in the media and the body weight of
the animal on the day of dosing. When dose was reported as bulk quantity applied (e.g., mg
amount), it was converted to mg/kg-bw by dividing by the body weight of the animal on the day
of dosing.
If the body weight on the day(s) of dosing was not reported in the publication, the default body
weight was used. The default body weights of rats and mice were modeled from normative data
on common strains of mice (BALB/cANCr, AKR/LwCr, and C57Bl/6Cr) surveyed by Poiley
(1972) and rats (Fischer 344 and Sprague-Dawley) surveyed by Poiley (1972) and Cameron et
al. (1985) using constrained linear regression and the statistical package STATA (Stata Corp,
College Station, Texas). The model takes the form:
BodyWeightage = β0 + β1 (day-1) + β2 (day-1)2 + β3 (day-1)3 + β4 (day-1)4 , where β0 was defined as the measured average body weight on day 1 of life (i.e., redefining day
1 as 'day 0' or the origin). The variable day is the day of life, and parameters, β1, β2, β3, β4 are
estimated. Fitted values for each day of life from birth through six months of age (i.e., day 168)
for male and female mice (applied to all strains) and male and female rats (separate body weight
tables are given for Sprague-Dawley rats and all other strains) are provided in Appendix A.
Procedure to Estimate Cancer Potency
Model parameters were estimated using maximum likelihood methods, using a forward selection
process. The forward selection process commences with the data being fit to a two-parameter
LMS model. If the goodness-of-fit test indicates an adequate fit (at the p = 0.05 level) then the
two-parameter LMS model is used to compute the cancer potency. If the two-parameter model
does not satisfactorily fit the data, a three-parameter model is fit. This model is then assessed via
a goodness-of-fit test. The process of adding an additional parameter and assessing model fit
continues until the goodness-of-fit statistic is no longer statistically significant.

SRP Draft
25
In some cases the dose response data are not consistent with an upward curving dose response
relationship, such that tumor incidence can initially increase with dose and then remain steady or
decrease as doses are further increased. This can occur from competing causes of mortality such
as cancers at sites other than the one being analyzed, and other causes of death. It can also result
from pharmacokinetics for example when a chemical requires activation for carcinogenic
activity, and the activation pathway saturates as dose is increased. Following the inclusion
criteria described above, when mortality from noncancer toxicity is high, the study is not suitable
for inclusion in the data base. There are a few datasets included in these analyses where, despite
meeting the study inclusion criteria, the LMS model does not fit the data well. For these
datasets, a procedure laid out in Anderson et al. (1983) is used to remove high dose groups.
Working down from the highest dose group, dose groups are removed, the model fitted, until
there is an adequate fit of the model to the data (goodness-of-fit, p > 0.05).
The analysis begins by focusing on experiments conducted with exposures in a given lifestage,
and deriving cancer potency estimates for each experiment conducted with groups exposed
during that lifestage.
The method of maximum likelihood is implemented to obtain the model parameter estimates for
each experiment. Here the parameter of greater interest is the potency, q1, the slope term in
equation (1). The idea behind maximum likelihood parameter estimation is to determine the
parameters that maximize the probability (likelihood) of observing the sample data. For each
animal, the probability of cancer is given by equation (1). Assuming each animal exposed to
dose di within a given lifestage has the same chance of developing cancer at a specific site (or
arising from a specific cell type), the probability of observing ri animals with that cancer out of
ni animals total may be described by the following binomial distribution,
ni
ri
⎛
⎝ ⎜
⎞
⎠ ⎟ [p(di)]
ri [1− p(di)](ni −ri ). (2)
For a given experiment, there are different dose groups, that is di is the same for each animal
within the dose group, but differs across the dose groups. The likelihood is constructed by
assuming that animals across the dose groups are independent, and the likelihood is the product
of the term (2) above across the k dose groups or categories, i.e.,
Deleted: for
Deleted: age window
Deleted: in
Deleted: age window
Deleted: within an exposure window
SRP Draft
26
L([q0,q1,K,qk−1]) =
ni
ri
⎛
⎝ ⎜
⎞
⎠ ⎟
i= 0
k−1
∏ [ p(di)]ri [1− p(di)]
(ni −ri ). (3)
The support function, also referred to as the log-likelihood, is defined as the natural logarithm of
the likelihood function (3), disregarding constants, i.e.
]),,,([ln]),,,([ 110110 −− = kk qqqLqqqS KK
= ri
i= 0
k−1
∑ ln[p(di)] + (ni − ri)ln[1− p(di)]. (4)
The values of q0, q1, . . . , qk-1 that maximize equation (4) are the maximum likelihood estimates.
Profile-likelihood methods are used to trace the likelihood to determine the 0.5% through the
99.5% (in increments of 0.5%) confidence bounds of the linear slope parameter of the model, q1.
This is done to describe the uncertainty in the estimates of this parameter, as well as the
confidence we may have that the parameter falls below some upper bound value. Determining
the confidence percentiles of the slope parameter q1 provides a discretized distribution of this
parameter.
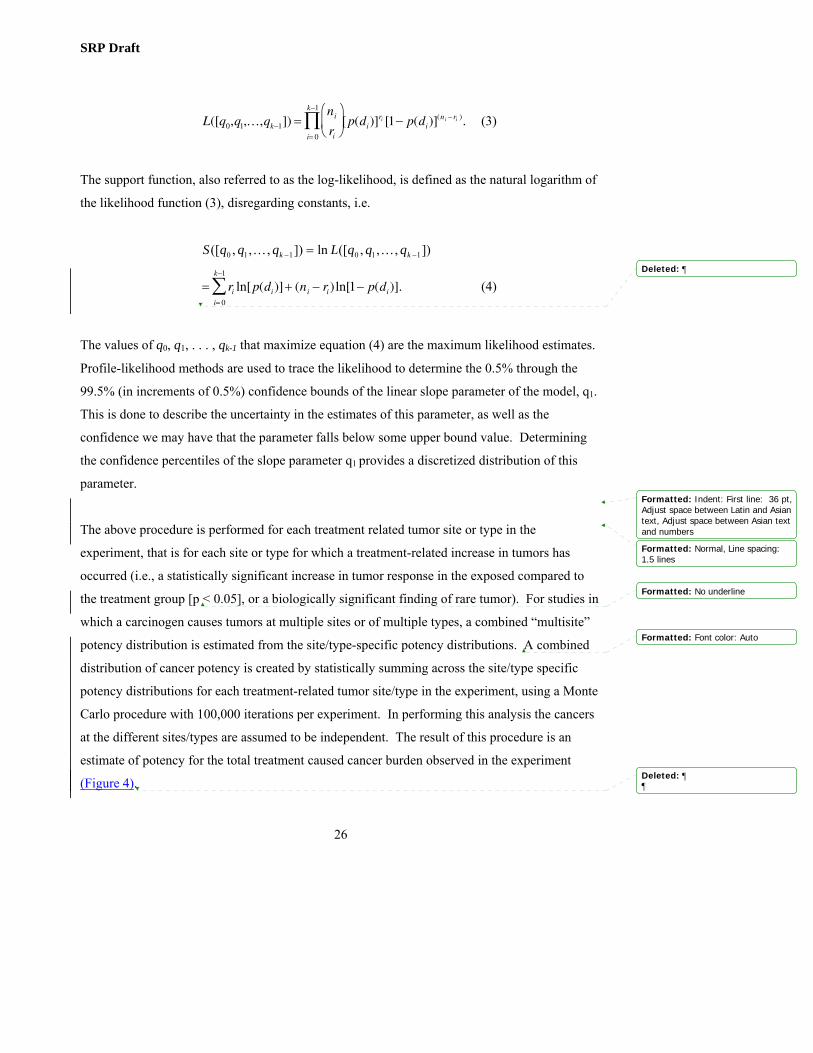
The above procedure is performed for each treatment related tumor site or type in the
experiment, that is for each site or type for which a treatment-related increase in tumors has
occurred (i.e., a statistically significant increase in tumor response in the exposed compared to
the treatment group [p < 0.05], or a biologically significant finding of rare tumor). For studies in
which a carcinogen causes tumors at multiple sites or of multiple types, a combined “multisite”
potency distribution is estimated from the site/type-specific potency distributions. A combined
distribution of cancer potency is created by statistically summing across the site/type specific
potency distributions for each treatment-related tumor site/type in the experiment, using a Monte
Carlo procedure with 100,000 iterations per experiment. In performing this analysis the cancers
at the different sites/types are assumed to be independent. The result of this procedure is an
estimate of potency for the total treatment caused cancer burden observed in the experiment
(Figure 4).
Formatted: Indent: First line: 36 pt,Adjust space between Latin and Asiantext, Adjust space between Asian textand numbers
Formatted: Normal, Line spacing: 1.5 lines
Formatted: No underline
Formatted: Font color: Auto
Deleted: 
Deleted: ¶¶

SRP Draft
27
Figure 4. Addition of potency distributions for multi-site cancer potency derivations
+
Lung PotencyDistribution
Freq
uenc
y
q1
Liver Potency Distribution
Freq
uenc
y
q1
=
Multisite Potency Distribution
Freq
uenc
y
q1
In a given experiment, not all groups were observed for the same length of time. Therefore in
computing potency for a given exposure lifestage within a study, all observation periods were
normalized to the same time length (tobs), typically the observation period for the control animals.
For the purpose of this calculation the observation period is defined as the time between the age
at the initiation of dosing (td) and the age the animals were killed (tm). Following the NTP
(Bailer and Portier, 1988), cancer was assumed to increase with the third power of age and an
adjustment (tm - td)3 / tobs3 was applied to each group. In cases where all groups were observed
for the same period, adjustment was not necessary. For the single-lifestage exposure
experiments analyzed in the chemical-specific case studies, all potency distributions were
adjusted to a two year observation period.
Formatted: Font: 13 pt
Formatted: Font: 13 pt, Bold
Formatted: Font: 13 pt
Deleted: F
Deleted: 3
Deleted: exposure window
Deleted:
Deleted: ational Toxicology Program

SRP Draft
28
Use of ASFs to Address Early-Age Sensitivity in Estimating Cancer Risk
Inherent Sensitivity of Lifestages – Lifestage Potency Ratios Cancer potency is derived for each experiment, which again consists of groups of animals (e.g.,
all dosed within the same defined lifestage (i.e., prenatal, postnatal, juvenile, or adult), and
following a similar experimental protocol but for dose level. In some cases different groups of
animals were dosed at the same level (e.g., on a mg/kg-bw basis) on different days within the
same lifestage (e.g., postnatal day 1 vs. postnatal day 15). If tumor incidences were not
statistically significantly different (at the p = 0.05 level) between the groups dosed on different
days within the same lifestage, the incidence data from the groups were combined. If a
statistically significant difference was observed, then each of the groups was treated as a separate
experiment. For each lifestage, a potency distribution is obtained for each experiment
conducted. The cancer potency from “early life” exposure was compared to that from “later life”
exposure. This comparison is facilitated by taking the quotient of the cancer potency distribution
for those animals exposed in early life and those animals exposed in later life. This ratio
distribution for multi-lifestage exposure studies is termed the lifestage potency (LP) ratio
distribution (Figure 5).
Figure 5. Lifestage Potency Ratio (LP) Ratio Distribution
=
Early-life potency
Adult potency
LP Ratio
Formatted: Font: Italic
Formatted: Normal, Indent: Firstline: 0 pt, Line spacing: single
Formatted: Font: 12 pt, Italic
Formatted: Font: 13 pt
Formatted: Normal
Deleted: ing
Deleted: :
Deleted: Age Sensitivity Factors (ASFs)
Deleted: exposure window
Deleted: exposure window
Deleted: exposure window
Deleted: exposure window
Deleted: window
Deleted: age sensitivity factor (ASF)

SRP Draft
29
For example the prenatal LP ratio is given by:
Prenatal LP ratio = q1prenatal ÷ q1 adult
The dividend is the cancer potency distribution for the prenatal exposure period q1prenatal and the
divisor is the cancer potency distribution for the adult exposure period q1 adult (Figure 5). Thus,
the quotient distribution represents the spectrum of cancer induction sensitivity in an early-life
stage relative to adults (or, in some instances juveniles when adult data are not available).
Of particular importance is the location of the LP ratio distribution in relation to the reference
value of 1.0. An LP ratio distribution that primarily lies above the value of 1.0 indicates early
life exposures to a carcinogen result in a stronger tumor response relative to adult exposure.
Conversely, an LP ratio distribution that mainly lies below the value of 1.0 indicates early life
exposure to a carcinogen results in a weaker tumor response relative to adult exposure.
Effect of longer time period for cancer to manifest The LP ratios described above characterize the inherent susceptibility of the young compared to
older animals to the carcinogen. The exposures were for individuals similarly exposed and
followed for similar periods of time. Age-specific adjustments to the cancer potency must also
take into account the longer period of time that carcinogen exposure to the young has to manifest
as cancer. These LP ratios do not address this. Empirical data from studies of both humans and
animals demonstrate that, for many cancers, cancer risk increases with age, or time since first
exposure. While some cancers have been seen to increase by as much as the sixth power of age,
a general approach taken for example by the NTP in analyzing tumor incidences in its chronic
bioassays is to assume that cancer risk increases by the third power of age (the poly-3 correction)
(Bailer and Portier, 1988).
The approach taken by the NTP and used here is based on the Armitage and Doll (1954)
mathematical description of carcinogenesis. This approach has been applied in various contexts
to consider the impact of dosing and observation at different ages (see e.g., Murdoch et al., 1992;
Crouch, 1983; and Crump and Howe, 1984). The model assumes that cancer derives from a
Formatted: Font: Times NewRoman, 12 pt
Formatted: Font: Not Italic
Formatted: Font: Not Italic
Formatted: Font: Not Italic, NotSuperscript/ Subscript
Formatted: Font: Times NewRoman, 12 pt,
Formatted: Font: Italic
Formatted: Indent: First line: 0 pt
Formatted: Normal, Indent: Firstline: 0 pt
Formatted: Line spacing: 1.5 lines
Deleted: ASF
Deleted: for the prenatal exposure window
Deleted: ASF
Deleted: window
Deleted: window
Deleted: exposure window
Deleted: ¶Page Break
Deleted: ASF
Deleted: ASF
Deleted: ASF

SRP Draft
30
single cell after it has undergone a series of transformations. While there have been numerous
scientific developments advancing the understanding of carcinogenesis since Doll and Armitage
first published their model, the model nonetheless provides a good statistical description of age
dependent observations of cancer development. Thus, this is the context in which the model is
applied here.
Assumptions are required for the application of the Doll-Armitage model regarding: 1) the
mathematical relationship between applied dose and the probability that a “stage transition” has
occurred, 2) the stage affected by the carcinogen and 3) the number of “stages.” For the
particular forms used to fit the tumor data in this report, a linear relationship is assumed between
dose and cell transformation, and the carcinogen is assumed to affect an early stage of the cancer
process.
If the probability per unit time of the stage transformation depends linearly on dose rate (d(t)),
and the carcinogen only affects a single “stage,” the probability of tumor by time Te becomes
P(Te) = 1 – exp[–(A + BD)] (5)
with
∫ −−−+−⋅
=eT
0 1
e )T)((),1(T
1D dttttdjjm
jjmm β
(6)
where Te is the time to observation, and β is Euler's beta function (see Crouch, 1983; Murdoch et
al., 1992). Here the adjustment is developed for analyses in rodents, so the default lifetime of
the test animal is assumed. Following Anderson et al. (1983) this is two years for rats and mice.
The integer m (the number of “stages”) specifies the rate of increase in incidence with time and j
is the “stage” affected by the carcinogen. To adjust for less than lifetime experiments in
estimating cancer potency, the hazard function is assumed to increase with the third power of
age, corresponding to a value for m of 3.0. The chemicals here demonstrably act at an early
stage, and it is assumed therefore j = 1. the solution to Equation 6 describing the constant daily
dose (D) equivalent to a daily dose d given over a time interval from a to b becomes, for j = 1
and m = 3:
Deleted: This is consistent with the poly-3 correction used by the National Toxicology Program in statistical analyses of tumor data in rodent cancer bioassays (Bailer and Portier, 1988).

SRP Draft
31
⎥⎦
⎤⎢⎣
⎡ −−−⋅= 3
3e
3e
T)T()T(
Dba
d . (7)
The intervals used to calculate the adjustment factors for each of the three early lifestages are:
the day of birth for the prenatal period and from birth to age 21 days for the postnatal period.
The juvenile and adult multi-lifestage exposure studies are in the rat; the interval used for the
adjustment is age 22 to 65 days, with 65 days being the midpoint between sexual maturity for the
female and male rats. Inserting these intervals into Equation 7, and comparing the result with the
average lifetime daily dose associated with dosing in that age interval provides the adjustment
factor. The time-of-dosing factors for the prenatal, postnatal and juvenile windows are 3, 2.9 and
2.7, respectively. Thus, ASFs were developed for each experiment, by first calculating the LP
ratio to address inherent susceptibility of early lifestages relative to adults, and then accounting
for the effect of years available to manifest a tumor following carcinogen exposure by
multiplying the LP ratio by the appropriate time-of-dosing factor (see Figure 1).
Deriving LP Ratios and ASFs for Multi-Lifestage Exposure Studies
For each early lifestage, LP ratios are derived for each study with experiments for which a
chemical was administered during that exposure period. These different chemical carcinogens
act by a variety of mechanisms, and with varying pharmacokinetic properties in different
lifestages. In addition, any given chemical can have multiple studies, sometimes in different
species, strains and gender. LP ratios differ for the different studies performed on the same
chemical and for the different chemicals. Combining these LP ratio distributions across all
chemicals within a specific early lifestage results in a description of the magnitude and
variability of age-at-exposure effects for the studies analyzed on these different chemicals. This
provides a means by which the susceptibility of that lifestage to carcinogen exposure relative to
the adult may be characterized for the data analyzed.
A single “LP ratio mixture distribution” for each early lifestage is derived via Monte Carlo re-
sampling methods across all of the chemicals representing a given lifestage. This LP ratio
mixture distribution for a particular lifestage describes the variability in the LP ratio across these
chemicals, and the uncertainty in the LP ratio.
Formatted: Normal, Indent: Firstline: 0 pt
Deleted: age window
Deleted: window
Deleted: window
Deleted: window
Deleted: adjustment
Deleted: Window
Deleted: -exposure window
Deleted: ASFs
Deleted: window
Deleted: There are multiple studies on different chemicals for each exposure window.
Deleted: for which ASF distributions were determined by the above described methods.
Deleted: ASF
Deleted: an “
Deleted: ” exposure window,
Deleted:
Deleted:
Deleted: age window
Deleted: ASF
Deleted: -
Deleted: exposure window
Deleted: exposure window
Deleted: ASF
Deleted: exposure window
Deleted: ASF
Deleted: ASF

SRP Draft
32
LP ratio mixture distributions for a given early lifestage were developed by (1) obtaining a single
LP ratio distribution for each chemical (when a chemical is represented by more than one study)
and (2) equally sampling across all chemicals. When a chemical is represented by more than one
study, the LP ratio distributions from all studies of that chemical were combined to achieve one
distribution to represent that chemical’s LP ratio. This was done by equally sampling from each
LP ratio distribution for each study via Monte Carlo methods. Once each chemical is
represented by a single LP ratio distribution, the LP ratio mixture distribution for each early
lifestage (e.g., prenatal) is obtained by equally sampling across all of the chemicals via Monte
Carlo methods.
Two sensitivity analyses were also conducted, employing two alternative sampling methods to
obtain a single LP ratio distribution to represent each chemical, for cases where a chemical was
represented by more than one study. In the first sensitivity analysis, for each chemical with
multiple studies, each study’s LP ratio distribution is sampled based upon an inverse-variance
weighting scheme. The variance is calculated for the logarithm of the LP ratio, and the
likelihood that an LP ratio distribution is sampled is proportional to the inverse of this variance.
In the second sensitivity analysis, the study with the largest median LP ratio is used to represent
the chemical, that is, the LP ratio distribution for that study is used to represent the LP ratio for
the chemical.
The LP ratio distribution for each chemical is used to derive the LP ratio mixture distribution for
the group of chemicals. For each chemical, an LP ratio value is randomly chosen, according to
its LP ratio distribution. This process proceeds for each of the chemicals in the group and is
replicated 1,000,000 times to derive an LP ratio mixture distribution for the group. Mixture
distributions are derived for each early lifestage.
Chemical-Specific Case Studies
The DEN and ENU case studies were limited to studies in mice. Mouse experiments for the
adult lifestage are not available for either of these chemicals. Thus, for these chemicals prenatal
and postnatal cancer potencies are compared to juvenile cancer potencies.
Formatted: Line spacing: 1.5 lines
Formatted: Not Highlight
Deleted: To derive the mixture distribution, each chemical in the data set is equally likely to be sampled, and each chemical is represented by a single ASF distribution. When there are multiple ASFs (representing multiple studies) on a chemical, three different methods are used to sample from them to derive the ASF mixture distribution for the chemical. ¶¶Method 1 − Each of the ASF distributions are equally likely to be selected.
Deleted: ¶Method 2 − Each of the ASF distributions is sampled based upon an inverse-variance weighting scheme. In this case, the variance is calculated for the distribution of the logarithm of the ASF, Var[logASF]. The likelihood that an ASF is sampled is proportional to 1/Var(log[ASF]). The variance of the logarithm of q1 is used because potencies tend to differ by factors rather than in a linear fashion.¶Method 3 − The ASF distribution with the largest median is used as the representative “mixture” ASF distribution to represent the chemical.
Deleted: Once
Deleted: an ASF
Deleted: is derived
Deleted: by one of these methods, these distributions are
Deleted: ASF
Deleted: ASF
Deleted: from
Deleted: ASF
Deleted: ASF
Deleted: each early
Deleted: -
Deleted: exposure window
Deleted: To evaluate the robustness of the study findings, ASF mixture distributions were generated using each of the three methods described above.

SRP Draft
33
Methods to compare early vs. later life cancer potencies from single-lifestage exposure studies,
as illustrated by the DEN and ENU case studies, necessarily proceed differently from the
methods described above for the multi-lifestage exposure studies. For DEN and ENU, there are
several single-lifestage exposure experiments for each lifestage.
For each chemical, an overall distribution of the logarithm of potencies is created for each
lifestage. This is accomplished via Monte Carlo methods, by sampling from each of the
individual (log) potency distributions derived for each experiment for that exposure period
equally, to create an overall potency distribution for that lifestage. Overall potency distributions
for the different lifestages are used to create a distribution of the ratio of the prenatal to juvenile
potencies, and similarly for the postnatal to juvenile potencies, i.e., prenatal LPj ratio
distributions and postnatal LPj ratio distributions.
Sensitivity analyses were also conducted, employing three alternative sampling methods to
create the potency distribution for a given lifestage. One alternative method truncated each
individual potency distribution at the fifth and ninety-fifth percentiles prior to creating the
equally weighted potency mixture distribution. This eliminates the most extreme values from
each potency distribution. A second alternative method did the same except it used the 25th and
75th percentiles. A third method sampled from the potency distributions based upon weights
equal to the computed inverse-variance of each (logarithm) potency distribution. That is, the
variance is calculated for the distribution of the logarithm of the q1, Var[log q1]. The likelihood
that an q1 is sampled is proportional to 1/Var(log[q1]).
By using one of these methods, a potency mixture distribution for each lifestage is obtained. The
ratio of mixture potency distributions for a given early lifestage (e.g., prenatal or postnatal) to the
potency distribution for the juvenile lifestage is computed to arrive at the LP ratio distribution for
that early lifestage. In general, exposures during the juvenile lifestage are expected to result in
greater sensitivity to carcinogens than adult exposures, thus the LP ratios calculated here should
be considered underestimates of the true LP ratio (i.e, the ratio of early to adult potencies) for
these chemicals.
Formatted
Formatted: Subscript
Formatted: Subscript
Formatted: Superscript
Formatted: Superscript
Formatted: Superscript
Formatted
Deleted: o
Deleted: r
Deleted: window
Deleted: each chemical-specific case study
Deleted: within
Deleted: exposure window
Deleted: Experiments for the adult exposure window are not available for either of these chemicals. For these chemicals prenatal and postnatal cancer potencies are compared to juvenile cancer potencies.
Deleted:
Deleted: exposure window
Deleted: to sample from
Deleted: window
Deleted: .
Deleted: Values are sampled from these different potency distributions
Deleted: exposure window
Deleted: exposure window
Deleted: To test the s
Deleted: of the result to different assumptions, different
Deleted: weighting
Deleted: schemes are used
Deleted: n age windo
Deleted: w:
Deleted: Method 2a − The potency distributions were sampled based upon weights equal to the computed inverse-variance of each (logarithm) potency
Deleted: exposure window
Deleted: exposure window
Deleted: exposure window
Deleted:
Deleted: age window
Deleted: ASF
Deleted: 
... [4]
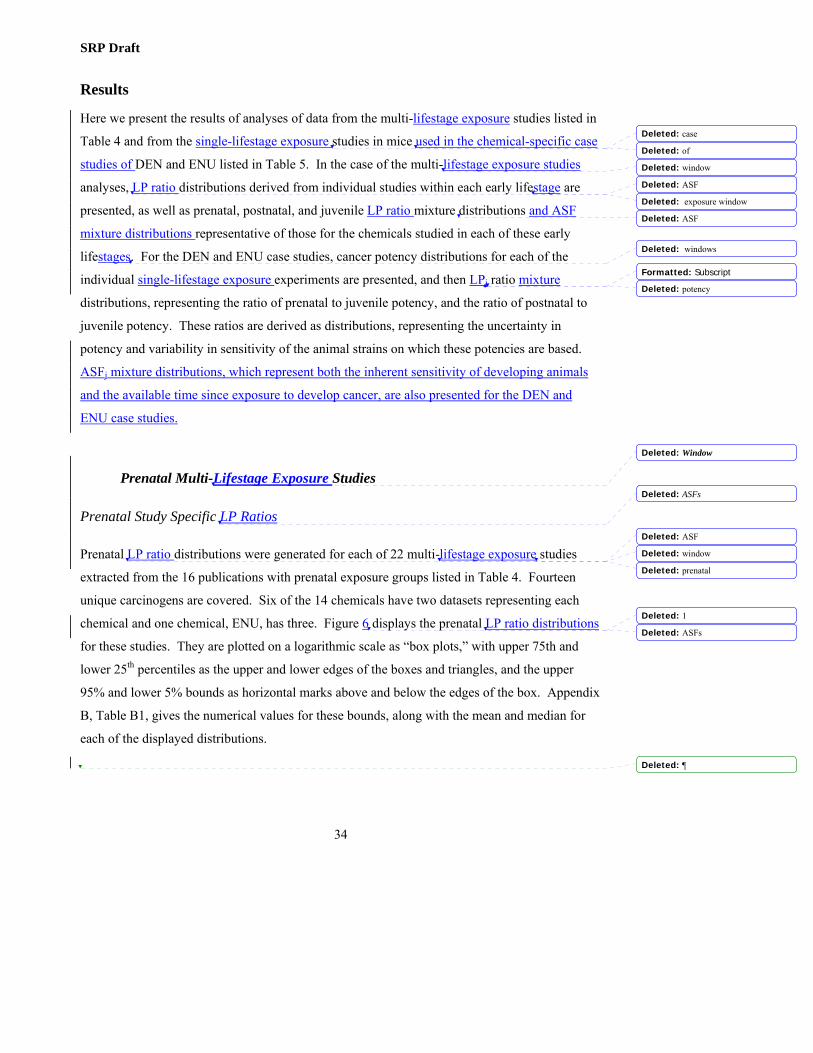
SRP Draft
34
Results
Here we present the results of analyses of data from the multi-lifestage exposure studies listed in
Table 4 and from the single-lifestage exposure studies in mice used in the chemical-specific case
studies of DEN and ENU listed in Table 5. In the case of the multi-lifestage exposure studies
analyses, LP ratio distributions derived from individual studies within each early lifestage are
presented, as well as prenatal, postnatal, and juvenile LP ratio mixture distributions and ASF
mixture distributions representative of those for the chemicals studied in each of these early
lifestages. For the DEN and ENU case studies, cancer potency distributions for each of the
individual single-lifestage exposure experiments are presented, and then LPj ratio mixture
distributions, representing the ratio of prenatal to juvenile potency, and the ratio of postnatal to
juvenile potency. These ratios are derived as distributions, representing the uncertainty in
potency and variability in sensitivity of the animal strains on which these potencies are based.
ASFj mixture distributions, which represent both the inherent sensitivity of developing animals
and the available time since exposure to develop cancer, are also presented for the DEN and
ENU case studies.
Prenatal Multi-Lifestage Exposure Studies
Prenatal Study Specific LP Ratios
Prenatal LP ratio distributions were generated for each of 22 multi-lifestage exposure studies
extracted from the 16 publications with prenatal exposure groups listed in Table 4. Fourteen
unique carcinogens are covered. Six of the 14 chemicals have two datasets representing each
chemical and one chemical, ENU, has three. Figure 6 displays the prenatal LP ratio distributions
for these studies. They are plotted on a logarithmic scale as “box plots,” with upper 75th and
lower 25th percentiles as the upper and lower edges of the boxes and triangles, and the upper
95% and lower 5% bounds as horizontal marks above and below the edges of the box. Appendix
B, Table B1, gives the numerical values for these bounds, along with the mean and median for
each of the displayed distributions.
Formatted: Subscript
Deleted: case
Deleted: of
Deleted: window
Deleted: ASF
Deleted: exposure window
Deleted: ASF
Deleted: windows
Deleted: potency
Deleted: Window
Deleted: ASFs
Deleted: ASF
Deleted: window
Deleted: prenatal
Deleted: 1
Deleted: ASFs
Deleted: 
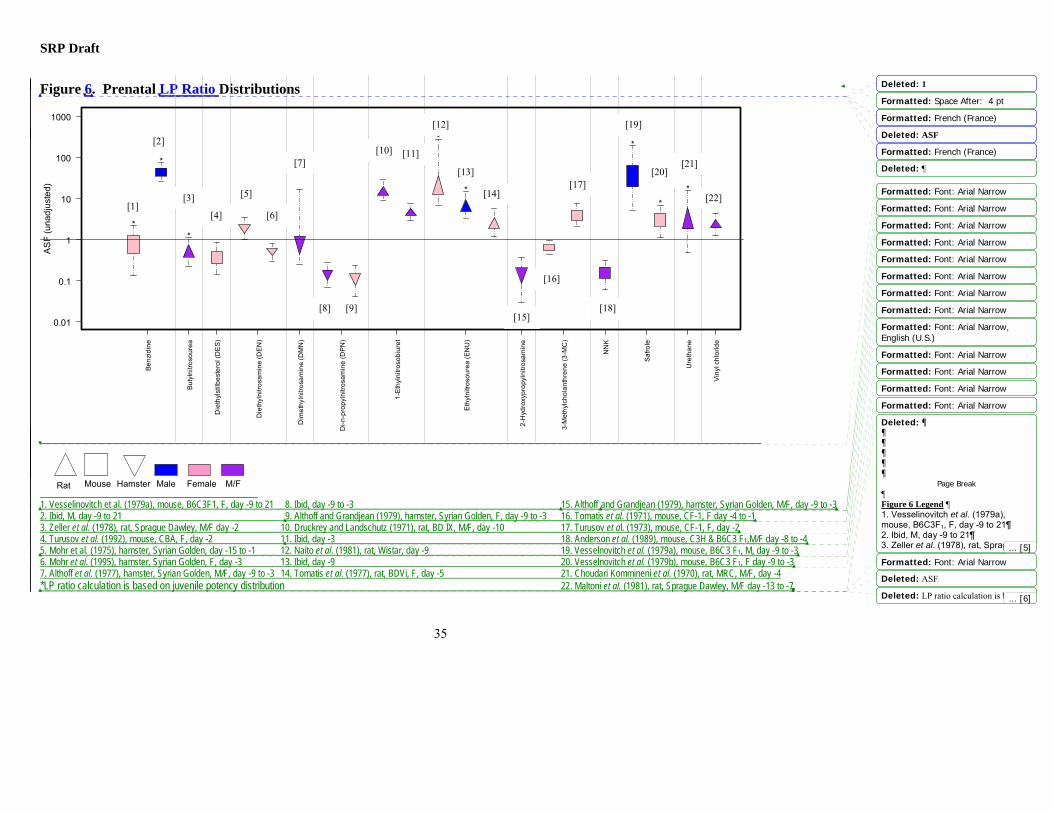
SRP Draft
35
Figure 6. Prenatal LP Ratio Distributions
*
*
*
*
*
*
**
Ben
zidi
ne
Buty
lnitr
osou
rea
Die
thyl
stilb
este
rol (
DE
S)
Die
thyl
nitro
sam
ine
(DE
N)
Dim
ethy
lnitr
osam
ine
(DM
N)
Di-n
-pro
pyln
itros
amin
e (D
PN
)
1-E
thyl
nitro
sobi
uret
Ethy
lnitr
osou
rea
(EN
U)
2-H
ydro
xypr
opyl
nitro
sam
ine
3-M
ethy
lcho
lant
hren
e (3
-MC
)
NN
K
Saf
role
Ure
than
e
Vin
yl c
hlor
ide
0.01
0.1
1
10
100
1000
AS
F (u
nadj
uste
d)
1. Vesselinovitch et al. (1979a), mouse, B6C3F1, F, day -9 to 21 8. Ibid, day -9 to -3 15. Althoff and Grandjean (1979), hamster, Syrian Golden, M/F, day -9 to -3 2. Ibid, M, day -9 to 21 9. Althoff and Grandjean (1979), hamster, Syrian Golden, F, day -9 to -3 16. Tomatis et al. (1971), mouse, CF-1, F day -4 to -1 3. Zeller et al. (1978), rat, Sprague Dawley, M/F day -2 10. Druckrey and Landschutz (1971), rat, BD IX, M/F, day -10 17. Turusov et al. (1973), mouse, CF-1, F, day -2 4. Turusov et al. (1992), mouse, CBA, F, day -2 11. Ibid, day -3 18. Anderson et al. (1989), mouse, C3H & B6C3 F1,M/F day -8 to -4 5. Mohr et al. (1975), hamster, Syrian Golden, day -15 to -1 12. Naito et al. (1981), rat, Wistar, day -9 19. Vesselnovitch et al. (1979a), mouse, B6C3 F1, M, day -9 to -3 6. Mohr et al. (1995), hamster, Syrian Golden, F, day -3 13. Ibid, day -9 20. Vesselnovitch et al. (1979b), mouse, B6C3 F1, F day -9 to -3 7. Althoff et al. (1977), hamster, Syrian Golden, M/F, day -9 to -3 14. Tomatis et al. (1977), rat, BDVi, F, day -5 21. Choudari Kommineni et al. (1970), rat, MRC, M/F, day -4 *LP ratio calculation is based on juvenile potency distribution 22. Maltoni et al. (1981), rat, Sprague Dawley, M/F day -13 to -7
Rat Mouse Male Female M/F Hamster
[1]
[2]
[3]
[4]
[5]
[6]
[8]
[7]
[9]
[10] [11]
[12]
[13]
[18]
[19]
[20] [21]
[22] [14]
[15]
[16]
[17]
Formatted: Space After: 4 pt
Formatted: French (France)
Formatted: French (France)
Formatted: Font: Arial Narrow
Formatted: Font: Arial Narrow
Formatted: Font: Arial Narrow
Formatted: Font: Arial Narrow
Formatted: Font: Arial Narrow
Formatted: Font: Arial Narrow
Formatted: Font: Arial Narrow
Formatted: Font: Arial Narrow
Formatted: Font: Arial Narrow,English (U.S.)
Formatted: Font: Arial Narrow
Formatted: Font: Arial Narrow
Formatted: Font: Arial Narrow
Formatted: Font: Arial Narrow
Formatted: Font: Arial Narrow
Deleted: 1
Deleted: ASF
Deleted: 
Deleted: ¶¶¶¶¶¶
Page Break¶Figure 6 Legend ¶1. Vesselinovitch et al. (1979a), mouse, B6C3F1, F, day -9 to 21¶2. Ibid, M, day -9 to 21¶3. Zeller et al. (1978), rat, Sprague
Deleted: ASF
Deleted: LP ratio calculation is based
... [5]
... [6]

SRP Draft
36
Considerable variability in prenatal sensitivity is evident for the 14 carcinogens, with several
demonstrating an enhanced tumor response, a few indicating an equivalent response, and others
demonstrating a reduced tumor response associated with prenatal exposure as compared to adult
exposure. The prenatal LP ratio 90% confidence intervals included values less than 0.1 for di-n-
propylnitrosamine (based on studies in hamsters), 2-hydroxypropylnitrosamine (hamsters), and
NNK (mice), values greater than 10 but less than 100 for benzidine (male mice), 1-
ethylnitrosobiuret (rats), ENU (male rats), and urethane (rats), and values greater than 100 for
ENU (female rats) and safrole (male mice). Twelve of the prenatal LP ratio distributions,
representing studies of eight carcinogens, had medians that exceed unity. The remaining ten
distributions, representing studies of nine carcinogens, had medians that were less than one.
Prenatal LP Ratio Mixture Distributions (LP Ratios for 14 Chemicals Combined)
The LP ratio mixture distributions characterize and summarize the prenatal LP ratio distributions
from the prenatal multi-lifestage exposure studies on 14 chemicals displayed in Figure 6. As
described in greater length in the Methods section above, in these derivations a single LP ratio
distribution was obtained for each chemical, and then each was equally sampled to obtain the LP
ratio mixture distribution.
Figure 7 displays the prenatal LP ratio mixture cumulative distribution functions, where Method
1 represents equal weighting of studies within a chemical, and Method 2 (inverse-variance
weighting) and Method 3 (LP ratio distribution with the largest median selected for each
chemical) represent the alternative weighting methods employed in the sensitivity analysis. In
each case, these prenatal LP ratio distribution functions are essentially bimodal, with significant
portions of each of the distributions below and above 1.0.
Deleted: ASF
Deleted: ASF
Deleted: ASF
Deleted: ASF
Deleted: ASF
Deleted: window
Deleted: prenatal
Deleted: 1
Deleted: each chemical was given equal weight and three different methods were used
Deleted: ASF
Deleted: 2
Deleted: ASF
Deleted: determined via Methods 1 through 3
Deleted: For all three methods
Deleted: ASF
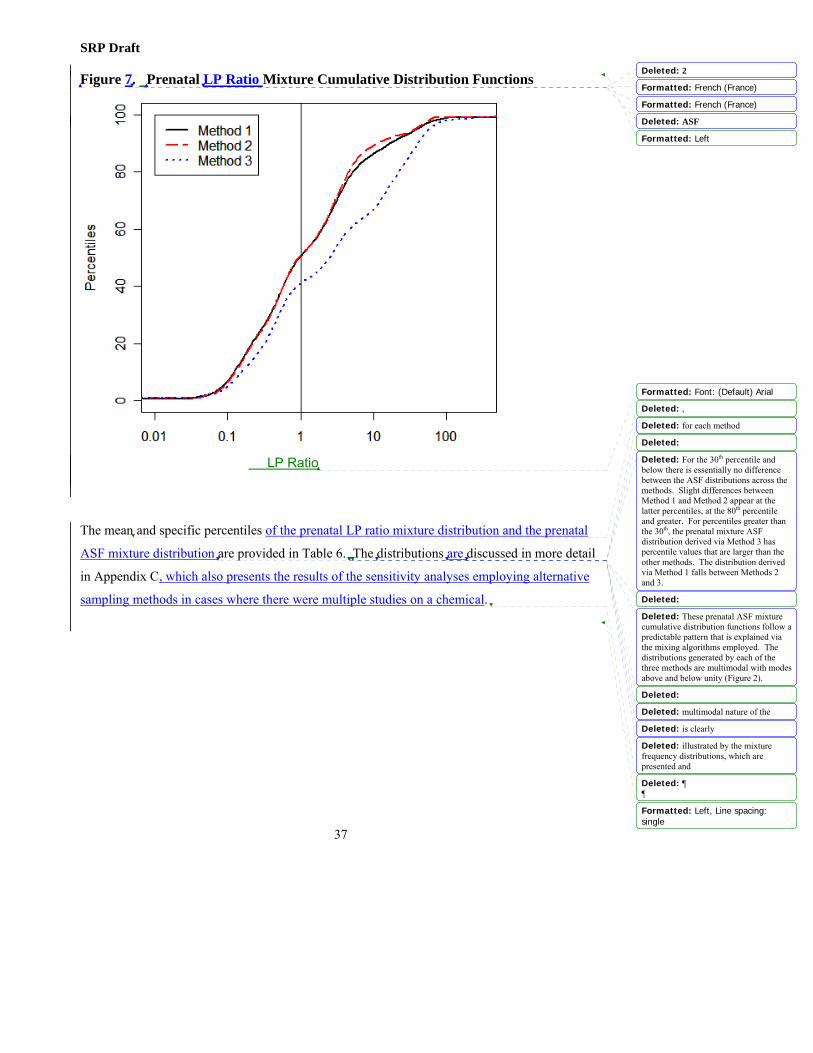
SRP Draft
37
Figure 7. Prenatal LP Ratio Mixture Cumulative Distribution Functions
The mean and specific percentiles of the prenatal LP ratio mixture distribution and the prenatal
ASF mixture distribution are provided in Table 6. The distributions are discussed in more detail
in Appendix C, which also presents the results of the sensitivity analyses employing alternative
sampling methods in cases where there were multiple studies on a chemical.
LP Ratio
Formatted: French (France)
Formatted: French (France)
Formatted: Left
Formatted: Font: (Default) Arial
Formatted: Left, Line spacing: single
Deleted: 2
Deleted: ASF
Deleted: ,
Deleted: for each method
Deleted:
Deleted: For the 30th percentile and below there is essentially no difference between the ASF distributions across the methods. Slight differences between Method 1 and Method 2 appear at the latter percentiles, at the 80th percentile and greater. For percentiles greater than the 30th, the prenatal mixture ASF distribution derived via Method 3 has percentile values that are larger than the other methods. The distribution derived via Method 1 falls between Methods 2 and 3.
Deleted:
Deleted: These prenatal ASF mixture cumulative distribution functions follow a predictable pattern that is explained via the mixing algorithms employed. The distributions generated by each of the three methods are multimodal with modes above and below unity (Figure 2).
Deleted:
Deleted: multimodal nature of the
Deleted: is clearly
Deleted: illustrated by the mixture frequency distributions, which are presented and
Deleted: ¶¶

SRP Draft
38
Table 6. Prenatal LP Ratio and ASF Mixture Distribution Statistics
Statistics LP Ratio ASF
Mean* 7.03 21.09 Percentiles
5th 0.09 0.27 10th 0.12 0.36 20th 0.22 0.66 30th 0.38 1.14 40th 0.58 1.74 50th 0.96 2.88 60th 1.95 5.85 70th 3.11 9.33 80th 5.18 15.54 90th 16.52 49.56 95th 38.49 115.47
* Calculated excluding large values above the 99th percentile.
Figure 8 shows the individual prenatal ASF 90% confidence bounds for each of the datasets used
in generating the prenatal ASF mixture frequency distribution. The ASF 90% confidence bounds
are displayed as a cumulative frequency profile.
Formatted: Font: 13 pt
Formatted Table
Formatted: Left
Formatted: Font: 10 pt
Formatted: Indent: Left: 0 pt
Formatted: Left
Deleted: by Method
Deleted: Unadjusted
Deleted: 
Deleted: Method 1
Deleted: Adjusted
Deleted: 
Deleted: Method 1
Deleted:
Deleted: 3
Deleted: where a single dataset was taken as representative of each chemical using Method 3.
Deleted: ¶¶
Page Break
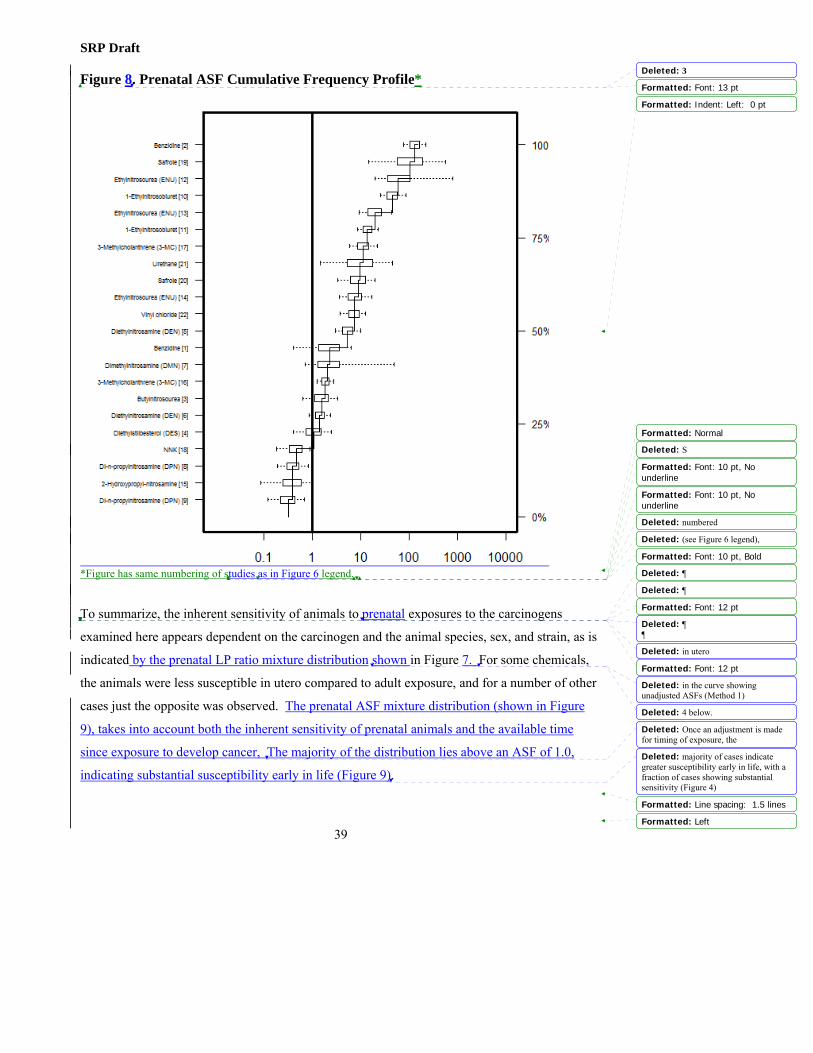
SRP Draft
39
Figure 8. Prenatal ASF Cumulative Frequency Profile*
*Figure has same numbering of studies as in Figure 6 legend.
To summarize, the inherent sensitivity of animals to prenatal exposures to the carcinogens
examined here appears dependent on the carcinogen and the animal species, sex, and strain, as is
indicated by the prenatal LP ratio mixture distribution shown in Figure 7. For some chemicals,
the animals were less susceptible in utero compared to adult exposure, and for a number of other
cases just the opposite was observed. The prenatal ASF mixture distribution (shown in Figure
9), takes into account both the inherent sensitivity of prenatal animals and the available time
since exposure to develop cancer, The majority of the distribution lies above an ASF of 1.0,
indicating substantial susceptibility early in life (Figure 9).
Formatted: Font: 13 pt
Formatted: Indent: Left: 0 pt
Formatted: Normal
Formatted: Font: 10 pt, Nounderline
Formatted: Font: 10 pt, Nounderline
Formatted: Font: 10 pt, Bold
Formatted: Font: 12 pt
Formatted: Font: 12 pt
Formatted: Line spacing: 1.5 lines
Formatted: Left
Deleted: 3
Deleted: S
Deleted: numbered
Deleted: (see Figure 6 legend),
Deleted: 
Deleted: 
Deleted: ¶¶
Deleted: in utero
Deleted: in the curve showing unadjusted ASFs (Method 1)
Deleted: 4 below.
Deleted: Once an adjustment is made for timing of exposure, the
Deleted: majority of cases indicate greater susceptibility early in life, with a fraction of cases showing substantial sensitivity (Figure 4)

SRP Draft
40
Figure 9. Prenatal ASF Mixture Distribution
Postnatal Multi-Lifestage Exposure Studies
Postnatal Study Specific LP Ratios
Postnatal LP ratio distributions generated for each of 55 multi-lifestage exposure studies are
displayed in Figure 10. These studies were extracted from the 25 publications listed in Table 4
that included a postnatal exposure group. Eighteen unique carcinogens are represented. Eleven
of the 18 chemicals have two or more datasets representing them. Figure 10 displays the LP
ratios for these studies as box plots. The values associated with the mean, 5th, 25th, 50th, 75th, and
95th percentile values for each of the LP ratios shown in the figure are given in Appendix B,
Table B2.
0 102030405060708090
100
0.01 0.1 1 10 100 1000ASF
Perc
entil
e
UnadjustedASF
Formatted: Font: 13 pt
Formatted: Left
Deleted: 4
Deleted: Method 1
Deleted: Window
Deleted: ¶¶
Page Break
Deleted: ASFs
Deleted: ASF
Deleted: window
Deleted: 5
Deleted: As for the prenatal case,
Deleted: 5
Deleted: ASFs
Deleted: M
Deleted: ASF
Deleted: distributions
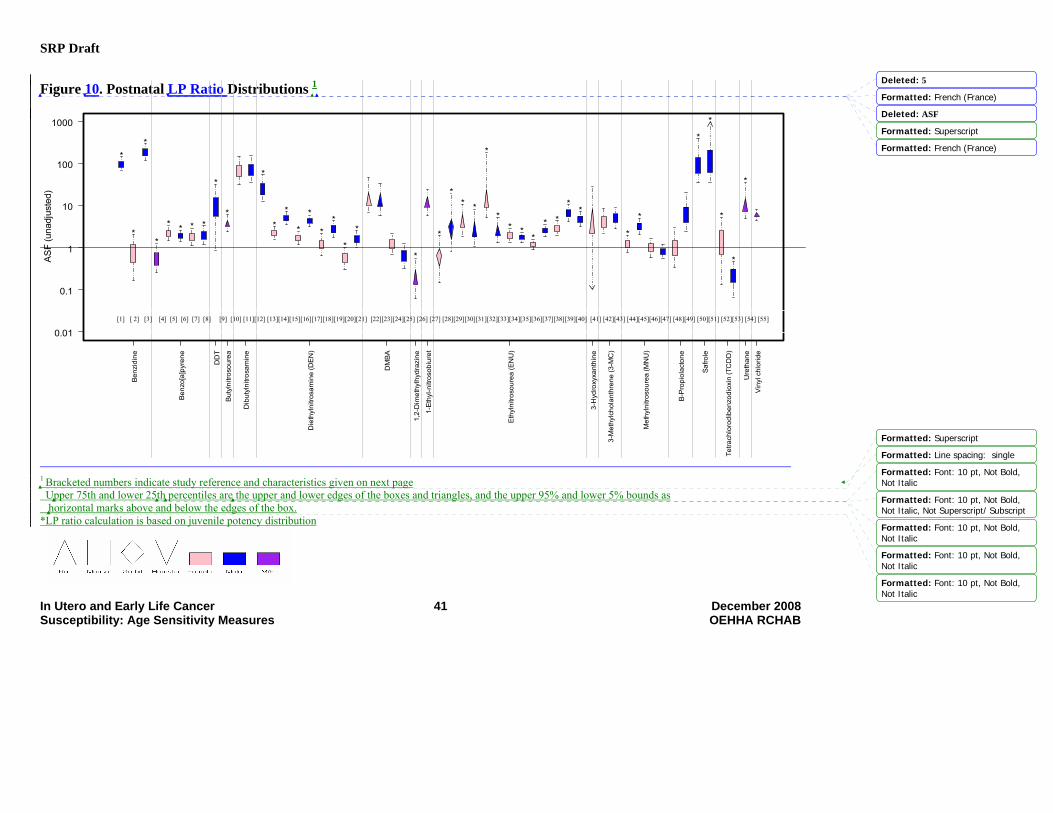
SRP Draft
In Utero and Early Life Cancer 41 December 2008 Susceptibility: Age Sensitivity Measures OEHHA RCHAB
Figure 10. Postnatal LP Ratio Distributions 1
*
*
*
*
* * * *
*
*
*
**
*
*
**
*
*
*
*
** *
*
** *
** *
**
*
*
*
*
*
*
Benz
idin
e
Ben
zo[a
]pyr
ene
DD
TBu
tyln
itros
oure
a
Dib
utyl
nitro
sam
ine
Die
thyl
nitro
sam
ine
(DE
N)
DM
BA
1,2-
Dim
ethy
lhyd
razi
ne
1-Et
hyl-n
itros
obiu
ret
Eth
ylni
troso
urea
(EN
U)
3-H
ydro
xyxa
nthi
ne
3-M
ethy
lcho
lant
hren
e (3
-MC
)
Met
hyln
itros
oure
a (M
NU
)
B-P
ropi
olac
tone
Safro
le
Tetra
chlo
rodi
benz
odio
xin
(TC
DD
)
Ure
than
eVi
nyl c
hlor
ide
0.01
0.1
1
10
100
1000
AS
F (u
nadj
uste
d)
*
1 Bracketed numbers indicate study reference and characteristics given on next page Upper 75th and lower 25th percentiles are the upper and lower edges of the boxes and triangles, and the upper 95% and lower 5% bounds as horizontal marks above and below the edges of the box. *LP ratio calculation is based on juvenile potency distribution
[1] [ 2] [3] [4] [5] [6] [7] [8] [9] [10] [11][12] [13][14][15][16][17][18][19][20][21] [22][23][24][25] [26] [27] [28][29][30][31][32][33][34][35][36][37][38][39][40] [41] [42][43] [44][45][46][47] [48][49] [50][51] [52][53] [54] [55]
Formatted: French (France)
Formatted: Superscript
Formatted: French (France)
Formatted: Superscript
Formatted: Line spacing: single
Formatted: Font: 10 pt, Not Bold,Not Italic
Formatted: Font: 10 pt, Not Bold,Not Italic, Not Superscript/ Subscript
Formatted: Font: 10 pt, Not Bold,Not Italic
Formatted: Font: 10 pt, Not Bold,Not Italic
Formatted: Font: 10 pt, Not Bold,Not Italic
Deleted: 5
Deleted: ASF

SRP Draft
In Utero and Early Life Cancer 42Susceptibility: Age Sensitivity Measures
Figure 10 (continued): Studies Identifiers 1 Vesselinovitch et al. (1975b), mouse, B6C3F1, M, day 7-27 2 Vesselinovitch et al. (1979), mouse, B6C3F1, F, day 1-21 3 Ibid, M, day 1-21 4 Truhaut et al. (1966), mouse, swiss, M/F, day 1 5 Vesselinovitch et al. (1975a), mouse, B6C3F1, F, day 1 6 Ibid, M, day 1 7 Ibid, C3A F1, F, day 1 8 Ibid, M, day 1 9 Vesselinovitch et al. (1979a), mouse, B6C3F1, M, day 1-28 10 Zeller et al. (1978), rat, Sprague Dawley, M/F, day 2 11 Wood et al. (1970), mouse, IF x C57, F, day 1-15 12 Ibid, M, day 1-15 13 Rao and Vesselinovitch (1973), mouse, B6C3F1, M, day 15 14 Vesselinovitch et al. (1984), mouse, B6C3F1, F, day 1 15 Ibid, M, day 1 16 Ibid, F, day 15 17 Ibid, F, day 15 18 Ibid, C3A F1, F, day 1 19 Ibid, M, day 1 20 Ibid, F, day 15 21 Ibid, M, day 15 22 Meranze et al. (1969), rat, Fels-Wistar, F, day 10 23 Ibid, M, day 10 24 Walters (1966), mouse, BALB/c, F, day 17 25 Ibid, M, day 17 26 Martin et al. (1974), rat, BDIX, M/F, day 10 27 Druckrey and Landschutz (1971), rat, BDIX, M/F, day 10 28 Naito et al. (1985), gerbil, mongolian, F, day 1 29 Ibid, M, day 1 30 Bosch (1977), rat, WAG, F, day 8 31 Ibid, M, day 8 32 Naito et al. (1981), rat, Wistar, F, day 7 33 Ibid, M, day 7 34 Vesselinovitch et al. (1974), mouse, B6C3F1, F, day 1 35 Ibid, M, day 1 36 Ibid, F, day 15 37 Ibid, M, day 15 38 Ibid, C3A F1, F, day 1 39 Ibid, M, day 1 40 Ibid, M, day 15 41 Anderson et al. (1978), rat, Wistar, F, day 9 42 Klein (1959), mouse, A/He, F, day 8-31 43 Ibid, M, day 8-31 44 Terracini and Testa (1970), mouse, B6C3F1, F, day 1 45 Ibid, M, day 1 46 Terracini et al. (1976), mouse, C3Hf/Dp, F, day 1 47 Ibid, M, day 1
48 Chernozemski and Warwick (1970), mouse, B6A F1, F, day 9 49 Ibid, M, day 9 50 Vesselinovitch et al. (1979a), mouse, B6C3F1, M, day 1-21 51 Vesselinovitch et al. (1979b), mouse, B6C3F1, M, day 1-21 52 Della Porta et al. (1987), mouse, B6C3F1, F, day 10-45 53 Ibid, M, day 10-45 54 Choudari Kommineni et al. (1970), rat, MRC, M/F, day 1-17 55 Maltoni et al. (1981), rat, Sprague Dawley, M/F, day 1-35
Deleted: Legend
Deleted: Section Break (Continuous)
Deleted:
Deleted:
Deleted:

SRP Draft
In Utero and Early Life Cancer 43 December 2008 Susceptibility: Age Sensitivity Measures OEHHA RCHAB
For two-thirds of the studies plotted - thirty-seven postnatal datasets (for 15 carcinogens) – the
LP ratio distributions are significantly greater than unity (i.e., the lower 95% confidence bound
exceeds unity). For sixteen postnatal studies or 29% of the total, representing nine carcinogens,
90% confidence intervals straddle unity. Two postnatal studies, or only 4% of the plotted
studies, representing two carcinogens, have LP ratios with upper 95% confidence bounds less
than unity.
Postnatal LP Ratio Mixture Distributions (LP Ratios for 18 Chemicals Combined)
The LP ratio mixture distributions characterize and summarize the postnatal LP ratio
distributions from the postnatal multi-lifestage exposure studies on 18 chemicals displayed in
Figure 10. In these derivations, a single LP ratio distribution was obtained for each chemical and
then each chemical was equally sampled to obtain the LP ratio mixture distribution (see
Methods).
Figure 11 displays the postnatal LP ratio mixture cumulative distribution functions, where
Method 1 represents equal weighting of studies within a chemical, and Method 2 (inverse-
variance weighting) and Method 3 (LP ratio distribution with the largest median selected for
each chemical) represent the alternative weighting methods employed in the sensitivity analysis.
Formatted: Danish
Formatted: Left
Deleted: ¶¶
Deleted: ASFs
Deleted: ASFs
Deleted: ASF
Deleted: 6
Deleted: ASF
Deleted:

SRP Draft
In Utero and Early Life Cancer 44 December 2008 Susceptibility: Age Sensitivity Measures OEHHA RCHAB
Figure 11. Postnatal LP Ratio Mixture Cumulative Distribution Functions
The mean and specific percentiles of the postnatal LP ratio and ASF mixture distributions are
provided in Table 7. The distributions are discussed in more detail in Appendix C, which also
presents the results of the sensitivity analyses employing alternative sampling methods in cases
where there were multiple studies on a chemical.
Table 7. Postnatal LP Ratio and ASF Mixture Distribution Statistics Statistics LP Ratio ASF Mean* 27.08 78.53
Percentiles 5th 0.20 0.58
10th 0.41 1.19 20th 1.08 3.13 30th 1.93 5.60 40th 3.13 9.08 50th 4.64 13.46 60th 6.35 18.42 70th 9.62 27.90 80th 18.10 52.49 90th 72.78 211.06 95th 122.82 356.18
* Calculated excluding large values above the 99th percentile.
LP Ratio
Formatted: Font: (Default) Arial
Formatted
Formatted: Font: 10 pt
Formatted: Line spacing: single
Formatted Table
Formatted
Deleted: 6
Deleted: ASF
Deleted: ,
Deleted: ASF
Deleted: mixture distribution
Deleted: mean,
Deleted: the prenatal
Deleted: certain percentiles for each method
Deleted: The cumulative distribution functions for Method 1 and Method 2 are nearly identical up to the 70th percentile. After the 70th percentile, Method 2 has slightly larger values as compared to Method 1. The most compact postnatal ASF distributions generally have values that are significantly greater than unity. As a result, the inverse-variance method (Method 2) produces a mixture cumulative distribution that is shifted slightly to the right of the distribution derived using Method 1, where equal weighting is given to all studies within a chemical. The magnitude of this rightward shift with Method 2 is not particularly large however because there were no single studies amongst those chemicals with multiple studies with considerably smaller variances than the others in the set. The postnatal ASF mixture cumulative distribution derived via Method 3 has percentile values that
Deleted: M
Deleted: s
Deleted: o
Deleted: n the results for the postnatal
Deleted:
Deleted: 
Deleted: by Method
Deleted:
Deleted: Unadjusted
Deleted: 
Deleted: Method 1
Deleted: Adjusted
Deleted: 
Deleted: Method 1
Deleted:
... [9]
... [7]
... [8]
... [10]

SRP Draft
In Utero and Early Life Cancer 45 December 2008 Susceptibility: Age Sensitivity Measures OEHHA RCHAB
Figure 12 shows the individual postnatal ASF 90% confidence bounds for each of the datasets
used in generating the postnatal ASF mixture frequency distribution. The ASF 90% confidence
bounds are displayed as a cumulative frequency profile.
Figure 12. Postnatal ASF Cumulative Frequency Profile*
*Figure has same numbering of studies as in Figure 10 legend.
ASF
Formatted: Font: 10 pt
Formatted: Left
Formatted: Font: 10 pt
Deleted: ¶¶
Deleted: 7
Deleted: re
Deleted: where a single dataset was taken as representative of each chemical (Method 3)
Deleted: 
Deleted: 7
Deleted:
1,2-Dimethylhydra
Tetrachlorodibenzodioxin (TCBenzo[a]py
Methylnitrosourea (MButylnitroso
3-Hydroxyxan3-Methylcholanthrene (3
B-PropiolacVinyl chlo
Ureth
1-Ethyl-nitrosobD
Ethylnitrosourea (EDiethylnitrosamine (D
DibutylnitrosaSa
Benz
Deleted: (Unadjusted)
Deleted: Studies numbered as in Figure 10 (see Figure 10 legend),

SRP Draft
In Utero and Early Life Cancer 46 December 2008 Susceptibility: Age Sensitivity Measures OEHHA RCHAB
To summarize, in general for the cases studied here animals are inherently more sensitive in the
postnatal period, as indicated by the postnatal LP ratio mixture distribution (Figure 11). The
postnatal ASF mixture distribution shown in Figure 13 below takes into account both the
inherent sensitivity of postnatal animals and the available time since exposure to develop cancer.
The majority of the distribution lies above an ASF of 1.0, indicating substantial susceptibility
early in life (Figure 13).
Figure 13. Postnatal ASF Mixture Distribution
Juvenile Multi-Lifestage Exposure Studies
Juvenile Study Specific LP Ratios
Juvenile LP ratio distributions were generated for each of seven multi-lifestage exposure studies
extracted from five publications with juvenile and adult exposure groups, covering five unique
carcinogens (See Table 4). Figure 14 displays the juvenile LP ratio distributions in boxplot
form. Appendix B, Table B3, provides the mean, 5th, 25th, 50th, 75th, and 95th percentile values
for these LP ratios. All studies were conducted in rats. Four studies have juvenile LP ratios
significantly greater than unity (p < 0.05), and the 90% confidence interval straddles unity for the
remaining three studies. Of the two LP ratio distributions representing the chemical MNU from
010 20 30 40 50 60 70 80 90
100
0.01 0.1 1 10 100 1000ASF
Perc
entil
e
Unadjusted ASF
Formatted: Font: Not Bold, NotItalic
Formatted: Indent: First line: 0 pt
Formatted: Left
Deleted: unadjusted ASF (Method 1)
Deleted: 8
Deleted: . Once
Deleted: an adjustment is made for timing of exposure, the difference between possible contributions of
Deleted: postnatal versus adult exposures becomes more pronounced, as indicated in Figure 8 by the ASF curve.
Deleted: 
Deleted: ¶¶¶
Deleted: 8
Deleted: Method 1
Deleted: 
Deleted: Window
Deleted: ASFs
Deleted: ASF
Deleted: window
Deleted: 9
Deleted: A
Deleted: SF
Deleted: .
Deleted:
Deleted: for each of
Deleted:
Deleted: se
Deleted: ASF
Deleted: distributions
Deleted: ASFs
Deleted: ASF

SRP Draft
In Utero and Early Life Cancer 47 December 2008 Susceptibility: Age Sensitivity Measures OEHHA RCHAB
the publication of Grubbs et al. (1983), only one is used in determining the juvenile LP ratio
mixture distribution, since the two LP ratio distributions are not independent. The juvenile
exposure data (representing the numerator of both LP ratio distributions) are from the same
group of female rats exposed on days 50 through 57, but the adult exposure data (representing
the denominators of the LP ratio distributions) differ. In the first MNU juvenile LP ratio
distribution the adult exposure data are from females exposed on days 80 through 87. In the
second MNU juvenile LP ratio distribution the adult exposure data are from females exposed on
days 140 through 147. These MNU data illustrate that even within the adult lifestage, the earlier
the exposure occurs, the more sensitive the animal is to MNU-induced mammary tumors. For
DMBA, the juvenile females are significantly more sensitive than the adult animals, as reflected
in the LP ratio distribution significantly exceeding unity. For juvenile DMBA exposed males
there is no significant difference with adults and the LP ratio is consistent with unity.
Formatted: Indent: Left: 0 pt, Firstline: 0 pt
Deleted: ASF
Deleted: ASF
Deleted: ASF
Deleted: ASF
Deleted: ASF
Deleted: ASF
Deleted: the carcinogen (i.e.,
Deleted: )
Deleted:
Deleted: (i.e., DMBA-induced mammary tumors)
Deleted: ASF
Deleted: , while
Deleted: f
Deleted: ASF
Deleted: 

SRP Draft
In Utero and Early Life Cancer 48 December 2008 Susceptibility: Age Sensitivity Measures OEHHA RCHAB
Figure 14. Juvenile LP Ratio Distributions
*
*
*
DM
BA
Dim
ethy
lnitr
osam
ine
(DM
N)
3-H
ydro
xyxa
nthi
ne
Met
hyln
itros
oure
a (M
NU
)
Ure
than
e
0.01
0.1
1
10
100
1000A
SF
(una
djus
ted)
♦ Adult comparison group dosed on days 80-87 + Adult comparison group dosed on days 140-147 * Adult comparison group dosing began during late juvenile lifestage (day 46) and continued through day 61 1. Meranze et al. (1969), rat, Fels-Wistar, F, day 45 2. Ibid, M, day 451 3. Noronha and Goodall (1984), rat, CRL/CDF, M, day 46 4. Anderson et al. (1978), rat, Wistar, F, day 28 5. Grubbs et al. (1983), rat, Sprague Dawley, F, day 50-57 6. Ibid, M, day 50-57 7. Choudari Kommineni et al. (1970), rat, MRC, M/F, day 28-43
Rat Male Female M/F
[1]
[2] [3] [4] [5]
[6]
[7]
Formatted: Indent: Left: -36 pt
Formatted: Danish
Formatted
Formatted: Font: (Default) Arial
Formatted
Formatted: Font: 9 pt
Formatted
Formatted
Formatted
Formatted
Formatted
Formatted: Font: 9 pt
Formatted
Formatted
Formatted: Font: 9 pt
Formatted
Formatted
Formatted: Font: 9 pt
Formatted
Formatted
Formatted
Formatted: Font: 9 pt
Formatted
Deleted: 9
Deleted: ASF
Deleted: 
Deleted: <sp><sp><sp>
Deleted: window
Deleted: lifestage (day 46) and
... [18]
... [12]
... [21]
... [20]
... [13]
... [11]
... [15]
... [23]
... [14]
... [24]
... [17]
... [25]
... [16]
... [26]
... [22]
... [27]
... [19]

SRP Draft
In Utero and Early Life Cancer 49 December 2008 Susceptibility: Age Sensitivity Measures OEHHA RCHAB
Juvenile LP Ratio Mixture Distributions (LP Ratios for Five Chemicals Combined)
The LP ratio mixture distributions characterize and summarize the juvenile LP ratio distributions
from the juvenile multi-lifestage exposure studies on five chemicals displayed in Figure 14. In
these derivations, a single LP ratio distribution was obtained for each chemical and then each
chemical was equally sampled to obtain the LP ratio mixture distribution (see Methods).
Figure 15 displays the juvenile LP ratio mixture cumulative distribution functions, where
Method 1 represents equal weighting of studies within a chemical, and Method 2 (inverse-
variance weighting) and Method 3 (LP ratio distribution with the largest median selected for
each chemical) represent the alternative weighting methods employed in the sensitivity analysis.
Since only one chemical, DMBA, had more than one study and the LP ratio differences for this
chemical were moderate, the three methods produced similar results.
Figure 15. Juvenile LP Ratio Mixture Cumulative Distribution Functions
LP Ratio
Formatted: Danish
Formatted: Danish
Formatted: Font: 12 pt, Danish
Formatted: Font: 12 pt, Italic,Danish
Formatted: Font: (Default) Arial, 9pt
Formatted: Font: 12 pt, Danish
Formatted: Left
Formatted: Font: (Default) Arial
Deleted: Figure 14 Legend ¶Section Break (Next Page)
1.Meranze et al. (1969), rat, Fels-Wistar, F, day 45¶2. Ibid, M, day 451¶3.Noronha and Goodall (1984), rat, CRL/CDF, M, day 46¶4. Anderson et al. (1978), rat, Wistar, F, day 28¶5. Grubbs et al. (1983), rat, Sprague Dawley, F, day 50-57¶6. Ibid, M, day 50-57¶7. Choudari Kommineni et al. (1970), rat, MRC, M/F, day 28-43
Deleted: ASF
Deleted: ASF
Deleted: used to generate a juvenile ASF mixture distribution
Deleted: Figure 10 displays the juvenile ASF mixture cumulative distribution functions determined via Methods 1 through 3.
Deleted: ¶ 
Page Break
Deleted: 0
Deleted: ASF

SRP Draft
In Utero and Early Life Cancer 50 December 2008 Susceptibility: Age Sensitivity Measures OEHHA RCHAB
The mean, and certain percentiles of the juvenile LP ratio mixture distribution and the juvenile
ASF mixture distributiona are provided in Table 8. The distributions are discussed in more detail
in Appendix C, which also presents the results of the sensitivity analyses employing alternative
sampling methods in cases where there were multiple studies on a chemical.
Table 8. Juvenile LP Ratio and ASF Mixture Distribution Statistics
Statistics LP Ratio ASF
Mean* 2.63 7.10Percentiles
5th 0.20 0.5410th 0.34 0.9220th 0.60 1.6230th 0.93 2.5140th 1.31 3.5450th 1.67 4.5160th 2.10 5.6770th 2.77 7.4880th 3.57 9.6490th 4.96 13.3995th 7.29 19.68
* Calculated excluding large values above the 99th percentile. Formatted: Left
Formatted Table
Formatted: Font: 10 pt
Deleted: for each method
Deleted: The juvenile ASF mixture cumulative distribution derived via Method 1 is nearly indistinguishable from the ASF mixture cumulative distribution derived via Method 2. The comparative length of the boxplots and their associated 90% confidence intervals between the DMBA exposed male and female rat bioassay studies (shown in Figure 9) are similar such that the inverse-variance weighting method produces a nearly identical ASF mixture distribution in comparison to Method 1. Method 3 results in greater differences in the ASF mixture distribution as compared to Methods 1 and 2 because the female DMBA rat ASF distribution is solely being sampled to represent the chemical DMBA. The female DMBA rat ASF distribution consists of ASF values that are entirely above unity. As a result, the ASF mixture cumulative distribution function via Method 3 is shifted to the right as compared to Methods 1 and 2. The difference observed is reflective of the greater sensitivity of female rats to mammary (i.e., breast) cancer during the juvenile period.
Deleted: by Method
Deleted: Unadjusted¶Method 1
Deleted: Adjusted
Deleted: Method 1

SRP Draft
In Utero and Early Life Cancer 51 December 2008 Susceptibility: Age Sensitivity Measures OEHHA RCHAB
Figure 16 shows the individual juvenile ASF 90% confidence bounds for each of the datasets.
The ASF 90% confidence bounds are displayed as a cumulative frequency profile..
Figure 16. Juvenile ASF Cumulative Frequency Profile
ASF
Deleted: 1
Deleted: presents the boxplots for individual ASFs used to generate the Method 3 juvenile ASF mixture frequency distribution
Deleted: 1
Deleted: (Unadjusted)

SRP Draft
In Utero and Early Life Cancer 52 December 2008 Susceptibility: Age Sensitivity Measures OEHHA RCHAB
Based on the limited data set analyzed here, animals are inherently more sensitive in the juvenile
period, as indicated by the juvenile LP ratio mixture distribution (Figure 15). The juvenile ASF
mixture distribution shown in Figure 17 below takes into account both the inherent sensitivity of
juvenile animals and the available time since exposure to develop cancer. The majority of the
distribution lies above an ASF of 1.0, indicating susceptibility early in life. .
Figure 17. Juvenile ASF Mixture Distribution
0
10
20
30
40
50
60
70
80
90
100
0.1 1 10 100
ASF
Perc
entil
e
Unadjusted ASF
Formatted: Font: Not Bold
Formatted: Font: Not Bold
Formatted: Font: Not Bold
Formatted: Font: Not Bold
Formatted: Font: Not Bold
Formatted: Font: Not Bold
Deleted: As indicated in Figure 12 by the ASF curve, once an adjustment is made for timing of exposure, the difference between possible contributions of juvenile versus adult exposures becomes more pronounced for the cases examined here
Deleted: ¶¶¶¶
Deleted: 2
Deleted: Method 1
SRP Draft
In Utero and Early Life Cancer 53 December 2008 Susceptibility: Age Sensitivity Measures OEHHA RCHAB
DEN Case Study
Ten mouse publications on DEN were included in the compilation of single-lifestage exposure
studies in mice (See Table 5). Of these, three included groups of mice exposed during the
prenatal lifestage, seven included groups of mice exposed during the postnatal lifestage, and two
included groups of mice exposed during the juvenile lifestage. These studies yielded a total of
eight prenatal datasets, 18 postnatal datasets, and five juvenile datasets. No “adult only”
exposure studies were identified in mice for DEN. Thus the juvenile exposure studies were used
as the “later life” exposure comparison group. As noted earlier, if mice exposed to DEN during
the juvenile lifestage are more prone to cancer than fully mature animals exposed to DEN, then
the use of these juvenile exposure studies as the comparison group will result in an overall
underestimate of the comparative cancer susceptibility of exposures during the prenatal and
postnatal periods.
Cancer Potency Distributions
Figure 18 displays the box plots representing the cancer potencies derived for the different DEN
prenatal, postnatal and juvenile single-lifestage exposure studies in the mouse. The interquartile
range of the potency distributions is shown as boxes, while the upper and lower bars extend from
the box to the 95th and 5th percentiles, respectively. The Appendix D tables give the numerical
values for these bounds, along with the mean, standard deviation, and median for each of the
displayed distributions. The prenatal potency distributions fall into two distinct groupings. One
grouping is located about the potency value 0.1. The second grouping is centered approximately
at the potency value 0.005. The second grouping of studies exhibits greater fold-variability than
the first grouping. The postnatal potency distributions all have confidence intervals that are
entirely above the potency value of 0.1. Graphically, a greater cancer risk for mice exposed
during the postnatal lifestage as compared to the prenatal lifestage is apparent. The juvenile
potency distributions also have slightly elevated potency values compared to those derived from
the prenatal studies.
Deleted: with early life exposure
Deleted: window
Deleted: window
Deleted: window
Deleted: windows
Deleted: 3
Deleted: exposure
Deleted: window
Deleted: exposure window
Deleted: window

SRP Draft
In Utero and Early Life Cancer 54 December 2008 Susceptibility: Age Sensitivity Measures OEHHA RCHAB
Figure 18. Cancer Potencies for DEN in Mice Exposed during the Prenatal, Postnatal or Juvenile Lifestages
Bracketed numbers indicate study reference and characteristics given on next page Upper 75th and lower 25th percentiles are the upper and lower edges of the boxes and triangles, and the upper 95% and lower 5% bounds as horizontal marks above and below the edges of the box
Prenatal Exposure
1 Anderson et al. (1989), C3H/HeN, F, sac day 540 5 Lai et al. (1985), B6C3F2, M 18
Vesselinovitch. (1980), B6C3F1, M
2 Ibid, sac day 650 6 Rao and Vesselinovitch (1973), B6C3F1, F
3 Ibid, M, sac day 461 7 Ibid, M 4 Ibid, sac day 644 8 Turusov et al. (1973), CF-1, F
5 Mohr and Althoff (1965), NMRI, F 9 Ibid, M Juvenile Exposure
6 Ibid, M 10 Vesselinovitch et al. (1984), B6C3F1, F, day 1 1
Rao and Vesselinovich (1973), B6C3F1, M
7 Vesselinovitch (1983), B6C3F1, F 11 Ibid, M, day 1 2
Vesselinovitch et al. (1984), B6C3F1, F
8 Ibid, M 12 Ibid, F, day 15 3 Ibid, M Postnatal Exposure 13 Ibid, M day 15 4 Ibid, C3AF1, F
1 Boberg et al. (1983), B6C3F1, M 14 Ibid, C3AF1, F, day 1 5 Ibid, M
2 Drinkwater and Ginsler (1986), B6C3F1, M 15 Ibid, M, day 1
3 Ibid, C3H/HeJ, M 16 Ibid, F, day 15 4 Ibid, C57BL/6J, M 17 Ibid, M, day 15
Formatted: Font: (Default) ArialNarrow
Formatted: Left
Formatted: Font: (Default) ArialNarrow
Deleted: 3
Deleted: in
Deleted: Exposure Window
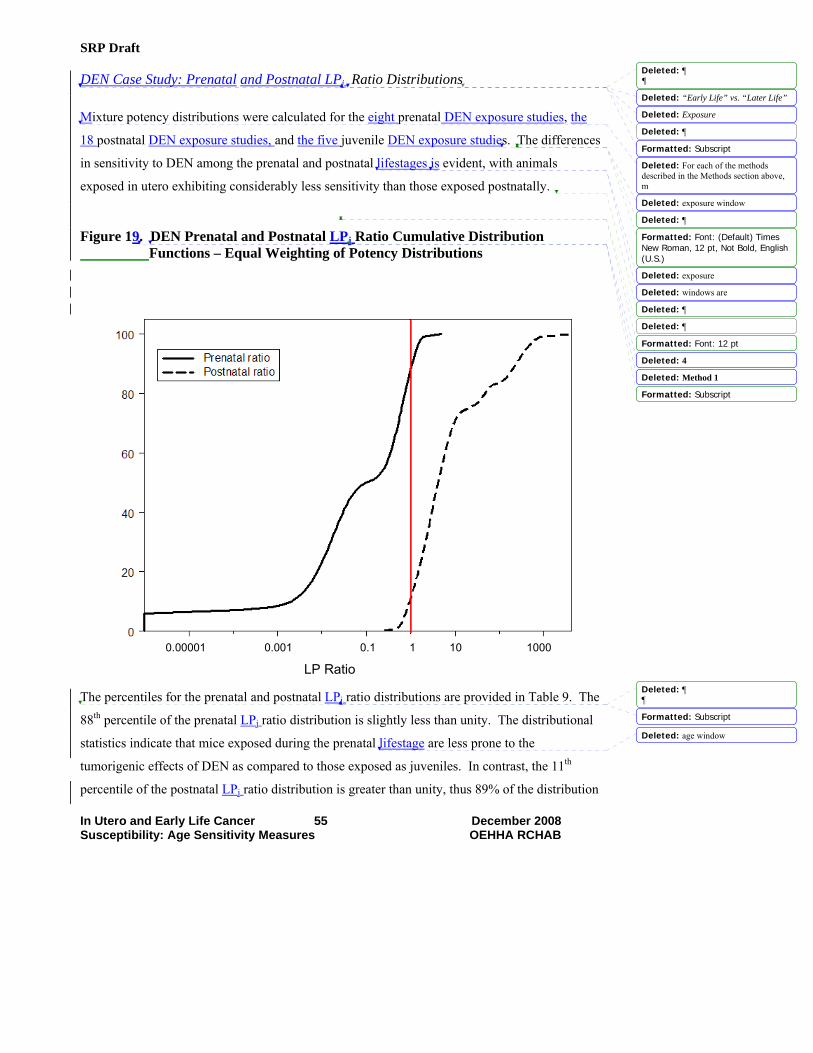
SRP Draft
In Utero and Early Life Cancer 55 December 2008 Susceptibility: Age Sensitivity Measures OEHHA RCHAB
DEN Case Study: Prenatal and Postnatal LPj Ratio Distributions
Mixture potency distributions were calculated for the eight prenatal DEN exposure studies, the
18 postnatal DEN exposure studies, and the five juvenile DEN exposure studies. The differences
in sensitivity to DEN among the prenatal and postnatal lifestages is evident, with animals
exposed in utero exhibiting considerably less sensitivity than those exposed postnatally.
Figure 19. DEN Prenatal and Postnatal LPj Ratio Cumulative Distribution Functions – Equal Weighting of Potency Distributions
The percentiles for the prenatal and postnatal LPj ratio distributions are provided in Table 9. The
88th percentile of the prenatal LPj ratio distribution is slightly less than unity. The distributional
statistics indicate that mice exposed during the prenatal lifestage are less prone to the
tumorigenic effects of DEN as compared to those exposed as juveniles. In contrast, the 11th
percentile of the postnatal LPj ratio distribution is greater than unity, thus 89% of the distribution
0.00001 0.001 0.1 1 10 1000
LP Ratio
Formatted: Subscript
Formatted: Font: (Default) TimesNew Roman, 12 pt, Not Bold, English(U.S.)
Formatted: Font: 12 pt
Formatted: Subscript
Formatted: Subscript
Deleted: ¶¶
Deleted: “Early Life” vs. “Later Life”
Deleted: Exposure
Deleted: 
Deleted: For each of the methods described in the Methods section above, m
Deleted: exposure window
Deleted: 
Deleted: exposure
Deleted: windows are
Deleted: 
Deleted: 
Deleted: 4
Deleted: Method 1
Deleted: ¶¶
Deleted: age window

SRP Draft
In Utero and Early Life Cancer 56 December 2008 Susceptibility: Age Sensitivity Measures OEHHA RCHAB
indicates that mice exposed during the postnatal lifestage are more prone to the tumorigenic
effects of DEN than those exposed as juveniles. The distributional differences in cancer risk (as
compared to juveniles) between DEN exposures occurring during the prenatal lifestage versus
the postnatal lifestage are quite evident.
Table 9. DEN Prenatal and Postnatal LPj Ratio Distributions
Percentiles Prenatal LPj Ratio
Postnatal LPj Ratio
5th 0.00 0.74 10th 0.002 0.96 20th 0.008 1.50 30th 0.02 2.19 40th 0.03 3.00 50th 0.10 4.21 60th 0.35 6.01 70th 0.53 9.53 80th 0.75 47.51 90th 1.08 240.62 95th 1.36 408.95
Table 10 shows the DEN prenatal and postnatal ASFj mixture distribution statistics. The
distributions are discussed more in detail in Appendix D, which also presents the results of the
sensitivity analyses employing alternative sampling methods to create the mixture potency
distributions for the different lifestages. In this case, at approximately the 60th percentile, the
DEN prenatal ASFj indicates equal contribution to lifetime risk from juvenile and in utero
exposure. The postnatal ASFj indicates considerably greater contributions to risk from postnatal
DEN exposures, as compared to juvenile exposures.
Formatted: Subscript
Formatted: Left
Formatted Table
Formatted: Subscript
Formatted: Subscript
Formatted Table
Formatted: Subscript
Deleted: age window
Deleted: a
Deleted: window
Deleted: a
Deleted: window
Deleted: In the variation on Method 1, where the potency distributions derived from each experiment are truncated at the 5th and 95th percentiles, the results are not appreciably different from those obtained without the truncation, and indicate the same general conclusions.¶¶¶
Deleted: Method 1
Deleted: (Unadjusted)
Deleted: –
Deleted: Equal Weighting of Potency Distributions
Deleted: Percentiles
Deleted: ¶¶Figure 15 shows the DEN prenatal and postnatal ratio frequency distributions generated using Method 1. Both the prenatal and postnatal ratio frequency distributions are multi-modal.¶¶¶Figure 15. Method 1 DEN Prenatal and Postnatal Ratio Frequency Distributions –Equal Weighting of Potency Distributions¶<sp><sp><sp><sp><sp><sp><sp><sp><sp><sp><sp>
Deleted: ratio
Deleted: when an adjustment is made for early versus adult timing of exposure.
Deleted: ratio
Deleted: adult
Deleted: ratio
Deleted: early in the postnatal period
... [28]
... [29]

SRP Draft
In Utero and Early Life Cancer 57 December 2008 Susceptibility: Age Sensitivity Measures OEHHA RCHAB
Table 10. DEN Prenatal and Postnatal ASFj Mixture Distribution Statistics –
Percentiles Prenatal ASFj Postnatal ASFj 5th 0.00 2.14
10th 0.01 2.78 20th 0.02 4.34 30th 0.05 6.37 40th 0.09 8.70 50th 0.31 12.20 60th 1.05 17.43 70th 1.58 27.65 80th 2.24 137.79 90th 3.25 697.81 95th 4.07 1185.95
ENU Case Study
Thirteen mouse publications on ENU were included in the compilation of single-lifstage
exposure studies in mice (See Table 5). Of these, five included groups exposed during the
prenatal lifestage, eight included groups exposed during the postnatal lifestage, and three
included groups exposed during the juvenile lifestage. These studies yielded a total of 30
prenatal, 27 postnatal, and eight juvenile datasets. As with DEN, no “adult only” exposure
studies were available and the juvenile exposure studies were used as the “later life” exposure
comparison group.
Cancer Potency Distributions
Figure 20 displays box plots representing the cancer potencies derived for the different ENU
prenatal, postnatal and juvenile single-lifestage exposure studies in the mouse. The interquartile
range of the potency distributions is shown as boxes, while the upper and lower bars extend from
the box to the 95th and 5th percentiles, respectively. The Appendix E tables give the numerical
values for these bounds, along with the mean, standard deviation, and median for each of the
Formatted: Subscript
Formatted Table
Formatted: Highlight
Formatted: Highlight
Deleted: Method 1
Deleted: Ratio Distributions
Deleted: with Adult vs. Early-Life Timing of Exposure Adjustment
Deleted: Ratio
Deleted: Ratio
Deleted: ¶¶¶¶Method 2: Weighting Potency Distributions by Inverse-Variance and the Interquartile Range.¶Figure 16 shows the DEN prenatal and postnatal ratio cumulative distribution functions generated using Method 2a, weighting by inverse-variance, and Method 2b, weighting by the interquartile range (IQR). Qualitatively the results are similar to Method 1, with considerable sensitivity exhibited in the postnatal window. The magnitude of the differences in the ratio distributions for DEN across the prenatal and postnatal exposure windows is evident. 
Page BreakFigure 16. Methods 2a and 2b DEN Prenatal and Postnatal Ratio Cumulative Distribution Functions – Inverse-Variance and Interquartile Weighting of Potency Distributions¶¶
Deleted: with early life exposure
Deleted: window
Deleted: window
Deleted: window
Deleted: experiments
Deleted: 17
Deleted: from
Deleted: experiments
... [30]

SRP Draft
In Utero and Early Life Cancer 58 December 2008 Susceptibility: Age Sensitivity Measures OEHHA RCHAB
displayed distributions. The prenatal potency distributions fall into two distinct groupings. One
grouping is located about the potency value 4.0, and a second grouping is centered
approximately at the potency value 0.1. The grouping of prenatal studies with potency values
centered around 4.0 have greater variability than the prenatal studies centered around the lower
potency value of 0.1. The postnatal potency distributions also exhibit two distinct groupings,
with one grouping located about the potency value 0.7, and a second centered approximately at
the potency value 0.1. The grouping of postnatal studies centered around 0.7 have greater
variability than the postnatal studies centered around the lower potency value of 0.1. Finally,
two distinct groupings are also apparent for the juvenile studies. One grouping is located about
the potency value 0.05. The second grouping is centered approximately at the potency value
0.007. The grouping of juvenile studies centered about the potency value of 0.007 has greater
variability than the grouping of juvenile studies centered about the higher potency value of 0.05.
Deleted: exposure window

SRP Draft
In Utero and Early Life Cancer 59 December 2008 Susceptibility: Age Sensitivity Measures OEHHA RCHAB
Figure 20. Cancer Potencies for ENU in Mice Exposed during the Prenatal, Postnatal or Juvenile Lifestages1
1Numbers indicate study reference and characteristics given on next page
Upper 75th and lower 25th percentiles are the upper and lower edges of the boxes and triangles, and the upper 95% and lower 5% bounds as horizontal marks above and below the edges of the box
Male
Female
Male/Female
Formatted: Font: 13 pt
Formatted: Superscript
Formatted: Font: 13 pt
Formatted: Superscript
Deleted: 17
Deleted: in
Deleted: Exposure Windows

SRP Draft
In Utero and Early Life Cancer 60 December 2008 Susceptibility: Age Sensitivity Measures OEHHA RCHAB
Figure 20 continued: Study Identifiers
Prenatal Exposure Postnatal Exposure
1 Diwan et al. (1974), AKR/J x SW/J, M 1 Anderson et al. (1989),
C3H/HenCr MTV,F, sac day 405 25 Ibid, day 15
2 Ibid, F 2 Ibid, sac day 451 26 Vesselinovitch (1983), B6C3F1, F 3 Ibid, SW/J x AKR/J , M 3 Ibid, M, sac day 342 27 Ibid, M 4 Ibid, F 4 Ibid, sac day 397 Juvenile Exposure 5 Kauffman (1976), Swiss, F,
day -7 5 Drinkwater and Ginsler (1986), C3F/HeJ, M 1 Vesselinovitch et al. (1973),
B6C3F1, F 6 Ibid, day -6 6 Ibid, C57BL/6, M 2 Ibid, M
7 Ibid, day -5 7 Naito et al. (1982), A/He, F 3 Vesselinovitch et al. (1974), C3AF1, F
8 Ibid, day -4 8 Ibid, M 4 Ibid, M 9 Ibid, day -3 9 Pereira et al. (1985), Cd1, F 5 Ibid, B6C3F1, F
10 Vesselinovitch et al. (1977), B6C3F1, day -10 10 Ibid, M 6 Ibid, M
11 Ibid, day -8 11 Schmahl (1988), NMRI, F 7 Vesselinovitch (1983), B6C3F1, F 12 Ibid, day -6 12 Ibid, F (independent exp) 8 Ibid, M 13 Ibid, day -4 13 Ibid, M 14 Ibid, day -10 14 Ibid, M (independent exp) 15 Ibid, day -8 15 Searle and Jones (1976), A, M/F 16 Ibid, day -6 16 Ibid, C57BL, M/F 17 Ibid, day -4 17 Ibid, DBA, M/F 18 Ibid, C3B6F1, day -10 18 Ibid, IF, M/F
19 Ibid, day -8 19 Vesselinovitch et al. (1974), B6C3F1, F, day 1
20 Ibid, day -6 20 Ibid, day 15 21 Ibid, day -4 21 Ibid, M, day 1 22 Ibid, day -10 22 Ibid, day 15 23 Ibid, day -8 23 Ibid, C3AF1, F 24 Ibid, day- 6 24 Ibid, M, day 1 25 Ibid, day -4 26 Vesselinovitch (1983), B6C3F1, F 27 Ibid, M
28 Wiggenhauser and Schmahl (1987), NMRI, day -8
29 Ibid, day -7 30 Ibid, day -6
Formatted: Font: 13 pt
Formatted: Font: 13 pt
Formatted: Bullets and Numbering
Deleted: 17
Deleted: Figure Legend
Deleted: October
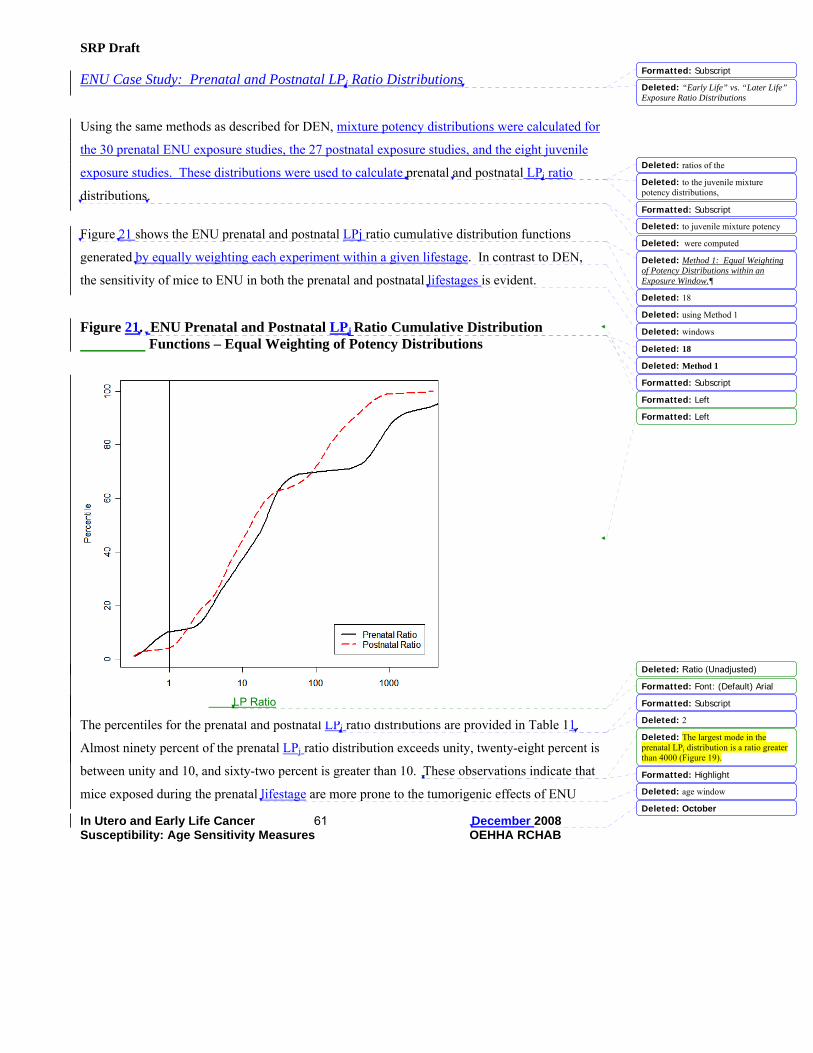
SRP Draft
In Utero and Early Life Cancer 61 December 2008 Susceptibility: Age Sensitivity Measures OEHHA RCHAB
ENU Case Study: Prenatal and Postnatal LPj Ratio Distributions
Using the same methods as described for DEN, mixture potency distributions were calculated for
the 30 prenatal ENU exposure studies, the 27 postnatal exposure studies, and the eight juvenile
exposure studies. These distributions were used to calculate prenatal and postnatal LPj ratio
distributions.
Figure 21 shows the ENU prenatal and postnatal LPj ratio cumulative distribution functions
generated by equally weighting each experiment within a given lifestage. In contrast to DEN,
the sensitivity of mice to ENU in both the prenatal and postnatal lifestages is evident.
Figure 21. ENU Prenatal and Postnatal LPj Ratio Cumulative Distribution Functions – Equal Weighting of Potency Distributions
The percentiles for the prenatal and postnatal LPj ratio distributions are provided in Table 11.
Almost ninety percent of the prenatal LPj ratio distribution exceeds unity, twenty-eight percent is
between unity and 10, and sixty-two percent is greater than 10. These observations indicate that
mice exposed during the prenatal lifestage are more prone to the tumorigenic effects of ENU
LP Ratio
Formatted: Subscript
Formatted: Subscript
Formatted: Left
Formatted: Left
Formatted: Font: (Default) Arial
Formatted: Subscript
Formatted: Highlight
Formatted: Subscript
Deleted: “Early Life” vs. “Later Life” Exposure Ratio Distributions
Deleted: ratios of the
Deleted: to the juvenile mixture potency distributions,
Deleted: to juvenile mixture potency
Deleted: were computed
Deleted: Method 1: Equal Weighting of Potency Distributions within an Exposure Window.
Deleted: 18
Deleted: using Method 1
Deleted: windows
Deleted: 18
Deleted: Method 1
Deleted: Ratio (Unadjusted)
Deleted: 2
Deleted: The largest mode in the prenatal LPj distribution is a ratio greater than 4000 (Figure 19).
Deleted: age window
Deleted: October

SRP Draft
In Utero and Early Life Cancer 62 December 2008 Susceptibility: Age Sensitivity Measures OEHHA RCHAB
than those exposed as juveniles. In addition, more than 95% of the postnatal LPj ratio
distribution is greater than unity. indicating that mice exposed during this lifestage are more
prone to the tumorigenic effects of ENU than those exposed as juveniles.
Table 11. ENU Prenatal and Postnatal LPj Ratio Distributions
Percentiles Prenatal LPj Ratio
Postnatal LPj Ratio
5th 0.53 1.14 10th 0.94 1.65 20th 3.86 3.03 30th 6.56 5.39 40th 11.60 8.09 50th 19.30 12.84 60th 27.13 21.87 70th 116.16 88.96 80th 679.56 154.90 90th 1266.12 325.80 95th 4381.63 519.75
Table 12 shows the ENU prenatal and postnatal ASFj mixture distribution statistics. The
distributions are discussed in more detail in Appendix E, which also presents the results of the
sensitivity analyses employing alternative sampling methods to create the mixture potency
distributions for the different lifestages. The prenatal ASFj and the postnatal ASFj indicate
considerably greater contributions to risk from ENU exposures during these lifestages, as
compared to juvenile exposures.
Table 12. ENU Prenatal and Postnatal ASFj Mixture Distribution Statistics
Percentiles Prenatal ASFj Postnatal ASFj
5th 1.59 3.31 10th 2.82 4.78 20th 11.58 8.79 30th 19.68 15.63 40th 34.80 23.46 50th 57.90 37.24 60th 81.39 63.42 70th 348.48 257.98 80th 2038.68 449.21 90th 3798.36 944.82 95th 13144.89 1507.28
Formatted: Font: 13 pt
Formatted: Font: 13 pt, Bold
Formatted: Font: 13 pt
Formatted: Left
Formatted Table
Formatted Table
Formatted: Subscript
Formatted: Highlight
Formatted: Highlight
Formatted: Subscript
Formatted: Left
Formatted: Subscript
Formatted: Subscript
Formatted Table
Deleted: ¶¶M
Deleted: the postnatal
Deleted: age window
Deleted: 
Deleted: 2
Deleted: Method 1
Deleted: (Unadjusted)
Deleted: –
Deleted: ¶Equal Weighting of Potency Distributions
Deleted: Percentiles
Deleted: Figure 19 shows the ENU prenatal and postnatal ratio frequency distributions generated using Method 1. Both the prenatal and postnatal ratio frequency distributions are multi-modal. The ENU postnatal ratio distribution has a similar overall shape as the prenatal ratio distribution, with a shift to the left such that the values of the distribution are not as extreme. The ENU postnatal ratio distribution is more compact and lacks the most extreme values observed in the
Deleted: 3
Deleted: ratios calculated using Method
Deleted: 3
Deleted: Method 1
Deleted: Ratio
Deleted: –
Deleted: with Adult vs. Early-Life
Deleted: Ratio
Deleted: Ratio
Deleted: October
... [34]
... [32]
... [33]
... [31]

SRP Draft
In Utero and Early Life Cancer 63 December 2008 Susceptibility: Age Sensitivity Measures OEHHA RCHAB
Discussion
Data from studies on 23 unique carcinogens, 20 of which are considered to act via primarily
genotoxic modes of action, were analyzed. Of these 20 carcinogens, 15 are thought to require
metabolic activation to the ultimate carcinogenic species. The analyses indicate that both the
prenatal and postnatal lifestages can be much more susceptible to developing cancer than the
adult lifestage. As an index of inherent susceptibility, one that does not account for the longer
time early exposures can manifest, an LP ratio was derived. This index compares the
carcinogenicity activity when exposures occur early in life compared to older ages, for the same
period of time between initial exposure and observation of effect. For the multi-lifestage
exposure studies, the median LP ratio for the postnatal period was 4.6 or 7.5, and the upper 95%
confidence bound ranged from 123 to 188, depending on the method of combining the ASF
distributions underlying studies on the same chemical.
There were few cases of LP ratios less than 1.0 for the postnatal lifestage. These results indicate
that in general, for the chemicals studied, there is inherently greater susceptibility during the
early postnatal compared to the adult period. The differences between postnatal and adult
susceptibility appear more pronounced once the longer period of time that exposed young have
to develop tumors is addressed by taking into account time-of-dosing, in calculating the ASF.
The median value for the postnatal ASF indicates for the chemicals studied here a 13.5- fold
greater contribution to lifetime cancer risk when exposure occurs during this period, compared to
the same exposure averaged throughout the adult period; the upper 90th percentile ASF was 211.
The DEN and ENU case studies also exhibited substantial sensitivity in the postnatal lifestage,
with inherent susceptibility about half an order of magnitude greater than juveniles for DEN, and
about an order of magnitude greater than juveniles for ENU, and again greater susceptibility
once the longer period of time that exposed young have to develop tumors is ttaken into account.
Regarding in utero exposure, few studies provided data indicative of equal inherent adult and
prenatal susceptibility, with an LP ratio of unity. For the multi-lifestage exposure studies, the
prenatal LP ratio distributions are roughly bimodal, with LP ratios for several studies
significantly greater than unity and several others significantly less than unity (Figure 6). The
median LP ratio mixture distribution was 2.5. The median estimate of the prenatal ASF was 2.9,
Formatted: Highlight
Formatted: Highlight
Formatted: Highlight
Formatted: Highlight
Formatted: Highlight
Deleted: Discussion¶¶Data from studies on 23 unique carcinogens, 20 of which are considered to act via primarily genotoxic modes of action, were analyzed. Of these 20
Deleted: 
Deleted: 
Deleted: 6
Deleted: ASF (unadjusted)
Deleted: window
Deleted: unadjusted ASF
Deleted: unadjusted ASFs
Deleted: window
Deleted: an adjustment is made to the
Deleted: adjusted
Deleted: either
Deleted: 4
Deleted: or 21.6-
Deleted: ranged
Deleted: from
Deleted: to 307.6, depending on the
Deleted: period
Deleted: larger contributions
Deleted: to risk during this period
Deleted: iming of exposure
Deleted: adjustment is made
Deleted: n unadjusted ASF
Deleted: window
Deleted: unadjusted ASF
Deleted: is
Deleted: unadjusted ASFs
Deleted: 1
Deleted: unadjusted ASF
Deleted: ranges from 0.93 to
Deleted: , depending on the method
Deleted: For
Deleted: s
Deleted: adjusted to take into account
Deleted: 8 to 7.5
Deleted: October
... [38]
... [40]
... [35]
... [37]
... [41]
... [36]
... [39]
SRP Draft
In Utero and Early Life Cancer 64 December 2008 Susceptibility: Age Sensitivity Measures OEHHA RCHAB
and the mean estimate ws 21.1. This modality in the prenatal LP ratio and ASF mixture
distributions is reflected in the case studies. The prenatal LPj ratio for DEN has a median of 0.1,
and the majority of the distribution falls below unity. This is suggestive of reduced inherent
susceptibility in utero. In contrast the median prenatal LPj ratio for ENU was 19.3, with the
majority of the distribution exceeding unity, indicative of greater inherent in utero susceptibility.
In considering implications of the DEN and ENU case studies it is important to recognize that
the referent groups were juvenile rather than adult animals. The prenatal (and postnatal) LPj
ratios and ASFjs are likely to be underestimates, to the extent that some of the apparent
sensitivity for DEN and ENU in the early postnatal period carries through to the juvenile period.
ENU is a direct acting carcinogen that does not require metabolic activation to alkylate DNA,
forming DNA adducts and mutations that ultimately result in the formation of tumors (Slikker III
et al., 2004). In contrast, DEN requires metabolic activation by cytochrome P450 enzymes (e.g.,
P450 2E1, P450 2A6) to form the active DNA ethylating species (Brittebo et al., 1981). While
both ENU and DEN cross the placenta and are widely distributed in fetal tissues (Rice et al.
1989; Brittebo et al., 1981), DEN can not be metabolized to any significant extent by fetal
tissues until relatively late in gestation (i.e., gestation day 18 in the mouse), and after birth the
expression of P450 2E1 progressively increases, reaching adult levels by day 30 (Brittebo et al.,
1981). This may explain the lower fetal susceptibility of DEN. However, the multi-lifestage
exposure studies illustrate that in utero metabolic status is not the sole determinant of in utero
susceptibility: benzidine and safrole require metabolic activation and exhibit greater
susceptibility from prenatal exposure (see Figure 6).
There are just five chemicals and seven studies, two of which are not independent (i.e., the MNU
studies of Grubbs et al., 1983), available to examine susceptibility in the juvenile lifestage. The
LP ratio distributions indicate significantly greater inherent susceptibility in this period for three
of the independent studies, with the three remaining independent studies consistent with equal
inherent susceptibility to adult animals (Figure 14). For the juvenile lifestage, the ASF mixture
distribution was 4.5 at the 50th percentile and 19.7 at the 95th percentile.
The studies that comprise the set of multi-lifestage exposure studies available for these analyses
were not homogeneous. That is, they do not represent observations from the same distribution.
Formatted: Subscript
Formatted: Subscript
Formatted: Font: Not Italic
Deleted: s
Deleted: from
Deleted: 16.6 to 37.1
Deleted: , depending on the method used to combine studies
Deleted: unadjusted ASF
Deleted: for the prenatal window
Deleted: vs. juvenile
Deleted: potency
Deleted: to 0.43, depending on the method used to combine studies within each exposure window
Deleted: unadjusted ASF
Deleted: range from
Deleted: 3.8 to
Deleted: 4
Deleted: vs. juvenile and postnatal vs. juvenile ratios for these chemicals
Deleted: of the ASF
Deleted: exposure
Deleted: window
Deleted: in utero
Deleted: 1
Deleted: period
Deleted: unadjusted ASF
Deleted: s
Deleted: 9
Deleted: window
Deleted: s adjusted for timing range from
Deleted: to 5.5
Deleted: from
Deleted: to 27.4
Deleted: window
Deleted: October

SRP Draft
In Utero and Early Life Cancer 65 December 2008 Susceptibility: Age Sensitivity Measures OEHHA RCHAB
Sensitivity analyses were conducted to test the robustness of the findings to different procedures
for analyzing data and combining results. Of the methods used to combine the LP ratio
distributions for underlying studies within each lifestage, the method of equally weighting
studies within a chemical appears to best represent the available data. The use of inverse
variance in weighting LP ratio distributions within a chemical may underweight small studies
and overweight large ones, and thus produce a LP ratio mixture distribution that does not
accurately reflect the overall data. This is clearly illustrated by the results of the postnatal ENU
case study analyses. The method of selecting a single study (i.e., that with the largest median LP
ratio) to represent each chemical may also result in inadvertent bias if a selected study is not
representative of the group being studied.
In taking into account the longer period of time for early carcinogen exposures to manifest, the
hazard function was assumed to increase with the third power of age. If the true rate of increase
with age is greater than that, then the ASFs presented here may result in underestimates of the
true sensitivity of these early lifestages.
As the multi-lifestage exposure and chemical-specific case studies show, there appears to be
considerable variability in age-at-exposure related susceptibility across carcinogens. There is
also variability in age-at-exposure related susceptibility among studies of the same carcinogen.
The sources of variability evident in the analyzed studies include timing of exposure within a
given lifestage, and gender, strain, and species differences in tumor response. The set of studies
identified and analyzed was not sufficiently robust to fully describe quantitatively the variability.
This variability raises concerns that selection of the median (the 50th percentile) estimates may
considerably underestimate effects for certain carcinogens or population groups. Relatively large
variability in humans in response to carcinogens is expected to be common (Finkel, 1995; 2002).
Several of the carcinogens studied induced tumors at multiple sites in the same experiment, and
at different sites, depending upon the lifestage during which exposure occurred. The cancer
potencies used in the early vs. later life comparisons were based on all treatment-related tumors.
When treatment-related tumors were induced at multiple sites in the same experiment, or at the
same site, but arising from different cell types, the slopes of the dose response curves from these
different tumor sites or types were statistically combined to create an overall multisite cancer
Deleted: three
Deleted: ASF
Deleted: exposure window
Deleted: ASF
Deleted: ASF
Deleted: ASF
Deleted: adjusting the ASF to
Deleted: e
Deleted:
Deleted: window
Deleted: age window
Deleted: , that is
Deleted: ,
Deleted: for age window-specific ASFs
Deleted: age window
Deleted: October

SRP Draft
In Utero and Early Life Cancer 66 December 2008 Susceptibility: Age Sensitivity Measures OEHHA RCHAB
potency distribution for that experiment. The result reflects the total cancer impact associated
with the carcinogen exposure in question. This approach differs from other researchers
investigating early vs. late in life differences (e.g., Barton et al., 2005; Hattis et al., 2004; 2005).
We believe this provides a more complete approach for considering age specific differences in
carcinogenic activity.
One limitation of the approach was the focus on lifestages, without attempting to describe
changes in susceptibility that occur within a lifestage. Timing of carcinogen exposure within a
given lifestage can affect the cancer outcome observed. This is illustrated by experiments with
1-ethyl-1-nitrosobiuret in prenatal and adult rats by Druckrey and Landschutz (1971). A three
fold difference in activity was observed between two prenatal exposure groups, one exposed on
prenatal day -10 and the other on prenatal day -3 (See Figure 6 and Appendix B, Table B1). The
timing of exposure within the adult age window can also affect the cancer outcome, as illustrated
by the experiments of Grubbs et al. (1983), in which female rats exposed early in the adult
period (days 80 through 87) were more than three times as sensitive to the breast cancer effects
of MNU than females exposed six weeks later (Figure 14 and Appendix B, Table B3). In
general the adult comparison groups in the multi-lifestage exposure studies were fairly young.
The extent to which this may result in an overall bias of the results presented here is unclear.
Also for several cases, juvenile animals were used as the later life exposure group. In these cases
the ASFs are likely underestimates of the relative sensitivity of the prenatal and postnatal
lifestages, compared to that of the adult lifestage.
Excluded from the analysis presented here were early in life studies in which exposure of a given
exposure group crossed multiple lifestages. An example of results from studies of this type is
provided by mouse studies for two non-genotoxic carcinogens, diphenylhydantoin (Chhabra et
al., 1993a) and polybrominated biphenyls (Chhabra et al., 1993ab), in which exposures began
prior to conception, and continued throughout the prenatal, postnatal, and post-weaning periods,
up to the age of eight weeks. The data, shown in Appendix F, demonstrate an increased
sensitivity associated with exposures to either of these non-genotoxic carcinogens during the
entire early life period, as compared to exposures during only the adult lifestage. Some studies
that crossed multiple lifestages were included in the analyses of Barton et al. (2005), which are
consistent with the general conclusions here.
Deleted: analysis of age windows,
Deleted: n age window
Deleted: age window
Deleted: 1
Deleted: 9
Deleted: window
Deleted: age window
Deleted: age window
Deleted: October

SRP Draft
In Utero and Early Life Cancer 67 December 2008 Susceptibility: Age Sensitivity Measures OEHHA RCHAB
Barton et al. (2005) discussed data on 18 unique carcinogens, but ultimately analyzed data on six
mutagenic carcinogens (benzidine, diethylnitrosamine, 3-MC, safrole, urethane, and vinyl
chloride) to derive the age dependent adjustment factor of 10 for carcinogen exposures occurring
between birth and the second birthday, as specified in the U.S. EPA’s (U.S. EPA, 2005)
Supplemental Guidance for Assessing Susceptibility from Early-Life Exposure to Carcinogens.
In performing the analysis, Barton et al. (2005) compared tumor site-specific potencies, while
here multi-site cancer potency estimates provide the basis for comparison. Barton et al. (2005)
also did not address prenatal or juvenile exposures in their analyses, nor was the issue of time-of
dosing addressed wherein exposure to the fetus, infant or child has a longer period of time
compared to an exposed adult to produce cancer. Other evaluations of exposure occurring in
early life and in adults in the same study have been attempted (e.g., McConnell, 1992) but have
not considered indices of carcinogenic activity as systematically as was done in the analyses here
or by Barton et al. (2005). Thus the analysis presented here adds to the body of evidence on
which to consider methods to use in estimating cancer risk when the young are exposed.
Implications for Cancer Risk Assessment Guidelines Taken together the results indicate that early lifestages are generally more sensitive to carcinogen
exposure than adults, and that cancer risk assessment practices should take increased sensitivity
of the young into account. Here the results of these analyses are reflected on in the context of
existing state and federal cancer risk assessment guidelines. The degree that such guidelines
adequately address carcinogenic exposures to the fetus, infants and children has been a concern
of the California State legislature, which mandated the study presented here, as part of the
Children’s Environmental Health Initiative (AB 2872, Shelly, HSC section 901). This
legislation also required OEHHA to review its own and other Cal/EPA, state and federal
guidelines to assess methodologies used and establish new methodologies if needed (HSC
section 901 [b] and [c]).
U.S. EPA, California and other states now have legal mandates to ensure that regulatory
standards are adequately protective of the fetus, infants and children, and have developed or are
considering methodologies that explicitly address the young in cancer risk estimation. In
California, the Children’s Environmental Health Initiative (HSC section 901 [b]) mandates
Deleted: longer “shelf-life”
Deleted: October
SRP Draft
In Utero and Early Life Cancer 68 December 2008 Susceptibility: Age Sensitivity Measures OEHHA RCHAB
OEHHA to ensure that regulatory standards for carcinogens are adequately protective of fetuses,
infants and children. In 2001 OEHHA reported on its review of existing guidelines. California
has, on occasion, adjusted dose calculations used in estimating cancer potency with a Doll-
Armitage analysis to account for variable dosing over time (e.g., early-in-life exposures). This
model can be used to address the longer period of time available for cancer to manifest when
exposures occur early in life. It does not however address the issue of inherent tissue
susceptibility. OEHHA in 2001 concluded that the existing default mathematical models
employed for the purpose of estimating excess cancer risk did not adequately address the
possibility that risk from early-in-life exposures may differ from that associated with exposures
occurring in adulthood. OEHHA further concluded that there was a need for such methodologies
to be developed, tested, and validated (Cal/EPA, 2004). Also, under SB 25 (The Children’s
Environmental Health Protection Act of 1999, Escutia, HSC section 39600 et seq.), in re-
evaluating cancer potency values under the Air Toxics Hot Spots program, California is required
to take into account general or chemical-specific consideration which suggests that children may
be especially susceptible to certain carcinogenic effects.
The U.S. EPA Supplemental Guidance for Assessing Susceptibility from Early-Life Exposure to
Carcinogens (U.S. EPA, 2005) concluded there is evidence of differential susceptibility for
mutagenic carcinogens and recommended adjustments to the adult slope factor and its integration
with exposure estimates in estimating cancer risk associated with early life exposures. A ten-
fold adjustment to the adult slope factor is suggested for exposures to mutagenic carcinogens
occurring from birth up to two years of age, and a three-fold adjustment for such exposures
occurring from 2 up to 16 years of age. No adjustment was recommended to address the fetus
for increased susceptibility or the full lifetime ahead for cancer to be manifest. No adjustment
was suggested for non-mutagenic carcinogens (U.S. EPA, 2005), even though there is increasing
appreciation that carcinogens often act by multiple mechanisms, including non-mutagenic
mechanisms, and that the relative importance of a given mechanism of action may vary with
lifestage. Indeed, evidence from human cancers indicates that epigenetic changes, such as
alterations in DNA methylation, are often associated with early events in human carcinogenesis
(Baylin, 2005). Thus existing U.S. EPA guidance applies to only a subset of carcinogens, and,
while addressing exposures to infants and children, does not acknowledge any effect of
carcinogen exposures to the fetus. Deleted: October

SRP Draft
In Utero and Early Life Cancer 69 December 2008 Susceptibility: Age Sensitivity Measures OEHHA RCHAB
OEHHA recognizes the limitations in the data and analyses presented, as discussed above. Still
the analyses do provide some guidance on the extent risk may be over- or underestimated by
current approaches. The analyses demonstrate the sensitivity of three early lifestages for the
carcinogens analyzed here. While there is a great deal of variability across chemicals in the
prenatal ASFs, the data indicate that the potency associated with prenatal carcinogen exposure is
not zero. A factor of 10 falls roughly at the 70th percentile for the multi-lifestage exposure
studies analysis (Table 6). This value could be applied to the potency estimate when calculating
lifetime cancer risk in humans arising from carcinogen exposures that occur in utero.
Alternatively, factors of 50 and 115 fall roughly at the 90th and 95th percentiles, respectively, for
the prenatal ASF derived in the multi-lifestage exposure studies analysis.
The U.S. EPA’s factor of 10 for postnatal exposures falls between the 40th and 50th percentiles
for postnatal studies (Table 7); thus while it is consistent with the data presented, it may result in
underestimates of risk for a reasonable fraction of chemicals. Factors of 210 and 350 fall
roughly at the 90th and 95th percentiles, respectively, for the postnatal ASF derived in the multi-
lifestage exposure studies analysis. The U.S. EPA’s factor of 3 for juvenile exposures is
consistent with the range of estimates derived from the multi-lifestage exposure studies, although
it falls below the median estimate (Table 8). It is acknowledged that there are few data available
on which to base an estimate for the juvenile lifestage. A factor of 3 adjusts for the longer time it
takes for cancer to manifest, but is unlikely to fully account for inherent differences in
susceptibility to cancer, such as occurs in breast tissue of pubescent girls exposed to radiation.
Factors of 13 and 20 fall roughly at the 90th and 95th percentiles, respectively, for the juvenile
ASF multi-lifestage exposure studies analysis.
Table 15 illustrates the impact of lifestage specific ASFs on lifetime cancer risk. In this
example, exposure to the carcinogen is assumed to occur at a constant exposure rate over the
entire lifetime. Risk calculations were performed using the mean, 50th, 70th, and 95th percentile
ASF values to adjust the adult cancer potency. As shown in Table 15, when increased
susceptibility of the fetus, infants, and children is taken into account by applying 50th percentile
ASF values, the total lifetime cancer risk is increased two-fold; applying 70th percentile ASF
values increases the risk three-fold, applying mean ASF values increases the risk 4.6-fold, and
Deleted: exposure windows
Deleted: window
Deleted: y
Deleted: multi-window
Deleted: multi-window
Deleted: window
Deleted: s
Deleted: for all three methods presented
Deleted: period
Deleted: multi-window
Deleted: age-window
Deleted: derived using Method 1 (i.e., equally weighting studies within a chemical; selected based upon the findings of a sensitivity analysis as the best method to represent the available data)
Deleted: October

SRP Draft
In Utero and Early Life Cancer 70 December 2008 Susceptibility: Age Sensitivity Measures OEHHA RCHAB
applying 95th percentile ASF values increases the risk 16-fold above the risk estimated in the
absence of age-specific adjustments to the potency. Table 15 also shows how the application of
the U.S. EPA’s adjustment factors for the postnatal and juvenile lifestages in calculating total
lifetime cancer risk compares with the use of the ASF values derived from the multi-lifestage
exposure studies analyzed here. For example, the use of 70th percentile ASF values as
adjustments for the prenatal, postnatal, and juvenile lifestages increases the total lifetime cancer
risk almost two-fold above the risk estimated using the U.S. EPA’s adjustment factors.
Concluding Remarks This report indicates the extent risk may be over- or underestimated by current risk assessment
approaches. The analyses support the application of weighting factors to address potential
increased susceptibility to carcinogen exposures occurring prenatally and during postnatal and
juvenile lifestages. The limitations in the data and analyses are recognized and discussed in the
report. Limitations can not explain the age specific differences observed.
Deleted: age windows
Deleted: window
Deleted: age windows
Deleted: age periods
Deleted: October

SRP Draft
In Utero and Early Life Cancer 71 December 2008 Susceptibility: Age Sensitivity Measures OEHHA RCHAB
Table 15. Comparison of cancer risk estimates1 for lifetime exposure to 0.0001 mg/kg-d of a carcinogen with potency 1 (mg/kg-d)-1 based on different parameters of ASF distributions, or U.S. EPA values.
No adjustment 50th percentile 70th percentile Mean 95th percentile U.S. EPA (2005) Lifestage Years of
life exposed
ASF Risk ASF Risk ASF Risk ASF Risk ASF Risk Factor Risk
In utero 0.75 0 0.0 3 3.2 x 10⁻⁶ 10 1.1 x 10⁻⁵ 21 2.2 x 10⁻⁵ 115 1.2 x 10⁻⁴ 0 0.0 Birth to <2 yr 2 1 2.9 x 10⁻⁶ 13 3.7 x 10⁻⁵ 28 7.9 x 10⁻⁵ 79 2.3 x 10⁻⁴ 350 1.0 x 10⁻³ 10 2.9 x 10⁻⁵
2 to <16 yr 14 1 2 x 10⁻⁵ 5 1.0 x 10⁻⁴ 7 1.4 x 10⁻⁴ 7 1.4 x 10⁻⁴ 20 4.0 x 10⁻⁴ 3 6.0 x 10⁻⁵ 16 to 70 yr 55 1 7.9 x 10⁻⁵ 1 7.9 x 10⁻⁵ 1 7.9 x 10⁻⁵ 1 7.9 x 10⁻⁵ 1 7.9 x 10⁻⁵ 1 7.9 x 10⁻⁵
Total lifetime risk
1.0 x 10⁻⁴
2.2 x 10⁻⁴ 3.1 x 10⁻⁴
4.7 x 10⁻⁴ 1.6 x 10⁻³ 1.7 x 10⁻⁴
1 Risk accrued in age window = potency x ASF x exposure rate x (years exposed/70 years).
Deleted: 2
Deleted: Age window
Deleted: 2 ASF derived using equal weighting of studies within a chemical (i.e., Method 1 in main text).
Deleted: October

SRP Draft
In Utero and Early Life Cancer 72 December 2008 Susceptibility: Age Sensitivity Measures OEHHA RCHAB
References
Althoff J, Grandjean C (1979). In vivo studies in Syrian golden hamsters: a transplacental bioassay of ten nitrosamines. Natl Cancer Inst Monogr (51):251-5.
Althoff J, Grandjean C, Gold B (1977). Diallylnitrosamine: a potent respiratory carcinogen in Syrian golden hamsters: brief communication. J Natl Cancer Inst 59(5 ):1569-71.
Anderson EL and the U.S. Environmental Protection Agency Carcinogen Assessment Group (1983). Quantitative approaches in use to assess cancer risk. Risk Analysis 3:277-295.
Anderson LM, Budinger JM, Maronpot RR, Good RA (1978). Transplacental lung tumorigenesis in the athymic mouse. Cancer Res 38 (1):137-41.
Anderson LM, Diwan BA, Fear NT, Roman E (2000). Critical windows of exposure for children's health: cancer in human epidemiological studies and neoplasms in experimental animal models. Environ Health Perspect 108 Suppl 3:573-94.
Anderson LM, Hagiwara A, Kovatch RM, Rehm S, Rice JM (1989). Transplacental initiation of liver, lung, neurogenic, and connective tissue tumors by N-nitroso compounds in mice. Fundam Appl Toxicol 12(3):604-20.
Armitage P, Doll R (1954). The age distribution of cancer and a multistage theory of carcinogenesis. Br J Cancer 8:1-12. Bailer AJ, Portier CJ (1988). Effects of treatment-induced mortality and tumor-induced mortality on tests for carcinogenicity in small samples. Biometrics 44: 417-431.
Barton HA, Cogliano VJ, Flowers L, Valcovic L, Setzer RW, Woodruff TJ (2005). Assessing susceptibility from early-life exposure to carcinogens. Environ Health Perspect 113:1125-1133.
Baylin SB (2005). DNA methylation and gene silencing in cancer. Nat Clin Pract Oncolo 2 Suppl 1:S4-11.
Bhatia S, Robison LL, Oberlin O, Greenberg M, Bunin G, Fossati-Bellani F et al. (1996). Breast cancer and other second neoplasm after childhood Hodgikin's disease. N Eng J Med 334(12):745-51.
Birnbaum LS, Fenton SE (2003). Cancer and developmental exposure to endocrine disruptors. Environ Health Perspect 111(4):389-94.
Boberg EW, Miller EC, Miller JA, Poland A, Liem A (1983). Strong evidence from studies with brachymorphic mice and pentachlorophenol that 1'-sulfooxysafrole is the major ultimate electrophilic and carcinogenic metabolite of 1'-hydroxysafrole in mouse liver. Cancer Res 43(11):5163-73.
Bosch DA (1977). Short and long term effects of methyl- and ethylnitrosourea (MNU & ENU) on the developing nervous system of the rat. I. Long term effects: the induction of (multiple) gliomas. Acta Neurol Scand 55(2):85-105.
Deleted: October
SRP Draft
In Utero and Early Life Cancer 73 December 2008 Susceptibility: Age Sensitivity Measures OEHHA RCHAB
Brittebo EB, Lindgren A, Tjalve H (1981). Fetal distribution and metabolism of N-nitrosodiethylamine in mice. ACTA Pharmacol Toxicol; 48 (4). 355-363.
Calabrese EJ, Blain RB (1999). The single exposure carcinogen database: assessing the circumstances under which a single exposures carcinogen can cause cancer. Tocicol Sci 50(2):169-85.
Cal/EPA, California Environmental Protection Agency (2004). The California Environmental Protection Agency’s Children’s Environmental Health Program Biennial Report for 2002-2003. A report to the Governor and Legislature on Implementation of the Children’s Environmental Health Initiative, including The Requirements of Chapter 731, Statutes of 1999, and The Requirements of Chapter 144, Statues of 2000. Children’s Environmental Health Center, Office of the Secretary, Cal/EPA, Sacramento California, January 1, 2004.
Cameron TP, Hickman RL, Kornreich MR, Tarone RE (1985). History, survival, and growth patterns of B6C3F1 mice and F344 rats in the National Cancer Institute Carcinogenesis Testing Program. Fundam Appl Toxicol 5(3):526-38.
CancerChem (2000). Version 3.0. Electronic database of U.S. Public Health Service Publication No. 149, Survey of Compounds Which Have Been Tested for Carcinogenic Activity, covers literature from 1900 to 1998. GMA Industries, Inc.
Charles River Laboratories (1999). Technical Bulletin: Originally published as Technical Bulletion No. 1. located at http://rats.info/flex_content_area/documents/rm_rm_n_techbul_spring_99.pdf.
Chernozemski IN, Warnick GP (1970). Liver regeneration and induction of hepatomas in B6AF mice by urethane. Cancer Res 30(11):2685-90.
Chhabra RS, Bucher JR, Haseman JK, Elwell MR, Kurtz PJ, Carlton BD (1993a). Comparative carcinogenicity of 5,5-diphenylhydantoin with or without perinatal exposure in rats and mice. Fundam Appl Toxicol 21(2):174-86.
Chhabra RS, Bucher JR, Haseman JK, Elwell MR, Kurtz PJ, Carlton BD (1993b). Comparative carcinogenicity of polybrominated biphenyls with or without perinatal exposure in rats and mice. Fundam Appl Toxicol 21(4):451-60.
Choudari Kommineni VR, Greenblatt M, Vesselinovitch SD, Mihailovich N (1970). Urethane carcinogenesis in rats: importance of age and dose. J Natl Cancer Inst 45(4):687-96.
Crouch EA (1983). Uncertainties in interspecies extrapolations of carcinogenicity. Environ Health Perspect 50: 321-327.
Crump KS, Hoel DG, Langley CH, Peto R (1976). Fundamental carcinogenic processes and their implications for low dose risk assessment. Cancer Res 36(9 pt.1):2973-9.
Crump KS, Howe RB (1984). The mutistage model with a time-dependent dose pattern: Applications to carcinogenic risk assessment. Risk Analysis 4:163-176.
Della Porta G, Dragani TA, Sozzi G (1987). Carcinogenic effects of infantile and long-term 2,3,7,8-tetrachlorodibenzo-p-dioxin treatment in the mouse. Tumori 73(2): 99-107. Deleted: October

SRP Draft
In Utero and Early Life Cancer 74 December 2008 Susceptibility: Age Sensitivity Measures OEHHA RCHAB
Diwan BA, Meier H, Huebner RJ (1974). Transplacental effects of 1-ethyl-1-nitrosourea in inbred strains of mice. IV. Rapid tumor induction in strain crosses. J Natl Cancer Institute 52: 893-895.
Drinkwater NR, Ginsler JJ (1986). Genetic control of hepatocarcinogenesis in C57BL/6J and C3H/HeJ inbred mice. Carcinogenesis 7(10):1701-7.
Druckrey H, Landschutz C ( 1971). Transplacental and neonatal carcinogenesis by ethylnitrosobiuret (ENBU) in BD IX-rats. Z Krebsforsch Klin Onkol Cancer Res Clin Oncol 76(1):45-58.
Finkel AM (1995). A quantitative estimate of the variations in human susceptibility to cancer and its implications for risk management. in: Olin S.S.; Farland W.; Park C.; Rhomberg L.; Scheuplein R.; Starr T. (Eds) Low-Dose Extrapolation of Cancer Risks: Issues and Perspectives, pp. 297-328, ILSI Press, Washington D.C.
Finkel AM (2002). The joy before cooking: Preparing ourselves to write a risk research recipe. Hum Ecol Risk Assess 8(6):1203-1221.
Fox JG, Cohen BJ, Loew R (1995). Laboratory Animal Medicine. Orlando, FL: Academic Press, Inc.
Ginsberg GL (2003). Assessing cancer risks from short-term exposures in children. Risk Anal 23(1):19-34.
Grubbs CJ, Peckham JC, McDonough KD (1983). Effect of ovarian hormones on the induction of 1-methyl-1-nitrosourea- induced mammary cancer. Carcinogenesis 4(4):495-7.
Harder JD, Stonebrook MJ, Pondy J (1993). Gestation and placentation in two New World Opossums: Didelphis virginiana and Mondodelphis domestica. J Exp Zool 266(5):463-79.
Harkness JE, Wagner JE (1995). The Biology and Medicine of Rabbits and Rodents. Philadelphia, PA: Lea and Febiger.
Hattis D, Goble R, Chu M ( 2005). Age-related differences in susceptibility to carcinogenesis. II. Approaches for application and uncertainty analyses for individual genetically acting carcinogens. Environ Health Perspect 113(4): 509-16.
Hattis D, Goble R, Russ A, Chu M, Ericson J (2004). Age-related differences in susceptibility to carcinogenesis: a quantitative analysis of empirical animal bioassay data. Environ Health Perspect 112(11):1152-8.
Herbst AL, Ulfelder H, Poskanzer DC (1971). Adenocarcinoma of the vagina. Association of maternal stilbestrol therapy with tumor appearance in young women. N Engl J Med 284(15):878-81.
Kauffman SL (1976). Susceptibility of fetal lung to transplacental 1-ethyl-1-nitrosourea: its relation to epithelial proliferation. J Natl Cancer Inst 57(4):821-5.
Klein M (1959). Influence of low dose of 2-acetylaminofluorene on liver tumorigenesis in mice. Proc Soc Exp Biol Med 101:637-8. Deleted: October

SRP Draft
In Utero and Early Life Cancer 75 December 2008 Susceptibility: Age Sensitivity Measures OEHHA RCHAB
Lai CC, Miller JA, Miller EC, Liem A (1985). N-sulfooxy-2-aminofluorene is the major ultimate electrophilic and carcinogenic metabolite of N-hydroxy-2-acetylaminofluorene in the livers of infant male C57BL/6J x C3H/HeJ F1 (B6C3F1) mice. Carcinogenesis 6(7):1037-45.
Maltoni C, Lefemine G, Ciliberti A, Cotti G, Carretti D (1981). Carcinogenicity bioassays of vinyl chloride monomer: a model of risk assessment on an experimental basis. Environ Health Perspect 41:3-29.
Martin MS, Martin F, Justrabo E, Knopf JF, Bastien H, Knobel S (1974). [Induction of colonic cancers in rats through a single injection of 1,2 dimethylhydrazine]. Biol Gastroenterol (Paris) 7(1):37-42.
McConnell EE (1992). Comparative responses in carcinogenesis bioassays as a function of age at first exposure. in: Guzelian, P.S.; Henry, C.J.; Olin, S.S. (Eds) Similarities and Differences Between Children and Adults: Implications for Risk Assessment. ILSI Press, Washington, D.C.
Meranze DR, Gruenstein M, Shimkin MB (1969). Effect of age and sex on the development of neoplasms in Wistar rats receiving a single intragastric instillation of 7,13-Dimethylbenz(a)anthracene. Int J Cancer 4(4):480-6.
Merck (1998). The Merck Veterinary Manual 8th Edition. Merck & Co., Inc., Whitehouse Station.
Miller MD, Marty MA, Arcus A, Brown J, Morry D, Sandy M (2002). Differences between children and adults: implications for risk assessment at California EPA. Int J Toxicol 21:403-418.
Mohr U, Althoff J (1965). [The transplacental action of the carcinogen diethylnitrosamine in the mouse]. Z Krebsforsch 67(2):152-5.
Mohr U, Emura M, Kamino K, Steinmann J, Kohler M, Morawietz G et al. (1995). Increased risk of cancer in the descendants of Syrian hamsters exposed prenatally to diethylnitrosamine (DEN). Int J Cancer 63(1):86-91.
Mohr U, Reznik-Schuller H, Reznik G, Hilfrich J (1975). Transplacental effects of diethylnitrosamine in Syrian hamsters as related to different days of administration during pregnancy. J Natl Cancer Inst 55 (3):681-3.
Moysich KB, Menezes RJ, Michalek AM (2002). Chernobyl-related ionising radiation exposure and cancer risk: an epidemiological review. Lancet Oncol 3(5):269-79.
Murdoch DJ, Krewski D, Wargo J. (1992). Cancer risk assessment with intermittent exposure. Risk Anal 12(4): 569-577.
Naito M, Aoyama H, Fujioka Y, Ito A (1985). Induction of gliomas in Mongolian gerbils (Meriones unguiculatus) following neonatal administration of N-ethyl-N-nitrosourea. J Natl Cancer Inst 75(3):581-7.
Naito M, Naito Y, Ito A (1981). Effect of age at treatment on the incidence and location of neurogenic tumors induced in Wistar rats by a single dose of N-ethyl-N-nitrosourea. Gann 72(4):569-77. Deleted: October

SRP Draft
In Utero and Early Life Cancer 76 December 2008 Susceptibility: Age Sensitivity Measures OEHHA RCHAB
Naito M, Naito Y, Ito A (1982). Effect of phenobarbital on the development of tumors in mice treated neonatally with N-ethyl-N-nitrosourea. Gann 73(1):111-4.
Napalkov NP, Rice JM, Tomatis L, Yamasaki H (1989). Perinatal and multigenerational carcinogenesis. IARC Sci Publ. vol 96, International Agency for Research on Cancer, Lyon France.
Noronha RF, Goodall CM (1984). The effects of estrogen on single dose dimethylnitrosamine carcinogenesis in male inbred Crl/CDF rats. Carcinogenesis 5(8):1003-7.
NRC, National Research Council (1990). Health effects of exposure to low levels of ionizing radiation. BEIR V, Committee on the Biological Effects of Ionizing Radiation. Washington, D.C.: National Academy Press.
NRC, National Research Council (1993). Pesticides in the diets of infants and children. Washington, D.C.: National Academy Press.
NRC, National Research Council (1994). Science and Judgment in Risk Assessment. Committee on Risk Assessment of Hazardous Air Pollutants, Commission on Life Sciences. Washington, D.C.: National Academy Press.
Penn I (2000). Post-transplant malignancy: the role of immunosuppression. Drug 23. 23(2. 2):101-13, 101-13.
Pereira MA, Knutsen GL, Herren-Freund SL (1985). Effect of subsequent treatment of chloroform or phenobarbital on the incidence of liver and lung tumors initiated by ethylnitrosourea in 15 day old mice. Carcinogenesis 6(2):203-7.
Peto R (1978). Carcinogenic effects of chronic exposure to very low levels of toxic substances. Environ Health Perspect 22:155-9.
Poiley SM (1972). Growth tables for 66 strains and stocks of laboratory animals. Lab Anim Sci 22(5):758-79.
Preston-Martin S (1989). Epidemiological studies of perinatal carcinogenesis. IARC Sci Publ. 96:289-314, International Agency for Research on Cancer, Lyon France.
Rao KV, Vesselinovitch SD (1973). Age- and sex-associated diethylnitrosamine dealkylation activity of the mouse liver and hepatocarcinogenesis. Cancer Res 33(7):1625-7.
Rice, JM (1979). Problems and perspectives in perinatal carcinogenesis: a summary of the conference. Natl Cancer Inst Monogr 51:271-278.
Rice JM, Rehm S, Donovan PJ, Perantoni AO (1989). Comparative transplacental carcinogenesis by directly acting and metabolism-dependent alkylating agents in rodents and nonhuman primates. IARC Sci Publ (96):17-34.
Schmahl W (1988). Synergistic induction of tumors in NMRI mice by combined fetal X- irradiation with low doses and ethylnitrosourea administered to juvenile offspring. Carcinogenesis 9(8):1493-8.
Deleted: October

SRP Draft
In Utero and Early Life Cancer 77 December 2008 Susceptibility: Age Sensitivity Measures OEHHA RCHAB
Searle CE, Jones EL (1976). The multipotential carcinogenic action of N-ethyl-N-nitrosourea administered neonatally to mice. Br J Cancer 33(6):612-25.
Slikker W, III, Mei N, Chen T. (2004). N-ethyl-N-nitrosourea (ENU) increased brain mutation in prenatal and neonatal mice but not in adults. Tox. Sci 81., 112-120
Terracini B, Testa MC (1970). Carcinogenicity of a single administration of N-nitrosomethylurea: a comparison between newborn and 5-week-old mice and rats. Br J Cancer 24(3):588-98.
Terracini B, Testa MC, Cabral JR, Rossi L (1976). The roles of age at treatment and dose in carcinogenesis in C3Hf/Dp mice with a single administration of N-nitroso-N-methylurea. Br J Cancer 33(4):427-39.
Tomatis L, Turusov V, Guibbert D, Duperray B, Malaveille C, Pacheco H (1971). Transplacental carcinogenic effect of 3-methylcholanthrene in mice and its quantitation in fetal tissues. J Natl Cancer Inst 47(3):645-51.
Tomatis L, Ponomarkov V, Turusov V (1977). Effects of ethylnitrosoura administration during pregnancy on three subsequent generation of BDVI rats. Int J Cancer 19:240-8.
Toth B (1968). A critical review of experiments in chemical carcinogenesis using newborn animals. Cancer Res 28:727-738.
Truhaut R, Lesca P, Dechambre RP, Gerard-Marchant R (1966). [On the means of manifestation of the cancerogenic power of 3,4-benzopyrene in newborn or treated immediately after weaning mice]. Pathol Biol 14(19):955-9.
Turusov V, Tomatis L, Guibberi D, Duperray B, Pacheco H. (1973). The effect of prenatal exposure of mice to methyl cholanthrene combined with the neonatal administration of diethylnitrosamine. In: Tomatis, L. And U. Mohr (ED.). International Agency for Research on Cancer Scientific Publication, No 4. Transplacental Carcinogenesis. Proceeding of a Meeting, Hannover, West Germany, Oct 6-7, 1971. XII pp. 84-91. International Agency for Research on Cancer: Lyon, France .
Turusov VS, Trukhanova LS, Parfenov YuD, Tomatis L (1992). Occurrence of tumours in the descendants of CBA male mice prenatally treated with diethylstilbestrol. Int J Cancer 50(1):131-5.
U.S. Environmental Protection Agency (U.S. EPA) (2005). Supplemental Guidance for Assessing Cancer Susceptibility from Early-Life Exposure to Carcinogens. EPA/630/R-03/003F, March 2005.
Vesselinovitch SD (1980). Infant mouse as a sensitive bioassay system for carcinogenicity of N- nitroso compounds. IARC Sci Publ (31):645-55.
Vesselinovitch SD (1983). Perinatal hepatocarcinogenesis. Biol Res Pregnancy Perinatol 4(1):22-5.
Vesselinovitch SD, Itze L, Mihailovich N, Rao KV, Manojlovski B (1973). Role of hormonal environment, partial hepatectomy, and dose of ethylnitrosourea in renal carcinogenesis. Cancer Deleted: October

SRP Draft
In Utero and Early Life Cancer 78 December 2008 Susceptibility: Age Sensitivity Measures OEHHA RCHAB
Res 33(2):339-41.
Vesselinovitch SD, Koka M, Mihailovich N, Rao KV (1984). Carcinogenicity of diethylnitrosamine in newborn, infant, and adult mice. J Cancer Res Clin Oncol 108(1):60-5.
Vesselinovitch SD, Koka M, Rao KV, Mihailovich N, Rice JM (1977). Prenatal multicarcinogenesis by ethylnitrosourea in mice. Cancer Res 37(6):1822-8.
Vesselinovitch SD, Kyriazis AP, Mihailovich N, Rao KV (1975a). Conditions modifying development of tumors in mice at various sites by benzo(a)pyrene. Cancer Res 35(11 Pt 1):2948-53.
Vesselinovitch SD, Rao KV, Mihailovich N (1975b). Factors modulating benzidine carcinogenicity bioassay. Cancer Res 35(10):2814-9.
Vesselinovitch SD, Rao KV, Mihailovich N (1979a). Neoplastic response of mouse tissues during perinatal age periods and its significance in chemical carcinogenesis. Natl Cancer Inst Monogr (51):239-50.
Vesselinovitch SD, Rao KV, Mihailovich N (1979b). Transplacental and lactational carcinogenesis by safrole. Cancer Res 39(11):4378-80
Vesselinovitch SD, Rao KV, Mihailovich N, Rice JM, Lombard LS (1974). Development of broad spectrum of tumors by ethylnitrosourea in mice and the modifying role of age, sex, and strain. Cancer Res 34(10):2530-8.
Walters MA (1966). The induction of lung tumours by the injection of 9,10-dimethyl-1,2- benzanthracene (DMBA) into newborn suckling and young adult mice. A dose response study. Br J Cancer 20(1):148-60.
Wiggenhauser A, Schmahl W (1987). Postnatal development and neoplastic disease pattern in NMRI mice after combined treatment with ethylnitrosourea and X-irradiation on different days of the fetal period. Int J Radiat Biol Relat Stud Phys Chem Med 51(6):1021-9.
Wood M, Flaks A, Clayson DB (1970). The carcinogenic activity of dibutylnitrosamine in IF x C57 mice. Eur J Cancer 6(5):433-40.
Zeller WJ, Ivankovic S, Zeller J (1978). Induction of malignant tumors in Wistar and Sprague-Dawley rats by single doses of n-butyl-nitrosourea in perinatal and juvenile phases of development. Arch Geschwulstforsch 48(1):9-16.
Deleted: October

SRP Draft
In Utero and Early Life Cancer A-1 December 2008 Susceptibility: Age Sensitivity Measures OEHHA RCHAB
Appendices
A. Default Body Weights for Rats and Mice During the
First Six Months of Life
B. Lifestage Potency (LP) Ratios for Multi-Lifestage Exposure Studies
Prenatal LP Ratios Postnatal LP Ratios Juvenile LP Ratios
C. Sensitivity Analyses: LP and ASF Mixture Frequency
Distributions for Multi-Lifestage Exposure Studies
Prenatal LP Ratio and ASF Mixture Distributions Postnatal LP Ratio and ASF Mixture Distributions Juvenile LP Ratio and ASF Mixture Distributions D. DEN Case Study: Cancer Potency Distributions
for DEN Single Lifestage Exposure Experiments
and Sensitivity Analyses
E. ENU Case Study: Cancer Potency Distributions
for ENU Single Lifestage Exposure Experiments
and Sensitivity Analyses
F. Early Life Across-Lifestage Exposure Studies of Two Non-
Genotoxic Carcinogens
Formatted: Portuguese (Brazil)
Formatted: Portuguese (Brazil)
Formatted: English (U.S.)
Deleted: Unadjusted ASFs
Deleted: Window
Deleted: Exposure
Deleted: Window
Deleted: Exposure Window
Deleted: Exposure
Deleted: Window
Deleted: om
Deleted: Methods 1-3 for 
Deleted: Window
Deleted: Exposure Window
Deleted: Exposure Window
Deleted: Window
Deleted: October

SRP Draft
In Utero and Early Life Cancer A-2 December 2008 Susceptibility: Age Sensitivity Measures OEHHA RCHAB
Appendix A Default Body Weights for Rats and Mice During the First Six Months of Life This appendix describes the approach taken to calculate body weights when needed for dose
calculations. For example, doses administered during the postnatal and juvenile lifestages may
have been reported as bolus amounts administered (e.g., milligrams) and the publication may not
have reported the weight of the animals on the day of compound administration. Because in
neonatal and juvenile rodents, body weight changes rapidly through development, default body
weights for the first six months of life (i.e., day 1-168) were estimated for each postnatal day for
mice and rats, for use in calculating dose in mg/kg-bd wt when body weight on the day of dosing
was not reported.
Growth Model Applied When standard growth models were applied to the data (e.g., models of Richards, Gompertz, and
Janoschek), most seemed to overpredict body weight at very young ages. Thus, OEHHA applied
a more flexible model, which was constrained to pass through the actual data point for the day 1
body weight. The modeling was performed using constrained linear regression using the
statistical package, STATA (Stata Corp, College Station, Texas). The model takes the form:
BodyWeightage = β0 + β1 (day-1) + β2 (day-1)2 + β3 (day-1)3 + β4 (day-1)4 (Eqn. A-1)
where β0 is defined as the measured average body weight on day 1 of life (i.e., redefining day 1
as 'day 0' or the origin). The variable day is the day of life, and parameters, β1, β2, β3, β4 are
estimated. Fitted values for each day of life through six months of age (i.e., day 168) are
provided in look up tables, which are appended.
Deleted: in
Deleted: windows
Deleted: October

SRP Draft
In Utero and Early Life Cancer A-3 December 2008 Susceptibility: Age Sensitivity Measures OEHHA RCHAB
Mice Default body weights were estimated using data from a survey of Poiley (1972) for several
strains of mice. Data from BALB/cANCr, AKR/LwCr and C57Bl/6Cr mice were selected for
use in deriving the default value, as these datasets comprised the largest numbers of animals
surveyed (i.e., early life groups represented averages of 256 to 547 mice for each species). Table
A7 gives the data used in the model fitting. Body weights for all three species were quite similar
during the first 70 days of life. The AKR/LwCr mice became heavier than the other two species
later in life, thus taken together data from these three strains likely provide a reasonable average.
Figure A1 displays the model fit for data from BALB/c, C57Bl/6Cr, AKR/LwCr, and DBA/2Cr
mouse strains. Two plots are shown. The first plot shows the data and model fit for male mice,
and the second plot does the same for female mice.
Figure A1. Model Fitted Data for Male and Female Mice
Day
Fitted values males_kg
1 252
.00125
.03739
Deleted: October
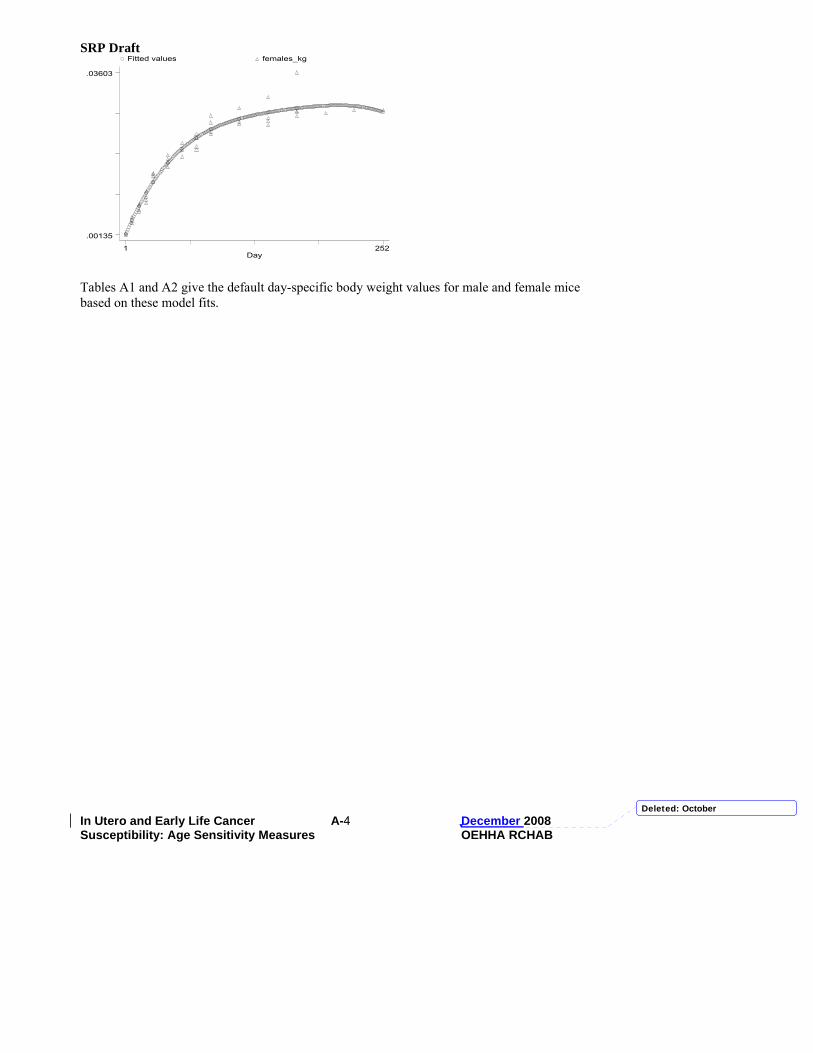
SRP Draft
In Utero and Early Life Cancer A-4 December 2008 Susceptibility: Age Sensitivity Measures OEHHA RCHAB
Day
Fitted values females_kg
1 252
.00135
.03603
Tables A1 and A2 give the default day-specific body weight values for male and female mice based on these model fits.
Deleted: October

SRP Draft
In Utero and Early Life Cancer A-5 December 2008 Susceptibility: Age Sensitivity Measures OEHHA RCHAB
Table A1. Male Mice: Default Body Weight for the First 168 Days of Life Day
of life Body weight
(kg) Day
of life Body weight
(kg) Day
of lifeBody weight
(kg) Day
of lifeBody weight
(kg) 1 0.00144 44 0.01894 87 0.02684 130 0.02950 2 0.00199 45 0.01921 88 0.02695 131 0.02953 3 0.00254 46 0.01948 89 0.02705 132 0.02955 4 0.00308 47 0.01974 90 0.02715 133 0.02958 5 0.00361 48 0.02000 91 0.02725 134 0.02960 6 0.00414 49 0.02026 92 0.02735 135 0.02962 7 0.00465 50 0.02050 93 0.02744 136 0.02964 8 0.00516 51 0.02075 94 0.02753 137 0.02966 9 0.00566 52 0.02099 95 0.02762 138 0.02968 10 0.00616 53 0.02122 96 0.02771 139 0.02970 11 0.00664 54 0.02145 97 0.02779 140 0.02972 12 0.00712 55 0.02168 98 0.02787 141 0.02974 13 0.00759 56 0.02190 99 0.02795 142 0.02975 14 0.00806 57 0.02212 100 0.02803 143 0.02977 15 0.00851 58 0.02233 101 0.02811 144 0.02978 16 0.00896 59 0.02254 102 0.02818 145 0.02980 17 0.00940 60 0.02274 103 0.02825 146 0.02981 18 0.00984 61 0.02294 104 0.02832 147 0.02982 19 0.01027 62 0.02313 105 0.02839 148 0.02983 20 0.01069 63 0.02333 106 0.02845 149 0.02984 21 0.01110 64 0.02351 107 0.02851 150 0.02985 22 0.01151 65 0.02370 108 0.02857 151 0.02986 23 0.01191 66 0.02388 109 0.02863 152 0.02987 24 0.01231 67 0.02405 110 0.02869 153 0.02988 25 0.01270 68 0.02422 111 0.02874 154 0.02989 26 0.01308 69 0.02439 112 0.02880 155 0.02990 27 0.01345 70 0.02456 113 0.02885 156 0.02990 28 0.01382 71 0.02472 114 0.02890 157 0.02991 29 0.01419 72 0.02487 115 0.02895 158 0.02992 30 0.01454 73 0.02503 116 0.02900 159 0.02992 31 0.01490 74 0.02518 117 0.02904 160 0.02993 32 0.01524 75 0.02532 118 0.02908 161 0.02993 33 0.01558 76 0.02547 119 0.02913 162 0.02994 34 0.01591 77 0.02561 120 0.02917 163 0.02994 35 0.01624 78 0.02575 121 0.02921 164 0.02994 36 0.01656 79 0.02588 122 0.02924 165 0.02995 37 0.01688 80 0.02601 123 0.02928 166 0.02995 38 0.01719 81 0.02614 124 0.02932 167 0.02995 39 0.01749 82 0.02626 125 0.02935 168 0.02996 40 0.01779 83 0.02638 126 0.02938 41 0.01809 84 0.02650 127 0.02941 42 0.01838 85 0.02662 128 0.02944 43 0.01866 86 0.02673 129 0.02947
Deleted: October

SRP Draft
In Utero and Early Life Cancer A-6 December 2008 Susceptibility: Age Sensitivity Measures OEHHA RCHAB
Table A2. Female Mice: Default Body Weight for the First 168 Days of Life Day
of life Body weight
(kg) Day
of life Body weight
(kg) Day
of lifeBody weight
(kg) Day
of lifeBody weight
(kg) 1 0.00147 44 0.01719 87 0.02418 130 0.02710 2 0.00198 45 0.01742 88 0.02428 131 0.02715 3 0.00248 46 0.01766 89 0.02438 132 0.02719 4 0.00298 47 0.01789 90 0.02447 133 0.02723 5 0.00346 48 0.01812 91 0.02457 134 0.02727 6 0.00394 49 0.01834 92 0.02466 135 0.02732 7 0.00441 50 0.01856 93 0.02475 136 0.02736 8 0.00488 51 0.01877 94 0.02484 137 0.02740 9 0.00533 52 0.01898 95 0.02493 138 0.02744 10 0.00578 53 0.01918 96 0.02501 139 0.02748 11 0.00622 54 0.01939 97 0.02509 140 0.02752 12 0.00665 55 0.01958 98 0.02518 141 0.02755 13 0.00708 56 0.01978 99 0.02526 142 0.02759 14 0.00750 57 0.01997 100 0.02533 143 0.02763 15 0.00791 58 0.02015 101 0.02541 144 0.02766 16 0.00832 59 0.02033 102 0.02549 145 0.02770 17 0.00872 60 0.02051 103 0.02556 146 0.02774 18 0.00911 61 0.02069 104 0.02563 147 0.02777 19 0.00949 62 0.02086 105 0.02570 148 0.02781 20 0.00987 63 0.02103 106 0.02577 149 0.02784 21 0.01024 64 0.02119 107 0.02584 150 0.02787 22 0.01061 65 0.02135 108 0.02591 151 0.02791 23 0.01097 66 0.02151 109 0.02597 152 0.02794 24 0.01132 67 0.02167 110 0.02604 153 0.02797 25 0.01167 68 0.02182 111 0.02610 154 0.02800 26 0.01201 69 0.02197 112 0.02616 155 0.02804 27 0.01234 70 0.02211 113 0.02622 156 0.02807 28 0.01267 71 0.02226 114 0.02628 157 0.02810 29 0.01299 72 0.02240 115 0.02634 158 0.02813 30 0.01331 73 0.02253 116 0.02640 159 0.02816 31 0.01362 74 0.02267 117 0.02645 160 0.02819 32 0.01393 75 0.02280 118 0.02651 161 0.02822 33 0.01423 76 0.02293 119 0.02656 162 0.02825 34 0.01452 77 0.02305 120 0.02662 163 0.02827 35 0.01481 78 0.02318 121 0.02667 164 0.02830 36 0.01509 79 0.02330 122 0.02672 165 0.02833 37 0.01537 80 0.02342 123 0.02677 166 0.02836 38 0.01565 81 0.02353 124 0.02682 167 0.02838 39 0.01592 82 0.02365 125 0.02687 168 0.02841 40 0.01618 83 0.02376 126 0.02692 41 0.01644 84 0.02387 127 0.02696 42 0.01669 85 0.02397 128 0.02701 43 0.01694 86 0.02408 129 0.02706
Deleted: October

SRP Draft
In Utero and Early Life Cancer A-7 December 2008 Susceptibility: Age Sensitivity Measures OEHHA RCHAB
Rats Default body weights applicable to all rat strains except Sprague-Dawley rats were estimated
using data from surveys by Poiley (1972) and Cameron et al. (1985) for Fischer 344 (F344) rats
(See Table A8). The body weights of F344 rats are reasonably representative of most other rat
strains (U.S. EPA, 1988). Data from Sprague-Dawley rats, which become much heavier than
most other rat strains, were used to estimate default body weights for this strain using normative
data surveyed by Poiley (1972) (See Table A9). Figure A2 displays the model fit for data from
the F344 rat strain. The first plot shows the fit for males, the second for females. Figure A3
displays the model fit for data from the Sprague-Dawley rat strain. The first plot shows the fit
for males, the second for females.
Figure A2. Model Fitted Data for Male and Female F344 Rats
Day
Fitted values males_kg
1 217
.00592
.357067
Day
fem_kg Fitted values
1 217
.00554
.23326
Deleted: October

SRP Draft
In Utero and Early Life Cancer A-8 December 2008 Susceptibility: Age Sensitivity Measures OEHHA RCHAB
Figure A3. Model Fitted Data for Male and Female Sprague-Dawley Rats
Tables A3 and A4 give the default day-specific body weight values for male and female rats
(with the exception of Sprague-Dawley rats) based on these model fits. The default day-specific
body weight values for male and female Sprague-Dawley rats were based on model fits derived
from data specific to Sprague-Dawley rats. These values are shown in Tables A5 and A6.
Deleted: October
day
m_kg Fitted values
1 316
.0067
.58305
day
f_kg Fitted values
1 316
.0063
.35199

SRP Draft
In Utero and Early Life Cancer A-9 December 2008 Susceptibility: Age Sensitivity Measures OEHHA RCHAB
Table A3. Male Rats: Default Body Weight for the First 168 Days of Life (based on F344 Rats; default does not apply to Sprague-Dawley rats) Day
of life Body weight
(kg) Day
of life Body weight
(kg) Day
of lifeBody weight
(kg) Day
of lifeBody weight
(kg) 1 0.00592 44 0.10643 87 0.22932 130 0.30443 2 0.00712 45 0.10943 88 0.23176 131 0.30544 3 0.00839 46 0.11244 89 0.23416 132 0.30641 4 0.00975 47 0.11545 90 0.23654 133 0.30736 5 0.01118 48 0.11847 91 0.23888 134 0.30828 6 0.01268 49 0.12150 92 0.24120 135 0.30916 7 0.01426 50 0.12452 93 0.24348 136 0.31002 8 0.01591 51 0.12755 94 0.24573 137 0.31085 9 0.01762 52 0.13058 95 0.24795 138 0.31165 10 0.01940 53 0.13361 96 0.25014 139 0.31242 11 0.02125 54 0.13664 97 0.25230 140 0.31316 12 0.02315 55 0.13966 98 0.25442 141 0.31387 13 0.02512 56 0.14268 99 0.25651 142 0.31456 14 0.02714 57 0.14570 100 0.25857 143 0.31523 15 0.02923 58 0.14871 101 0.26059 144 0.31586 16 0.03136 59 0.15171 102 0.26258 145 0.31648 17 0.03355 60 0.15471 103 0.26454 146 0.31706 18 0.03579 61 0.15769 104 0.26646 147 0.31763 19 0.03808 62 0.16067 105 0.26835 148 0.31817 20 0.04042 63 0.16363 106 0.27021 149 0.31869 21 0.04280 64 0.16658 107 0.27203 150 0.31919 22 0.04523 65 0.16952 108 0.27382 151 0.31966 23 0.04769 66 0.17245 109 0.27557 152 0.32012 24 0.05020 67 0.17536 110 0.27728 153 0.32056 25 0.05275 68 0.17826 111 0.27897 154 0.32098 26 0.05533 69 0.18114 112 0.28061 155 0.32138 27 0.05796 70 0.18400 113 0.28223 156 0.32176 28 0.06061 71 0.18684 114 0.28381 157 0.32213 29 0.06330 72 0.18967 115 0.28535 158 0.32248 30 0.06601 73 0.19247 116 0.28686 159 0.32282 31 0.06876 74 0.19526 117 0.28833 160 0.32314 32 0.07153 75 0.19802 118 0.28977 161 0.32345 33 0.07433 76 0.20077 119 0.29118 162 0.32375 34 0.07716 77 0.20349 120 0.29255 163 0.32404 35 0.08000 78 0.20619 121 0.29389 164 0.32432 36 0.08287 79 0.20886 122 0.29519 165 0.32458 37 0.08576 80 0.21151 123 0.29646 166 0.32485 38 0.08867 81 0.21413 124 0.29770 167 0.32510 39 0.09159 82 0.21673 125 0.29890 168 0.32535 40 0.09454 83 0.21930 126 0.30007 41 0.09749 84 0.22185 127 0.30121 42 0.10046 85 0.22437 128 0.30231 43 0.10344 86 0.22686 129 0.30339
Deleted: October

SRP Draft
In Utero and Early Life Cancer A-10 December 2008 Susceptibility: Age Sensitivity Measures OEHHA RCHAB
Table A4. Female Rats: Default Body Weight for the First 168 Days of Life (based on F344 Rats; default does not apply to Sprague-Dawley rats) Day
of life Body weight
(kg) Day
of life Body weight
(kg) Day
of lifeBody weight
(kg) Day
of lifeBody weight
(kg) 1 0.00554 44 0.09273 87 0.16280 130 0.20171 2 0.00756 45 0.09465 88 0.16408 131 0.20224 3 0.00959 46 0.09655 89 0.16534 132 0.20276 4 0.01162 47 0.09844 90 0.16658 133 0.20325 5 0.01365 48 0.10032 91 0.16780 134 0.20374 6 0.01570 49 0.10219 92 0.16901 135 0.20420 7 0.01774 50 0.10405 93 0.17020 136 0.20466 8 0.01980 51 0.10589 94 0.17137 137 0.20509 9 0.02185 52 0.10772 95 0.17253 138 0.20552 10 0.02391 53 0.10955 96 0.17366 139 0.20593 11 0.02597 54 0.11136 97 0.17478 140 0.20632 12 0.02803 55 0.11315 98 0.17588 141 0.20670 13 0.03010 56 0.11494 99 0.17696 142 0.20707 14 0.03216 57 0.11671 100 0.17802 143 0.20743 15 0.03423 58 0.11846 101 0.17907 144 0.20777 16 0.03630 59 0.12021 102 0.18010 145 0.20810 17 0.03836 60 0.12194 103 0.18111 146 0.20841 18 0.04043 61 0.12365 104 0.18210 147 0.20871 19 0.04250 62 0.12535 105 0.18307 148 0.20900 20 0.04456 63 0.12704 106 0.18403 149 0.20928 21 0.04662 64 0.12871 107 0.18496 150 0.20955 22 0.04869 65 0.13037 108 0.18588 151 0.20980 23 0.05074 66 0.13202 109 0.18679 152 0.21005 24 0.05280 67 0.13364 110 0.18767 153 0.21028 25 0.05485 68 0.13526 111 0.18853 154 0.21050 26 0.05690 69 0.13685 112 0.18938 155 0.21071 27 0.05894 70 0.13843 113 0.19021 156 0.21091 28 0.06098 71 0.14000 114 0.19103 157 0.21111 29 0.06302 72 0.14155 115 0.19182 158 0.21129 30 0.06505 73 0.14308 116 0.19260 159 0.21146 31 0.06707 74 0.14460 117 0.19336 160 0.21162 32 0.06909 75 0.14610 118 0.19410 161 0.21178 33 0.07111 76 0.14759 119 0.19483 162 0.21192 34 0.07311 77 0.14905 120 0.19554 163 0.21206 35 0.07511 78 0.15051 121 0.19623 164 0.21219 36 0.07710 79 0.15194 122 0.19691 165 0.21232 37 0.07909 80 0.15336 123 0.19756 166 0.21243 38 0.08106 81 0.15476 124 0.19821 167 0.21254 39 0.08303 82 0.15614 125 0.19883 168 0.21264 40 0.08499 83 0.15751 126 0.19944 41 0.08694 84 0.15886 127 0.20003 42 0.08888 85 0.16019 128 0.20061 43 0.09081 86 0.16150 129 0.20117
Deleted: October

SRP Draft
In Utero and Early Life Cancer A-11 December 2008 Susceptibility: Age Sensitivity Measures OEHHA RCHAB
Table A5. Male Sprague-Dawley Rats: Default Body Weight for the First 168 Days of Life Day
of life Body weight
(kg) Day
of life Body weight
(kg) Day
of lifeBody weight
(kg) Day
of lifeBody weight
(kg) 1 0.00670 44 0.17648 87 0.35543 130 0.42990 2 0.00877 45 0.18129 88 0.35848 131 0.43110 3 0.01099 46 0.18611 89 0.36149 132 0.42985 4 0.01334 47 0.19091 90 0.36425 133 0.43218 5 0.01583 48 0.19570 91 0.36715 134 0.43204 6 0.01845 49 0.20048 92 0.37000 135 0.43144 7 0.02120 50 0.20525 93 0.37257 136 0.43240 8 0.02406 51 0.21000 94 0.37529 137 0.43290 9 0.02705 52 0.21473 95 0.37792 138 0.43292 10 0.03015 53 0.21944 96 0.38048 139 0.43448 11 0.03336 54 0.22413 97 0.38276 140 0.43355 12 0.03668 55 0.22880 98 0.38515 141 0.43415 13 0.04009 56 0.23343 99 0.38745 142 0.43426 14 0.04361 57 0.23804 100 0.38986 143 0.43590 15 0.04721 58 0.24271 101 0.39196 144 0.43502 16 0.05091 59 0.24713 102 0.39396 145 0.43565 17 0.05469 60 0.25164 103 0.39565 146 0.43578 18 0.05856 61 0.25623 104 0.39903 147 0.43540 19 0.06250 62 0.26049 105 0.40008 148 0.43651 20 0.06652 63 0.26503 106 0.40283 149 0.43711 21 0.07061 64 0.26944 107 0.40322 150 0.43718 22 0.07476 65 0.27370 108 0.40530 151 0.43672 23 0.07898 66 0.27803 109 0.40704 152 0.43774 24 0.08326 67 0.28221 110 0.40844 153 0.43823 25 0.08760 68 0.28644 111 0.40949 154 0.43817 26 0.09198 69 0.29051 112 0.41220 155 0.43756 27 0.09642 70 0.29462 113 0.41254 156 0.43842 28 0.10091 71 0.29856 114 0.41454 157 0.43872 29 0.10544 72 0.30254 115 0.41616 158 0.44047 30 0.11001 73 0.30655 116 0.41742 159 0.43964 31 0.11461 74 0.31037 117 0.41831 160 0.44026 32 0.11925 75 0.31422 118 0.41881 161 0.44030 33 0.12392 76 0.31787 119 0.42095 162 0.44178 34 0.12862 77 0.32173 120 0.42270 163 0.44268 35 0.13334 78 0.32540 121 0.42203 164 0.44298 36 0.13808 79 0.32887 122 0.42299 165 0.44270 37 0.14285 80 0.33253 123 0.42556 166 0.44383 38 0.14762 81 0.33598 124 0.42571 167 0.44435 39 0.15242 82 0.33922 125 0.42545 168 0.44629 40 0.15722 83 0.34263 126 0.42678 41 0.16203 84 0.34603 127 0.42770 42 0.16684 85 0.34920 128 0.42819 43 0.17166 86 0.35233 129 0.42825
Deleted: October

SRP Draft
In Utero and Early Life Cancer A-12 December 2008 Susceptibility: Age Sensitivity Measures OEHHA RCHAB
Table A6. Female Sprague-Dawley Rats: Default Body Weight for the First 168 Days of Life Day
of life Body weight
(kg) Day
of life Body weight
(kg) Day
of lifeBody weight
(kg) Day
of lifeBody weight
(kg) 1 0.00630 44 0.15144 87 0.25154 130 0.28142 2 0.00966 45 0.15449 88 0.25302 131 0.28167 3 0.01304 46 0.15752 89 0.25446 132 0.28101 4 0.01643 47 0.16051 90 0.25580 133 0.28167 5 0.01984 48 0.16348 91 0.25717 134 0.28140 6 0.02326 49 0.16642 92 0.25850 135 0.28097 7 0.02670 50 0.16933 93 0.25972 136 0.28109 8 0.03015 51 0.17221 94 0.26098 137 0.28104 9 0.03360 52 0.17505 95 0.26219 138 0.28081 10 0.03706 53 0.17787 96 0.26336 139 0.28114 11 0.04054 54 0.18065 97 0.26440 140 0.28054 12 0.04401 55 0.18339 98 0.26548 141 0.28050 13 0.04749 56 0.18611 99 0.26650 142 0.28028 14 0.05098 57 0.18879 100 0.26755 143 0.28061 15 0.05446 58 0.19146 101 0.26848 144 0.28001 16 0.05795 59 0.19403 102 0.26935 145 0.27996 17 0.06144 60 0.19660 103 0.27009 146 0.27972 18 0.06492 61 0.19918 104 0.27144 147 0.27928 19 0.06840 62 0.20162 105 0.27192 148 0.27940 20 0.07188 63 0.20414 106 0.27301 149 0.27931 21 0.07535 64 0.20658 107 0.27323 150 0.27903 22 0.07882 65 0.20896 108 0.27405 151 0.27855 23 0.08228 66 0.21133 109 0.27473 152 0.27861 24 0.08573 67 0.21362 110 0.27527 153 0.27847 25 0.08917 68 0.21592 111 0.27567 154 0.27813 26 0.09260 69 0.21813 112 0.27668 155 0.27758 27 0.09602 70 0.22034 113 0.27680 156 0.27757 28 0.09942 71 0.22247 114 0.27751 157 0.27735 29 0.10281 72 0.22458 115 0.27808 158 0.27766 30 0.10619 73 0.22669 116 0.27850 159 0.27702 31 0.10955 74 0.22871 117 0.27877 160 0.27690 32 0.11290 75 0.23072 118 0.27889 161 0.27658 33 0.11623 76 0.23264 119 0.27960 162 0.27678 34 0.11954 77 0.23462 120 0.28016 163 0.27676 35 0.12283 78 0.23650 121 0.27982 164 0.27653 36 0.12610 79 0.23829 122 0.28007 165 0.27608 37 0.12935 80 0.24014 123 0.28090 166 0.27614 38 0.13257 81 0.24189 124 0.28082 167 0.27599 39 0.13578 82 0.24354 125 0.28059 168 0.27635 40 0.13896 83 0.24524 126 0.28094 41 0.14212 84 0.24691 127 0.28112 42 0.14525 85 0.24849 128 0.28114 43 0.14836 86 0.25003 129 0.28099
Deleted: October

SRP Draft
In Utero and Early Life Cancer A-13 December 2008 Susceptibility: Age Sensitivity Measures OEHHA RCHAB
Table A7. Mouse Data Used in Fitting Eqn. 1 (Source: Poiley, 1972)
Bodyweight (kg) Bodyweight (kg) Strain Day Males Females
Strain Day Males Females
1 0.00125 0.00169 1 0.00148 0.00135 7 0.00511 0.00509 7 0.00406 0.00396
14 0.00817 0.00803 14 0.00823 0.00781 21 0.01127 0.01076 21 0.00969 0.00952 28 0.01545 0.01432 28 0.01554 0.01462 42 0.01948 0.0169 42 0.01908 0.01752 56 0.02082 0.01941 56 0.02188 0.01958 70 0.02197 0.02022 70 0.02481 0.02202 84 0.02516 0.02287 84 0.02672 0.02535
112 0.0276 0.02504 112 0.02682 0.02541 140 0.02816 0.02476 140 0.02788 0.02565 168 0.02857 0.02667
DBA/2Cr
168 0.02886 0.02754 196 0.02857 0.02735 224 0.02925 0.02798
Balb/C
252 0.03033 0.0281 1 0.00153 0.00143 7 0.00444 0.0043
14 0.00704 0.00674 21 0.00896 0.00874 28 0.01391 0.0127 42 0.02053 0.01841 56 0.02327 0.02105 70 0.02481 0.02296 84 0.03028 0.02686
112 0.03193 0.02848 140 0.03477 0.03087
AKR/LwCr
168 0.03739 0.03603 1 0.00149 0.0014 7 0.00419 0.00394
14 0.00653 0.00637 21 0.00941 0.00818 28 0.01486 0.01389 42 0.01893 0.01592 56 0.02159 0.01812 70 0.02276 0.0196 84 0.02509 0.02328
112 0.02756 0.02503 140 0.02771 0.02632
C57Bl/6Cr
168 0.02803 0.02787
Deleted: October

SRP Draft
In Utero and Early Life Cancer A-14 December 2008 Susceptibility: Age Sensitivity Measures OEHHA RCHAB
Table A8. F344 Rat Data Used in Fitting Eqn. 1
Bodyweight (kg) Age (in days) Males Females
Reference
1 0.00592 0.00574 7 0.01201 0.01285
14 0.02634 0.02436 21 0.0307 0.02658 28 0.05423 0.04849 42 0.10506 0.09446 56 0.18112 0.15936 70 0.24446 0.17893 84 0.20588 0.18567
112 0.3042 0.19976 140 0.31301 0.22657 168 0.33542 0.23326
Poiley, 1972
42 0.075 0.075 56 0.125 0.1 77 0.18 0.12 91 0.23 0.145
112 0.26 0.165 133 0.29 0.185 140 0.31 -- 147 0.325 0.19 217 0.355 0.215
Cameron et al., 1985
Table A9. Sprague-Dawley Rat Data Used in Fitting Eqn. 1 (Source: Poiley, 1972)
Bodyweight (kg)
Age (in days)
Males Females 1 0.0067 0.0063 7 0.018 0.0164
14 0.053 0.052 21 0.057 0.0556 28 0.0985 0.0953 42 0.1668 0.1553 56 0.2326 0.1901 70 0.2965 0.2361 84 0.3686 0.2446
112 0.3849 0.259 140 0.4403 0.2803 168 0.4511 0.2868 196 0.5157 0.895
Deleted: October
SRP Draft
In Utero and Early Life Cancer A-15 December 2008 Susceptibility: Age Sensitivity Measures OEHHA RCHAB
References Cameron TP, Hickman RL, Kornreich MR, Tarone RE (1985). History, survival, and growth patterns of B6C3F1 mice and F344 rats in the National Cancer Institute Carcinogenesis Testing Program. Fundam Appl Toxicol 5(3):526-38.
Poiley SM (1972). Growth tables for 66 strains and stocks of laboratory animals. Lab Anim Sci 22(5):758-79.
U.S. Environmental Protection Agency (U.S. EPA) (1988). Recommendations for and Documentation of Biological Values in Risk Assessment. Cincinnati, Ohio: U.S. EPA, EPA/600/6-87-008.
Deleted: October

SRP Draft
In Utero and Early Life Cancer A-16 December 2008 Susceptibility: Age Sensitivity Measures OEHHA RCHAB
Appendix B Lifestage Potency (LP) Ratios for Multi-Lifestage Exposure Studies Lifestage cancer potency (LP) ratio distribution statistics derived from multi-lifestage exposure
study datasets are presented here. Multi-lifestage exposure studies have at least two groups of
animals exposed to a given chemical carcinogen during different lifestages. One dose group is
exposed to a chemical only during one early lifestage (either the prenatal, postnatal, or juvenile
lifestage). The second dose group is exposed for some period of time at an older age, preferably
during the adult lifestage. For each multi-lifestage exposure study, the LP ratio distribution was
computed as the quotient of the cancer potency distribution for those animals exposed during the
early lifestage (e.g., prenatal, postnatal, or juvenile) and those exposed in later life (e.g., adult, or
juvenile in cases where no adult exposure group was included).
Table B1 presents the prenatal LP ratio distributions and study details for the multi-lifestage
exposure datasets that included a prenatal exposure group, grouped by carcinogen. Table B2
presents the postnatal LP ratio distributions and study details for the multi-lifestage exposure
datasets that included a postnatal exposure group, grouped by carcinogen. Table B3 presents the
juvenile LP ratio distributions and study details for the multi-lifestage exposure datasets that
included a juvenile exposure group as the “early life” exposure, grouped by carcinogen.
Deleted: Unadjusted ASFs
Deleted: Window
Deleted: Age sensitivity factor (ASF)
Deleted: window
Deleted: obtained from cancer bioassay experiments in which separate
Deleted: were
Deleted: to
Deleted: s
Deleted: “early life” or “later life” age windows are presented here.
Deleted: window
Deleted: dataset
Deleted: ASF
Deleted: period
Deleted: unadjusted
Deleted: ASF
Deleted: window
Deleted: unadjusted
Deleted: ASF
Deleted: window
Deleted: unadjusted
Deleted: ASF
Deleted: window
Deleted: October

SRP Draft
In Utero and Early Life Cancer A-17 December 2008 Susceptibility: Age Sensitivity Measures OEHHA RCHAB
Table B1. Multi-Lifestage Exposure Studies: Prenatal Lifestage Potency (LP) Ratios for Different Chemicals
Chemical Reference Species Strain Gender Multi-site
Model para-
meters Mean Infinite
values 5th
percentile 25th
percentile 50th
percentile 75th
percentile 95th
percentile
Mouse* B6C3F1 Female No 2 9.12E-01 0.000% 1.36E-01 4.52E-01 7.70E-01 1.22E+00 2.17E+00 Benzidine Vesselinovitch
et al. (1979a) Mouse* B6C3F1 Male No 2 4.64E+01 0.000% 2.57E+01 3.54E+01 4.42E+01 5.49E+01 7.46E+01
Butylnitrosourea Zeller et al. (1978) Rat* Sprague
Dawley Male/
Female Yes 2 5.82E-01 0.000% 2.18E-01 3.74E-01 5.30E-01 7.30E-01 1.12E+00
Diethylstilbesterol (DES)
Turusov et al. (1992) Mouse CBA Female No 2 4.07E-01 0.000% 1.38E-01 2.54E-01 3.59E-01 5.02E-01 8.25E-01
Mohr et al. (1975) Hamster Syrian
Golden Female No 2 1.94E+00 0.000% 1.01E+00 1.41E+00 1.80E+00 2.32E+00 3.34E+00 Diethylnitrosamine
(DEN) Mohr et al. (1995) Hamster Syrian
Golden Female No 2 5.01E-01 0.000% 2.86E-01 3.87E-01 4.78E-01 5.89E-01 7.95E-01
Dimethylnitrosamine (DMN)
Althoff et al. (1977) Hamster Syrian
Golden Male/
Female Yes 2 7.84E+00 4.028% 2.40E-01 4.38E-01 6.86E-01 1.20E+00 1.64E+01
Althoff et al. (1977) Hamster Syrian
Golden Male/
Female Yes 2 1.47E-01 0.000% 6.40E-02 1.00E-01 1.34E-01 1.79E-01 2.76E-01 Di-n-propyl-
nitrosamine (DPN) Althoff and Grandjean
(1979) Hamster Syrian
Golden Female No 2 1.18E-01 0.000% 4.03E-02 7.55E-02 1.07E-01 1.49E-01 2.33E-01
Yes 2 1.64E+01 0.000% 8.70E+00 1.19E+01 1.51E+01 1.94E+01 2.88E+01 1-Ethylnitrosobiuret
Druckrey and Landschutz
(1971) Rat BD IX Male/
Female Yes 2 4.87E+00 0.000% 2.88E+00 3.78E+00 4.62E+00 5.68E+00 7.75E+00
Formatted: Font: Bold
Deleted: Exposure Window: Estimated Age Sensitivity Factors (Unadjusted)
Deleted: October
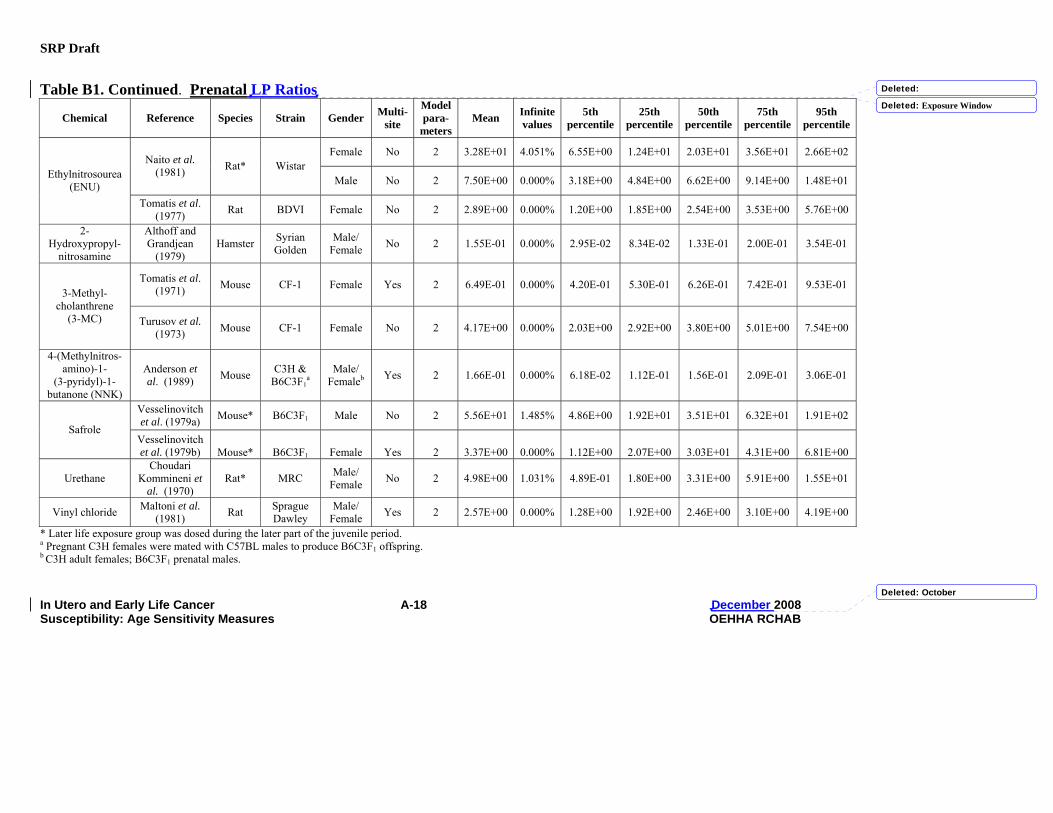
SRP Draft
In Utero and Early Life Cancer A-18 December 2008 Susceptibility: Age Sensitivity Measures OEHHA RCHAB
Table B1. Continued. Prenatal LP Ratios
Chemical Reference Species Strain Gender Multi-site
Model para-
meters Mean Infinite
values 5th
percentile 25th
percentile 50th
percentile 75th
percentile 95th
percentile
Female No 2 3.28E+01 4.051% 6.55E+00 1.24E+01 2.03E+01 3.56E+01 2.66E+02 Naito et al.
(1981) Rat* Wistar Male No 2 7.50E+00 0.000% 3.18E+00 4.84E+00 6.62E+00 9.14E+00 1.48E+01 Ethylnitrosourea
(ENU) Tomatis et al.
(1977) Rat BDVI Female No 2 2.89E+00 0.000% 1.20E+00 1.85E+00 2.54E+00 3.53E+00 5.76E+00
2-Hydroxypropyl-
nitrosamine
Althoff and Grandjean
(1979) Hamster Syrian
Golden Male/
Female No 2 1.55E-01 0.000% 2.95E-02 8.34E-02 1.33E-01 2.00E-01 3.54E-01
Tomatis et al. (1971) Mouse CF-1 Female Yes 2 6.49E-01 0.000% 4.20E-01 5.30E-01 6.26E-01 7.42E-01 9.53E-01
3-Methyl-cholanthrene
(3-MC) Turusov et al. (1973) Mouse CF-1 Female No 2 4.17E+00 0.000% 2.03E+00 2.92E+00 3.80E+00 5.01E+00 7.54E+00
4-(Methylnitros-amino)-1-
(3-pyridyl)-1-butanone (NNK)
Anderson et al. (1989) Mouse C3H &
B6C3F1a
Male/ Femaleb Yes 2 1.66E-01 0.000% 6.18E-02 1.12E-01 1.56E-01 2.09E-01 3.06E-01
Vesselinovitch et al. (1979a) Mouse* B6C3F1 Male No 2 5.56E+01 1.485% 4.86E+00 1.92E+01 3.51E+01 6.32E+01 1.91E+02
Safrole Vesselinovitch et al. (1979b) Mouse* B6C3F1 Female Yes 2 3.37E+00 0.000% 1.12E+00 2.07E+00 3.03E+01 4.31E+00 6.81E+00
Urethane Choudari
Kommineni et al. (1970)
Rat* MRC Male/ Female No 2 4.98E+00 1.031% 4.89E-01 1.80E+00 3.31E+00 5.91E+00 1.55E+01
Vinyl chloride Maltoni et al. (1981) Rat Sprague
Dawley Male/
Female Yes 2 2.57E+00 0.000% 1.28E+00 1.92E+00 2.46E+00 3.10E+00 4.19E+00
* Later life exposure group was dosed during the later part of the juvenile period. a Pregnant C3H females were mated with C57BL males to produce B6C3F1 offspring. b C3H adult females; B6C3F1 prenatal males.
Deleted:
Deleted: Exposure Window
Deleted: October

SRP Draft
In Utero and Early Life Cancer A-19 December 2008 Susceptibility: Age Sensitivity Measures OEHHA RCHAB
Table B2. Multi-Lifestage Exposure Studies: Postnatal Lifestage Potency (LP) Ratios for Different Chemicals
Chemical Reference Species Strain Gender Multi-site
Model para-meters
Mean Infinite values
5th percentile
25th percentile
50th percentile
75th percentile
95th percentile
Vesselinovitch et al. (1975b) Mouse* B6C3F1 Male No 2 9.98E+01 0.000% 6.75E+01 8.23E+01 9.54E+01 1.12E+02 1.46E+02
Female No 2 8.76E-01 0.000% 1.66E-01 4.34E-01 7.39E-01 1.17E+00 2.07E+00 Benzidine Vesselinovitch et al. (1979) Mouse* B6C3F1
Male No 2 1.95E+02 0.000% 1.21E+02 1.56E+02 1.88E+02 2.26E+02 2.98E+02
Truhaut et al. (1966) Mouse* Swiss Male/
Female No 2 6.20E-01 0.000% 2.55E-01 3.88E-01 5.31E-01 7.43E-01 1.28E+00
Female Yes 2 2.28E+00 0.000% 1.50E+00 1.86E+00 2.18E+00 2.60E+00 3.42E+00 B6C3F1
Male Yes 2 & 3c 1.96E+00 0.000% 1.42E+00 1.70E+00 1.93E+00 2.18E+00 2.61E+00
Female Yes 2 1.90E+00 0.000% 1.14E+00 1.50E+00 1.82E+00 2.21E+00 2.94E+00
Benzo[a]pyrene Vesselinovitch et al. (1975a) Mouse*
C3AF1 Male Yes 2 2.06E+00 0.000% 1.20E+00 1.59E+00 1.94E+00 2.40E+00 3.30E+00
1,1-Bis(p-Chlorophenol)-2,2,2-trichloroethane
(DDT)
Vesselinovitch et al. (1979a) Mouse* B6C3F1 Male No 2 1.46E+01 0.000% 8.43E-01 5.61E+00 9.68E+00 1.56E+01 3.25E+01
Butylnitrosourea Zeller et al. (1978) Rat* Sprague
Dawley Male/
Female Yes 2 3.99E+00 0.000% 2.46E+00 3.17E+00 3.80E+00 4.60E+00 6.14E+00
Female Yes 2 7.49E+01 0.000% 3.32E+01 4.96E+01 6.64E+01 9.04E+01 1.45E+02 Dibutylnitrosamine Wood et al.
(1970) Mouse IF x C57 Male Yes 2 8.04E+01 0.000% 3.53E+01 5.25E+01 7.08E+01 9.73E+01 1.59E+02
Deleted: Exposure Window:
Deleted: Estimated Age Sensitivity Factors (Unadjusted)
Deleted: October
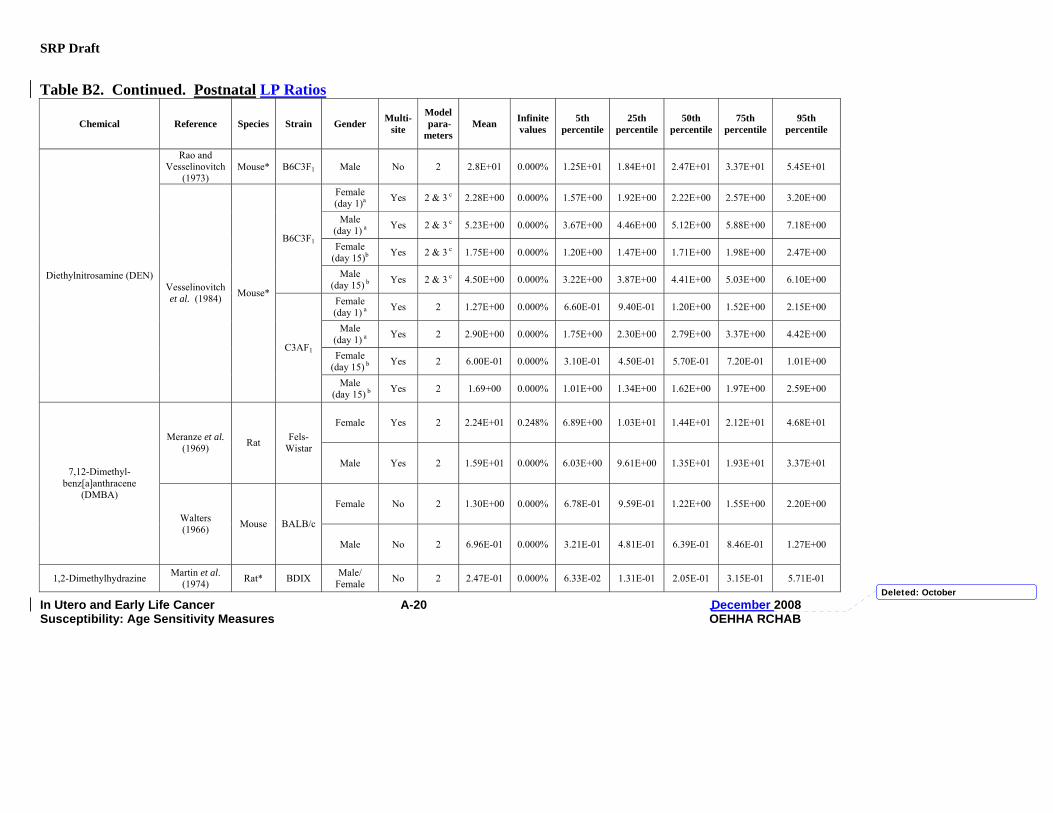
SRP Draft
In Utero and Early Life Cancer A-20 December 2008 Susceptibility: Age Sensitivity Measures OEHHA RCHAB
Table B2. Continued. Postnatal LP Ratios
Chemical Reference Species Strain Gender Multi-site
Model para-meters
Mean Infinite values
5th percentile
25th percentile
50th percentile
75th percentile
95th percentile
Rao and Vesselinovitch
(1973) Mouse* B6C3F1 Male No 2 2.8E+01 0.000% 1.25E+01 1.84E+01 2.47E+01 3.37E+01 5.45E+01
Female (day 1)a Yes 2 & 3 c 2.28E+00 0.000% 1.57E+00 1.92E+00 2.22E+00 2.57E+00 3.20E+00
Male (day 1) a Yes 2 & 3 c 5.23E+00 0.000% 3.67E+00 4.46E+00 5.12E+00 5.88E+00 7.18E+00
Female (day 15)b Yes 2 & 3 c 1.75E+00 0.000% 1.20E+00 1.47E+00 1.71E+00 1.98E+00 2.47E+00
B6C3F1
Male (day 15) b Yes 2 & 3 c 4.50E+00 0.000% 3.22E+00 3.87E+00 4.41E+00 5.03E+00 6.10E+00
Female (day 1) a Yes 2 1.27E+00 0.000% 6.60E-01 9.40E-01 1.20E+00 1.52E+00 2.15E+00
Male (day 1) a Yes 2 2.90E+00 0.000% 1.75E+00 2.30E+00 2.79E+00 3.37E+00 4.42E+00
Female (day 15) b Yes 2 6.00E-01 0.000% 3.10E-01 4.50E-01 5.70E-01 7.20E-01 1.01E+00
Diethylnitrosamine (DEN) Vesselinovitch et al. (1984) Mouse*
C3AF1
Male (day 15) b Yes 2 1.69+00 0.000% 1.01E+00 1.34E+00 1.62E+00 1.97E+00 2.59E+00
Female Yes 2 2.24E+01 0.248% 6.89E+00 1.03E+01 1.44E+01 2.12E+01 4.68E+01 Meranze et al.
(1969) Rat Fels-Wistar
Male Yes 2 1.59E+01 0.000% 6.03E+00 9.61E+00 1.35E+01 1.93E+01 3.37E+01
Female No 2 1.30E+00 0.000% 6.78E-01 9.59E-01 1.22E+00 1.55E+00 2.20E+00
7,12-Dimethyl- benz[a]anthracene
(DMBA)
Walters (1966) Mouse BALB/c
Male No 2 6.96E-01 0.000% 3.21E-01 4.81E-01 6.39E-01 8.46E-01 1.27E+00
1,2-Dimethylhydrazine Martin et al. (1974) Rat* BDIX Male/
Female No 2 2.47E-01 0.000% 6.33E-02 1.31E-01 2.05E-01 3.15E-01 5.71E-01 Deleted: October
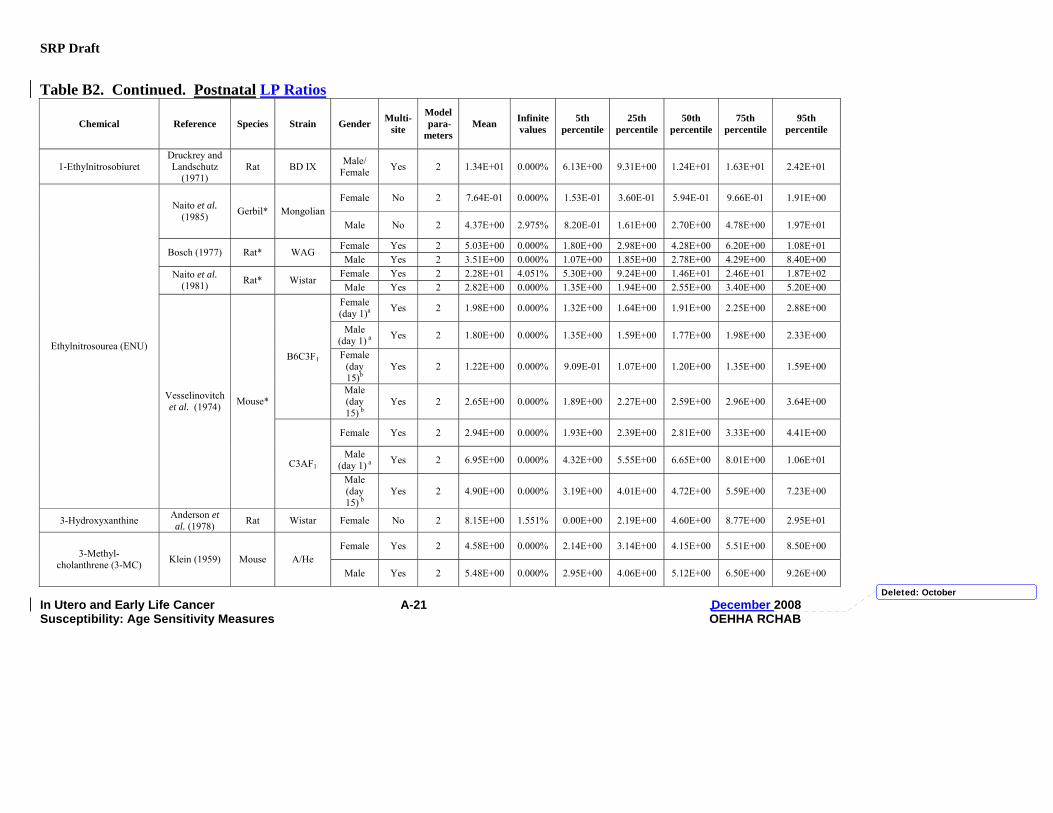
SRP Draft
In Utero and Early Life Cancer A-21 December 2008 Susceptibility: Age Sensitivity Measures OEHHA RCHAB
Table B2. Continued. Postnatal LP Ratios
Chemical Reference Species Strain Gender Multi-site
Model para-meters
Mean Infinite values
5th percentile
25th percentile
50th percentile
75th percentile
95th percentile
1-Ethylnitrosobiuret Druckrey and Landschutz
(1971) Rat BD IX Male/
Female Yes 2 1.34E+01 0.000% 6.13E+00 9.31E+00 1.24E+01 1.63E+01 2.42E+01
Female No 2 7.64E-01 0.000% 1.53E-01 3.60E-01 5.94E-01 9.66E-01 1.91E+00 Naito et al.
(1985) Gerbil* Mongolian Male No 2 4.37E+00 2.975% 8.20E-01 1.61E+00 2.70E+00 4.78E+00 1.97E+01
Female Yes 2 5.03E+00 0.000% 1.80E+00 2.98E+00 4.28E+00 6.20E+00 1.08E+01 Bosch (1977) Rat* WAG
Male Yes 2 3.51E+00 0.000% 1.07E+00 1.85E+00 2.78E+00 4.29E+00 8.40E+00 Female Yes 2 2.28E+01 4.051% 5.30E+00 9.24E+00 1.46E+01 2.46E+01 1.87E+02 Naito et al.
(1981) Rat* Wistar Male Yes 2 2.82E+00 0.000% 1.35E+00 1.94E+00 2.55E+00 3.40E+00 5.20E+00
Female (day 1)a Yes 2 1.98E+00 0.000% 1.32E+00 1.64E+00 1.91E+00 2.25E+00 2.88E+00
Male (day 1) a Yes 2 1.80E+00 0.000% 1.35E+00 1.59E+00 1.77E+00 1.98E+00 2.33E+00
Female (day 15)b
Yes 2 1.22E+00 0.000% 9.09E-01 1.07E+00 1.20E+00 1.35E+00 1.59E+00 B6C3F1
Male (day 15) b
Yes 2 2.65E+00 0.000% 1.89E+00 2.27E+00 2.59E+00 2.96E+00 3.64E+00
Female Yes 2 2.94E+00 0.000% 1.93E+00 2.39E+00 2.81E+00 3.33E+00 4.41E+00
Male (day 1) a Yes 2 6.95E+00 0.000% 4.32E+00 5.55E+00 6.65E+00 8.01E+00 1.06E+01
Ethylnitrosourea (ENU)
Vesselinovitch et al. (1974) Mouse*
C3AF1 Male (day 15) b
Yes 2 4.90E+00 0.000% 3.19E+00 4.01E+00 4.72E+00 5.59E+00 7.23E+00
3-Hydroxyxanthine Anderson et al. (1978) Rat Wistar Female No 2 8.15E+00 1.551% 0.00E+00 2.19E+00 4.60E+00 8.77E+00 2.95E+01
Female Yes 2 4.58E+00 0.000% 2.14E+00 3.14E+00 4.15E+00 5.51E+00 8.50E+00 3-Methyl-
cholanthrene (3-MC) Klein (1959) Mouse A/He Male Yes 2 5.48E+00 0.000% 2.95E+00 4.06E+00 5.12E+00 6.50E+00 9.26E+00
Deleted: October
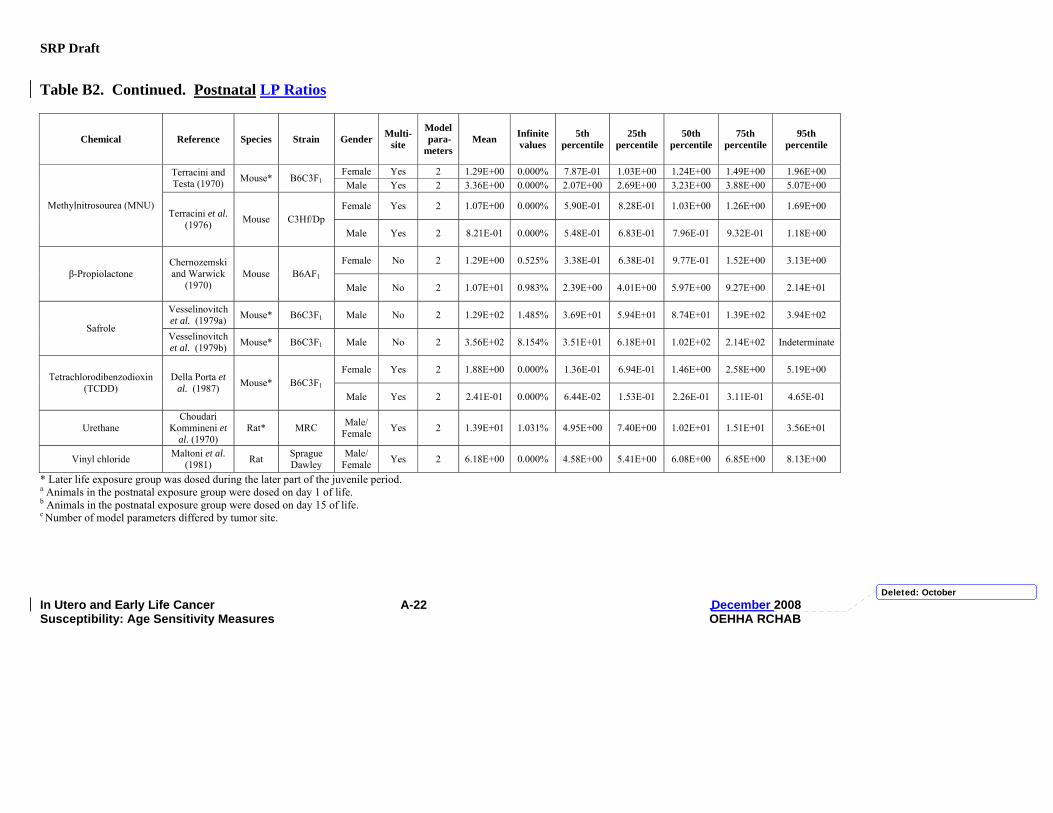
SRP Draft
In Utero and Early Life Cancer A-22 December 2008 Susceptibility: Age Sensitivity Measures OEHHA RCHAB
Table B2. Continued. Postnatal LP Ratios
Chemical Reference Species Strain Gender Multi-site
Model para-meters
Mean Infinite values
5th percentile
25th percentile
50th percentile
75th percentile
95th percentile
Female Yes 2 1.29E+00 0.000% 7.87E-01 1.03E+00 1.24E+00 1.49E+00 1.96E+00 Terracini and Testa (1970) Mouse* B6C3F1 Male Yes 2 3.36E+00 0.000% 2.07E+00 2.69E+00 3.23E+00 3.88E+00 5.07E+00
Female Yes 2 1.07E+00 0.000% 5.90E-01 8.28E-01 1.03E+00 1.26E+00 1.69E+00 Methylnitrosourea (MNU) Terracini et al.
(1976) Mouse C3Hf/Dp Male Yes 2 8.21E-01 0.000% 5.48E-01 6.83E-01 7.96E-01 9.32E-01 1.18E+00
Female No 2 1.29E+00 0.525% 3.38E-01 6.38E-01 9.77E-01 1.52E+00 3.13E+00 β-Propiolactone
Chernozemski and Warwick
(1970) Mouse B6AF1
Male No 2 1.07E+01 0.983% 2.39E+00 4.01E+00 5.97E+00 9.27E+00 2.14E+01
Vesselinovitch et al. (1979a) Mouse* B6C3F1 Male No 2 1.29E+02 1.485% 3.69E+01 5.94E+01 8.74E+01 1.39E+02 3.94E+02
Safrole Vesselinovitch et al. (1979b) Mouse* B6C3F1 Male No 2 3.56E+02 8.154% 3.51E+01 6.18E+01 1.02E+02 2.14E+02 Indeterminate
Female Yes 2 1.88E+00 0.000% 1.36E-01 6.94E-01 1.46E+00 2.58E+00 5.19E+00 Tetrachlorodibenzodioxin
(TCDD) Della Porta et
al. (1987) Mouse* B6C3F1 Male Yes 2 2.41E-01 0.000% 6.44E-02 1.53E-01 2.26E-01 3.11E-01 4.65E-01
Urethane Choudari
Kommineni et al. (1970)
Rat* MRC Male/ Female Yes 2 1.39E+01 1.031% 4.95E+00 7.40E+00 1.02E+01 1.51E+01 3.56E+01
Vinyl chloride Maltoni et al. (1981) Rat Sprague
Dawley Male/
Female Yes 2 6.18E+00 0.000% 4.58E+00 5.41E+00 6.08E+00 6.85E+00 8.13E+00
* Later life exposure group was dosed during the later part of the juvenile period. a Animals in the postnatal exposure group were dosed on day 1 of life. b Animals in the postnatal exposure group were dosed on day 15 of life. c Number of model parameters differed by tumor site.
Deleted: October

SRP Draft
In Utero and Early Life Cancer A-23 December 2008 Susceptibility: Age Sensitivity Measures OEHHA RCHAB
Table B3. Multi-Lifestage Exposure Studies: Juvenile Lifestage Potency (LP) Ratios for Different Chemicals
Chemical Reference Species Strain Gender Multi-site Model para-meters
Mean Infinite values
5th percentile
25th percentile
50th percentile
75th percentile
95th percentile
Female Yes 2 9.74E+00 0.248% 2.79E+00 4.37E+00 6.17E+00 9.24E+00 2.07E+01 7,12-Dimethyl-
benz[a]anthracene (DMBA)
Meranze et al. (1969) Rat Fels-
Wistar Male No 2 1.24E+00 0.000% 3.21E-01 6.31E-01 9.95E-01 1.55E+00 2.96E+00
Dimethylnitrosamine (DMN)
Noronha and
Goodall (1984)
Rat CRL/CDF Male Yes 2 1.80E+00 0.000% 1.14E+00 1.46E+00 1.73E+00 2.07E+00 2.70E+00
3-Hydroxyxanthine Anderson
et al. (1978)
Rat Wistar Female No 2 1.55E+00 1.551% 9.89E-02 4.81E-01 9.03E-01 1.63E+00 5.28E+00
Femalea+ Yes 2 3.57E+00 0.000% 2.25E+00 2.88E+00 3.43E+00 4.11E+00 5.39E+00
Methylnitrosourea (MNU)
Grubbs et al. (1983) Rat Sprague
Dawley
Femaleb Yes 2 1.11E+01 0.000% 6.61E+00 8.64E+00 1.05E+01 1.29E+01 1.77E+01
Urethane
Choudari Kommineni
et al. (1970)
Rat* MRC Male/ Female No 2 7.86E-01 1.031% 2.86E-02 2.92E-01 5.42E-01 9.41E-01 2.39E+00
* Later life exposure group was dosed during the later part of the juvenile period. + MNU dataset selected for generation of juvenile LP ratio mixture distribution; see text for explanation. a Animals in the adult exposure group were dosed from day 80 to 87. b Animals in the adult exposure group were dosed from day 140 to 147.
Formatted: Font: 20 pt
Deleted: Exposure Window: Estimated Age Sensitivity Factors (Unadjusted)
Deleted: ASF
Deleted: October

SRP Draft
In Utero and Early Life Cancer A-24 December 2008 Susceptibility: Age Sensitivity Measures OEHHA RCHAB
Appendix C
Sensitivity Analyses: Lifestage Potency (LP) Ratio and ASF
Mixture Frequency Distributions for Multi-Lifestage Exposure
Studies
This appendix presents the detailed findings for the LP ratio frequency distributions generated
for the prenatal, postnatal, and juvenile lifestages from the multi-lifestage exposure studies. As
described in the Methods section, in order to derive the LP ratio mixture distribution for each
early lifestage, each chemical in the data set was equally likely to be sampled, and each chemical
was represented by a single LP ratio distribution. When there were multiple LP ratios
(representing multiple studies) on a chemical, the LP ratio distributions from all studies of that
chemical were combined by equally sampling from each LP ratio distribution via Monte Carlo
methods to obtain a single LP ratio distribution for that chemical. Sensitivity analyses were also
conducted, employing alternative sampling methods to obtain a single LP ratio distribution to
represent each chemical for which there were multiple studies. In one alternative sampling
method, each of the LP ratio distributions available for a chemical is sampled based upon an
inverse-variance weighting scheme, where the variance is calculated for the distribution of the
logarithm of the LP ratio, Var[log LP ratio], and the likelihood that an LP ratio distribution is
sampled is proportional to 1/Var(log[LP ratio]). In another alternative sampling method, the LP
ratio distribution with the largest median is used as the representative “mixture” LP ratio
distribution to represent the chemical.
Prenatal LP Ratio and ASF Mixture Distributions
Chemicals Equally Weighted and Within Each Chemical Equal Weight per Study.
Figure C-1a shows the prenatal LP ratio mixture frequency distribution generated using this
method. The frequency distribution is multi-modal (four modes), at 0.15, 0.54, 3.65, and 47.86.
The largest peak of the frequency distribution is an LP ratio value of 0.54. The smallest mode, at
an LP ratio value of 0.15, is primarily composed of LP ratio values from the following
Formatted: English (U.S.)
Deleted: ASF
Deleted: from Methods 1—3
Deleted: Window
Deleted: ASF mixture
Deleted: using Methods 1, 2 and 3
Deleted: exposure windows
Deleted: window
Deleted: ASF
Deleted: -
Deleted: exposure window
Deleted: ASF
Deleted: ASF
Deleted: three different methods were used to sample from them to derive the ASF mixture distribution for the chemical. Using Method 1, each of the ASF distributions available for a chemical is equally likely to be sampled. Using Method 2,
Deleted: ASF
Deleted: ASF
Deleted: logASF
Deleted: ASF
Deleted: ASF
Deleted: Using Method 3
Deleted: ASF
Deleted: ASF
Deleted: ASF
Deleted: Method 1:
Deleted: ASF
Deleted: M
Deleted: 1
Deleted: ASF
Deleted: ASF
Deleted: ASF
Deleted: October

SRP Draft
In Utero and Early Life Cancer A-25 December 2008 Susceptibility: Age Sensitivity Measures OEHHA RCHAB
chemicals: di-n-propylnitrosamine, 2-hydroxypropylnitrosamine, and NNK. These chemicals
display confidence intervals that indicate the true value of the LP ratio is statistically
significantly less than 1.0 (at the 0.05 level; see also Fig. 6 in the main text). The second mode,
with a value of 0.54, is comprised primarily of LP ratio values from chemicals whereby a bulk of
their LP ratio distributions lie below 1.0, yet the 90% upper confidence bound may be slightly
greater than 1.0. These chemicals are as follows: benzidine (female mouse), butylnitrosourea,
DES, DEN (one of the two female hamster studies), dimethylnitrosamine, and 3-MC (one of the
two female mouse studies). The third mode, with a value of 3.65, consists primarily of LP ratio
values from chemicals whereby a bulk of their LP ratio distributions lie above 1.0 yet their upper
90% confidence bound is generally not greater than 10. These chemicals are as follows: DEN
(one of the two female hamster studies), ENU (one of two female rat studies), 3-MC (one of the
two female mouse studies), safrole (female mouse), urethane, and vinyl chloride. The largest
mode is primarily composed of LP ratio values from the following chemicals: benzidine (male
mouse), 1-ethylnitrosobiuret, ENU (male rat, one of two female rat studies), and safrole (male
mouse). These chemicals display confidence intervals that indicate the true value of the LP ratio
is statistically significantly greater than 1.0 (at the p < 0.05 level).
Formatted: Highlight
Deleted: ASF
Deleted: 1
Deleted: ASF
Deleted: ASF
Deleted: ASF
Deleted: ASF
Deleted: ASF
Deleted: ASF
Deleted: October

SRP Draft
In Utero and Early Life Cancer A-26 December 2008 Susceptibility: Age Sensitivity Measures OEHHA RCHAB
Figure C-1a. Prenatal LP Ratio Mixture Frequency Distribution – Equally Weighted Chemicals, Equally Weighted Studies (Method presented in the main text)
Alternative Weighting: Chemicals Equally Weighted and Within Each Chemical Inverse-
Variance Weighting of Studies.
Figure C-1b shows the prenatal LP ratio mixture frequency distribution generated using the
alternative weighting method whereby each of the LP ratio distributions available for a chemical
is sampled based upon an inverse-variance weighting scheme (i.e., the likelihood that an LP ratio
distribution is sampled is proportional to 1/Var(log[LP ratio]) (Method 2). The prenatal LP ratio
mixture frequency distribution is multi-modal (four modes). The modes of the frequency
distribution are 0.14, 0.52, 3.63, and 47.86. The largest peak of the frequency distribution is an
LP ratio value of 0.52. The general shape of this prenatal LP ratio mixture frequency distribution
is similar to that generated when multiple LP ratio distributions for a chemical are equally
weighted. Of those chemicals that had more than a single LP ratio dataset representing them,
unless there were appreciable fold-differences across the studies, datasets within a chemical were
LP Ratio Formatted: Font: (Default) Arial
Deleted: Method 1
Deleted: ASF
Deleted: Method 2:
Deleted: ASF
Deleted: Method 2.
Deleted: ASF
Deleted: ASF
Deleted: ASF
Deleted: using
Deleted: Method 1 (i.e., all chemicals equally represented in the mixture distribution)
Deleted: ASF
Deleted: October

SRP Draft
In Utero and Early Life Cancer A-27 December 2008 Susceptibility: Age Sensitivity Measures OEHHA RCHAB
generally sampled from equally, even using this inverse-variance weighting method. In
instances where there were fold differences across datasets within a chemical, this inverse-
variance weighting method assigns datasets with the greatest variability (log space) the smallest
weights in comparison to other datasets with less variability (log space). Chemicals that have
multiple prenatal studies representing them that have fold-differences such that they are not
equally sampled are benzidine, ENU, and safrole. The greatest departure between the LP ratio
mixture frequency distributions generated using equal weighting within a chemical and inverse-
variance weighting within a chemical is attributed to the datasets associated with these
chemicals.
Figure C-1b. Prenatal LP Ratio Mixture Frequency Distribution – Equally Weighted Chemicals, Inverse-Variance Weighting of Studies (Method 2)
LP Ratio
Formatted: Font: Bold
Formatted: Font: (Default) Arial
Deleted: Method 2
Deleted: e
Deleted: M
Deleted: ASF
Deleted: Method 1
Deleted: Method 2
Deleted: Method 2
Deleted: ASF
Deleted: October

SRP Draft
In Utero and Early Life Cancer A-28 December 2008 Susceptibility: Age Sensitivity Measures OEHHA RCHAB
Alternative Weighting: Chemicals Equally Weighted, Single Study Represents Each Chemical.
Figure C-1c shows the prenatal LP ratio mixture frequency distribution generated using the
alternative weighting method whereby for chemicals with multiple studies LP ratios
distributions, the distribution with the largest median was selected to represent that chemical in
the LP ratio mixture distribution (Method 3). The prenatal LP ratio mixture frequency
distribution is multi-modal (five modes). This distribution looks somewhat different than those
shown in Figures C-1a and C-1b; it is more disperse and the modes of the distribution are more
peaked for larger LP ratio values. The modes of this prenatal LP ratio mixture frequency
distribution are 0.15, 0.53, 3.60, 19.12 and 47.98. The largest peak of this distribution is the LP
ratio value of 0.53.
Of those chemicals that had more than a single study representing them, the study with the
largest median tended to also have the largest variance. As a result, the mixture frequency
distribution resulting from Method 3 tends to be more spread out and shifted toward the right.
The chemicals contributing to the peak with value 0.15 are di-n-propylnitrosamine, 2-
hydroxypropylnitrosamine, and NNK. The chemicals primarily contributing to the mode with
value 0.53 are butylnitrosourea and DES. The next largest peak with a value of 3.60 is
comprised of the chemicals DEN, dimethylnitrosamine, 3-MC, urethane and vinyl chloride. The
peaks with the largest modes (values of 19.12 and 47.98) consist of the chemicals benzidine, 1-
ethylnitrosobiuret, ENU, and safrole. All of the studies that comprise the two peaks with the
largest modes display confidence intervals that indicate the true value of the LP ratio is
statistically significantly greater than 1 (at the 0.05 level).
Deleted: Method 3
Deleted: ASF
Deleted: The dataset selected as representative of each chemical was the one with the largest median in the ASF distribution.
Deleted: ASF
Deleted: ASF
Deleted: ASF
Deleted: ASF
Deleted: ASF
Deleted: October

SRP Draft
In Utero and Early Life Cancer A-29 December 2008 Susceptibility: Age Sensitivity Measures OEHHA RCHAB
Figure C-1c. Prenatal LP Ratio Mixture Frequency Distribution - Equally Weighted Chemicals, Single Study Represents Each Chemical(Method 3)
The mean, and specific percentiles for the LP ratio and ASF mixture distributions for each
method are provided in Table C-1. For the 30th percentile and below there is essentially no
difference between the LP ratio mixture distributions across the methods. Slight differences
between Method 1 and Method 2 appear at the latter percentiles, at the 80th percentile and
greater. For percentiles greater than the 30th, the prenatal LP ratio mixture distribution derived
via Method 3 has percentile values that are larger than the other methods. The distribution
derived via Method 1 falls between Methods 2 and 3. These prenatal LP ratio mixture
cumulative distribution functions follow a predictable pattern that is explained via the mixing
algorithms employed. In summary, the LP ratio and ASF distributions generated by each of the
three methods are multimodal with modes above and below unity.
LP Ratio Formatted: Font: (Default) Arial
Formatted: Font: Bold
Deleted: Method 3
Deleted: ASF
Deleted: October
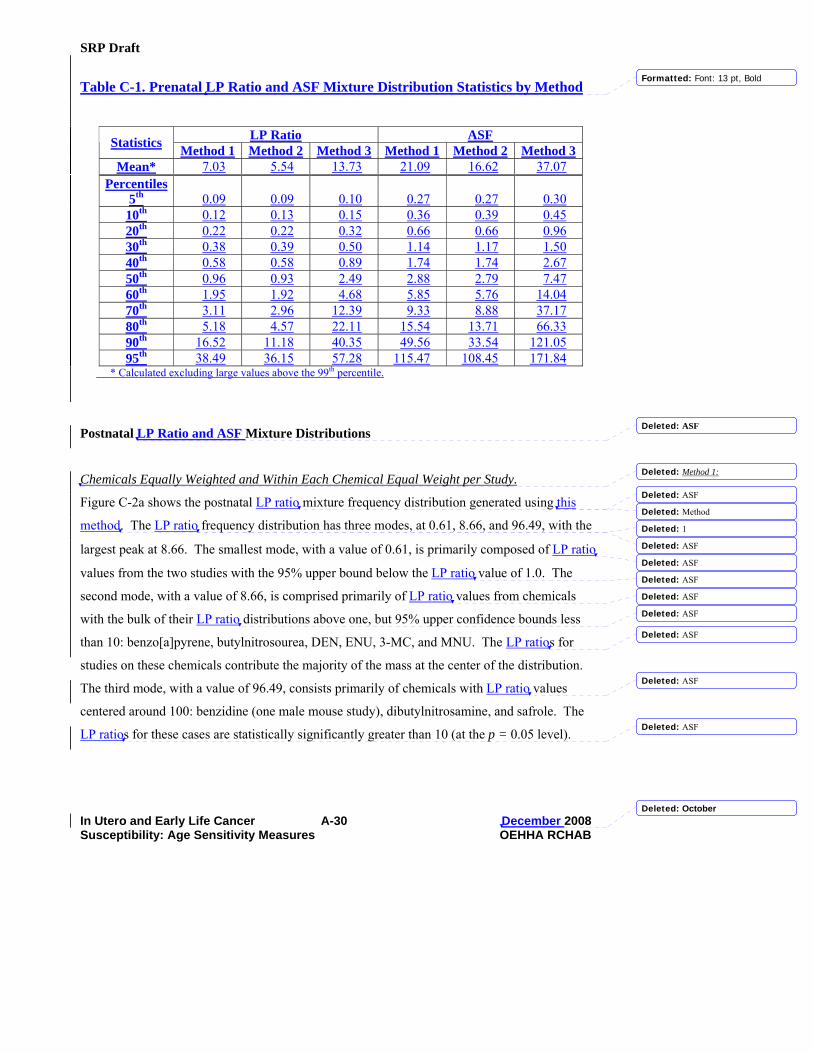
SRP Draft
In Utero and Early Life Cancer A-30 December 2008 Susceptibility: Age Sensitivity Measures OEHHA RCHAB
Table C-1. Prenatal LP Ratio and ASF Mixture Distribution Statistics by Method
LP Ratio ASF Statistics Method 1 Method 2 Method 3 Method 1 Method 2 Method 3 Mean* 7.03 5.54 13.73 21.09 16.62 37.07
Percentiles 5th 0.09 0.09 0.10 0.27 0.27 0.30 10th 0.12 0.13 0.15 0.36 0.39 0.45 20th 0.22 0.22 0.32 0.66 0.66 0.96 30th 0.38 0.39 0.50 1.14 1.17 1.50 40th 0.58 0.58 0.89 1.74 1.74 2.67 50th 0.96 0.93 2.49 2.88 2.79 7.47 60th 1.95 1.92 4.68 5.85 5.76 14.04 70th 3.11 2.96 12.39 9.33 8.88 37.17 80th 5.18 4.57 22.11 15.54 13.71 66.33 90th 16.52 11.18 40.35 49.56 33.54 121.05 95th 38.49 36.15 57.28 115.47 108.45 171.84
* Calculated excluding large values above the 99th percentile.
Postnatal LP Ratio and ASF Mixture Distributions
Chemicals Equally Weighted and Within Each Chemical Equal Weight per Study.
Figure C-2a shows the postnatal LP ratio mixture frequency distribution generated using this
method. The LP ratio frequency distribution has three modes, at 0.61, 8.66, and 96.49, with the
largest peak at 8.66. The smallest mode, with a value of 0.61, is primarily composed of LP ratio
values from the two studies with the 95% upper bound below the LP ratio value of 1.0. The
second mode, with a value of 8.66, is comprised primarily of LP ratio values from chemicals
with the bulk of their LP ratio distributions above one, but 95% upper confidence bounds less
than 10: benzo[a]pyrene, butylnitrosourea, DEN, ENU, 3-MC, and MNU. The LP ratios for
studies on these chemicals contribute the majority of the mass at the center of the distribution.
The third mode, with a value of 96.49, consists primarily of chemicals with LP ratio values
centered around 100: benzidine (one male mouse study), dibutylnitrosamine, and safrole. The
LP ratios for these cases are statistically significantly greater than 10 (at the p = 0.05 level).
Formatted: Font: 13 pt, Bold
Deleted: ASF
Deleted: Method 1:
Deleted: ASF
Deleted: Method
Deleted: 1
Deleted: ASF
Deleted: ASF
Deleted: ASF
Deleted: ASF
Deleted: ASF
Deleted: ASF
Deleted: ASF
Deleted: ASF
Deleted: October

SRP Draft
In Utero and Early Life Cancer A-31 December 2008 Susceptibility: Age Sensitivity Measures OEHHA RCHAB
Figure C-2a. Postnatal LP Ratio Mixture Frequency Distribution – Equally Weighted Chemicals, Equally Weighted Studies (Method 1, presented in the main text)
Alternative Weighting: Chemicals Equally Weighted and Within Each Chemical Inverse-
Variance Weighting of Studies.
Figure C-2b shows the postnatal LP ratio mixture frequency distribution generated using the
alternative weighting method whereby each of the LP ratio distributions available for a chemical
is sampled based upon an inverse-variance weighting scheme (i.e., the likelihood that an LP ratio
distribution is sampled is proportional to 1/var(log[lp ratio]) (Method 2). The postnatal ASF
mixture frequency distribution has four modes, at 0.49, 1.43, 8.66, and 95.55. As with Method 1,
the largest has an LP ratio value of 8.66, and its general shape is similar to the one generated
using Method 1 (Figure C-2a). The main difference is that the Method 2 distribution is slightly
more spread out with more defined peaks, and the peaks tend to be more elevated. The higher
peaks are due to the studies within a chemical that have smaller fold differences being weighted
more heavily than those studies with greater variability (e.g. benzidene, benzo[a]pyrene, DEN,
and ENU). However, the studies with greater variability (log space) are still contributing to the
frequency distribution. The studies with the most variability (log space) and the largest LP ratio
values contribute to the enhanced variability of Method 2 as compared to Method 1.
Undefined 0.01 0.1 1 10 100 1000 Infinity
LP Ratio Formatted: Font: (Default) Arial
Deleted: Method 1
Deleted: ASF
Deleted: Method 2:
Deleted: ASF
Deleted: ASF
Deleted: ASF
Deleted: October

SRP Draft
In Utero and Early Life Cancer A-32 December 2008 Susceptibility: Age Sensitivity Measures OEHHA RCHAB
Figure C-2b. Postnatal LP Ratio Mixture Frequency Distribution – Equally Weighted Chemicals, Inverse-Variance Weighting of Studies (Method 2)
LP Ratio
Alternative Weighting: Chemicals Equally Weighted, Single Study Represents Each Chemical.
Figure C-2c shows the postnatal LP ratio mixture frequency distribution generated using the
alternative weighting method whereby for chemicals with multiple studies LP ratios
distributions, the distribution with the largest median was selected to represent that chemical in
the LP ratio mixture distribution (Method 3). The postnatal LP ratio mixture frequency
distribution again has four modes, 0.58, 8.96, 97.83, and 163.79. It has two very distinct peaks
and is more skewed to the right than those shown in Figures C-2a and C-2b. The largest peak of
this frequency distribution is an LP ratio value of 8.96.
For chemicals where there is significant study-to-study variability, the effect of selecting the
distribution with the largest median exaggerates the percentiles of the resultant mixture
frequency distribution. This effect is most pronounced for the chemicals benzidine, DEN,
DMBA, ENU, and β-propiolactone.
Freq
uenc
y
Undefined 0.01 0.1 1 10 100 1000 Infinity
Deleted: Method 2
Deleted: ASF
Deleted: Method 3
Deleted: ASF
Deleted: The dataset selected as representative of each chemical was the one with the largest median in the ASF distribution.
Deleted: ASF
Deleted: ASF
Deleted: October

SRP Draft
In Utero and Early Life Cancer A-33 December 2008 Susceptibility: Age Sensitivity Measures OEHHA RCHAB
Figure C-2c. Postnatal LP Ratio Mixture Frequency Distribution - Equally Weighted Chemicals, Single Study Represents Each Chemical (Method 3)
LP Ratio
The mean, and specific percentiles for the LP ratio and ASF mixture distributions for each
method are provided in Table C-2. The LP ratio and ASF distributions for Method 1 and Method
2 are nearly identical up to the 70th percentile. After the 70th percentile, Method 2 has slightly
larger values as compared to Method 1. The most compact postnatal LP ratio distributions
generally have values that are significantly greater than unity. As a result, the inverse-variance
method (Method 2) produces a LP ratio mixture distribution that is shifted slightly to the right of
the distribution derived using Method 1, where equal weighting is given to all studies within a
chemical (see Figure 11 in the main text). The magnitude of this rightward shift with Method 2
is not particularly large however because there were no single studies amongst those chemicals
with multiple studies with considerably smaller variances than the others in the set. The
postnatal LP ratio and ASF mixture cumulative distributions derived via Method 3 have
percentile values that are considerably larger than the other methods beyond the 5th percentile.
The most peaked mode of the postnatal LP ratio mixture frequency distribution is similar across
the mixing algorithms employed (i.e., Methods 1-3). However, when a single study with the
largest median value is selected to represent the chemical (Method 3), the percentiles of the
distribution become somewhat larger as compared to that seen using Methods 1 or 2.
Freq
uenc
y
Undefined 0.01 0.1 1 10 100 1000 Infinity
Deleted: Method 3
Deleted: ASF
Deleted: October
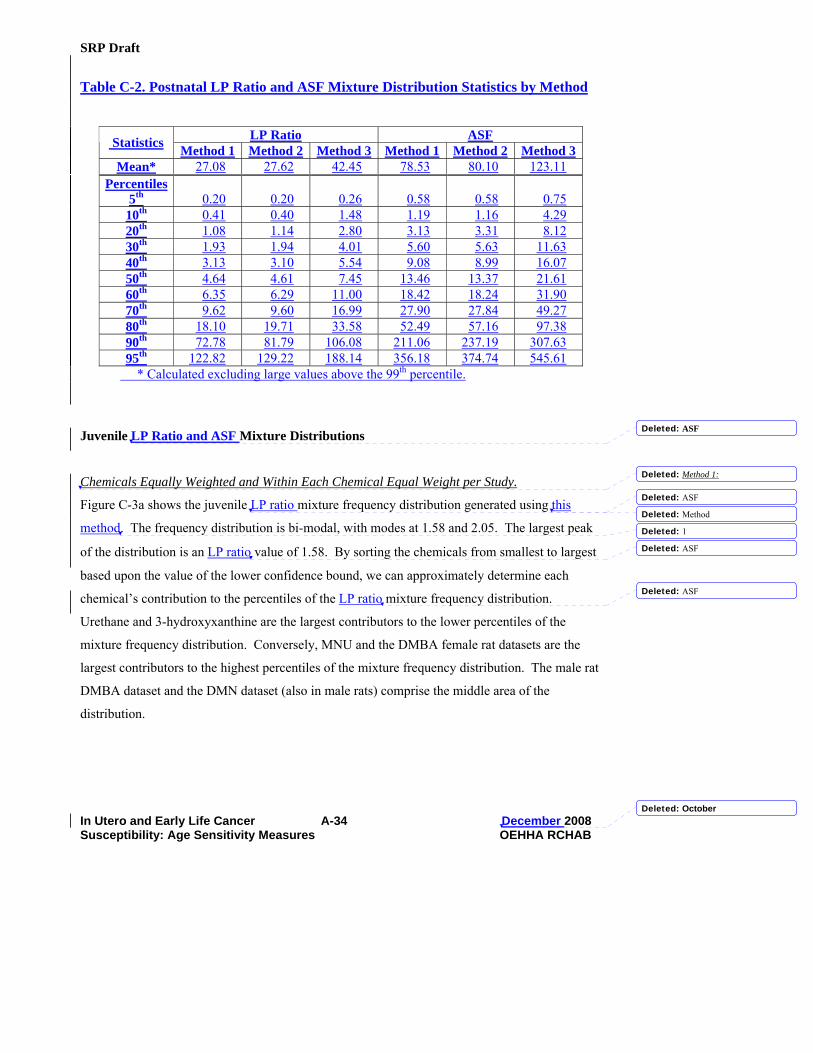
SRP Draft
In Utero and Early Life Cancer A-34 December 2008 Susceptibility: Age Sensitivity Measures OEHHA RCHAB
Table C-2. Postnatal LP Ratio and ASF Mixture Distribution Statistics by Method
LP Ratio ASF Statistics Method 1 Method 2 Method 3 Method 1 Method 2 Method 3 Mean* 27.08 27.62 42.45 78.53 80.10 123.11
Percentiles 5th 0.20 0.20 0.26 0.58 0.58 0.75 10th 0.41 0.40 1.48 1.19 1.16 4.29 20th 1.08 1.14 2.80 3.13 3.31 8.12 30th 1.93 1.94 4.01 5.60 5.63 11.63 40th 3.13 3.10 5.54 9.08 8.99 16.07 50th 4.64 4.61 7.45 13.46 13.37 21.61 60th 6.35 6.29 11.00 18.42 18.24 31.90 70th 9.62 9.60 16.99 27.90 27.84 49.27 80th 18.10 19.71 33.58 52.49 57.16 97.38 90th 72.78 81.79 106.08 211.06 237.19 307.63 95th 122.82 129.22 188.14 356.18 374.74 545.61
* Calculated excluding large values above the 99th percentile.
Juvenile LP Ratio and ASF Mixture Distributions
Chemicals Equally Weighted and Within Each Chemical Equal Weight per Study.
Figure C-3a shows the juvenile LP ratio mixture frequency distribution generated using this
method. The frequency distribution is bi-modal, with modes at 1.58 and 2.05. The largest peak
of the distribution is an LP ratio value of 1.58. By sorting the chemicals from smallest to largest
based upon the value of the lower confidence bound, we can approximately determine each
chemical’s contribution to the percentiles of the LP ratio mixture frequency distribution.
Urethane and 3-hydroxyxanthine are the largest contributors to the lower percentiles of the
mixture frequency distribution. Conversely, MNU and the DMBA female rat datasets are the
largest contributors to the highest percentiles of the mixture frequency distribution. The male rat
DMBA dataset and the DMN dataset (also in male rats) comprise the middle area of the
distribution.
Deleted: ASF
Deleted: Method 1:
Deleted: ASF
Deleted: Method
Deleted: 1
Deleted: ASF
Deleted: ASF
Deleted: October

SRP Draft
In Utero and Early Life Cancer A-35 December 2008 Susceptibility: Age Sensitivity Measures OEHHA RCHAB
Figure C-3a. Juvenile LP Ratio Mixture Frequency Distribution – Equally Weighted Chemicals, Equally Weighted Studies (Method 1)
Alternative Weighting: Chemicals Equally Weighted and Within Each Chemical Inverse-
Variance Weighting of Studies.
Figure C-3b shows the juvenile LP ratio mixture frequency distribution generated using the
alternative weighting method whereby each of the LP ratio distributions available for a chemical
is sampled based upon an inverse-variance weighting scheme (i.e., the likelihood that an LP ratio
distribution is sampled is proportional to 1/var(log[lp ratio]) (Method 2). The frequency
distribution is bi-modal, with modes at 1.57 and 2.08. The largest peak of the distribution is an
LP ratio value of 1.57. This LP ratio distribution is practically identical to the LP ratio
distribution derived via Method 1.
Undefined 0.01 0.1 1 10 100 1000 Infinity LP Ratio
Formatted: Font: Not Bold
Deleted: Method 1
Deleted: ASF
Deleted: Method 2
Deleted: ASF
Deleted: ASF
Deleted: ASF
Deleted: ASF
Deleted: October
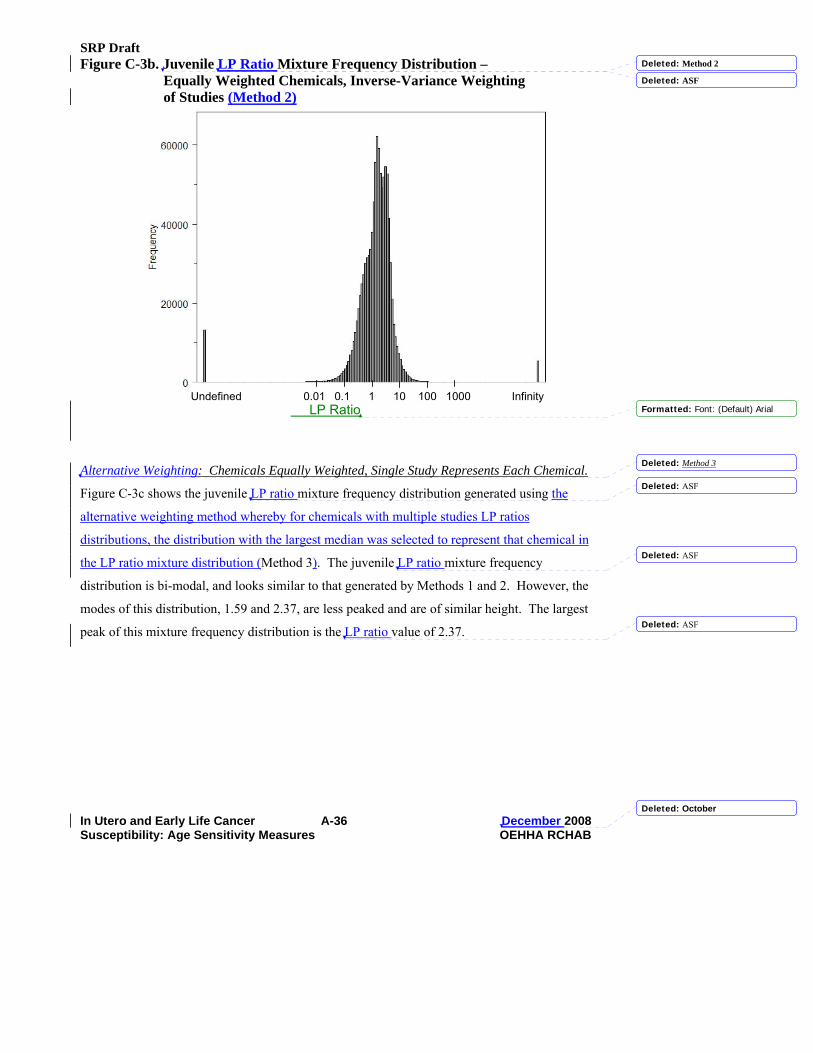
SRP Draft
In Utero and Early Life Cancer A-36 December 2008 Susceptibility: Age Sensitivity Measures OEHHA RCHAB
Figure C-3b. Juvenile LP Ratio Mixture Frequency Distribution – Equally Weighted Chemicals, Inverse-Variance Weighting of Studies (Method 2)
Alternative Weighting: Chemicals Equally Weighted, Single Study Represents Each Chemical.
Figure C-3c shows the juvenile LP ratio mixture frequency distribution generated using the
alternative weighting method whereby for chemicals with multiple studies LP ratios
distributions, the distribution with the largest median was selected to represent that chemical in
the LP ratio mixture distribution (Method 3). The juvenile LP ratio mixture frequency
distribution is bi-modal, and looks similar to that generated by Methods 1 and 2. However, the
modes of this distribution, 1.59 and 2.37, are less peaked and are of similar height. The largest
peak of this mixture frequency distribution is the LP ratio value of 2.37.
Undefined 0.01 0.1 1 10 100 1000 Infinity LP Ratio Formatted: Font: (Default) Arial
Deleted: Method 2
Deleted: ASF
Deleted: Method 3
Deleted: ASF
Deleted: ASF
Deleted: ASF
Deleted: October

SRP Draft
In Utero and Early Life Cancer A-37 December 2008 Susceptibility: Age Sensitivity Measures OEHHA RCHAB
Figure C-3c. Juvenile LP Ratio Mixture Frequency Distribution - Equally Weighted Chemicals, Single Study Represents Each Chemical (Method 3)
The mean, and certain percentiles for each method are provided in Table C-3. The juvenile LP
ratio and ASF mixture cumulative distributions derived via Method 1 are nearly
indistinguishable from the mixture cumulative distributions derived via Method 2. The
comparative length of the boxplots and their associated 90% confidence intervals between the
DMBA exposed male and female rat bioassay studies (shown in Figure 14 of the main text) are
similar such that the inverse-variance weighting method produces a nearly identical LP ratio ad
ASF mixture distributions in comparison to Method 1. Method 3 results in greater differences in
the LP ratio and ASF mixture distributions as compared to Methods 1 and 2 because the female
DMBA rat LP ratio (and ASF) distribution is solely being sampled to represent the chemical
DMBA. The female DMBA rat LP ratio distribution consists of LP ratio values that are entirely
above unity. The difference observed is reflective of the greater sensitivity of female rats to
mammary (i.e., breast) cancer during the juvenile period.
Undefined 0.01 0.1 1 10 100 1000 Infinity
LP Ratio Formatted: Font: (Default) Arial
Deleted: Method 3
Deleted: ASF
Deleted: October

SRP Draft
In Utero and Early Life Cancer A-38 December 2008 Susceptibility: Age Sensitivity Measures OEHHA RCHAB
Table C-3. Juvenile LP Ratio and ASF Mixture Distribution Statistics by Method
LP Ratio ASF Statistics Method 1 Method 2 Method 3 Method 1 Method 2 Method 3
Mean* 2.63 2.71 3.49 7.10 7.32 9.42 Percentiles
5th 0.20 0.20 0.20 0.54 0.54 0.54 10th 0.34 0.34 0.36 0.92 0.92 0.97 20th 0.60 0.61 0.69 1.62 1.65 1.86 30th 0.93 0.94 1.16 2.51 2.54 3.13 40th 1.31 1.33 1.58 3.54 3.59 4.27 50th 1.67 1.68 2.03 4.51 4.54 5.48 60th 2.10 2.13 2.69 5.67 5.75 7.26 70th 2.77 2.80 3.44 7.48 7.56 9.29 80th 3.57 3.62 4.43 9.64 9.77 11.96 90th 4.96 5.04 6.74 13.39 13.61 18.20 95th 7.29 7.46 10.16 19.68 20.14 27.43
* Calculated excluding large values above the 99th percentile.
Deleted: October

SRP Draft
In Utero and Early Life Cancer A-39 December 2008 Susceptibility: Age Sensitivity Measures OEHHA RCHAB
Appendix D DEN Case Study: Cancer Potency Distributions for DEN Single—
Lifestage Exposure Experiments and Sensitivity Analyses
DEN (diethyl-N-nitrosoamine) cancer potency distribution statistics derived from cancer
bioassay single-lifestage exposure experiments conducted in mice exposed to DEN during either
the prenatal, postnatal, or juvenile lifestage are presented here. Table D1 presents the cancer
potency distributions and study details for the prenatal exposure datasets. Table D2 presents the
cancer potency distributions and study details for the postnatal exposure datasets. Table D3
presents the cancer potency distributions and study details for the juvenile exposure datasets.
The remainder of this appendix presents the detailed findings for the LPj ratio and ASFj cumulative distribution functions generated for the prenatal and postnatal lifestages from the DEN single-lifestage exposure experiments in mice. As described in the Methods section, an overall distribution of the logarithm of potencies was created for each lifestage. This was accomplished via Monte Carlo methods, by sampling from each of the individual (log) potency distributions derived for each experiment for that exposure period equally. Sensitivity analyses were also conducted, employing alternative sampling methods to create the potency distribution for a given lifestage. One alternative method truncated each individual potency distribution at the fifth and ninety-fifth percentiles prior to creating the equally weighted potency mixture distribution. A second alternative method sampled from the potency distributions based upon weights equal to the computed inverse-variance of each (logarithm) potency distribution. That is, the variance was calculated for the distribution of the logarithm of the q1, Var[log q1]. The likelihood that an q1 is sampled is proportional to 1/Var(log[q1]). A third alternative method sampled from the potency distributions based upon weights equal to the computed interquartiles (25th and 75th percentiles) of each (logarithm) potency distribution. The likelihood that an q1 is sampled is proportional to 1/log(q1 75) - log(q1 25)). Potency mixture distributions for each lifestage were obtained using each of these methods. The LPj ratio and ASFj distributions computed using potency mixture distributions derived via the various sampling methods are presented.
Formatted: Subscript
Formatted: Subscript
Formatted: Subscript
Formatted: Subscript
Formatted: Subscript
Formatted: Subscript
Formatted: Font: Italic, Subscript
Formatted: Subscript
Formatted: Font: Italic, Subscript
Formatted: Subscript
Formatted: Subscript
Deleted: N-nitrosodiethylamine
Deleted: age window
Deleted: ¶¶
Deleted: October

SRP Draft
In Utero and Early Life Cancer A-40 December 2008 Susceptibility: Age Sensitivity Measures OEHHA RCHAB
Table D1. DEN Prenatal Mouse Studies: Cancer Potency Estimates in Units (cumulative mg/kg-bw)-1
Reference Strain Gender Mean SD 5th percentile
25th percentile
50th percentile
75th percentile
95th percentile
Female (540)a 0.0793739 0.0147744 0.0558226 0.0690785 0.0788648 0.0891974 0.10467
Female (650) a 0.00135364 0.00149944 0 0.000151185 0.00091793 0.00200131 0.00440449
Male (461) a 0.138321 0.0511987 0.0596149 0.101144 0.134968 0.171184 0.229449
Anderson et al. (1989) C3H/HeN
Male (644) a 0.00411408 0.00501051 0 0.000575143 0.00236785 0.0054626 0.0151794
Female 0.239892 0.067558 0.132634 0.192885 0.236059 0.283579 0.359286 Mohr and Althoff (1965) NMRI
Male 0.187186 0.0701371 0.0756144 0.137731 0.18516 0.233584 0.306676
Female 0.00667806 0.00582567 0 0.00240222 0.00513474 0.00941687 0.0187249 Vesselinovitch
(1983) B6C3F1 Male 0.00952546 0.00812867 0 0.00313266 0.00792549 0.0140185 0.0251028
a Day of sacrifice.
Deleted: October

SRP Draft
In Utero and Early Life Cancer A-41 December 2008 Susceptibility: Age Sensitivity Measures OEHHA RCHAB
Table D2. DEN Postnatal Mouse Studies: Cancer Potency Estimates in Units (cumulative mg/kg-bw)-1
Reference Strain Gender Mean SD 5th percentile
25th percentile
50th percentile
75th percentile
95th percentile
Boberg et al. (1983) B6C3F1 Male 48.3648 14.391 28.9842 38.0081 46.0943 56.3092 75.2761
B6C3F1 Male 17.9418 4.73622 11.1826 14.5018 17.3425 20.7377 26.8706
22.9791 7.17883 13.3745 17.8596 21.7639 26.8271 36.8345 Drinkwater and Ginsler (1986)
C3H/HeJ Male 2.68143 0.555517 1.82759 2.28691 2.63839 3.03852 3.65828
Lai et al. (1985) B6C3F2 Male 12.8913 2.39873 9.27649 11.1601 12.6851 14.41 17.2813 Female 1.41599 0.285257 0.978519 1.21049 1.39454 1.59902 1.93235 Rao and
Vesselinovitch (1973)
B6C3F1 Male 2.30206 0.661882 1.43057 1.82508 2.18762 2.65531 3.542
Female 0.575921 0.131105 0.37814 0.481996 0.565362 0.65859 0.810561 Turusov et al.
(1973) CF-1 Male 0.830932 0.174098 0.565934 0.707333 0.818634 0.941348 1.13883
Female (Day 1)a 0.589447 0.062358 0.491627 0.545742 0.586343 0.63034 0.697702
Male (Day 1) a 1.03983 0.148035 0.808426 0.93473 1.03146 1.13696 1.29788
Female (Day 15)b 0.453917 0.051127 0.374289 0.417738 0.451081 0.48722 0.543127
Vesselinovitch et al. (1984) B6C3F1
Male (Day 15) b 0.894762 0.115637 0.717843 0.81268 0.887008 0.968949 1.09932
Deleted: October

SRP Draft
In Utero and Early Life Cancer A-42 December 2008 Susceptibility: Age Sensitivity Measures OEHHA RCHAB
Table D2. Continued. DEN Postnatal Mouse Studies: Cancer Potency Estimates in Units (cumulative mg/kg-bw)-1
Reference Strain Gender Mean SD 5th
percentile 25th
percentile 50th
percentile 75th
percentile 95th
percentile Female
(Day 1) a 0.641045 0.111376 0.469409 0.562094 0.634021 0.712722 0.837305
Male (Day 1) a 1.11429 0.173993 0.835839 0.993194 1.10931 1.22972 1.41043
Female (Day 15) b 0.303322 0.050107 0.224424 0.267995 0.300956 0.336305 0.390135
Vesselinovitch et al. (1984) C3AF1
Male (Day 15) b 0.649307 0.106642 0.480839 0.574691 0.644526 0.719069 0.834195
Vesselinovitch (1980) B6C3F1 Male 3.07401 0.452323 2.36812 2.75378 3.04908 3.3669 3.88832
a Mice were dosed on day 1 of life. b Mice were dosed on day 15 of life.
Deleted: October

SRP Draft
In Utero and Early Life Cancer A-43 December 2008 Susceptibility: Age Sensitivity Measures OEHHA RCHAB
Table D3. DEN Juvenile Mouse Studies: Cancer Potency Estimates in Units (cumulative mg/kg-bw)-1
Reference Strain Gender Mean SD 5th percentile
25th percentile
50th percentile
75th percentile
95th percentile
Rao and Vesselinovitch (1973)
B6C3F1 Male 0.093411 0.031799 0.048166 0.070136 0.089942 0.113182 0.15094
Female 0.267868 0.049742 0.191397 0.232495 0.26428 0.299789 0.356424
B6C3F1
Male 0.203009 0.029221 0.157292 0.182313 0.201531 0.22207 0.254173
Female 0.555707 0.178219 0.313719 0.427389 0.527989 0.654242 0.88766
Vesselinovitch et al. (1984)
C3AF1
Male 0.40558 0.094585 0.268191 0.337805 0.395187 0.462985 0.579307
Deleted: October
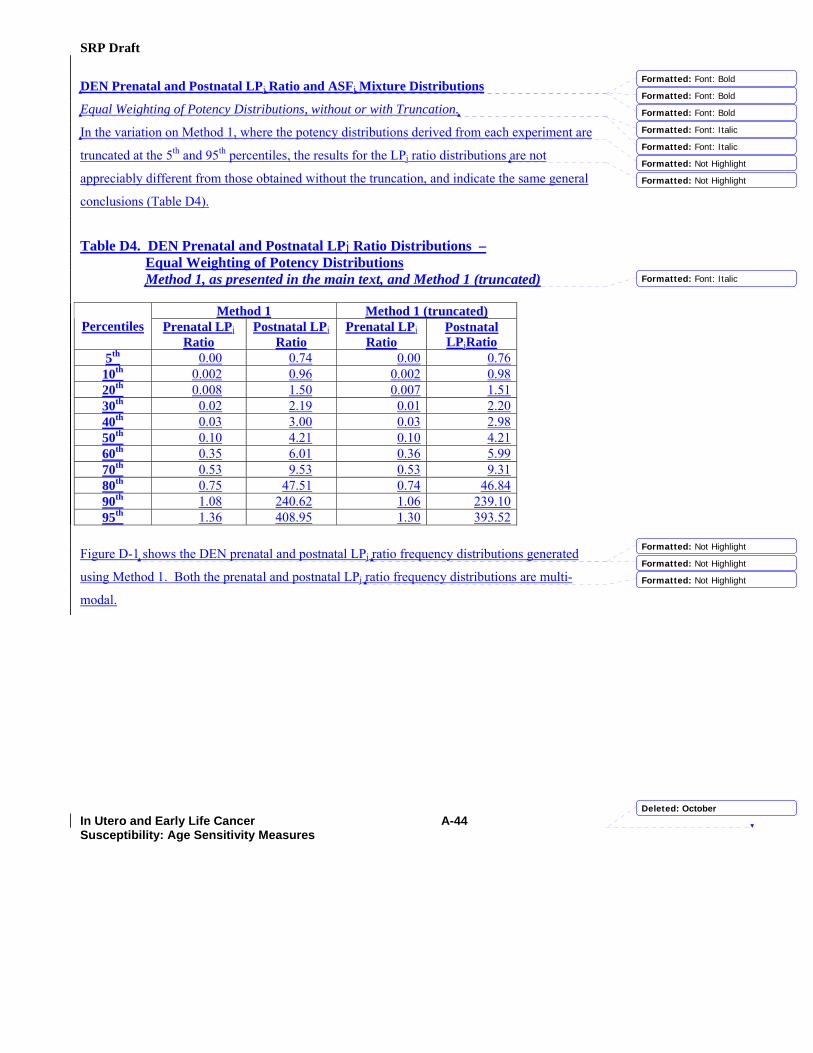
SRP Draft
In Utero and Early Life Cancer A-44Susceptibility: Age Sensitivity Measures
DEN Prenatal and Postnatal LPj Ratio and ASFj Mixture Distributions
Equal Weighting of Potency Distributions, without or with Truncation.
In the variation on Method 1, where the potency distributions derived from each experiment are
truncated at the 5th and 95th percentiles, the results for the LPj ratio distributions are not
appreciably different from those obtained without the truncation, and indicate the same general
conclusions (Table D4).
Table D4. DEN Prenatal and Postnatal LPj Ratio Distributions – Equal Weighting of Potency Distributions Method 1, as presented in the main text, and Method 1 (truncated)
Method 1 Method 1 (truncated)
Percentiles Prenatal LPj Ratio
Postnatal LPj Ratio
Prenatal LPj Ratio
Postnatal LPjRatio
5th 0.00 0.74 0.00 0.7610th 0.002 0.96 0.002 0.9820th 0.008 1.50 0.007 1.5130th 0.02 2.19 0.01 2.2040th 0.03 3.00 0.03 2.9850th 0.10 4.21 0.10 4.2160th 0.35 6.01 0.36 5.9970th 0.53 9.53 0.53 9.3180th 0.75 47.51 0.74 46.8490th 1.08 240.62 1.06 239.1095th 1.36 408.95 1.30 393.52
Figure D-1 shows the DEN prenatal and postnatal LPj ratio frequency distributions generated
using Method 1. Both the prenatal and postnatal LPj ratio frequency distributions are multi-
modal.
Deleted: October
Formatted: Font: Bold
Formatted: Font: Bold
Formatted: Font: Italic
Formatted: Font: Italic
Formatted: Not Highlight
Formatted: Font: Bold
Formatted: Font: Italic
Formatted: Not Highlight
Formatted: Not Highlight
Formatted: Not Highlight
Formatted: Not Highlight
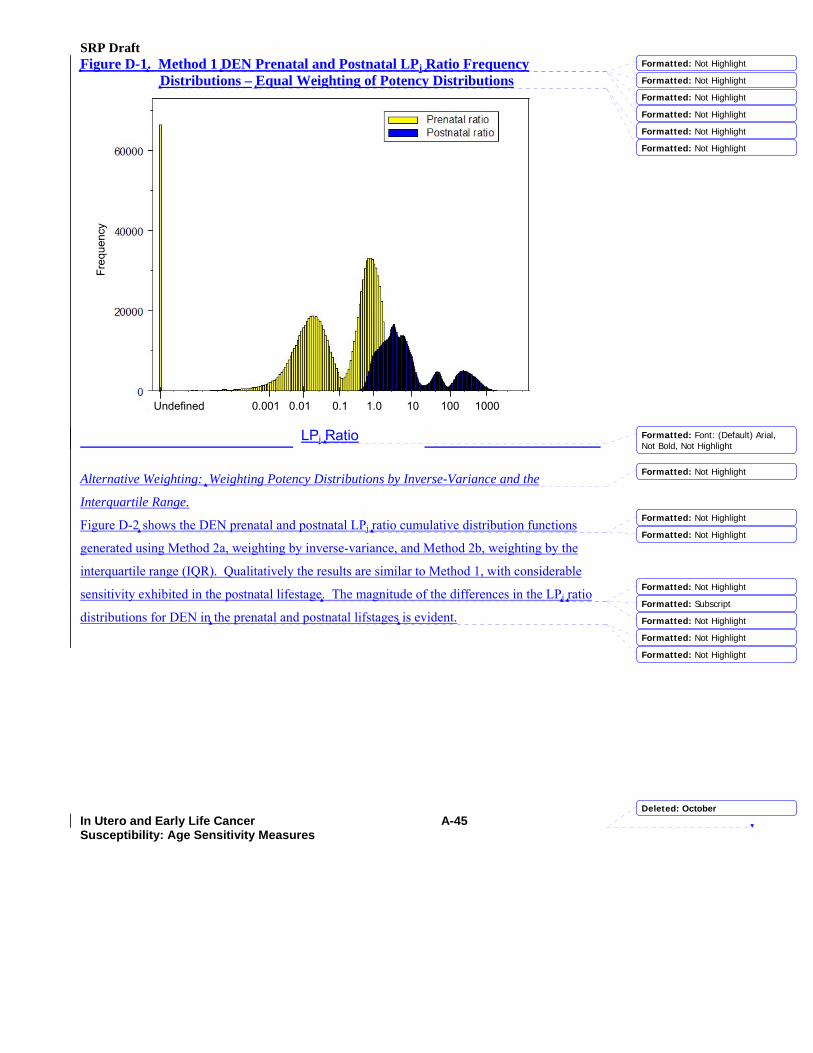
SRP Draft
In Utero and Early Life Cancer A-45Susceptibility: Age Sensitivity Measures
Figure D-1. Method 1 DEN Prenatal and Postnatal LPj Ratio Frequency Distributions – Equal Weighting of Potency Distributions
Alternative Weighting: Weighting Potency Distributions by Inverse-Variance and the
Interquartile Range.
Figure D-2 shows the DEN prenatal and postnatal LPj ratio cumulative distribution functions
generated using Method 2a, weighting by inverse-variance, and Method 2b, weighting by the
interquartile range (IQR). Qualitatively the results are similar to Method 1, with considerable
sensitivity exhibited in the postnatal lifestage. The magnitude of the differences in the LPj ratio
distributions for DEN in the prenatal and postnatal lifstages is evident.
Freq
uenc
y
LPj Ratio
Undefined 0.001 0.01 0.1 1.0 10 100 1000
Deleted: October
Formatted: Not Highlight
Formatted: Not Highlight
Formatted: Not Highlight
Formatted: Not Highlight
Formatted: Not Highlight
Formatted: Font: (Default) Arial,Not Bold, Not Highlight
Formatted: Not Highlight
Formatted: Not Highlight
Formatted: Not Highlight
Formatted: Not Highlight
Formatted: Subscript
Formatted: Not Highlight
Formatted: Not Highlight
Formatted: Not Highlight
Formatted: Not Highlight

SRP Draft
In Utero and Early Life Cancer A-46Susceptibility: Age Sensitivity Measures
Figure D-2. Methods 2a and 2b DEN Prenatal and Postnatal LPj Ratio Cumulative Distribution Functions – Inverse-Variance and Interquartile Weighting of Potency Distributions
The percentiles for the DEN prenatal and postnatal LPj ratio distributions are provided in Table
D5a, and the percentiles for the DEN prenatal and postnatal ASF distributions are provided in
Table D5b. With inverse-variance weighting, slightly less than 89% of the prenatal LPj ratio
distribution lies below the value of one. Although not statistically significant, the distributional
statistics suggest that mice exposed during the prenatal lifestage are less prone to the tumorigenic
effects of DEN as compared to those exposed as juveniles. For the postnatal LPj ratio
distribution, more than 94% of the distribution is greater than unity under Method 2a (inverse-
variance weighting), indicating that mice exposed during the postnatal lifestage are more prone
to the tumorigenic effects of DEN than those exposed as juveniles. The distributional
LPj Ratio
Deleted: October
Formatted: Not Highlight
Formatted: Not Highlight
Formatted: Not Highlight
Formatted: Not Highlight
Formatted: Not Highlight
Formatted: Font: (Default) Arial,Not Bold, Not Highlight
Formatted: Not Highlight
Formatted: Not Highlight
Formatted: Not Highlight
Formatted: Not Highlight
Formatted: Not Highlight
Formatted: Not Highlight
Formatted: Subscript
Formatted: Not Highlight
Formatted: Not Highlight
Formatted: Not Highlight
Formatted: Not Highlight
Formatted: Not Highlight

SRP Draft
In Utero and Early Life Cancer A-47Susceptibility: Age Sensitivity Measures
differences in cancer risk (as compared to juveniles) between DEN exposures occurring during
the prenatal lifestage versus the postnatal lifestage are quite evident.
Table D5a. Method 2 DEN Prenatal and Postnatal LPj Ratio Distributions – Distributional Weighting of Potency Distributions
Method 2a – Inverse Variance Weighting
Method 2b - Interquartile Weighting Percentiles Prenatal LPj
Ratio Postnatal LPj
Ratio Prenatal LPj
Ratio Postnatal LPj
Ratio 5th 0.03 0.93 0.005 0.85
10th 0.21 1.49 0.01 1.19 20th 0.27 1.99 0.18 1.77 30th 0.32 2.34 0.27 2.24 40th 0.36 2.74 0.34 2.73 50th 0.41 3.31 0.43 3.48 60th 0.47 4.18 0.55 4.71 70th 0.58 5.27 0.71 6.42 80th 0.75 7.36 0.91 11.02 90th 1.04 37.80 1.20 106.70 95th 1.30 154.34 1.45 287.68
Table D5b. Method 2 DEN Prenatal and Postnatal ASFj Distributions – Distributional Weighting of Potency Distributions
Method 2a – Inverse Variance Weighting
Method 2b - Interquartile Weighting Percentiles
Prenatal ASFj Postnatal ASFj Prenatal ASFj Postnatal ASFj 5th 0.09 2.69 0.02 2.47
10th 0.62 4.33 0.03 3.45 20th 0.81 5.78 0.54 5.13 30th 0.95 6.80 0.81 6.50 40th 1.08 7.94 1.02 7.92 50th 1.23 9.60 1.29 10.09 60th 1.42 12.12 1.65 13.66 70th 1.73 15.27 2.13 18.62 80th 2.25 21.35 2.73 31.96 90th 3.13 109.62 3.60 309.43 95th 3.90 447.59 4.35 834.27
Deleted: October
Formatted: Not Highlight
Formatted: Not Highlight
Formatted: Not Highlight
Formatted: Not Highlight
Formatted: Not Highlight
Formatted: Font: 13 pt, Bold
Formatted: Font: 13 pt, Bold, NotSuperscript/ Subscript
Formatted: Not Highlight
Formatted: Not Highlight
Formatted: Not Highlight
Formatted: Not Highlight
Formatted: Not Highlight
Formatted: Not Highlight
Formatted: Not Highlight
Formatted: Not Highlight
Formatted: Not Highlight
Formatted: Not Highlight
Formatted: Not Highlight
Formatted: Not Highlight
Formatted: Not Highlight
Formatted: Not Highlight
Formatted: Not Highlight
Formatted: Not Highlight
Formatted: Not Highlight
Formatted: Not Highlight
Formatted: Not Highlight
Formatted: Not Highlight
Formatted: Not Highlight
Formatted: Subscript
Formatted: Not Highlight
Formatted: Not Highlight
Formatted: Not Highlight
Formatted: Font: Bold
Formatted: Not Highlight
Formatted: Not Highlight
Formatted: Not Highlight
Formatted: Not Highlight
Formatted: Not Highlight

SRP Draft
In Utero and Early Life Cancer A-48 December 2008 Susceptibility: Age Sensitivity Measures OEHHA RCHAB
Appendix E ENU Case Study: Cancer Potency Distributions for ENU Single-
Lifestage Exposure Experiments, and Sensitivity Analyses ENU (N-ethyl-N-nitrosourea) cancer potency distribution statistics derived from cancer bioassay
single-lifestage exposure experiments conducted in mice exposed to ENU during either the
prenatal, postnatal, or juvenile lifestage are presented here. Table E1 presents the cancer potency
distributions and study details for the prenatal exposure datasets. Table E2 presents the cancer
potency distributions and study details for the postnatal exposure datasets. Table E3 presents the
cancer potency distributions and study details for the juvenile exposure datasets.
The remainder of this appendix presents the detailed findings for the LPj ratio and ASFj
cumulative distribution functions generated for the prenatal and postnatal lifestages from the
ENU single-lifestage exposure experiments in mice. As described in the Methods section, an
overall distribution of the logarithm of potencies was created for each lifestage. This was
accomplished via Monte Carlo methods, by sampling from each of the individual (log) potency
distributions derived for each experiment for that exposure period equally. Sensitivity analyses
were also conducted, employing alternative sampling methods to create the potency distribution
for a given lifestage. One alternative method truncated each individual potency distribution at
the fifth and ninety-fifth percentiles prior to creating the equally weighted potency mixture
distribution. A second alternative method sampled from the potency distributions based upon
weights equal to the computed inverse-variance of each (logarithm) potency distribution. That
is, the variance was calculated for the distribution of the logarithm of the q1, Var[log q1]. The
likelihood that an q1 is sampled is proportional to 1/Var(log[q1]). A third alternative method
sampled from the potency distributions based upon weights equal to the computed interquartiles
(25th and 75th percentiles) of each (logarithm) potency distribution. The likelihood that an q1 is
sampled is proportional to 1/log(q1 75) - log(q1 25)). Potency mixture distributions for each
lifestage were obtained using each of these methods. The LPj ratio and ASFj distributions
computed using potency mixture distributions derived via the various sampling methods are
presented.
Deleted: age window
Deleted: October

SRP Draft
In Utero and Early Life Cancer A-49 December 2008 Susceptibility: Age Sensitivity Measures OEHHA RCHAB
Table E1. ENU Prenatal Mouse Studies: Cancer Potency Estimates in Units (cumulative mg/kg-bw)-1
a Day of dosing in gestation, where day of birth is designated as day 1.
Study Strain Gender Mean SD ---------------------------------Percentiles-------------------------------- 5th 25th 50th 75th 95th
Female 1.52277 0.531149 0.796624 1.14448 1.44501 1.81488 2.52135 AKR/J x SWR/J Male 0.788833 0.242592 0.408852 0.617535 0.777224 0.946775 1.21021
Female 6.40048 1.26518 4.48233 5.50555 6.30745 7.19692 8.64127 Diwan et al. (1974)
SWR/J x AKR/J Male 8.23676 2.02853 5.41389 6.7886 7.96423 9.37737 12.0313
Female (Day -7)a 2.75745 0.780679 1.70604 2.20068 2.63687 3.17936 4.26637
Female (Day -6) a 2.73481 0.777314 1.68615 2.1712 2.60713 3.15855 4.24545
Female (Day -5) a 2.39602 0.773729 1.38175 1.83596 2.26666 2.8147 3.8993
Female (Day -4) a 2.79589 0.781762 1.74426 2.23081 2.66744 3.2193 4.3065
Kauffman (1976) Swiss
Female (Day -3) a 2.53857 0.770214 1.50408 1.98352 2.41683 2.95218 3.99008
Female (Day -10) a 0.042928 0.00468297 0.0354941 0.0396959 0.0427621 0.0460137 0.0509013
Female (Day -8) a 0.0886033 0.00963707 0.0736767 0.0817998 0.0880656 0.0948531 0.105386
Female (Day -6) a 0.136846 0.0191498 0.107902 0.123231 0.135315 0.148804 0.171023
Female (Day -4) a 0.083219 0.0122441 0.0645201 0.0744767 0.0823669 0.0910178 0.104993
Male (Day -10) a 0.0508204 0.00566404 0.041823 0.0468659 0.0506208 0.0545794 0.0604567
Male (Day -8) a 0.127622 0.0154249 0.103632 0.116711 0.126869 0.137618 0.154515
Male (Day -6) a 0.286018 0.0598357 0.204919 0.243175 0.277137 0.319002 0.398503
B6C3F1
Male (Day -4) a 0.165365 0.0228038 0.131436 0.149108 0.16331 0.179562 0.206382
Female (Day -10) a 0.0235324 0.00539875 0.0151785 0.0197164 0.0232224 0.0270231 0.0329388
Female (Day -8) a 0.111417 0.0169991 0.0860396 0.0992914 0.109892 0.121913 0.141993
Female (Day -6) a 0.121747 0.0240692 0.0860168 0.104546 0.119536 0.13667 0.165114
Female (Day -4) a 0.0729087 0.00911406 0.0587817 0.0664352 0.0723775 0.078822 0.0889698
Male (Day -10) a 0.0356864 0.00744729 0.0242335 0.0304194 0.0352127 0.0404608 0.0488031
Male (Day -8) a 0.167691 0.0313038 0.122511 0.14528 0.164215 0.186164 0.225405
Male (Day -6) a 0.241567 0.0548256 0.167721 0.202249 0.233152 0.271325 0.345658
Vesselinovitch et al. (1977)
C3B6F1
Male (Day -4) a 0.083293 0.00962997 0.068251 0.0765158 0.0828024 0.0895821 0.0999465
Female 0.0188286 0.00433908 0.0123229 0.0156683 0.0184721 0.0215981 0.0266903 Vesselinovitch (1983) B6C3F1
Male 0.0311922 0.00595895 0.0220985 0.0269647 0.0307819 0.0350559 0.041544
Male & Female (Day -8)a 0.191795 0.0154062 0.166844 0.181108 0.191371 0.202129 0.217871
Male & Female (Day -7) a 0.181807 0.0165413 0.155072 0.170363 0.181426 0.192894 0.209776 Wiggenhauser and Schmahl (1987) NMRI
Male & Female (Day -6) a 0.153851 0.0149143 0.129937 0.143407 0.153387 0.16381 0.179375
Deleted: October

SRP Draft
In Utero and Early Life Cancer A-50 December 2008 Susceptibility: Age Sensitivity Measures OEHHA RCHAB
Table E2. ENU Postnatal Mouse Studies: Cancer Potency Estimates in Units (cumulative mg/kg-bw)-1
Study Strain Gender Mean SD ---------------------------------Percentiles-------------------------------- 5th 25th 50th 75th 95th
Female (405)a 0.401602 0.0714822 0.295997 0.350593 0.394317 0.445627 0.531848
Female (451) a 0.190949 0.0332242 0.139564 0.16738 0.18888 0.212447 0.249345
Male (342) a 0.705296 0.160744 0.46968 0.589517 0.689687 0.803716 0.997279 Anderson et al. (1989) C3H/HeNCr
MTV
Male (397) a 0.409096 0.0684954 0.300275 0.361199 0.406761 0.454284 0.526448
C3H/HeJ Male 1.87256 0.619931 1.04439 1.42364 1.7664 2.21011 3.03312 Drinkwater and Ginsler (1986)
C57BL/6J Male 0.193632 0.0706384 0.0924212 0.141821 0.185241 0.236855 0.326457
Female 0.488979 0.113488 0.321961 0.407412 0.47754 0.558629 0.696155 Naito et al. (1982) A/He
Male 0.53121 0.106117 0.369563 0.455872 0.524035 0.598363 0.71904
Female 0.453666 0.0963253 0.303665 0.384955 0.448654 0.516608 0.622827 Pereira et al. (1985) CD1
Male 0.650342 0.167153 0.37248 0.522933 0.660456 0.772229 0.914794
Female 0.0511349 0.00593372 0.04167 0.0469975 0.0509134 0.0550801 0.061308
Female 0.0813521 0.010729 0.0648204 0.0737127 0.0806609 0.0882508 0.100297
Male 0.0819858 0.010706 0.0654327 0.0744036 0.0812874 0.088867 0.100923 Schmahl (1988) NMRI
Male 0.113765 0.016685 0.0891173 0.101707 0.11222 0.124072 0.143985
A Male & Female 0.102345 0.0307605 0.0492138 0.0821283 0.103482 0.123574 0.151421
C57BL Male & Female 0.246532 0.0422712 0.180748 0.217317 0.244314 0.273666 0.32047
DBAF Male & Female 0.123967 0.0202948 0.090089 0.110854 0.12422 0.13749 0.156851 Searle and Jones (1976)
IF Male & Female 0.118889 0.0283388 0.0747125 0.0992445 0.11737 0.137096 0.168199
Female (Day 1)b 0.0901191 0.0182086 0.0653432 0.0770816 0.0873993 0.100164 0.124208
Female (Day 15)c 0.0555416 0.00590128 0.0463567 0.0513833 0.0552225 0.0593717 0.0658145
Male (Day 1) b 0.0784357 0.0094572 0.0638592 0.0718073 0.0778351 0.0844925 0.0950637 B6C3F1
Male (Day 15) c 0.115803 0.0193859 0.0886015 0.102078 0.113324 0.126753 0.151878
Female 0.0162293 0.00195763 0.0130923 0.0148687 0.0161727 0.0175495 0.0195461
Male (Day 1) b 0.0478472 0.00952346 0.03385 0.0410128 0.0468717 0.0537055 0.0652326
Vesselinovitch et al. (1974)
C3AF1
Male (Day 15) c 0.0337552 0.00545562 0.0254094 0.0298703 0.0333879 0.0372465 0.0434698
Female 0.0325201 0.00615214 0.0229783 0.0281148 0.0321294 0.0365301 0.0435769 Vesselinovitch (1983) B6C3F1
Male 0.0695924 0.0120803 0.0509478 0.0609427 0.0687729 0.0774048 0.0913846 a Day of sacrifice. b Mice were dosed on day 1 of life. c Mice were dosed on day 15 of life.
Deleted: October

SRP Draft
In Utero and Early Life Cancer A-51 December 2008 Susceptibility: Age Sensitivity Measures OEHHA RCHAB
Table E3. ENU Juvenile Mouse Studies: Cancer Potency Estimates in Units (cumulative mg/kg-bw)-1
Reference Strain Gender Mean SD ---------------------------------Percentiles-------------------------------- 5th 25th 50th 75th 95th
Female 0.00126335 0.000460445 0.000605155 0.000927673 0.00121074 0.00153788 0.00212734 Vesselinovitch et al. (1973) B6C3F1
Male 0.00337468 0.000804246 0.00213171 0.00279749 0.00331756 0.00389027 0.00481319
Female 0.0463117 0.00618634 0.0367588 0.0419302 0.045902 0.0503072 0.0572276 B6C3F1
Male 0.0441913 0.00498978 0.0363954 0.04067 0.0439454 0.0474287 0.0529056
Female 0.00579571 0.00122561 0.00380638 0.00495406 0.00577705 0.00661704 0.00784915 Vesselinovitch et al. (1974)
C3AF1 Male 0.00713611 0.00130036 0.00503552 0.00623303 0.00711547 0.00800999 0.0093149
Female 0.00451849 0.00192539 0.00183844 0.00309386 0.00425096 0.00566614 0.00819086 Vesselinovitch (1983) B6C3F1
Male 0.00886785 0.00285617 0.00458294 0.00681412 0.00858931 0.0106642 0.0139855
Deleted: October

SRP Draft
In Utero and Early Life Cancer A-52 December 2008 Susceptibility: Age Sensitivity Measures OEHHA RCHAB
ENU Prenatal and Postnatal LPj Ratio and ASFj Mixture Distributions
Equal Weighting of Potency Distributions, without or with Truncation.
In the variation on Method 1, where the potency distributions derived from each experiment are
truncated at the 5th and 95th percentiles, the results for the LPj ratio distributions are not
appreciably different from those obtained without the truncation, and indicate the same general
conclusions (Table E4).
Table E4. ENU Prenatal and Postnatal LPj Ratio Distributions – Equal Weighting of Potency Distributions Method 1, as presented in the main text, and Method1 (truncated)
Method 1 Method 1 (truncated) Percentiles Prenatal LPj Ratio
Postnatal LPj Ratio
Prenatal LPj Ratio
Postnatal LPj Ratio
5th 0.53 1.14 0.53 1.1810th 0.94 1.65 0.93 1.6820th 3.86 3.03 3.89 3.0030th 6.56 5.39 6.59 5.4540th 11.60 8.09 11.63 8.0750th 19.30 12.84 19.40 12.8160th 27.13 21.87 26.66 20.7670th 116.16 88.96 137.82 92.2780th 679.56 154.90 687.33 152.7890th 1266.12 325.80 1173.53 319.5395th 4381.63 519.75 4557.69 506.81
Figure E-1 shows the ENU prenatal and postnatal LPj ratio frequency distributions generated
using Method 1. Both the prenatal and postnatal LPj ratio frequency distributions are multi-
modal. The ENU postnatal LPj ratio distribution has a similar overall shape as the prenatal LPj
ratio distribution, with a shift to the left such that the values of the distribution are not as
extreme. The ENU postnatal LPj ratio distribution is more compact and lacks the most extreme
values observed in the rightmost tail of the prenatal LPj ratio distribution (Figure 21, in the main
text), although large values in the upper tails are evident (See also Table E4). Table E4 shows
the ENU LPj ratios calculated using Method 1 barely differ when the potency distributions are
truncated at the fifth and ninety-fifth percentiles to eliminate the extreme values, prior to
developing the mixture potency distributions.
Deleted: October
Formatted: Underline
Formatted: Line spacing: 1.5 lines
Formatted: Font: 13 pt
Formatted: Font: 13 pt, Italic
Formatted: Subscript
Formatted: Not Highlight
Formatted: Subscript
Formatted: Not Highlight
Formatted: Not Highlight
Formatted: Font: 12 pt, Not Bold,Italic
Formatted: Not Highlight
Formatted: Not Highlight
Formatted: Not Highlight
Formatted: Not Highlight
Formatted: Not Highlight
Formatted: Not Highlight
Formatted: Not Highlight
Formatted: Not Highlight

SRP Draft
In Utero and Early Life Cancer A-53 December 2008 Susceptibility: Age Sensitivity Measures OEHHA RCHAB
Figure E-1. Method 1 ENU Prenatal and Postnatal LPj Ratio Frequency Distributions – Equal Weighting of Potency Distributions
Alternative Weighting: Weighting Potency Distributions by Inverse-Variance and
Interquartile Range. The ENU prenatal and postnatal LPj ratio distributions computed by Method 2a and Method 2b
differ substantially from one another, as shown in Figure E-2. This is because each lifestage has
a grouping of experiments that have narrower confidence intervals than the remaining grouping
of experiments. Within each lifestage, those experiments with the narrowest confidence intervals
are given greater weight. Figure E-2 demonstrates that the differences observed between the
weighting methods is due to greater weight being assigned to these studies with the narrowest
confidence intervals via the inverse-variance weighting method compared to the interquartile
range weighting method.
Freq
uenc
y
LPj Ratio
0.1 1 10 100 1000 10000
Deleted: October
Formatted: Not Highlight
Formatted: Font: 13 pt, Bold,English (U.S.)
Formatted: Font: 13 pt, Bold,English (U.S.)
Formatted: Not Highlight
Formatted: Not Highlight
Formatted: Font: 13 pt, Bold,English (U.S.)
Formatted: Font: 13 pt, Bold,English (U.S.), Not Superscript/Subscript
Formatted: Font: 13 pt, Bold,English (U.S.)
Formatted: Not Highlight
Formatted: Font: 13 pt, Bold,English (U.S.), Not Superscript/Subscript
Formatted: Not Highlight
Formatted: Subscript
Formatted: Not Highlight
Formatted: Not Highlight
Formatted: Not Highlight
Formatted: Not Highlight
Formatted: Not Highlight
Formatted: Not Highlight

SRP Draft
In Utero and Early Life Cancer A-54 December 2008 Susceptibility: Age Sensitivity Measures OEHHA RCHAB
The ENU prenatal LPj ratio distributions computed via Method 2a and 2b have medians equal to
3.81 and 11.05, respectively. The ENU postnatal LPj ratio distributions computed via Method 2a
and 2b have medians equal to 0.55 and 7.24, respectively. Clearly, the inverse-variance
weighting results suggest less susceptibility from early life exposure to ENU than the
interquartile range weighting results. The inverse-variance weighting scheme tends to weigh the
studies with narrower distributions, and in the case of the ENU pre- and postnatal studies,
smaller potency values, considerably more heavily as compared to interquartile range weighting.
Both weighting methods clearly indicate greater inherent sensitivity of the prenatal lifestage to
ENU, which was also observed when studies were weighted equally (Method 1). The two
weighting methods (2a and 2b) yield strikingly different results for the postnatal lifestage,
however. Using inverse variance weighting, approximately half of the ENU postnatal LPj ratio
distribution is less than unity, indicating no substantial inherent sensitivity for the postnatal
compared to juvenile lifestage. With interquartile weighting, the 10th percentile is 1.04 and half
the distribution exceeds 7.0, indicating a strong postnatal sensitivity. The inverse variance
results are also substantially different to the results seen when all studies are equally sampled, as
shown in Method 1 above. However, the interquartile range weighting results are similar to
those obtained via Method 1 though slightly more moderate. Results from both Method 2a and
2b indicate that prenatal sensitivity is substantially greater than postnatal sensitivity.
Deleted: October
Formatted: Subscript
Formatted: Not Highlight
Formatted: Not Highlight
Formatted: Not Highlight
Formatted: Not Highlight
Formatted: Not Highlight
Formatted: Not Highlight
Formatted: Not Highlight
Formatted: Not Superscript/Subscript, Not Highlight
Formatted: Not Highlight
Formatted: Not Highlight
Formatted: Not Highlight
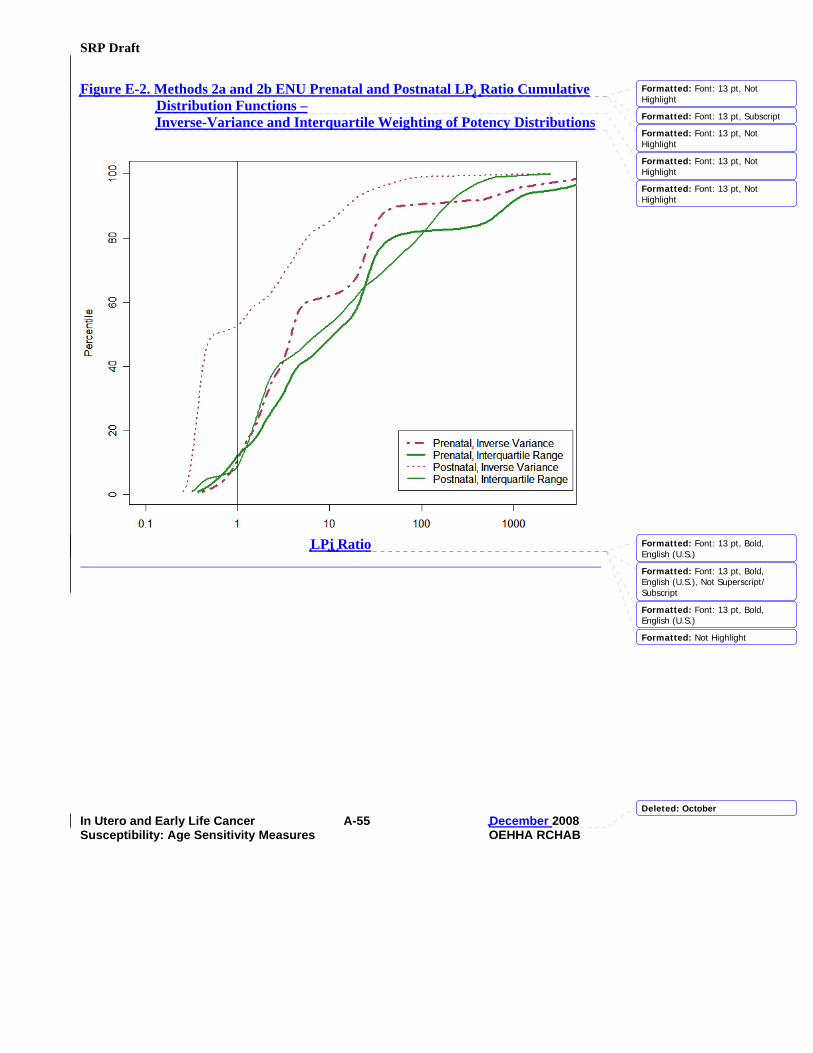
SRP Draft
In Utero and Early Life Cancer A-55 December 2008 Susceptibility: Age Sensitivity Measures OEHHA RCHAB
Figure E-2. Methods 2a and 2b ENU Prenatal and Postnatal LPj Ratio Cumulative Distribution Functions – Inverse-Variance and Interquartile Weighting of Potency Distributions
LPj Ratio
Deleted: October
Formatted: Font: 13 pt, NotHighlight
Formatted: Font: 13 pt, NotHighlight
Formatted: Font: 13 pt, NotHighlight
Formatted: Font: 13 pt, NotHighlight
Formatted: Font: 13 pt, Subscript
Formatted: Font: 13 pt, Bold,English (U.S.), Not Superscript/Subscript
Formatted: Font: 13 pt, Bold,English (U.S.)
Formatted: Not Highlight
Formatted: Font: 13 pt, Bold,English (U.S.)

SRP Draft
In Utero and Early Life Cancer A-56 December 2008 Susceptibility: Age Sensitivity Measures OEHHA RCHAB
Table 5a. Method 2 ENU Prenatal and Postnatal LPj Ratio Distributions – Distributional Weighting of Potency Distributions
Method 2a – Inverse Variance
Weighting Method 2b - Interquartile
Weighting Percentiles Prenatal LPj Ratio
Postnatal LPj Ratio
Prenatal LPj Ratio
Postnatal LPj Ratio
5th 0.74 0.29 0.61 0.47 10th 0.95 0.31 0.87 1.04 20th 1.45 0.35 1.75 1.43 30th 1.98 0.38 2.91 1.85 40th 2.93 0.42 4.55 2.69 50th 3.81 0.55 11.05 7.24 60th 5.45 1.72 20.97 17.05 70th 21.18 3.33 27.36 39.81 80th 27.75 5.61 47.64 91.56 90th 53.70 15.32 852.11 182.93 95th 940.28 27.92 2608.68 296.87
Table 5b. Method 2 ENU Prenatal and Postnatal ASFj Distributions – Distributional Weighting of Potency Distributions
Method 2a – Inverse Variance
Weighting Method 2b - Interquartile
Weighting Percentiles Prenatal ASFj Postnatal ASFj Prenatal ASFj Postnatal ASFj
5th 2.22 0.78 1.83 1.36 10th 2.85 0.84 2.61 3.02 20th 4.35 0.94 5.25 4.15 30th 5.94 1.03 8.73 5.37 40th 8.79 1.13 13.65 7.80 50th 11.43 1.48 33.15 21.00 60th 16.35 4.64 62.91 49.45 70th 63.54 8.99 82.08 115.45 80th 83.25 15.15 142.92 265.52 90th 161.1 41.36 2556.33 530.50 95th 2820.84 75.38 7826.04 860.92
Deleted: October
Formatted: Not Highlight
Formatted: Not Highlight
Formatted: Not Highlight
Formatted: Not Highlight
Formatted: Subscript, Not Highlight
Formatted: Not Highlight
Formatted: Not Highlight
Formatted: Subscript
Formatted: Font: 12 pt, Not Bold
Formatted: Not Highlight

SRP Draft
In Utero and Early Life Cancer A-57 December 2008 Susceptibility: Age Sensitivity Measures OEHHA RCHAB
Appendix F Early Life Across-Lifestage Exposure Studies of Two Non-
Genotoxic Carcinogens Early in life studies in which treatment group exposures crossed multiple lifestages were
excluded from the main analyses presented in this document, as across-lifestage exposures
preclude derivation of age-at-exposure sensitivity measures for specific early lifestages. Some
studies with early life across-lifestage exposures have been included in the analyses of Barton et
al. (2005), and can provide information on early life vs. later life sensitivity. This appendix
presents the lifestage potency (LP) ratio distribution statistics derived from analyses of
experiments conducted in mice with two non-genotoxic carcinogens: diphenylhydantoin
(Chhabra et al., 1993a) and polybrominated biphenyls (Chhabra et al., 1993ab). In these studies
separate groups of animals were exposed to either diphenylhydantoin or polybrominated
biphenyls across multiple “early life” lifestages (i.e., prenatal, postnatal and juvenile) or during
the adult lifestage. For the early lifestage exposure groups, exposures began prior to conception,
and continued throughout the prenatal, postnatal, and post-weaning periods, up to the age of
eight weeks.
Table F1 presents the LP ratio distributions and study details for these early life across-lifestage
datasets.
Deleted: Window
Deleted: exposure of a given exposure
Deleted: age windows
Deleted: window
Deleted: age windows
Deleted: window
Deleted: unadjusted early life age sensitivity factor (ASF)
Deleted: windows
Deleted: age window
Deleted: unadjusted early life ASF
Deleted: window
Deleted: October

SRP Draft
In Utero and Early Life Cancer A-58 December 2008 Susceptibility: Age Sensitivity Measures OEHHA RCHAB
Table F1. Across-Lifestage Exposure Studies: Estimated Lifestage Potency Ratios for Two Non-Genotoxic Chemicals
Chemical Reference Species Strain Gender Multi-site
Model para-
meters Mean Infinite
values 5th
percentile 25th
percentile 50th
percentile 75th
percentile 95th
percentile
Diphenylhydan-toin
Chhabra et al. (1993a) Mouse B6C3F1 Female No 2 2.14E+01 0.000% 2.46E+00 1.25E+01 2.00E+01 2.87E+01 4.42E+01
Female No 2 3.10E+00 0.000% 1.59E+00 2.36E+00 2.99E+00 3.72E+00 4.96E+00 Polybrominated
biphenyls Chhabra et al.
(1993b) Mouse B6C3F1 Male No 2 3.90E+00 0.000% 1.93E+00 2.85E+00 3.68E+00 4.72E+00 6.62E+00
Deleted: Window
Deleted: Age Sensitivity Factors (Unadjusted)
Deleted: October

Page 5: [1] Deleted MSANDY 11/7/2008 4:19:00 PM
window
Page 5: [1] Deleted MSANDY 11/20/2008 3:52:00 PM
M
Page 5: [1] Deleted MSANDY 11/20/2008 3:52:00 PM
s
Page 5: [1] Deleted MSANDY 11/20/2008 3:53:00 PM
s
Page 5: [1] Deleted MSANDY 11/7/2008 4:23:00 PM
window
Page 5: [1] Deleted MSANDY 11/20/2008 3:53:00 PM
adjusted to take into account the longer period for cancer to manifest after early life
exposures, range from
Page 5: [1] Deleted MSANDY 11/20/2008 3:53:00 PM
8
Page 5: [1] Deleted MSANDY 11/20/2008 3:54:00 PM
to 7.5
Page 5: [1] Deleted MSANDY 11/20/2008 3:54:00 PM
s
Page 5: [1] Deleted MSANDY 11/20/2008 3:54:00 PM
from
Page 5: [1] Deleted MSANDY 11/20/2008 3:55:00 PM
16
Page 5: [1] Deleted MSANDY 11/20/2008 4:39:00 PM
.6 to 37.1, depending on the method used to combine studies
Page 5: [1] Deleted MSANDY 11/20/2008 4:37:00 PM
exposure
Page 5: [1] Deleted MSANDY 11/20/2008 4:37:00 PM
window
Page 5: [2] Deleted MSANDY 11/7/2008 4:24:00 PM
age window
Page 5: [2] Deleted MSANDY 11/7/2008 4:24:00 PM
period

Page 5: [2] Deleted MSANDY 11/20/2008 4:39:00 PM
M
Page 5: [2] Deleted MSANDY 11/20/2008 4:38:00 PM
unadjusted ASF
Page 5: [2] Deleted MSANDY 11/20/2008 4:39:00 PM
are
Page 5: [2] Deleted MSANDY 11/20/2008 4:39:00 PM
– 7.4
Page 5: [2] Deleted MSANDY 11/20/2008 4:39:00 PM
estimates
Page 5: [2] Deleted MSANDY 11/20/2008 4:39:00 PM
are
Page 5: [2] Deleted MSANDY 11/20/2008 4:39:00 PM
– 42.4, depending on the method used to combine studies
Page 5: [2] Deleted MSANDY 11/20/2008 4:46:00 PM
increased susceptibility appears even more pronounced once adjustments are made to
take into account the long period cancer has to manifest when exposure occurs early in
life. M
Page 5: [2] Deleted MSANDY 11/20/2008 4:49:00 PM
s
Page 5: [2] Deleted MSANDY 11/20/2008 4:50:00 PM
adjusted
Page 5: [2] Deleted MSANDY 11/20/2008 4:50:00 PM
s
Page 5: [2] Deleted MSANDY 11/7/2008 4:24:00 PM
window
Page 5: [2] Deleted MSANDY 11/20/2008 4:50:00 PM
range from
Page 5: [2] Deleted MSANDY 11/20/2008 4:50:00 PM
to 21.6
Page 5: [2] Deleted MSANDY 11/20/2008 4:50:00 PM
s

Page 5: [2] Deleted MSANDY 11/20/2008 4:50:00 PM
from
Page 5: [2] Deleted MSANDY 11/20/2008 4:50:00 PM
to 123.1, depending on the method used to combine studies
Page 5: [2] Deleted MSANDY 11/7/2008 4:24:00 PM
period
Page 5: [3] Deleted MSANDY 11/7/2008 4:25:00 PM
Page 5: [3] Deleted MSANDY 11/7/2008 4:25:00 PM
period
Page 5: [3] Deleted MSANDY 11/7/2008 4:25:00 PM
period
Page 5: [3] Deleted MSANDY 11/20/2008 4:51:00 PM
M
Page 5: [3] Deleted MSANDY 11/20/2008 4:51:00 PM
s
Page 5: [3] Deleted MSANDY 11/20/2008 4:51:00 PM
adjusted
Page 5: [3] Deleted MSANDY 11/20/2008 4:51:00 PM
s
Page 5: [3] Deleted MSANDY 11/7/2008 4:25:00 PM
window a
Page 5: [3] Deleted MSANDY 11/20/2008 4:51:00 PM
range from
Page 5: [3] Deleted MSANDY 11/20/2008 4:52:00 PM
to 5.5
Page 5: [3] Deleted MSANDY 11/20/2008 4:52:00 PM
s
Page 5: [3] Deleted MSANDY 11/20/2008 4:52:00 PM
to 9.4, depending upon the method used to combine studies
Page 33: [4] Deleted MSANDY 11/21/2008 1:20:00 PM
Method 2a − The potency distributions were sampled based upon weights equal to
the computed inverse-variance of each (logarithm) potency

distribution. That is, the variance is calculated for the distribution of
the logarithm of the q1, Var[log q1]. The likelihood that an q1 is
sampled is proportional to 1/Var(log[q1]).
Page 35: [5] Deleted Lauren Zeise 11/24/2008 10:00:00 AM
Page Break
Figure 6 Legend 1. Vesselinovitch et al. (1979a), mouse, B6C3F1, F, day -9 to 21 2. Ibid, M, day -9 to 21 3. Zeller et al. (1978), rat, Sprague Dawley, M/F day -2 4. Turusov et al. (1992), mouse, CBA, F, day -2 5. Mohr et al. (1975), hamster, Syrian Golden, day -15 to -1 6. Mohr et al. (1995), hamster, Syrian Golden, F, day -3 7. Althoff et al. (1977), hamster, Syrian Golden, M/F, day -9 to -3 8. Ibid, day -9 to -3 9. Althoff and Grandjean (1979), hamster, Syrian Golden, F, day -9 to -3 10. Druckrey and Landschutz (1971), rat, BD IX, M/F, day -10 11. Ibid, day -3 12. Naito et al. (1981), rat, Wistar, day -9 13. Ibid, day -9 14. Tomatis et al. (1977), rat, BDVi, F, day -5 15. Althoff and Grandjean (1979), hamster, Syrian Golden, M/F, day -9 to -3 16. Tomatis et al. (1971), mouse, CF-1, F day -4 to -1 17. Turusov et al. (1973), mouse, CF-1, F, day -2 18. Anderson et al. (1989), mouse, C3H & B6C3 F1,M/F day -8 to -4 19. Vesselnovitch et al. (1979a), mouse, B6C3 F1, M, day -9 to -3 20. Vesselnovitch et al. (1979b), mouse, B6C3 F1, F day -9 to -3 21. Choudari Kommineni et al. (1970), rat, MRC, M/F, day -4 22. Maltoni et al. (1981), rat, Sprague Dawley, M/F day -13 to -7
Page Break
(*
Page 35: [6] Deleted Lauren Zeise 11/24/2008 10:02:00 AM LP ratio calculation is based on juvenile potency distribution)
Page 44: [7] Deleted MSANDY 11/21/2008 4:35:00 PM
The cumulative distribution functions for Method 1 and Method 2 are nearly identical up
to the 70th percentile. After the 70th percentile, Method 2 has slightly larger values as
compared to Method 1. The most compact postnatal ASF distributions generally have
Rat Mouse Male Female M/F Hamster

values that are significantly greater than unity. As a result, the inverse-variance method
(Method 2) produces a mixture cumulative distribution that is shifted slightly to the right
of the distribution derived using Method 1, where equal weighting is given to all studies
within a chemical. The magnitude of this rightward shift with Method 2 is not
particularly large however because there were no single studies amongst those chemicals
with multiple studies with considerably smaller variances than the others in the set. The
postnatal ASF mixture cumulative distribution derived via Method 3 has percentile
values that are considerably larger than the other methods beyond the 5th percentile. The
most peaked mode of the postnatal ASF mixture frequency distribution is similar across
the mixing algorithms employed (i.e., Methods 1-3). However, when a single study with
the largest median value is selected to represent the chemical (Method 3), the percentiles
of the distribution become somewhat larger as compared to that seen using Methods 1 or
2.
Page 44: [8] Deleted MSANDY 11/21/2008 4:36:00 PM
n the results for the postnatal multi-window analysis by the three methods are given
Page 44: [9] Formatted Lauren Zeise 11/24/2008 11:04:00 AM
Left, Space Before: 2 pt, Line spacing: single
Page 44: [10] Formatted Lauren Zeise 11/24/2008 11:05:00 AM
Justified, Indent: Left: 0 pt
Page 48: [11] Deleted Lauren Zeise 11/24/2008 11:57:00 AM

*
*
*D
MBA
Dim
ethy
lnitr
osam
ine
(DM
N)
3-H
ydro
xyxa
nthi
ne
Met
hyln
itros
oure
a (M
NU
)
Ure
than
e
0.01
0.1
1
10
100
1000A
SF
(una
djus
ted)
♦ Adult comparison group dosed on days 80-87 + Adult comparison group dosed on days 140-147
* Adult comparison group dosing began during late juvenile
Page 48: [12] Deleted Lauren Zeise 11/24/2008 11:53:00 AM lifestage (day 46) and continued through day 61
Page 48: [13] Formatted Lauren Zeise 11/24/2008 11:56:00 AM
Font: (Default) Arial Narrow
Page 48: [14] Formatted Lauren Zeise 11/24/2008 11:56:00 AM
Font: (Default) Arial Narrow
Page 48: [15] Formatted Lauren Zeise 11/24/2008 11:56:00 AM
Font: (Default) Arial Narrow
Page 48: [16] Formatted Lauren Zeise 11/24/2008 11:54:00 AM
Indent: Left: 0 pt, First line: 0 pt
Page 48: [17] Formatted Lauren Zeise 11/24/2008 11:56:00 AM
Font: (Default) Arial, 9 pt
Page 48: [18] Formatted Lauren Zeise 11/24/2008 11:56:00 AM
Rat Male Female M/F
♦
+

Font: (Default) Arial, 9 pt
Page 48: [19] Formatted Lauren Zeise 11/24/2008 11:56:00 AM
Font: (Default) Arial, 9 pt
Page 48: [20] Formatted Lauren Zeise 11/24/2008 11:56:00 AM
Font: (Default) Arial, 9 pt
Page 48: [21] Formatted Lauren Zeise 11/24/2008 11:56:00 AM
Font: (Default) Arial, 9 pt
Page 48: [22] Formatted Lauren Zeise 11/24/2008 11:56:00 AM
Font: (Default) Arial, 9 pt
Page 48: [23] Formatted Lauren Zeise 11/24/2008 11:54:00 AM
Font: (Default) Arial, 9 pt
Page 48: [24] Formatted Lauren Zeise 11/24/2008 11:54:00 AM
Font: (Default) Arial, 9 pt
Page 48: [25] Formatted Lauren Zeise 11/24/2008 11:54:00 AM
Font: (Default) Arial, 9 pt, Not Italic
Page 48: [26] Formatted Lauren Zeise 11/24/2008 11:54:00 AM
Font: (Default) Arial, 9 pt
Page 48: [27] Formatted Lauren Zeise 11/24/2008 11:54:00 AM
Font: (Default) Arial, 9 pt, Danish
Page 56: [28] Deleted MSANDY 11/24/2008 9:25:00 AM
Percentiles Method 1
Page 56: [29] Deleted Lauren Zeise 11/24/2008 12:56:00 PM
Figure 15 shows the DEN prenatal and postnatal ratio frequency distributions generated
using Method 1. Both the prenatal and postnatal ratio frequency distributions are multi-
modal.

Figure 15. Method 1 DEN Prenatal and Postnatal Ratio Frequency Distributions –Equal Weighting of Potency Distributions
Page 57: [30] Deleted Lauren Zeise 11/24/2008 12:59:00 PM
Method 2: Weighting Potency Distributions by Inverse-Variance and the Interquartile
Range.
Figure 16 shows the DEN prenatal and postnatal ratio cumulative distribution functions
generated using Method 2a, weighting by inverse-variance, and Method 2b, weighting by
the interquartile range (IQR). Qualitatively the results are similar to Method 1, with
considerable sensitivity exhibited in the postnatal window. The magnitude of the
differences in the ratio distributions for DEN across the prenatal and postnatal exposure
windows is evident.
Freq
uenc
y
Ratio (Unadjusted)
Undefined 0.001 0.01 0.1 1.0 10 100 1000

Page Break
Figure 16. Methods 2a and 2b DEN Prenatal and Postnatal Ratio Cumulative Distribution Functions – Inverse-Variance and Interquartile Weighting of Potency Distributions
The percentiles for the prenatal and postnatal ratio distributions are provided in Table 11a
(unadjusted) and b (adjusted for early versus adult timing of exposure). With inverse-
variance weighting, slightly less than 89% of the unadjusted prenatal ratio distribution
lies below the value of one. Although not statistically significant, the distributional
statistics suggest that mice exposed during the prenatal age window are less prone to the
tumorigenic effects of DEN as compared to those exposed as juveniles. For the
unadjusted postnatal ratio distribution, more than 94% of the unadjusted postnatal ratio
distribution is greater than unity under Method 2a (inverse-variance weighting),

indicating that mice exposed during the postnatal age window are more prone to the
tumorigenic effects of DEN than those exposed as juveniles. The distributional
differences in cancer risk (as compared to juveniles) between DEN exposures occurring
during a prenatal window versus a postnatal window are quite evident.
Table 11a. Method 2 DEN Prenatal and Postnatal Ratio Distributions (Unadjusted)– Distributional Weighting of Potency Distributions
Method 2a – Inverse Variance Weighting
Method 2b - Interquartile Weighting Percentiles
Prenatal Ratio Postnatal Ratio Prenatal Ratio Postnatal Ratio 5th 0.03 0.93 0.005 0.85 10th 0.21 1.49 0.01 1.19 20th 0.27 1.99 0.18 1.77 30th 0.32 2.34 0.27 2.24 40th 0.36 2.74 0.34 2.73 50th 0.41 3.31 0.43 3.48 60th 0.47 4.18 0.55 4.71 70th 0.58 5.27 0.71 6.42 80th 0.75 7.36 0.91 11.02 90th 1.04 37.80 1.20 106.70 95th 1.30 154.34 1.45 287.68
Table 11b. Method 2 DEN Prenatal and Postnatal Ratio Distributions (Adjusted*)–
Distributional Weighting of Potency Distributions
Method 2a – Inverse Variance Weighting
Method 2b - Interquartile Weighting Percentiles
Prenatal Ratio Postnatal Ratio Prenatal Ratio Postnatal Ratio 5th 0.09 2.69 0.02 2.47 10th 0.62 4.33 0.03 3.45 20th 0.81 5.78 0.54 5.13 30th 0.95 6.80 0.81 6.50 40th 1.08 7.94 1.02 7.92 50th 1.23 9.60 1.29 10.09 60th 1.42 12.12 1.65 13.66 70th 1.73 15.27 2.13 18.62 80th 2.25 21.35 2.73 31.96 90th 3.13 109.62 3.60 309.43 95th 3.90 447.59 4.35 834.27

*Adult vs. early-life timing of exposure adjustment
Page Break
Page 62: [31] Deleted MSANDY 11/24/2008 9:53:00 AM
Percentiles Method 1 Method 1 (truncated)
Page 62: [32] Deleted Lauren Zeise 11/24/2008 1:11:00 PM
Figure 19 shows the ENU prenatal and postnatal ratio frequency distributions generated
using Method 1. Both the prenatal and postnatal ratio frequency distributions are multi-
modal. The ENU postnatal ratio distribution has a similar overall shape as the prenatal
ratio distribution, with a shift to the left such that the values of the distribution are not as
extreme. The ENU postnatal ratio distribution is more compact and lacks the most
extreme values observed in the rightmost tail of the prenatal ratio distribution (Figure 18),
although large values in the upper tails are evident (See also Table 12). Table 12 shows
the ENU ratios calculated using Method 1 barely differ when the potency distributions
are truncated at the fifth and ninety-fifth percentiles to eliminate the extreme values, prior
to developing the mixture potency distributions.
Page Break
Figure 19. Method 1 ENU Prenatal and Postnatal Ratio Frequency Distributions – Equal Weighting of Potency Distributions

Page 62: [33] Deleted MSANDY 11/24/2008 9:56:00 AM
ratios calculated using Method 1, after adjustment is made for early versus adult timing
of exposure.
Page 62: [34] Deleted MSANDY 11/24/2008 9:57:00 AM
with Adult vs. Early-Life Timing of Exposure Adjustment
Page 63: [35] Deleted Lauren Zeise 11/24/2008 1:15:00 PM
Discussion
Data from studies on 23 unique carcinogens, 20 of which are considered to act via
primarily genotoxic modes of action, were analyzed. Of these 20 carcinogens, 15 are
thought to require metabolic activation to the ultimate carcinogenic species. The
analyses indicate that both the prenatal and postnatal lifestages can be much more
susceptible to developing cancer than the adult lifestage. As an index of inherent
susceptibility, one that does not account for the longer time early exposures can manifest,
Freq
uenc
y
Ratio (Unadjusted)
0.1 1 10 100 1000 10000

an LP ratio was derived. This index compares the carcinogenicity activity when
exposures occur early in life compared to older ages, for the same period of time between
initial exposure and observation of effect. For the multi-lifestage exposure studies, the
median LP ratio for the postnatal period was 4.6 or 7.5, and the upper 95% confidence
bound ranged from 123 to 188, depending on the method of combining the ASF
distributions underlying studies on the same chemical.
There were few cases of LP ratios less than 1.0 for the postnatal lifestage. These results
indicate that in general, for the chemicals studied, there is inherently greater susceptibility
during the early postnatal compared to the adult period. The differences between
postnatal and adult susceptibility appear more pronounced once the longer period of time
that exposed young have to develop tumors is addressed by taking into account time-of-
dosing, in calculating the ASF. The median value for the postnatal ASF indicates for the
chemicals studied here a 13.5- fold greater contribution to lifetime cancer risk when
exposure occurs during this period, compared to the same exposure averaged throughout
the adult period; the upper 90th percentile ASF was 211. The DEN and ENU case studies
also exhibited substantial sensitivity in the postnatal lifestage, with inherent susceptibility
about half an order of magnitude greater than juveniles for DEN, and about an order of
magnitude greater than juveniles for ENU, and again greater susceptibility once the
longer period of time that exposed young have to develop tumors is ttaken into account.
Regarding in utero exposure, few studies provided data indicative of equal inherent adult
and prenatal susceptibility, with an LP ratio of unity. For the multi-lifestage exposure
studies, the prenatal LP ratio distributions are roughly bimodal, with LP ratios for several
studies significantly greater than unity and several others significantly less than unity
(Figure 6). The median LP ratio mixture distribution was 2.5. The median estimate of
the prenatal ASF was 2.9, and the mean estimate ws 21.1. This modality in the prenatal
LP ratio and ASF mixture distributions is reflected in the case studies. The prenatal LPj
ratio for DEN has a median of 0.1, and the majority of the distribution falls below unity.
This is suggestive of reduced inherent susceptibility in utero. In contrast the median
prenatal LPj ratio for ENU was 19.3, with the majority of the distribution exceeding

unity, indicative of greater inherent in utero susceptibility. In considering implications of
the DEN and ENU case studies it is important to recognize that the referent groups were
juvenile rather than adult animals. The prenatal (and postnatal) LPj ratios and ASFjs are
likely to be underestimates, to the extent that some of the apparent sensitivity for DEN
and ENU in the early postnatal period carries through to the juvenile period.
ENU is a direct acting carcinogen that does not require metabolic activation to alkylate
DNA, forming DNA adducts and mutations that ultimately result in the formation of
tumors (Slikker III et al., 2004). In contrast, DEN requires metabolic activation by
cytochrome P450 enzymes (e.g., P450 2E1, P450 2A6) to form the active DNA
ethylating species (Brittebo et al., 1981). While both ENU and DEN cross the placenta
and are widely distributed in fetal tissues (Rice et al. 1989; Brittebo et al., 1981), DEN
can not be metabolized to any significant extent by fetal tissues until relatively late in
gestation (i.e., gestation day 18 in the mouse), and after birth the expression of P450 2E1
progressively increases, reaching adult levels by day 30 (Brittebo et al., 1981). This may
explain the lower fetal susceptibility of DEN. However, the multi-lifestage exposure
studies illustrate that in utero metabolic status is not the sole determinant of in utero
susceptibility: benzidine and safrole require metabolic activation and exhibit greater
susceptibility from prenatal exposure (see Figure 6).
There are just five chemicals and seven studies, two of which are not independent (i.e.,
the MNU studies of Grubbs et al., 1983), available to examine susceptibility in the
juvenile lifestage. The LP ratio distributions indicate significantly greater inherent
susceptibility in this period for three of the independent studies, with the three remaining
independent studies consistent with equal inherent susceptibility to adult animals (Figure
14). For the juvenile lifestage, the ASF mixture distribution was 4.5 at the 50th percentile
and 19.7 at the 95th percentile.
The studies that comprise the set of multi-lifestage exposure studies available for these
analyses were not homogeneous. That is, they do not represent observations from the
same distribution. Sensitivity analyses were conducted to test the robustness of the
findings to different procedures for analyzing data and combining results. Of the
methods used to combine the LP ratio distributions for underlying studies within each
lifestage, the method of equally weighting studies within a chemical appears to best
represent the available data. The use of inverse variance in weighting LP ratio
distributions within a chemical may underweight small studies and overweight large
ones, and thus produce a LP ratio mixture distribution that does not accurately reflect the
overall data. This is clearly illustrated by the results of the postnatal ENU case study
analyses. The method of selecting a single study (i.e., that with the largest median LP
ratio) to represent each chemical may also result in inadvertent bias if a selected study is
not representative of the group being studied.
In taking into account the longer period of time for early carcinogen exposures to
manifest, the hazard function was assumed to increase with the third power of age. If the
true rate of increase with age is greater than that, then the ASFs presented here may result
in underestimates of the true sensitivity of these early lifestages.
As the multi-lifestage exposure and chemical-specific case studies show, there appears to
be considerable variability in age-at-exposure related susceptibility across carcinogens.
There is also variability in age-at-exposure related susceptibility among studies of the
same carcinogen. The sources of variability evident in the analyzed studies include
timing of exposure within a given lifestage, and gender, strain, and species differences in
tumor response. The set of studies identified and analyzed was not sufficiently robust to
fully describe quantitatively the variability. This variability raises concerns that selection
of the median (the 50th percentile) estimates may considerably underestimate effects for
certain carcinogens or population groups. Relatively large variability in humans in
response to carcinogens is expected to be common (Finkel, 1995; 2002).
Several of the carcinogens studied induced tumors at multiple sites in the same
experiment, and at different sites, depending upon the lifestage during which exposure
occurred. The cancer potencies used in the early vs. later life comparisons were based on
all treatment-related tumors. When treatment-related tumors were induced at multiple

sites in the same experiment, or at the same site, but arising from different cell types, the
slopes of the dose response curves from these different tumor sites or types were
statistically combined to create an overall multisite cancer potency distribution for that
experiment. The result reflects the total cancer impact associated with the carcinogen
exposure in question. This approach differs from other researchers investigating early vs.
late in life differences (e.g., Barton et al., 2005; Hattis et al., 2004; 2005). We believe
this provides a more complete approach for considering age specific differences in
carcinogenic activity.
One limitation of the approach was the focus on lifestages, without attempting to describe
changes in susceptibility that occur within a lifestage. Timing of carcinogen exposure
within a given lifestage can affect the cancer outcome observed. This is illustrated by
experiments with 1-ethyl-1-nitrosobiuret in prenatal and adult rats by Druckrey and
Landschutz (1971). A three fold difference in activity was observed between two
prenatal exposure groups, one exposed on prenatal day -10 and the other on prenatal day -
3 (See Figure 6 and Appendix B, Table B1). The timing of exposure within the adult age
window can also affect the cancer outcome, as illustrated by the experiments of Grubbs et
al. (1983), in which female rats exposed early in the adult period (days 80 through 87)
were more than three times as sensitive to the breast cancer effects of MNU than females
exposed six weeks later (Figure 14 and Appendix B, Table B3). In general the adult
comparison groups in the multi-lifestage exposure studies were fairly young. The extent
to which this may result in an overall bias of the results presented here is unclear. Also
for several cases, juvenile animals were used as the later life exposure group. In these
cases the ASFs are likely underestimates of the relative sensitivity of the prenatal and
postnatal lifestages, compared to that of the adult lifestage.
Excluded from the analysis presented here were early in life studies in which exposure of
a given exposure group crossed multiple lifestages. An example of results from studies
of this type is provided by mouse studies for two non-genotoxic carcinogens,
diphenylhydantoin (Chhabra et al., 1993a) and polybrominated biphenyls (Chhabra et al.,
1993ab), in which exposures began prior to conception, and continued throughout the

prenatal, postnatal, and post-weaning periods, up to the age of eight weeks. The data,
shown in Appendix F, demonstrate an increased sensitivity associated with exposures to
either of these non-genotoxic carcinogens during the entire early life period, as compared
to exposures during only the adult lifestage. Some studies that crossed multiple lifestages
were included in the analyses of Barton et al. (2005), which are consistent with the
general conclusions here.
Barton et al. (2005) discussed data on 18 unique carcinogens, but ultimately analyzed data on six mutagenic carcinogens (benzidine, diethylnitrosamine, 3-MC, safrole, urethane, and vinyl chloride) to derive the age dependent adjustment factor of 10 for carcinogen exposures occurring between birth and the second birthday, as specified in the U.S. EPA’s (U.S. EPA, 2005) Supplemental Guidance
for Assessing Susceptibility from Early-Life Exposure to
Carcinogens. In performing the analysis, Barton et al. (2005) compared tumor site-specific potencies, while
Page 63: [36] Deleted Lauren Zeise 11/24/2008 1:15:00 PM
Page 63: [37] Deleted Lauren Zeise 11/24/2008 1:15:00 PM
Method 2: Weighting Potency Distributions by Inverse-Variance and
Interquartile Range. The ENU prenatal and postnatal ratio distributions computed by
Method 2a and Method 2b differ substantially from one another, as shown in Figure 20.
This is because each exposure window has a grouping of experiments that have narrower
confidence intervals than the remaining grouping of experiments. Within each exposure
window, those experiments with the narrowest confidence intervals are given greater
weight. Figure 20 demonstrates that the differences observed between the weighting
methods is due to greater weight being assigned to these studies with the narrowest

confidence intervals via the inverse-variance weighting method compared to the
interquartile range weighting method.
The ENU prenatal ratio distributions computed via Method 2a and 2b have medians equal
to 3.81 and 11.05, respectively. The ENU postnatal ratio distributions computed via
Method 2a and 2b have medians equal to 0.55 and 7.24, respectively. Clearly, the
inverse-variance weighting results suggest less susceptibility from early life exposure to
ENU than the interquartile range weighting results. The inverse-variance weighting
scheme tends to weigh the studies with narrower distributions, and in the case of the ENU
pre- and postnatal studies, smaller potency values, considerably more heavily as
compared to interquartile range weighting.
Both weighting methods clearly indicate greater inherent sensitivity of the prenatal
window to ENU, which was also observed when studies were weighted equally (Method
1). The two weighting methods (2a and 2b) yield strikingly different results for the
postnatal window, however. Using inverse variance weighting, approximately half of the
ENU postnatal ratio distribution is less than unity, indicating no substantial inherent
sensitivity for the postnatal compared to juvenile development window. With
interquartile weighting, the 10th percentile is 1.04 and half the distribution exceeds 7.0,
indicating a strong postnatal sensitivity. The inverse variance results are also
substantially different to the results seen when all studies are equally sampled, as shown
in Method 1 above. However, the interquartile range weighting results are similar to
those obtained via Method 1 though slightly more moderate. Results from both Method
2a and 2b indicate that prenatal sensitivity is substantially greater than postnatal
sensitivity.
Page Break
Figure 20. Methods 2a and 2b ENU Prenatal and Postnatal Ratio Cumulative
Distribution Functions – Inverse-Variance and Interquartile Weighting of Potency
Distributions

Page Break
Table 14a. Method 2 ENU Prenatal and Postnatal Ratio Distributions (Unadjusted)–Distributional Weighting of Potency Distributions
Method 2a – Inverse Variance
Weighting Method 2b - Interquartile
Weighting Percentiles Prenatal Ratio Postnatal Ratio Prenatal Ratio Postnatal Ratio
5th 0.74 0.29 0.61 0.47 10th 0.95 0.31 0.87 1.04 20th 1.45 0.35 1.75 1.43 30th 1.98 0.38 2.91 1.85 40th 2.93 0.42 4.55 2.69 50th 3.81 0.55 11.05 7.24 60th 5.45 1.72 20.97 17.05 70th 21.18 3.33 27.36 39.81 80th 27.75 5.61 47.64 91.56 90th 53.70 15.32 852.11 182.93 95th 940.28 27.92 2608.68 296.87
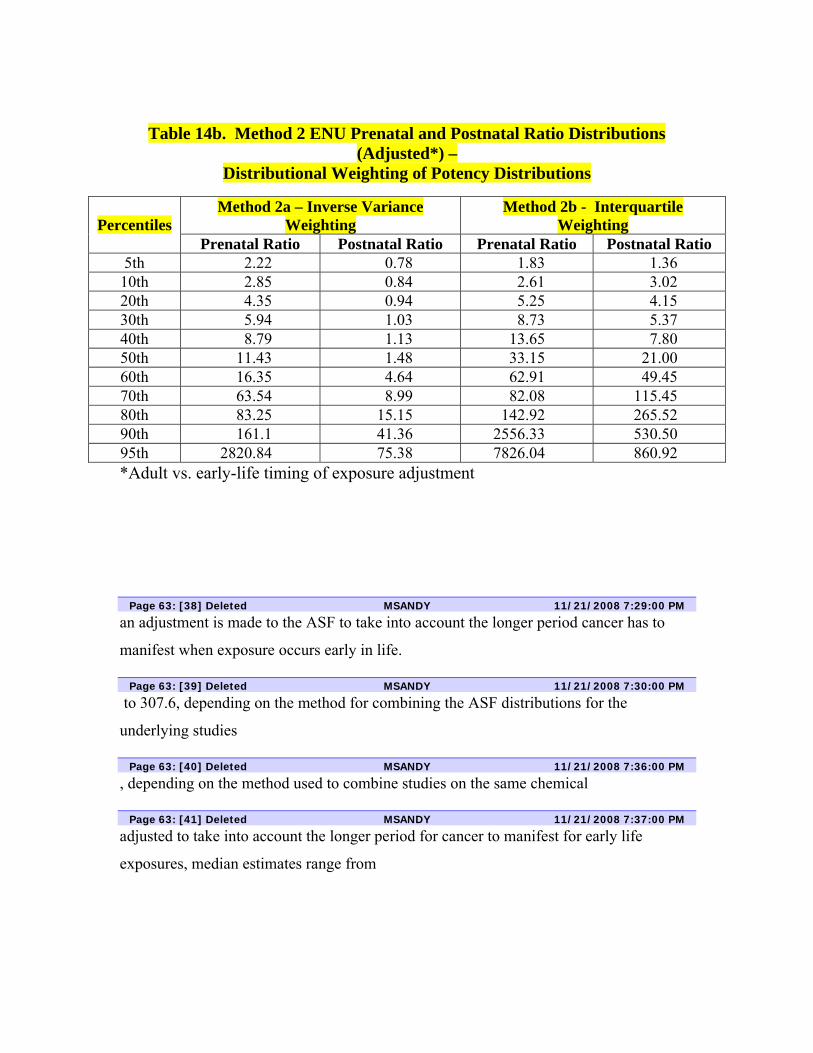
Table 14b. Method 2 ENU Prenatal and Postnatal Ratio Distributions (Adjusted*) –
Distributional Weighting of Potency Distributions
Method 2a – Inverse Variance Weighting
Method 2b - Interquartile Weighting Percentiles
Prenatal Ratio Postnatal Ratio Prenatal Ratio Postnatal Ratio 5th 2.22 0.78 1.83 1.36 10th 2.85 0.84 2.61 3.02 20th 4.35 0.94 5.25 4.15 30th 5.94 1.03 8.73 5.37 40th 8.79 1.13 13.65 7.80 50th 11.43 1.48 33.15 21.00 60th 16.35 4.64 62.91 49.45 70th 63.54 8.99 82.08 115.45 80th 83.25 15.15 142.92 265.52 90th 161.1 41.36 2556.33 530.50 95th 2820.84 75.38 7826.04 860.92 *Adult vs. early-life timing of exposure adjustment
Page 63: [38] Deleted MSANDY 11/21/2008 7:29:00 PM
an adjustment is made to the ASF to take into account the longer period cancer has to
manifest when exposure occurs early in life.
Page 63: [39] Deleted MSANDY 11/21/2008 7:30:00 PM
to 307.6, depending on the method for combining the ASF distributions for the
underlying studies
Page 63: [40] Deleted MSANDY 11/21/2008 7:36:00 PM
, depending on the method used to combine studies on the same chemical
Page 63: [41] Deleted MSANDY 11/21/2008 7:37:00 PM
adjusted to take into account the longer period for cancer to manifest for early life
exposures, median estimates range from