in vitro third generation cephalosporin gonococcal ... · ceftriaxone: 100% susceptible; mic range
TRANSCRIPT

Author
Year
published
Year
collected Country
Number of
isolates
tested
Susceptibility (S)
Threshold, Method Reported findings
Allen 2013 2010-2011 Canada (Toronto clinic) 291 S ≤0.06 mcg/mL Cefixime: 79.7% susceptible.
Cefixime: 100% susceptible; 9.4% with "reduced susceptibility" (MICs 0.125-0.25).
Ceftriaxone: 100% susceptible; 9.4% with "reduced susceptibility" (MICs 0.032-0.125).
Cefixime: 100% susceptible; percent with elevated MICs (≥0.064) increased from 2% to 43% 2006-2010,
decreased to 27% in 2011.
Ceftriaxone: 100% susceptible; percent with elevated MICs (≥0.064) increased from 1% to 33% 2006-
2010, decreased to 16% in 2011.
Cefixime: 99.97% susceptible (3 isolates with MIC 0.5: 1 each in 2004, 2007, and 2008); right shift in
modal MIC from 0.016 to 0.125 from 2001-2010.
Ceftriaxone: 100% susceptible; right shift in modal MIC from 0.016 to 0.063 from 2001-2010.
Cefixime: 99.95% susceptible in 2011; percent with elevated MICs (≥0.25) increased from 0.1% in 2006 to
1.4% in 2010 and 2011, was 1.1% in 1st 6 months of 2012.
Ceftriaxone: 100% susceptible in 2011; percent with elevated MICs (≥0.125) increased from 0.05% in
2006 to 0.3% in 2009-2010 and 0.4% in 2011, was 0.3% in 1st 6 months of 2012.
Méndez 2008 1997-2004 Argentina 434 agar dilution Ceftriaxone: 100% susceptible (MIC range 0.001-0.032); paper in Spanish.
Starnino 2012 2000-2009
Argentina, Bolivia, Brazil,
Chile, Colombia, Cuba,
Ecuador, Peru, Uruguay,
Venezuela
9,231 multipleCeftriaxone: 99.0% susceptible in Brazil (7 isolates with MIC >0.25 and zone diameter <35 mm, all from
Manaus, Brazil in 2007); 100% susceptible in other countries.
Lis-Tønder 2009 2003-2007 Denmark 62 disc diffusion Ceftriaxone: 100% susceptible.
Cefixime: 89.0% susceptible among GUM patients (82.6% in 2010); 96.2% susceptible among non-GUM
patients (89.4% in 2010).
Ceftriaxone: 100% susceptible (100% in 2010); increase in percent with highly sensitive isolates (MIC
≤0.002) since 2010, decrease in percent with an MIC ≥0.03 (6.9% in 2011 vs. 13.7% in 2010).
Manavi 2010 2001-2008England (pharyngeal
isolates at one clinic)128 S <0.125 Ceftriaxone: 100% susceptible.
Cefixime: 91% susceptible (96% in 2009); 11 countries had <95% susceptible, 5 countries had <85%
susceptible.
Ceftriaxone: 100% susceptible; percent with "higher MICs" increased compared with 2009.
Farhi 2009 2005-2007 France 115 S ≤0.12 mcg/mL Ceftriaxone: 100% susceptible.
50 S ≤0.5 mcg/mL Cefotaxime: 100% susceptible.
49 S ≤0.25 mcg/mL Ceftriaxone: 100% susceptible.
Tzelepi 2010 2005-2008 Greece 635 S ≤0.5 mcg/mLCefotaxime: 100% susceptible in 2005-2006, 98.8% susceptible in 2007, 100% susceptible in 2008;
percent with MIC ≥0.25 increased from 0.6% in 2005 to 20.7% in 2008.
Carannante 2012 2006-2010 Italy 586 S ≤0.5 mcg/mL Ceftriaxone: 100% susceptible; MIC range 0.002-0.125.
Cefixime: 88% susceptible; MIC range <0.016-0.38; 99% with MIC ≤0.25 mcg/mL.
Ceftriaxone: 100% susceptible; MIC range 0.002-0.094; may be included in Carannante 2012.
de Vries 2009 2006-2008 Netherlands 1,596 S ≤0.125 mcg/mLCefotaxime: percent susceptible decreased from 95.2% in Q4 2006 to 87.9% in Q4 2008; all MICs were
<0.5.
PubMed search terms: (gonorrhea or gonorrhoeae or gonorrhoea or gonococcus or gonococcal) AND (treatment or therapy or resistance or antibiotics or failure) AND ("2008"[Date - Publication] : "3000"[Date -
Publication]).
Table 1: Most recent published reports of in vitro third generation cephalosporin gonococcal susceptibility by region
Hottes
Health
Protection
Agency
(GRASP)
2012
2013
S ≤0.25 mcg/mL149Canada (Ontario Public
Health Laboratory)2008
2012, 2011 2001-2010Canada (National
Microbiology Lab)10,301
2011Allen
2013 2006-2011Canada (British
Columbia)1,837
2011 England and Wales 1,359? S ≤0.06 mcg/mL
LATIN AMERICA/CARIBBEAN
EUROPE
NORTH AMERICA
ECDC (GASP-
Europe)2012 2010 21 EU/EEA countries 1,766 S ≤0.125 mcg/mL
S ≤0.25 mcg/mL
CDC (GISP) 2012, 2013 2011 USA 5,467 S ≤0.25 mcg/mL
S ≤0.25 mcg/mL
Martin
Abraham
S ≤0.12 mcg/mL293Italy2006-20102011Carannante
Germany2001-2010

Cefixime: 96.5% susceptible (3.5% isolates with MIC 0.19-0.38).
Ceftriaxone: 98.2% susceptible to ceftriaxone (1.8% with MIC 0.19).
Florindo 2010 2006-2009 Portugal 187 S ≤0.06 mcg/mL Ceftriaxone: 97.9% susceptible (2.1% isolates with MICs 0.125-0.25, all in 2007).
Cefixime: 94.8% susceptible; shift towards higher MICs compared with 2003.
Ceftriaxone: 99.6% susceptible; shift towards higher MICs compared with 1998.
Cefixime: 100% susceptible.
Ceftriaxone: 100% susceptible.
Filipiuc 2010 2009-2010 Romania 32 ?Ceftriaxone: "96.9% strains were sensitive for ceftriaxone and spectinomycin"; article in Romanian,
minimal information available from English abstract.
Kubanova (RU-
GASP)2010 2007-2008 Russia 1,560 S ≤0.25 mcg/mL Ceftriaxone: 100% susceptible (also 100% susceptible 2005-2006).
Dan 2010 2002-2007 Israel 406 S ≤0.25 mcg/mL Ceftriaxone: 100% susceptible, overall MIC range 0.002-0.19.
Cao 2008 2004-2006 Cameroon 50 disc diffusion Ceftriaxone: 100% susceptible.
Cao 2008 2004-2006 Central African Republic 28 S ≤0.25 mcg/mL Ceftriaxone: 100% susceptible; MIC range 0.002-0.016.
Cefixime: 100% susceptible.
Ceftriaxone: 100% susceptible.
108 Cefixime: 100% susceptible.
154 Ceftriaxone: 100% susceptible.
Cefixime: 100% susceptible; MICs increased over time.
Ceftriaxone: 100% susceptible; MICs increased over time.
Cao 2008 2004-2006 Madagascar 68 S ≤0.25 mcg/mL Ceftriaxone: 100% susceptible to ceftriaxone, MIC range 0.001-0.03
Cefixime: 99% susceptible (1 isolate with MIC of 1).
Ceftriaxone: 100% susceptible; MIC range 0.002-0.031.
Cefixime: 100% susceptible; all MICs ≤0.015.
Ceftriaxone: 100% susceptible; all MICs ≤0.015.
Lewis 2008 2007 South Africa 272 S ≤0.25 mcg/mL Ceftriaxone: 100% susceptible.
Lahra (AGSP) 2012 2011 Australia 4,129 S <0.06 mcg/mL
Ceftriaxone: 96.8% susceptible in 2011; percent with decreased susceptibility (MICs 0.06-0.125)
increased from 0.6% in 2006 to 4.8% in 2010, but decreased to 3.2% in 2011; no MIC >0.125 reported in
Australia.
Ahmed 2010 1997-2006 Bangladesh 1,767 S ≤0.25 mcg/mL Ceftriaxone: 100% susceptible; no increase in MIC50 or MIC90 over time.
7,154 disc diffusion Ceftibuten: 96.3%-99.1% susceptible; stable over time.
8,123 S ≤0.25 mcg/mL Ceftriaxone: 100% susceptible; MICs stable over time.
Bala 2008 2002-2004 India 191 multiple Ceftriaxone: 2.1% "less sensitive" (not defined).
Bala 2011 2000-2009 India 764 mulitple Cefixime and ceftriaxone: 1.6% "were less susceptible" (not defined).
Cefixime: 100% susceptible to cefixime.
Ceftriaxone: 98.1% susceptible (1.8% "intermediate", not defined).
Cefixime: 100% susceptible; MIC range <0.016-0.064.
Ceftriaxone: 100% susceptible; MIC range <0.002-0.064.
Shilpee 2008 ? India 10 disc diffusion Ceftriaxone: 100% susceptible.
Matsumoto 2008 ? Japan ? ?Cefozopran: "The incidence rate of [cefozopran-resistant N. gonorrhoeae, 4th generation ceph] is now
40%..."
S ≤0.25 mcg/mL Cefixime: 92.2% susceptible; MIC range ≤0.008-0.5.
S ≤2 mcg/mL Cefodizime:100% susceptible; MIC range ≤0.008-0.016.
S ≤0.25 mcg/mL Ceftriaxone: 100% susceptible; MIC range ≤0.008-0.06.
Sethi 2013 2007-2011 India, Pakistan, Bhutan 65 S ≤0.12 mcg/mL
Takahashi 2012 2007-2009 Japan 51
Hong Kong2012Lo 2005-2010
Kulkarni
ASIA/PACIFIC
Olsen 2012 2006-2008
2012 2007-2008 India 64 S ≤0.25 mcg/mL
Apalata 2009 2005 Mozambique 55 S ≤0.25 mcg/mL
Brown 2010 2007
Guinea-Bissau
S ≤0.12 mcg/mL114Norway20092012Hjelmevoll
S ≤0.12 mcg/mL80Belarus20092011Glazkova
EASTERN EUROPE/CENTRAL ASIA
Golparian 2010 2009 Sweden 230 S ≤0.125 mcg/mL
31 S ≤0.125 mcg/mL
Lagace-Wiens 2012 2009-2010 Kenya multiple
MIDDLE EAST
AFRICA
Malawi 100 S ≤0.25 mcg/mL
Mehta 2011 2002-2009 Kenya 105 S ≤0.25 mcg/mL
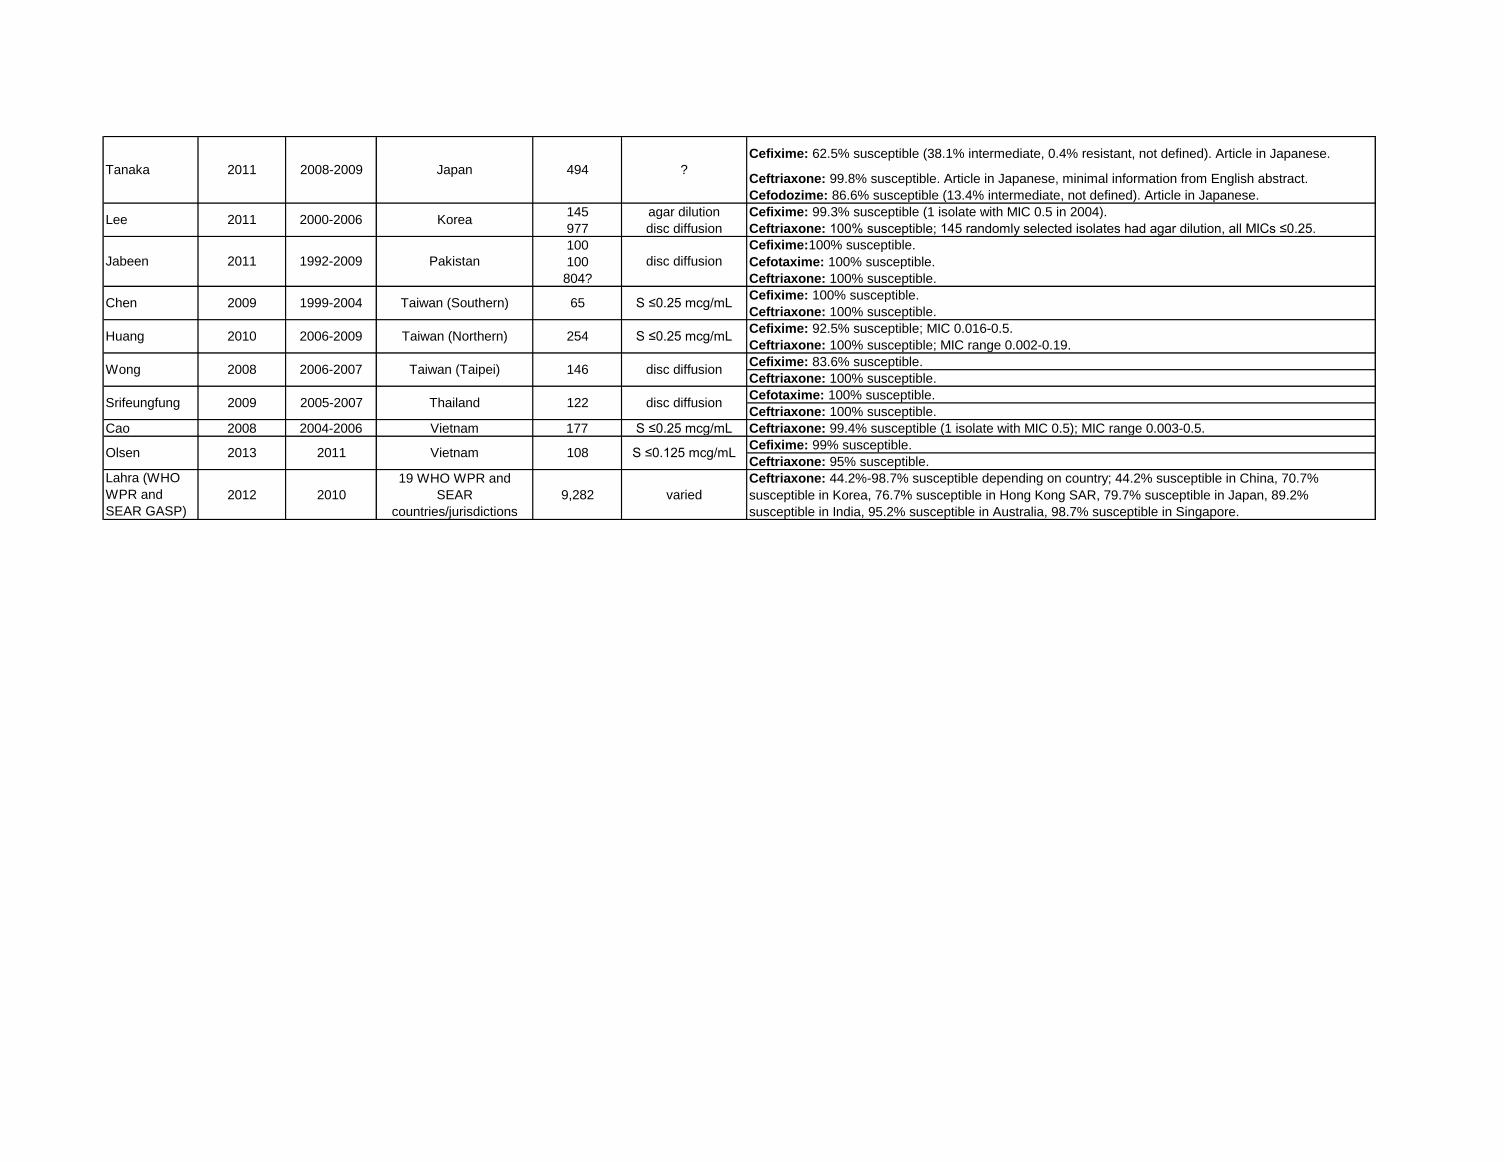
Cefixime: 62.5% susceptible (38.1% intermediate, 0.4% resistant, not defined). Article in Japanese.
Ceftriaxone: 99.8% susceptible. Article in Japanese, minimal information from English abstract.
Cefodozime: 86.6% susceptible (13.4% intermediate, not defined). Article in Japanese.
145 agar dilution Cefixime: 99.3% susceptible (1 isolate with MIC 0.5 in 2004).
977 disc diffusion Ceftriaxone: 100% susceptible; 145 randomly selected isolates had agar dilution, all MICs ≤0.25.
100 Cefixime:100% susceptible.
100 Cefotaxime: 100% susceptible.
804? Ceftriaxone: 100% susceptible.
Cefixime: 100% susceptible.
Ceftriaxone: 100% susceptible.
Cefixime: 92.5% susceptible; MIC 0.016-0.5.
Ceftriaxone: 100% susceptible; MIC range 0.002-0.19.
Cefixime: 83.6% susceptible.
Ceftriaxone: 100% susceptible.
Cefotaxime: 100% susceptible.
Ceftriaxone: 100% susceptible.
Cao 2008 2004-2006 Vietnam 177 S ≤0.25 mcg/mL Ceftriaxone: 99.4% susceptible (1 isolate with MIC 0.5); MIC range 0.003-0.5.
Cefixime: 99% susceptible.
Ceftriaxone: 95% susceptible.
Lahra (WHO
WPR and
SEAR GASP)
2012 2010
19 WHO WPR and
SEAR
countries/jurisdictions
9,282 varied
Ceftriaxone: 44.2%-98.7% susceptible depending on country; 44.2% susceptible in China, 70.7%
susceptible in Korea, 76.7% susceptible in Hong Kong SAR, 79.7% susceptible in Japan, 89.2%
susceptible in India, 95.2% susceptible in Australia, 98.7% susceptible in Singapore.
Huang 2010 2006-2009 Taiwan (Northern) 254 S ≤0.25 mcg/mL
Olsen 2013 2011 Vietnam 108 S ≤0.125 mcg/mL
Wong 2008 2006-2007 Taiwan (Taipei) 146 disc diffusion
Srifeungfung 2009 2005-2007 Thailand 122 disc diffusion
Jabeen 2011 1992-2009 Pakistan disc diffusion
Chen 2009 1999-2004 Taiwan (Southern) 65 S ≤0.25 mcg/mL
Tanaka 2011 2008-2009 Japan 494 ?
Lee 2011 2000-2006 Korea

Author
Year
published
Year
collected Country
Number of
isolates
tested
Susceptibility (S)
Threshold, Method Reported findings
Allen 2011 2008Canada (Ontaria Public
Health Laboratory)149 Etest 77.2% susceptible to erythromycin; 34 (22.8%) with erythro MIC ≥2, also had azithro MICs 0.25-0.5.
Hottes 2013 2006-2011Canada (British
Columbia)1,837 ≤1 mcg/mL 99% with MIC ≤1; percent with elevated MICs (≥0.5) incresed from 26% in 2006 to 82% in 2011.
Martin 2011 2000-2009Canada (National
Microbiology Lab)40,875 S ≤1 mcg/mL 99.8% susceptible; modal MIC shifted from 0.25 in 2001 to 0.5 by 2007-2009.
CDC (GISP) 2012 2011 USA 5,467 ≤1 mcg/mL 99.7% with MIC ≤1; no temporal trend in MICs.
Méndez 2008 1997-2004 Argentina 434 ≤1 mcg/mL 99.8% with MIC ≤1 (1 isolate with MIC 16 in 2004). Paper in Spanish.
Starnino 2012 2000-2009 Argentina 3,894 S ≤1 mcg/mL95% susceptible overall (90% in 2000, 84% in 2001, 94% in 2002-2003, 99% in 2004, 96% in 2005-2006,
99% in 2007, 96% in 2008, 97% in 2009).
Starnino 20122001-2004,
2007, 2009Brazil 635 S ≤1 mcg/mL 97% susceptible overall (100% in 2001-2003, 78% in 2004, 94% in 2007, 99% in 2009).
Starnino 2012 2000-2009 Chile 3,116 S ≤1 mcg/mL 73% susceptible overall; percent susceptible decreased from 97% in 2000 to 54% in 2009.
Starnino 2012 2000-2009 Colombia 134 S ≤1 mcg/mL 100% susceptible.
Starnino 20122000-2002,
2005-2006Peru 351 S ≤1 mcg/mL 100% susceptible.
Starnino 2012 2000-2009 Uruguay 243 S ≤1 mcg/mL92% susceptible overall (100% in 2000, 94% in 2001, 100% in 2002, 94% in 2003, 79% in 2004, 84% in
2005, 88% in 2006, 87% in 2007, 96% in 2008, 91% in 2009).
2012 2011 England and Wales 1,359? S ≤0.5 mcg/mL99.5% susceptible in GUM clinics, 100% susceptible in non-GUM clinics (same as 2010); no high-level
resistance (MIC ≥256); weighted analysis.
2010 2001-2008England (pharyngeal
isolates at one clinic)128 S <1 mcg/mL 100% susceptible.
ECDC (GASP-
Europe)2012 2010 21 EU/EEA countries 1766 S ≤0.5 mcg/mL
93% susceptible overall; countries ranged from 70%(Slovakia) susceptible to 100% susceptible (Cyprus,
France, Hungary, Malta, and UK); no apparent trend from 2004 to 2010, no high-level resistance (MIC
>256).
Starnino 2009 2007-2008 Italy 219 S ≤0.5 mcg/mL 90.0% susceptible; 7.8% with MIC 1-8; 0.5% with MIC 128, 1.8% with MIC 256.
Hjelmevoll 2012 2009 Norway 114 S ≤0.25 mcg/mL 89% susceptible.
Palmer 2008 2004-2007 Scotland 3,326 S ≤0.5 mcg/mL97.6% susceptible in 2004, 98.1% susceptible in 2005, 97.3% susceptible in 2006, 94.8% susceptible in
2007; high-level resistance (MIC ≥256) increased from 0.3% in 2004 to 3.9% in 2007.
Glazkova 2011 2009 Belarus 80 S ≤0.25 mcg/mL 55.5% susceptible, 27.2% with MIC 0.5, 17.3% with MIC >0.5.
Kubanova (RU-
GASP)2010 2007-2008 Russia 1,560 S ≤0.25 mcg/mL
90.3% susceptible in 2007, 94.8% susceptible in 2008; 4.8% with MIC ≥1.0 in 2007, 0.4% with MIC ≥1.0 in
2008.
Dan 2010 2002-2007 Israel 406 S ≤0.5 mcg/mL82.6% susceptible in 2002, 88% susceptible in 2003, 62% susceptible in 2004, 90.75% susceptible in
2005, 88.4% susceptible in 2006, 91.8% susceptible in 2007; overall MIC range 0.008-12.0.
Olsen 2012 2006-2008 Guinea-Bissau 31 S ≤0.25 mcg/mL 100% susceptible.
Lagace-Wiens 2012 2009-2010 Kenya 108 multiple 100% susceptible; 7 (6.5%) isolates with MIC 0.5 or inhibition diameters 25-28 mm.
MIDDLE EAST
AFRICA
Table 2: Most recent published reports of in vitro azithromycin gonococcal susceptibility by regionPubMed search terms: (gonorrhea or gonorrhoeae or gonorrhoea or gonococcus or gonococcal) AND (treatment or therapy or resistance or antibiotics or failure) AND ("2008"[Date - Publication] : "3000"[Date -
Publication]). *Run on March 9, 2013.
NORTH AMERICA
LATIN AMERICA/CARIBBEAN
EUROPE
EASTERN EUROPE/CENTRAL ASIA
Health
Protection
Agency
(GRASP)

Mehta 2011 2002-2009 Kenya 105 S ≤1 mcg/mL 100% susceptible; "marginally" significant increase in MICs over time (p = 0.097).
Brown 2010 2007 Malawi 100 S ≤0.5 mcg/mL 100% susceptible.
Lahra (AGSP) 2012 2011 Australia 4,129 S <1.0 mcg/mL 98.9% susceptible; azithro data not included in previous reports.
Ahmed 2010 1997-2006 Bangladesh 1,767 S ≤1 mcg/mL 99.9% susceptible (1 isolate in 2002 with MIC >1);MIC50 and MIC90 increased over time.
Yuan 2011 2008-2009 China 318 S ≤1 mcg/mL 94.7% susceptible overall (96.9% susceptible in 2008, 92.4% susceptible in 2009).
Lo 2012 2010 Hong Kong 485 S ≤0.25 mcg/mL 69.7% susceptible, 22.3% intermediate (MIC 0.5), 8% resistant (MIC ≥1). 1.6% had MIC ≥256.
Bala 2011 2004-2009 India 274 S <1 mcg/mL 99.6% susceptible (1 isolate with MIC ≥1 in 2009).
Sethi 2013 2007-2011 India, Pakistan, Bhutan 65 S ≤0.25 76.9% susceptible, 15.4% intermediate (MIC = 0.5), 7.7% resistant (MIC >0.5); MIC range 0.016-4.
Tanaka 2011 2008-2009 Japan 494 ? 96.6% susceptible. Paper in Japanese, minimal information from English abstract.
Jabeen 2011 2007-2009 Pakistan 100 disc diffusion 100% susceptible.
Chen 2009 1999-2004 Taiwan (Southern) 65 <1 mcg/mL 100% had MIC <1.
Olsen 2013 2011 Vietnam 108 S ≤0.25 mcg/mL 62% susceptible, 27% intermediate (MIC=0.5), 11% resistant (MIC>0.5).
Lahra (WHO
WPR and
SEAR GASP)
2012 20106 WHO WPR and SEAR
countries/jurisdictions5,295 varied
"There was no resistance (0%) reported from Cambodia; Vietnam and India and very low rates (<1%) from
Australia. In contrast, 34% resistance was reported from Mongolia."
ASIA/PACIFIC

Table 3: Cephalosporin treatment failure - any year
Author
Year
published
Year
collected Country Drug # Failed
Site of
infection MIC's (mcg/ml) Resolution Comments
Allen 2013 2010-2011 Canadacefixime 400 mg (n=7)
or 800 mg (n=2) PO9
4 urethral, 2
pharyngeal, 3
rectal
cefixime MIC 0.12 (n=7),
0.06 (n=1), ≤0.03 (n=1)
ceftriaxone 250 mg IM (n=6)
or cefixime 800 mg PO (n=3)
Denied re-exposure; pre- and post-treatment
strains identical by molecular typing, all but 1
had penA mosaic allele XXXIV. 5 pts who failed
were co-treated with doxy, 1 with azithro.
Chen 2013 2010 Australia ceftriaxone 500 mg IM 1 pharyngeal ceftriaxone MIC 0.03-0.06 azithromycin 2 g PO
NG-MAST of pre- and post-treatment strains
identical (ST1407), penA mosaic allele XXXIV;
denied re-exposure.
Lewis 2013 2012 South Africa2 courses of cefixime
400 mg PO1 urethral
cefixime MIC 0.25,
ceftriaxone MIC 0.064
Treated with ceftriaxone 2 gm
IV x 1, lost to follow-up
2nd related isolate also identified in Joburg
(cefixime MIC 0.25, ceftriaxone MIC 0.125,
treated with azithro 1 gm x 1 and lost to f/u); both
with penA mosaic allele XXXIV, NG-MAST
ST4822 and MLST ST1901.
Lo 2012 ? Hong Kong ceftibuten 400 mg PO 30 ? ? ?
"Among 35 patients who received oral ceftibuten
treatment and returned for follow-up with TOC
specimens, only five were documented to have
cleared the infection."
Unemo 2012 2011 Slovenia ceftriaxone 250 mg IM 1 pharyngealcefixime MIC 0.25,
ceftriaxone MIC 0.125
ceftriaxone 250 mg IM +
azithromycin 1 g PO
NG-MAST of pre- and post-treatment strains
identical (ST1407), penA mosaic allele XXIV;
denied re-exposure.
Unemo 2012 2010 Francecefixime 200 mg PO x 2
(6 hrs apart)1 urethral
cefixime MIC 4, ceftriaxone
MIC 1-2gentamicin 160 mg IM
MSM, no travel, denied re-exposure; strain F89;
PBP 2 XXXIV mosaic allele with A501P
alteration.
Ohnishi x 2 2011 2009 Japan ceftriaxone 1 g IV 1 pharyngealcefixime MIC 8, ceftriaxone
MIC 2-4
2nd dose of ceftriaxone (dose
not specified)
FSW, H041, MLST ST7363, NG-MAST ST4220,
unique penA mosaic allele (highly similar to X).
Unemo 2011 2011 Austria
cefixime 400 mg PO QD
x 7 days, then cefixime
400 mg PO QD x 14
days
1 urethralcefixime MIC 1.0,
ceftriaxone MIC 0.5azithromycin 2 g PO
MSM, denied re-exposure; MLST ST1901, NG-
MAST ST1407, novel penA mosaic allele (XXXIV
with T534A alteration).
Forsyth 2011 ? UKcefixime 400 mg PO +
azithro 1 gm PO1 urethral
cefixime MIC ≥0.25,
ceftriaxone MIC ≤0.12,
azithro MIC ≤1
ceftriaxone 500 mg IM MSM, denied re-exposure.
Ison 2011 2010 England
cefixime 400 mg PO,
then 2 courses of
azithromycin 2 g PO
1 urethral
cefixime MIC 0.19,
ceftriaxone MIC 0.047-
0.064, azithro 0.25-->1.0
ceftriaxone 250 mg IMMSW, reported sex between 1st and 2nd
courses of azithro.
Ison 2011 2010 England
cefixime 400 mg PO x 1
+ doxy 100 mg PO BID
x 7 days
1 urethral
Pre-treatment: cefixime
and ceftriaxone "sensitive"
by disc diffusion; post-
treatment: cefixime 0.25,
ceftriaxone 0.064
ceftriaxone 250 mg IM MSM, denied re-exposure.
Unemo 2011 2010 Sweden
ceftriaxone 250 mg IM,
then ceftriaxone 500 mg
IM
1 pharyngealcefixime MIC 0.5,
ceftriaxone MIC 0.125-0.25ceftriaxone 1 g IV
MSW, exposure to female partner from Japan,
denied re-exposure; pre- and post-treatment
isloates indistinguishable by NG-MAST
(ST2958).
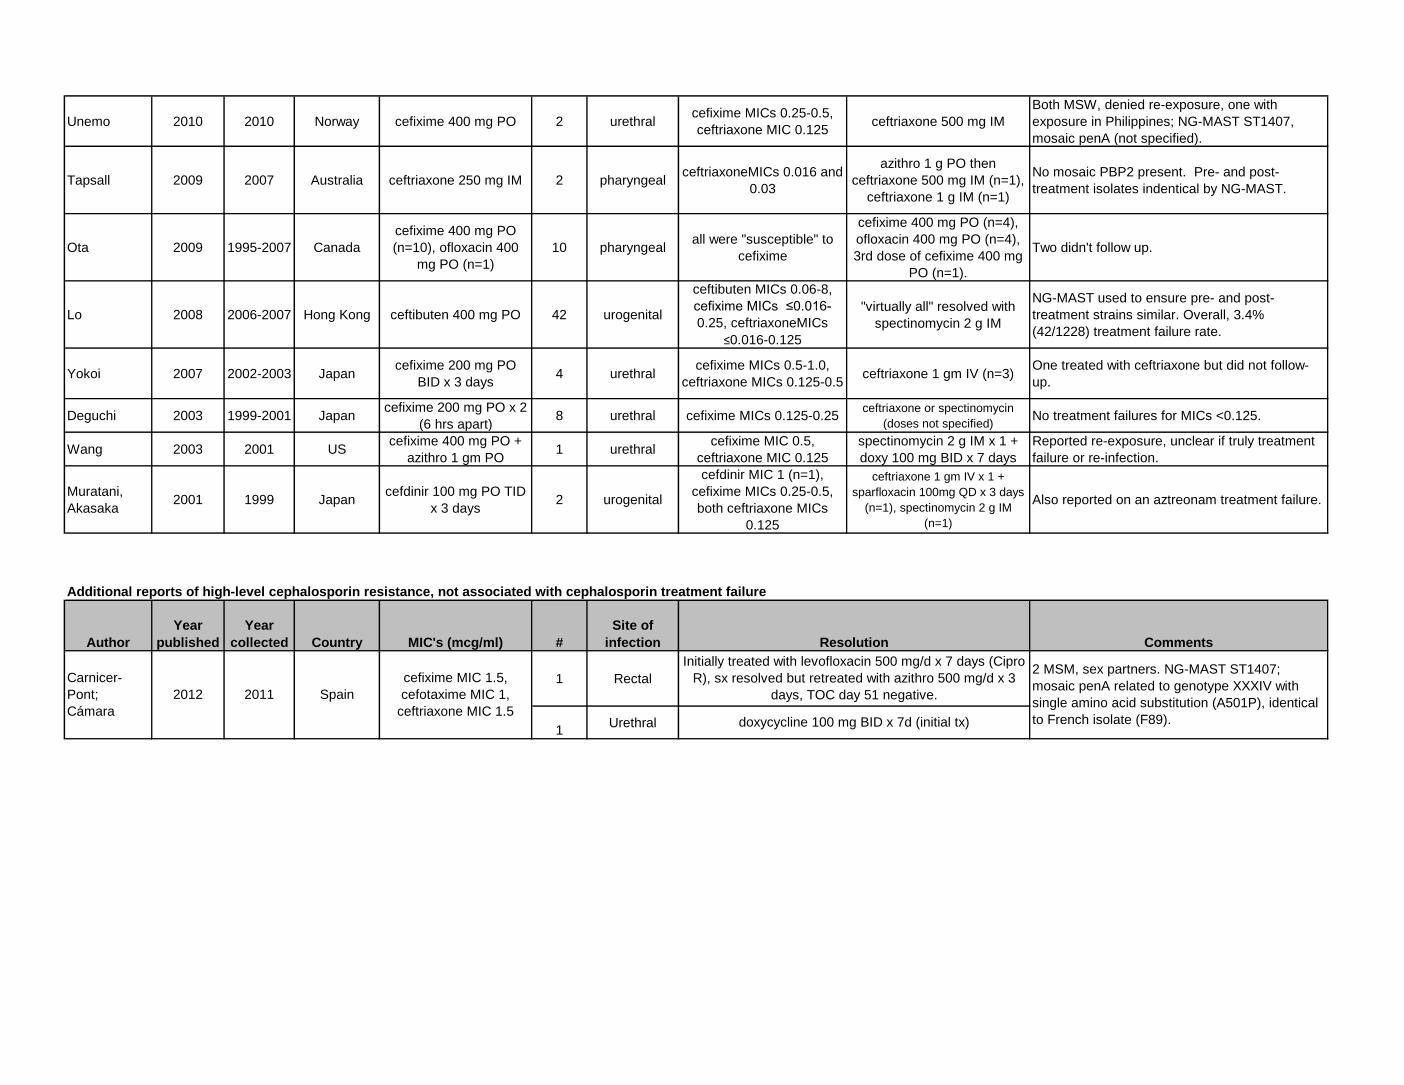
Unemo 2010 2010 Norway cefixime 400 mg PO 2 urethralcefixime MICs 0.25-0.5,
ceftriaxone MIC 0.125ceftriaxone 500 mg IM
Both MSW, denied re-exposure, one with
exposure in Philippines; NG-MAST ST1407,
mosaic penA (not specified).
Tapsall 2009 2007 Australia ceftriaxone 250 mg IM 2 pharyngealceftriaxoneMICs 0.016 and
0.03
azithro 1 g PO then
ceftriaxone 500 mg IM (n=1),
ceftriaxone 1 g IM (n=1)
No mosaic PBP2 present. Pre- and post-
treatment isolates indentical by NG-MAST.
Ota 2009 1995-2007 Canada
cefixime 400 mg PO
(n=10), ofloxacin 400
mg PO (n=1)
10 pharyngealall were "susceptible" to
cefixime
cefixime 400 mg PO (n=4),
ofloxacin 400 mg PO (n=4),
3rd dose of cefixime 400 mg
PO (n=1).
Two didn't follow up.
Lo 2008 2006-2007 Hong Kong ceftibuten 400 mg PO 42 urogenital
ceftibuten MICs 0.06-8,
cefixime MICs ≤0.016-
0.25, ceftriaxoneMICs
≤0.016-0.125
"virtually all" resolved with
spectinomycin 2 g IM
NG-MAST used to ensure pre- and post-
treatment strains similar. Overall, 3.4%
(42/1228) treatment failure rate.
Yokoi 2007 2002-2003 Japancefixime 200 mg PO
BID x 3 days4 urethral
cefixime MICs 0.5-1.0,
ceftriaxone MICs 0.125-0.5ceftriaxone 1 gm IV (n=3)
One treated with ceftriaxone but did not follow-
up.
Deguchi 2003 1999-2001 Japancefixime 200 mg PO x 2
(6 hrs apart)8 urethral cefixime MICs 0.125-0.25
ceftriaxone or spectinomycin
(doses not specified)No treatment failures for MICs <0.125.
Wang 2003 2001 UScefixime 400 mg PO +
azithro 1 gm PO1 urethral
cefixime MIC 0.5,
ceftriaxone MIC 0.125
spectinomycin 2 g IM x 1 +
doxy 100 mg BID x 7 days
Reported re-exposure, unclear if truly treatment
failure or re-infection.
Muratani,
Akasaka2001 1999 Japan
cefdinir 100 mg PO TID
x 3 days2 urogenital
cefdinir MIC 1 (n=1),
cefixime MICs 0.25-0.5,
both ceftriaxone MICs
0.125
ceftriaxone 1 gm IV x 1 +
sparfloxacin 100mg QD x 3 days
(n=1), spectinomycin 2 g IM
(n=1)
Also reported on an aztreonam treatment failure.
Author
Year
published
Year
collected Country MIC's (mcg/ml) #
Site of
infection Comments
1 Rectal
1Urethral
20112012
Carnicer-
Pont;
Cámara
cefixime MIC 1.5,
cefotaxime MIC 1,
ceftriaxone MIC 1.5
Additional reports of high-level cephalosporin resistance, not associated with cephalosporin treatment failure
Resolution
Initially treated with levofloxacin 500 mg/d x 7 days (Cipro
R), sx resolved but retreated with azithro 500 mg/d x 3
days, TOC day 51 negative.
doxycycline 100 mg BID x 7d (initial tx)
2 MSM, sex partners. NG-MAST ST1407;
mosaic penA related to genotype XXXIV with
single amino acid substitution (A501P), identical
to French isolate (F89).
Spain
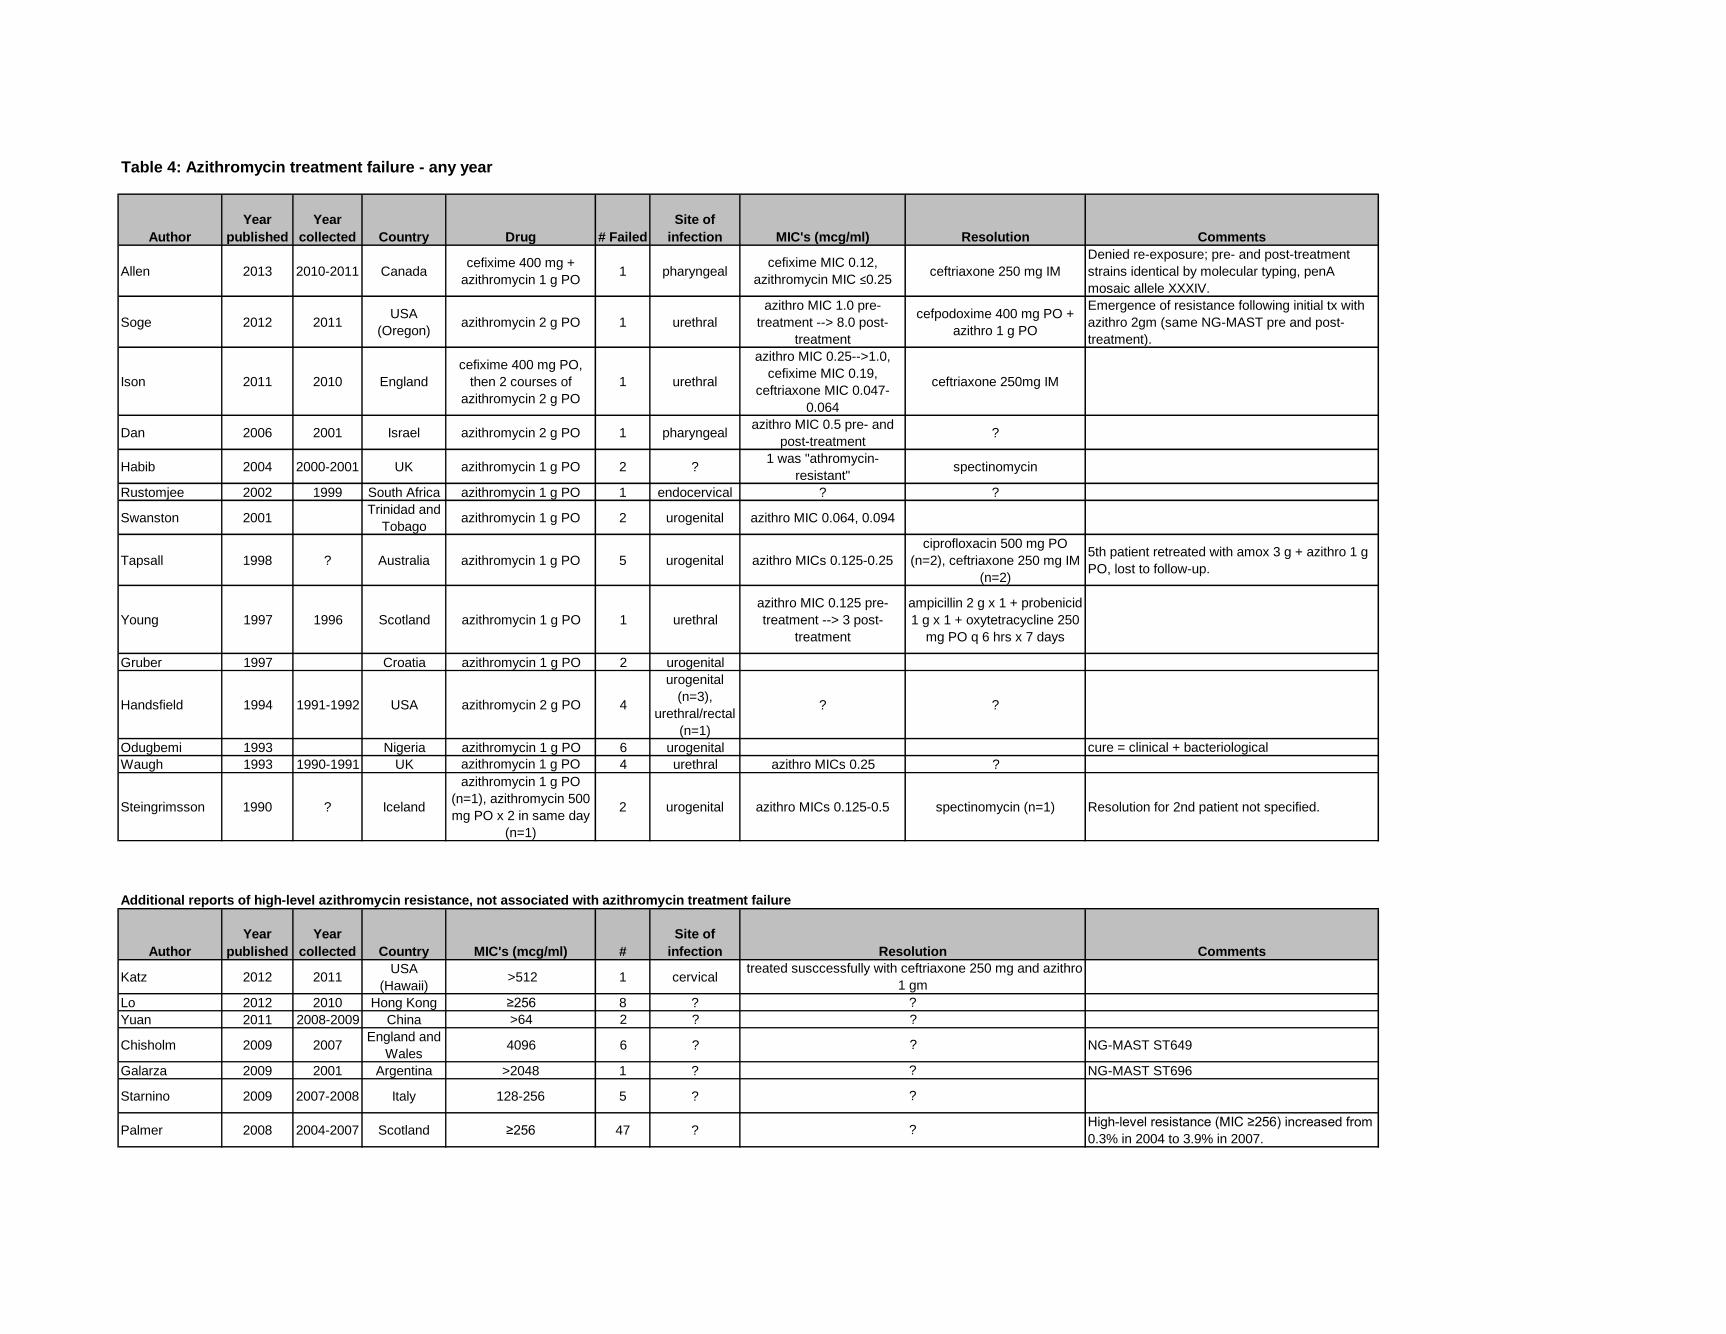
Table 4: Azithromycin treatment failure - any year
Author
Year
published
Year
collected Country Drug # Failed
Site of
infection MIC's (mcg/ml) Resolution Comments
Allen 2013 2010-2011 Canadacefixime 400 mg +
azithromycin 1 g PO1 pharyngeal
cefixime MIC 0.12,
azithromycin MIC ≤0.25ceftriaxone 250 mg IM
Denied re-exposure; pre- and post-treatment
strains identical by molecular typing, penA
mosaic allele XXXIV.
Soge 2012 2011USA
(Oregon)azithromycin 2 g PO 1 urethral
azithro MIC 1.0 pre-
treatment --> 8.0 post-
treatment
cefpodoxime 400 mg PO +
azithro 1 g PO
Emergence of resistance following initial tx with
azithro 2gm (same NG-MAST pre and post-
treatment).
Ison 2011 2010 England
cefixime 400 mg PO,
then 2 courses of
azithromycin 2 g PO
1 urethral
azithro MIC 0.25-->1.0,
cefixime MIC 0.19,
ceftriaxone MIC 0.047-
0.064
ceftriaxone 250mg IM
Dan 2006 2001 Israel azithromycin 2 g PO 1 pharyngealazithro MIC 0.5 pre- and
post-treatment?
Habib 2004 2000-2001 UK azithromycin 1 g PO 2 ?1 was "athromycin-
resistant"spectinomycin
Rustomjee 2002 1999 South Africa azithromycin 1 g PO 1 endocervical ? ?
Swanston 2001Trinidad and
Tobagoazithromycin 1 g PO 2 urogenital azithro MIC 0.064, 0.094
Tapsall 1998 ? Australia azithromycin 1 g PO 5 urogenital azithro MICs 0.125-0.25
ciprofloxacin 500 mg PO
(n=2), ceftriaxone 250 mg IM
(n=2)
5th patient retreated with amox 3 g + azithro 1 g
PO, lost to follow-up.
Young 1997 1996 Scotland azithromycin 1 g PO 1 urethral
azithro MIC 0.125 pre-
treatment --> 3 post-
treatment
ampicillin 2 g x 1 + probenicid
1 g x 1 + oxytetracycline 250
mg PO q 6 hrs x 7 days
Gruber 1997 Croatia azithromycin 1 g PO 2 urogenital
Handsfield 1994 1991-1992 USA azithromycin 2 g PO 4
urogenital
(n=3),
urethral/rectal
(n=1)
? ?
Odugbemi 1993 Nigeria azithromycin 1 g PO 6 urogenital cure = clinical + bacteriological
Waugh 1993 1990-1991 UK azithromycin 1 g PO 4 urethral azithro MICs 0.25 ?
Steingrimsson 1990 ? Iceland
azithromycin 1 g PO
(n=1), azithromycin 500
mg PO x 2 in same day
(n=1)
2 urogenital azithro MICs 0.125-0.5 spectinomycin (n=1) Resolution for 2nd patient not specified.
Author
Year
published
Year
collected Country MIC's (mcg/ml) #
Site of
infection Comments
Katz 2012 2011USA
(Hawaii) >512 1 cervical
Lo 2012 2010 Hong Kong ≥256 8 ?
Yuan 2011 2008-2009 China >64 2 ?
Chisholm 2009 2007England and
Wales4096 6 ? NG-MAST ST649
Galarza 2009 2001 Argentina >2048 1 ? NG-MAST ST696
Starnino 2009 2007-2008 Italy 128-256 5 ?
Palmer 2008 2004-2007 Scotland ≥256 47 ?High-level resistance (MIC ≥256) increased from
0.3% in 2004 to 3.9% in 2007.?
?
?
?
Additional reports of high-level azithromycin resistance, not associated with azithromycin treatment failure
Resolution
treated susccessfully with ceftriaxone 250 mg and azithro
1 gm
?
?

Author
Year
published
Country,
Year of
study Drug
Site of
infection Study design Percentage cured Comments
Kirkcaldy 2014USA, 2010-
2012
dual treatment with
gemifloxacin 320 mg PO
+ azithromycin 2 g PO
urogenital randomized clinical trial99.5% (198/199; lower 1-sided exact 95% CI bound
97.6%)Gastrointestinal adverse events common
Kirkcaldy 2014USA, 2010-
2012
dual treatment with
gentamicin 240 IM +
azithromycin 2 g PO
urogenital randomized clinical trial100% (202/202; lower 1-sided exact 95% CI bound
98.5%)Gastrointestinal adverse events common
Kirkcaldy 2014USA, 2010-
2012
dual treatment with
gemifloxacin 320 mg PO
+ azithromycin 2 g PO
rectal randomized clinical trial 5/5 rectal infections cured Gastrointestinal adverse events common
Kirkcaldy 2014USA, 2010-
2012
dual treatment with
gentamicin 240 IM +
azithromycin 2 g PO
rectal randomized clinical trial 1/1 rectal infections cured Gastrointestinal adverse events common
Allen 2013Canada,
2010-2011
cefixime 400 mg or 800
mg PO +/- doxy or
azithro
urogenital,
rectal, or
pharyngeal
retrospective analysis93.0% (120/129) (excluding those with possible re-
exposure)
133/291 returned for TOC, 13 had positive TOC, 4
with possible re-exposure. Of pts with TOC: Tx failure
in 9/133 (6.8%) overall, 25.0% if MIC 0.12, 1.9% if
MIC <0.12. Of all pts: Tx failure in 9/291 (3.1%)
overall, 11.9% if MIC ≥0.12, 0.9% if MIC <0.12
Bai 2012ceftriaxone 250 mg vs.
ceftotaxime 500 mg
urogenital,
rectal, or
pharyngeal
systematic review and meta-analysis of randomized
control trials
ceftriaxone: 78.9% (476/603); cefotaxime 74.6%
(452/606); OR 1.25 (95% CI 0.95-1.66)denominator was patients enrolled
Bai 2012ceftriaxone 250 mg vs.
cefixime 400 mg
urogenital,
rectal, or
pharyngeal
systematic review and meta-analysis of randomized
control trials
ceftriaxone: 87.4% (202/234); cefixime 78.1%
(272/348); *OR 1.77 (95% CI 1.11-2.80)denominator was patients enrolled
Bai 2012ceftriaxone 250 mg vs.
cefixime 800 mg
urogenital,
rectal, or
pharyngeal
systematic review and meta-analysis of randomized
control trials
ceftriaxone: 88.5% (139/157); cefixime: 90.1%
(128/142); OR 1.19 (95% CI 0.19-7.39)denominator was patients enrolled
Bai 2012ceftriaxone 125 mg vs.
cefixime 400 mg
urogenital,
rectal, or
pharyngeal
systematic review and meta-analysis of randomized
control trials
ceftriaxone 95.3% (41/43); cefixime 96.2% (50/52); OR
0.82 (95% CI 0.11-6.08)denominator was patients enrolled
Bai 2012ceftriaxone 125 mg vs.
spectinomycin 2 g
urogenital,
rectal, or
pharyngeal
systematic review and meta-analysis of randomized
control trials
ceftriaxone 88.5% (85/96); spectinomycin 69.2%
(72/104); *OR 3.44 (95% CI 1.08-10.90)denominator was patients enrolled
Bai 2012ceftriaxone 250 mg vs.
spectinomycin 2 g
urogenital,
rectal, or
pharyngeal
systematic review and meta-analysis of randomized
control trials
ceftriaxone 92.3% (204/221); spectinomycin 88.1%
(223/253); OR 1.25 (95% CI 0.64-2.42)denominator was patients enrolled
Dowell 2012gentamicin 240 mg or
280 mg IM x 1urogenital systematic review and meta-analysis of clinical trials pooled cure rate 91.5%, 95% CI 88.1%-94.0% based on 3 studies, 26 studies excluded
Bignell 2010 azithromycin 1 g urogenital systematic review and meta-analysis of clinical studies pooled cure rate 97.0% (688/709), 95% CI 95.2%-97.9%
based on 10 clinical trials; if exclude retrospective
data (Habib), cure rate 96.5% (520/539), 95% CI
94.3%-97.6%)
Bignell 2010 azithromycin 2 g urogenital systematic review and meta-analysis of clinical studies pooled cure rate 99% (392/396), 95% CI 97.5%-99.6%based on 2 clinical trials, included patients infected at
multiple sites
Bignell 2010 azithromycin varied rectal systematic review and meta-analysis of clinical studiespooled cure rate 97.1% (34/35) - failure in 1 patient
receiving 2g dosebased on 3 clinical trials
Shams-ur-
Rehman2009
Saudi
Arabia,
2003-2004
ciprofloxacin 500 mg PO urogenital randomized clinical trial 80% (80/100)
Failure defined as persistence of symptoms with
presence of gram-negative diplococci and pus on day
5 following treatment; no comment on re-exposure.
Table 5: New data on clinical effectiveness of treatment for uncomplicated urogenital/rectal gonorrhea (and older summed clinical trials data)PubMed search terms: (gonorrhea or gonorrhoeae or gonorrhoea or gonococcus or gonococcal) AND (treatment or therapy or resistance or antibiotics or failure) AND ("2008"[Date - Publication] : "3000"[Date - Publication]). *Run on March 9, 2013.
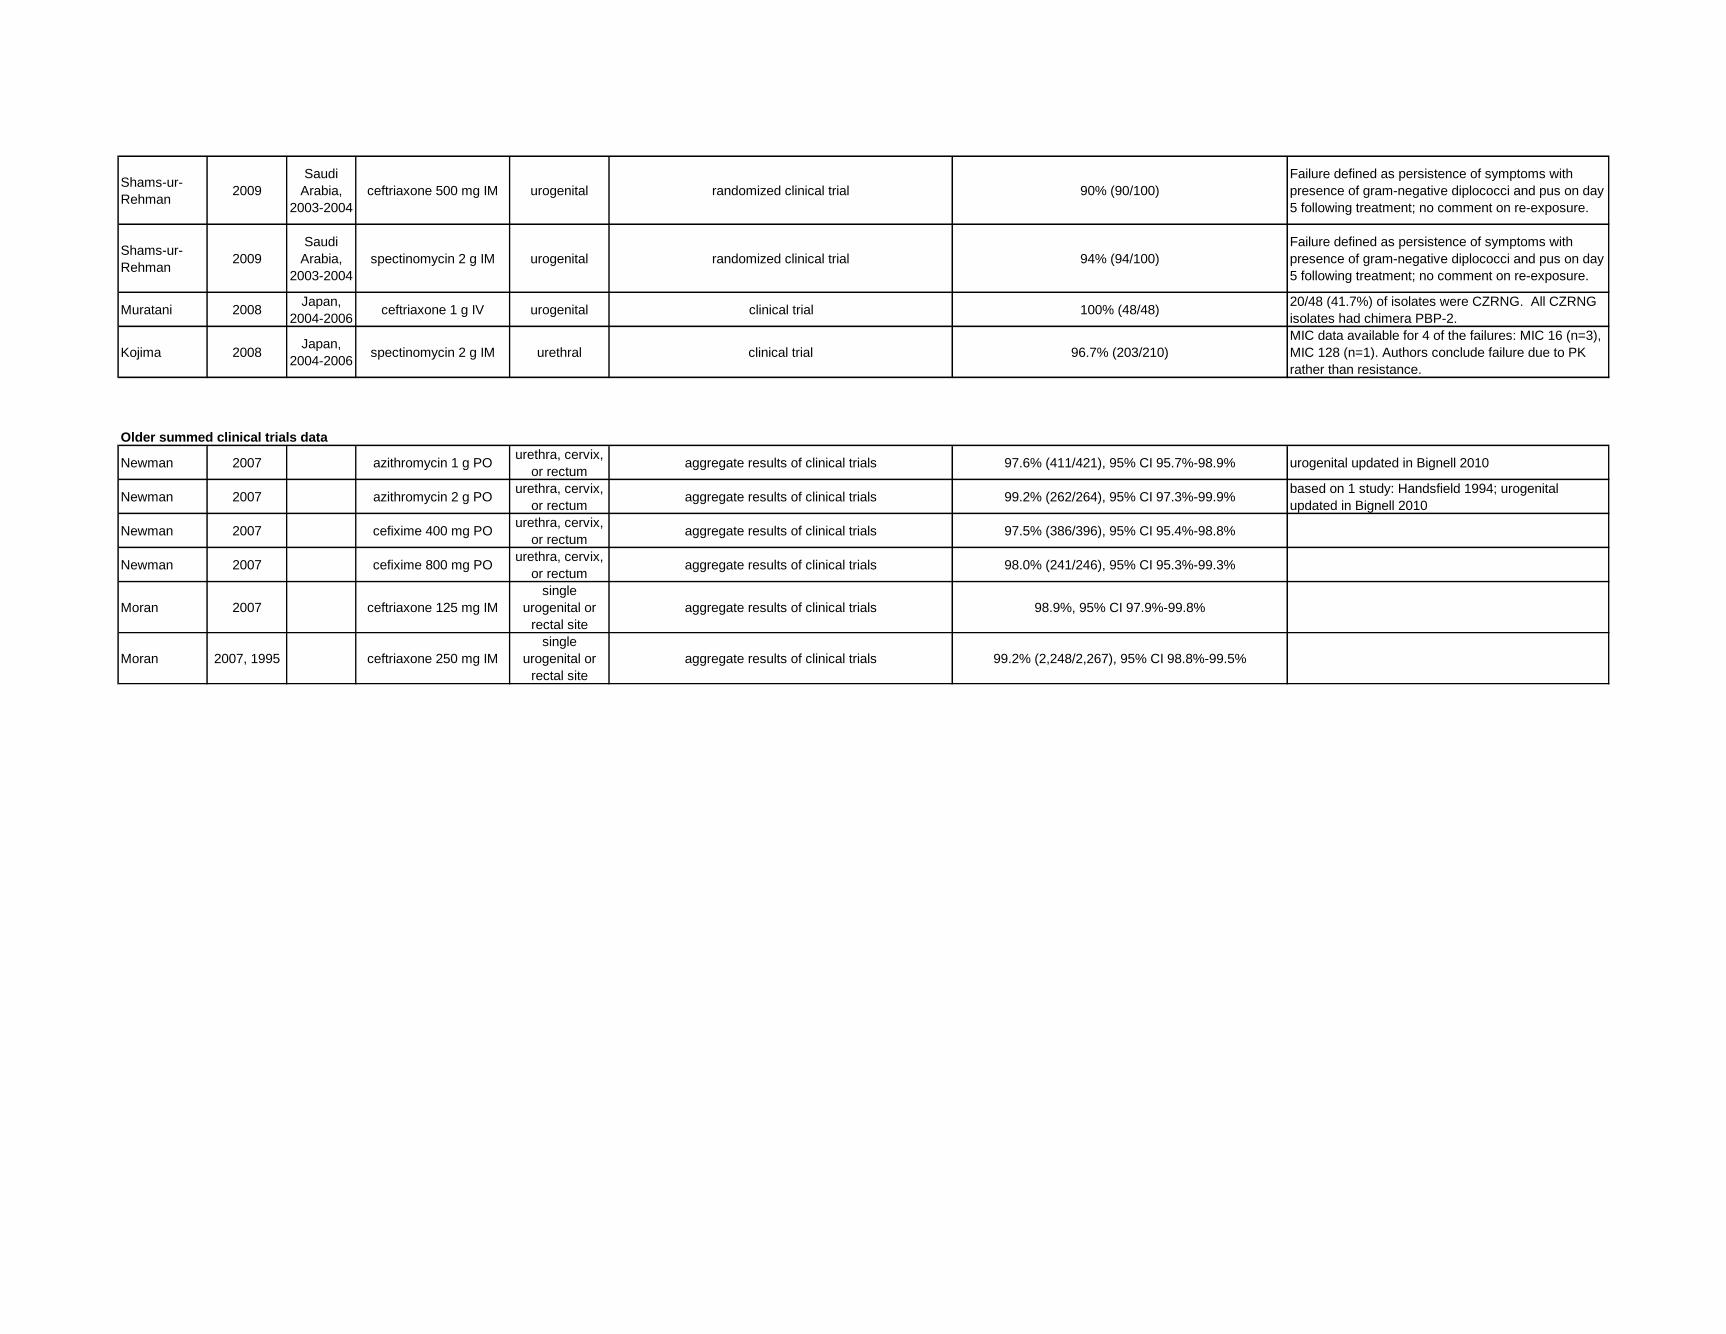
Shams-ur-
Rehman2009
Saudi
Arabia,
2003-2004
ceftriaxone 500 mg IM urogenital randomized clinical trial 90% (90/100)
Failure defined as persistence of symptoms with
presence of gram-negative diplococci and pus on day
5 following treatment; no comment on re-exposure.
Shams-ur-
Rehman2009
Saudi
Arabia,
2003-2004
spectinomycin 2 g IM urogenital randomized clinical trial 94% (94/100)
Failure defined as persistence of symptoms with
presence of gram-negative diplococci and pus on day
5 following treatment; no comment on re-exposure.
Muratani 2008Japan,
2004-2006ceftriaxone 1 g IV urogenital clinical trial 100% (48/48)
20/48 (41.7%) of isolates were CZRNG. All CZRNG
isolates had chimera PBP-2.
Kojima 2008Japan,
2004-2006spectinomycin 2 g IM urethral clinical trial 96.7% (203/210)
MIC data available for 4 of the failures: MIC 16 (n=3),
MIC 128 (n=1). Authors conclude failure due to PK
rather than resistance.
Older summed clinical trials data
Newman 2007 azithromycin 1 g POurethra, cervix,
or rectumaggregate results of clinical trials 97.6% (411/421), 95% CI 95.7%-98.9% urogenital updated in Bignell 2010
Newman 2007 azithromycin 2 g POurethra, cervix,
or rectumaggregate results of clinical trials 99.2% (262/264), 95% CI 97.3%-99.9%
based on 1 study: Handsfield 1994; urogenital
updated in Bignell 2010
Newman 2007 cefixime 400 mg POurethra, cervix,
or rectumaggregate results of clinical trials 97.5% (386/396), 95% CI 95.4%-98.8%
Newman 2007 cefixime 800 mg POurethra, cervix,
or rectumaggregate results of clinical trials 98.0% (241/246), 95% CI 95.3%-99.3%
Moran 2007 ceftriaxone 125 mg IM
single
urogenital or
rectal site
aggregate results of clinical trials 98.9%, 95% CI 97.9%-99.8%
Moran 2007, 1995 ceftriaxone 250 mg IM
single
urogenital or
rectal site
aggregate results of clinical trials 99.2% (2,248/2,267), 95% CI 98.8%-99.5%

Author
Year
published
Country,
Year of
Study Drug
Site of
infection Study design Percentage cured Comments
Kirkcaldy 2014USA,
2010-2012
dual treatment with
gemifloxacin 320 mg PO
+ azithromycin 2 g PO
pharyngeal randomized clinical trial 15/15 pharyngeal infections curedGastrointestinal adverse events
common
Kirkcaldy 2014USA,
2010-2012
dual treatment with
gentamicin 240 IM +
azithromycin 2 g PO
pharyngeal randomized clinical trial 10/10 pharyngeal infections curedGastrointestinal adverse events
common
Barbee 2013USA,1993-
2011
cefixime/cefpodoxime +
azithropharyngeal retrospective analysis 93.0% (107/115)
Based on 360/1,440 (25%) with re-test
at 7-180 days.
Barbee 2013USA,1993-
2011
cefixime/cefpodoxime +
doxypharyngeal retrospective analysis 66.7% (28/42)
*RR of positive re-test: 4.18, 95% CI
1.64-10.7 (vs. oral ceph + azithro)
Barbee 2013USA,1993-
2011
cefixime/cefpodoxime
monotherapypharyngeal retrospective analysis 70.2% (40/57)
*RR of positive re-test: 3.98, 95% CI
1.70-9.36 (vs. oral ceph + azithro)
Barbee 2013USA,1993-
2011
ceftriaxone +
azithro/doxypharyngeal retrospective analysis 88.7% (55/62)
RR of positive re-test: 1.20, 95% CI
0.43-3.33 (vs. oral ceph + azithro)
Barbee 2013USA,1993-
2011ceftriaxone monotherapy pharyngeal retrospective analysis 90.9% (40/44)
RR of positive re-test: 0.81, 95% CI
0.18-3.60 (vs. oral ceph + azithro)
Bignell 2010 azithromycin varied pharyngeal systematic review and meta-analysis of clinical studiespooled cure rate 97.9% (46/47) - failure in 1 patient
receiving 2g dose (MIC 0.5)
Based on 6 clinical trials. By my
calculation, cure rate for 2 g: 97.5%
(39/40), 95% CI 87.1%-99.4%; cure
rate for 1 g: 100% (5/5), 95% CI 54.1%-
99.6%.
Manavi 2010England,
2001-2008cefixime 400 mg PO pharyngeal retrospective analysis 100% (27/27)
Based on 27/46 who returned for TOC.
Diagnosis, TOC by culture only.
Ota 2009Canada,
1995-2007
cefixime 400 mg or
ofloxacin 400 mgpharyngeal retrospective analysis 91% (111/122)
MSM only. 10 of the failures were
treated with cefixime, 1 was treated with
ofloxacin.
Muratani 2008Japan,
2004-2006ceftriaxone 1 g IV pharyngeal clinical trial 100% (25/25) 15/25 (60%) of isolates were CZRNG.
All CZRNG isolates had chimera PBP-2.
Older summed clinical trials data
Moran 1995 azithromycin 1 g PO pharyngeal aggregate results of clinical trials 100% (3/3), 95% CI 29.2%-100% updated in Bignell 2010
Moran 2007, 1995 azithromycin 2 g PO pharyngeal aggregate results of clinical trials 100% (19/19), 95% CI 82.3%-100% updated in Bignell 2010
Moran 2007 cefixime 400 mg PO pharyngeal aggregate results of clinical trials 92.3%, 74.9%-99.1%
Moran 2007, 1995 cefixime 800 mg PO pharyngeal aggregate results of clinical trials 80.0% (12/15), 95% CI 51.9%-95.7%
Moran 2007 ceftriaxone 125 mg IM pharyngeal aggregate results of clinical trials 94.1%, 95% CI 85.6%-98.4%
Moran 2007 ceftriaxone 250 mg IM pharyngeal aggregate results of clinical trials 99.0%, 95% CI 94.4%-100%
Barbee 2013 USA azithromycin 1 or 2 g pharyngeal retrospective analysis 86.9% (13/15)
Barbee 2013 USA cefixime 400 mg PO pharyngeal retrospective analysis 79.2% (19/24)
Sathia 2007 UK cefixime 400 mg PO pharyngeal retrospective analysis 87.6% (14/16)
Barbee 2013 USAcefixime 400 mg PO +
doxycyclinepharyngeal retrospective analysis 71.0% (22/31)
PubMed search terms: (gonorrhea or gonorrhoeae or gonorrhoea or gonococcus or gonococcal) AND (treatment or therapy or resistance or antibiotics or failure) AND ("2008"[Date - Publication] : "3000"[Date - Publication]). *Run on March
9, 2013.
Table 6: New data on clinical effectiveness of treatment for pharyngeal gonorrhea (and older summed clinical trials data)
Recent (2005-present) retrospective studies of dual treatment for pharyngeal infection, by regimen

Sathia 2007 UK
cefixime 400 mg +
doxycycline 100 mg PO
BID x 7 days
pharyngeal retrospective analysis 73.3% (11/15)
Barbee 2013 USAcefixime 400 mg PO +
azithromycinpharyngeal retrospective analysis 94.0% (47/50)
McMillan 2007 UKcefixime 400 mg +/-
azithromycin 1 g pharyngeal retrospective analysis 97.8% (44/45)
83% of 53 treated patients received
cefixime + azithro, unclear which
treatment failed.
Sathia 2007 UKcefixime 400 mg +
azithromycin 1 g POpharyngeal retrospective analysis 100% (24/24)
Barbee 2013 USAceftriaxone 125/250 mg
IMpharyngeal retrospective analysis 90.9% (40/44)
Sathia 2007 UK ceftriaxone 250 mg IM pharyngeal retrospective analysis 88.2% (15/17)
Barbee 2013 USAceftriaxone 125/250 mg
IM + doxycyclinepharyngeal retrospective analysis 100% (2/2)
Sathia 2007 UK
ceftriaxone 250 mg IM +
doxycycline 100 mg PO
BID x 7 days
pharyngeal retrospective analysis 90.9% (10/11)
Barbee 2013 USAceftriaxone 125/250 mg
IM + azithromycin POpharyngeal retrospective analysis 88.3% (53/60)
Sathia 2007 UKceftriaxone 250 mg IM +
azithromycin 1 g POpharyngeal retrospective analysis 100% (5/5)

Author
Year
published Country Drug Study design Findings Comments
Arruda 2011 Brazil
3 extracts from
Jacaranda
cuspidifolia Mart.
in vitro2/3 with antigonococcal activity by disc diffusion,
MICs 25.2 mg/mL
Biedenbach 2012 USAJNJ-Q2 (novel
fluoroquinolone)in vitro MIC50/90 = 0.03/0.25 mcg/mL (range 0.004-0.25)
MIC50s: ceftriaxone (0.015 mcg/mL) < JNJ-Q2 (0.03 mcg/mL) <
ciprofloxacin (0.25 mcg/mL) = azithromycin (0.25 mcg/mL) <
tetracycline (1 mcg/mL) < penicillin (2 mcg/mL)
Chomnawang 2009 Thailand22 plant extracts and
purified berberinein vitro
4/22 with high antigonococcal activity by disc
diffusion, MICs 47-253 mcg/mL; purified berberine
MICs 13-21 mcg/mL
Cybulska 2011 Canada14 plant extracts,
berberinein vitro
4/14 with MIC50 16-64; berberine had high
antigonococcal activity by disc diffusion
De Villiers 2010South
Africa
extracts of 15
Cussonia and
related species
in vitromethanolic extracts: MICs 20-400 mcg/mL; aqueous
extracts: MICs 100-700 mcg/mL
Fedarovich 2012 US50,000 compound
libraryin vitro 7 with antigonococcal activity, MICs 2-32 mcg/mL
Fujimoto 2013 Japan
SM-295291 (novel
parenteral 2-aryl
carbapenem)
in vitro MIC 50/90 = 0.5/1 mcg/mL, range 0.0313-1
MIC50s: cefditoren (0.0313 mcg/mL) < SM-369926 (0.25 mcg/mL) =
tebipenem (0.25 mcg/mL) < SM-295291 (0.5 mcg/mL) =
Clarithromycin (0.5 mcg/mL) < faropenem (2 mcg/mL) < levofloxacin
(4 mcg/mL)
Fujimoto 2013 Japan
SM-369926 (novel
parenteral 2-aryl
carbapenem)
in vitro MIC 50/90 = 0.25/0.25 mcg/mL, range 0.0156-0.25
MIC50s: cefditoren (0.0313 mcg/mL) < SM-369926 (0.25 mcg/mL) =
tebipenem (0.25 mcg/mL) < SM-295291 (0.5 mcg/mL) =
Clarithromycin (0.5 mcg/mL) < faropenem (2 mcg/mL) < levofloxacin
(4 mcg/mL)
Golparian 2012solithromycin (CEM-
101)in vitro
MIC50/90 = 0.125/0.25 mcg/mL (range 0.001-32
mcg/mL)
MIC50s: ceftriaxone (0.016 mcg/mL) < cefixime (0.032 mcg/mL) <
solithromycin (0.125 mcg/mL) < telithromycin (0.25 mcg/mL) <
azithromycin (0.5 mcg/mL) < ampicillin (1 mcg/mL) < ciprofloxacin (4
mcg/mL) = tetracycline (4 mcg/mL) < spectinomycin (15 mcg/mL)
Jones 2008 USDC-159a (new
fluoroquinolone)in vitro MIC50/90 = 1/1 mcg/mL in cipro-resistant strains
MIC50s: ceftriaxone (0.06 mcg/mL) < DC-159a (1 mcg/mL) <
ciprofloxacin (4 mcg/mL) = penicillin (4 mcg/mL) = tetracycline (4
mcg/mL) < levofloxacin (8 mcg/mL).
Jones 2009 US iclaprim in vitro MIC 50/90 = 4/8 mcg/mLdihydrofolate reductase inhibitor, mode of action similar to
trimethoprim
Jones 2010 USfusidic acid (CEM-
102)in vitro MIC 50/90 = 0.5/1 mcg/mL
MIC50s: ceftriaxone (≤0.008 mcg/mL) < ciprofloxacin (0.015 mcg/mL)
< azithromycin (0.25 mcg/mL) <fusidic acid (0.5 mcg/mL) <penicillin
(1 mcg/mL) = tetracycline (1 mcg/mL)
Jones 2008 USzabofloxacin (DW-
224a)in vitro MIC 50/90 = 0.016/0.5 mcg/mL
MIC50s: ceftriaxone (≤0.008 mcg/mL) < zabifloxacin (0.016 mcg/mL)
< ciprofloxacin (0.06 mcg/mL) <azithromycin (0.25 mcg/mL) =
penicillin (0.25 mcg/mL) < tetracycline (1 mcg/mL)
Kuete 2009 Cameroon
diospyrone,
crassiflorone, and
plumbagin
in vitro MICs 1->39 mcg/mL
Kuete 2010 Cameroon5 flavonoids from
Dorstenia barteriin vitro MICs 1->39 mcg/mL
Table 7: New in vitro data for other antimicrobial therapy for gonorrhea
PubMed search terms: (gonorrhea or gonorrhoeae or gonorrhoea or gonococcus or gonococcal) AND (treatment or therapy or resistance or antibiotics or failure) AND ("2008"[Date - Publication] : "3000"[Date -
Publication]). *Run on March 9, 2013.

Lauderdale 2010 Taiwan
nemonoxacin (novel
nonfluorinated
quinolone)
in vitro MICs 0.25-1 mcg/mL in cipro-resistant strains
Mbaveng 2011 Cameroon extracts from 4 plants in vitroextracts from 2 plants had "good" antigonoccal
activity, with MICs 16-256 mcg/mL
Mulaudzi 2011South
Africa
extracts of 12
medicinal plantsin vitro
extracts from 4 plants had good activity by disc
diffusion
Muratani 2009 Japan tebipenem in vitro"potent activity against NG", "activity comparable to
cefixime"Article in Japanese, minimal data available from English abstract.
Putnam 2010 USsolithromycin (CEM-
101)in vitro MIC50/90 = 0.06/0.25 mcg/mL (range 0.03-0.25)
MIC50s: ceftriaxone (≤0.015 mcg/mL), ciprofloxacin (0.008 mcg/mL) <
CEM-101 (0.06 mcg/mL) < azithromycin (0.25 mcg/mL) < penicillin (1
mcg/mL) = tetracycline (1 mcg/mL)
Ruddock 2011 Canada 21 plant extracts in vitro
4/21 with high antigonococcal activity by disc
diffusion; only 1 had significant activity without UV
light activation - MIC100 for 2 compounds from this
extract were 64 mcg/mL and 128 mcg/mL
Shokeen 2009 India 16 medicinal plants in vitro 60% exhibited high activity
Shokeen 2008 India eugenol in vitro MICs 85-256 mcg/mL
Unemo 2012
Sweden
and
Australia
ertapenem in vitro MIC50/90 = 0.032/0.064 mcg/mLin vitro advantage over ceftriaxone for isolates with ceftriaxone
resistance (MICs 0.016-0.064 vs. 0.5-4)
van Vuuren 2010South
Africa
extracts from 18
plantsin vitro 3 with noteworthy activity, MICs 300-1000 mcg/mL