in vivo potential hypoglycemic and in vitro vasorelaxant ... · brasileira de farmacognosia 25 ......
TRANSCRIPT

O
IC
DDFa
b
c
d
a
ARAA
KCDMTAV
I
tsa2ea2
deC
0
Revista Brasileira de Farmacognosia 25 (2015) 473–484
www.sbfgnos ia .org .br / rev is ta
riginal Article
n vivo potential hypoglycemic and in vitro vasorelaxant effects ofecropia glaziovii standardized extracts
aniela Paula Arenda, Talitha Caldas dos Santosa, Luisa Helena Cazarolli d, Mariana Appel Hortc,iva Sonaglioa, Ana Lúcia Gomes dos Santosa, Rosa Maria Ribeiro-do-Vallec,átima Regina Mena Barreto Silvab, Angela Machado de Camposa,∗
Departamento de Ciências Farmacêuticas, Laboratório de Farmacotécnica, Centro de Ciências da Saúde, Universidade Federal de Santa Catarina, Florianópolis, SC, BrazilDepartamento de Bioquímica, Laboratório de Hormônios e Transduc ão de Sinais, Centro de Ciências Biológicas, Universidade Federal de Santa Catarina, Florianópolis, SC, BrazilLaboratório de Farmacologia de Produtos Naturais, Departamento de Farmacologia Centro de Ciências Biológicas, Universidade Federal de Santa Catarina, Florianópolis, SC, BrazilUniversidade Federal da Fronteira Sul, Campus Universitário Laranjeiras do Sul, Laranjeiras do Sul, PR, Brazil
r t i c l e i n f o
rticle history:eceived 19 November 2014ccepted 25 May 2015vailable online 3 July 2015
eywords:ecropia glazioviiecoctionaceration
otal phenolicntihyperglycemic activityasorelaxant activity
a b s t r a c t
The aim of this study is to investigate the effect of Cecropia glaziovii Snethl, Urticaceae, extracts on theoral glucose tolerance curve, on glycemia in alloxan-induced diabetic rats and vasorelaxant effect afterthe extraction process, and to standardize the extractive solutions. The effects of the process variablesand their interactions were calculated in relation to dry residue, pH, total phenolic results and chemicalmarker content. Furthermore, the effect of the extracts (400 mg/kg), chlorogenic (2 or 15 mg/kg) andcaffeic acids (2 mg/kg) were investigated on the oral glucose tolerance curve and on glycemia in alloxan-induced diabetic rats. Oral administration of ethanol extracts 4d20 and 8d20 significantly improvedglucose tolerance in the hyperglycemic rats. Chlorogenic and caffeic acids, as well as the association ofthe compounds were able to significantly reduce glycemia after oral gavage treatments. On the otherhand, the aqueous extracts did not alter the glycemia. The aqueous extracts (8020 and 9030) and onlythe higher dose of chlorogenic acid presented a significant effect on serum glucose lowering in diabetic
rats. Additionally, the IC50 reveals that the ethanol extracts presented more potent vasodilator effectsthan the aqueous extracts in aortic rings. This study shows that C. glaziovii standardized extracts exhibitsantihyperglycemic action, is able to improve glucose tolerance and has a potent vascular relaxing effect.These results are probably linked to concentrations of the main phenolic compounds of the extracts.© 2015 Sociedade Brasileira de Farmacognosia. Published by Elsevier Editora Ltda. All rights reserved.
ntroduction
Leaves of Cecropia glaziovii Snethl, Urticaceae, are used in theraditional medicine, mainly in the form of tea. Pharmacologicaltudies have shown that extractive solutions of this species producenxiolytic (Rocha et al., 2002), hypotensive (Lima-Landman et al.,007), antiasthmatic (Delarcina et al., 2007), antidepressant (Rochat al., 2007), antacid, antiulcer (Souccar et al., 2008) effects, as wells in vitro antiviral effects against human herpes virus types 1 and
(Silva et al., 2010).Some Cecropia species are used in popular medicine to treat
iabetes and hypoglycemic effects have been reported for thextractive solutions of Cecropia obtusifolia Bertol., Urticaceaae,ecropia peltata L., Urticaceae (Andrade-Cetto and Wiedenfeld,
∗ Corresponding author.E-mail: [email protected] (A.M. de Campos).
http://dx.doi.org/10.1016/j.bjp.2015.05.010102-695X/© 2015 Sociedade Brasileira de Farmacognosia. Published by Elsevier Editora
2001; Nicasio et al., 2005; Andrade-Cetto et al., 2007; Alonso-Castroet al., 2008; Andrade-Cetto and Vázquez, 2010) and also Cecropiapachystachya Trécul., Urticaceae (Aragão et al., 2010). Based on thehypoglycemic potential described to Cecropia species and consid-ering that there are no studies on the hypoglycemic effect of C.glaziovii, the present study sought to evaluate the effect of extractsprepared from C. glaziovii leaves on oral glucose tolerance curveand on glycemia in alloxan-induced diabetic rats.
In the preparation of the extractive solutions, the applicabilityof the maceration and decoction methods was determined for opti-mizing the extraction conditions of phenolic acids substances fromC. glaziovii leaves. Some extraction parameters were analyzed usingan experimental design. This work therefore determines the mostappropriate extraction method, and the best conditions for pro-
moting an extraction with the highest contents of chemical markers(chlorogenic and caffeic acids). Chlorogenic (CGA) and caffeic (CFA)acids were used as chemical markers for standardization due tohigh concentration present in the extracts and also to be related toLtda. All rights reserved.

4 de Fa
teGsd
M
M
mSMfPBbg
R
bCvaimta
T
loteo
L
aLlswam
P
m3w1P
A
m
74 D.P. Arend et al. / Revista Brasileira
he hypoglycemic/antihyperglycemic effects in the literature (Hsut al., 2000; Rodriguez de Sotillo and Hadley, 2002; Jung et al., 2006;enta et al., 2010). These initial results can be used to guide furthertandardization and application of C. glaziovii leaf extract in theevelopment of phytopharmaceutical preparations.
aterials and methods
aterials
Chemicals and reagents were obtained from the following com-ercial sources: chlorogenic acid and caffeic acid (Sigma–Aldrich,
t. Louis, MO, USA), Folin–Ciocalteu (Fluka, Sigma–Aldrich, St. Louis,O, USA), methanol and acetonitrile (HPLC grade) were purchased
rom J.T. Baker (Phillipsburg, NJ, USA), acetic acid (Qhemis, Sãoaulo, Brazil), LC-grade water obtained in Milli-Q system (Millipore,edford, MA, USA). All samples and solutions were prepared fromidistilled water. All other reagents and solvents were of analyticalrade.
aw material characterization: plant material
The leaves of Cecropia glaziovii Snethl, Urticaceae, were collectedy the Ílio Montanari Jr. researcher at Pluridisciplinary Center ofhemical, Biological and Agronomic Studies (CPQBA) of the Uni-ersity of Campinas, SP, Brazil. A specimen voucher is depositedt the CPQBA herbarium (number 78). The dry leaves were groundn a knife mill (Macmont) using a 3 mm mesh. The milled vegetal
aterial was characterized by total ash content, loss on drying, par-icle size distribution and microbiological quality of the raw plant,s described below.
otal ash content (TA)
The total ash content was determined after bumming the milledeaves. The procedure was done gravimetrically by weighing 3.0 gf milled leaves in a porcelain crucible. The samples were submit-ed to calcination in an oven at 600 ◦C for 2 h. The results werexpressed as percentage of remaining weight (w/w) by the meanf three measurements (Farmacopéia Brasileira, 2010).
oss on drying (LOD)
The loss on drying analysis was carried out to determine themount of water and volatile matter in the plant drug material. TheOD was determined gravimetrically by weighing 2.0 g of milledeaves in a weighing bottle and submitting the samples to a heatedtove at 105 ◦C for 2 h. The procedure was repeated until constanteight was achieved (variation < 5 mg). The results were expressed
s percentage of weight lost (w/w) by the mean of three measure-ents (Farmacopéia Brasileira, 2010).
article size distribution
Particle size distribution was evaluated by a standard sievingethod, for a period of 15 min (Sieve Shaker Bertel 1400), with
0 g of the dried milled plant material, using a series of sievesith screen sizes corresponding to 180, 355, 500, 710, 1000 and
700 �m. The average particle size was calculated by means ofrobito’s evaluation (Vila-Jato, 1997; Pasqualoto et al., 2005).
ssessment of microbiological quality of raw plant
The total viable aerobic count of the plant material was deter-ined, as specified in the test procedure below, using the plate
rmacognosia 25 (2015) 473–484
count method. Aerobic bacteria and fungi (molds and yeasts) weredetermined in this test.
Pretreatment of the test plant material
Plant material (10 g) was diluted in phosphate buffer pH 7.2,total volume adjusted to 100 ml. The treated sample resulted in adilution of 10−1.
Total viable aerobic count
To determine the total bacteria, the pre-treated herbal mate-rial was prepared in duplicate using decimal dilution until 10−9
dilution. Samples were incubated at 30–35 ◦C for 7 days in nutrientagar. Similarly, for fungi, pre-treated plant material was prepared induplicate using decimal dilution until 10−9 dilution. Samples wereincubated at 20–25 ◦C for 7 days in Sabouraud agar (WHO, 1998).
Extract preparation: experimental design
Two full factorial screening designs (22) was chosen to investi-gate the effects of the extraction conditions in the two extractionmethods: maceration and decoction. In the case of maceration,the independent variables were ethanol concentration (20, 50 and80%; v/v) (factor A) and extraction time (4, 6 and 8 days) (factorB), while for the decoction method the variables were tempera-ture (70, 80 and 90 ◦C) (factor A) and extraction time (10, 20 and30 min) (factor B). All data are given as means ± standard devia-tions of two independent batches. One central point was proposedin each design and these experiments were performed in dupli-cate. The effects of the process variables and their interactionson the dry residue, pH, total phenolic and chemical marker con-tent (CGA and CFA) were calculated as the differences betweenthe means on the high and the low levels, respectively. The sig-nificance of the effects was evaluated by comparing their valuesto the confidence intervals based on the mean standard devia-tion for the respective response variables (Montgomery, 2005).The experiments were carried out randomly and the effects werecalculated presuming a linear model with interaction among thefactors. The established screening design and the results were ana-lyzed by Design-Expert® software (Version 8.0.6, StatEase, andMinneapolis, MN). The effects of each factor tested in these exper-iments were demonstrated using analysis of variance (regressioncoefficients and significant p values) and Pareto chart, which werea useful tool for showing the statistically significant effects eval-uated in study. The function of the Pareto chart is to provide anadditional chart used to display the t-values of the effects. Anotheruse of the Pareto chart is to check “one more significant effect”that was not easily visible in the other chart. Analysis of variance(ANOVA) was performed to identify the significance of single fac-tors and their binary interactions in terms of their influence onthe responses analyzed (significant when the p value < 0.05). Theinteraction terms that were not significant were removed from themodel.
Characterization of the extractive solutions (ethanol and aqueousextracts)
Determination of dry residueThe dry residue was determined by drying 20 g of each extrac-
tive solution in an oven at 105 ◦C for 2 h. After complete drying,the residual solid matter was weighed and the dry residue wasexpressed as a percentage (w/w) by the mean of three measure-ments (Farmacopéia Brasileira, 2010).

de Fa
T
eetFfircr
Q
evaSa1erB3
rsatrs(m
V
aNowf
A
ltsgme
T
AniafwcCaa
D.P. Arend et al. / Revista Brasileira
otal phenolic content (TPC)Percentages of total phenolic of the ethanol and aqueous
xtracts were determined according to the method reported by Yut al. (2002). Briefly, the reaction mixture contained extractive solu-ion (10 �l of ethanol extract or 20 �l aqueous extract), 500 �l of theolin–Ciocalteu reagent, and 1.5 ml of 20% sodium carbonate. Thenal volume was made up to 10 ml with purified water. After 2 h ofeaction, the absorbance at 765 nm was measured and used to cal-ulate the phenolic contents using gallic acid as standard. Triplicateeactions were conducted.
uantitative analysis of CGA and CFA (HPLC)
The chlorogenic (CGA) and caffeic (CFA) acids content in thextractive solutions were determined by HPLC analysis using a pre-iously validated method (Arend et al., 2011) on a Perkin-Elmerpparatus equipped with an autosampler Series 200, interface 600eries LINK, binary pump Series 200, UV-Vis detector Series 200,nd vacuum degasser Series 200. A Zorbax C HP C18 column (5 mm,50 mm × 4.6 mm, Agilent Technologies) was used. The gradient oflution consisted of acetonitrile (A) 1.0% acetic acid (B) with a flowate of 1 ml/min, and was programmed as follows: 0–15 min, 87%; 15–25 min, 87–60% B; 25–34 min, 60% B. Detection was set at30 nm. The injection volume was 20 �l.
The quantification of chemical markers, CGA and CFA was car-ied out by comparison of their retention times and co-injection oftandard solutions. Two standard curves were plotted: chlorogeniccid (2.5–200 �g/ml) and caffeic acid (2.5–100 �g/ml). Quantifica-ion of the individual compounds was performed using a validatedegression curve (r > 0.9999). Three milliliters of each extractiveolutions were diluted to 10 ml using a methanol:water solution50:50; v/v). The samples were filtered through a 0.45 mm HVLP
embrane (Millipore) before injection.
ascular reactivity in thoracic rat aortaPharmacological studies related to hypotensive activity have
lready been described for this plant (Lima-Landman et al., 2007;inahuaman et al., 2007). In an attempt to evaluate the potencyf these extractive solutions, the potential cardiovascular effectas demonstrated through vascular reactivity in thoracic rat aorta
ollowing the steps below.
nimals
Male Wistar rats (250–300 g) were maintained in a 12 hight/dark cycle with free access to water and standard rat chow. Onhe day of the experiments, rats were euthanized under anesthe-ia with a mixture of ketamine (80 mg/kg) and xylasine (15 mg/kg)iven intraperitonially and the aorta was removed. The experi-ents were performed after approval of the protocol by the local
thical committee for animal use (Protocol CEUA/UFSC PP00482).
issue preparation
The thoracic aorta was isolated as described previously byndriambeloson et al. (1999). In brief, after removal of fat and con-ective tissue, aortic rings (3–4 mm in length) were mounted in an
solated organ bath on isometric force transducers connected to anmplifier and chart recorder (Soft and Solutions/KITCAD8, Brazil)or isometric tension recordings as described elsewhere. The ringsere bathed with physiological salt solution with the following
omposition in mM: 130.0 NaCl, 4.7 KCl, 1.2 KH2PO4, 1.2 MgSO4, 1.6aCl2, 14.9 NaHCO3, 0.03 EDTA and 5.5 glucose, maintained at 37 ◦Cnd bubbled with 95% O2–5% CO2. The aortic rings were stretchedpplying tension of 1 g applied for 1 h with periodical washes every
rmacognosia 25 (2015) 473–484 475
15 min. After this period, the rings were contracted with phenyle-phrine (1 �M) and challenged with acetylcholine (1 �M) to test thetissue viability and integrity of the endothelium, respectively.
Evaluation of the vasorelaxant effectEndothelium-intact aortic rings were contracted with phenyle-
phrine (1 �M) until the plateau of the contraction was reached(around 15 min) and then exposed to increasing concentrations ofthe extractive solutions (0.1–100 �g/ml) given at 5 min intervals. Aconcentration–response curve of acetylcholine-induced vasodila-tation (1 nM to 3 �M) was used as a positive control. The resultswere expressed as mean ± standard error of the mean (SEM) ofpercentage of relaxation. Statistical comparisons between groupswere carried out using one-way analysis of variance (ANOVA) fol-lowed by the Tukey test. The results were also expressed as thegeometric mean (IC50) values, accompanied by their respective 95%confidence limits.
Antihyperglycemic activityFasted rats for antihyperglycemic activity measurements, from
the same animal facility, were deprived of food for at least 16 hbut allowed free access to water. All the animals were monitoredand maintained in accordance with the local ethical committee foranimal use (Protocol CEUA/UFSC PP00223).
Oral glucose tolerance curveAnimals were divided into groups of five animals for each
treatment: hyperglycemic group: fasted rats that received glu-cose (4 g/kg; 8.9 M); hyperglycemic treated group: fasted rats thatreceived glucose (4 g/kg) plus different ethanol or aqueous extracts(400 mg/kg) or tolbutamide (100 mg/kg) or chemical marker alone,chlorogenic acid (CGA 2 or 15 mg/kg) or caffeic acid (CFA at a dose of2 mg/kg) or in combination (CGA plus CFA at a dose of 2 mg/kg). Alltreatments were carried out by oral gavage. Blood samples werecollected just prior to and at 0, 15, 30, 60 and 180 min after theglucose loading. After centrifugation, serum was used to deter-mine the glycemia by the glucose oxidase method (Folador et al.,2010). Data were expressed as mean ± S.E.M. One-way analysis ofvariance (ANOVA), followed by the Bonferroni post-test or non-paired Student’s t test, was used to identify significantly differentgroups. Differences were considered to be significant at the p ≤ 0.05level.
Diabetic animals
Rats were made diabetic by a single intravenous injection ofalloxan monohydrate 5% (w/v) in a saline solution at a dose of40 mg/kg body weight. Blood samples were collected 3 days later,and glucose levels were determined as indicative of the develop-ment of diabetes. Diabetic rats received ethanol or aqueous extracts(400 mg/kg) or chemical marker alone, chlorogenic acid (CGA 2 or15 mg/kg) or caffeic acid (CFA at dose 2 mg/kg) or in combination(CGA plus CFA at dose 2 mg/kg). Blood samples from the tail veinwere collected and centrifuged and the serum was used to deter-mine the glycemia by the glucose oxidase method. A serum glucoserange of 22–29 mmol/l was used for the experiment (Folador et al.,2010).
Determination of the serum glucose concentrationBlood samples were collected and centrifuged, and the blood
glucose levels were determined by the glucose oxidase method(Varley et al., 1976; Folador et al., 2010).

476 D.P. Arend et al. / Revista Brasileira de Farmacognosia 25 (2015) 473–484
Table 1Dry residue, pH, total phenolic content, and CGA and CFA contents for the maceration extraction method.
Extractive solution Ethanol (%) Time (days) Dry residue (%) pH Total phenolic (mg/ml) CGA (�g/ml) CFA (�g/ml)
4d20 20 4 1.06 5.78 3.64 131.09 36.934d20 20 4 1.05 5.81 3.96 128.81 36.674d80 80 4 1.02 5.88 3.48 150.99 3.254d80 80 4 1.01 5.88 3.37 150.69 3.278d20 20 8 1.14 5.79 3.95 73.36 58.358d20 20 8 1.10 5.83 3.69 75.62 57.618d80 80 8 1.06 5.90 3.47 154.80 3.78
R
R
odmDftapeiacweitt
trabaeovtWc
P
a
TD
8d80 80 8 1.05
6d50 50 6 1.086d50 50 6 1.07
esults and discussion
aw material characterization
Plants are complex mixtures that present a problem in termsf standardization and quality control. Therefore, protocols wereeveloped from the raw material to establish their previous treat-ent and quality control in order to characterize them properly.etermination of the total ash content is particularly important
or evaluating the cleanliness of the plant material, for example,he presence or absence of inorganic matter such as sand and dirtdhered to the surface of the drug (Jain et al., 2010). Similarly, theresence of water can promote degradation reactions and prolif-ration of microorganisms. This contamination compromises thentegrity of pharmacologically active substances. Total ash contentnd loss on drying of the plant drug were determined by the pro-edures given in the Brazilian Pharmacopoeia (2010). The resultsere 7.92 ± 0.03% and 13.10 ± 0.06%, respectively. The mean diam-
ter of the crushed leaves was determined as 0.78 ± 0.41 mm. Thisnformation is important for standardizing the reproducibility ofhe extraction process, a homogenous sample might to improvehe kinetics of the chemical compound extraction.
The presence of microorganisms can be a natural consequence ofhe agricultural practices and processing conditions of plant mate-ials (Kolb, 1999). Thus, raw material plant may be associated with
broad variety of microbial contaminants, and this microbiologicalackground has an important impact on the results of qualitativend quantitative analyses carried out for quality control (Wolfgangt al., 2002; Kosalec et al., 2009). The results of the standard aer-bic bacteria count were 1.04 × 10³ UFC/ml, moreover, the meanalues for mold and yeast were from 8.25 × 10⁴ UFC/ml. Therefore,he raw material did not exceed the value recommended by the
HO (1998). The data obtained suggest that the raw material washaracterized and deemed appropriate for continuing studies.
reparation and standardization of extractive solutions
In the standardization of herbal preparations various aspects ofnalysis must be performed, requiring the use of scientific proof
able 2ry residue, pH, total phenolic content, and CGA and CFA contents for the decoction extra
Extractive solution Temperature (◦C) Time (min) Dry residue (%)
7010 70 10 0.82
7010 70 10 0.76
9010 90 10 0.91
9010 90 10 0.93
7030 70 30 0.87
7030 70 30 0.83
9030 90 30 0.91
9030 90 30 0.95
8020 80 20 0.77
8020 80 20 0.76
5.93 3.43 153.99 3.675.92 3.88 167.11 11.945.96 3.89 167.65 12.18
and clinical validation with chemical standardization, biologicalassays and clinical trials (Ong, 2004). The choice of the techniquefor the extraction plant material is the most important step inthe development of analytical methods (Benthin et al., 1999; Ong,2004), particularly considering that herbal extracts are complexmixtures, and appropriate techniques are needed to allow a bet-ter extraction of their constituents of interest (Jacques et al., 2007).Decoction and maceration methods were investigated as an alter-native to traditional extraction methods used in the extraction ofchemical markers (CGA and CFA), searching for improved extrac-tion efficiency. The conditions for the extraction of C. glaziovii usingmaceration and decoction methods were evaluated on dry residue,total phenolic values and CGA and CFA acids content. Tables 1 and 2show the results of the experimental designs used for the macera-tion and decoction techniques, respectively.
Dry residue
In the ethanol extracts obtained by maceration, both factors– ethanol concentration (factor A) and extraction time (factor B)– were significant (Table 3; Fig. 1c). Increasing the percentage ofethanol causes a decrease of dry residue. On the other hand, theincrease in extraction time resulted in an increased amount of dryresidue (Fig. 1a).
In the case of the aqueous extracts obtained by decoction,only the factor temperature was significant (Table 4; Fig. 1d). Theincrease in temperature caused an increase in dry residue. In thedecoction method, significant curvature was observed, indicatingthere is no linearity for the dry residue response, as shown in Fig. 1b.
pH
The pH values for the ethanol extracts were in the range5.78–5.96. In the extracts obtained by maceration, only the factorethanol concentration was significant (Table 3; Fig. 2c). Lowering
the ethanol concentration also lowered the pH values (Fig. 2a).The same occurred with increasing temperature for the aqueousextracts (Table 4; Fig. 2b and d), which seems to indicate the extrac-tion of substances with acidic character in those conditions. Thection method.
pH Total phenolic (mg/ml) CGA (�g/ml) CFA (�g/ml)
5.88 2.09 179.09 7.755.94 1.65 177.67 7.725.72 2.19 190.17 7.595.72 2.15 192.99 8.025.85 2.21 185.41 8.065.84 2.13 186.65 8.185.70 2.19 191.55 8.705.71 2.35 193.04 8.635.65 2.15 220.87 4.865.66 2.06 221.30 4.86

D.P. Arend et al. / Revista Brasileira de Farmacognosia 25 (2015) 473–484 477
Table 3Analysis of variance (regression coefficients and significant p values) for dry residue, total phenolic, CGA and CFA responses for maceration extraction method.
Polynomial term Dry residue (%) pH Total phenolic CGA (�g/ml) CFA (�g/ml)
Coefficient p value Coefficient p value Coefficient p value Coefficient p value Coefficient p value
Model – 0.0023 – 0.0018 – 0.0153 – <0.0001 – <0.0001Intercept +1.06 – 5.85 – 3.62 127.42 – 25.44 –(A) Ethanol (%) −0.026 0.0024 0.048 0.0007 −0.19 0.0053 +25.20 <0.0001 −21.95 <0.0001(B) Time (days) +0.026 0.0024 0.013 0.1466 (NS) 0.011 0.8057 (NS) −12.98 <0.0001 +5.41 <0.0001(AB) Interaction – NS – NS NS +14.75 <0.0001 −5.18 <0.0001Curvature – NS – 0.0017 0.0370 – <0.0001 <0.0001
NS, not significant.
Ethanol concentration (%)Extraction time (days) Time (min.) Temperature (ºC)
Bonferroni Limit 3.28746
t-Value Limit 2.44691t-Value Limit 2.36462
Bonferroni Limit 3.12755
B
AB
A4.58
3.44
2.29
1.15
0.00
AB
BA5.02
4.02
3.01
2.01
1.00
0.00
0.95
0.89
0.82
0.76
0.70
3080
50
204
6
8
1.14
1.11
1.07
1.03
1.00
Dey
res
idue
(%
)
Dey
res
idue
(%
)
7010
80
90
20
t-V
alue
of |
Effe
ct|
t-V
alue
of |
Effe
ct|
1 2 3
Rank1 2 3
Rank
a b
c d
Fig. 1. Graph of ethanol concentration (A) and extraction time (B) versus dry residue for maceration (a); and temperature (A) and time (B) for decoction (b), and significanceof the effects (*) on Pareto chart: Maceration (c) Decoction (d); positive effects (#); negative effects (##).
Table 4Analysis of variance (regression coefficients and significant p values) for dry residue, pH, CGA and CFA responses for decoction extraction method.
Polynomial term Dry residue (%) pH CGA (�g/ml) CFA (�g/ml)
Coefficient p value Coefficient p value Coefficient p value Coefficient p value
Model – 0.0046 – 0.0001 – 0.0002 – 0.0044Intercept +0.85 – 5.79 – +13.91 – +7.44 –(A) Temperature (◦C) +0.053 0.0020 −0.082 <0.0001 +0.18 <0.0001 +0.15 0.0289(B) Time (min.) +0.017 0.1340 (NS) −0.020 0.0498 +0.077 0.0038 +0.31 0.0017(AB) Interaction – NS – NS −0.064 0.0081 – NSCurvature – 0.0031 – 0.0003 – <0.0001 <0.0001
NS, not significant.

478 D.P. Arend et al. / Revista Brasileira de Farmacognosia 25 (2015) 473–484
Ethanol concentration (%)Extraction time (days) Time (min.) Temperature (ºC)
t-V
alue
of |
Effe
ct|
t-V
alue
of |
Effe
ct|
6.00
5.94
5.88
5.81
5.75
8
6
4 20
50
80 30
20
10 70
80
90
5.60
5.70
5.80
5.90
6.00
pH
10.10
7.58
5.05
2.53
0.00
AB
B
A5.66
4.24
2.83
1.41
0.00
Bonferroni Limit 3.12755
t-Value Limit 2.36462
t-Value Limit 2.44691
Bonferroni Limit 3.28746
B
AB
A
1 2 3Rank
1 2 3Rank
pHa b
c d
F eratioo ; nega
st
cfdm
T
n(i(pceogeaept(i
ig. 2. Graph of ethanol concentration (A) and extraction time (B) versus pH for Macf the effects (*) on Pareto chart: Maceration (c); Decoction (d); positive effects (#)
ignificant curvature values for both extraction methods show thathis increase is not linear, a behavior also shown in Fig. 2a and b.
The pH values appear to reach a steady state at a higher ethanoloncentration for the ethanol extracts and at a higher temperatureor the aqueous extracts. However, although there are statisticalifferences, the small variation between the pH values (5.78–5.96)ay not be relevant from technological standpoint.
otal phenolic content
Several researchers have investigated the ability of some phe-olic compounds present in plant material to act as antioxidantsSeeram et al., 2006; Zhang et al., 2008; Is ık et al., 2011). This activ-ty may be correlated with the content of their phenolic compoundsVelioglu et al., 1998; Cheung et al., 2003). Determination of totalhenolic content has been achieved using the Folin–Ciocalteu pro-edure (Yu et al., 2002). This colorimetric method is based on thextraction of phenolic compounds (acidic solution) after oxidationf the reduced molecules by a mixture of the two strong inor-anic oxidant phosphotungstic and phosphomolybdic acids (Is ıkt al., 2011). The Folin method has poor specificity, as it can given overestimated value for total phenol content in extracts. Forxample, between some non-phenolic substances this method can
otentially interfere in the determination of total phenolic con-ent by increasing the absorbance value of the phenolic compoundsStevanato et al., 2004; Is ık et al., 2011). Even with this potentialnterference, due to the complexity of the sample, this techniquen (a) and temperature (A) and extraction time (B) for decoction (b), and significancetive effects (##).
is easy and fast to use, and is convenient for routine use for qualitycontrol tests on the plant material.
Total phenolic content was expressed as gallic acid equivalents.A calibration curve was constructed with different concentrationsof gallic acid as standard. The amount of phenolic compounds inthe ethanol extracts was higher than that of the aqueous extracts(Table 1). The total phenolic content of ethanol extracts gradu-ally decreased with increasing ethanol concentration, and was notinfluenced by extraction time (Table 3; Fig. 3a and c). This indicatesthat at 4 days of maceration, a steady state may have already beenreached in the extraction of these compounds. The higher total phe-nolic content in the ethanol extracts than in the aqueous extractsmight be explained by the different extractor liquid used in theextraction. In addition, the extraction method may contribute tothe difference in content (Yu et al., 2002). Normally, the efficiencyof the extraction of polyphenolics compounds is lower using puresolutions like water, ethanol or methanol. The yield of total pheno-lic compounds extracted from these extracts can be higher whensolvents containing some water are used in the extraction process(Katsube et al., 2009).
As observed in Fig. 3b, the increases in temperature and extrac-tion time tend to increase the total phenolic concentration inthe aqueous extracts, although no statistical significance has been
observed in the factors evaluated for these extracts (Fig. 3d).The yield of phenolic compounds may depend significantly onextraction temperature and time (Herrera and Luque de Castro,2005). Heating may soften the plant tissue, weaken the cell wall
D.P. Arend et al. / Revista Brasileira de Farmacognosia 25 (2015) 473–484 479
4.00
3.85
3.70
3.55
3.40
8
6
4 20
50
80
Ethanol concentration (%)Extraction time (days)
A
2.30
2.17
2.05
1.93
1.80
30
20
10 70
80
90
Time (min.) Temperature (ºC)
Bonferroni Limit 3.28746
t-Value Limit 2.44691
BA
AB
1 2 3Rank
1 2 3Rank
BAB
0.00
0.82
1.64
2.47
3.29
t-V
alue
of |
Effe
ct|
t-V
alue
of |
Effe
ct|
0.00
1.14
2.29
3.43
4.57
Bonferroni Limit 3.12755
t-Value Limit 2.36462
Tot
al p
heno
lic (
mg/
ml)
Tot
al p
heno
lic (
mg/
ml)
a b
c d
F nolic f( ; posi
i(ssCibiMao
C
ftoi
cTowtwd
ig. 3. Graph of ethanol concentration (A) and extraction time (B) versus total pheb), and significance of the effects (*) on Pareto chart: Maceration (c); Decoction (d)
ntegrity, hydrolyze the bonds of bound phenolic compoundsphenol–protein or phenol–polysaccharide) and enhance phenolicolubility. As a result, phenolic compounds would disperse in theolvent (Juntachote et al., 2006; Li et al., 2006; Spigno et al., 2007;han et al., 2009). However, even though increased temperatures
ncrease the solubility of the chlorogenic and caffeic acids, it shoulde taken into account that higher temperatures promote instabil-
ty of the phenolic compounds (Herrera and Luque de Castro, 2005;a et al., 2009). This may indicate a degradation of some phenolic
cids (Ma et al., 2009) which is a crucial influence in the extractionf phenolic acid yields.
GA and CFA content
According to the experimental design, the extraction of CGArom maceration had a significant influence on ethanol concentra-ion and time. However, an interaction between the factors wasbserved. Significant curvature was also observed, indicating theres no linearity for this response (Table 3; Fig. 4a and c).
Ethanol extracts containing 80% ethanol showed the same con-entration of the CGA for all extraction times (4, 6 and 8 days).hese data suggest that the steady state between drug and solventccurred from the fourth day. On the other hand, extracts prepared
ith 20% ethanol presented significantly lower levels of CGA overime (Fig. 4a). The CFA content in extracts containing 20% ethanolas different according to the extraction time (Table 3; Fig. 4b and). Between the fourth and eighth days, an increase was observed
or Maceration method (a) and temperature (A) and time (B) for decoction methodtive effects (#); negative effects (##).
in the amount of this compound, from 36 to 58 �g/ml, respec-tively. In the same period, CGA concentration decreased from 130 to75 �g/ml. This decrease in CGA content was previously investigatedby our group (Arend et al., 2011). In order to check the occurrenceof thermal or enzymatic degradation of CGA during the macerationtime, the influence of temperature and the presence of a preser-vative on the content of this acid in the extractive solutions wereevaluated. These results showed that CGA concentration does notalter in presence of a preservative, suggesting that the decreasein CGA content in extractive solutions is not due to microbiologi-cal degradation during the extraction period. This effect might berelated to a chemical degradation, considering that chlorogenic acidis an ester of caffeic acid and quinic acid (Olthof et al., 2001; Arendet al., 2011). A higher CGA concentration was observed in extractscontaining 50% ethanol, followed by with 80% ethanol (indepen-dent of extraction time) and 20% ethanol, 4 days and 8 days ofextraction time, respectively.
CGA extraction on aqueous extracts appears to be influencedby time and temperature and an interaction between the factorswas observed (Table 4; Fig. 5a and c). Maximum CGA content wasobserved at 30 min and an extraction temperature of about 80 ◦C,showing non-linearity in this response (Table 4). The same occursfor the amount of CFA, but in the opposite direction, with the
smallest amount occurring at around 80 ◦C (Table 4; Fig. 5b andd). However, CFA content in the aqueous extracts was very low,particularly when compared CGA content in these extractive solu-tions.
480 D.P. Arend et al. / Revista Brasileira de Farmacognosia 25 (2015) 473–484
Ethanol concentration (%)Extraction time (days) Extraction time (days) Ethanol concentration (%)
CF
A (μ
g/m
l)
CG
A (μ
g/m
l)200
165
130
95
60
8
6
80
50
204
6
4 20
50
808
0
15
30
45
60
66.92
57.36
47.80
38.24
28.68
19.12
9.56
0.00
t-V
alue
of |
Effe
ct|
AB
B
A237.15
177.86
118.57
59.29
0.00
B
A
AB
1 2 3
Rank1 2 3
Rank
t-V
alue
of |
Effe
ct|
a b
c d
Bonferroni Limit 3.53411t-Value Limit 2.57058 Bonferroni Limit 3.53411t-Value Limit 2.57058
F nd CFC
V
m(hgpbrFriai8(ea
A
A
oece
ig. 4. Graph of ethanol concentration (A) and extraction time (B) versus CGA (a) aGA (c); CFA (d); positive effects (#); negative effects (##).
ascular reactivity in vitro in thoracic rat aorta
Infusion of C. glaziovii leaves has been used in traditionaledicine as an antihypertensive, cardiotonic and antiasthmatic
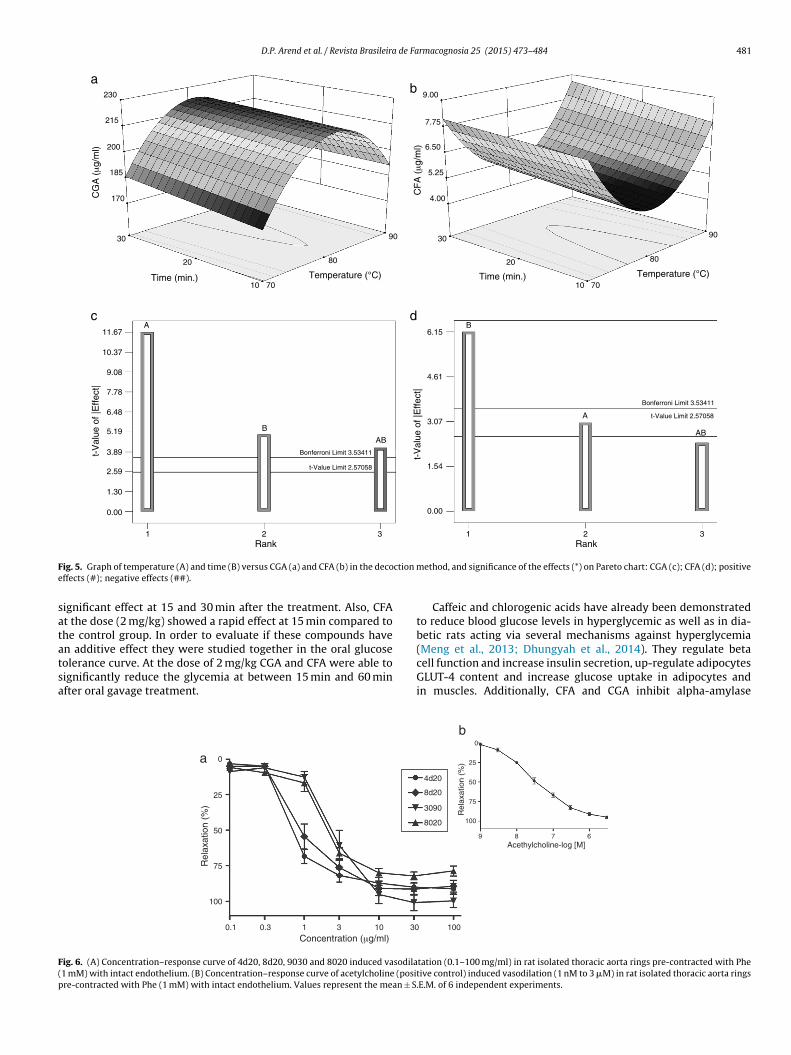
Rocha et al., 2002). Lima-Landman et al. (2007) described an anti-ypertensive effect for aqueous extract and butanolic fraction of C.laziovii, with satisfactory results. Based on these results, this workrovides evidence of the ability of the extractive solutions preparedy maceration (4d20, 8d20) and decoction (9030 and 8020) to relaxat aorta, and evaluate the potency of the extracts for this purpose.ig. 6 shows the concentration–effect curves to samples in rat aorticings pre-contracted with phenylephrine (1 �M). Cumulative dos-ng of extracts produced a concentration-dependent relaxation ofortic rings. The IC50 values with the 95% respective confidencentervals for the extractive solutions were: 4d20, 0.85 (0.74–0.96);d20, 1.48 (1.01–1.89); 9030, 2.62 (2.26–2.98); and 8020, 2.411.99–2.81) �g/ml. Analyzing the IC50 values, we verified that thethanol extracts presented more potent vasodilator effects than thequeous extracts in aortic rings.
ntihyperglycemic activity
cute antihyperglycemic effect of C. glazioviiFig. 7a and b shows the effect of different ethanol and aque-
us extracts from C. glaziovii on the glucose tolerance curve. Thextracts were selected based on the concentration of the chemi-al markers, chlorogenic acid (CGA) and caffeic acid (CFA), in thextracts. Oral administration (400 mg/kg) of ethanol extracts 4d20
A (b) in the maceration method, and significance of the effects (*) on Pareto chart:
and 8d20 improved glucose tolerance, and this effect was signif-icant at 15 min for 4d20 extract and at 15, 30, 60 and 180 minfor 8d20 extract when compared with the hyperglycemic controlgroup. On the other hand, the oral treatments with 6d50 ethanolextract as well as the 8020 and 9030 aqueous extracts were notable to reduce the blood glucose levels. As expected, after startingthe glucose tolerance test the serum glucose concentration was sig-nificantly increased when compared with zero time. Tolbutamide(100 mg/kg) an oral hypoglycemic agent of sulfonylurea class wasused as a positive control and produced a typical serum glucoselowering at 15, 30 and 60 min compared to the hyperglycemicgroup (Fig. 1C).
Considering the glucose homeostasis, some species of Cecropiahave been described to improve glucose metabolism. The hypo-glycemic effect of methanol leaf extracts of C. obtusifolia and C.peltata were evaluated in healthy mice. Both extracts produced asignificant hypoglycemic effect at 2 and 4 h after oral administra-tion. However, C. peltata showed a better effect than C. obtusifolia,which may be correlated to the difference in chlorogenic acidcontent between them (Nicasio et al., 2005). Additionally, aninvestigation of the C. pachystachya methanol extract confirmeda hypoglycemic effect that can be explained by the presence ofchlorogenic acid and C-glycosylated flavones as the major con-stituents.
Based on these results, the chemical markers were evaluatedon the glucose tolerance curve and the results are shown in Fig. 8.It can be observed that CGA at 15 mg/kg was not able to reducethe glycemia, however at a lower dose (2 mg/kg) it presented a
D.P. Arend et al. / Revista Brasileira de Farmacognosia 25 (2015) 473–484 481
Temperature (°C)Time (min.)7010
Temperature (°C)Time (min.)
80
90
20
30
170
185
200
215
230 9.00
7.75
6.50
5.25
4.00
30
20
10
80
90
70
6.15
4.61
3.07
1.54
0.00
1 2 3Rank
1 2 3Rank
A
B
AB
11.67
10.37
9.08
7.78
6.48
5.19
3.89
2.59
1.30
0.00
A
B
AB
CF
A (μ
g/m
l)
CG
A (μ
g/m
l)t-
Val
ue o
f |E
ffect
|
t-V
alue
of |
Effe
ct|
Bonferroni Limit 3.53411
t-Value Limit 2.57058
ab
c d
Bonferroni Limit 3.53411
t-Value Limit 2.57058
F ction me
satatsa
F(p
ig. 5. Graph of temperature (A) and time (B) versus CGA (a) and CFA (b) in the decoffects (#); negative effects (##).
ignificant effect at 15 and 30 min after the treatment. Also, CFAt the dose (2 mg/kg) showed a rapid effect at 15 min compared tohe control group. In order to evaluate if these compounds have
n additive effect they were studied together in the oral glucoseolerance curve. At the dose of 2 mg/kg CGA and CFA were able toignificantly reduce the glycemia at between 15 min and 60 minfter oral gavage treatment.0.1 0.3 1 3 10 30Concentration (μg/ml)
100
75
50
25
0
Rel
axat
ion
(%)
a
ig. 6. (A) Concentration–response curve of 4d20, 8d20, 9030 and 8020 induced vasodila1 mM) with intact endothelium. (B) Concentration–response curve of acetylcholine (posire-contracted with Phe (1 mM) with intact endothelium. Values represent the mean ± S
ethod, and significance of the effects (*) on Pareto chart: CGA (c); CFA (d); positive
Caffeic and chlorogenic acids have already been demonstratedto reduce blood glucose levels in hyperglycemic as well as in dia-betic rats acting via several mechanisms against hyperglycemia
(Meng et al., 2013; Dhungyah et al., 2014). They regulate betacell function and increase insulin secretion, up-regulate adipocytesGLUT-4 content and increase glucose uptake in adipocytes andin muscles. Additionally, CFA and CGA inhibit alpha-amylase100
Acethylcholine-log [M]8 679
100
75
50
25
0
Rel
axat
ion
(%)
4d20
8d20
3090
8020
b
tation (0.1–100 mg/ml) in rat isolated thoracic aorta rings pre-contracted with Phetive control) induced vasodilation (1 nM to 3 �M) in rat isolated thoracic aorta rings.E.M. of 6 independent experiments.

482 D.P. Arend et al. / Revista Brasileira de Farmacognosia 25 (2015) 473–484
603015 180
Time (min) Time (min)603015 180
50
100
150
200
250Hyperglycemic control
8020 400 mg/kg
9030 400 mg/kg
4d20 400 mg/kg
8d20 400 mg/kg
6d50 400 mg/kg
Hyperglycemic control250
200
150
100
50
Ser
um g
luco
se le
vels
(m
g/dl
)
Ser
um g
luco
se le
vels
(m
g/dl
)
a b
F ethl of rglyce
aiTefgar(chgdui
ggmmgert
F(me
ig. 7. Effect of maceration (A) and decoction (B) extracts from Cecropia glaziovii Snor each treatment. Statistically significant difference from the corresponding hype
nd alpha-glucosidase activity in the gastrointestinal tract andncreases glucokinase activity in the hepatocytes (Jung et al., 2006;ousch et al., 2008; Bassoli et al., 2008; Karthikesan et al., 2010; Ongt al., 2012, 2013; Meng et al., 2013; Dhungyah et al., 2014). Caf-eic acid and chlorogenic acid also lower glucose-6-phosphatase,lucose-6-translocase and phosphoenolpyruvate carboxykinasectivities, components of gluconeogenesis and glycogenolysis inat liver resulting in a reduction of the hepatic glucose productionSchwab et al., 2001). Considering that CGA and CFA are the majoronstituents of C. glaziovii extracts, it can be suggested that the anti-yperglycemic and the hypoglycemic effect observed herein to C.laziovii extracts and to CFA and CGA could be mediated throughifferent targets of action involving hepatic glucose output, glucoseptake in insulin target tissues, intestinal glucose absorption and
nsulin secretion.Based on the content of the CGA and CFA on each of the C.
laziovii extractive solutions and based on the literature, it is sug-ested that the antihyperglycemic effect of the different extractsay be related with the content/concentration of the chemicalarkers and also to the ratio between them. The best results on
lycemia were observed with the extracts that contained the low-st concentrations of CGA and CFA (8d20 and 4d20) and also theatio close to 1:1 (Fig. 7a and b/Table 1). This result is in line withhose observed for CGA and CFA on the glucose tolerance curve, in
Ser
um g
luco
se le
vels
(m
g/dl
)
CGA 15 mg/kg
Hyperglycemic control
230
170
110
503015 60
Time (min)180
CGA 2 mg/kg
CFA 2 mg/kg
CGA + CFA 2 mg/kg
ig. 8. Effect of the chemical markers chlorogenic acid (CGA) and caffeic acidCFA), and the association on glucose tolerance curve. Values are expressed as
ean ± S.E.M; n = 6 in duplicate for each treatment. Statistically significant differ-nce from the corresponding hyperglycemic group; **p ≤ 0.01.
n glucose tolerance curve. Values are expressed as mean ± S.E.M; n = 6 in duplicatemic group; *p ≤ 0.05; ***p ≤ 0.001).
which the lowest dose of CGA as well as the association of both, CGAand CFA presented the most pronounced effect (Fig. 8) showing adose-dependent pattern of action on the glucose tolerance curve.
Additionally, in order to complement the glycemic profile, thedifferent extracts of C. glaziovii and the chemical markers werestudied in vivo, using an alloxan-induced diabetic rat model (unableto secret insulin). Fig. 9 shows the effect of ethanol and aqueousextracts as well as CGA on glycemia in alloxan-induced diabeticrats. The aqueous extracts, 8020 and 9030, were able to reducesignificantly the glycemia, at 1 h and at 2 h, respectively, after theoral treatments (400 mg/kg), when compared with the diabeticcontrol group. Also, it can be observed that the ethanol extract8d20 presented a slight reduction in glycemia at 2 h after the treat-ment. Additionally, when the chemical markers, CGA and CFA wereevaluated, just the higher dose of CGA (15 mg/kg) presented a sig-nificant effect on reducing the blood glucose levels at 2 and 3 h afterthe treatment. The CFA, CGA as well as the association of both at2 mg/kg were ineffective in this approach (data not shown). Con-trary to that observed in hyperglycemic normal rats, the absence ofand/or the slight effect of the ethanol extracts in alloxan-induceddiabetic rats may be related to the insufficient concentration of CGAand CFA in the extracts, since when these compounds were eval-uated only the higher dose of CGA was effective in this approach.Also, the aqueous extracts that presented a higher concentrationof CGA were effective in the diabetic animals. It is possible that
to exert its effect as an insulinomimetic agent in diabetic rats, C.glaziovii extracts/compounds must have higher concentrations ofthe main constituents, CGA and CFA.CGA 15 mg/kg
8020 400 mg/kg
9030 400 mg/kg
8d20 400 mg/kg
Diabe tic control
250
300
350
400
450
500
Ser
um g
luco
se le
vels
(m
g/dl
)
1 2 3Time (h)
Fig. 9. Effect of the ethanolic and aqueous extracts and the chlorogenic acid (CGA)on the serum glucose level in alloxan-induced diabetic rats. Values are expressed asmean ± S.E.M; n = 6 in duplicate for each treatment. Statistically significant differ-ence from the corresponding zero time value of each group; *p ≤ 0.05. Statisticallysignificant difference from the corresponding diabetic group; #p ≤ 0.05.

de Fa
sptiogatapac
pgeeatscl
A
cpctscm
C
A
0
R
A
A
A
A
A
A
A
B
B
D.P. Arend et al. / Revista Brasileira
Recent studies have shown the hypoglycemic effect of Cecropiapecies in diabetic animal models. Aqueous and butanol extractsrepared from C. obtusifolia and C. peltata were evaluated in strep-ozotocin diabetic rats and the results showed a significant decreasen serum glucose at 3 h after the oral treatment as well as on theral glucose tolerance curve. Moreover, it is suggested that chloro-enic acid is involved in the hypoglycemic effect of C. obtusifoliand C. peltata because it was one of the major constituents ofhe extracts (Andrade-Cetto and Wiedenfeld, 2001; Andrade-Cettond Vázquez, 2010). The methanol extract from the leaves of C.achystachya also produced a significant hypoglycemic effect inlloxan-induced diabetic rats, probably due to the chlorogenic acidontent in this species (Aragão et al., 2010; Karthikesan et al., 2010).
In conclusion, this study provides the first report on the antihy-erglycemic action of the extracts of C. glaziovii leaves improvinglucose tolerance. In addition, the potent relaxing effect of ethanolxtracts on thoracic aorta was demonstrated. Independent of thexact mechanism of action involved, these results can probably bessociated with the concentrations of the phenolic constituents ofhe extracts. The results presented here give initial experimentalupport for future experiments, as they link this effect to morelasses of secondary compounds as well as evaluation of the iso-ated compounds present in the extractive solutions.
uthors’ contributions
DPA (MSc student) contributed in running the laboratory work,hromatographic analysis, analysis of the data and drafted theaper. TCS contributed in drafting the manuscript. LHC and MAHontributed to biological studies. DS, ALGS, RMRV and FRMBS con-ributed to critical reading of the manuscript. AMC designed thetudy, supervised the laboratory work and contributed to criti-al reading of the manuscript. All the authors have read the finalanuscript and approved the submission.
onflicts of interest
The authors declare no conflicts of interest.
cknowledgments
The authors thank FAPESC (Grant Number 05798, edict08/2006), CNPq and Ílio Montanari Jr. researcher at CPQBA.
eferences
lonso-Castro, A.J., Miranda-Torres, A.C., González-Chávez, M.M., Salazar-Olivo, L.A.,2008. Cecropia obtusifolia Bertol and its active compound, chlorogenic acid, stim-ulate 2-NBDglucose uptake in both insulin-sensitive and insulin-resistant 3T3adipocytes. J. Ethnopharmacol. 120, 458–464.
ndrade-Cetto, A., Cárdenas, R., Ramírez-Reyes, B., 2007. Hypoglycemic effect ofCecropia peltata L. on N5-STZ type 2 diabetic rats. Pharmacology 3, 203–210.
ndrade-Cetto, A., Vázquez, R.C., 2010. Gluconeogenesis inhibition and phytochem-ical composition of two Cecropia species. J. Ethnopharmacol. 130, 93–97.
ndrade-Cetto, A., Wiedenfeld, H., 2001. Hypoglycemic effect of Cecropia obtusifoliaon streptozotocin diabetic rats. J. Ethnopharmacol. 78, 145–149.
ndriambeloson, E., Stoclet, J.C., Andriantsitohaina, R., 1999. Mechanism of endothe-lial nitric oxide-dependent vasorelaxation induced by wine polyphenols in ratthoracic aorta. J. Cardiovasc. Pharm. 33, 248–254.
ragão, D.M.O., Guarize, L., Lanini, J., da Costa, J.C., Garcia, R.M.G., Scio, E., 2010.Hypoglycemic effects of Cecropia pachystachya in normal and alloxan-induceddiabetic rats. J. Ethnopharmacol. 128, 629–633.
rend, D.P., dos Santos, T.C., Sonaglio, D., dos Santos, A.L.G., Reginatto, F.H., de Cam-pos, A.M., 2011. Experimental design as a tool to evaluate chlorogenic and caffeicacids extracted from Cecropia glaziovii Sneth. J. Pharm. Biomed. Anal. 54, 58–66.
assoli, B.K., Cassolla, P., Borba-Murad, G.R., Constantin, J., Salgueiro-Pagadigorria,
C.L., Bazotte, R.B., Silva, R.S.S.F., Souza, H.M., 2008. Chlorogenic acid reduces theplasma glucose peak in the oral glucose tolerance test: effects on hepatic glucoserelease and glycaemia. Cell Biochem. Funct. 26, 320–328.enthin, B., Danz, H., Hamburger, M., 1999. Pressurized liquid extraction of medicinalplants. J. Chromatogr. A 837, 211–219.
rmacognosia 25 (2015) 473–484 483
2010. Farmacopéia Brasileira, 5th ed. Agência Nacional de Vigilância Sanitária,Brasília.
Chan, S.W., Lee, C.Y., Yap, C.F., Wan Aida, W.M., Ho, C.W., 2009. Optimisation ofextraction conditions for phenolic compounds from limau purut (Citrus hystrix)peels. IFRJ 16, 203–213.
Cheung, L.M., Cheung, P.C.K., Ooi, V.E.C., 2003. Antioxidant activity and total pheno-lics of edible mushroom extracts. Food Chem. 81, 249–255.
Delarcina, S., Lima-Landman, M.T.R., Souccar, C., Cysneiros, R.M., Tanae, M.M., Lapa,A.J., 2007. Inhibition of histamine-induced bronchospasm in guinea pigs treatedwith Cecropia glaziovi Sneth and correlation with the in vitro activity in trachealmuscles. Phytomedicine 14, 328–332.
Dhungyah, B., Koirala, P., Sharma, C., Jha, D.K., 2014. Caffeic acid – a potent phyto-compound against diabetes mellitus a review. SMU Med. J. 1, 152–161.
Folador, P., Cazarolli, L.H., Gazola, A.C., Reginatto, F.H., Schenkel, E.P., Silva, F.R.M.B.,2010. Potential insulin secretagogue effects of isovitexin and swertisin iso-lated from Wilbrandia ebracteata roots in non-diabetic rats. Fitoterapia 81,1180–1187.
Genta, S.B., Cabrera, W.M., Mercado, M.I., Grau, A., Catalán, C.A., Sánchez, S.S.,2010. Hypoglycemic activity of leaf organic extracts from Smallanthus sonchi-folius: constituents of the most active fractions. Chem. Biol. Interact. 185,143–152.
Herrera, M.C., Luque de Castro, M.D., 2005. Ultrasound-assisted extraction of phe-nolic compounds from strawberries prior to liquid chromatographic separationand photodiode array ultraviolet detection. J. Chromatogr. A 1100, 1–7.
Hsu, F.-L., Chen, Y.-C., Cheng, J.-T., 2000. Caffeic acid as active principle from the fruitof Xanthium strumarium to lower plasma glucose in diabetic rats. Planta Med.66, 228–230.
Is ık, E., S ahin, S., Demir, C., Türkben, C., 2011. Determination of total phenolic contentof raspberry and blackberry cultivars by immobilized horseradish peroxidasebioreactor. J. Food Compos. Anal. 24, 944–949.
Jacques, R.A., dos Santos Freitas, L., Pérez, V.F., Dariva, C., de Oliveira, A.P., de Oliveira,J.V., Caramão, E.B., 2007. The use of ultrasound in the extraction of Ilex paraguar-iensis leaves: a comparison with maceration. Ultrason. Sonochem. 14, 6–12.
Jain, S.C., Pancholi, B., Singh, R., Jain, R., 2010. Pharmacognostical studies of importantarid zone plants. Rev. Bras. Farmacogn. 20, 659–665.
Jung, U.J., Lee, M.-K., Park, Y.B., Jeon, S.-M., Choi, M.-S., 2006. Antihyperglycemic andantioxidant properties of caffeic acid in db/db mice. J. Pharmacol. Exp. Ther. 318,476–483.
Juntachote, T., Berghofer, E., Bauer, F., Siebenhandl, S., 2006. The applicationof response surface methodology to the production of phenolic extracts oflemon grass galangal, holy basil and rosemary. Int. J. Food Sci. Technol. 41,121–133.
Karthikesan, K., Pari, L., Menon, V.P., 2010. Combined treatment of tetrahydrocur-cumin and chlorogenic acid exerts potential antihyperglycemic effect onstreptozotocin–nicotinamide-induced diabetic rats. Gen. Physiol. Biophys. 29,23–30.
Katsube, T., Tsurunaga, Y., Sugiyama, M., Furuno, T., Yamasaki, Y., 2009. Effect ofair-drying temperature on antioxidant capacity and stability of polyphenoliccompounds in mulberry (Morus alba L.) leaves. Food Chem. 113, 964–969.
Kolb, N., 1999. Microbiological status of untreated Herbal materials. DeutscheLebensmittel-Rundschau 95, 263–269.
Kosalec, I., Cvek, J., Tomic, S., 2009. Contaminants of Medicinal Herbs and HerbalProducts. Arh Hig Rada Toksikol, pp. 485.
Li, B.B., Smith, B., Hossain, M.M., 2006. Extraction of phenolics from citrus peels: II.Enzyme-assisted extraction method. Sep. Purif. Technol. 48, 189–196.
Lima-Landman, M.T.R., Borges, A.C.R., Cysneiros, R.M., De Lima, T.C.M., Souccar, C.,Lapa, A.J., 2007. Antihypertensive effect of a standardized aqueous extract ofCecropia glaziovii Sneth in rats: an in vivo approach to the hypotensive mecha-nism. Phytomedicine 14, 314–320.
Ma, Y.-Q., Chen, J.-C., Liu, D.-H., Ye, X.-Q., 2009. Simultaneous extraction of phenoliccompounds of citrus peel extracts: effect of ultrasound. Ultrason. Sonochem. 16,57–62.
Meng, S., Cao, J., Feng, Q., Peng, J., Hu, Y., 2013. Roles of chlorogenic acid on regulatingglucose and lipids metabolism: a review. Evid. Based Complement. Altern. Med.2013, 1–11.
Montgomery, D.C., 2005. Design and Analysis of Experiments, 6a ed, New Jersey.Nicasio, P., Aguilar-Santamaría, L., Aranda, E., Ortiz, S., González, M., 2005. Hypo-
glycemic effect and chlorogenic acid content in two Cecropia species. Phytother.Res. 19, 661–664.
Ninahuaman, M.F.M.L., Souccar, C., Lapa, A.J., Lima-Landman, M.T.R., 2007. ACEactivity during the hypotension produced by standardized aqueous extract ofCecropia glaziovii Sneth: a comparative study to captopril effects in rats. Phy-tomedicine 14, 321–327.
Olthof, M.R., Hollman, P.C.H., Katan, M.B., 2001. Chlorogenic acid and caffeic acid areabsorbed in humans. J. Nutr. 131, 66–71.
Ong, E.S., 2004. Extraction methods and chemical standardization of botanicals andherbal preparations. J. Chromatogr. B 812, 23–33.
Ong, K.W., Hsu, A., Tan, B.K.H., 2012. Chlorogenic acid stimulates glucose transportin skeletal muscle via AMPK activation: a contributor to the beneficial effects ofcoffee on diabetes. PLoS ONE 7, e32718.
Ong, K.W., Hsu, A., Tan, B.K.H., 2013. Anti-diabetic and anti-lipidemic effects of
chlorogenic acid are mediated by AMPK activation. Biochem. Pharmacol. 85,1341–1351.Pasqualoto, K.F.M., Funck, J.A.B., Silva, F.E.B., Kratz, C.P., 2005. Utilizac ão de probitoscomo instrumento estatístico simples à avaliac ão da distribuic ão de tamanho departículas de dois tipos de celulose microcristalina. Rev. Bras. Farm. 86, 31–34.

4 de Fa
R
R
R
S
S
S
S
84 D.P. Arend et al. / Revista Brasileira
ocha, F.F., Lapa, A.J., De Lima, T.C.M., 2002. Evaluation of the anxiolytic-likeeffects of Cecropia glazioui Sneth in mice. Pharmacol. Biochem. Behav. 71,183–190.
ocha, F.F., Lima-Landman, M.T.R., Souccar, C., Tanae, M.M., De Lima, T.C.M., Lapa,A.J., 2007. Antidepressant-like effect of Cecropia glazioui Sneth and its con-stituents – in vivo and in vitro characterization of the underlying mechanism.Phytomedicine 14, 396–402.
odriguez de Sotillo, D.V., Hadley, M., 2002. Chlorogenic acid modifies plasmaand liver concentrations of: cholesterol, triacylglycerol, and minerals in (fa/fa)Zucker rats. J. Nutr. Biochem. 13, 717–726.
chwab, D., Herling, A.W., Hemmerle, H., Schubert, G., Hagenbuch, B., Burger,H.-J., 2001. Hepatic uptake of synthetic chlorogenic acid derivativesby the organic anion transport proteins. J. Pharmacol. Exp. Ther. 296,91–98.
eeram, N.P., Lee, R., Scheuller, H.S., Heber, D., 2006. Identification of phenolic com-pounds in strawberries by liquid chromatography electrospray ionization massspectroscopy. Food Chem. 97, 1–11.
ilva, I.T., Costa, G.M., Stoco, P.H., Schenkel, E.P., Reginatto, F.H., Simões, C.M.O., 2010.In vitro antiherpes effects of a C-glycosylflavonoid-enriched fraction of Cecropia
glaziovii Sneth. Lett. Appl. Microbiol. 51, 143–148.ouccar, C., Cysneiros, R.M., Tanae, M.M., Torres, L.M.B., Lima-Landman, M.T.R.,Lapa, A.J., 2008. Inhibition of gastric acid secretion by a standardized aqueousextract of Cecropia glaziovii Sneth and underlying mechanism. Phytomedicine15, 462–469.
rmacognosia 25 (2015) 473–484
Spigno, G., Tramelli, L., De Faveri, D.M., 2007. Effects of extraction time, temperatureand solvent on concentration and antioxidant activity of grape marc phenolics.J. Food Eng. 81, 200–208.
Stevanato, R., Fabris, S., Momo, F., 2004. New enzymatic method for the deter-mination of total phenolic content in tea and wine. J. Agric. Food Chem. 52,6287–6293.
Tousch, D., Lajoix, A.D., Hosy, E., Azay-Milhau, J., Ferrare, K., Jahannault, C., Cros, G.,Petit, P., 2008. Chicoric acid a new compound able to enhance insulin releaseand glucose uptake. Biochem. Biophys. Res. Commun. 377, 131–135.
Varley, H., Gowenlock, A.H., Bell, M., 1976. Practical Biochemistry, London.Velioglu, Y.S., Mazza, G., Gao, L., Oomah, B.D., 1998. Antioxidant activity and total
phenolics in selected fruits, vegetables, and grain products. J. Agric. Food Chem.46, 4113–4117.
Vila-Jato, J.L., 1997. Tecnologia Farmacéutica. Aspectos fundamentales de los sis-temas farmacêuticos y operaciones básicas. Madrid, Editorial Sintesis.
WHO, 1998. Quality control methods for medicinal plant materials. In: World HealthOrganization (Ed.), WHO Library Cataloguing-in-Publication Data.
Wolfgang, K., Erich, C., Brigitte, K., 2002. Microbial contamination of medicinalplants. A review. Planta Med. 68, 5–15.
Yu, L., Haley, S., Perret, J., Harris, M., Wilson, J., Qian, M., 2002. Free radical scavengingproperties of wheat extracts. J. Agric. Food Chem. Food Chem. 50, 1619–1624.
Zhang, Y., Seeram, N.P., Lee, R., Feng, L., Heber, D., 2008. Isolation and identification ofstrawberry phenolics with antioxidant and human cancer cell antiproliferativeproperties. J. Agric. Food Chem. 56, 670–675.