in04 - lab 6 - excel addin
TRANSCRIPT

7/21/2019 IN04 - Lab 6 - Excel AddIn
http://slidepdf.com/reader/full/in04-lab-6-excel-addin 1/32
- IN04 -
RSBizWare PlantMetrics Advanced Lab
Lab 6
RSBizWare Excel Add-In
Presenter : Todd SmithRSBizWare PlantMetrics Product Manager

7/21/2019 IN04 - Lab 6 - Excel AddIn
http://slidepdf.com/reader/full/in04-lab-6-excel-addin 2/32

7/21/2019 IN04 - Lab 6 - Excel AddIn
http://slidepdf.com/reader/full/in04-lab-6-excel-addin 3/32
RSTechED 2005 § Rockwell Software 1 of 30
PlantMetrics Advanced Lab 6 RSBizWare
Excel Add-In
Contents
Before you begin.......................................................................................................................2
Tools & prerequisites....................................... .............................. ........................... ................... 2
Overview....................................................................................................................................3
Open a Pre-existing Database ................................ .............................. .......................... ..........4
Examine the BizBikes Example Spreadsheet ......................... .............................. ...................5
Create a new Excel report.......................................................................................................13
Return to the BizBikes Database............................................................................................28
Frequently Asked Questions......................... ............................... ................................ ..........29
Notes........................................................................................................................................30

7/21/2019 IN04 - Lab 6 - Excel AddIn
http://slidepdf.com/reader/full/in04-lab-6-excel-addin 4/32
2 of 30 RSTechED 2005 § Rockwell Software
Before you begin
This lab explores the functionality of the Excel Add-In that ships with RSBizWare. The Add-In is
used to import RSBizWare data into Excel for further manipulation or reporting.
One could argue on one hand that reporting via Excel has no place in an RSBizWare
PlantMetrics application, because it introduces the possibility that a user could alter data taken
from the RSBizWare system. In fact, many PlantMetrics applications replace an in-house
developed Excel-based application that was inaccurate, incomplete, hard to maintain, and hard to
share. In that light, talking about Excel-based reporting may seem like a step backwards.
On the other hand, there may be PlantMetrics users whose needs cannot easily be satisfied by
the RSBizWare reporting engine. They may have a need for very complex reports that are
difficult to author in a database environment, or they may need to take the data that PlantMetrics
provides and manipulate it in another way. For that kind of user, the Excel Add-In may be just the
tool they need.
In this lab you will examine the example Excel Add-In that ships with the BizBikes application on
the RSBizWare CD, as well as create a new report using the Excel Add-In.
Tools & prerequisites
This lab assumes the lab computer has the following software installed and properly configured:
§ Microsoft Windows 2003 Server Standard Edition
§ Microsoft Internet Explorer 6.0 (SP1 or higher)
§ Microsoft SQL Server 2000 Standard Edition (SP3a or higher)
§ RSBizWare 8.0
§ FactoryTalk version 2.0.10
§ The BizBikes RSView32 project, RSSql configuration, and BizBikes database from the
RSBizWare 8.0 CD restored according to the provided instructions
§ RSView32 7.2
§ Microsoft Office XP or 2003 (with FrontPage – optional)
§ Activation licenses for appropriate software
§ An alternate BizBikes database called BizBikes2 that contains example data

7/21/2019 IN04 - Lab 6 - Excel AddIn
http://slidepdf.com/reader/full/in04-lab-6-excel-addin 5/32
RSTechED 2005 § Rockwell Software 3 of 30
Overview
This lab contains instructions on how to create reports in Excel that use data from an RSBizWare
PlantMetrics database.
This lab you will:
§ Restore an RSBizWare database that contains some pre-collected data. There is not enough
time in the lab to collect data that will illustrate the changes you are making.
§ Examine the example Excel report that is included with the BizBikes application to see how it
was constructed using the Excel Add-In.
§ Create a new Excel spreadsheet that will integrate data taken from the BizBikes PlantMetrics
application with other data into a report.

7/21/2019 IN04 - Lab 6 - Excel AddIn
http://slidepdf.com/reader/full/in04-lab-6-excel-addin 6/32
4 of 30 RSTechED 2005 § Rockwell Software
Open a Pre-existing Database
Because this lab exercise is so short in duration, there is not enough time to collect data that
would span multiple days to illustrate the report that is created. So, there is a second BizBikes
database on your machine that contains several days of PlantMetrics data. The first step is to
point all of the RSBizWare services at that database. A System DSN called BizBikes2DSN has
been created for the database, which is called BizBikes2.
1. Launch the RSBizWare Enterprise Manager from the Start menu by selecting Programs >
Rockwell Software > RSBizWare > RSBizWare Enterprise Manager .
2. Select the Server Manager entry in the tree.
3. If prompted , login using the default administrator account:
User: admin
Password admin2
Click Login.
4. Expand the Servers entry on the tree and click the Production Server .
5. On the right side of the dialog box, select BizBikes2DSN from the Data Sources list. Enter
BizBikesUser2 for the Database User ID and bizbikesuser2 for the Database Password.
Click Test Connection and make sure it is successful.
6. Click the Advanced button and enter C:\BizBikes2\html\ into the HTML Root field. Changethe Max Records to Return value to 10000. This sets the maximum limit for the number of
records to be returned by any report, and can be set higher if required. Click Apply to make
the change and restart the server, and click Yes to the confirmation message. Click OK on
the dialog box that warns you not to not interrupt the restart.
7. Expand the Production Server item and select the PlantMetrics Server in the tree.
8. On the right side of the dialog box, select BizBikes2DSN from the Data Sources list. Enter
BizBikesUser2 for the Database User ID and bizbikesuser2 for the Database Password.
Click Test Connection and make sure it is successful. Click Apply to make the change and
restart the server. Click Yes on the confirmation dialog box.
9. Exit the RSBizWare Enterprise Manager at this point. The RSBizWare services are now
using the BizBikes2 database, which contains five days of BizBikes data.
Warning: Do not attempt to start RSSql data collection at any time during this lab. There is no
RSSql configuration associated with the BizBikes2 database.

7/21/2019 IN04 - Lab 6 - Excel AddIn
http://slidepdf.com/reader/full/in04-lab-6-excel-addin 7/32
RSTechED 2005 § Rockwell Software 5 of 30
Examine the BizBikes Example Spreadsheet
There is an example spreadsheet included in the BizBikes application which illustrates the use of
the RSBizWare Excel Add-In.
1. Double-click the file C:\BizBikes\Excel\Example Report.xls to launch Excel and open the
report.
2. Select the Week Summary sheet in the workbook.
3. In the toolbar area you will see an RSBizWare Reporting toolbar. This is automatically
installed on the computer when RSBizWare is installed. Click the Connection Properties to
the RSBizWare Server button ( ) on the left side of the toolbar.
4. Enter the name of the local computer (the computer on which the RSBizWare Production
Server is running), or the word localhost, which is a key word for the local machine. Click
OK.
5. Refresh the data on the spreadsheet with the new data from the RSBizWare database to
which you just attached. To do this, enter the dates 4/19/2005 and 4/22/2005 into cells B1
and B2 and click the Select reports to retrieve current data button ( ).

7/21/2019 IN04 - Lab 6 - Excel AddIn
http://slidepdf.com/reader/full/in04-lab-6-excel-addin 8/32
6 of 30 RSTechED 2005 § Rockwell Software
6. Select the Refresh All Reports check box and click Update to retrieve the current data.
Each of the sheets that make up the report will be refreshed.
7. Return to the Week Summary sheet in the workbook where you should see new data for the
period 4/19/2005 through 4/22/2005. This report would be very difficult to construct using the
RSBizWare reporting environment, which is why it is a good candidate for the Excel Add-In.
It combines data from two report data sources – Workcell History and Event History – and
also pivots that data so that it is in columns by workcell. Finally, it does some calculations on
the resulting numbers.

7/21/2019 IN04 - Lab 6 - Excel AddIn
http://slidepdf.com/reader/full/in04-lab-6-excel-addin 9/32
RSTechED 2005 § Rockwell Software 7 of 30
8. If you select cell B7, you will see that the value in that cell is taken from cell H2 on the Cut
sheet. Click the Cut sheet and look at the data. There is one row of data containing most of
the Workcell History data values summed over the timeframe you defined for the report. Cell
H2 contains the good part count summed over that period. Cells B8, B11, B12 and B19 also
contain data from that sheet, and cell B18 is a calculation on two numbers on that sheet.

7/21/2019 IN04 - Lab 6 - Excel AddIn
http://slidepdf.com/reader/full/in04-lab-6-excel-addin 10/32
8 of 30 RSTechED 2005 § Rockwell Software
9. Select cell B14 and you will see its data is taken from the CutStby sheet, which contains one
line of data summing all the time the Cut workcell has spent in Standby events between the
beginning and ending dates of the report. If you look at cells B15 and B16, you will see
similar data for Operation events and Downtime events.

7/21/2019 IN04 - Lab 6 - Excel AddIn
http://slidepdf.com/reader/full/in04-lab-6-excel-addin 11/32
RSTechED 2005 § Rockwell Software 9 of 30
10. So the Weekly Summary sheet is just a collection of data that comes from other sheets in the
workbook, and the data in those sheets comes from the RSBizWare PlantMetrics database.
To see how those sheets are populated, click the sheet called RSBizWareSetup. This sheet
contains all the report parameter information necessary to populate multiple sheets of the
workbook with data from an RSBizWare database.
11. To see how one of these queries is constructed, select column B on the spreadsheet and
click the Edit Selected Report Parameters button ( ) on the RSBizWare toolbar.

7/21/2019 IN04 - Lab 6 - Excel AddIn
http://slidepdf.com/reader/full/in04-lab-6-excel-addin 12/32
10 of 30 RSTechED 2005 § Rockwell Software
12. This dialog box defines the data to be written to the Cut sheet in the workbook. The Report
Parameters are defined by the report data source, report object, and filter. The Time Range
is optional and has fewer options than the Time Selection toolbar in an RSBizWare report.
Each report defined this way should go to a separate sheet in the workbook, and within that
sheet you can specify the starting cell for the report. Click Cancel to close the dialog box.
13. Run the RSBizWare Production Client from the Windows Start menu by selecting Programs
> Rockwell Software > RSBizWare > RSBizWare Production Client.

7/21/2019 IN04 - Lab 6 - Excel AddIn
http://slidepdf.com/reader/full/in04-lab-6-excel-addin 13/32
RSTechED 2005 § Rockwell Software 11 of 30
14. Create a new report by selecting File > New Report and insert an existing report object by
selecting Insert > Existing RSBizWare Report Object. Click Yes to confirm the authoring
information.
15. Specify the same report data source, report object, and filter as on the dialog box in Step 12
and click OK.
16. Double-click the report object, select the Time Range button ( ), and specify the time
range shown in the dialog box in Step 12, and click the Refresh button ( ) to refresh the
report. Compare the output to the contents of the Cut sheet in the Excel workbook to the
report object. They should be identical.
The report objects and filters used by the Excel Add-In must be created by using the
authoring capabilities of the RSBizWare Production Client. Once created, all the grid reports
are accessible to the Excel Add-In.
Note: The Excel Add-In cannot use chart reports.

7/21/2019 IN04 - Lab 6 - Excel AddIn
http://slidepdf.com/reader/full/in04-lab-6-excel-addin 14/32
12 of 30 RSTechED 2005 § Rockwell Software
17. Return to Excel and to the RSBizWareSetup sheet in the workbook. Select cell B15, which
contains the Start Date of the time range used in the report. Note that the value in this cell is
taken from cell B1 on the Week Summary worksheet, so when you changed those dates in
Step 5, the value in this cell (B15) was also updated with the new dates, which in turn
changed the query parameters of the report defined in column B. If you look at all the entries
in rows 15-18, you will see they are all configured to take their values from the WeekSummary worksheet.
Note: If you set up the Report Parameters to take a value from another cell like this, the
indirect reference will be lost each time you edit the Report Parameters and save the
changes. So if you change any report parameters, you will have to re-establish the indirect
reference.
7/21/2019 IN04 - Lab 6 - Excel AddIn
http://slidepdf.com/reader/full/in04-lab-6-excel-addin 15/32
RSTechED 2005 § Rockwell Software 13 of 30
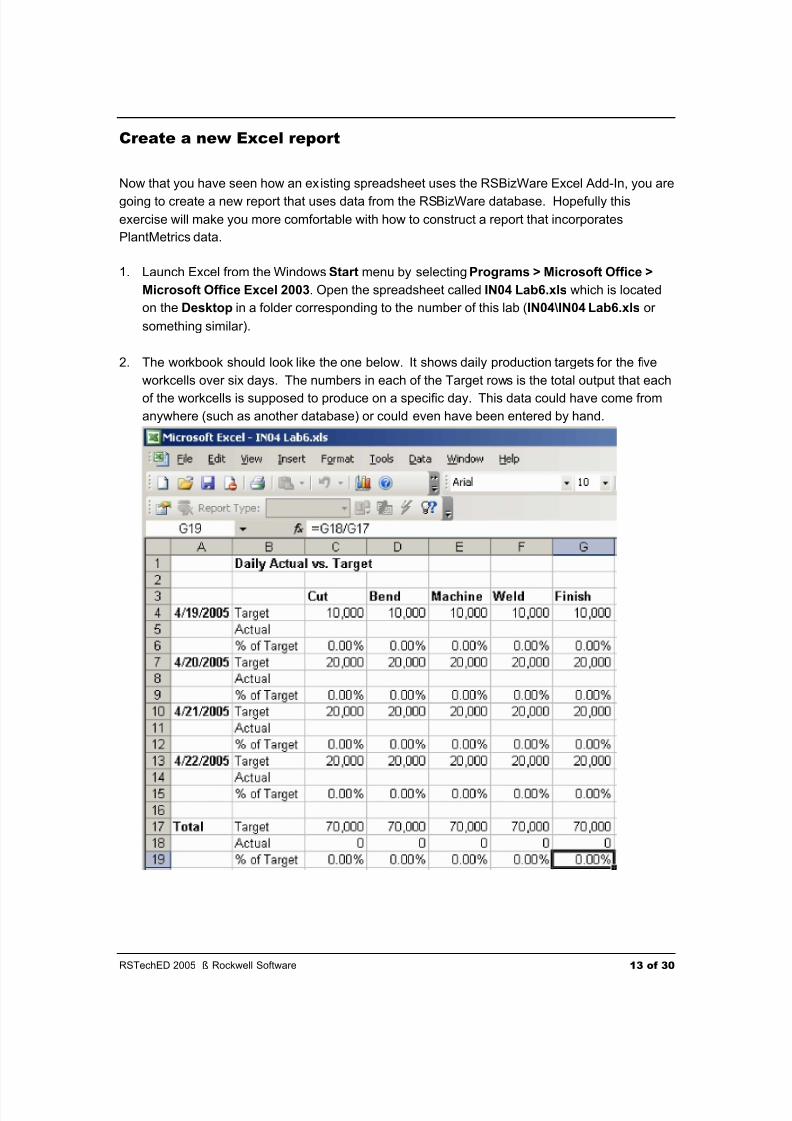
Create a new Excel report
Now that you have seen how an existing spreadsheet uses the RSBizWare Excel Add-In, you are
going to create a new report that uses data from the RSBizWare database. Hopefully this
exercise will make you more comfortable with how to construct a report that incorporates
PlantMetrics data.
1. Launch Excel from the Windows Start menu by selecting Programs > Microsoft Office >
Microsoft Office Excel 2003. Open the spreadsheet called IN04 Lab6.xls which is located
on the Desktop in a folder corresponding to the number of this lab (IN04\IN04 Lab6.xls or
something similar).
2. The workbook should look like the one below. It shows daily production targets for the five
workcells over six days. The numbers in each of the Target rows is the total output that each
of the workcells is supposed to produce on a specific day. This data could have come from
anywhere (such as another database) or could even have been entered by hand.

7/21/2019 IN04 - Lab 6 - Excel AddIn
http://slidepdf.com/reader/full/in04-lab-6-excel-addin 16/32
14 of 30 RSTechED 2005 § Rockwell Software
What you want to add to this report is the data in the Actual rows, which you will get from the
RSBizWare database. The calculations for % of Target and totals are already in the
spreadsheet, so as soon as you f ill in the Actual lines, they will be calculated.
This would be a difficult report to create in PlantMetrics, because there is nothing in the data
model equivalent to a Target production count. There is Ideal Capacity, which represents the
production count under ideal conditions, but a Target production count would no doubt becloser to historical actual production counts.
One could incorporate Target production counts into the RSBizWare reporting structure, but it
would involve creating a table in the database to contain Target production counts (or
referencing an existing external table), creating a database view that joined PlantMetrics
Workcell History data with the Target production count data, and creating an RSBizWare
report data source of the resulting view that could be used for RSBizWare reporting.
To populate this report, you first have to create a PlantMetrics report that will provide the data
that you need. Three fields are needed:
§ Workcell Description
§ Date
§ Total of Good Parts for the date
Finally, the report needs to get its date range from the Actual vs Target worksheet.
3. Return to the RSBizWare Production Client, create a new report by selecting File > New
Report, and insert a new text report object by selecting Insert > Text Report. Click Yes to
the authoring prompt.
4. On the wizard, click Next until you get to the Report Data Source and Fields dialog box.
Select PlantMetrics Workcell History from Report Data Source list. Then select the 3 fields
shown below. Click Next.

7/21/2019 IN04 - Lab 6 - Excel AddIn
http://slidepdf.com/reader/full/in04-lab-6-excel-addin 17/32
RSTechED 2005 § Rockwell Software 15 of 30
5. You want only one line in the report for each workcell for each day, so select the Workcell
Description and Start Time fields and move them to the Grouped fields list. Then select
Start Time and click Grouping Interval.
6. Select mm/dd/yyyy as the grouping interval format. That will give you one record for each
day. Click OK. Click Next.

7/21/2019 IN04 - Lab 6 - Excel AddIn
http://slidepdf.com/reader/full/in04-lab-6-excel-addin 18/32
16 of 30 RSTechED 2005 § Rockwell Software
7. Select the SUM checkbox for the Good Parts field to display a total value for that field for
every day and every workcell. Click the Summary Only option. Click Next.
8. Click Next on the Format Style dialog box (styles are not used by the Excel Add-In). Name
the report object Total by Day. Click Next.
9. Select Cut Workcell from the Filter list. This filter selects records from the Cut workcell only.
Click Next and Finish to finish the Report Wizard.
10. Before viewing the new report, you must associate the report object with the Cut Workcell
filter. So right-click the report object and select Properties.

7/21/2019 IN04 - Lab 6 - Excel AddIn
http://slidepdf.com/reader/full/in04-lab-6-excel-addin 19/32
RSTechED 2005 § Rockwell Software 17 of 30
11. On the Report Object Properties dialog box, select the Runtime Settings tab and select Cut
Workcell from the Default Filter list. Then click OK to save the settings and return to the
report.
12. Double-click the report object, select the All Times button ( ) from the Time Selection
toolbar, and click the Refresh button ( ). Your report should look like this.
13. Right-click the report object and select Properties. Select the Runtime Settings tab and
select the Filter check box. Click OK. Now you can change the filter selection to see data
from other workcells.
14. Select File > Save Report to save the report and name it Total by Day.

7/21/2019 IN04 - Lab 6 - Excel AddIn
http://slidepdf.com/reader/full/in04-lab-6-excel-addin 20/32
18 of 30 RSTechED 2005 § Rockwell Software
15. Return to Excel. Click the Connection Properties to the RSBizWare Server button ( )
on the RSBizWare toolbar and enter localhost as the host name. A new sheet called
RSBizWareSetup should appear in the workbook.
16. On the RSBizWareSetup sheet, click somewhere in column B and make sure Grid Data is
selected in the Report Type list. Click the Create new Report Parameters button ( ) in
the RSBizWare toolbar.

7/21/2019 IN04 - Lab 6 - Excel AddIn
http://slidepdf.com/reader/full/in04-lab-6-excel-addin 21/32
RSTechED 2005 § Rockwell Software 19 of 30
17. On this dialog box you will provide all the parameters needed to run the report you just
created and store the results in Excel. Choose the same report data source, report object
and filter that you used with the Total by Day report.
Check the Use Time Range checkbox, but don’t specify a value for Start Date or End Date.
Those will be set in the worksheet using Excel. Specify an output sheet named Cut (whichwill be created) in the Target Sheet box. Click Save and OK to the acknowledgement.

7/21/2019 IN04 - Lab 6 - Excel AddIn
http://slidepdf.com/reader/full/in04-lab-6-excel-addin 22/32
20 of 30 RSTechED 2005 § Rockwell Software
18. The resulting Cut worksheet will be blank because there is no data in the database for the
time period specified. Return to the RSBizWareSetup sheet, click cell B15, which is the Start
Date for the report just created, and type this into the cell:
=MIN('Actual vs Target'!A4:A13)
If you know Excel, you also know that everything between the parentheses in this expression
can be entered automatically if you switch to the Actual vs Target worksheet and select the
cells between A4 and A13. Press Return and the value 4/19/2005 should appear in cell B15.
That expression will select the smallest date between cells A4 and A13 on the Actual vs
Target sheet. That means you can change the dates used in the Actual vs Target sheet and
the query to the RSBizWare database will automatically change with it.
Type the following into cell B17, which is the End Date for the report defined by column B:
=MAX('Actual vs Target'!A4:A13)
The value 4/22/2005 should appear in the cell. This expression will select the latest date
from the Actual vs Target worksheet.
Now enter 23:59:59 into cell B18, which is the Time End for the report query.
19. Click the Select reports to retrieve current data button ( ) on the RSBizWare toolbar to
re-query for data.

7/21/2019 IN04 - Lab 6 - Excel AddIn
http://slidepdf.com/reader/full/in04-lab-6-excel-addin 23/32
RSTechED 2005 § Rockwell Software 21 of 30
20. Select the Cut report (really the worksheet name) from the Report Name list and click
Update.
21. The data that now appears in the Cut worksheet should be identical to the Total by Day
report that you saved using the RSBizWare Production Client. Check to make sure that it is.
22. Next, you must incorporate this data into the Actual vs. Target sheet. Select the Actual vs
Target sheet. Select cell C5 and type in the following:
=Cut!C2
This will populate cell C5 with the total good part count from 4/19/2005 on the Cut worksheet.

7/21/2019 IN04 - Lab 6 - Excel AddIn
http://slidepdf.com/reader/full/in04-lab-6-excel-addin 24/32
22 of 30 RSTechED 2005 § Rockwell Software
23. Enter the following expressions into the rest of the Actual cells in column C:
§ Cell C8: =Cut!C3
§ Cell C11: =Cut!C4
§ Cell C14: =Cut!C5
Column B on the sheet should now be completed.

7/21/2019 IN04 - Lab 6 - Excel AddIn
http://slidepdf.com/reader/full/in04-lab-6-excel-addin 25/32
RSTechED 2005 § Rockwell Software 23 of 30
24. Repeat Steps 16 through 23 and create Report Parameters for the Bend workcell in column
C of the RSBizWareSetup worksheet, and link the resulting data to the appropriate cells on
the Actual vs. Target spreadsheet. When you are finished, the Actual vs. Target worksheet
should look like this:

7/21/2019 IN04 - Lab 6 - Excel AddIn
http://slidepdf.com/reader/full/in04-lab-6-excel-addin 26/32
24 of 30 RSTechED 2005 § Rockwell Software
25. Repeat Steps 15-0 and follow the same process to import data for the three remaining
workcells (Machine, Weld, and Finish). When finished, the Actual vs Target worksheet
should look like this:
Save the workbook file. All the RSBizWare report properties content is also saved. This
spreadsheet can be reused over and over again with different dates. Correct operation of the
calculations is based on several assumptions:
§ The dates on the Actual vs Target spreadsheet are sorted in chronological order.
§ The dates on the Actual vs Target spreadsheet are consecutive.
§ If dates are missing from the Actual vs Target spreadsheet, no production was done on
the missing dates.
§ All workcells produced product on the same days.
In this lab you did not explore some of the more advanced features of Excel, but it is possible
to use some of those features to change or eliminate some of the above assumptions.
Hopefully it is evident how you might use this same method to produce a report that showed
Actual vs Target by shift, by week, or by month.
7/21/2019 IN04 - Lab 6 - Excel AddIn
http://slidepdf.com/reader/full/in04-lab-6-excel-addin 27/32
RSTechED 2005 § Rockwell Software 25 of 30
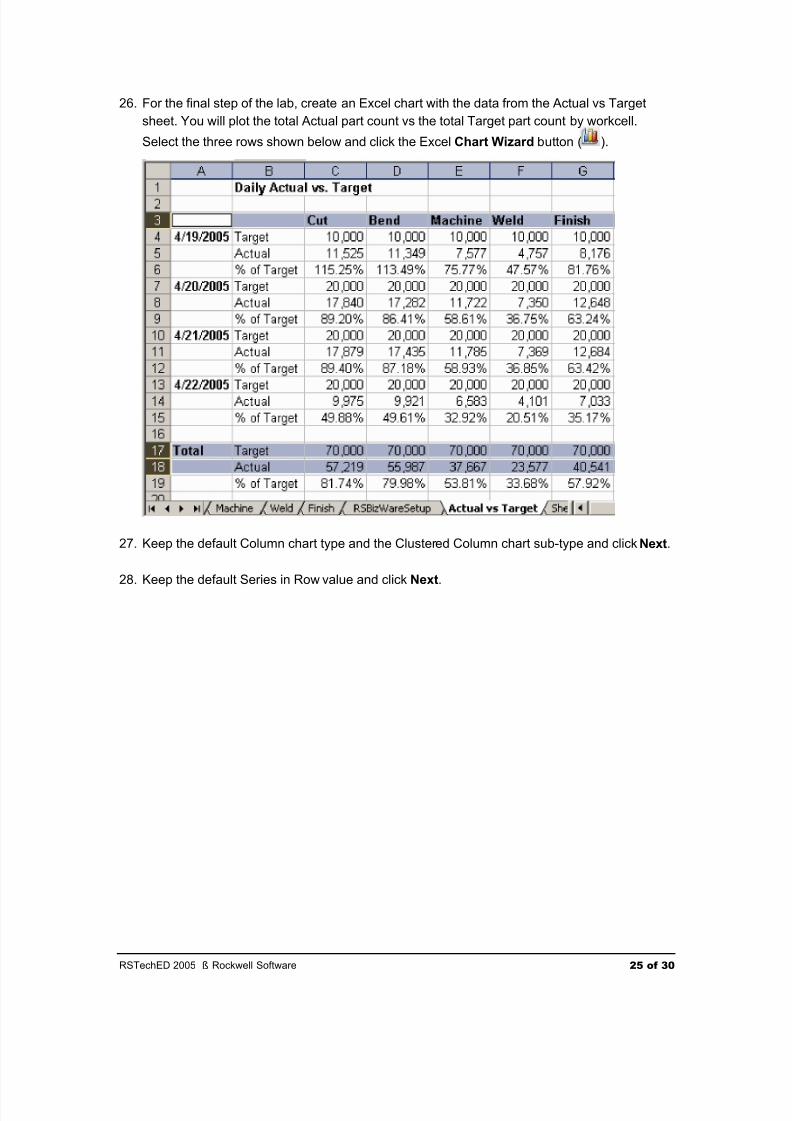
26. For the final step of the lab, create an Excel chart with the data from the Actual vs Target
sheet. You will plot the total Actual part count vs the total Target part count by workcell.
Select the three rows shown below and click the Excel Chart Wizard button ( ).
27. Keep the default Column chart type and the Clustered Column chart sub-type and click Next.
28. Keep the default Series in Row value and click Next.

7/21/2019 IN04 - Lab 6 - Excel AddIn
http://slidepdf.com/reader/full/in04-lab-6-excel-addin 28/32
26 of 30 RSTechED 2005 § Rockwell Software
29. Type Total Actual vs Target 4/19-4/22 for the Chart title, Workcell for the Category (X) axis,
and Good Production Count for the Value (Y) axis. Click Next.
30. Click Finish to make the chart part of the Actual vs Target worksheet and complete the chart.

7/21/2019 IN04 - Lab 6 - Excel AddIn
http://slidepdf.com/reader/full/in04-lab-6-excel-addin 29/32
RSTechED 2005 § Rockwell Software 27 of 30
31. Resize or move the chart as you see fit. Save your final worksheet.

7/21/2019 IN04 - Lab 6 - Excel AddIn
http://slidepdf.com/reader/full/in04-lab-6-excel-addin 30/32
28 of 30 RSTechED 2005 § Rockwell Software
Return to the BizBikes Database
If you are going to continue with another lab, you should return the standard BizBikes database
on which most of the labs are based. Remember, for this lab you connected to a database that
was pre-loaded with some data.
1. Run the RSBizWare Enterprise Manager from the Windows Start menu by selecting
Programs > Rockwell Software > RSBizWare > RSBizWare Enterprise Manager .
2. Select the Server Manager entry in the tree, expand the Servers tree item, and select the
Production Server .
3. On the right side of the dialog box, select BizBikesDSN from the Data Sources list. Enter
BizBikesUser for the Database User ID and bizbikesuser for the Database Password. Click
Test Connection and make sure it is successful.
4. Click the Advanced button and enter C:\BizBikes\html\ into the HTML Root box. Change
the Max Records to Return value to 1000. Click Apply to make the change and restart the
server, and click Yes to the confirmation message. Click OK on the dialog box that warns
you not to not interrupt the restart.
5. Select the PlantMetrics Server item in the tree.
6. On the right side of the dialog box, select BizBikesDSN from the Data Sources list. Enter
BizBikesUser for the Database User ID and bizbikesuser for the Database Password. Click
Test Connection and make sure it is successful. Click Apply to make the change and
restart the server. Click Yes on the confirmation dialog box.
7. Exit the RSBizWare Enterprise Manager. The RSBizWare services are now using the
standard BizBikes database again.

7/21/2019 IN04 - Lab 6 - Excel AddIn
http://slidepdf.com/reader/full/in04-lab-6-excel-addin 31/32
RSTechED 2005 § Rockwell Software 29 of 30
Frequently Asked Questions
Q: When and how is the Excel Add-In installed?
A: The Excel Add-In is automatically installed and registered whenever the RSBizWare
Production Client is installed. The default location for the Add-In is C:\Program files\Rockwell
Software\RSBizWare\RSBizWareExcelAddIn.dll. The RSBizWare toolbar is installed when
Excel is next run. You must launch Excel to install the toolbar; if you just launch an existing
Excel spreadsheet, the toolbar will not install.
Q: Can you insert RSBizWare Objects into an Excel spreadsheet?
A: No. RSBizWare ActiveX controls are only supported in Internet Explorer, RSView32,
RSViewSE, RSBizWare Production Client, FrontPage and Visual Basic. Excel, Word, andother Office products are not supported.
Q: Can an Excel spreadsheet with RSBizWare content be shared with other users via
RSBizWare Quick Web?
A: There is not a straightforward way to do this. The Microsoft Office Web Components for
spreadsheets will not work with the Excel Add-In, so you cannot drop an interactive
spreadsheet onto a Web page and have it query the RSBizWare database. You could create
a Web page that imports an existing spreadsheet (via CSV), but that would have to be
manually updated every time the spreadsheet changed. If you figure out a better way, let
your instructor know and you may get a nice gift!

7/21/2019 IN04 - Lab 6 - Excel AddIn
http://slidepdf.com/reader/full/in04-lab-6-excel-addin 32/32
Notes