inadequacies of research used to monitor … · each report has serious errors, ... fat-tailed...
TRANSCRIPT

Rock Art Research 2017 - Volume 34, Number 2, pp. 130-148. J. L. BLACK, I. BOX and S. DIFFEY130
KEYWORDS: Research credibility – Industry emission – Air pollution – Colorimetry
INADEQUACIES OF RESEARCH USED TO MONITOR CHANGE TO ROCK ART AND REGULATE INDUSTRY ON
MURUJUGA (‘BURRUP PENINSULA’), AUSTRALIA
John L. Black, Ilona Box and Simon Diffey
Abstract. Murujuga (‘Burrup Peninsula’) in northwest Western Australia contains the largest concentration of petroglyphs in the world. A substantial petrochemical industrial complex has been placed in close proximity to this cultural treasure. A review of the publically avail-able research reports used by governments to justify establishment of industry and the levels of acceptable emissions reveals the research is not scientifically credible in design, method-ology, analysis or interpretation. Each report has serious errors, which renders most results to be of little value. There remains a knowledge deficit on the condition of petroglyphs. No credible decisions about the effects of industry on the rock art can be made using the reports.
IntroductionThe Dampier Archipelago, which includes the island
Murujuga (‘Burrup Peninsula’), is estimated to contain more than one million rock art images in the form of petroglyphs (JMcD CHM 2011). These petroglyphs are thought to capture thousands of years of human culture and spiritual beliefs through a changing environment (Bednarik 1979; Donaldson 2009; JMcD CHM 2011; McDonald and Veth 2009; Mulvaney 2011). The rock art is believed by some to contain the oldest known representation of the human face (Mulvaney 2015). Other petroglyphs include elaborate geometric designs, purported extinct mammals such as megafauna, the fat-tailed kangaroo and Thylacines, as well as existing animals, birds and sea creatures (Bird and Hallam 2006; JMcD CHM 2011; Mulvaney 2009, 2013, 2015). The Murujuga inhabitants created this rock art until 1868, when the Yaburara indigenous population was almost exterminated beginning with the ‘Flying Foam Massacre’ (Bednarik n.d. 2006: 16–22; Gara 1983). The petroglyphs on Murujuga are a priceless, irreplaceable, historical and archaeological treasure of global significance.
The island (connected to the mainland by a cause-way) is also the site of a huge industrial complex. An iron ore export terminal was established at King Bay towards the southern end of Murujuga in 1964 and a salt production and export facility commenced operation in 1970. These developments were followed in the late 1970s to early 1980s with natural gas processing facilities at Whitnell Bay and an additional liquefied natural gas (LNG) production plant in 1995. In 2007,
construction commenced of a second LNG facility situated between King Bay and Whitnell Bay, with first production in 2012. An ammonium fertiliser plant commenced production in 2006 and an ammonium nitrate production facility is complete and awaiting a licence to operate. The Port of Dampier is now one of the busiest bulk-handling ports in the world. During the year 2013–2014, 6027 vessels entered the port with exports approaching 180 million tonnes. A single bulk cargo ship burning high-sulphur fuels has been estimated to release 5200 tonnes per year of sulphur oxides into the atmosphere (Vidal 2009). The sulphur dioxide combines with water to form sulphuric acid. The shipping, liquefied gas, fertiliser and ammonium nitrate plants are in close proximity to the rock art motifs. Indeed, well over 2000 rocks containing motifs were removed with many more destroyed to allow construction of the LNG facilities (Bednarik 2002, 2006; Davidson 2011; Donaldson 2009; González Zarandona 2011).
Concerns were raised in the early 2000s (Bednarik 2002) about the potential impact of increased industrial emissions, particularly acidity, on bleaching of petroglyphs and adjacent rock surfaces from erosion of the ferruginous patina crust. Monitoring changes in rock surface colour and mineralogy were chosen as appropriate macroscopic means for assessing likely changes to rock art due to industrial emissions (Summaries of proposed rock art monitoring studies 2004). The magnitude of change considered detrimental for rock art appears not to have been set. However, governments have used reports from this research on

131Rock Art Research 2017 - Volume 34, Number 2, pp. 130-148. J. L. BLACK, I. BOX and S. DIFFEY
air pollutants, colour change and mineralogy at rock art sites (Gillett 2008; Lau et al. 2013; Lau et al. 2007; Lau et al. 2008; Lau et al. 2010; Lau et al. 2009; Lau et al. 2011; Lau et al. 2012; Markley et al. 2014; Markley et al. 2015) to justify continued establishment of industry on Murujuga. The reports have been used by industry and the Western Australian Government to establish a new ammonium nitrate facility, and to set the limits for emissions from this facility with an acid load of 200 meq/m2/year (ERM 2012: 26), 135 tonnes/year of oxides of nitrogen, 163.7 tonnes/year of nitrous oxide and ammonium nitrate dust sized PM10 particle emissions at 25.2 tonnes/year (EPA 2011: 2–3).
These reports were reviewed by the authors of this paper to establish the scientific credibility and value of the reports for decision making in relation to preservation of the rock art. The lack of statistical analyses and the overall poor quality of the reports prompted this review. Several inadequacies of the Lau et al. (2007) report have been detailed previously (Bednarik 2009) and the failure of the program was predicted before it commenced (Bednarik 2004).
The reportsThe Western Australian Government established
in 2002 the Burrup Rock Art Monitoring Management Committee (BRAMMC) to oversee studies designed to determine whether the rock art was likely to be adversely affected by industrial emissions. Funds (» $1.2m) for the research were provided from industry on Murujuga, but administered by the Western Australian Government. Five studies were initiated: an air pollu-tion study (Gillett 2008), atmospheric modelling of air pollutant concentrations and depositions (Sinclair Knight Merz 2009), artificial fumigation studies (Lau et al. 2007), a microbiological diversity study (O’Hara 2008) and colour change and mineralogy studies (Lau et al. 2008). A summary of the reports to BRAMMC concludes: ‘There are no known impact assessment criteria for the impact of air quality to rocks of the type that exist on the Burrup and that contain rock art’ (Sinclair Knight Merz 2009: 1). The reports do not state that emissions from industry will not adversely affect rock art. However, industry claims that an impact of emissions on rock art is not likely (ERM 2013: 14), while government submissions state: ‘it is unlikely that the relatively small quantities of NO2 and NH3 that would be emitted from the TANPF [Technical Ammonium Nitrate Production Facility] would have a significant impact on rock art in the surrounding areas’ (EPA 2011: iii).
The study monitoring colour and mineralogy changes on selected sites across Murujuga was continued beyond 2007, adding to the annual measurements taken since 2004. Annual reports on these measurements have been released by the Western Australian Government (Lau et al. 2013; Lau et al. 2008; Lau et al. 2010; Lau et al. 2009; Lau et al. 2011; Lau et al. 2012; Markley et al. 2014; Markley et al. 2015), with, at the time of writing,
the latest being for measurements from 2004 to 2014. A review of these reports including measurements beyond 2007 revealed the following statement:
The comparison of the colour and spectral data collected and processed for both the Northern (control sites) and Southern sites has shown no consistent trend in an increasing or decreasing direction. For the last 11 years no observed accelerated colour contrast change was detected at the Southern test sites, when compared with the Northern control sites (Markley et al. 2015: vii).
Statements such as these are made without presen-tation of statistical analyses until the report including the 2012 results (Lau et al. 2013). The accuracy of the statements could not be verified by outside observers using the information presented in the annual reports because there was insufficient data or statistical inform-ation presented for sound reanalysis or reinterpretation. Limited statistical analyses have been provided in the 2014 and 2015 reports (Markley et al. 2014; Markley et al. 2015). These later reports primarily analyse differences between northern and southern sites for colour changes in the current year and for changes in mineralogy (Markley et al. 2014; Markley et al. 2015). Standard errors for yearly measurements have not been presented, undermining any validity of these studies.
MethodThe three reports used primarily by governments
and industry to justify additional industry on Murujuga and levels of emission have been:• 2007 Report: Lau D., E. Ramanaidou, S. Furman, I.
Cole, T. Hughes and P. Hoobin 2007. Field studies of rock art appearance, final report: fumigation & dust deposition, progress report: colour change & spectral mineralogy.
• 2008 Report: Gillett R. 2008. Burrup Peninsula air pollution study: report for 2004/2005 and 2007/2008.
• 2015 Report: Markley T., M. Wells, E. Ramanaidou, D. Lau and D. Alexander 2015. Burrup Peninsula Aboriginal petroglyphs: colour change & spectral mine-ralogy 2004–2014.Each report was examined in relation to accepted
scientific method (Black et al. 2016; Gliner et al. 2017), including the quality and adequacy of the design, methodology, analysis and interpretation. Inadequacies, where identified, were evaluated in relation to existing scientific literature.
Two methods were used to assess the reliability of the spectrophotometers and the procedures used for measuring colour space variables (L*, a* and b*) in the reported studies.
Prediction of colour from reported L*, a* and b* values
A representation of a colour was generated from reported L*, a* and b* colour space values using an online colour calculator (Irotek 2017) with settings: illuminant: D65 (daylight); observer: 2º (1931). The pictorial colours generated from the reported colour space
Rock Art Research 2017 - Volume 34, Number 2, pp. 130-148. J. L. BLACK, I. BOX and S. DIFFEY132
variables provide an approximate check on whether the values obtained from the spectrophotometers are a reasonable representation when compared with colour photographs provided in reports for each rock art site. The consistency of the Hyper Text Markup Language (HTML) colour value produced from the Irotek (2017) colour calculator were checked against a second colour calculator’s (Loncar 2017) HTML colour values and by using the Red, Green and Blue (RGB) values from both calculators. The HTML and RGB colour values were consistent across the two colour calculators. Colour swatches were cropped from the Irotek (2017) generated HTML colour sample and superimposed on photographs from the reports to compare the colours predicted from the reported L*, a* and b* values with those in the photographs.
Prediction of L*, a* and b* values from colour imagesA square photographic colour image of a selected
size and pixel number was used to calculate the L*, a* and b* values for each pixel and the average and frequency distribution of those values for that image. A photograph from a report or literature was inserted into PowerPoint (Microsoft 2007) and, preserving scale, squares of a selected size were marked. The marked up photograph was saved as a Portable Network Graphics Format (.png) file using the PowerPoint ‘Save as Picture…’ function. The marked up photograph .png file was opened in Paint.NET (Brewster et al. 2017). For each square marked on a photograph, the square area (without the square border) was selected using the Magic Wand tool. The selected area was copied, pasted into a new file with a canvas size the exact size of the selected area and saved as a .png file. Each square area .png file was uploaded and processed using Image
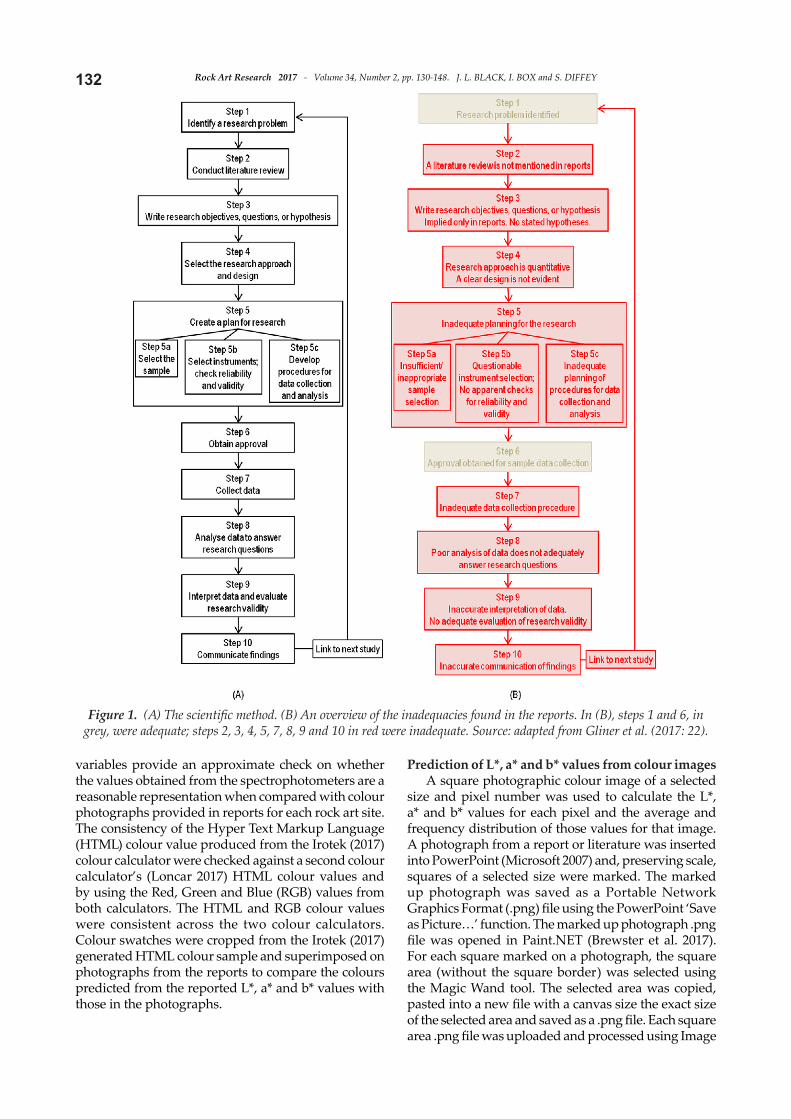
Figure 1. (A) The scientific method. (B) An overview of the inadequacies found in the reports. In (B), steps 1 and 6, in grey, were adequate; steps 2, 3, 4, 5, 7, 8, 9 and 10 in red were inadequate. Source: adapted from Gliner et al. (2017: 22).

133Rock Art Research 2017 - Volume 34, Number 2, pp. 130-148. J. L. BLACK, I. BOX and S. DIFFEY
Color Summarizer (Krzywinski 2017a) with settings: output format: text; statistics: histogram; number of colour clusters: 10; delimiter: tab; precision: vhigh (200 pixels width). Each file was analysed in RGB values and converted via XYZ colour space to International Commission on Illumination (CIE) Lab colour space using a D65 illuminant (Krzywinski 2017b). L*, a*, and b* statistics were derived from the total number of pixels for each square colour image.
Scientific methodFigure 1 shows the scientific method and the
inadequacies found across the set of reports. Many crucial steps of the scientific method were not followed in the studies, with serious consequences for the value of the reports for making decisions relating to preservation of rock art on Murujuga. Most evident was the lack of review of factors likely to change the colour and composition of rock surfaces, the importance of surface heterogeneity and appropriateness of instruments used in the harsh Murujuga environment. There appeared to be no clear experimental design to account for environmental factors known to affect measurement variability, no consideration of statistical processes or of the number of replicates needed to prove differences were significant. Lack of statistical analyses resulted in failure to accurately interpret results. The findings from the studies were not written into papers for peer review and publication in scientific journals.
2007 ReportThe Lau et al. (2007) report includes results from
three experiments: (i) fumigation study with industrial gaseous emissions; (ii) immersion of rock in organic compounds, acids or alkali; (iii) colour and spectral mineralogy changes at seven selected rock art sites.
Fumigation studyFragments of Murujuga rock with exposed surface
patina and engraving were fumigated with a mixture
of gaseous pollutants at two concentrations for 720 cyclic, one hour periods, under fluctuating conditions of temperature and humidity. Treatments included a control without industrial gases, plus two gas concentrations described as ‘x1’, to represent projected future industry emissions, and ‘x10’, to represent ten-times projected future industrial emissions. Fumigation was conducted with and without dust. Measurements were made of spectral and colour differences before and after fumigation.
Inadequacy:Insufficient replication: the design of this controlled
experiment was inadequate to show whether there was a statistically significant effect of gaseous fumigation on either rock surface colour or mineralogy.
The experiment included one replication for treat-ments (control, x1 and x10) for petroglyph (‘engraving’) or for background rock without dust and no replications for those treatments with dust. Insufficient replication meant that statistical analysis could not be conducted for the fumigation studies with dust and statistical analyses were not conducted for experiments without dust. The variation in measurements (Table 1) between the two replicates was so great for the studies without dust that conclusions based on normal statistical procedures could not be made. Colour measurements were reported to have been made on three 2 mm diameter areas before and after fumigation. However, the values were averaged and no standard errors of the measurements presented (Table 1).
Table 1 shows large inconsistencies between the two replicate measurements for both petroglyphs and background rock. The difference in colour change bet-ween replicates of the same treatment range from 1.3- to 3.9-fold. Five of the six colour difference (ΔE76) values for the controls lie outside the range for fumigated samples and in one instance (background replicate 1) by 6.5 ΔE76 units. The variation between measurements is so great; no sound scientifically based conclusion
Treatment Colour change (ΔE76)Control Fumigation x1 Fumigation x10
Petroglyph replicate 1 7.72 17.91* 5.23Petroglyph replicate 2 5.75* 6.13 20.14Replicate difference (fold) 1.3 2.9 3.9Petroglyph-dust replicate 1 7.62* 7.61 3.27Background replicate 1 4.78 13.50 11.27*
Background replicate 2 6.89 6.43* 4.35*
Replicate difference (fold) 1.4 2.1 2.6Background-dust replicate 1 13.39* 2.81 12.39
* These figures appear to have rounding errors, either up or down, based on our comparison between the reported data and our calculations.Notes: The table contains the reported ΔE values. The reported ΔE values are labelled as Δ CMC in Lau et al. (2007: 39). However, we could only closely replicate the ΔE reported values using the ΔE76 colour-difference formula, and not the ΔE CMC (l:c) colour-difference formula.Source: adapted from Lau et al. (2007: 39–40)
Table 1. Change in colour (ΔE76) for petroglyph and background rock following fumigation with and without dust (Control ΔE76 values outside the range for fumigated samples are highlighted in orange).

Rock Art Research 2017 - Volume 34, Number 2, pp. 130-148. J. L. BLACK, I. BOX and S. DIFFEY134can be made.
A well-founded interpretation of the results would have been that, given the observed measurement variability, there were insufficient replicates to make conclusions about the impact of pollutant mixtures on the surface of Murujuga rocks or petroglyphs.
Clearly, with no possibility of conducting statistical analyses, the claims by Lau et al. (2007) are not credible. Nevertheless, Lau et al. (2007: 40) stated:
the comparison between the control samples and the exposed samples measured in the laboratory shows that the colour change values are within the same range for both groups. The samples that were exposed with dust did not show a significantly different colour change either. There was not a consistent increase in the colour change value with the exposure concentration increase from x1 to x10.
Use by Lau et al. (2007) of the word ‘significantly’ in the above extract is ungrounded, and potentially misleading, because no statistical analyses were, or could be conducted.
The Fourier transform infrared spectroscopy (FTIR) figures (Lau et al. 2007: 29, 30, 34) show differences in mineralogy scans before and after fumigation. However, due to the lack of sufficient replicates, a statistical test is not possible to determine if the differences are significant. Even though mineralogy analyses ‘allow[ed] the formation of hypotheses’ (Lau et al. 2007: 19–20), the experiment did not follow this critical design step in the scientific method, where the number of replicates is identified to show significance, with 95% confidence, for a specified percentage change in measurements before and after fumigation.
Emersion studyThe emersion study involved placing iron ore
samples in vials containing solutions of water, concen-trated benzene, toluene, xylene, 1 molar nitric acid, concentrated nitric acid, 1 molar sulphuric acid, con-centrated sulphuric acid, 1 molar ammonia or concen-trated ammonia at ambient temperature or at 50°C for 22 days. The iron ore was washed with water and dried. Colour and mineralogy change was compared with untreated iron ore.
Treatment with sulphuric acid at both concentrations produced colour and mineralogy changes to the iron ore.
Inadequacy:Iron ore was used in the experiment and not rock
surfaces with rock varnish or of the lithology on which the petroglyphs occur. The results are worthless for understanding the effects of industrial pollutants on rock art.
Colour change and spectral mineralogy studiesThe colour change and mineralogy studies measured
background rock and petroglyphs at seven rock art sites across Murujuga, Dolphin and Gidley Islands. The measurements in the 2007 report covered the period
from 2004 to 2006.These studies have continued beyond 2006 with
annual reporting to the Western Australian Government. The last report available to the public at the time of writing covered the period 2004 to 2014 (Markley et al. 2015) and the inadequacies of this research are dealt with under 2015 Report below.
2008 ReportGillett (2008) reports air pollutant concentrations
and meteorological data on Murujuga in 2004–5 and 2007–8. The report is generally scientifically sound and well written. However, the report concludes that rock art on Murujuga has a critical acid load of 200 meq/m2/year (Gillett 2008: 3). Yara Pilbara has set the limits of total acid deposition from the TANPF at 200 meq/m2/year, based on this conclusion (ERM 2012: 5).
Inadequacy:Gillett (2008) did not measure the acid load that
would affect the surface of rocks on Murujuga or their buffering capacity (ability to neutralise the acid). Gillett (2008) based his conclusions on the report of Cinderby et al. (1998) who assessed the ‘critical load’ of acid in terms of meq/m2/year for ecosystems of major regions of the world. Critical load is defined as ‘a quantitative estimate of an exposure to one or more pollutants below which significant harmful effects on specified sensitive elements of the environment do not occur according to present knowledge’ (Nilsson and Grennfelt 1988: 9). Critical load is a term applied to a specific pollutant for a specific risk on a nominated target such as trees, fish or people. Critical acid load for rock art on Murujuga is one specific application of this principle: the effect of acid on rock patina.
The Cinderby et al. (1998) use of critical load relates to the ability of soils to neutralise acidity and reduce damaging impacts on vegetation and other living organisms within an ecosystem. Cinderby et al. (1998) defined critical load to assess the impact of soil acidification on vegetation, on a global scale. Critical load, as used by Cinderby et al. (1998), applies to soils and ecosystems not to rocks or rock art.
Cinderby et al. (1998) used six categories to assess sensitivity of an environment to acid load. The sensitivity was determined by the buffering capacity of the soil. Soils with low buffering capacity were most sensitive to acid load at 25 meq/m2/year, whereas soils with the highest buffering capacity had a high critical load of 200 meq/m2/year. Soils with greater than 200 meq/m2/year were considered to have no critical acid load. Gillett (2008) used a broad map of Australia developed by Cinderby et al. (1998) to assess that the critical acid load for soil on Murujuga was the highest of the five critical load categories at 200 meq/m2/year.
Cinderby et al. (1998) do not mention the Dampier Archipelago in their report. Rather they used world soil maps developed by the United Nations Food and Agriculture Organisation to suggest areas of the world

135Rock Art Research 2017 - Volume 34, Number 2, pp. 130-148. J. L. BLACK, I. BOX and S. DIFFEY
that would be more and less sensitive to acid-producing pollutants. Australia is included in their map, but the resolution of critical load areas is extremely low, with a scale of 1:5 000 000. The area marked on the Cinderby map used by Gillett (2008) is approximately 300 000 km2. This area is treated as one critical load soil type and is considered to have the least sensitivity to acid (200 meq/m2/year). Murujuga is about 110 km2 (DEE n.d.), or 0.03% of the Cinderby map area. While the Cinderby map area defines one soil type, Murujuga has at least three soil types, none of which are relevant to the Cinderby map (CSIRO Land and Water n.d.).
Ecosystems with fast-weathering rocks produce high buffering-capacity soils and have a high critical load (Cinderby et al. 1998; Ifo 2012). Conversely, ecosystems with slow-weathering rocks have low buf-fering-capacity soils and a low critical load (Cinderby et al. 1998). A critical load of 200 meq/m2/year suggested by Gillett (2008) would indicate the rocks on Murujuga have a high-weathering rate. However, the rocks of Murujuga, where the petroglyphs are found, are extremely slow-weathering (Pillans and Fifield 2013). Based on the arguments developed by Cinderby et al. (1998), these rocks would be expected to have low critical load and the ecosystem would be highly sensitive to acid emissions. The category from Cinderby et al. (1998) with the most sensitivity had critical load values of 25 meq/m2/year for sulphur only. ‘The inclusion of nitrogen deposition would increase the risk posed to ecosystems’ (Cinderby et al. 1998: 2). The Gillett (2008) report provides measured values of total acid load, that is, sulphur and nitrogen, near the industrial areas of Murujuga of 25 meq/m2/year in 2004/2005 and 32 meq/m2/year in 2007/2008. In 2008, these values were already, given present knowledge, in excess of the most likely critical load for Murujuga (i.e. <25 meq/m2/year).
Kuylenstierna, leader and a co-author of Cinderby et al. (1998), concluded in his submission to the Senate Inquiry into Protection of Aboriginal Rock Art of the Burrup Peninsula (Kuylenstierna 2017: 2; Parliament of Australia website 2016):
the use of the Cinderby et al. 1998 global sensitivity map and critical loads to say anything of relevance to the rock art in the Burrup Peninsula is just plain wrong — for many reasons and should not be used in evidence to the committee. It cannot be used by industry or governments to justify acid load emissions of 200 meq/m2/year.
The conclusion made by Gillett (2008) about the critical acid load for rock art on Murujuga is incorrect. The Murujuga rocks are extremely sensitive to acid because of their slow weathering rate. The slow rate of erosion of rocks on Murujuga would indicate the critical acid load would be the lowest on the international scale (i.e. 25 meq/m2/year). The conclusion the critical acid load for rock art on Murujuga is 200 meq/m2/year cannot be used to justify the level of emissions proposed by Yara Pilbara Nitrates Pty Ltd as the assessment criterion (ERM 2012: 26).
2015 Report Markley et al. (2015) report on the 2004 to 2014 colour
contrast and spectral mineralogy studies undertaken from 2004 at seven rock art sites. Measurements were made at three spots for petroglyphs and adjacent background rock at each site. Colour measurements were made from 2004 to 2012, using a BYK-Gardner model 45/0 portable spectrophotometer (BYK) and from 2009 to 2014, using a Konica Minolta CM-700d spectrophotometer (KM). Reported errors relating to electronic transfer of data from the BYK instrument resulted in measurements being available from the BYK-Gardner spectrophotometer for 2004 to 2012, from both BYK and KM instruments for 2009 to 2012 and for the KM instrument only for 2013 to 2014.
Colour was assessed using the CIE standard coordinates with measurement of the L*, a* and b* colour space variables. Changes in colour, ΔE, between yearly observations were calculated from the colour space variables using the 1976 CIE colour difference formula (Markley et al. 2015). Annual reports have been prepared since 2007 and delivered to the Western Australian Government. These reports conclude there have been no consistent changes in colour or mineralogy for either background rock or petroglyphs at rock art sites across Murujuga from the time measurements commenced in 2004.
Inadequacies:1. Inadequate statistical analyses: the conclusions were
made without the presentation of statistical analyses in reports up to Lau et al. (2013), which included 2012 measurements. Limited statistical analyses were provided in the 2014 and 2015 reports (Markley et al. 2014; Markley et al. 2015). These statistical analyses were included only after one of us (JLB) made the recommendation of the necessity for statistical analyses to the Burrup Rock Art Technical Working Group (BRATWG). Statistical analyses in these two reports primarily relate to differences between northern and southern sites for colour changes in the current year and for changes in mineralogy. Standard errors for yearly measurements were not presented for colour variables and a thorough statistical analysis of all colour space variables (L*, a*, b*, and ΔE76) across time was not undertaken.
The data used by Markley et al. (2015) to claim there were no consistence changes in colour across the 11 years of measurement were provided to the authors of this paper for appropriate statistical analysis. These analyses have been completed, but (as at 11 March 2017) public release of the results from these analyses has been withheld by the Minister for the Environment in the Western Australian Government. Provision of the data to the authors was covered by a confidentiality agreement.
2. Inconsistencies in results reported from year to year: Table 2 shows the reported inter-year colour change (ΔE76) values for averaged background rock and

Rock Art Research 2017 - Volume 34, Number 2, pp. 130-148. J. L. BLACK, I. BOX and S. DIFFEY136
petroglyphs at Site 7 (Deep Gorge) for all available reports. Similar data are available in the reports for other sites. ΔE76 at rock art sites was compared only from one year to the next and not from the first to the last year of measurement in three of the annual reports.
Colour change values for a specific yearly interval, for example 04–05, should remain the same for every subsequent report. However, values for L*, a*, b* and ΔE76 for specific years vary across reports. In 317 instances (28%, n=1134), L*, a* or b* values differ from the previous year or are missing. The reasons for these differences or treatment of missing data are not described, but may be due to a change in instruments or data manipulation when adjusting BYK measurements to be more closely aligned to the KM measurements. In 17 instances (5%, n=336), we cannot reproduce the reported ΔE76 values using the 1976 CIE ΔE algorithm. These changes in year-to-year results and the inability to repeat ΔE calculations destroy all confidence in the integrity of the data or conclusions drawn.
Results appear to have been selectively not presented in the Markley et al. (2015) report. For example, previous reports in the annual series describing colour and mineralogy changes at the seven rock art sites have noted that the greatest colour changes have occurred at Site 7. Figure 21 of the Markley et al. (2015) report shows a constant decline across years in the colour contrast between background rock and petroglyphs at Site 7. However, results from Site 7 are not included in the statistical analyses or ‘Box Plots’ presented in Figures 26, 28 and 30 for L*, a* and b* respectively.
Markley et al. (2015) used the 1976 CIE ΔE algorithm
for determining colour change. However, the 2000 CIE ΔE formula was available when the research commenced. Habekost (2013) shows convincingly that the 2000 ΔE algorithm is superior to the 1976 version for assessing colour differences.
3. Suitability of, and change in, spectrophotometers, with lack of adequate cross-calibration: Specifications for the BYK and KM instruments suggest they are not suitable for accurately measuring colour change of rocks on Murujuga (Table 3). The spectral range from 400–700 nm does not cover the full range of visible light from 380–750 nm. Large spectral intervals of 20 nm and 10 nm for the BYK and KM instruments, respectively, reduce precision of measurements (ASTM International 2001). The instruments are designed for use on smooth surfaces, are not recommended for application outdoors in dusty environments and have operating temperature and humidity limits likely to be exceeded on Murujuga. Changing temperature and humidity affect colour readings (BYK-Gardner GmBH 2009; Hunter and Harold 1987). The small aperture of the instruments (4 mm and 3 mm diameter, respectively, for BYK and KM), when applied to the heterogeneous surface of Murujuga rocks, adds to variation in colour measurement depending on the exact positioning of the aperture. Lack of clear identification of the settings used for each instrument for each measurement adds to uncertainties in accuracy of measurements (ASTM International 2001; Hunt and Pointer 2011).
Markley et al. (2015) provide a comparison of measurements from the BYK and the KM instruments. The comparison was for 13 measurements obtained for
Years for colour change (ΔE76) comparisonsReport year Data years 04–05 05–
0606–07
07–08
08–09
09–10
10–11
11–12
12–13
13–14
2004 to last
2007 2004–06 10.58 6.10‡ 4.17
2008 2004–07 10.58 6.10‡ 7.58 6.10‡
2009 2004–08 10.58 6.10‡ 7.58 3.80 8.91‡
2010 2004–09 10.58 6.10‡ 7.58 3.80 8.26 13.49‡
2011 2004–10 10.58 6.10‡ 7.58 3.80 8.26 8.36 12.962012 2004–11 10.58 6.10‡ 7.58 3.80 8.26 8.36 10.58 NR2013 2004–12 10.58 6.10‡ 7.58 3.78 8.26 8.36 10.58 2.68 NR2014* 2004–13 4.84 5.7‡ 5.45 2.5 12.02 1.69‡ 1.08‡ 2.46 1.8 NR2015 2004–14 10.58§ 9.00‡ 7.58 3.78 NP 1.76§ 1.04 2.46 1.8 2.17‡ 9.48†‡
* All data reported in 2014 for L*a*b* and ΔE76 appear to be from BYK converted to KM or the KM data sets.† Comparison of 2004 with 2014 used 2004 BYK data converted to be comparable with KM data (Markley et al. 2015: 36).‡ We could not calculate ΔE76 from available data to equal these values.§ Based on available data and our use of the CIE ΔE76 formula, we found these values have rounding errors either up or down.Notes: We adjusted our calculations for missing L*a*b* values for 2004, Site 7, Spot 3, Engraving for all report years and for 2010, Site 7, Spot 3, Engraving for report years: 2011, 2012, and 2013 so that we could compare our calculated values with reported values.NR = Not reportedNP = Not provided; ‘No comparison calculated for 2008–09 due to change of instrument’ (Markley et al. 2015: 36)Sources: Lau et al. (2013); Lau et al. (2007); Lau et al. (2008); Lau et al. (2010); Lau et al. (2009); Lau et al. (2011); Lau et al. (2012); Markley et al. (2014); Markley et al. (2015).
Table 2. Reported average ΔE76 from year to year and from 2004 to the last year for Site 7 (Deep Gorge), all spots, background and petroglyph.

137Rock Art Research 2017 - Volume 34, Number 2, pp. 130-148. J. L. BLACK, I. BOX and S. DIFFEY
greyish, smooth or rough red surfaces of rocks. The mean results and standard errors for L*, a* and b* for the two instruments presented in the report are shown in Table 4.
The results show larger measurement standard errors for the greyish and rough red surfaces, but not for the smooth red surface for the BYK than the KM instrument. A smooth red surface would more closely resemble the surfaces for which the BYK and KM instruments were intended. The report states: ‘The numerical value of the measurements are slightly different which is to be expected given the measurement angle may be altered due to the head configuration’ (Markley et al. 2015: 10). On average the KM values were 20.6% higher (range 4.3% to 46%) than the BYK values. These differences are large in the context of colour change for rocks on Murujuga and not, as Markley et al. (2015) describe as, ‘slightly different’. The results suggest the two instruments may not be measuring the same variables. Despite these substantial
differences in measured values between instruments, Markley et al. (2015) appear to have made no attempt to identify which instrument was measuring correctly and why the KM instrument was consistently producing colour variables with higher values.
The same observers and illuminants were presu-mably set for the two instruments, though this was notspecified. Spectrophotometer geometry influences colour measurements. The geometry of the KM instrument has been observed to provide higher lightness values than the geometry of the BYK instrument (Kandi 2011: 70). Similarly, surface texture can affect colour difference measurements from 0.4 to 4.8 CIE ΔE2000 units (Hunt and Pointer 2011; Kandi 2011: 70). The BYK measurement area is about 1.8 times larger than the KM measurement area. Rough surfaces make it more difficult to exclude light than smooth surfaces (Kandi 2011) and extraneous light destroys integrity of measurements. More measurements using instruments with a smaller aperture are required to achieve the same
Attribute BYK-Gardner (BYK) Konica Minolta CM-700d (KM)Observer 2º, 10º 10º
Illuminant A; C; D50; D55; D65: F2; F6; F7; F8; F10; F11 D65-simulated daylight
Spectral wavelength range
400–700 nm 400–700 nm†
Spectral interval 20 nm 10 nm
Geometry 45/0 di: 8º, de: 8º†
Aperture 4 mm (SAV): f3 mm measurement areaf6 mm illumination area
Operating temperature 10–42°C* 5–40°C†
Humidity <85 % relative humidity, non-condensing/35°C* ≤80 % relative humidity, non-condensing/35°C†
Operating conditions
Do not allow any foreign objects to get into the measurement opening. Do not expose the unit to direct sunlight for extended periods of time. Do not store it in a hot or dusty environment. *
The reading may fluctuate slightly due to changes in the ambient temperature or due to heat generation caused by repeated operation of the instrument … designed exclusively for indoor use … should never be used outdoors because … factors may damage the instrument. †
Note: SAV = spectrophotometric absorbance values.Sources: * BYK-Gardner GmBH (2009); † Konica Minolta (2013); except where indicated, Markley et al. (2015).
Table 3. Attributes of the BYK-Gardner and Konica Minolta CM-700d spectrophotometers.
Rock Greyish surface (n=13) Smooth red surface (n=13) Rough red surface (n=13)Variable L* a* b* L* a* b* L* a* b*KM meanSE
41.27±0.29
11.46±0.31
19.14±0.27
39.32±1.75
18.39±1.44
18.52±1.35
39.59±0.50
13.54±0.19
19.12±0.29
BYK meanSE
29.36±5.59
10.18±1.41
16.79±2.55
37.64±1.63
16.47±1.30
16.19±1.97
30.69±4.69
8.51±1.27
10.22±2.50
Diff (%) 28.9% 11.2% 12.3% 4.3% 10.4% 12.6% 22.5% 37.1% 46.5%
Source: Markley et al. (2015: 10, Table 5)
Table 4. Results of comparison between KM and BYK instruments for measuring colour space variables on different rock surfaces.

Rock Art Research 2017 - Volume 34, Number 2, pp. 130-148. J. L. BLACK, I. BOX and S. DIFFEY138precision as a larger aperture, particularly when the surface is heterogeneous (Lakacha 2015).
4. Validity of colour measurements: the accuracy of colour measurements obtained from the spectrophotometers was assessed by two methods:a) For the years 2004 and 2014 and each of the site,
spot and background or petroglyph rock positions at Site 6 and Site 7, the reported L*, a* and b* values were used to generate a colour swatch (Method: Prediction of colour from reported L*, a* and b* values) that was superimposed onto the appropriate site photograph provided by Markley et al. (2015). The 24 data-origin colour swatches were visually compared for approximation of lightness and colour representation with the petroglyph and background in the site photograph.
b) For each of the site, spot and background or petroglyph rock positions at Site 6 and Site 7, a
selected area (either 182 or 196 pixels) near the identified spots in the site photograph was used to generate corresponding average L*, a* and b* values (Method: Prediction of L*, a* and b* values from colour images). These average L*, a* and b* values for the selected area were used to generate an image-origin colour swatch for comparison with the site photograph and data-origin colour swatches (a above). These image-origin average L* a* and b* values were also used to calculate ΔE76 colour difference between background rock and petroglyphs in the site photographs and compared with those presented in the Markley et al. (2015) report.Measured L* values of results from Markley et al.
(2015) show that Site 6 (Water Tanks: granophyre rock) tended to have the lightest coloured rock (highest L* values) and Site 7 (Deep Gorge: gabbro rock) the darkest
coloured rock (lowest L* values). Figure 2 shows representations of Site 6 and Site 7 cropped from photographs provided by Markley et al. (2015). All photographs of rock art sites across the series of reports appear to have been taken in 2004.
Superimposed on Figure 2 are data-origin colour swatches generated from the published L*, a* and b* values in Markley et al. (2015) for background rock and petroglyphs at each spot for 2004 and 2014. The photographs also have superimposed image-origin colour swatches generated from the L*, a* and b* values obtained from the image within the white squares marked on the photograph. The area of the white square was selected as representative of the background rock and petroglyph at each spot. However, the image was removed from the spot located by Markley et al. (2015) because there appeared to be pinkish-purplish circles (Fig. 3) surrounding the marked spots that would have influenced the colour used to generate the image-origin swatches. Markley et al. (2015) do not report how they avoided these
Figure 2. Site 6 and Site 7 images cropped from photos taken in 2004 (Lau et al. 2005) and data-origin colour swatches rendered from reported L*a*b* data and image-origin swatches (marked with white squares). Note: the data for Site 7, Spot 3, Engraving is not available for 2004, so the data for 2005 were used. The largest site photographs based on pixel width and height were used. Sources: colour swatches generated using Irotek (2017); Site 6 photo from Lau et al. (2010); Site 7 photo from Lau et al. (2009); L*a*b* data to generate 2004 and 2014 colour swatches from Markley et al. (2015).
Figure 3. Site 7, Spot 2 magnified 800 times showing pinkish-purplish circles surrounding each spot identified by Markley et al. (2015). The source of these circles is unclear, whether applied by Markley et al. (2015) or a chromatic aberration (Ridpath 2012).

139Rock Art Research 2017 - Volume 34, Number 2, pp. 130-148. J. L. BLACK, I. BOX and S. DIFFEY
artificially coloured areas, but it may be a chromatic aberration on the photograph (Ridpath 2012).
Differences in colour generation and the multi-coloured nature of a rock position mean there will be inconsistencies when comparing the colours of data-origin swatches with the colours in the photographs. However, we can reasonably expect a site photograph to depict elements of reality, particularly relating to the comparative lightness of features in the image.
Two observations from the data- and image-origin colour swatches (Fig. 2) and calculated ΔE76 values between background rock and petroglyph (full analyses not shown) lead to serious concerns about the validity of the colour measurements reported by Markley et al. (2015).
The petroglyphs are clearly lighter than the background for both sites in the site photographs (Fig. 2), yet the data-origin colour swatches show the petroglyphs as darker than the background at all spots, with the difference being particularly noticeable in 2004. The lighter swatches generated for background than petroglyphs correspond to higher L* values for background rock than petroglyphs in Table 11 from Markley et al. (2015). The colour difference in 2004 between background rock and petroglyph for the combined three spots was 3.8 ΔE76 units for Site 6 and 16.8 ΔE76 units for Site 7 with the petroglyphs being darker. The corresponding differences between background rock and petroglyphs for the combined three spots when calculated for the image-origin colour swatches were 6.9 ΔE76 units for Site 6 and 14.5 ΔE76 units for Site 7, with the petroglyphs being lighter in colour than the background rock.
The second major discrepancy between the Markley et al. (2015) observations and the photographs was the values for L* or lightness. The average measured L* value for all background and engraving spots at Site 6 was 35, compared with 72 when determined for image-origin colour swatches at the spots identified by white squares in Figure 2. Corresponding values for L* at Site 7 were 12 measured by Markley et al. (2015) and 46 as derived for the image-origin swatches.
These discrepancies between data-origin and image-origin colour swatches seriously question the validity of the colour measurements taken by Markley et al. (2015). There is a visually detectable change in the lightless and colour of data-origin swatches at all measured locations between 2004 and 2014 for Site 7 and some for Site 6. However, the reports concluded that no change had occurred, despite the recorded L*, a* and b* values showing a colour change. A statistical analysis is required to support or refute the visual evidence in Figure 2.
5. Variation from year to year in ASD measurements: the ASD instrument is a spectrometer used to measure reflectance of light wavelengths from 350 to 2500 nm. Changes in reflectance at specific wavelengths can be used to calculate colour and mineralogy differences over time. Markley et al. (2015) conclude: ‘A robust
statiscal [sic] analysis of the ASD spectra was conducted for the second time and showed that none of the engravings or background showed systematic change through time’. This statement may be true, but is grossly misleading because the variation in year-to-year measurements at any one rock location is so great that no logical conclusion can be made about changes in ASD wavelengths or colour over time.
The extent of the variation in measurements across years at one location is illustrated as an example in Figure 4, for Site 1, Spot 2, Engraving; reproduced from Markley et al. (2015). Other locations have smaller and larger variation than shown in Figure 4. A review of all ASD spectral graphs in the Markley et al. (2015) report suggests that the range in year-to-year values represents around 50% of the mean value for any measured spot. The second fact to note from the Markley et al. (2015) ASD graphs is that the order of reflectance values for spots is not constant across years, with the highest and lowest value frequently coming from different years. Figure 5 illustrates further the variation across years of measurement, showing the year for the lowest value coming from different years on Site 5, Spot 1 and Spot 2 for petroglyphs.
Markley et al. (2015) claim that this variation is due to ‘random variation’. Despite the variation, the Markley et al. (2015) analyses show there are significant trends over time at some rock locations. These significant trends are for ten of the 42 measured locations and are not in a consistent direction. Markley et al. (2015) conclude that these significant trends are likely to be ‘false positives’ and that the analyses show there has been no consistent change over time.
If there was no change in reflectance across years (as claimed by Markley et al. 2015), and the measurement procedure was accurate, the measured value for each year would be exactly the same. Figures 4 and 5 show clearly large variation from year to year at one rock location in the reflectance spectra, which suggests that highly variable measurement procedures were used. The scientists undertaking the ASD measurements have revealed that, until 2016, all measurements were made without removing and replacing the instrument on
Figure 4. Year-to-year variation in reflectance measurements for Site 1, Spot 2 petroglyph. Source: Markley et al. (2015: 65).

Rock Art Research 2017 - Volume 34, Number 2, pp. 130-148. J. L. BLACK, I. BOX and S. DIFFEY140
the rock surface (Ramanaidou 2016). Although ‘repeat measurements’ were made at individual locations across the study area and years, the variation in these measurements on any occasion simply represented the in-built instrument variation and the steadiness of the operator while holding the instrument on the rock. Thus, the ‘repeat measurements’ resolve into one single measurement for each year, with no true replication.
The authors of this paper have been provided with the more than 10 000 ASD-generated files for the Markley et al. (2015) report. Data from these files can be used to identify the date and time of day for each measurement, the frequency of ‘white reference’ and ‘dark current’ calibration measurements and other procedures. These data have been analysed for every location to identify within-year and between-year variation, whether
there were significant differences between years at one specific rock location and, assuming only one position placement of the instrument each year, the number of years it would take to show a 5% change in colour to be significant with 95% confidence using the experimental procedures. Unfortunately, these analyses cannot be included in this paper because, at the time of writing, their release has been withheld by the Minister for the Environment in the Western Australian Government under provisions of a confidentiality agreement.
6. Positioning of instrument aperture on the rock surface: the consequences of placing the instrument head at only one position on a rock and not making multiple replicate measurements can be demonstrated using a photograph of the surface of a rock from Murujuga (Bednarik 2007: 224, Fig. 19). Summaries of proposed
rock art monitoring studies (2004) states that digital photography would be used to locate the required position on each rock to within one millimetre. However, Bednarik (2009: 58) believes this would be impossible because the ‘baffle surrounding the tool’s [BYK] aperture measures about 12 cm’.
The impact on colour measured from placing the KM instrument with a 3 mm diameter aperture at three different places on the rock surface in the Bednarik (2007) photograph and of moving the aperture 0.5 mm to the right was determined by calculating L*, a* and b* from selected images (Method: Prediction of L*, a* and b* values from colour images). The five millimetre scale on the photograph was used to place a square, with the same area as an aperture with a 3 mm diameter, at purposefully selected locations (Patton 2002: 230) on to the photograph to obtain a range of lightness and colours. The colour space variables were used to calculate the ΔE76 colour differences between the squares. Image-origin colour swatches were created using the calculated L*, a* and b* (Method: Prediction of colour from reported L*, a* and b* values).
The three positions (A, B, C) selected on
Figure 5. Year-to-year variation at Site 5, petroglyphs for spots 1 and 2 showing inconsistency in order of reflectance measurements from the ASD instrument. Source: Markley et al. (2015: 68).
Figure 6. Three square areas (A, B, C) with the same area as a 3 mm diameter aperture positioned on a photograph of the surface patina of a Murujuga rock (Bednarik 2007: 224, Fig. 19) and moved 0.5 mm to the right in the lower panels.

141Rock Art Research 2017 - Volume 34, Number 2, pp. 130-148. J. L. BLACK, I. BOX and S. DIFFEY
the Bednarik (2007) photograph and the change in position when moved 0.5 mm to the right are illustrated in Figure 6. The range in L*, a* and b* values associated with each position on the photograph is shown in Table 5. Variation in L* for all pixels within and between A, B and C is shown in Figure 7. The consequences of selecting one position compared with another on the calculated ΔE76 colour change and the average colour swatch are given in Table 6.
Selecting position B instead of position A resulted in a 5.92 change in ΔE76, whereas selecting position C instead of position A resulted in a 13.30 change in
ΔE76. Selection of position C instead of position B resulted in a change of 18.71 in ΔE76. These differences are perceivable to the human eye (ΔE > 2.0, Habekost 2013) and are large as the total range of ΔE76 is 100 units. Similarly, moving the position of A, B, and C 0.5 mm to the right changed ΔE76 by 3.74, 2.00 and 7.55 units, respectively.
The example using the photograph of a Murujuga rock surface shows the importance of accurately positioning the aperture of the instruments. Even a small error in positioning of 0.5 mm has a marked effect on colour; many true replicates that involve positioning,
Square Position L* a* b*Avg Median Min Max Avg Median Min Max Avg Median Min Max
A 0, 0 51 51 29 85 26 26 10 44 22 22 6 50B 0, 0 46 46 17 80 25 25 1 47 19 17 -8 47C 0, 0 59 60 22 79 34 35 16 52 29 29 1 49A 0.5, 0 50 51 14 75 24 24 8 41 19 19 -2 46B 0.5, 0 48 48 17 78 25 25 1 49 19 18 -8 51C 0.5, 0 55 56 22 76 30 31 8 52 24 26 0 46
Table 5. L*, a* and b* colour space values predicted from each pixel in each square with the same area as a 3 mm diameter aperture using the Image Color Summarizer (Krzywinski 2017a). Abbreviations: ‘Ave’ average value; ‘Min’ minimum
value; ‘Max’ maximum value.
Figure 7. Range in lightness values (L*) for every pixel across the entire area of the three squares (A, B, C)selected on the Bednarik (2007: 224, Fig. 19) photograph (see Fig. 6).
Square Posi-tion
Colour difference between squares in the same position (ΔE76)
Colour difference between squares in different positions (ΔE76) L*a*b* Average
colour swatchA-B A-C B-C A-A B-B C-CA 0, 0 5.92 13.30 3.74
B 0, 0 5.92 18.71 2.00
C 0, 0 13.30 18.71 7.55
A 0.5, 0 2.24 9.27 3.74
B 0.5, 0 2.24 9.95 2.00
C 0.5, 0 9.27 9.95 7.55
Table 6. Effect of changing position on the rock surface on the colour difference determined by CIE ΔE76 calculations using average L*, a* and b* values predicted for each square with the same area as a 3 mm diameter aperture using the
online colour calculator (Irotek 2017).

Rock Art Research 2017 - Volume 34, Number 2, pp. 130-148. J. L. BLACK, I. BOX and S. DIFFEY142
removal and repositioning are required to allow for surface colour and texture heterogeneity.
7. Identified variation in procedures: a review of all reports describing the collection of colour and mineralogy data reveals huge inconsistency in procedures used across sites, rock locations and years (Fig. 8).
Examples of the inconsistencies in experimental procedures include:
• No obvious means for holding instruments at a constant angle to the rock surface as required.
• The angle of the instrument to the rock surface changed.
• No obvious method for ensuring extraneous stray light does not enter the measuring aperture.
• Instruments were rested directly on rocks or in carry cases and/or left in the sun.
• Measurements were made in and not in shadows, with and without using umbrellas.
• White gloves were used sometimes.• Notebooks and other items were at varying
distances from the measuring instrument.• Unknown variation in time from BYK, KM or ASD
powered on to time of measurement.Other inconsistencies are known also to have
occurred, but illustration of these cannot be given because of the confidentiality agreement with the Western Australian Government.
8. Errors in reporting: a review of all reports describing the colour and mineralogy studies reveals poor quality in the consistency and accuracy of the writing. Examples of the inconsistencies in writing include:• Numerical values for the same observation change
year on year.• Typographical errors are repeated year on year.• Text duplicated from a previous year is not altered
to having meaning for the current reporting year.
DiscussionThe large number of inadequacies identified in
the reports indicates the authors failed to follow the scientific method, including undertaking a thorough review of the literature in relation to the nature of the rock surfaces to be measured or the suitability of the instruments used to make measurements. The authors also appear to have failed to design the experiments, particularly in relation to the variance in measurements, factors associated with experimental procedures, the external environment that would influence the measured values and the number of replicates needed to prove a specified percentage change in a measured value would be significant at the P<0.05 level of probability (Black et al. 2016). Lack of appropriate measurement and treatment replication has been a major failing across the studies conducted. Several inadequacies in experimental procedures and inappropriateness of the BYK instrument were identified previously by Bednarik (2009). The inadequacies in experimental procedures are so great that no sound judgement can be made from the experiments about whether industrial emissions have changed colour or mineralogy characteristics on rock surfaces at rock art sites on Murujuga.
The fumigation study (Lau et al. 2007) was flawed because there were either no or insufficient treatment replications. It is not an acceptable scientific practice to conclude there were no differences before or after fumigation when there were insufficient replicates to
Figure 8. Illustration of inconsistent methods used across years. Sources: top: Lau et al. (2005: 63, Fig. 32); middle: Lau et al. (2010 cover); bottom: Markley et al. (2014: 58, Fig. 27)

143Rock Art Research 2017 - Volume 34, Number 2, pp. 130-148. J. L. BLACK, I. BOX and S. DIFFEY
undertake a statistical analysis. The lack of sufficient replication of treatments and enormous variability between measurements for the same treatment renders the fumigation study worthless for making decisions about the effects of industrial emissions on rock art. Government and industry emissions standards cannot be based on the fumigation study.
The study involving emersion of iron ore in vials of liquid organic compounds, nitric acid, sulphuric acid or ammonia (Lau et al. 2007) has no relevance to understanding whether these compounds will change the colour or composition of the surface of Murujuga rocks. The study is of no value for providing knowledge that may assist preservation of the petroglyphs. The impact of these compounds on petroglyphs can only be assessed if changes to the outer rock patina layer (rock or desert varnish) are measured because preservation of the petroglyphs depends on maintaining the integrity of rock varnish. The petroglyphs are formed by mechanical force breaking through the harder rock varnish layer to the softer, lighter coloured weathering rind of the rock (Bednarik 2007). Removal of the rock varnish through chemical erosion will lead to destruction of the petroglyph. Rock varnish is formed under arid conditions, when the rock surface is alkaline, through extraction of clay and primarily manganese and iron minerals, by inorganic and organic processes, from ambient dust particles deposited on the rock (Dorn 2009; Engel and Sharp 1958). The rock varnish is formed at an incredibly slow rate of <1 to 10 µm per 1000 years (Dorn and Meek 1995; Liu and Broecker 2000). The hard manganese and iron compounds in the varnish are dissolved when the rock surface pH falls below seven (Black et al. 2017). Concurrent with acid dissolution of the manganese and iron-rich components, the colour of the varnish is predicted to become lighter, redder and more yellow (Black et al. 2017).
Markley et al. (2015) state there have been no consistent changes in colour of petroglyphs or back-ground rock on Murujuga over the 11 years of mea-surement. However, accuracy of the colour and mineralogy measurements made over these years is highly questionable. The instruments used to measure colour appear to be inappropriate for measuring the colour of heterogeneous rock surfaces in the hot and dusty environment of Murujuga. Furthermore, the instruments used by the scientists do not appear to be measuring colour and colour differences between background rock and petroglyphs that are visible tothe eye in photographs. These discrepancies cast ex-treme doubt onto the reliability of the colour measu-rements made and reported to governments.
Acid emissions on Murujuga are reported at 36 000 tonnes coming from the combined Woodside NLG and Yara Pilbara fertiliser plants in 2014, with similar amounts in previous years (Woodside 2014; Yara 2014). Woodside reported emission into the atmosphere of 20 018 tonnes of NOx in 2014 and Yara Pilbara fertilisers reported the emission of 13 600 tonnes of acid SO2
equivalents during the same year. These industrial emissions have already increased the acidity of rock surfaces on Murujuga. Bednarik (2002: 36) measured natural rain pH on Murujuga to be from 7.0 to 7.2 in the 1960s, while MacLeod (2005) found that the surface pH of rocks from Murujuga had fallen from near neutral (pH 6.8±0.2) during pre-industrial times to highly acid in 2004 with rock surface pH measured as low as 4.2. Evidence showing the dissolution of rock patina in desert environments by surface acid comes from Bednarik (1979), where the patina disappeared under bird droppings with an average pH of 5.9 across 30 sites in an area adjacent to Dampier. Similarly, Engel and Sharp (1958) and Dragovich (1987) showed that rock varnish was not present beneath growing lichen because of accumulated organic acids secreted by the lichen. Acid emissions from industry and shipping are already likely to be dissolving the rock patina and changing its colour, but the experiments conducted and their statistical analyses are so inadequate that no significant changes have been reported. However, electrochemical theory shows an increase in acidity of the surface rock varnish to the extent reported by MacLeod (2005) would dissolve manganese and iron oxides and hydroxides making the varnish thinner, lighter, redder and more yellow in colour (Black et al. 2017). Clearly, properly designed experiments are required to determine the impact of acids and decreased pH on the chemical composition, physical structure and colour of petroglyphs and background rock on Murujuga.
Temperature has a marked effect on colour instrument readings and the effect differs between wavelengths. The influence of direct sunlight on the instrument can be substantial (Analytical Spectral Devices 2002; BYK-Gardner GmBH 2009; Konica Minolta 2013). MacLeod (2005) recorded rock temperature on Murujuga at 54°C and recordings of rock surface temperatures in desert environments can exceed 80°C (Cooke et al. 2006). The maximum operating temperature of the instruments is approximately 40°C (Table 3). Rock surface temperature also alters the actual colour measured (Che et al. 2016). The effect of temperature differs with colour wavelength and generally results in movement towards higher wavelengths (Fig. 9). Consequently there are differential effects on L*, a* and b*, as illustrated for an orange tile, with a* rising as temperature increases while L* and b* fall (Fig. 10). These differential changes in L*, a* and b* have a major effect on calculated colour change (ΔE2000), as shown in Figure 11. However, if temperature is known, the effects of temperature on colour change can be removed (Malkin et al. 1997). Figure 12 shows a plot of apparent changes in metric chroma (ΔC*, a measure of colour change) over time. There appears to be a drift in the results with time. However, when the same data are plotted against ambient temperature (Fig. 13), the cause of the variation is shown to be temperature. Thus, when colour and temperature are measured, it is possible to correct for

Rock Art Research 2017 - Volume 34, Number 2, pp. 130-148. J. L. BLACK, I. BOX and S. DIFFEY144variation in temperature. However, neither ambient temperature nor temperature of the rock surface were measured in the studies described by Markley et al. (2015).
The proposed acid emissions assessment criteria from the Technical Ammonium Nitrate Production Facility are 200 meq/m2/year, based on the report by Gillett (2008). However, evidence presented at the recent Senate Inquiry (Kuylenstierna 2017) showed that the Gillett (2008) recommendation was based on a complete misuse of the Cinderby et al. (1998) report. The Senate Inquiry asked for the recommendation, that the rock art environment of Burrup Peninsula has a critical acid load of 200 meq/m2/year, to be removed from the Gillett (2008) report. An appropriate critical acid load for preservation of rock art on Murujuga would appear to be less than 25 meq/m2/year.
Evidence from electrochemical principles (Black et al. 2017) and empirical observations (Bednarik 2007) show acidity below neutral dissolves manganese and iron compounds from the rock patina. The acidity of rock surfaces on Murujuga pre-industrialisation was around neutral (pH 7; Bednarik 2002: 36) and is already down in the strongly acid pH range of four to five (Bednarik 2007: 227–8; MacLeod 2005). The value of <25 meq/m2/year can also be derived from comparisons of critical loads for other parent rock types and ecosystems. The rocks on Murujuga are igneous and formed under great pressure to make them extremely hard. Pillans and Fifield (2013) showed these rocks to be among the slowest eroding rocks anywhere in the world. Consequently, little soil is formed where petroglyphs occur. Erosion rate of parent rocks is strongly related to buffering capacity (Ifo 2012: 196).
Important evidence for setting critical acid loads can be obtained from studies in other parts of the world (Nilsson and Grennfelt
1988). Figure 14 shows the impact of parent rock on the critical loads of nitrogen and sulphur for forests in Europe. The slower degrading granite rock has lower buffering capacity and therefore lower critical loads than the faster degrading limestone. The lower extremes of the bars in Figure 14 represent unmanaged forests. The critical nitrogen load for undisturbed European forests growing on granitic soil was from 3–5 kg/ha/year (15 to 25 meq/m2/year) depending on the sulphur load. Since the rocks on Murujuga are extremely slow degrading and do not produce soils sufficient to
Figure 9. Reflectance curves of green, yellow, orange, and red-coloured tiles at temperatures from about 10 to 50ºC. The black arrows indicate the significant shift in the colour measurements with increasing temperature. Source: Che et al. (2016: 146, Fig. 3).
Figure 10. Differential effect of increasing instrument temperature on L*, a* and b* calculated from spectrometer wavelength data. Source: Che et al. (2016: 151, Fig. 18).
Figure 11. Effect of temperature on colour change (CIE ΔE2000) when calculated from spectrophotometer data. Source: Che et al. (2016: 148, Fig. 11).

145Rock Art Research 2017 - Volume 34, Number 2, pp. 130-148. J. L. BLACK, I. BOX and S. DIFFEY
maintain substantial plant growth, the critical loads would be expected to be below the bar for granite in the graph.
There appear to be a large number of inconsistencies in the experimental procedures used to measure colour and mineralogy changes at rock art sites on Murujuga. However, the direct impact of each inconsistency on variance in measured values cannot be determined without access to the instrument-derived data and knowledge about the impact of each change on measured values. A major failing in all the research conducted has been failure to effectively design experiments, include a suitable number of replicates and statistically analyse the results before making interpretations.
ConclusionsThe reports primarily used by governments and
industry to justify additional industry on Murujuga (‘Burrup Peninsula’) and levels of emission (Gillett 2008; Lau et al. 2007; Markley et al. 2015) and others in the series (Lau et al. 2013; Lau et al. 2008; Lau et al. 2010; Lau et al. 2009; Lau et al. 2011; Lau et al. 2012; Markley et al. 2014) are of poor quality and contain numerous errors in design, methodology, analysis and interpretation. Conclusions about the critical acid load for rock art on Murujuga are based on a misinterpretation of previously published research. The impacts of environmental conditions on measured values were not determined. The errors are so great that most of the results in the reports are worthless. The Western Australian Government remains in a state of knowledge deficit as if no study on colour change and mineralogy has been conducted, despite the large amount of time and money spent. No sound decisions about the effects of industry on the rock art on Murujuga can be made using the reports. This conclusion has political implications for governments because decisions allowing further industrialisation of Murujuga have been made on the assumption that the reports correctly state there has been no change to rock art sites over time and current and proposed concentrations of emissions are unlikely to damage the rock art. These decisions need now to be reconsidered, particularly in relation to The precautionary principle and The principle of intergenerational equity of the Western Australian Environmental Protection Act — 1986; Section 4A.
AcknowledgmentsWe thank Dr Ken Mulvaney for valuable information
about petroglyphs on Murujuga and industrialisation of the region. We thank the Editor of RAR for informing us on the use of Murujuga as the correct name for the island also known as Burrup Peninsula. We acknowledge the Australian Aboriginal and Torres Strait Islander peoples of our nation. We acknowledge the traditional custodians, Ngarluma,Yinjibarndi, Yaburara, Mardudhunera and Wong-Goo-Tt-Oo, of the Aboriginal land, Murujuga, about which we have written. We pay our respects to ancestors and Elders,
Figure 12. Change in colour (as ΔC*) over time. Source: Malkin et al. (1997: 93, Fig. 2).
Figure 14. Nitrogen and sulphur critical loads for European forests growing on soils formed from different base rock types. Source: Nilsson and Grennfelt (1988: 20, Fig. 1)
Figure 13. Change in colour (as ΔC*) with temperature. Source: Malkin et al. (1997: 94, Fig. 3).
past and present. We are committed to honouring Australian Aboriginal and Torres Strait Islander peoples’ unique cultural and spiritual relationships to the land, waters and seas and their rich contribution to society by ensuring that, to the best of our abilities, our work is accurate and sound.

Rock Art Research 2017 - Volume 34, Number 2, pp. 130-148. J. L. BLACK, I. BOX and S. DIFFEY146Prof. John L. BlackJohn L Black ConsultingP.O. Box 4021Warrimoo, NSW [email protected]
Dr Ilona BoxIlona Box Consulting58 Terrymont RdWarrimoo, NSW [email protected]
Dr Simon DiffeyCentre for Bioinformatics and BiometricsUniversity of WollongongWollongong, NSW [email protected]
REFERENCES
Analytical Spectral Devices 2002. FieldSpec(R) Pro user’s guide, unpublished, Analytical Spectral Devices, Inc., viewed 2 December 2016, http://support.asdi.com/Document/FileGet.aspx?f=600000.PDF.
ASTM International 2001. Standard practice for computing the colors of objects by using the CIE system, Vol. E308, ASTM International, West Conshohocken, PA, USA, viewed 8 December 2016, https://www.researchgate.net/file.PostFileLoader.html?id= 57b5d0e4615e2748f06bd1f8& assetKey=AS% 3A396453483696133% 401471533284636.
Bednarik, R. G. 1979. The potential of rock patination analysis in Australian archeology — part 1. The Artefact 4: 14–38.
Bednarik, R. G. 2002. The survival of the Murujuga (Burrup) petroglyphs. Rock Art Research 19(1): 29–40.
Bednarik, R. G. 2004. A recipe for failure. AURA Newsletter 21(1): 8–9.
Bednarik, R. G. 2006. Australian apocalypse: the story of Australia’s greatest cultural monument. Occasional AURA Publication 14, Australian Rock Art Research Association Inc., Melbourne.
Bednarik, R. G. 2007. The science of Dampier rock art — part 1. Rock Art Research 24(2): 209–246.
Bednarik, R. G. 2009. Experimental colorimetric analysis of petroglyphs. Rock Art Research 26(1): 55–64.
Bednarik, R. G. n.d. The killing fields of Murujuga. Viewed 1 February 2016, www.dampierrockart.net/Robert%20Bednarik%20massacre.pdf.
Bird, C. and S. J. Hallam 2006. A review of archaeology and rock art in the Dampier Archipelago. Unpubl. report prepared for the National Trust of Australia (WA).
Black, J., S. Diffey and S. Nielsen 2016. Perspective: are animal scientists forgetting the scientific method and the essential role of statistics? Animal Production Science 57(1): 16–19.
Black, J. L., I. D. MacLeod and B. W. Smith 2017. Theoretical effects of industrial emissions on colour change at rock art sites on Burrup Peninsula, Western Australia. Journal of Archaeological Science: Reports 12: 457–462.
Brewster, R., C. Crosetto, T. Jackson, M. Kelsey, B. Ortiz, C. Taylor, C. Trevino and L. Walker 2017. Paint.NET. version 4.0.13, dotPDN LLC, accessed 6 March 2017, http://www.getpaint.net/index.html.
BYK-Gardner GmBH 2009. Spectro-guide 45/0 gloss, spectro-guide sphere gloss, manual, unpublished, BYK Additives & Instruments.
Che, J., R. Li and M. Senanayake 2016. A comparative study of the dependency of colour measurement on surface temperature. Coloration Technology 132(2): 144–152.
Cinderby, S., H. Cambridge, R. Herrera, W. Hicks, J. Kuylenstierna, F. Murray and K. Olbrich 1998. Global assessment of terrestrial ecosystem sensitivity to acidic deposition. Stockholm Environment Institute.
Cooke, R. U., A. Warren and A. S. Goudie 2006. Desert geomorphology. CRC Press, London.
CSIRO Land and Water n.d. Australian Soil Resource Information System: ASRIS — Maps: Australian soil classification, CSIRO, viewed 28 February 2017, http://www.asris.csiro.au/mapping/viewer.htm.
Davidson, R. 2011. Into the beehive: the destruction of Burrup rock art. The Monthly, February 2011, https://www.themonthly.com.au/issue/2011/february/1316556127/robyn-davidson/beehive.
DEE, Department of Environment and Energy, n.d. National heritage places — Dampier Archipelago (including Burrup Peninsula), Australian Government, viewed 28 February 2017, https://www.environment.gov.au/heritage/places/national/dampier-archipelago.
Donaldson, M. 2009. Burrup rock art: ancient Aboriginal rock art of Burrup Peninsula and Dampier Archipelago Western Australia. Wildrocks Publications, Mt Lawley.
Dorn, R. I. 2009. Desert rock coatings. In A. J. Parsons and A. D. Abrahams (eds), Geomorphology of desert environments, pp. 153–186. Springer Netherlands, Dordrecht.
Dorn, R. I. and N. Meek 1995. Rapid formation of rock varnish and other rock coatings on slag deposits near Fontana, California. Earth Surface Processes and Landforms 20(6): 547–560.
Dragovich, D. 1987. Weathering of desert varnish by lichens. Readings in Australian Geography. Proceedings of the 21st IAG Conference, Perth, pp. 407–412. Institute of Australian Geographers, Perth, Western Australia.
Engel, C. G. and R. P. Sharp 1958. Chemical data on desert varnish. Geological Society of America Bulletin 69(5): 487–518.
EPA, Environmental Protection Authority 2011. Technical ammonium nitrate production facility, Burrup Peninsula: Burrup Nitrates Pty Ltd. Report and recommendations of the Environmental Protection Authority, Environmental Protection Authority, Perth, Western Australia.
ERM, Environmental Resources Management Australia 2012. Burrup Nitrates Pty Ltd: Burrup Peninsula technical ammonium nitrate production facility air quality assess-ment update, Environmental Resources Management Australia, Docklands, Victoria.
ERM, Environmental Resources Management Australia 2013. Burrup Technical Ammonium Nitrate Production Facility: Air quality management plan. Burrup Nitrates Pty Ltd Environmental Resources Management Australia, Docklands, Victoria.
Gara, T. 1983. The Flying Foam massacre: an incident on the northwest frontier, Western Australia. Paper presented to the Archaeology at ANZAAS 1983, 53rd ANZAAS Congress, Perth, Western Australia.
Gillett, R. 2008. Burrup Peninsula air pollution study: report for 2004/2005 and 2007/2008. Department of Environment and Conservation, Western Australia.
Gliner, J. A., G. A. Morgan and N. L. Leech 2017. Research methods in applied settings: an integrated approach to design and analysis. Routledge, New York.

147Rock Art Research 2017 - Volume 34, Number 2, pp. 130-148. J. L. BLACK, I. BOX and S. DIFFEY
González Zarandona, J. A. 2011. The destruction of heritage: rock art in the Burrup Peninsula. International Journal of the Humanities 9(1): 325–341.
Habekost, M. 2013. Which color differencing equation should be used. International Circular of Graphic Education and Research 6: 2033.
Hunt, R. W. G. and M. R. Pointer 2011. Measuring colour. John Wiley & Sons Ltd, Chichester, UK.
Hunter, R. S. and R. W. Harold 1987. The measurement of appearance. John Wiley & Sons, New York.
Ifo, Institut für Wirtshaftforschung (Institute for Economic Research) 2012. German case study. In A. Markandya and M. Pavan (eds), Green accounting in Europe: four case studies, Vol. 11, pp. 175–228. Kluwer Academic Publishers, Dordrecht, The Netherlands and Boston, Mass.
Irotek 2017. EasyRGB: colour calculator, IRO Group Limited, http://www.easyrgb.com/index.php?X=CALC.
JMcD CHM, Jo McDonald Cultural Heritage Management Pty Ltd 2011. Study of the outstanding universal values of the Dampier Archipelago site, Western Australia. Unpubl. report to the Australian Heritage Council, Canberra.
Kandi, S. G. 2011. The effect of spectrophotometer geometry on the measured colors for textile samples with different textures. The Journal of Engineered Fibers and Fabrics 6: 70–78.
Konica Minolta 2013. Spectrophotometer CM-700d/600d [English] instruction manual. In Konica Minolta, Inc. (ed.), http://www.konicaminolta.com/instruments/download/instruction_manual/color/pdf/cm-700d_instruction_eng.pdf, vol. 9222-A0E8-26.
Krzywinski, M. 2017a. Image color summarizer, version 0.76, accessed 5 March 2017, http://mkweb.bcgsc.ca/color-summarizer/?analyze.
Krzywinski, M. 2017b. Why 7056?, pers. email comm. I. Box, 5–6 March 2017.
Kuylenstierna, J. 2017. Expert advice to the Environment and Communications references committee inquiry into the protection of Aboriginal rock art of the Burrup Peninsula, viewed 26 February 2017, http://www.aph.gov.au/Parliamentary_Business/Committees/Senate/Environment_and_Communications/BurrupPeninsula/Submissions.
Lakacha, A. 2015. 7 considerations in aperture size for print measurement, Techkon, http://www.techkonusa.com/7-considerations-in-aperture-size-for-print-measurement/.
Lau, D., E. Ramanaidou, L. Fonteneau and T. Markley 2013. Burrup Peninsula Aboriginal petroglyphs: colour change & spectral mineralogy 2004-2012, No. EP138017, CSIRO, viewed 15 January 2017, https://www.der.wa.gov.au/images/documents/our-work/programs/Burrup-Peninsula-Aboriginal-petroglyphs-report-2004-2012.pdf.
Lau, D., E. Ramanaidou, S. Furman, I. Cole and T. Hughes 2005. Field studies of rock art appearance: interim report 1. Draft for external review, No. CMIT(C)-2005-228, CSIRO Manufacturing and Infrastructure Technology, viewed 13 January 2017, http://web.archive.org/web/20060823164912/http://www.doir.wa.gov.au/documents/investment/DRAFT_reports_rev_screen.pdf.
Lau, D., E. Ramanaidou, S. Furman, I. Cole, T. Hughes and P. Hoobin 2007. Field studies of rock art appearance, final report: fumigation & dust deposition, Progress report: colour change & spectral mineralogy, CSIRO Manufacturing and Materials Technology, viewed 9 January 2017, http://web.archive.org/web/20091002111652/http:/www.dsd.wa.gov.au/documents/BI_BurrupRockArtCSIROFieldStudies.pdf.
Lau, D., E. Ramanaidou, S. Furman, A. Hacket, M. Caccetta, M. Wells and B. McDonald 2008. Burrup Peninsula
Aboriginal petroglyphs: colour change and spectral mineralogy 2004–2007, CSIRO, viewed 15 January 2017, https://www.der.wa.gov.au/images/documents/our-work/programs/Colour_Change_and_Spectral_Mineralogy_2007_report_Sept2008.pdf.
Lau, D., E. Ramanaidou, A. Hacket, M. Caccetta and S. Furman 2010. Burrup Peninsula Aboriginal petroglyphs: colour change & spectral mineralogy 2004–2009, restricted report No. P2010/408 CMSE(C)-2010-059, CSIRO, viewed 15 January 2017, https://www.der.wa.gov.au/images/documents/our-work/programs/Burrup-Aboriginal-Petroglyphs-2004-2009.pdf.
Lau, D., E. Ramanaidou, A. Hacket, S. Corbel and S. Furman 2009. Burrup Peninsula Aboriginal petroglyphs 2004–8 colour change & spectral mineralogy, No. CMSE-2009-205, P2009/301 CSIRO, viewed 15 January 2017, http://web.archive.org/web/20090917094334/http://www.dsd.wa.gov.au/documents/2004-08_CSIRO_ColourChange__SMineralogy_Report.pdf.
Lau, D., E. Ramanaidou, A. Hacket and S. Furman 2011. Burrup Peninsula Aboriginal petroglyphs: colour change & spectral mineralogy 2004–2010, restricted report No. P2011, CSIRO, viewed 15 January 2017, https://www.der.wa.gov.au/images/documents/our-work/programs/Burrup-Peninsula-Aboriginal-Petroglyphs-2004-2010.pdf.
Lau, D., E. Ramanaidou, S. Morin Ka and S. Furman 2012. Burrup Peninsula Aboriginal petroglyphs: colour and spectra change 2004–2011, No. EP123469, CSIRO, viewed 15 January 2017, https://www.der.wa.gov.au/images/documents/our-work/programs/Burrup-Aboriginal-Petroglyphs-2004-2011.pdf.
Liu, T. and W. S. Broecker 2000. How fast does rock varnish grow? Geology 28(2): 183–186.
Loncar, S. 2017. Colorizer — color picker and converter (RGB HSL HSB/HSV CMYK HEX LAB), viewed 3 March 2017, http://colorizer.org/.
MacLeod, I. 2005. Effects of moisture, micronutrient supplies and microbiological activity on the surface pH of rocks in the Burrup Peninsula. Triennial meeting (14th), The Hague, 12–16 September 2005: preprints, James & James, pp. 386–393.
Malkin, F., J. A. Larkin, J. F. Verrill and R. H. Wardman 1997. The BCRA–NPL ceramic colour standards, Series II — Master spectral reflectance and thermochromism data. Journal of the Society of Dyers and Colourists 113(3): 84–94.
Markley, T., L. Fonteneau, E. Ramanaidou, D. Lau and D. Alexander 2014. Burrup Peninsula Aboriginal petroglyphs: colour change & spectral mineralogy 2004–2013, No. EP143145, CSIRO, viewed 15 January 2017, https://www.der.wa.gov.au/images/documents/our-work/programs/Burrup-Penninsula-Aboriginal-Petroglyphs-Report-2004-2013.pdf.
Markley, T., M. Wells, E. Ramanaidou, D. Lau and D. Alexander 2015. Burrup Peninsula Aboriginal petro-glyphs: colour change & spectral mineralogy 2004–2014, No. EP1410003, CSIRO, viewed 15 January 2017, https://www.der.wa.gov.au/images/documents/our-work/programs/Burrup-Penninsula-Aboriginal-Petroglyphs-Report-2004-2014.pdf.
McDonald, J. and P. Veth 2009. Dampier Archipelago petroglyphs: archaeology, scientific values and National Heritage listing. Archaeology in Oceania 44(S1): 49–69.
Microsoft 2007. PowerPoint. version 12.0.6755.5000 SP3 MSO (12.0.6762.5000), Microsoft Office.
Mulvaney, K. 2009. Dating the Dreaming: extinct fauna in the petroglyphs of the Pilbara region, Western Australia.

Rock Art Research 2017 - Volume 34, Number 2, pp. 130-148. J. L. BLACK, I. BOX and S. DIFFEY148Archaeology in Oceania 44(S1): 40–48.
Mulvaney, K. 2011. About time: toward a sequencing of the Dampier Archipelago petroglyphs of the Pilbara region, Western Australia. Records of the Western Australian Museum, Supplement 79 [‘Fire and hearth’ forty years on: essays in honour of Sylvia J. Hallam. Bird, Caroline and Webb, R. Esmee (eds).]: 30–49.
Mulvaney, K. 2013. Burrup and beyond: a short guide to the area’s cultural heritage and history. Rio Tinto Mining Company of Australia, Perth, Western Australia.
Mulvaney, K. 2015. Murujuga Marni: rock art of the macropod hunters and mollusc harvesters. UWA Press, Perth.
Nilsson, J. and P. Grennfelt 1988. Critical loads for sulphur and nitrogen: report from a workshop held at Skokloster, Sweden. Critical loads for sulphur and nitrogen, Vol. Miljørapport 1988: 15, eds J. Nilsson & P. Grennfelt, UN-ECE, Nordic Council of Ministers, Skokloster, Sweden.
O’Hara, G. 2008. Monitoring of microbial diversity on rock surfaces of the Burrup Peninsula. Monitoring of microbial diversity on rock surfaces of the Burrup Peninsula, viewed 16 March 2017, https://web.archive.org/web/20091002135201/http:/www.dsd.wa.gov.au/documents/Microbial_Diversity_on_Rock_Surfaces_-_Sept2008(1).doc.
Parliament of Australia website 2016. Protection of Aboriginal rock art of the Burrup Peninsula. Senate Environment and Communications References Committee, Parliament of Australia, viewed 1 March 2017, http://www.aph.gov.au/Parliamentary_Business/Committees/Senate/Environment_and_Communications/BurrupPeninsula.
Patton, M. Q. 2002. Qualitative research and evaluation methods, 3rd edn. Sage Publications, Thousand Oaks, CA, USA.
Pillans, B. and L. K. Fifield 2013 Erosion rates and weathering history of rock surfaces associated with Aboriginal rock art engravings (petroglyphs) on Burrup Peninsula, Western Australia, from cosmogenic nuclide measurements. Quaternary Science Reviews 69: 98–106.
Ramanaidou, E. 2016. RE: ASD conversions, pers. comm. J. L. Black, 19 December 2016.
Ridpath, I. 2012. Chromatic aberration. In A dictionary of astronomy, Oxford University Press, viewed 15 March 2017, www.oxfordreference.com/10.1093/acref/978019960 9055.001.0001/acref-9780199609055-e-681.
Sinclair Knight Merz 2009. Burrup Rock Art Monitoring Program — summary of study reports: a report to the Burrup Rock Art Monitoring Management Committee, No. WV03739-MV-RP-0003, Sinclair Knight Merz Pty Ltd, Perth WA Australia, viewed 5 January 2017, https://web.archive.org/web/20091002135431/http:/www.dsd.wa.gov.au/documents/Final_Scientific_Summary_Report_-_February_2009.pdf.
Summaries of proposed rock art monitoring studies 2004. BRAMMC, Burrup Rock Art Monitoring Management Committee; Western Australian Government, Department of Industry and Resources, viewed 16 January 2017, http://web.archive.org/web/20070901002710/http://www.doir.wa.gov.au/documents/investment/Summaries_Proposed_Rock_Art.pdf.
Vidal, J. 2009. Health risks of shipping pollution have been ‘underestimated’. The Guardian (Environment, Travel and Transport), 10 April 2009, viewed 31 January 2016, https://www.theguardian.com/environment/2009/apr/09/shipping-pollution.
Woodside 2014. 2014 Sustainability report, Woodside, viewed 8 March 2017, http://www.woodside.com.au/Work ing-Sustainably/Documents/2014%20Sustainable%20Develop ment%20Report.pdf.
Yara 2014. Environmental indicator points. Yara International, Yara International, http://yara.com/sustainability/reporting/impact_reporting_archive/2014/gri_reporting/environmental_performance/environmental_indicator_points/.
RAR 34-1230
A Special Issue of the open access journal Arts is dedicated to ‘World rock art’ and edited by R. G. Bednarik. It can be accessed at
http://www.mdpi.com/journal/arts/special_issues/world_rock_art
Currently there are thirty-seven articles about the world’s palaeoart in this Special Issue and submissions continue to be accepted free of publishing fees.
A new Special Issue of the open access journal Humanities is dedicated to ‘Re-assessing human origins’ and edited by R. G. Bednarik. It can be accessed at
http://www.mdpi.com/journal/humanities/special_issues/re-assessing_human_origins
Submissions for this Special Issue are invited now.