inas hemts: the path to thz electronics?
TRANSCRIPT

InAs HEMTs: the path to THz electronics?
J. A. del AlamoMicrosystems Technology Laboratories, MIT
Short Course on: High-Performance narrow-bandgap HEMT technology for advanced microwave front-ends: Towards the end of the roadmap?
Acknowledgements: Dae-Hyun Kim, Tae-Woo Kim, Niamh WaldronSponsors: FCRP-MSD, Intel Corp., SRCLabs at MIT: MTL, SEBL, NSL

III-V HEMT: record fT vs. time
2
Current record:ft=660 GHzLeuther IPRM 2011 (Fraunhofer Inst.)
(and MHEMT)
For >20 years, record fT obtained on InGaAs-channel HEMTs

III-V HEMT: record fT vs. time
3
Well balanced devices:ft=644 GHz, fmax=680 GHz at same bias pointKim EDL 2010(MIT)
(and MHEMT)
InGaAs-channel HEMTs offer record balanced fT and fmax

Record fT III-V HEMTs: megatrends
4
Over time: Lg↓, InxGa1-xAs channel xInAs↑
InP lattice constant
GaAs latt. const.

Record fT III-V HEMTs: megatrends
5
Over time: tch↓, tins↓
Quantum-well channel
Bulkchannel

6
Outline
1. Example of high-frequency InAs HEMT2. fT measurements3. fT analysis4. How to improve fT5. Limits to HEMT scaling and future prospects

S D
Etch stopper
Barrier
Channel
Buffer
tins
Oxide
tch
Gate
Cap
77
1. Example of high-frequency InAs HEMT
77
- QW channel (tch = 10 nm):• InAs core (tInAs = 5 nm)• InGaAs cladding
n,Hall = 13,200 cm2/V-sec- InAlAs barrier (tins = 4 nm)- Ti/Pt/Au Schottky gate- Lg=30 nm- Lside=150 nmKim, EDL 2010
Lg=30 nm InAs HEMT

-0.6 -0.4 -0.2 0.0 0.20.0
0.5
1.0
1.5
2.0
g m [m
S/m
]VGS [V]
VDS = 0.5 V
88
Lg=30 nm InAs HEMT
8
• Large current drive: ION>0.5 mA/µm at VDD=0.5 V• VT = -0.15 V, RS=190 Ohm.μm• High transconductance: gmpk= 1.9 mS/μm at VDD=0.5 V
8
Kim, EDL 2010
0.0 0.2 0.4 0.6 0.80.0
0.2
0.4
0.6
0.8
0.2 V
0.4 V
0 V
I D [m
A/
m]
VDS [V]
VGS =

109 1010 1011 10120
10
20
30
40
Frequency [Hz]
Gai
ns [d
B]
-1
0
1
2
3
K
H21
K
MSG/MAG
Ug
Lg=30 nm InAs HEMT
999
• Only transistor of any kind with both fT and fmax > 640 GHz at same bias point
• Subthreshold characteristics: – S = 74 mV/dec, DIBL = 80 mV/V, Ion/Ioff ~ 5x10³
9
Kim, EDL 2010
-1.0 -0.8 -0.6 -0.4 -0.2 0.0 0.2 0.410-9
10-8
10-7
10-6
10-5
10-4
10-3
VDS = 0.05 V
VDS = 0.5 V
IG
ID
VDS = 0.5 V
I D, I
G [A
/m
]
VGS [V]
VDS = 0.05 VfT=644 GHzfmax=686 GHz
VDS=0.5 V, VGS=0.2 V

2. fT measurements
10101010
• Extraordinary claims demand extraordinary evidence!
• Verification of fT and fmax measurements:1. Gummel technique
2. Small-signal equivalent circuit model
3. Measurements on multiple devices
4. Measurements on multiple test benches

Gummel technique for fT extraction
11111111
In one-pole system:
Then:
Slope gives fT
Gummel, Proc IEEE 1969Kim, EDL 2008
Lg=30 nmInAs HEMT

109 1010 1011 10120
10
20
30
40
Frequency [Hz]
Gai
ns [d
B]
-1
0
1
2
3
K
H21
K
MSG/MAG
Ug
fT extraction from equivalent-circuit model
12
Small-signal equivalent circuit model in linear and saturation regimes at VGS of peak fT: Kim, EDL 2010
109 1010 1011 10120
10
20
30
40
Frequency [Hz]
Gai
ns [d
B]
-1
0
1
2
3
K
MSG/MAG
Ug
K
H21
VGS=0.2 V, VDS=0.5 VVGS=0.2 V, VDS=0.1 V
fT=644 GHzfmax=686 GHz
Extrapolation from small-signal model yields: fT=648 GHz fmax=686 GHz
Also model S parameters (see below)

Measurements on multiple devices and systems
13131313
Measurements of one device in three different test benches:
Measurement of three devices on one test bench:
fT=645, 644, 644 GHz.
All measurements at same bias point: VGS=0.2 V, VDS=0.5 V
8510C@MIT
8510C@TSC
PNA@UCSB Avg. STD
fT [GHz]
From H21 645 645 643 644.3 0.9
From Gummel’s
approach644 644 645 644.3 0.5
fmax [GHz] 681 686 677 681.3 3.7
Kim, EDL 2010

14
3. ft analysis
• First-order fT expression for HEMT:
14
gmivgs
goi
RDRS
Cgs Cgd
S D
G

15
Break out parasitic capacitances
• Capacitance components:
15
S
G
D

16
Delay time analysis
• Delay time:
• Components of delay time:
16
Intrinsic delay (transit time)
Extrinsic delay Parasitic
delay

Extraction of parasitic capacitances
17
• Need devices with different Lg• Bias them at same VGS overdrive around peak fT point• Extract small-signal equivalent circuit models• Study Lg scaling behavior of Cgs and Cgd
0 50 100 150 200 2500
500
1000
1500
2000
Cgdext = 112 fF/mm
Cgsext = 255 fF/mm
Cgdi = 0.27 fF/um2
Cgs
& C
gd [f
F/m
m]
Lg [nm]
Cgsi = 5.87 fF/um2
VDS = 0.5 V
Cgsi/Lg=5.87 fF/m2
Cgdi/Lg=0.27 fF/m2
Cgsext=255 fF/mm
Cgdext=112 fF/mmInAs HEMTs
(ft=601 GHz, fmax=609 GHz at Lg=30 nm)
Kim, IEDM 2008

18
Delay components of Lg=30 nm InAs HEMT
18
Delay time from ft: ~265 fs• Intrinsic delay: ~59 fs• Extrinsic delay: ~117 fs• Parasitic delay: ~80 fs• Unaccounted: ~9 fs
least significant, yields ve=5.1x107 cm/s
30 %
4 %
22 %
44 %unaccounted
Lg = 30 nm
t
ext par
InAs HEMTs
(ft=601 GHz, fmax=609 GHz at Lg=30 nm)
Kim, IEDM 2008
most significant

19
Scaling of delay components
19
ext and par do not scale, become dominant for Lg< 60 nm
0 100 200 3000
400
800
1200
par
ext
Del
ays
[fs]
Lg [nm]
t
InAs HEMTs
(ft=601 GHz, fmax=609 GHz at Lg=30 nm)
Kim, IEDM 2008

• Intrinsic delay:
Lg ↓ (without degrading gmi) ve ↑ channel engineering
• Extrinsic delay:
Cgsext, Cgdext ↓ gate engineering gmi ↑ harmonious scaling
20
4. How to improve fT
20

21
How to improve fT
21
• Parasitic delay:
RS+RD ↓ increase electrostatic integrity: goi/gmi↓

22
How far can we expect to go?
22
ft=1 THz feasible even at Lg=30 nm
10 100
200G
400G
600G
800G1T
f T [H
z]
Lg [nm]
Modeled iedm 08 + 50% Reduction in Rs and Rd
+ 50% Reduction in Cgext
VDS = 0.5 V

1m
RS ~ 200 Ohm.m
a) RS+RD↓
23
• In typical HEMTs: – large G-S, G-D gaps– barrier in extrinsic region– limited electron concentration in extrinsic channel
Kim, IEDM 2010
0 10 20 30 40 50 60-0.4
-0.3
-0.2
-0.1
0.0
0.1
0.2
0.3
0.4
0.5
Electron density [cm-3]
CB
Pro
file
[eV]
Vertical depth [nm]
Single delta doping
Zero bias
0
2
4
ns = 3 x 10¹² /cm2
EC and n incross section
x 1018

1 10 100 10000
20
40
60
K
H21
, MA
G/M
SG a
nd U
g [dB
]Frequency [GHz]
VGS = 0.1 V, VDS = 0.7 VL
g = 40 nm
0.0
0.2
0.4
0.6
0.8
1.0
fmax = 445 GHz
MAG/MSG
UG
H21
K
fT = 530 GHz
Approaches to reducing barrier and ns,ext ↑
• InAs-rich InAlAs sub-barrier:
Kim, Electron Lett 2011 24
0 20 40 60-0.4
-0.3
-0.2
-0.1
0.0
0.1
0.2
0.3
0.4
0.5
Elec
tron
Den
sity
[eV]
CB
Pro
file
[eV]
Depth [nm]
Normal HEMT InAs-rich spacer HEMT
X 1018/cm3
0
2
4
6
ns = 2.9 x 10¹² / cm2ns = 3 x 10¹² / cm2
Lg=40 nm In0.7Ga0.3As HEMT:Rs ~ 170 Ohm.mfT=530 GHz at VDS=0.7 V

25
Approaches to reducing barrier and ns,ext ↑
• Dual delta-doping in barrier:
Kim, IEDM 2010
0 10 20 30 40 50 60-0.4
-0.3
-0.2
-0.1
0.0
0.1
0.2
0.3
0.4
0.5
Electron density [cm-3]
CB
Pro
file
[eV]
Vertical depth [nm]
Dual delta doping
Zero bias
0
2
4
ns = 3.8 x 10¹² /cm2
0 10 20 30 40 50 60-0.4
-0.3
-0.2
-0.1
0.0
0.1
0.2
0.3
0.4
0.5
Electron density [cm-3]
CB
Pro
file
[eV]
Vertical depth [nm]
Single delta doping
Zero bias
0
2
4
ns = 3 x 10¹² /cm2
x 1018 x 1018

0.0 0.1 0.2 0.3 0.4 0.5 0.6 0.70.0
0.2
0.4
0.6
0.8
1.0
0 V
0.1 V
0.2 V
0.3 V
0.4 V
I D [m
A/
m]
VDS [V]
VGS = 0.5 V
Approaches to reducing LGS and LGD
Self-aligned process:
26
• Heterostructure with dual delta doping in InAlAs• Dry-etched Mo contacts: Rc = 7 Ohm.μm, stable to 600 ◦C • LG=50 nm, RS=144 Ohm.μm, gm=2.2 mS/μm @ VDS=0.5 V
LGS=100 nm
Kim, IEDM 2010
Lg=50 nm

1 10 100 10000
20
40
K
MAG/MSG
Ug
Measured data Modeled data
H21
, MA
G/M
SG a
nd U
g [dB
]
Frequency [GHz]
K
VGS = 0.2 V, VDS = 0.6 VH21
0
1
2
3
4
freq (500.0MHz to 700.0GHz)
S(1
,1)
S(3
,3)
S(2
,2)
S(4
,4)
S(2
,1)/1
0S
(4,3
)/10
S(1
,2)
S(3
,4)
Lg=60 nm self-aligned In0.7Ga0.3As HEMT
27
• Good agreement between modeled and measured HF characteristics• Highest fT and fmax at Lg 60 nm of any FET
Kim, IEDM 2010
Lg=60 nm
VGS = 0.2 V, VDS = 0.6 V Wg = 2 x 20 μm
S21/10
S12
S22
S11
fT=595 GHzfmax=680 GHz

28
b) Increase electrostatic integrity: goi/gmi↓
28
Sources of output conductance in InAs HEMTs: – impact ionization: slow irrelevant at RF– drain-induced barrier lowering (DIBL)
Kim, IPRM 2009
VGS of peak fT
impact ionization
DIBL

29
Drain-Induced Barrier Lowering (DIBL)
29
• Negative shift of VT with VDS
• Due to reduction in channel barrier as VDS ↑
• DIBL Figure of Merit:
-1.0 -0.8 -0.6 -0.4 -0.2 0.0 0.2 0.410-9
10-8
10-7
10-6
10-5
10-4
10-3
VDS = 0.05 V
VDS = 0.5 V
IG
ID
VDS = 0.5 V
I D, I
G [A
/m
]
VGS [V]
VDS = 0.05 V
DIBL = 80 mV/V
30 nm InAs HEMTKim, EDL 2010
Efe
EC
EC

30
Drain-Induced Barrier Lowering (DIBL)
30
Factors affecting DIBL:– Gate length: Lg
– Channel thickness: tch
– Barrier thickness: tins
– Side etch length: Lside
40 80 120 160 20040
80
120
160
InAs HEMTs: tch = 5 nm
InAs HEMTs: tch = 10 nm
DIB
L [m
V/V]
Lg [nm]
In0.7Ga0.3As HEMTs: tch = 13 nm
Kim, ISDRS 2007
Kim, TED 2008Kim, IPRM 2010
0 100 200 300 4000
200
400
600 Lside = 50 nm Lside = 150 nm Lside = 350 nm
DIB
L [m
V/V]
Lg [nm]

31
The role of Lside in fT
31
As Lside ↑ goi ↓ par ↓Cgsext, Cgd ext ↓ ext ↓RS, RD ↑ par ↑ Kim, JSTS 2006
Lg=60 nmSuemitsu, TED 2002
There is an optimum Lside which depends on rest of device design

32
The role of tins in fT
32
fT tends to improve as tins ↓Kim, TED 2008
Lg=60 nm
As tins ↓ goi ↓ par ↓ gmi ↑ par ↓, ext ↓RS, RD ↑ par ↑
InAs HEMT Lg=30 nm
Kim, IEDM 2008

33
The role of tch in fT
33
As tch ↓ goi ↓ par ↓ gmi ↑ par ↓, ext ↓RS, RD ↑ par ↑
40 60 80 100 120 140300
400
500
600
300
400
500
600
fmax
In0.7Ga0.3As PHEMTsf T,
f max
[GH
z]
Lg [nm]
InAs PHEMTs
VDS = 0.5 V
fT
tch=10 nm
tch=13 nm
Kim, IPRM 2009
fT tends to improve as tch ↓
34
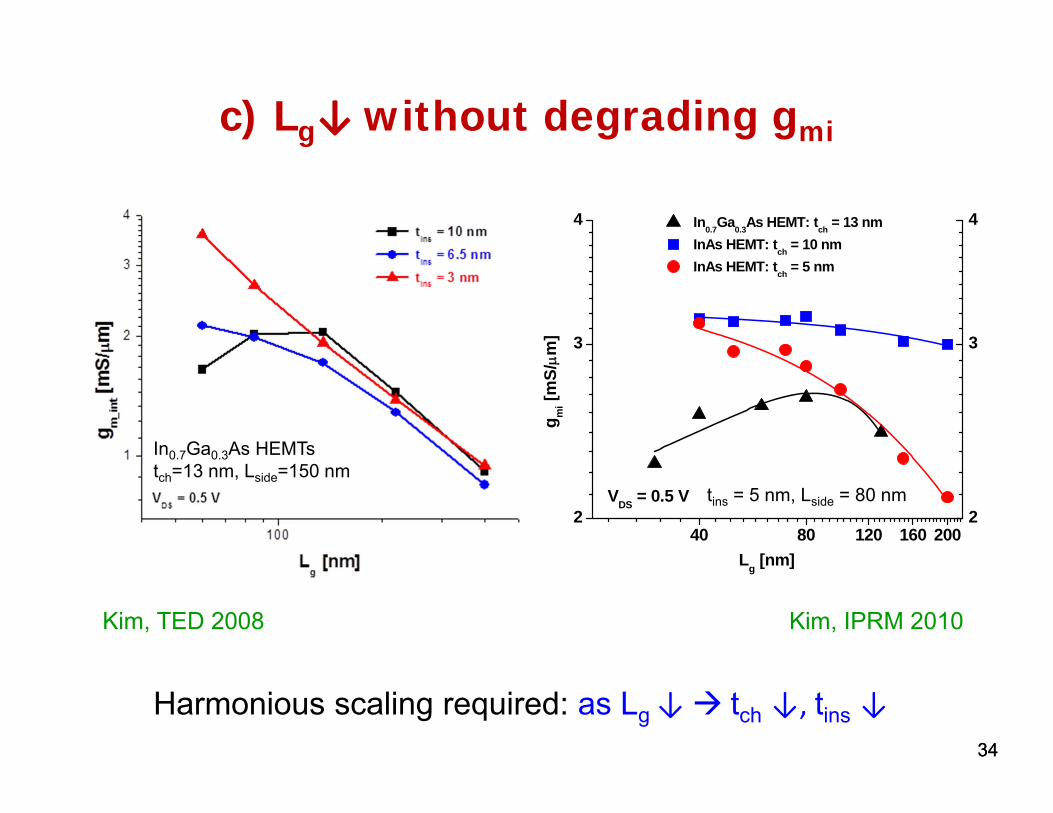
c) Lg↓ without degrading gmi
34
Kim, TED 2008
In0.7Ga0.3As HEMTstch=13 nm, Lside=150 nm
40 80 120 160 2002
3
4
Lg [nm]
2
3
4 In0.7Ga0.3As HEMT: tch = 13 nm InAs HEMT: tch = 10 nm InAs HEMT: tch = 5 nm
g mi [m
S/m
]
VDS = 0.5 V tins = 5 nm, Lside = 80 nm
Kim, IPRM 2010
Harmonious scaling required: as Lg ↓ tch ↓, tins ↓

35
Aspect ratio of record ft devices
35
Our work: dimensions verified by XTEM
• Channel aspect ratio between 2 and 4• Insulator aspect ratio between 2 and 8 (2 likely an
underestimate)
Channel aspect ratio: Lg/tch Insulator aspect ratio: Lg/tins

36
5. Limits to HEMT scaling and future prospects
36
Barrier thickness scaling limited by IG
del Alamo, IPRM 2011

37
Alternative insulators
37
Radosavljevic, IEDM 2009
High-K dielectrics being pursued for III-V CMOS huge opportunity for THz HEMT electronics!
tox=4 nm
1000x reduction
E- mode

38
Limits to HEMT scaling
38
Deep channel thickness scaling degrades performance: RS ↑ fT ↓
Kim, IPRM 2010
InAs HEMT, Lside = 80 nm, tins = 5 nm
Noticeable mobility degradation: tch=10 nm e=13,500 cm2/V.stch=5 nm e=9,950 cm2/V.s

39
Channel strain engineering
39
InAs 300 K quantum-well mobility vs. lattice constant:
InP AlSbInAs InSb
Independent control of channel strain and composition: new possibilities for channel design

THz HEMTs: possible designs
40
n+n+
Regrown S/D QW-MOSFET
FinFET Gate-all-around nanowire FET
Etched S/D QW-MOSFET

41
Conclusion
41
• THz HEMTs just around the corner
• Expanding interest on III-V CMOS: huge opportunity for THz HEMT electronics fast technology progress new processes and tools fundamental research on transport, etc. Si as substrate for THz electronics