incentive regulation of distribution utilities - michigan.gov · cost of production (perfectly...
TRANSCRIPT
Incentive Regulation of Distribution Utilities
A Primer: Theory and PracticeRobert G. Ozar P.E.
Assistant Director, Electric Reliability Division, Michigan Public Service Commission
November 21, 2017
• Section 1: Economic and regulatory foundations
Basis for Public Utility Regulation
• Natural monopoly – high capital costs, high barriers to entry, cannot move or transfer facilities to gain new markets
• Economic regulation substitutes for market competition
• Prevents abuse of monopoly power – protects consumers
Double Task of Economic Regulation
• Determine the sum of revenues that a regulated utility is allowed to collect [remuneration challenge]– Operating costs
– Investment costs (return of and on investment)
• Determine how the revenues will be collected [tariff challenge]– Cost allocation
– Rate design
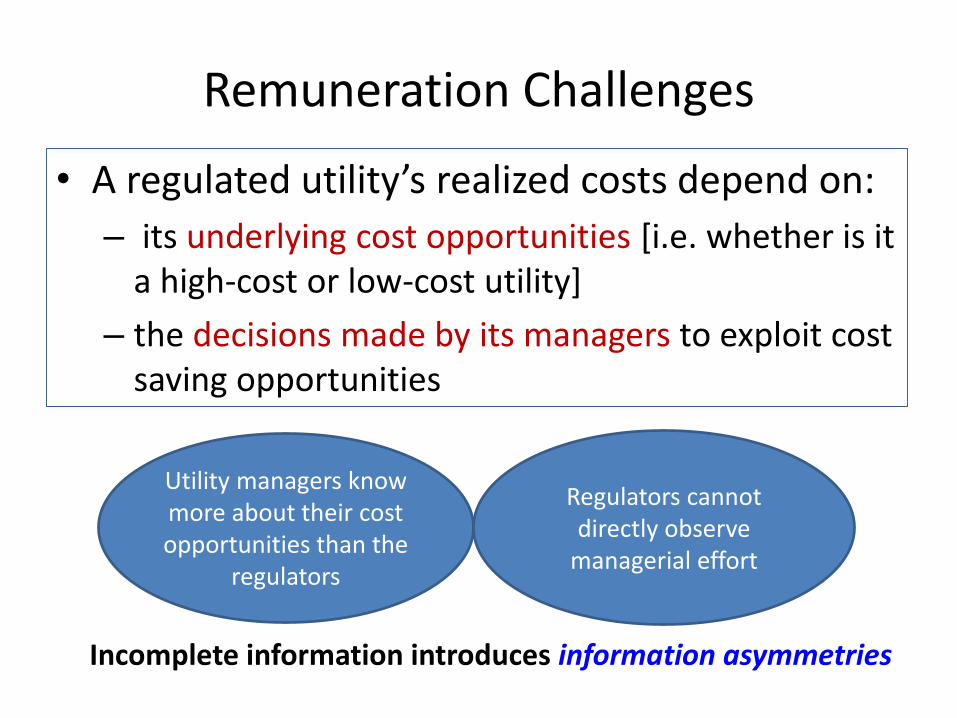
Remuneration Challenges
• A regulated utility’s realized costs depend on:
– its underlying cost opportunities [i.e. whether is it a high-cost or low-cost utility]
– the decisions made by its managers to exploit cost saving opportunities
Incomplete information introduces information asymmetries
Utility managers know more about their cost opportunities than the
regulators
Regulators cannot directly observe
managerial effort
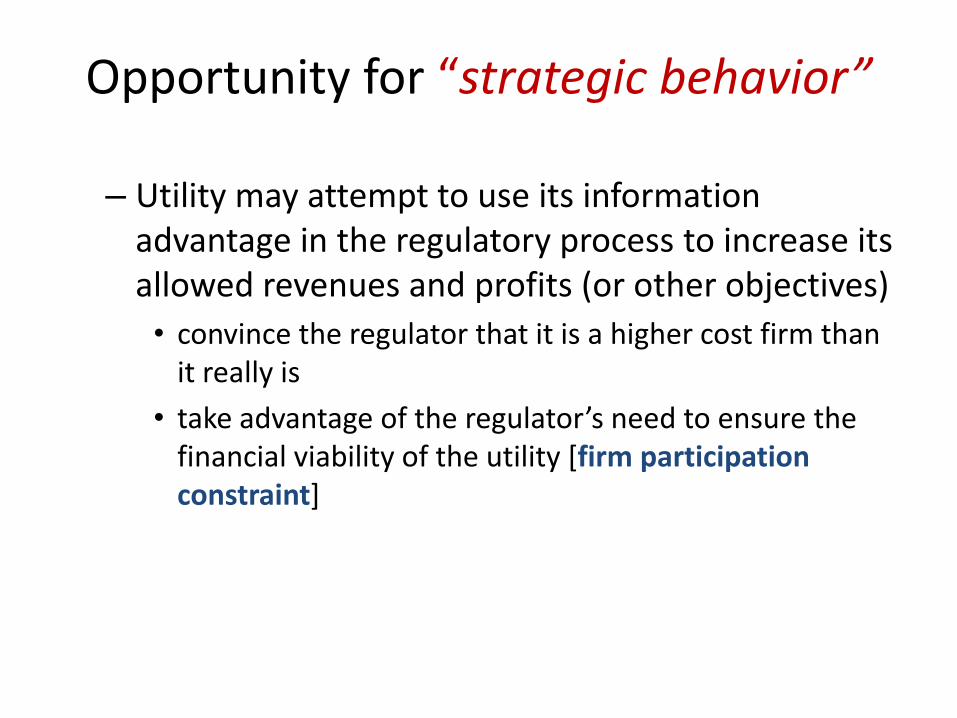
Opportunity for “strategic behavior”
– Utility may attempt to use its information advantage in the regulatory process to increase its allowed revenues and profits (or other objectives)
• convince the regulator that it is a higher cost firm than it really is
• take advantage of the regulator’s need to ensure the financial viability of the utility [firm participation constraint]
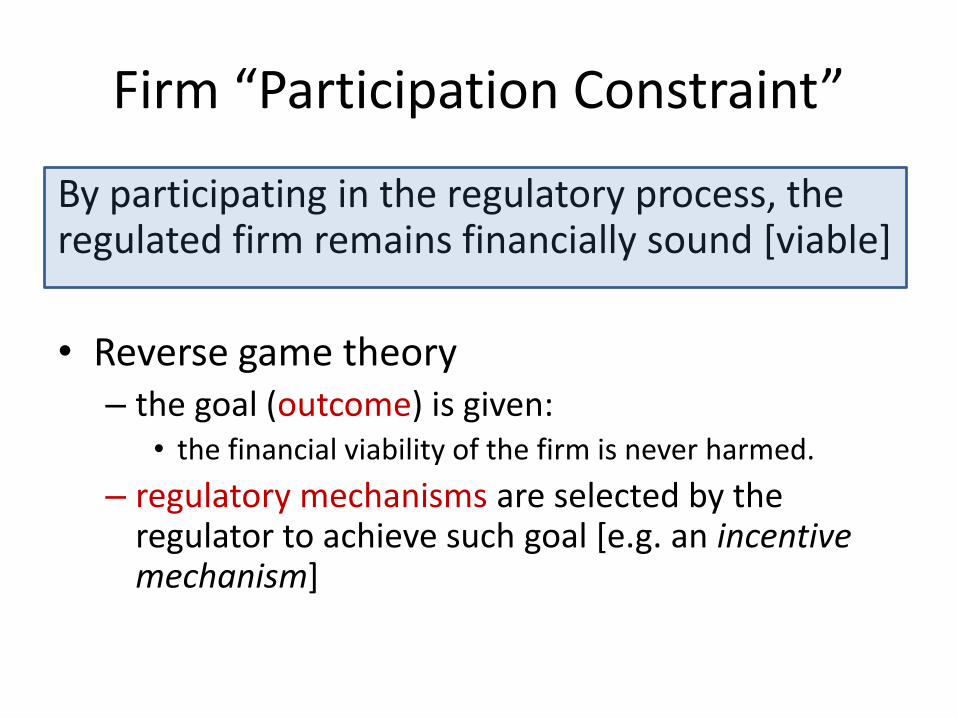
Firm “Participation Constraint”
By participating in the regulatory process, the regulated firm remains financially sound [viable]
• Reverse game theory– the goal (outcome) is given:
• the financial viability of the firm is never harmed.
– regulatory mechanisms are selected by the regulator to achieve such goal [e.g. an incentive mechanism]
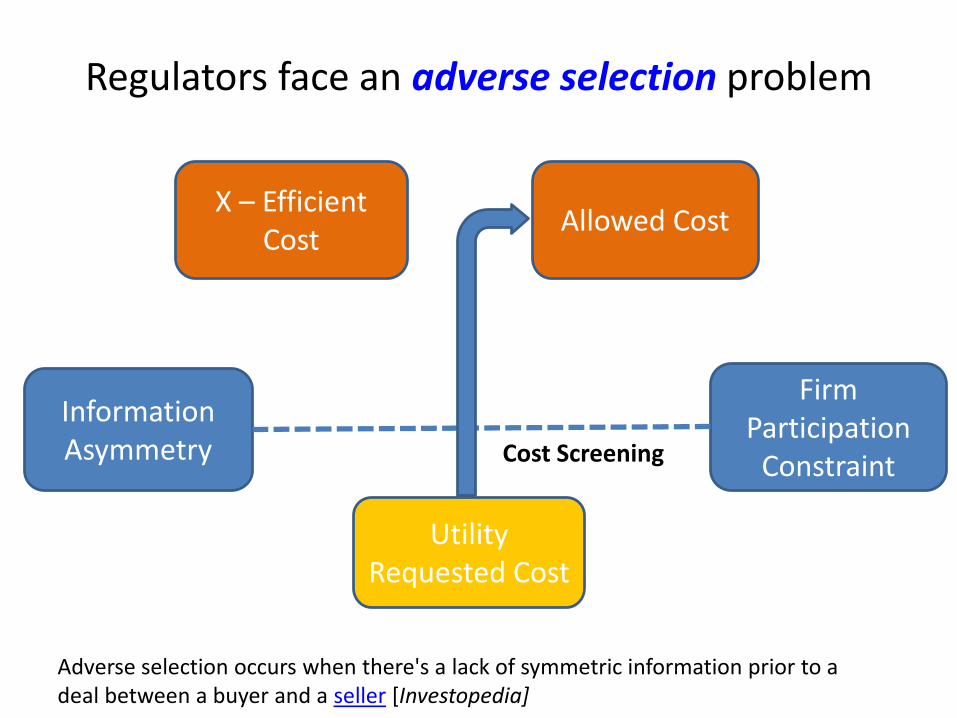
Regulators face an adverse selection problem
Information Asymmetry
Firm Participation
Constraint
Utility Requested Cost
X – Efficient Cost
Cost Screening
Allowed Cost
Adverse selection occurs when there's a lack of symmetric information prior to a deal between a buyer and a seller [Investopedia]
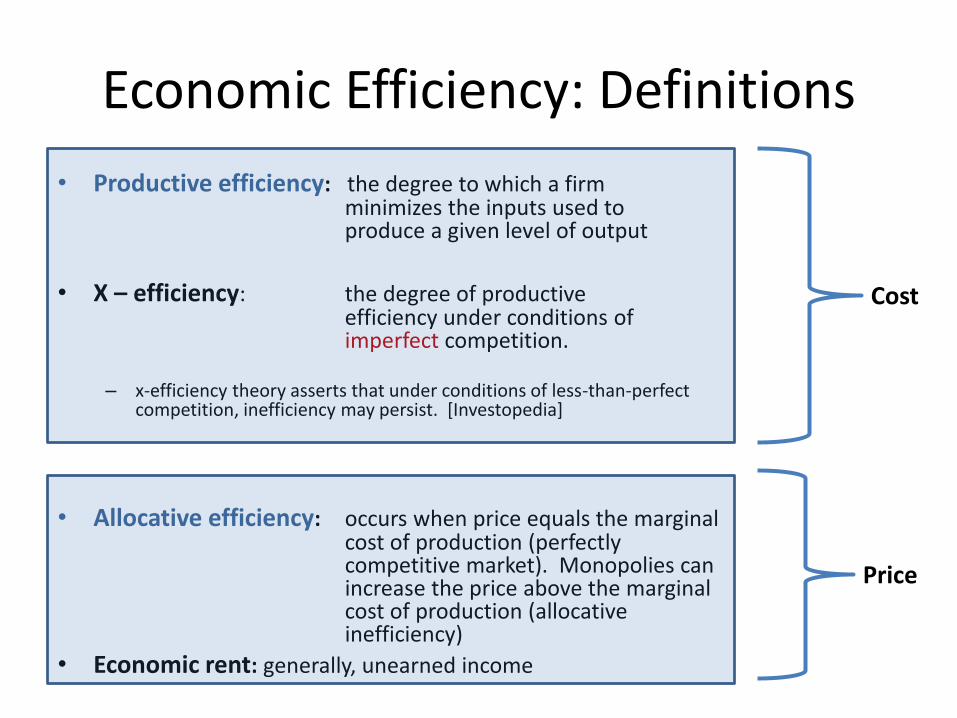
Economic Efficiency: Definitions
• Productive efficiency: the degree to which a firm minimizes the inputs used to produce a given level of output
• X – efficiency: the degree of productive efficiency under conditions of imperfect competition.
– x-efficiency theory asserts that under conditions of less-than-perfect competition, inefficiency may persist. [Investopedia]
• Allocative efficiency: occurs when price equals the marginal cost of production (perfectly competitive market). Monopolies can increase the price above the marginal cost of production (allocative inefficiency)
• Economic rent: generally, unearned income
Cost
Price
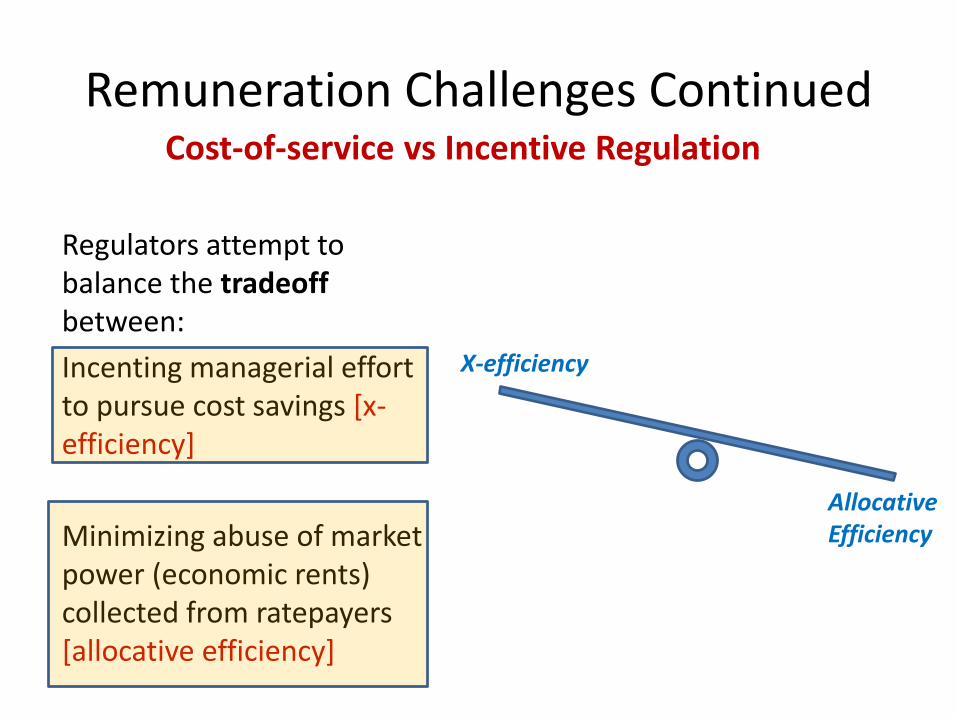
Remuneration Challenges Continued
Regulators attempt to balance the tradeoffbetween:
Incenting managerial effort to pursue cost savings [x-efficiency]
Minimizing abuse of market power (economic rents) collected from ratepayers [allocative efficiency]
X-efficiency
Allocative Efficiency
Cost-of-service vs Incentive Regulation
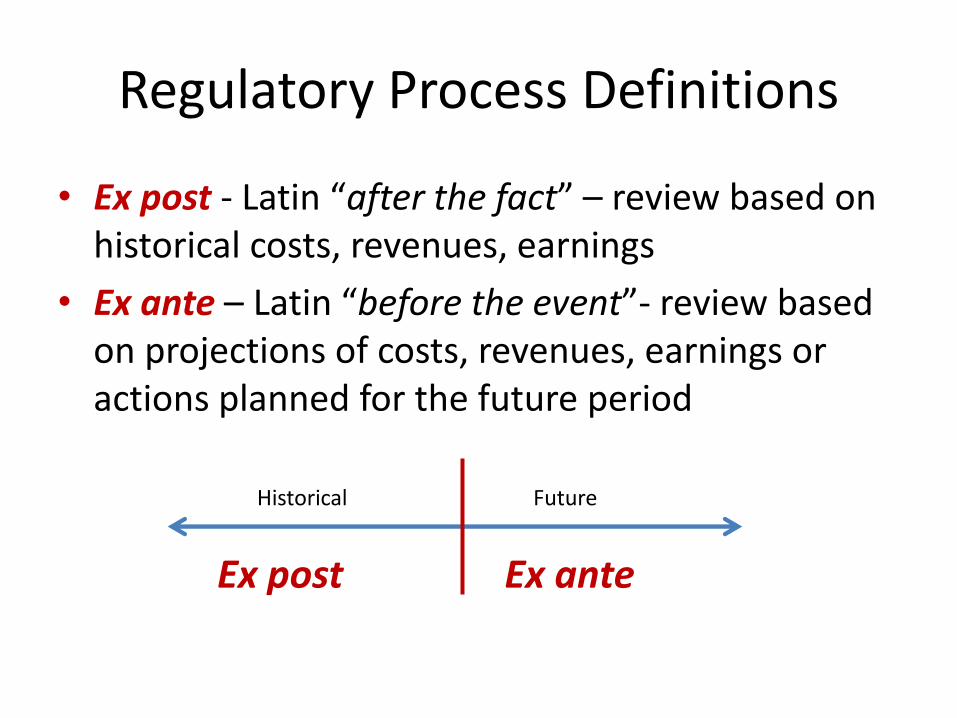
Regulatory Process Definitions
• Ex post - Latin “after the fact” – review based on historical costs, revenues, earnings
• Ex ante – Latin “before the event”- review based on projections of costs, revenues, earnings or actions planned for the future period
Ex post Ex ante
Historical Future
• Section 2: Cost-of-Service regulation and Incentive regulation [contrasted and compared]
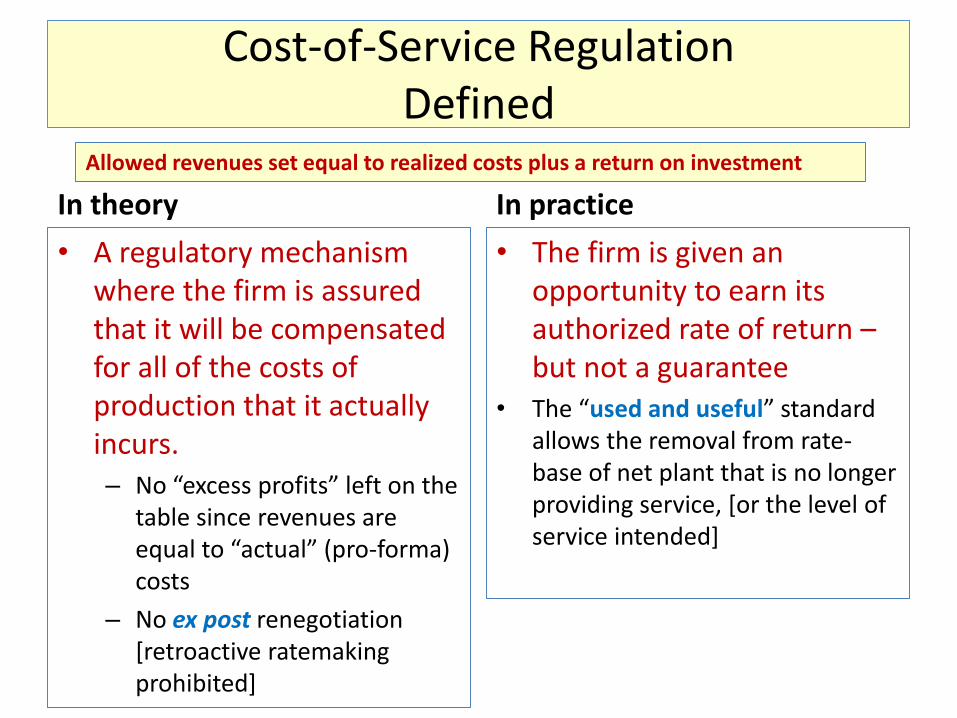
Cost-of-Service RegulationDefined
In theory
• A regulatory mechanism where the firm is assured that it will be compensated for all of the costs of production that it actually incurs.– No “excess profits” left on the
table since revenues are equal to “actual” (pro-forma) costs
– No ex post renegotiation [retroactive ratemaking prohibited]
In practice
• The firm is given an opportunity to earn its authorized rate of return –but not a guarantee
• The “used and useful” standard allows the removal from rate-base of net plant that is no longer providing service, [or the level of service intended]
Allowed revenues set equal to realized costs plus a return on investment
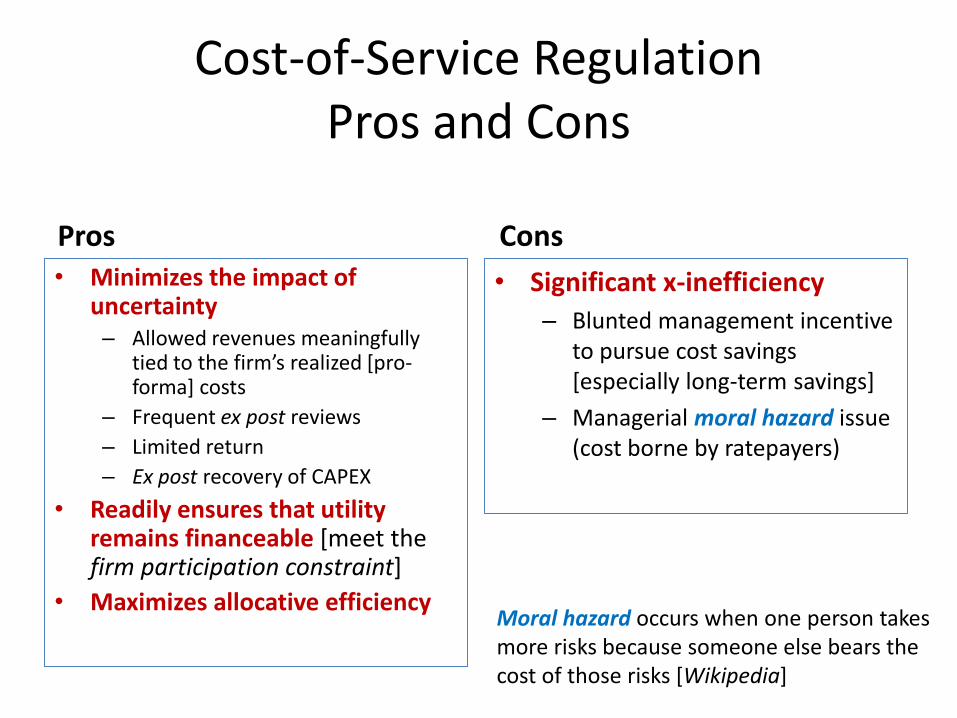
Cost-of-Service RegulationPros and Cons
Pros• Minimizes the impact of
uncertainty– Allowed revenues meaningfully
tied to the firm’s realized [pro-forma] costs
– Frequent ex post reviews
– Limited return
– Ex post recovery of CAPEX
• Readily ensures that utility remains financeable [meet the firm participation constraint]
• Maximizes allocative efficiency
Cons
• Significant x-inefficiency
– Blunted management incentive to pursue cost savings [especially long-term savings]
– Managerial moral hazard issue (cost borne by ratepayers)
Moral hazard occurs when one person takes more risks because someone else bears the cost of those risks [Wikipedia]
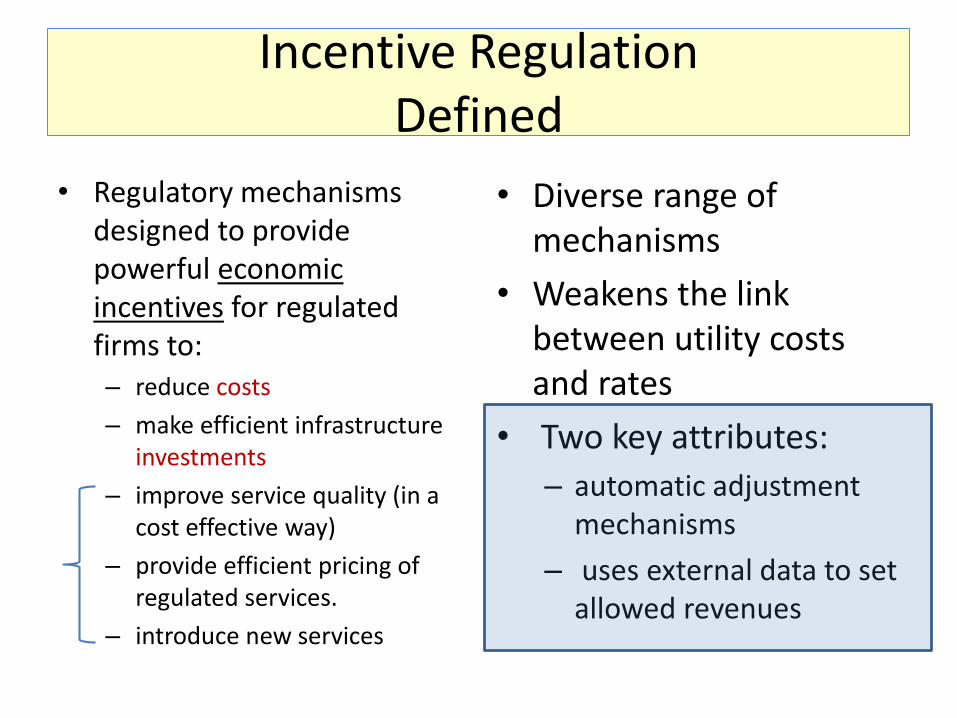
Incentive RegulationDefined
• Regulatory mechanisms designed to provide powerful economic incentives for regulated firms to:– reduce costs
– make efficient infrastructure investments
– improve service quality (in a cost effective way)
– provide efficient pricing of regulated services.
– introduce new services
• Diverse range of mechanisms
• Weakens the link between utility costs and rates
• Two key attributes:
– automatic adjustment mechanisms
– uses external data to set allowed revenues
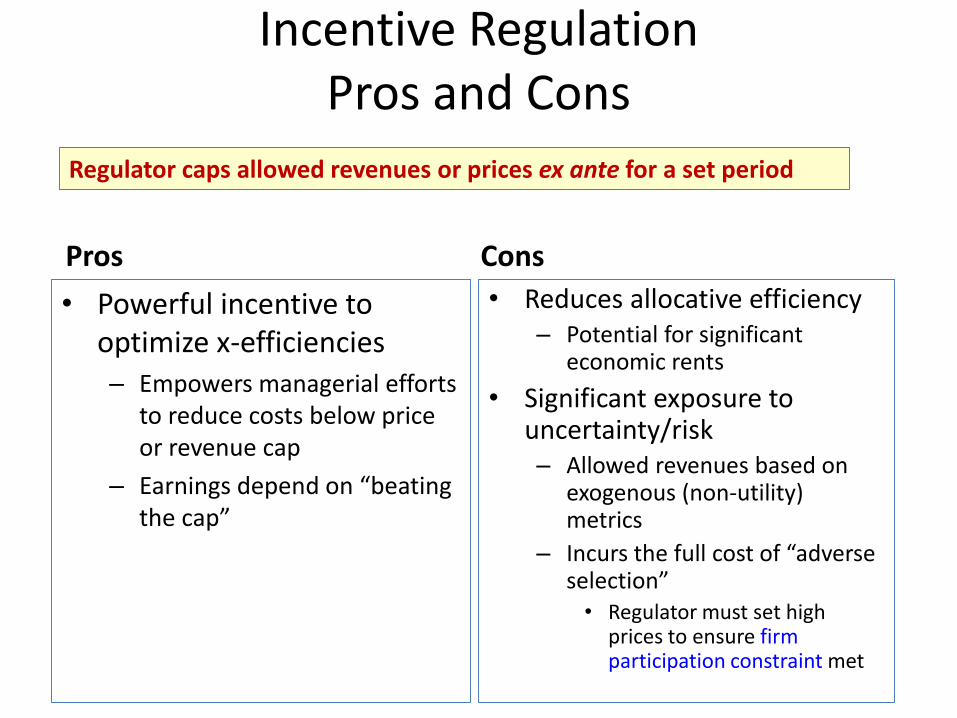
Incentive RegulationPros and Cons
Pros
• Powerful incentive to optimize x-efficiencies– Empowers managerial efforts
to reduce costs below price or revenue cap
– Earnings depend on “beating the cap”
Cons
• Reduces allocative efficiency– Potential for significant
economic rents
• Significant exposure to uncertainty/risk– Allowed revenues based on
exogenous (non-utility) metrics
– Incurs the full cost of “adverse selection” • Regulator must set high
prices to ensure firm participation constraint met
Regulator caps allowed revenues or prices ex ante for a set period
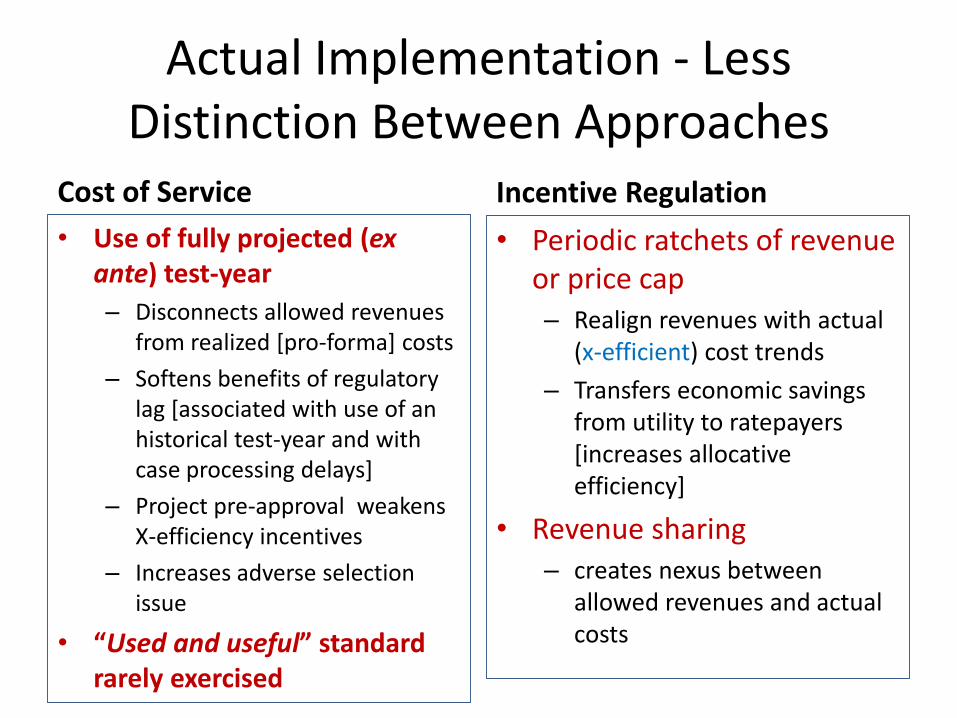
Actual Implementation - Less Distinction Between Approaches
Cost of Service
• Use of fully projected (ex ante) test-year
– Disconnects allowed revenues from realized [pro-forma] costs
– Softens benefits of regulatory lag [associated with use of an historical test-year and with case processing delays]
– Project pre-approval weakens X-efficiency incentives
– Increases adverse selection issue
• “Used and useful” standard rarely exercised
Incentive Regulation
• Periodic ratchets of revenue or price cap– Realign revenues with actual
(x-efficient) cost trends
– Transfers economic savings from utility to ratepayers [increases allocative efficiency]
• Revenue sharing– creates nexus between
allowed revenues and actual costs
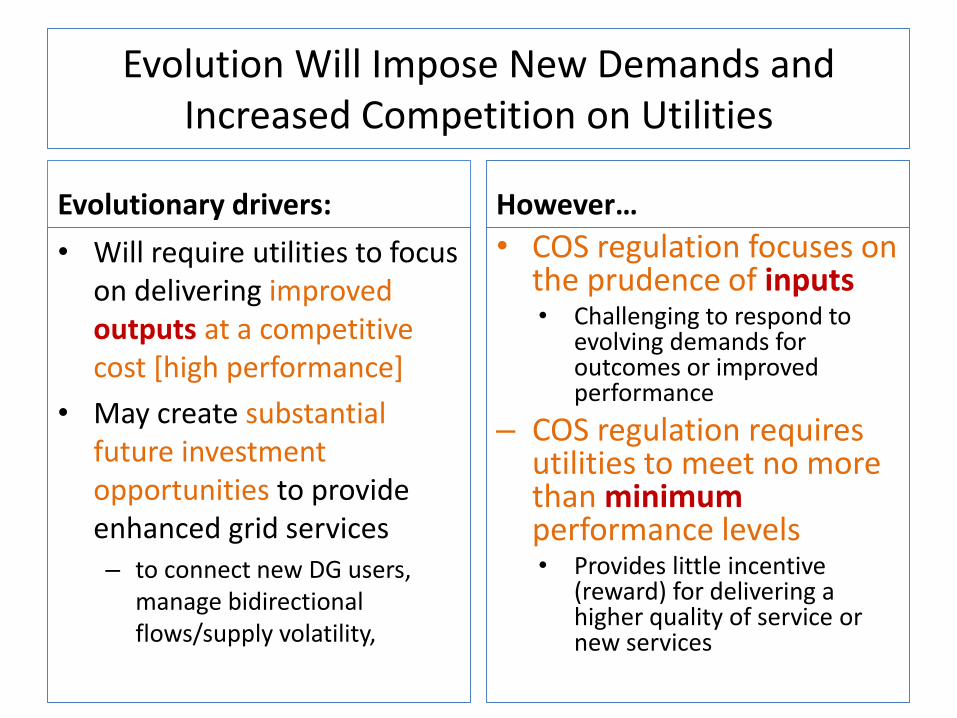
Evolution Will Impose New Demands and Increased Competition on Utilities
Evolutionary drivers:
• Will require utilities to focus on delivering improved outputs at a competitive cost [high performance]
• May create substantial future investment opportunities to provide enhanced grid services– to connect new DG users,
manage bidirectional flows/supply volatility,
However…
• COS regulation focuses on the prudence of inputs• Challenging to respond to
evolving demands for outcomes or improved performance
– COS regulation requires utilities to meet no more than minimumperformance levels• Provides little incentive
(reward) for delivering a higher quality of service or new services
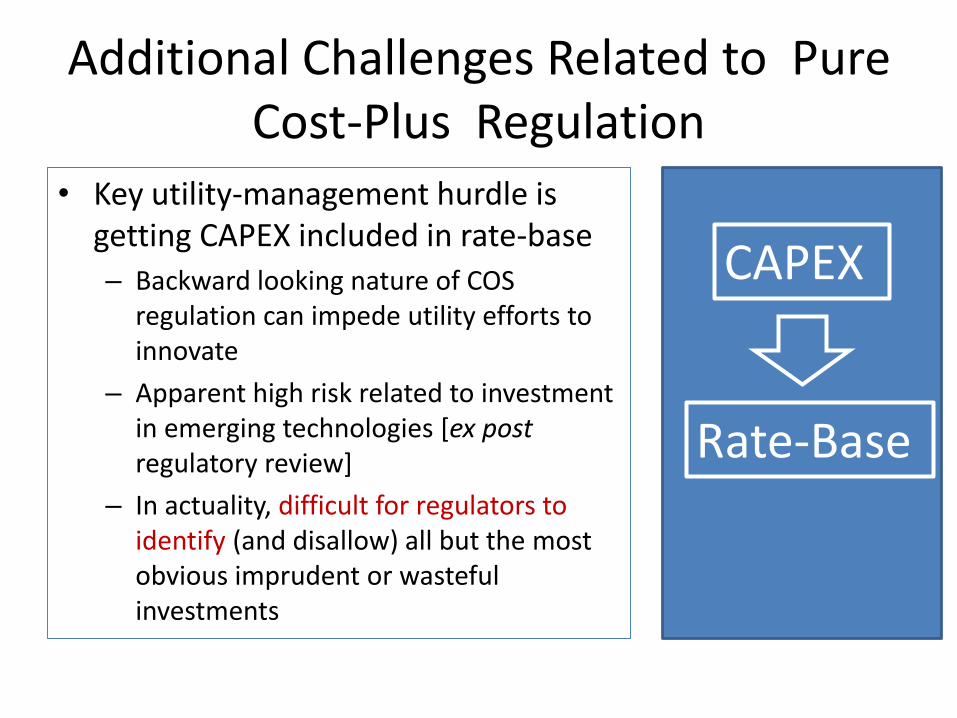
Additional Challenges Related to Pure Cost-Plus Regulation
• Key utility-management hurdle is getting CAPEX included in rate-base
– Backward looking nature of COS regulation can impede utility efforts to innovate
– Apparent high risk related to investment in emerging technologies [ex post regulatory review]
– In actuality, difficult for regulators to identify (and disallow) all but the most obvious imprudent or wasteful investments
CAPEX
Rate-Base
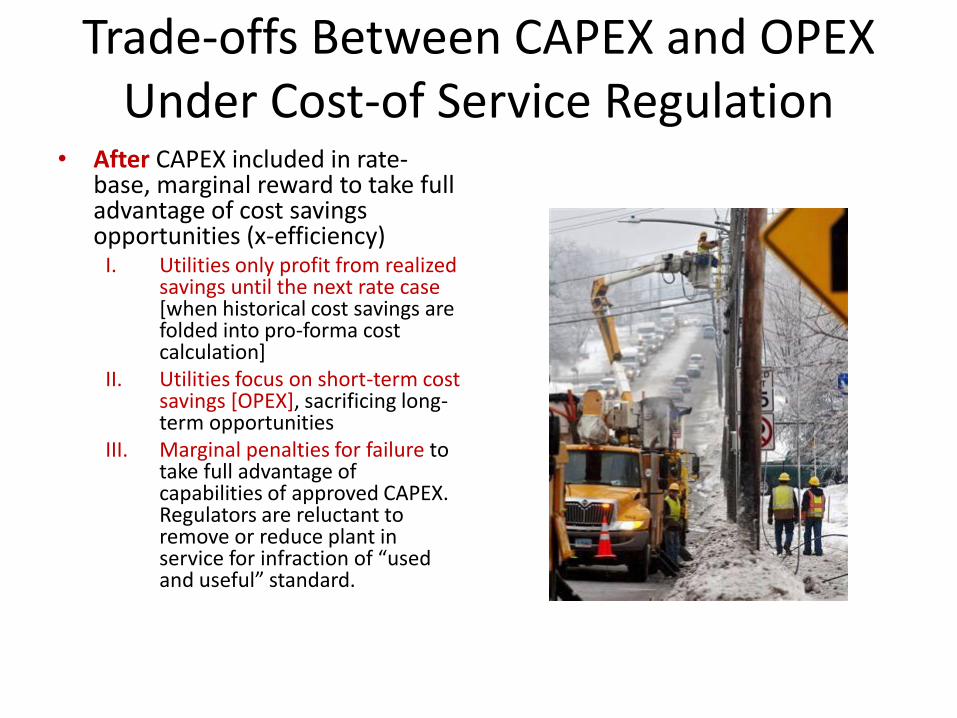
Trade-offs Between CAPEX and OPEX Under Cost-of Service Regulation
• After CAPEX included in rate-base, marginal reward to take full advantage of cost savings opportunities (x-efficiency)
I. Utilities only profit from realized savings until the next rate case [when historical cost savings are folded into pro-forma cost calculation]
II. Utilities focus on short-term cost savings [OPEX], sacrificing long-term opportunities
III. Marginal penalties for failure to take full advantage of capabilities of approved CAPEX. Regulators are reluctant to remove or reduce plant in service for infraction of “used and useful” standard.
COS and a Regulated Utility’s Strategic Business Model
• When faced with the choice between a capital investment [CAPEX] or an expense [OPEX] a regulated IOU will tend to choose the CAPEX route despite x-efficiency benefits of the latter.
• Examples: – Build out of a private data (mesh)
network for smart meters vs. contracting with a public telecommunications carrier for point-to-point cellular service
– Depreciation unit defines replacement size; may affect repair/replacement decisions
Preferable Regulatory Mechanism
• Balance between a pure cost-of-service and pure incentive regulation
COS Incentive
Role of Economic Incentivesfor Investor Owned Utilities
• Economic incentives are the key to signaling that a certain investment or decision is valued or encouraged and another is relatively discouraged
• Holds true irrespective of which regulatory model is used by regulators
Incentive RegulationStrategic Goal
Incentive-based regulatory mechanisms make it profitable for regulated utilities to make x-efficiency improvements and yield consumer benefits (in the long run)
• Regulated firms may earn significantly higher returns than their cost of capital when these “excess” returns are achieved from cost savings beyond the benchmark
• In theory, if the firm over performs against the target, consumers eventually benefit at the next price review “ratchet”
• Section 3: Price Cap regulation is the historical foundation of Performance Based Regulation
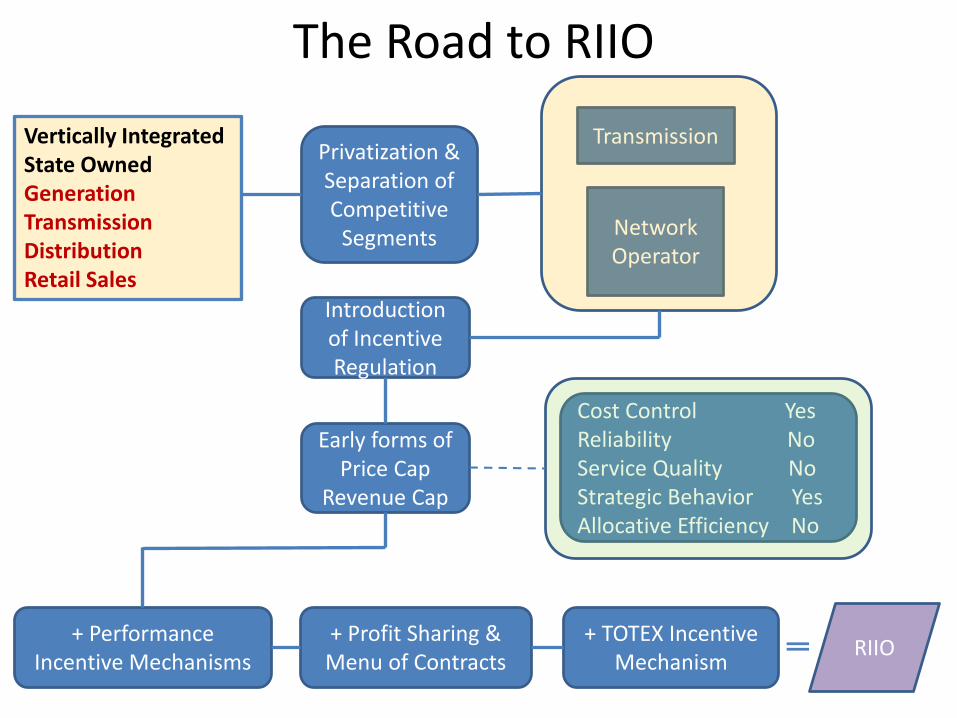
Vertically Integrated State OwnedGenerationTransmissionDistributionRetail Sales
Privatization & Separation of Competitive
Segments Network Operator
Introduction of Incentive Regulation
Early forms ofPrice Cap
Revenue Cap
Transmission
Cost Control YesReliability NoService Quality No Strategic Behavior YesAllocative Efficiency No
+ Performance Incentive Mechanisms
+ Profit Sharing & Menu of Contracts
+ TOTEX Incentive Mechanism
RIIO
The Road to RIIO
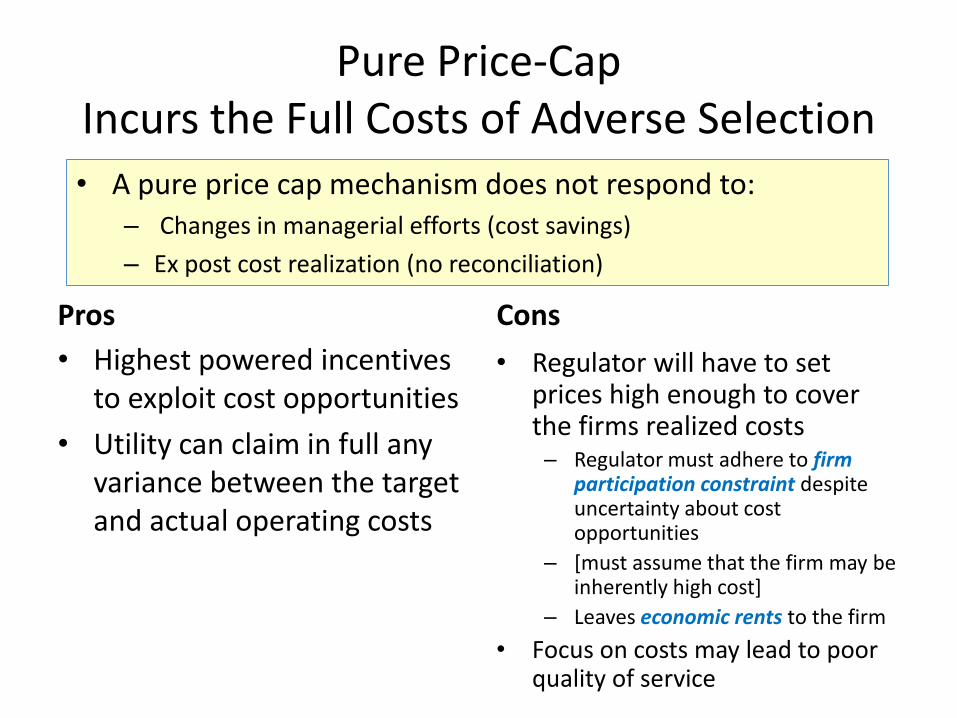
Pure Price-Cap Incurs the Full Costs of Adverse Selection
Pros
• Highest powered incentives to exploit cost opportunities
• Utility can claim in full any variance between the target and actual operating costs
Cons
• Regulator will have to set prices high enough to cover the firms realized costs– Regulator must adhere to firm
participation constraint despite uncertainty about cost opportunities
– [must assume that the firm may be inherently high cost]
– Leaves economic rents to the firm
• Focus on costs may lead to poor quality of service
• A pure price cap mechanism does not respond to:– Changes in managerial efforts (cost savings)
– Ex post cost realization (no reconciliation)
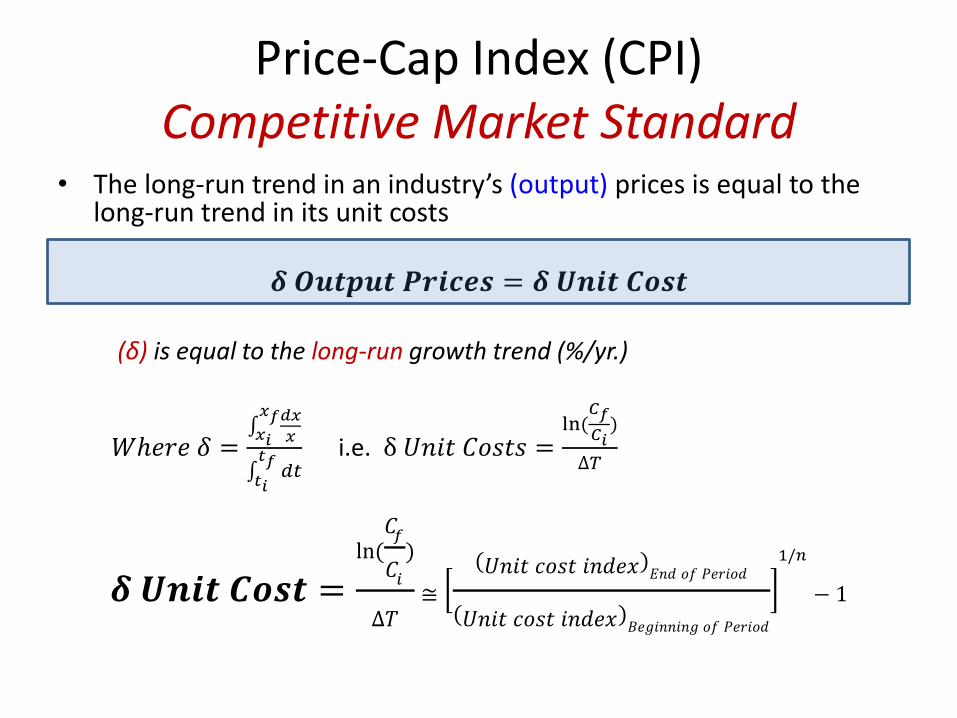
Price-Cap Index (CPI)Competitive Market Standard
• The long-run trend in an industry’s (output) prices is equal to the long-run trend in its unit costs
𝜹 𝑶𝒖𝒕𝒑𝒖𝒕 𝑷𝒓𝒊𝒄𝒆𝒔 = 𝜹 𝑼𝒏𝒊𝒕 𝑪𝒐𝒔𝒕
(δ) is equal to the long-run growth trend (%/yr.)
𝑊ℎ𝑒𝑟𝑒 𝛿 = 𝑥𝑖
𝑥𝑓𝑑𝑥
𝑥
𝑡𝑖
𝑡𝑓𝑑𝑡
i.e. δ 𝑈𝑛𝑖𝑡 𝐶𝑜𝑠𝑡𝑠 =ln(𝐶𝑓
𝐶𝑖)
∆𝑇
𝜹 𝑼𝒏𝒊𝒕 𝑪𝒐𝒔𝒕 =ln(𝐶𝑓
𝐶𝑖)
∆𝑇≅
𝑈𝑛𝑖𝑡 𝑐𝑜𝑠𝑡 𝑖𝑛𝑑𝑒𝑥 𝐸𝑛𝑑 𝑜𝑓 𝑃𝑒𝑟𝑖𝑜𝑑
𝑈𝑛𝑖𝑡 𝑐𝑜𝑠𝑡 𝑖𝑛𝑑𝑒𝑥 𝐵𝑒𝑔𝑖𝑛𝑛𝑖𝑛𝑔 𝑜𝑓 𝑃𝑒𝑟𝑖𝑜𝑑
1/𝑛
− 1
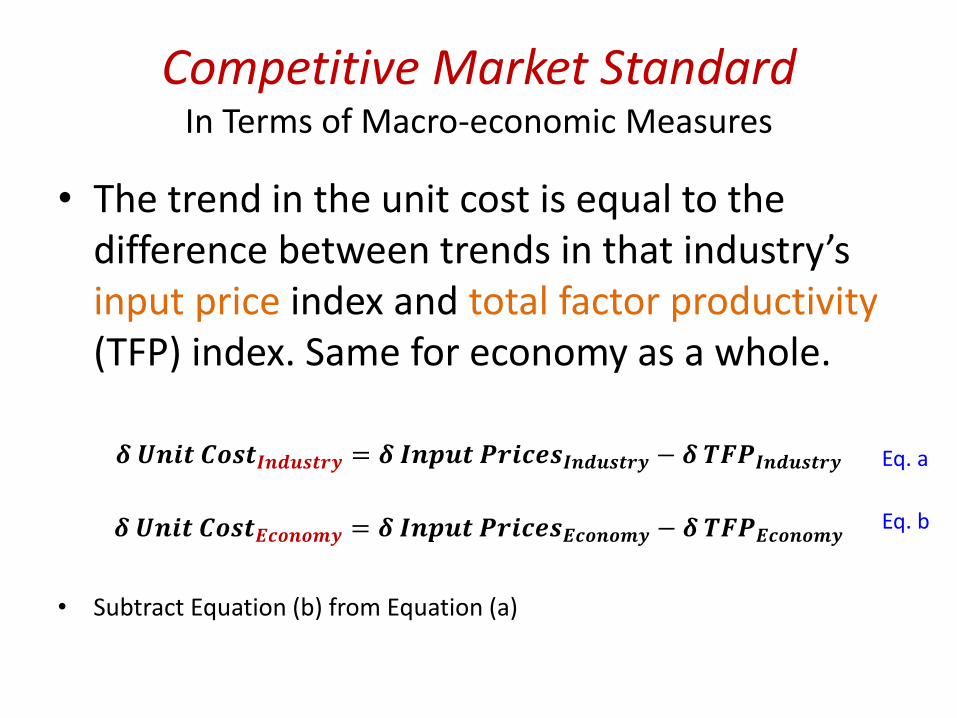
Competitive Market StandardIn Terms of Macro-economic Measures
• The trend in the unit cost is equal to the difference between trends in that industry’s input price index and total factor productivity(TFP) index. Same for economy as a whole.
𝜹 𝑼𝒏𝒊𝒕 𝑪𝒐𝒔𝒕𝑰𝒏𝒅𝒖𝒔𝒕𝒓𝒚 = 𝜹 𝑰𝒏𝒑𝒖𝒕 𝑷𝒓𝒊𝒄𝒆𝒔𝑰𝒏𝒅𝒖𝒔𝒕𝒓𝒚 − 𝜹 𝑻𝑭𝑷𝑰𝒏𝒅𝒖𝒔𝒕𝒓𝒚
𝜹 𝑼𝒏𝒊𝒕 𝑪𝒐𝒔𝒕𝑬𝒄𝒐𝒏𝒐𝒎𝒚 = 𝜹 𝑰𝒏𝒑𝒖𝒕 𝑷𝒓𝒊𝒄𝒆𝒔𝑬𝒄𝒐𝒏𝒐𝒎𝒚 − 𝜹 𝑻𝑭𝑷𝑬𝒄𝒐𝒏𝒐𝒎𝒚
• Subtract Equation (b) from Equation (a)
Eq. a
Eq. b
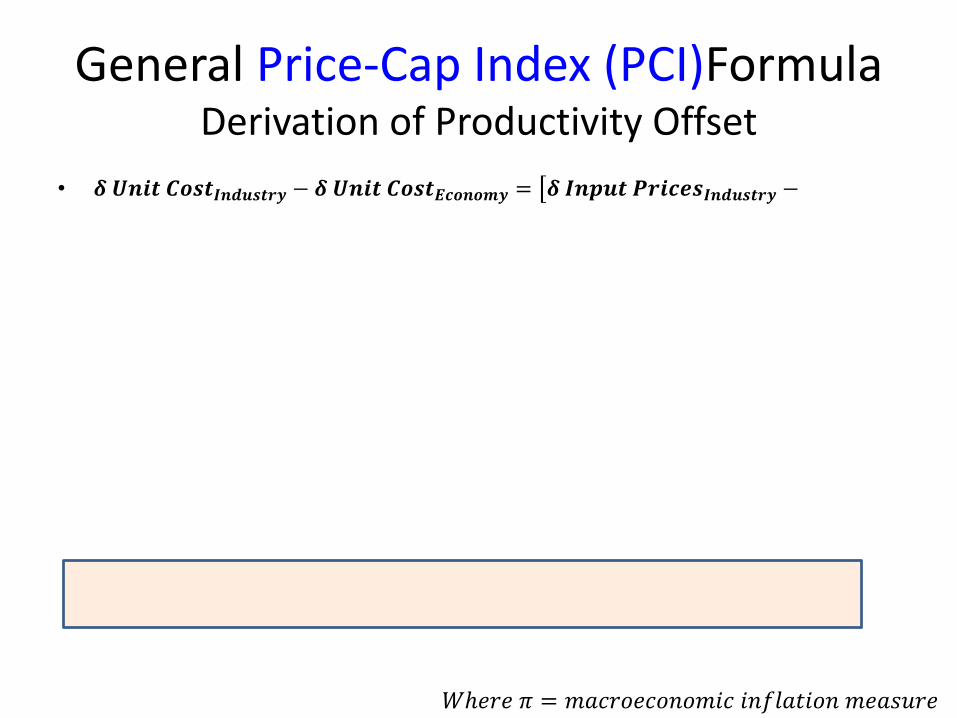
General Price-Cap Index (PCI)FormulaDerivation of Productivity Offset
• 𝜹 𝑼𝒏𝒊𝒕 𝑪𝒐𝒔𝒕𝑰𝒏𝒅𝒖𝒔𝒕𝒓𝒚 − 𝜹 𝑼𝒏𝒊𝒕 𝑪𝒐𝒔𝒕𝑬𝒄𝒐𝒏𝒐𝒎𝒚 = 𝜹 𝑰𝒏𝒑𝒖𝒕 𝑷𝒓𝒊𝒄𝒆𝒔𝑰𝒏𝒅𝒖𝒔𝒕𝒓𝒚 −
𝑊ℎ𝑒𝑟𝑒 𝜋 = 𝑚𝑎𝑐𝑟𝑜𝑒𝑐𝑜𝑛𝑜𝑚𝑖𝑐 𝑖𝑛𝑓𝑙𝑎𝑡𝑖𝑜𝑛 𝑚𝑒𝑎𝑠𝑢𝑟𝑒
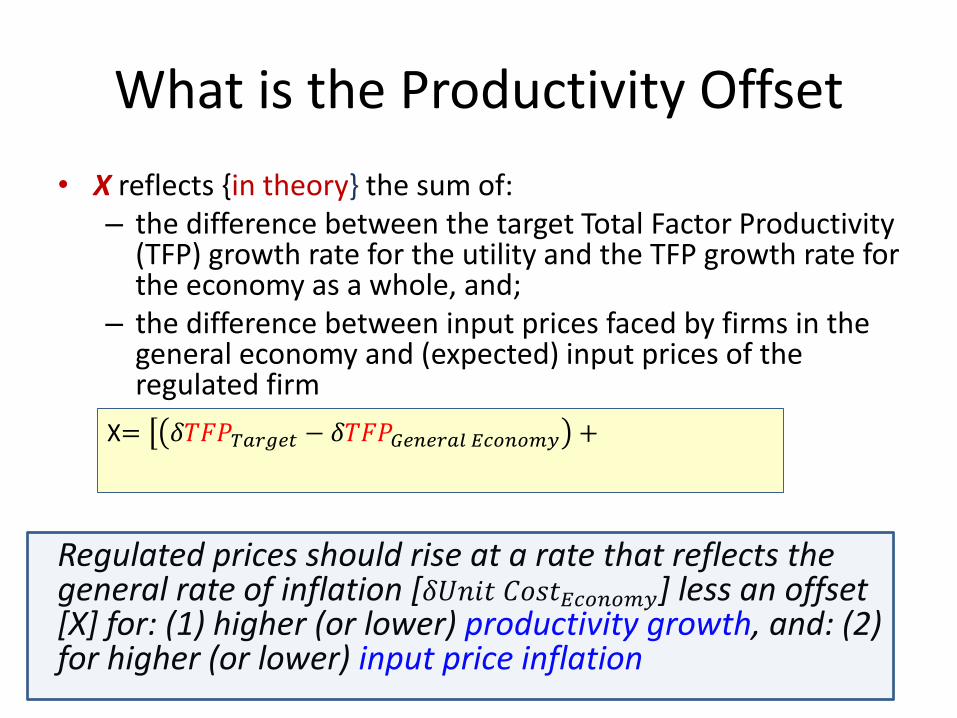
What is the Productivity Offset
• X reflects {in theory} the sum of: – the difference between the target Total Factor Productivity
(TFP) growth rate for the utility and the TFP growth rate for the economy as a whole, and;
– the difference between input prices faced by firms in the general economy and (expected) input prices of the regulated firm
Regulated prices should rise at a rate that reflects the general rate of inflation [𝛿𝑈𝑛𝑖𝑡 𝐶𝑜𝑠𝑡𝐸𝑐𝑜𝑛𝑜𝑚𝑦] less an offset [X] for: (1) higher (or lower) productivity growth, and: (2) for higher (or lower) input price inflation
X= 𝛿𝑇𝐹𝑃𝑇𝑎𝑟𝑔𝑒𝑡 − 𝛿𝑇𝐹𝑃𝐺𝑒𝑛𝑒𝑟𝑎𝑙 𝐸𝑐𝑜𝑛𝑜𝑚𝑦 +
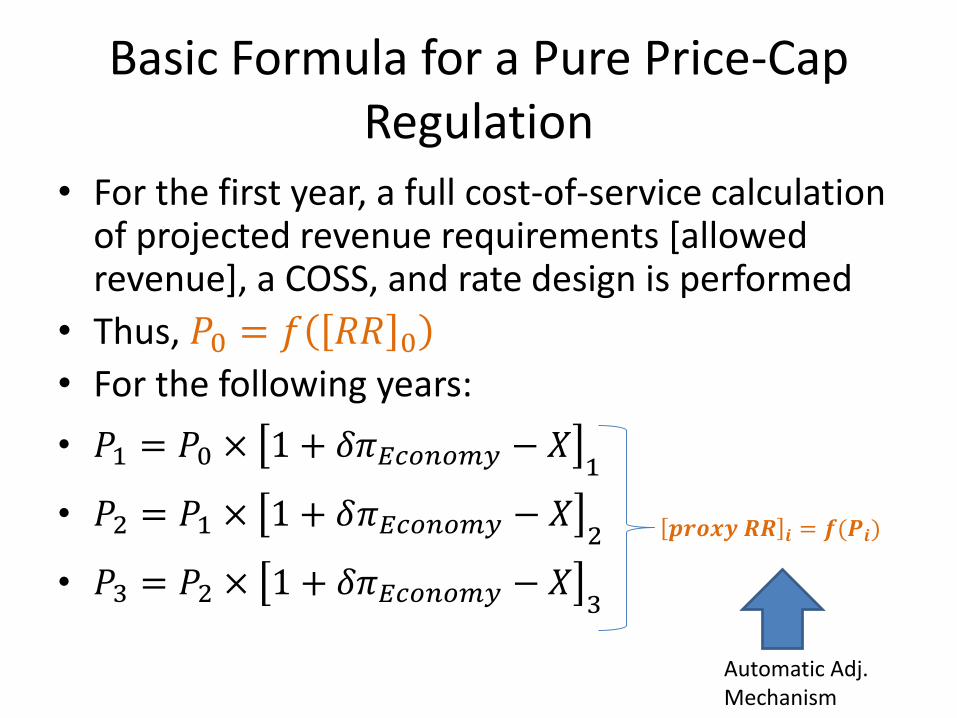
Basic Formula for a Pure Price-Cap Regulation
• For the first year, a full cost-of-service calculation of projected revenue requirements [allowed revenue], a COSS, and rate design is performed
• Thus, 𝑃0 = 𝑓 𝑅𝑅 0• For the following years:
• 𝑃1 = 𝑃0 × 1 + 𝛿𝜋𝐸𝑐𝑜𝑛𝑜𝑚𝑦 − 𝑋 1
• 𝑃2 = 𝑃1 × 1 + 𝛿𝜋𝐸𝑐𝑜𝑛𝑜𝑚𝑦 − 𝑋 2
• 𝑃3 = 𝑃2 × 1 + 𝛿𝜋𝐸𝑐𝑜𝑛𝑜𝑚𝑦 − 𝑋 3
𝒑𝒓𝒐𝒙𝒚 𝑹𝑹 𝒊 = 𝒇(𝑷𝒊)
Automatic Adj. Mechanism
• Section 4: The U.K.’s RPI-X and RIIO PBR Models
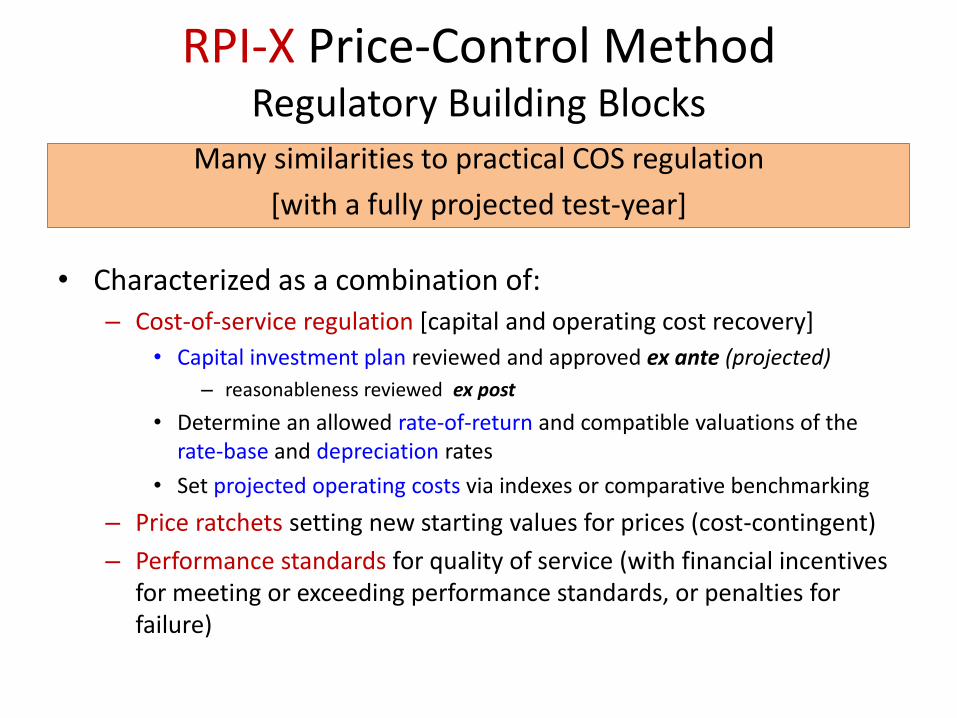
RPI-X Price-Control Method Regulatory Building Blocks
Many similarities to practical COS regulation
[with a fully projected test-year]
• Characterized as a combination of:– Cost-of-service regulation [capital and operating cost recovery]
• Capital investment plan reviewed and approved ex ante (projected)
– reasonableness reviewed ex post
• Determine an allowed rate-of-return and compatible valuations of the rate-base and depreciation rates
• Set projected operating costs via indexes or comparative benchmarking
– Price ratchets setting new starting values for prices (cost-contingent)
– Performance standards for quality of service (with financial incentives for meeting or exceeding performance standards, or penalties for failure)
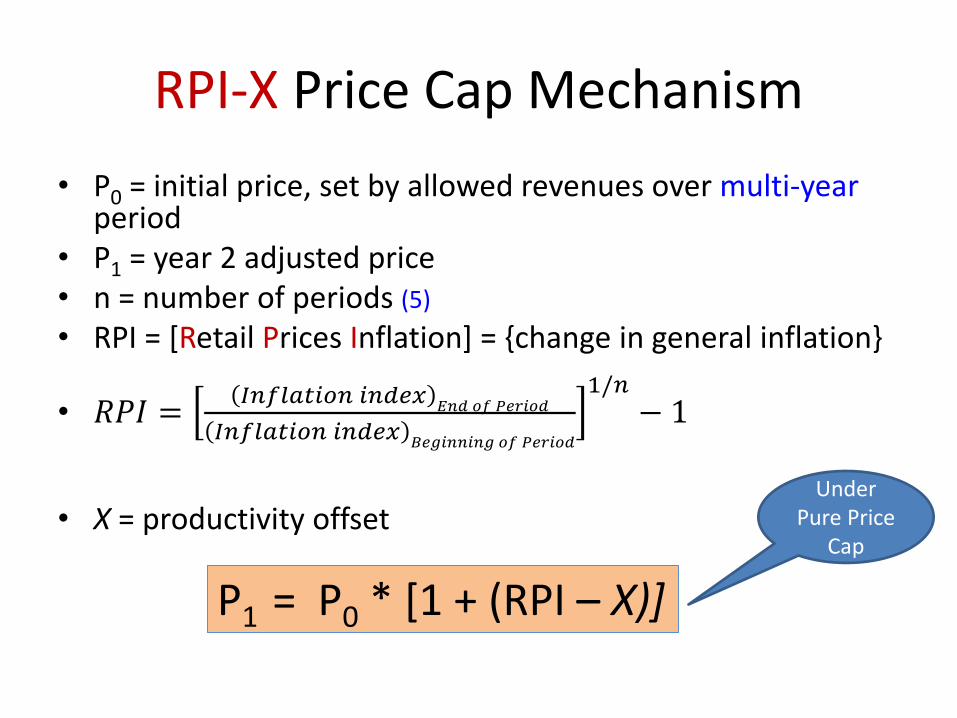
RPI-X Price Cap Mechanism
• P0 = initial price, set by allowed revenues over multi-yearperiod
• P1 = year 2 adjusted price• n = number of periods (5)
• RPI = [Retail Prices Inflation] = {change in general inflation}
• 𝑅𝑃𝐼 =𝐼𝑛𝑓𝑙𝑎𝑡𝑖𝑜𝑛 𝑖𝑛𝑑𝑒𝑥
𝐸𝑛𝑑 𝑜𝑓 𝑃𝑒𝑟𝑖𝑜𝑑
𝐼𝑛𝑓𝑙𝑎𝑡𝑖𝑜𝑛 𝑖𝑛𝑑𝑒𝑥𝐵𝑒𝑔𝑖𝑛𝑛𝑖𝑛𝑔 𝑜𝑓 𝑃𝑒𝑟𝑖𝑜𝑑
1/𝑛− 1
• X = productivity offset
P1 = P0 * [1 + (RPI – X)]
Under Pure Price
Cap
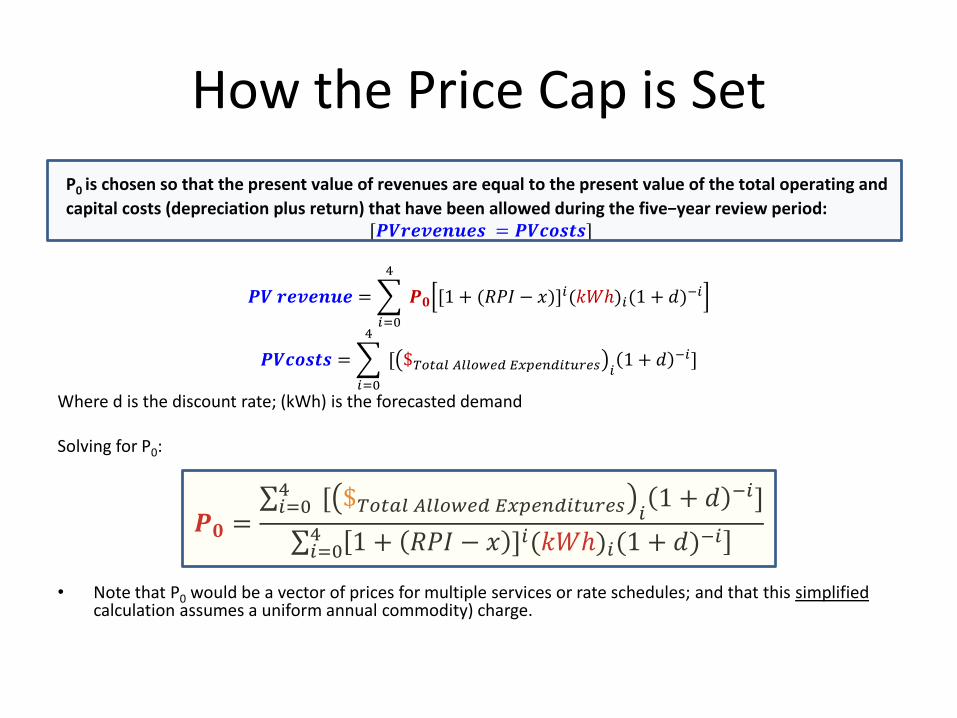
How the Price Cap is Set
P0 is chosen so that the present value of revenues are equal to the present value of the total operating and
capital costs (depreciation plus return) that have been allowed during the five−year review period:[𝑷𝑽𝒓𝒆𝒗𝒆𝒏𝒖𝒆𝒔 = 𝑷𝑽𝒄𝒐𝒔𝒕𝒔]
𝑷𝑽 𝒓𝒆𝒗𝒆𝒏𝒖𝒆 =
𝑖=0
4
𝑷𝟎 [1 + (𝑅𝑃𝐼 − 𝑥)]𝑖(𝑘𝑊ℎ)𝑖(1 + 𝑑)
−𝑖
𝑷𝑽𝒄𝒐𝒔𝒕𝒔 =
𝑖=0
4
[ $𝑇𝑜𝑡𝑎𝑙 𝐴𝑙𝑙𝑜𝑤𝑒𝑑 𝐸𝑥𝑝𝑒𝑛𝑑𝑖𝑡𝑢𝑟𝑒𝑠 𝑖 1 + 𝑑−𝑖]
Where d is the discount rate; (kWh) is the forecasted demand
Solving for P0:
𝑷𝟎 = 𝑖=04 [ $𝑇𝑜𝑡𝑎𝑙 𝐴𝑙𝑙𝑜𝑤𝑒𝑑 𝐸𝑥𝑝𝑒𝑛𝑑𝑖𝑡𝑢𝑟𝑒𝑠 𝑖 1 + 𝑑
−𝑖]
𝑖=04 1 + 𝑅𝑃𝐼 − 𝑥 ]𝑖(𝑘𝑊ℎ)𝑖(1 + 𝑑)
−𝑖
• Note that P0 would be a vector of prices for multiple services or rate schedules; and that this simplifiedcalculation assumes a uniform annual commodity) charge.
RPI-X Insights
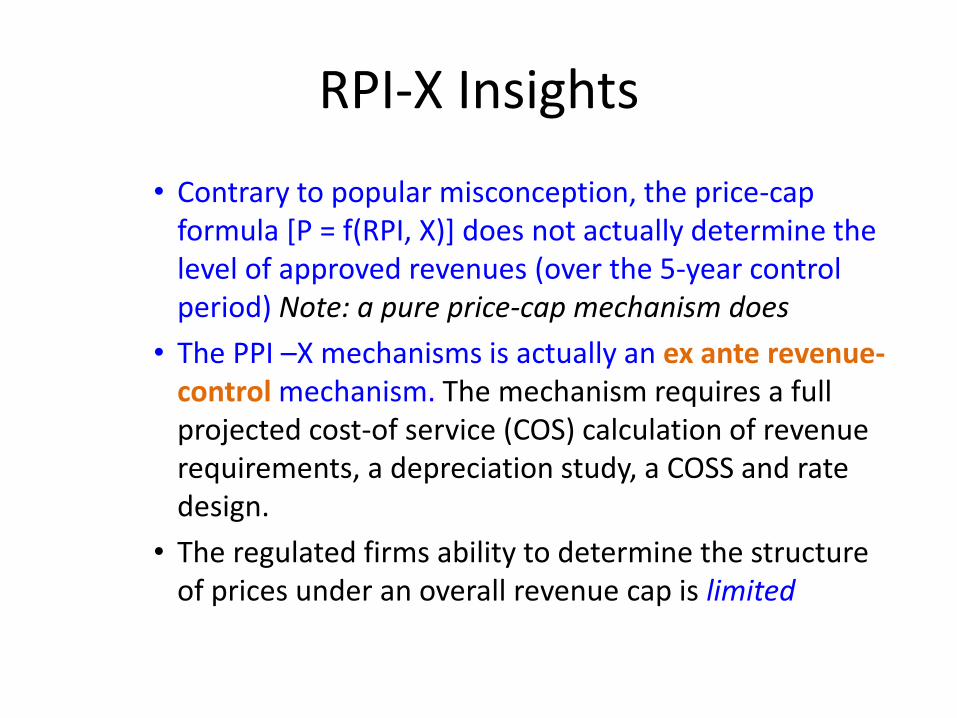
• Contrary to popular misconception, the price-cap formula [P = f(RPI, X)] does not actually determine the level of approved revenues (over the 5-year control period) Note: a pure price-cap mechanism does
• The PPI –X mechanisms is actually an ex ante revenue-control mechanism. The mechanism requires a full projected cost-of service (COS) calculation of revenue requirements, a depreciation study, a COSS and rate design.
• The regulated firms ability to determine the structure of prices under an overall revenue cap is limited
UK(United Kingdom) Price-CapImplementation Issues
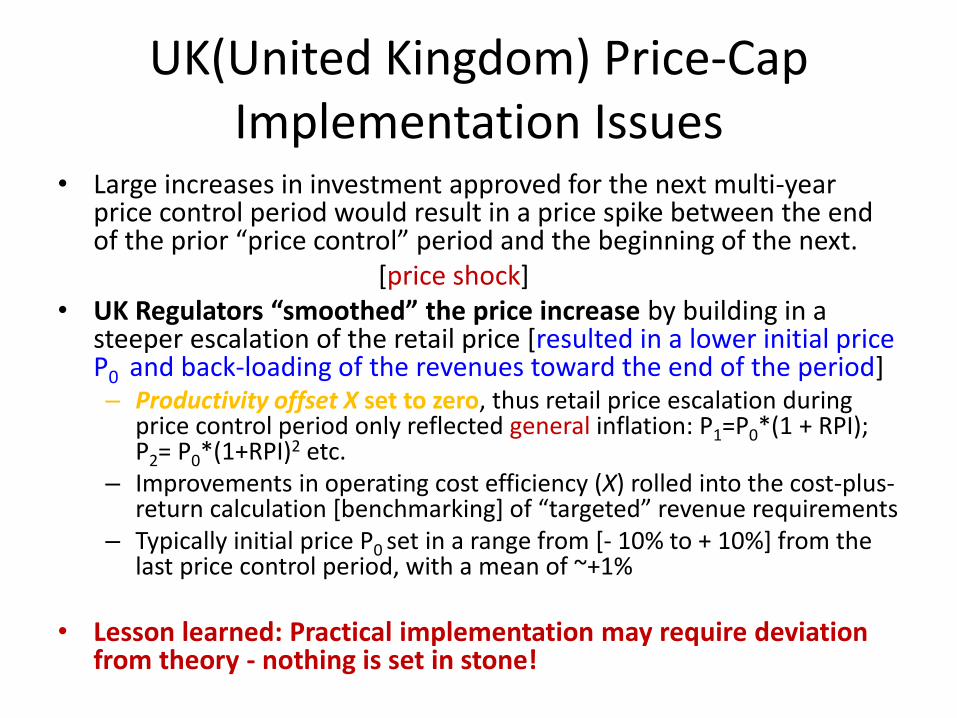
• Large increases in investment approved for the next multi-year price control period would result in a price spike between the end of the prior “price control” period and the beginning of the next.
[price shock]• UK Regulators “smoothed” the price increase by building in a
steeper escalation of the retail price [resulted in a lower initial price P0 and back-loading of the revenues toward the end of the period]– Productivity offset X set to zero, thus retail price escalation during
price control period only reflected general inflation: P1=P0*(1 + RPI); P2= P0*(1+RPI)2 etc.
– Improvements in operating cost efficiency (X) rolled into the cost-plus-return calculation [benchmarking] of “targeted” revenue requirements
– Typically initial price P0 set in a range from [- 10% to + 10%] from the last price control period, with a mean of ~+1%
• Lesson learned: Practical implementation may require deviation from theory - nothing is set in stone!
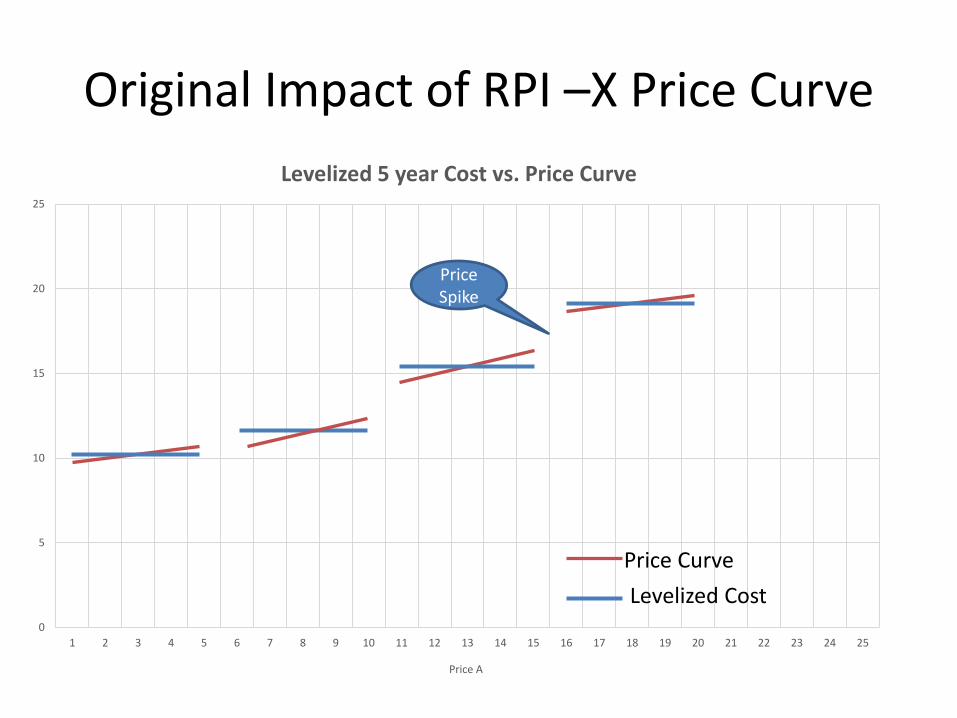
Original Impact of RPI –X Price Curve
0
5
10
15
20
25
1 2 3 4 5 6 7 8 9 10 11 12 13 14 15 16 17 18 19 20 21 22 23 24 25
Levelized 5 year Cost vs. Price Curve
Price A
Levelized Cost
Price Curve
Price Spike
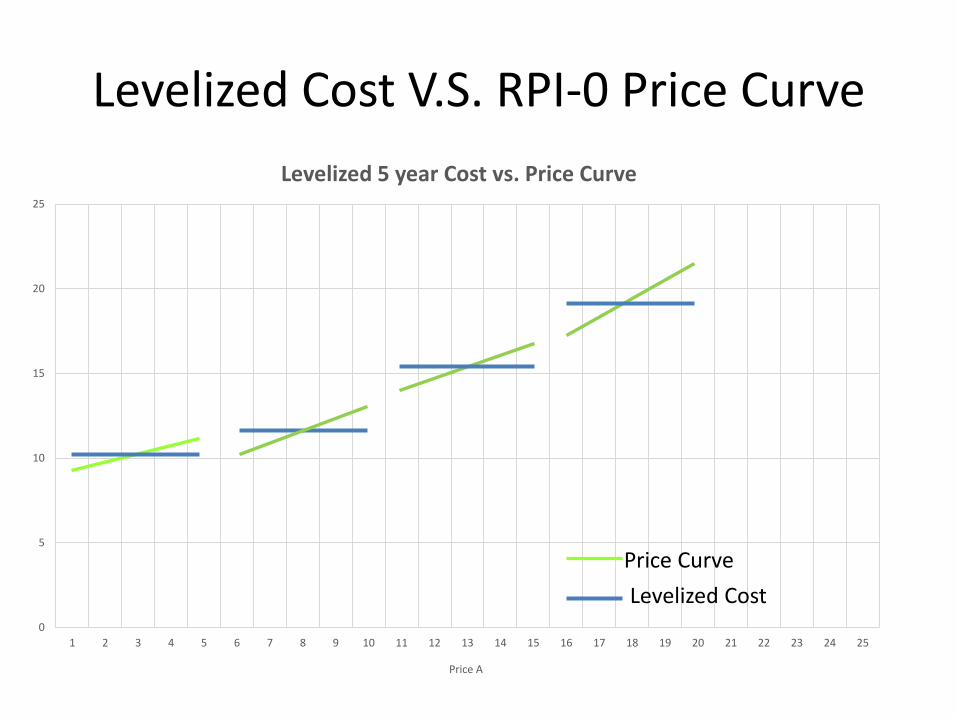
Levelized Cost V.S. RPI-0 Price Curve
0
5
10
15
20
25
1 2 3 4 5 6 7 8 9 10 11 12 13 14 15 16 17 18 19 20 21 22 23 24 25
Levelized 5 year Cost vs. Price Curve
Price A
Levelized Cost
Price Curve
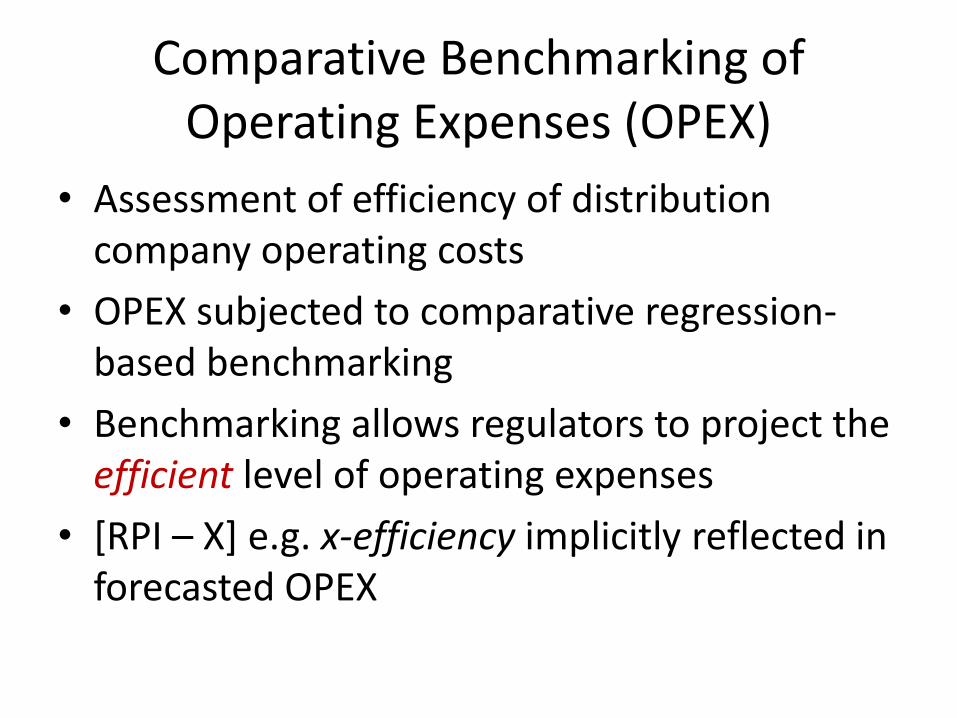
Comparative Benchmarking of Operating Expenses (OPEX)
• Assessment of efficiency of distribution company operating costs
• OPEX subjected to comparative regression-based benchmarking
• Benchmarking allows regulators to project the efficient level of operating expenses
• [RPI – X] e.g. x-efficiency implicitly reflected in forecasted OPEX
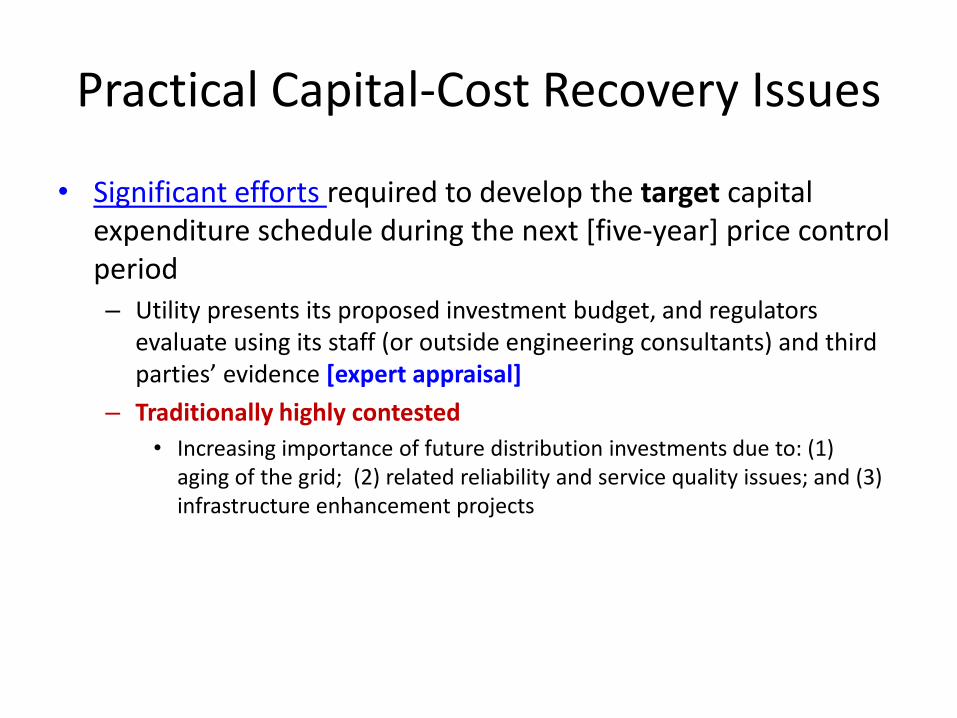
Practical Capital-Cost Recovery Issues
• Significant efforts required to develop the target capital expenditure schedule during the next [five-year] price control period– Utility presents its proposed investment budget, and regulators
evaluate using its staff (or outside engineering consultants) and third parties’ evidence [expert appraisal]
– Traditionally highly contested
• Increasing importance of future distribution investments due to: (1) aging of the grid; (2) related reliability and service quality issues; and (3) infrastructure enhancement projects
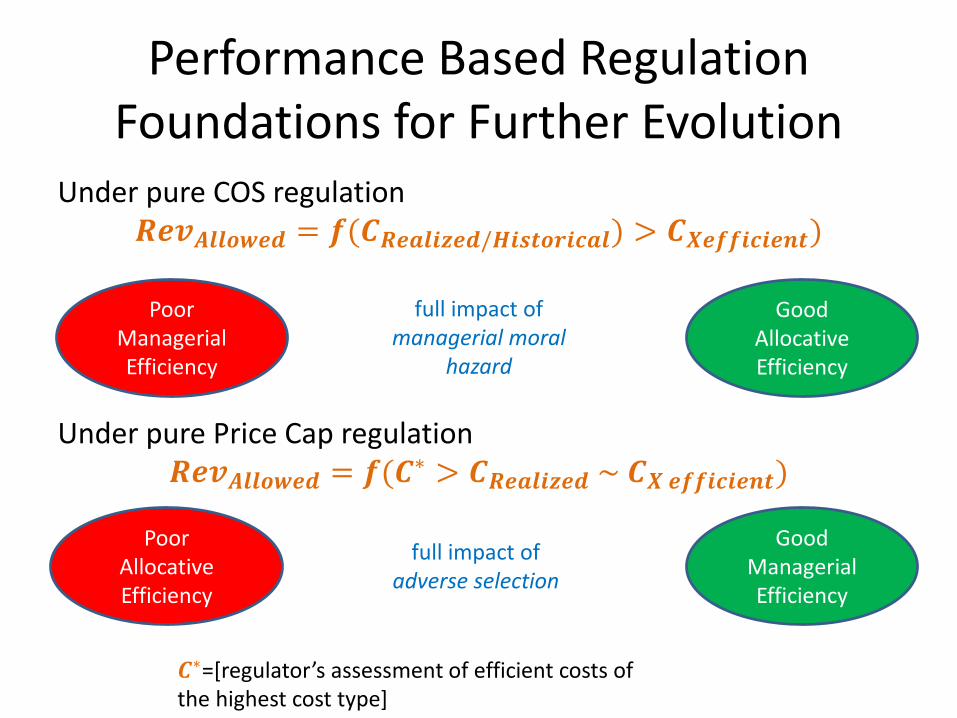
Performance Based RegulationFoundations for Further Evolution
Under pure COS regulation𝑹𝒆𝒗𝑨𝒍𝒍𝒐𝒘𝒆𝒅 = 𝒇(𝑪𝑹𝒆𝒂𝒍𝒊𝒛𝒆𝒅/𝑯𝒊𝒔𝒕𝒐𝒓𝒊𝒄𝒂𝒍) > 𝑪𝑿𝒆𝒇𝒇𝒊𝒄𝒊𝒆𝒏𝒕)
Under pure Price Cap regulation𝑹𝒆𝒗𝑨𝒍𝒍𝒐𝒘𝒆𝒅 = 𝒇(𝑪
∗ > 𝑪𝑹𝒆𝒂𝒍𝒊𝒛𝒆𝒅 ~ 𝑪𝑿 𝒆𝒇𝒇𝒊𝒄𝒊𝒆𝒏𝒕)
full impact of managerial moral
hazard
full impact of adverse selection
𝑪∗=[regulator’s assessment of efficient costs of the highest cost type]
Good Allocative Efficiency
Good Managerial Efficiency
Poor Managerial Efficiency
Poor Allocative Efficiency
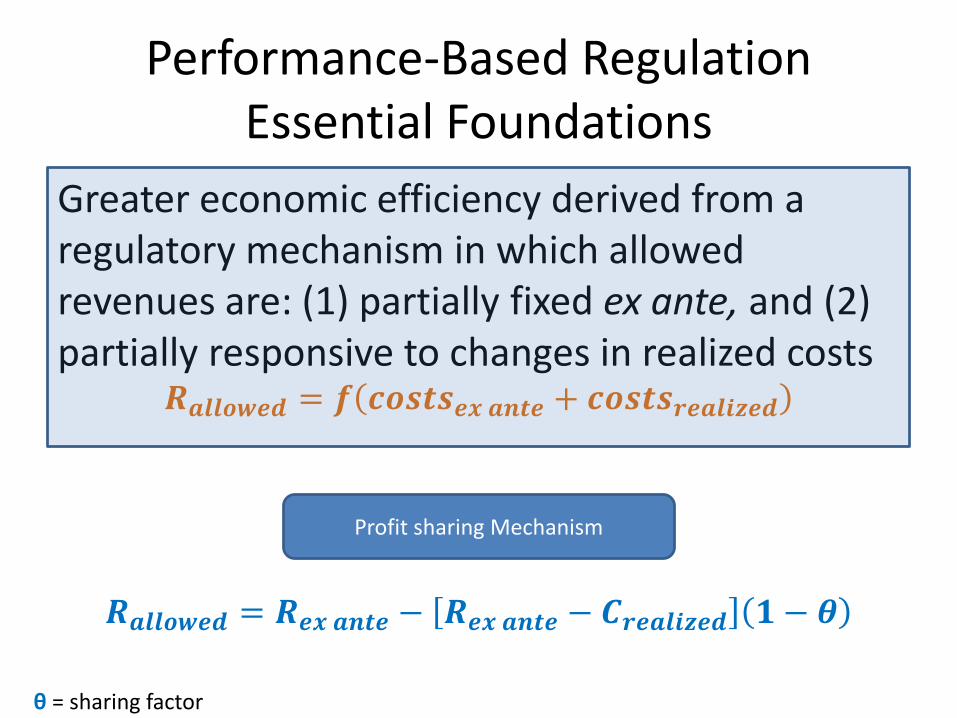
Performance-Based RegulationEssential Foundations
Greater economic efficiency derived from a regulatory mechanism in which allowed revenues are: (1) partially fixed ex ante, and (2) partially responsive to changes in realized costs
𝑹𝒂𝒍𝒍𝒐𝒘𝒆𝒅 = 𝒇 𝒄𝒐𝒔𝒕𝒔𝒆𝒙 𝒂𝒏𝒕𝒆 + 𝒄𝒐𝒔𝒕𝒔𝒓𝒆𝒂𝒍𝒊𝒛𝒆𝒅
𝑹𝒂𝒍𝒍𝒐𝒘𝒆𝒅 = 𝑹𝒆𝒙 𝒂𝒏𝒕𝒆 − 𝑹𝒆𝒙 𝒂𝒏𝒕𝒆 − 𝑪𝒓𝒆𝒂𝒍𝒊𝒛𝒆𝒅 𝟏 − 𝜽
Profit sharing Mechanism
θ = sharing factor
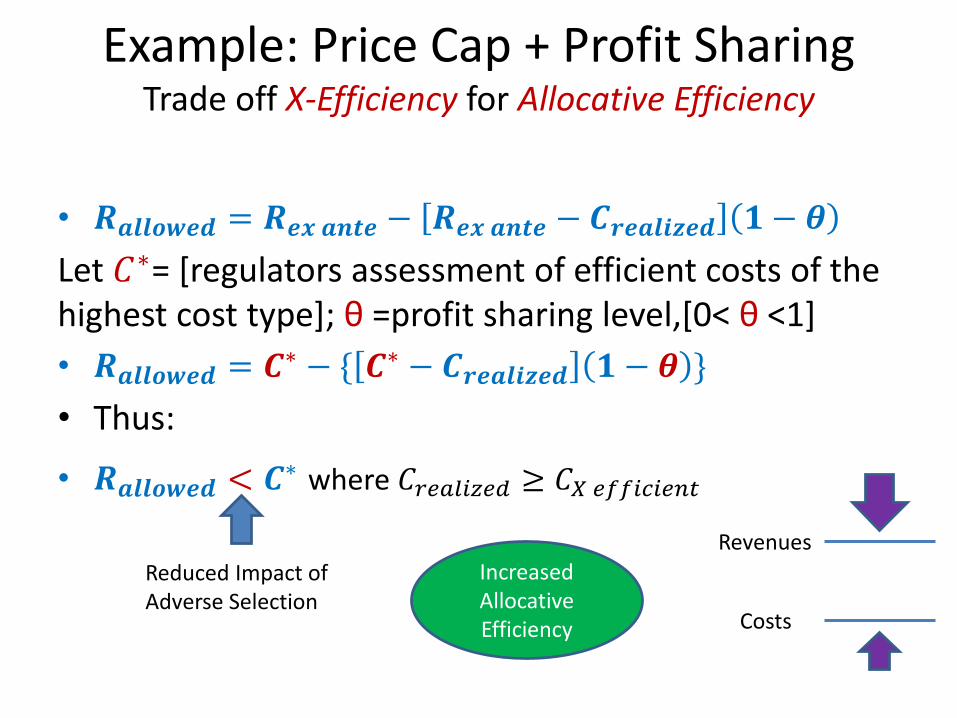
Example: Price Cap + Profit SharingTrade off X-Efficiency for Allocative Efficiency
• 𝑹𝒂𝒍𝒍𝒐𝒘𝒆𝒅 = 𝑹𝒆𝒙 𝒂𝒏𝒕𝒆 − 𝑹𝒆𝒙 𝒂𝒏𝒕𝒆 − 𝑪𝒓𝒆𝒂𝒍𝒊𝒛𝒆𝒅 𝟏 − 𝜽
Let 𝐶∗= [regulators assessment of efficient costs of the highest cost type]; θ =profit sharing level,[0< θ <1]
• 𝑹𝒂𝒍𝒍𝒐𝒘𝒆𝒅 = 𝑪∗ − { 𝑪∗ − 𝑪𝒓𝒆𝒂𝒍𝒊𝒛𝒆𝒅 𝟏 − 𝜽 }
• Thus:
• 𝑹𝒂𝒍𝒍𝒐𝒘𝒆𝒅 < 𝑪∗ where 𝐶𝑟𝑒𝑎𝑙𝑖𝑧𝑒𝑑 ≥ 𝐶𝑋 𝑒𝑓𝑓𝑖𝑐𝑖𝑒𝑛𝑡
Reduced Impact of Adverse Selection
Increased Allocative Efficiency Costs
Revenues
Performance-Based RegulationEssential Foundations
• Even better economic efficiencies may be obtained with a sliding-scale menu of profit-sharing “contracts”
• Prices are partially fixed ex ante, and partially responsive to realized costs
• The utility “picks” a contract from the menu by filing their ex ante forecast. The ratio of their request to the regulator’s base estimate determines the allowed revenue, and the level of sharing
• The menu of contracts satisfies the incentive compatibility constraint– Utilities with low cost opportunities choose a high profit-sharing
contract, and those with high cost opportunities choose a low profit-sharing contract
– For any realized cost, the utility earns the most income when its filed forecast equals the realized cost
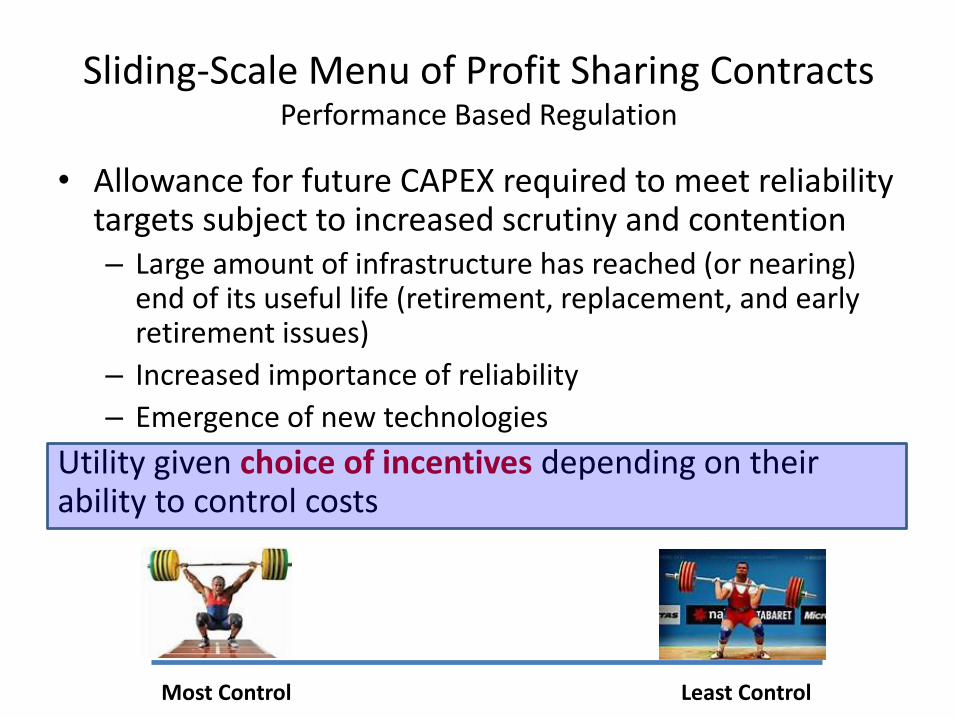
Sliding-Scale Menu of Profit Sharing ContractsPerformance Based Regulation
• Allowance for future CAPEX required to meet reliability targets subject to increased scrutiny and contention– Large amount of infrastructure has reached (or nearing)
end of its useful life (retirement, replacement, and early retirement issues)
– Increased importance of reliability
– Emergence of new technologies
Utility given choice of incentives depending on their ability to control costs
Least ControlMost Control
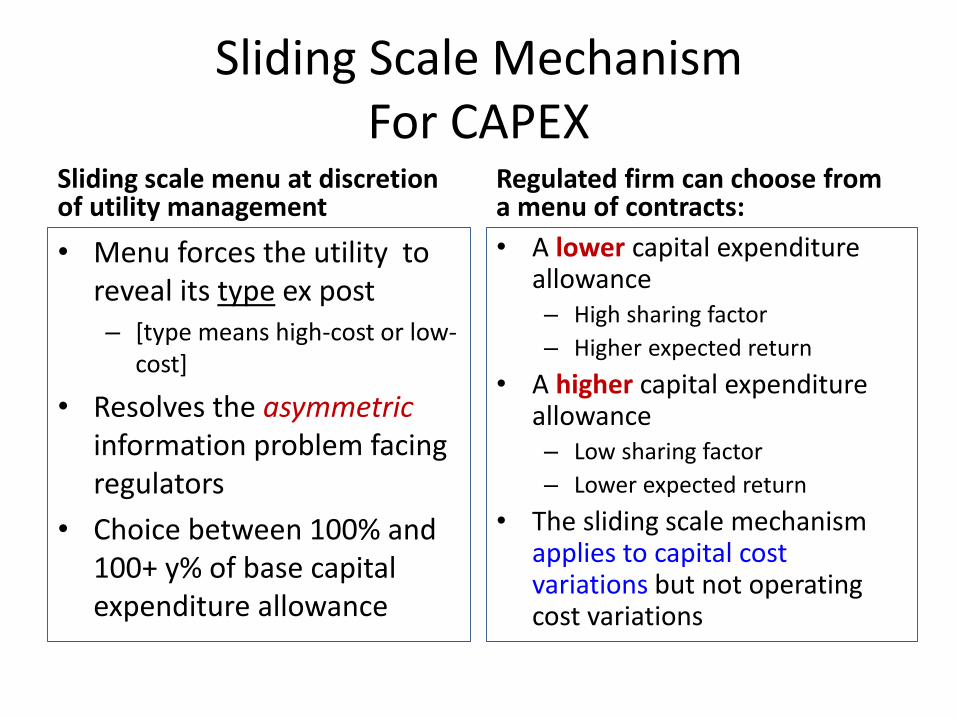
Sliding Scale MechanismFor CAPEX
Sliding scale menu at discretion of utility management
• Menu forces the utility to reveal its type ex post– [type means high-cost or low-
cost]
• Resolves the asymmetric information problem facing regulators
• Choice between 100% and 100+ y% of base capital expenditure allowance
Regulated firm can choose from a menu of contracts:
• A lower capital expenditure allowance– High sharing factor
– Higher expected return
• A higher capital expenditure allowance– Low sharing factor
– Lower expected return
• The sliding scale mechanism applies to capital cost variations but not operating cost variations
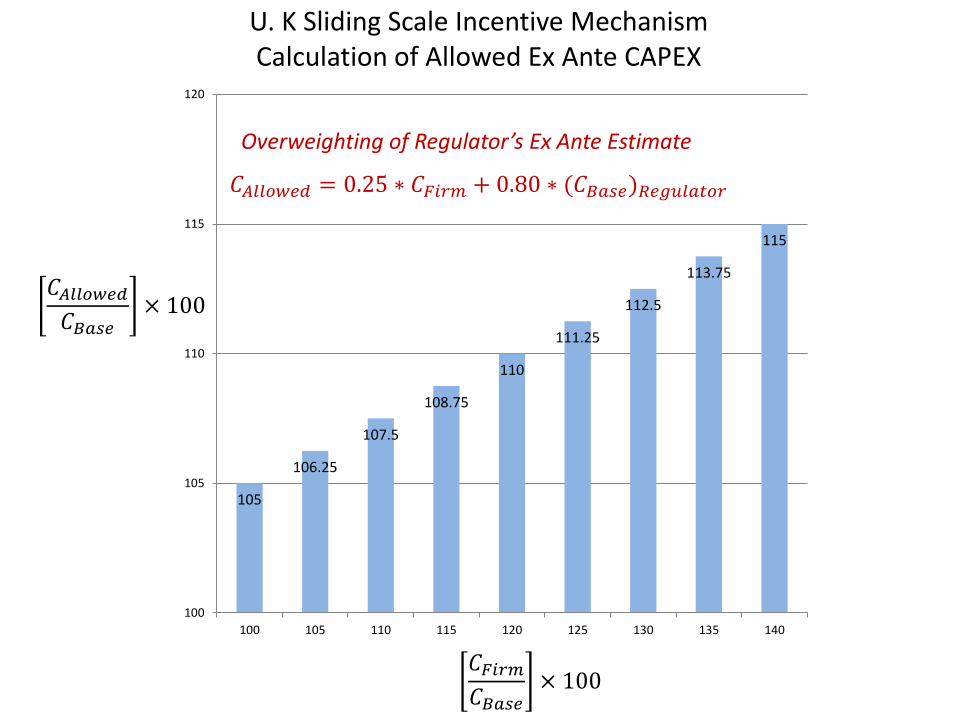
105
106.25
107.5
108.75
110
111.25
112.5
113.75
115
100
105
110
115
120
100 105 110 115 120 125 130 135 140
𝐶𝐹𝑖𝑟𝑚𝐶𝐵𝑎𝑠𝑒
× 100
U. K Sliding Scale Incentive MechanismCalculation of Allowed Ex Ante CAPEX
𝐶𝐴𝑙𝑙𝑜𝑤𝑒𝑑 = 0.25 ∗ 𝐶𝐹𝑖𝑟𝑚 + 0.80 ∗ (𝐶𝐵𝑎𝑠𝑒)𝑅𝑒𝑔𝑢𝑙𝑎𝑡𝑜𝑟
𝐶𝐴𝑙𝑙𝑜𝑤𝑒𝑑𝐶𝐵𝑎𝑠𝑒
× 100
Overweighting of Regulator’s Ex Ante Estimate
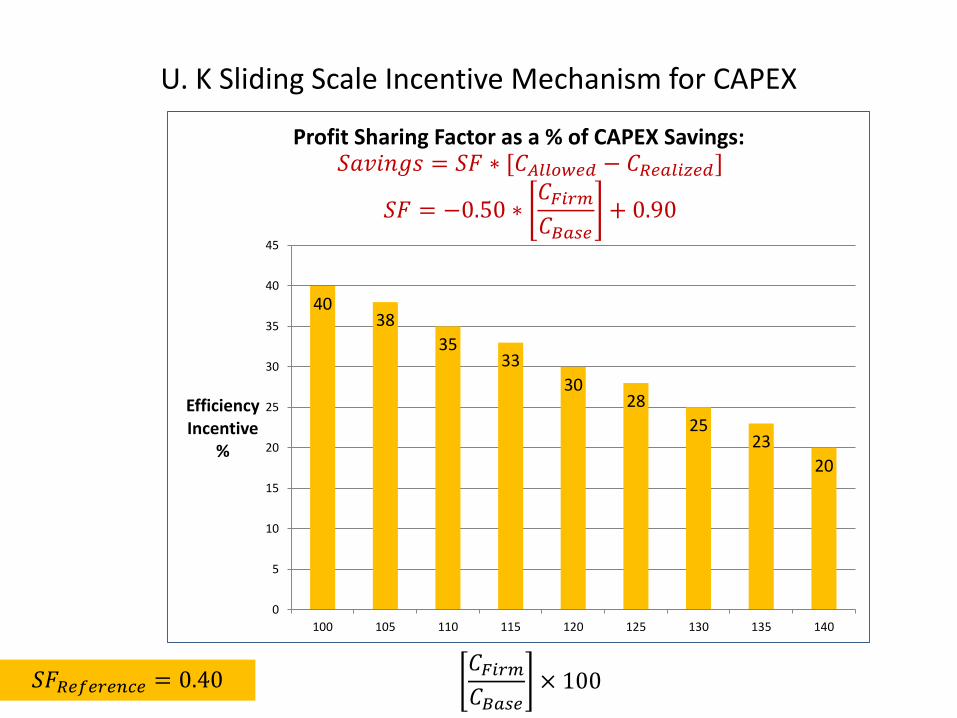
4038
3533
3028
2523
20
0
5
10
15
20
25
30
35
40
45
100 105 110 115 120 125 130 135 140
Efficiency Incentive
%
Profit Sharing Factor as a % of CAPEX Savings:
U. K Sliding Scale Incentive Mechanism for CAPEX
𝐶𝐹𝑖𝑟𝑚𝐶𝐵𝑎𝑠𝑒
× 100
𝑆𝑎𝑣𝑖𝑛𝑔𝑠 = 𝑆𝐹 ∗ [𝐶𝐴𝑙𝑙𝑜𝑤𝑒𝑑 − 𝐶𝑅𝑒𝑎𝑙𝑖𝑧𝑒𝑑]
𝑆𝐹 = −0.50 ∗𝐶𝐹𝑖𝑟𝑚𝐶𝐵𝑎𝑠𝑒
+ 0.90
𝑆𝐹𝑅𝑒𝑓𝑒𝑟𝑒𝑛𝑐𝑒 = 0.40
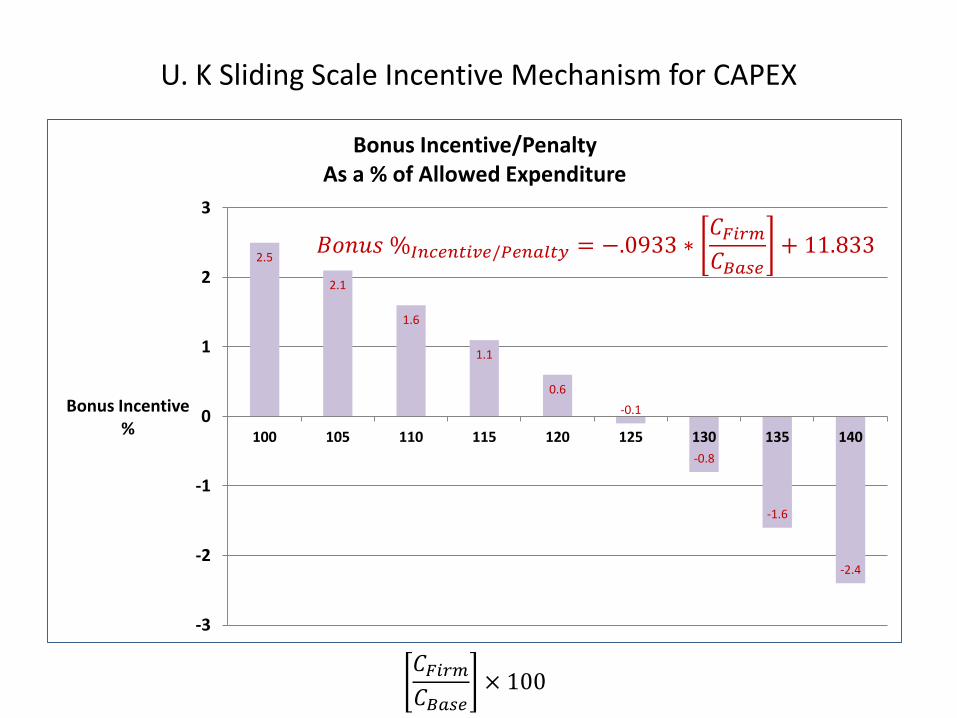
2.5
2.1
1.6
1.1
0.6
-0.1
-0.8
-1.6
-2.4
-3
-2
-1
0
1
2
3
100 105 110 115 120 125 130 135 140
Bonus Incentive%
Bonus Incentive/PenaltyAs a % of Allowed Expenditure
U. K Sliding Scale Incentive Mechanism for CAPEX
𝐶𝐹𝑖𝑟𝑚𝐶𝐵𝑎𝑠𝑒
× 100
𝐵𝑜𝑛𝑢𝑠 %𝐼𝑛𝑐𝑒𝑛𝑡𝑖𝑣𝑒/𝑃𝑒𝑛𝑎𝑙𝑡𝑦 = −.0933 ∗𝐶𝐹𝑖𝑟𝑚𝐶𝐵𝑎𝑠𝑒
+ 11.833
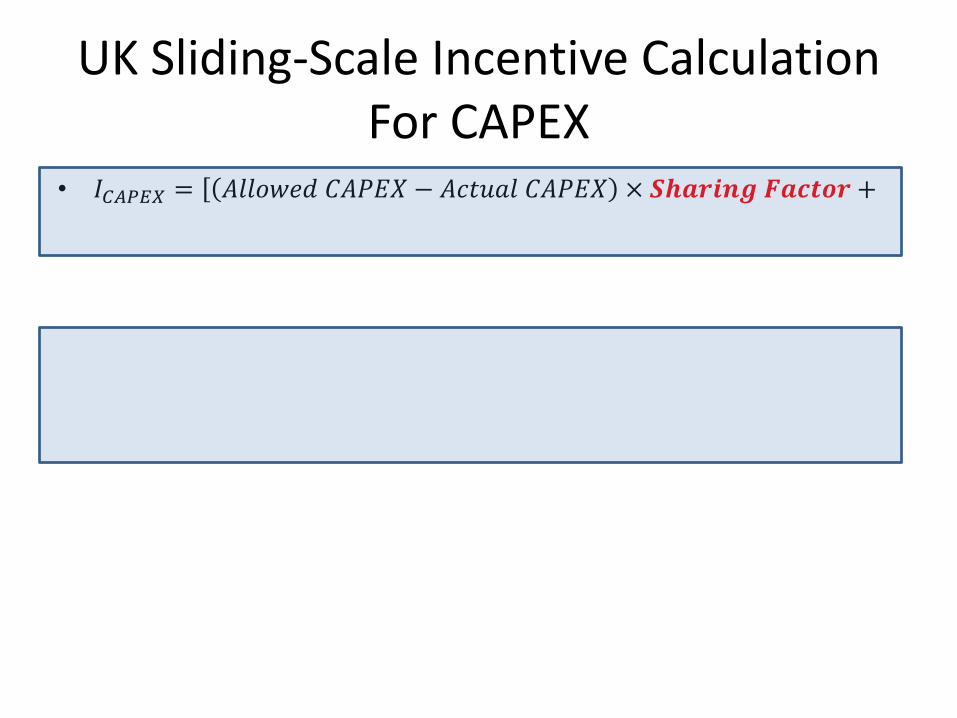
UK Sliding-Scale Incentive CalculationFor CAPEX
• 𝐼𝐶𝐴𝑃𝐸𝑋 = [ 𝐴𝑙𝑙𝑜𝑤𝑒𝑑 𝐶𝐴𝑃𝐸𝑋 − 𝐴𝑐𝑡𝑢𝑎𝑙 𝐶𝐴𝑃𝐸𝑋 × 𝑺𝒉𝒂𝒓𝒊𝒏𝒈 𝑭𝒂𝒄𝒕𝒐𝒓 +
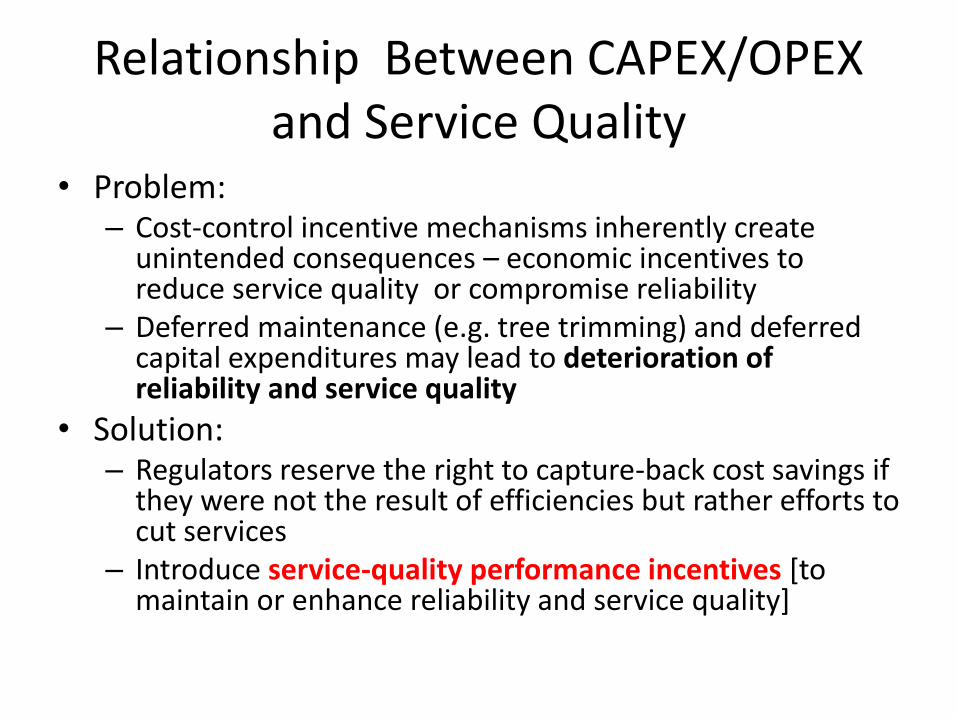
Relationship Between CAPEX/OPEX and Service Quality
• Problem:– Cost-control incentive mechanisms inherently create
unintended consequences – economic incentives to reduce service quality or compromise reliability
– Deferred maintenance (e.g. tree trimming) and deferred capital expenditures may lead to deterioration of reliability and service quality
• Solution:– Regulators reserve the right to capture-back cost savings if
they were not the result of efficiencies but rather efforts to cut services
– Introduce service-quality performance incentives [to maintain or enhance reliability and service quality]
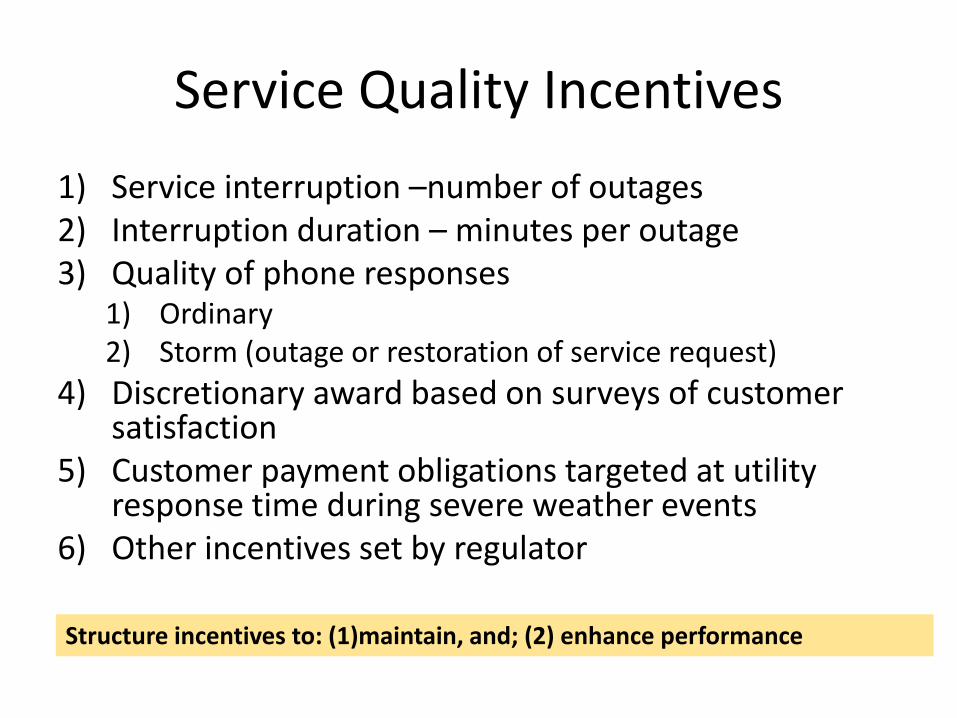
Service Quality Incentives
1) Service interruption –number of outages2) Interruption duration – minutes per outage3) Quality of phone responses
1) Ordinary 2) Storm (outage or restoration of service request)
4) Discretionary award based on surveys of customer satisfaction
5) Customer payment obligations targeted at utility response time during severe weather events
6) Other incentives set by regulator
Structure incentives to: (1)maintain, and; (2) enhance performance
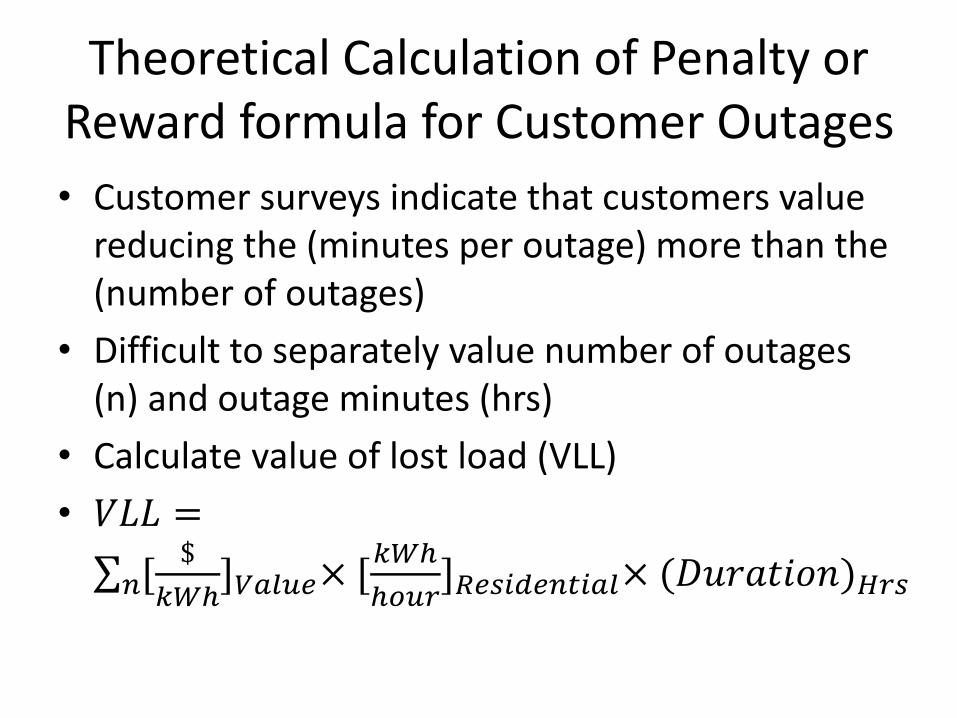
Theoretical Calculation of Penalty or Reward formula for Customer Outages
• Customer surveys indicate that customers value reducing the (minutes per outage) more than the (number of outages)
• Difficult to separately value number of outages (n) and outage minutes (hrs)
• Calculate value of lost load (VLL)
• 𝑉𝐿𝐿 =
𝑛[$
𝑘𝑊ℎ]𝑉𝑎𝑙𝑢𝑒× [
𝑘𝑊ℎ
ℎ𝑜𝑢𝑟]𝑅𝑒𝑠𝑖𝑑𝑒𝑛𝑡𝑖𝑎𝑙× (𝐷𝑢𝑟𝑎𝑡𝑖𝑜𝑛)𝐻𝑟𝑠
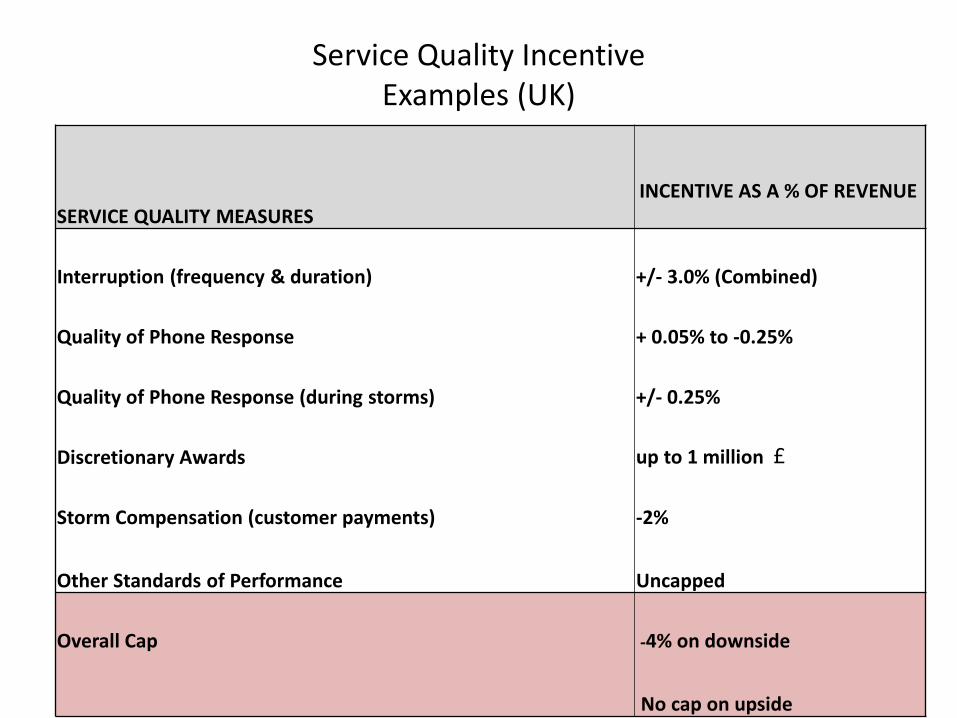
Service Quality IncentiveExamples (UK)
SERVICE QUALITY MEASURESINCENTIVE AS A % OF REVENUE
Interruption (frequency & duration) +/- 3.0% (Combined)
Quality of Phone Response + 0.05% to -0.25%
Quality of Phone Response (during storms) +/- 0.25%
Discretionary Awards up to 1 million £
Storm Compensation (customer payments) -2%
Other Standards of Performance Uncapped
Overall Cap -4% on downside
No cap on upside
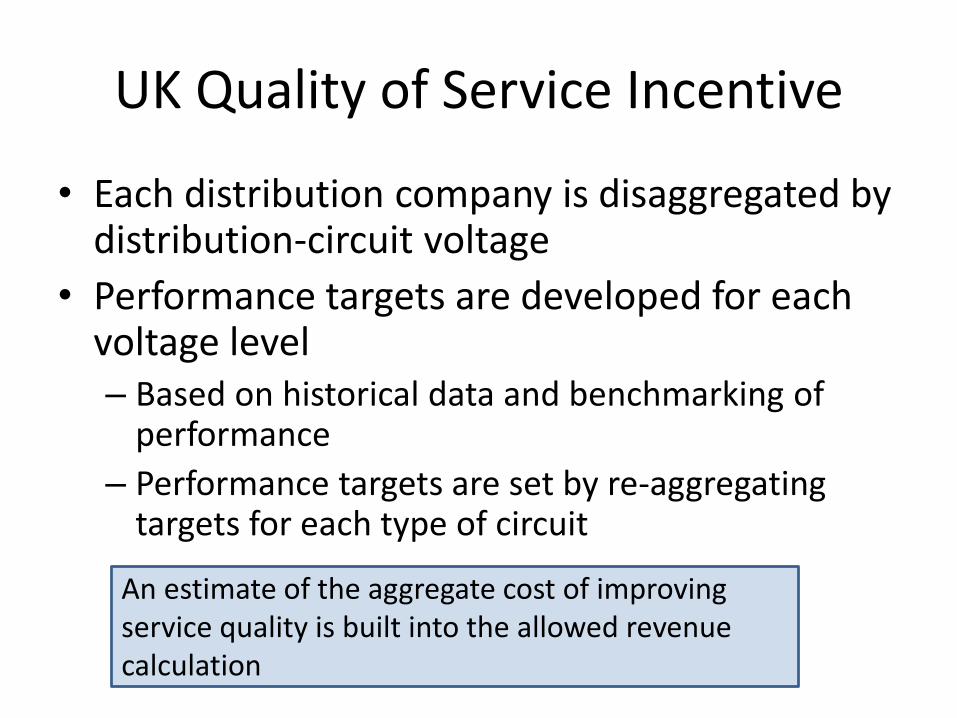
UK Quality of Service Incentive
• Each distribution company is disaggregated by distribution-circuit voltage
• Performance targets are developed for each voltage level – Based on historical data and benchmarking of
performance
– Performance targets are set by re-aggregating targets for each type of circuit
An estimate of the aggregate cost of improving service quality is built into the allowed revenue calculation
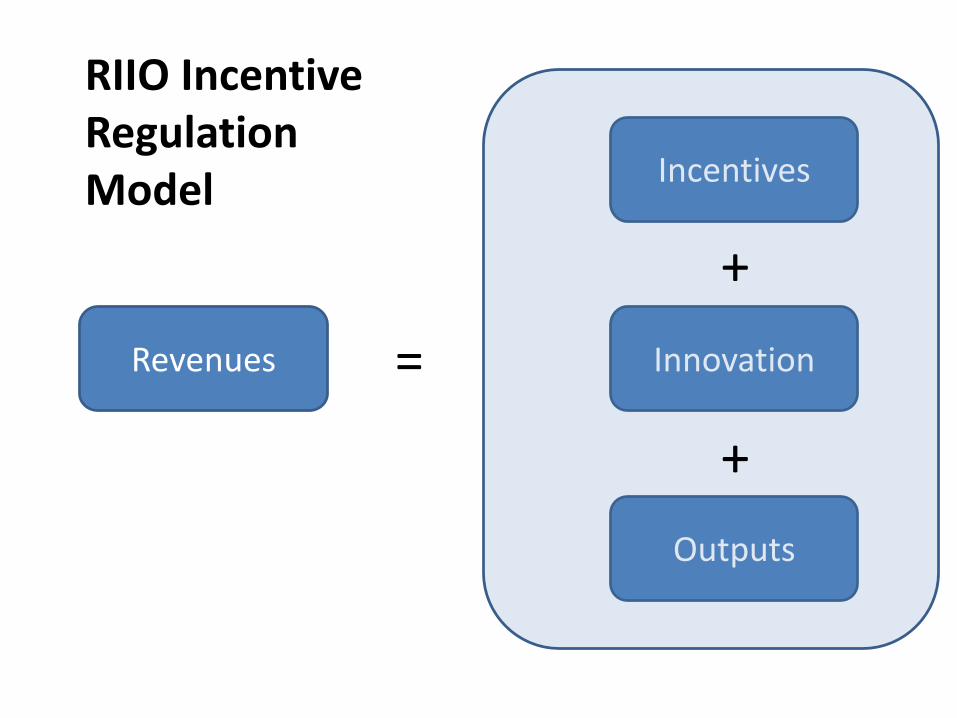
Revenues
Incentives
Outputs
Innovation
RIIO Incentive Regulation Model
+
+
=
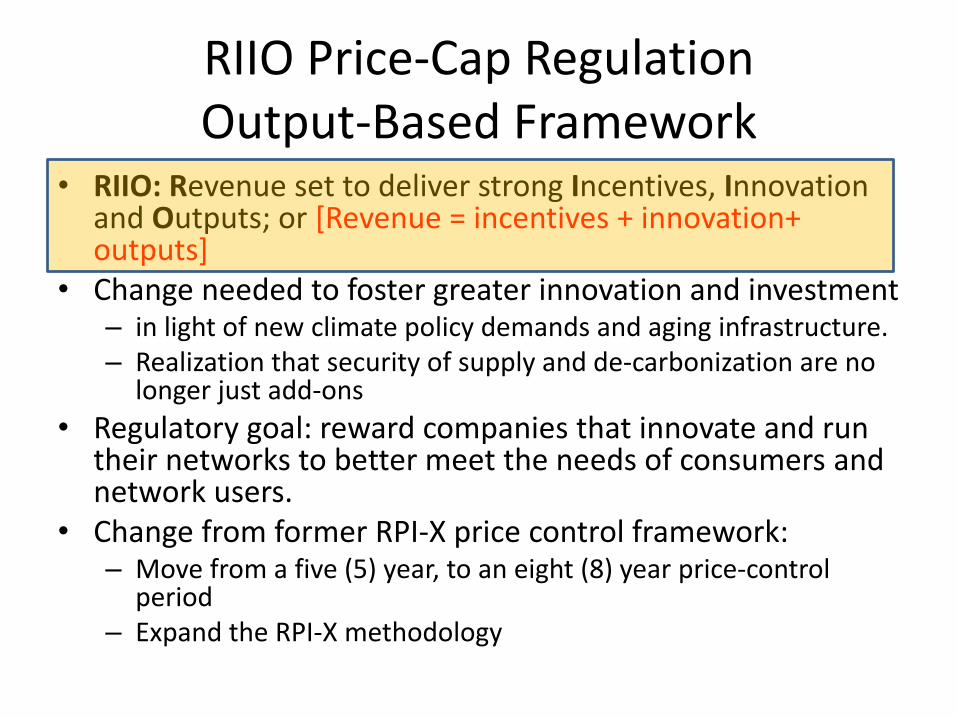
RIIO Price-Cap RegulationOutput-Based Framework
• RIIO: Revenue set to deliver strong Incentives, Innovation and Outputs; or [Revenue = incentives + innovation+ outputs]
• Change needed to foster greater innovation and investment – in light of new climate policy demands and aging infrastructure.– Realization that security of supply and de-carbonization are no
longer just add-ons
• Regulatory goal: reward companies that innovate and run their networks to better meet the needs of consumers and network users.
• Change from former RPI-X price control framework:– Move from a five (5) year, to an eight (8) year price-control
period– Expand the RPI-X methodology
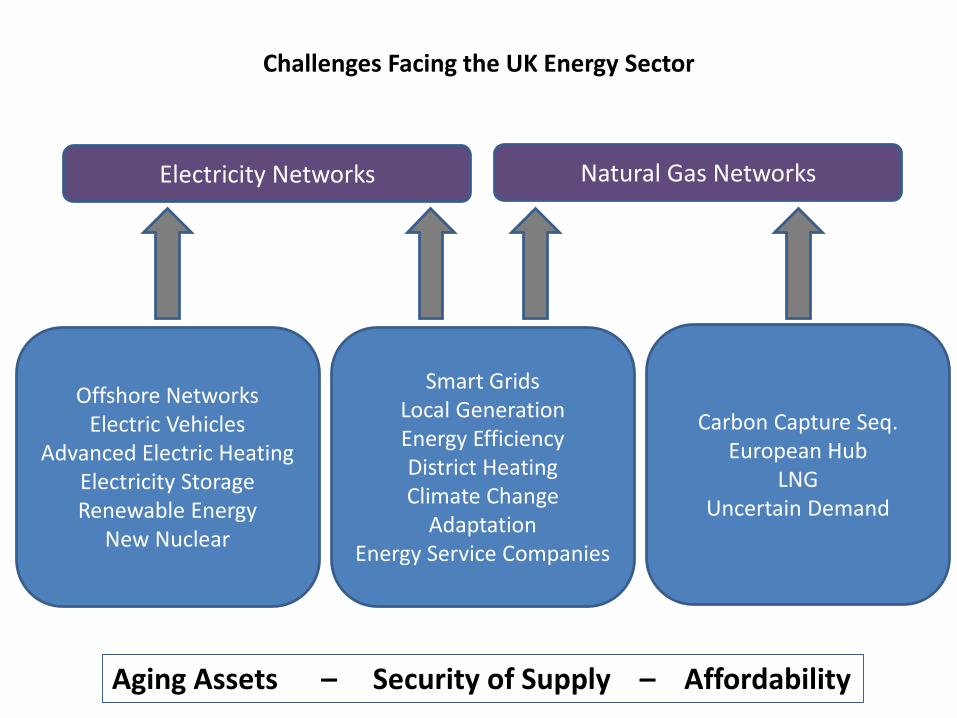
Electricity Networks Natural Gas Networks
Challenges Facing the UK Energy Sector
Offshore NetworksElectric Vehicles
Advanced Electric HeatingElectricity StorageRenewable Energy
New Nuclear
Smart GridsLocal GenerationEnergy EfficiencyDistrict HeatingClimate Change
AdaptationEnergy Service Companies
Carbon Capture Seq.European Hub
LNGUncertain Demand
Aging Assets – Security of Supply – Affordability
RIIO Changes Relationship with Regulators
• Not a price control system set unilaterally by the regulator [as was RPI-X]
• RIIO price controls are the product of negotiated settlements
• Result in regulatory contracts between Ofgemand regulated utilities
Key changes from RPI-X
• Base revenue requirements calculated using forecasts of efficient total expenditures (TOTEX) rather than distinguishing between capital (CAPEX) and operating (OPEX) costs– TOTEX benchmarking uses statistic (regression) models
– Includes both replacement investment and incremental investment
– CAPEX no longer based on engineering analysis
• (TOTEX) presumably balances the goals of reducingcosts and increasing investment, (which are often at odds)
Performance Incentives
• Under RPI-X performance incentives were disconnected from the price review
• Under RIIO, performance incentives are integrated into the review process
– Six outputs are integrated into performance incentives
– Mid-period review
– End of period review
RIIO Output Goals
1. Customer satisfaction
2. Reliable and available network services
3. Safe network services
4. Timely and non-discriminatory network connection and access terms
5. Limited environmental impact
6. Social obligations (that the network companies are required by the government to deliver)
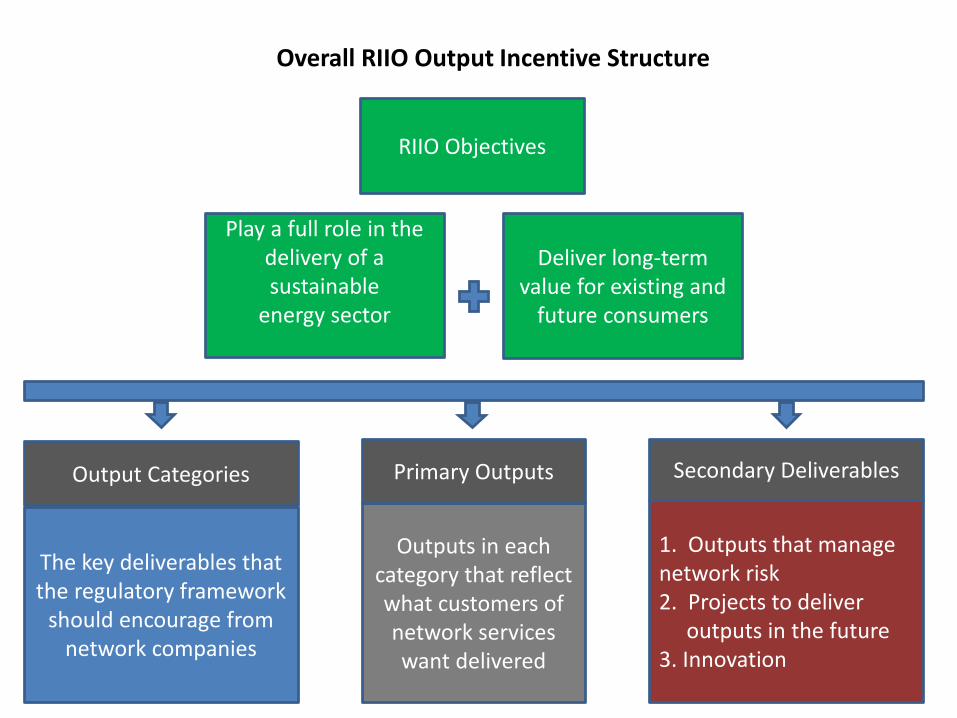
The key deliverables thatthe regulatory framework
should encourage fromnetwork companies
Outputs in eachcategory that reflectwhat customers ofnetwork serviceswant delivered
1. Outputs that manage network risk2. Projects to deliver
outputs in the future3. Innovation
Primary OutputsOutput Categories Secondary Deliverables
RIIO Objectives
Play a full role in thedelivery of a sustainable
energy sector
Deliver long-term value for existing and
future consumers
Overall RIIO Output Incentive Structure
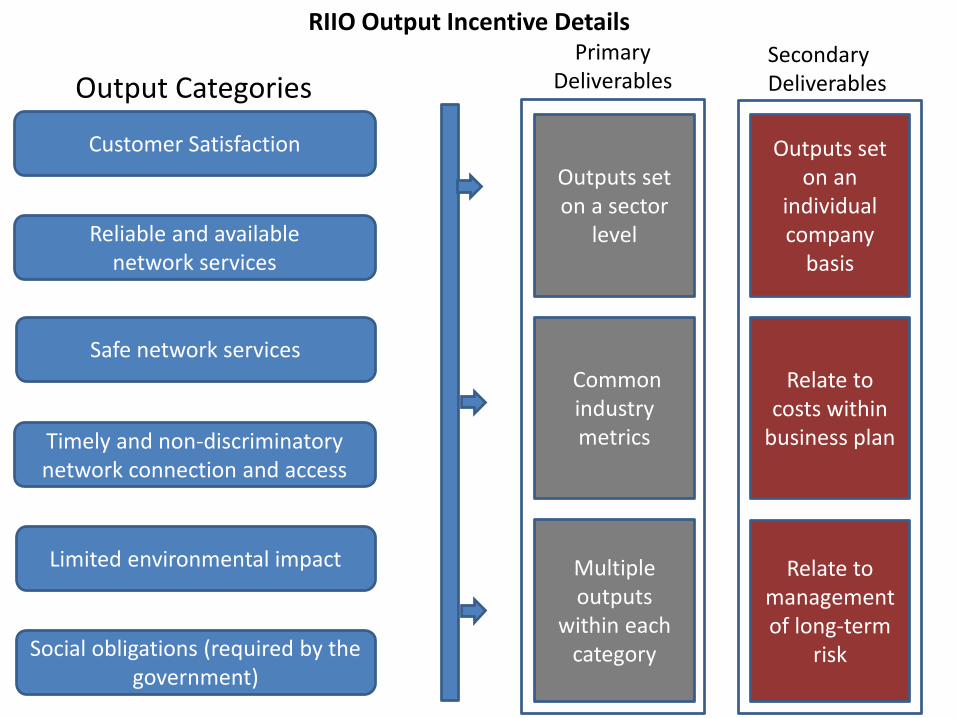
Customer Satisfaction
Reliable and available network services
Safe network services
Timely and non-discriminatory network connection and access
Social obligations (required by the government)
Limited environmental impact
Output CategoriesPrimary
Deliverables
Outputs set on a sector
level
SecondaryDeliverables
Common industry metrics
Multiple outputs
within each category
Outputs set on an
individual company
basis
Relate to costs within
business plan
Relate to management of long-term
risk
RIIO Output Incentive Details
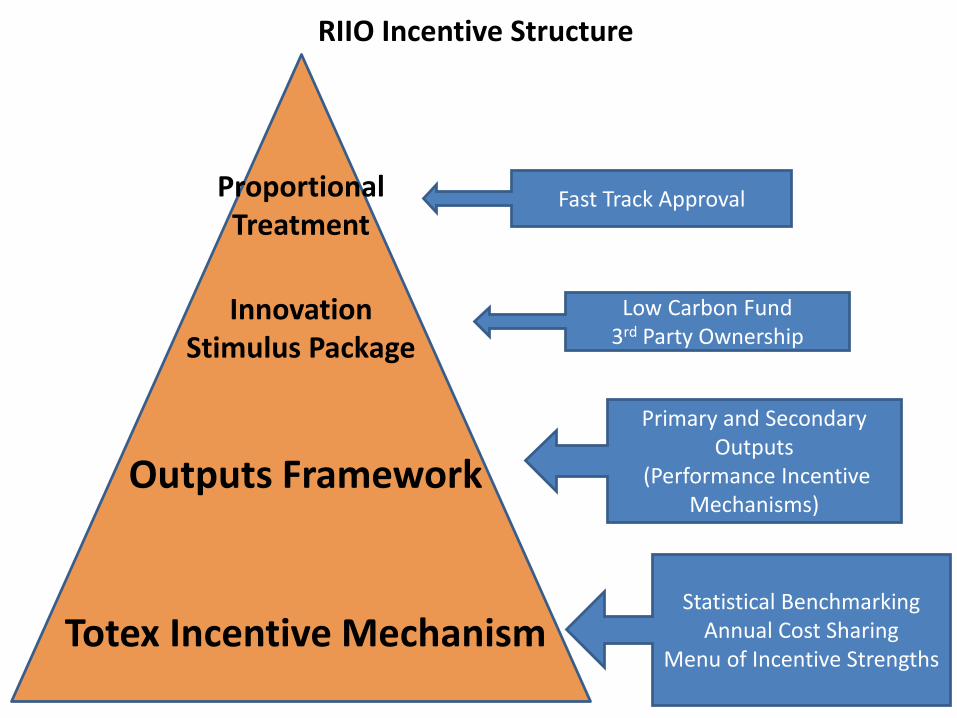
Totex Incentive Mechanism
Outputs Framework
ProportionalTreatment
Low Carbon Fund3rd Party Ownership
Primary and Secondary Outputs
(Performance Incentive Mechanisms)
Statistical BenchmarkingAnnual Cost Sharing
Menu of Incentive Strengths
RIIO Incentive Structure
Fast Track Approval
InnovationStimulus Package
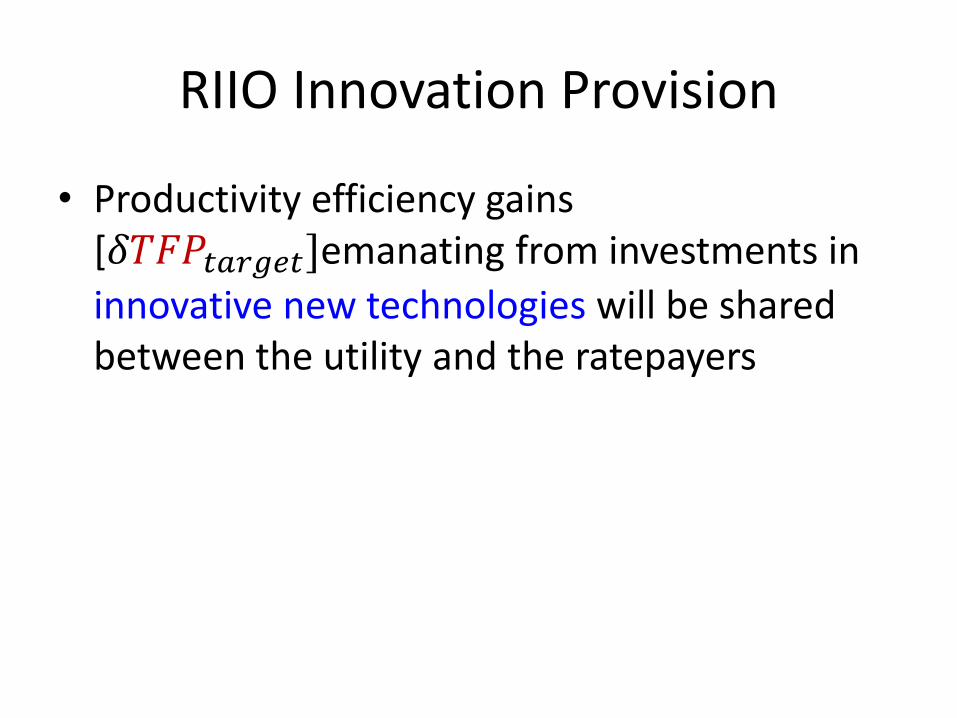
RIIO Innovation Provision
• Productivity efficiency gains [𝛿𝑇𝐹𝑃𝑡𝑎𝑟𝑔𝑒𝑡]emanating from investments in
innovative new technologies will be shared between the utility and the ratepayers
Low Carbon Networks FundInnovation Grants
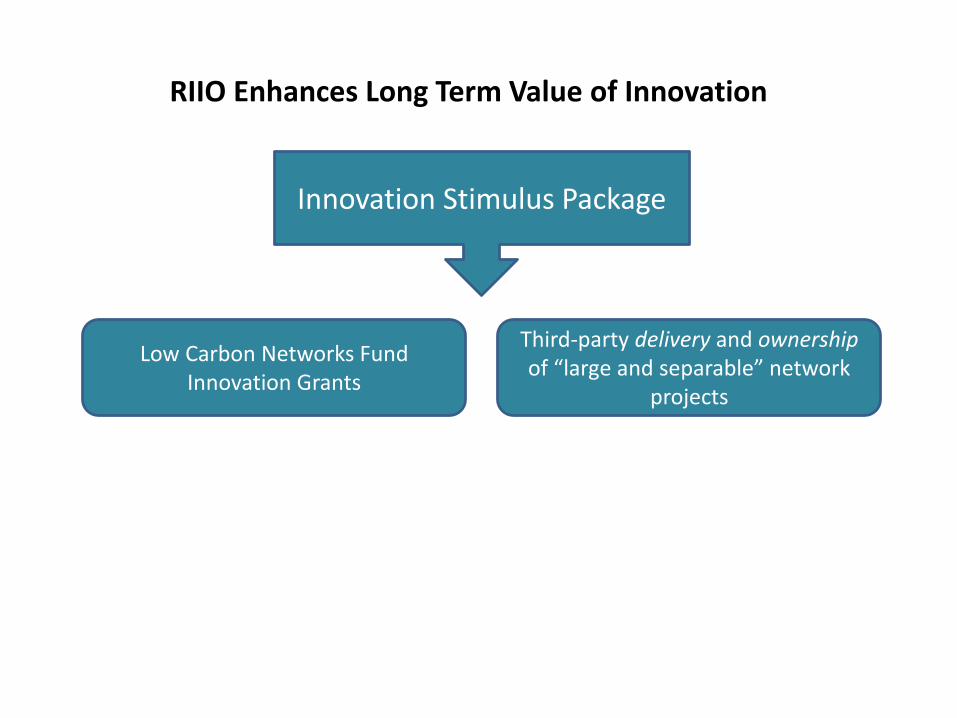
Innovation Stimulus Package
Third-party delivery and ownershipof “large and separable” network
projects
RIIO Enhances Long Term Value of Innovation
Utility Business Plan
• The utility files a business plan (cost-benefit analysis) covering the six performance outputs
• Funding included in the price control calculation [if business plans are well justified]
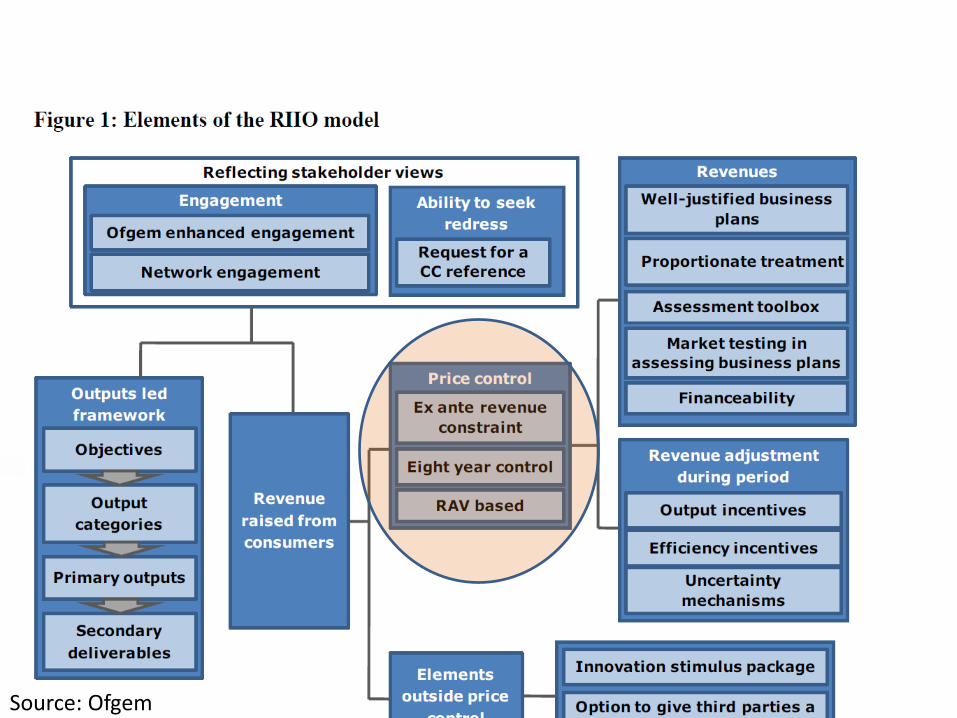
Source: Ofgem
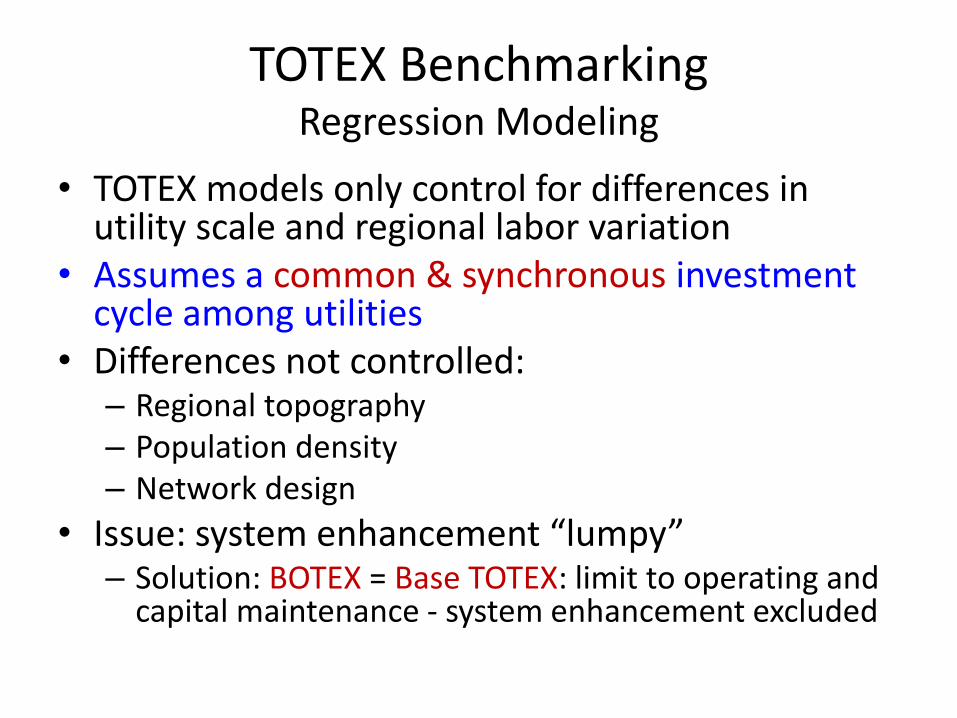
TOTEX BenchmarkingRegression Modeling
• TOTEX models only control for differences in utility scale and regional labor variation
• Assumes a common & synchronous investment cycle among utilities
• Differences not controlled:– Regional topography– Population density– Network design
• Issue: system enhancement “lumpy” – Solution: BOTEX = Base TOTEX: limit to operating and
capital maintenance - system enhancement excluded
MPSC Staff Observations
• Michigan has a long history of cost-plus ratemaking and the current rate-setting process is well developed
• The UK’s RIIO model of PBR is innovative and highly aggressive in attempting to extract optimal x-efficiencies and output-based objectives
• The RIIO PBR model is applied to a utility industry that has been restructured to exclude competitive segments, and Michigan is likely to continue with a vertically-integrated regulated utility structure [significantly complicates RIIO type PBR}
• Full implementation of a RIIO type PBR in Michigan would entail significant cost and human resources
• Current direction of the electric utility industry in Michigan will continue toward further grid automation, expanding renewable energy, distributed generation, and ultimately a high level of de-carbonization
• Output based PBR mechanism such as Performance Incentive Mechanisms (PIM’s) may be considered as a means of achieving policy objectives at most reasonable cost to ratepayers
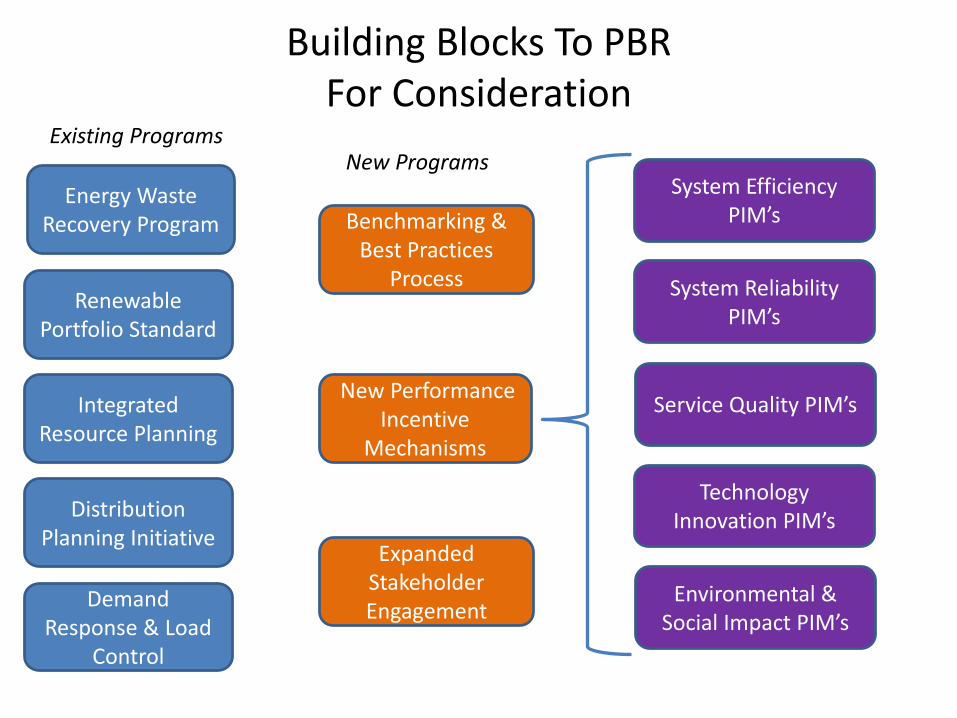
Building Blocks To PBRFor Consideration
Renewable Portfolio Standard
Distribution Planning Initiative
Integrated Resource Planning
Energy Waste Recovery Program
Demand Response & Load
Control
Benchmarking & Best Practices
Process
Expanded Stakeholder Engagement
New Performance Incentive
Mechanisms
System Efficiency PIM’s
System Reliability PIM’s
Service Quality PIM’s
Technology Innovation PIM’s
Existing ProgramsNew Programs
Environmental & Social Impact PIM’s
References
• The Remuneration Challenge: New Solutions for the Regulation of Electricity Distribution Utilities Under High Penetrations of Distributed Energy Resources and Smart Grid TechnologiesJesse D. Jenkins and Ignacio Pérez-Arriaga, September 2014
• INCENTIVE REGULATION IN THEORY AND PRACTICE: ELECTRICITY DISTRIBUTION AND TRANSMISSION NETWORKS Paul L Joskow1; MIT, January 21, 2006
• Performance-Based Regulation of Utilities Mark Newton Lowry, PhD, Lawrence Kaufmann, PhD, Oct 22, 2002
• Reflections on the Successes of RIIO and the Scope of Future Improvement James Grayburn and Richard Druce, January 2016
• ET1 Price Control Financial Handbook [July 4, 2014]; Handbook for implementing the RIIO model [ Oct 10, 2010] Office of Gas and Electricity Markets (Ofgem)