incentives for quality over time the case of facebook ... · pdf fileincentives for quality...
TRANSCRIPT

Incentives for Quality over Time
– The Case of Facebook Applications
Jörg Claussen Tobias Kretschmer Philip Mayrhofer
Discussion paper 2010 – 06
December 2011
Munich School of Management
University of Munich
Fakultät für Betriebswirtschaft
Ludwig-Maximilians-Universität München
Online at http://epub.ub.uni-muenchen.de
Incentives for Quality over Time
– The Case of Facebook Applications
Jörg Claussen
Ifo Institute – Leibniz Institute for Economic Research at the
University of Munich Poschingerstr. 5
81679 Munich, Germany [email protected]
Tobias Kretschmer
University of Munich and Ifo Institute
Schackstr. 4/III, 80539 Munich, Germany
Philip Mayrhofer
CDTM, LMU & TU Munich Arcisstr. 21
80333 Munich, Germany [email protected]
December 2011
Abstract: We study the market for applications on Facebook, the dominant platform for social
networking and make use of a rule change by Facebook by which high-quality applications were
rewarded with further opportunities to engage users. We find that the change led to quality being a
more important driver of usage while sheer network size became less important. Further, we find
that update frequency helps applications maintain higher usage, while generally usage of Facebook
applications declines less rapidly with age.
Keywords: Usage intensity, social media, platform management, two-sided markets.
JEL Classification: L1, L50, O33
Acknowledgements: We thank participants at the 2010 ZEW conference on platform markets, 2011
ZEW conference on online markets, the 4th INTERTIC conference on competition in high-tech
markets, the 2011 annual conference of the Royal Economic Society, the 2nd workshop on the
economics of ICTs in Evora, the 9th annual International Industrial Organization conference, the
BRIE-ETLA conference on the changing competitive landscape in the ICT domain and its socio-
economic implications, seminar participants at LMU Munich, Oliver Alexy, Annika Bock, David
Genesove, Jose Luis Moraga Gonzalez, Stefan Wagner, and Tim Watts for helpful comments and
discussions.
A previous version of the paper was circulated under the title “Private Regulation by Platform
Operators – Implications for Usage Intensity”.
2
1. Introduction
A platform sponsor faces a chicken-and-egg problem since platform markets typically display indirect
network effects (Farrell and Klemperer 2007). Consumers will only use the platform if there are
sufficient complementary goods available, while producers of complementary goods will only
provide them if the number of potential users is sufficiently large (Caillaud and Jullien 2003, Evans
2003). When managing a platform (or multi-sided market), an important question is how to ensure
sufficient supply of each side from independent suppliers. To achieve this, platform providers often
open up their platform to third-party developers who supply additional modules and functionality
(Wheelwright and Clark 1992, Tiwana et al. 2010). Opening one side of the market poses challenges
to the platform owner as its ability to generate revenues and profits depends on the quality and
quantity of both market sides, none of which the owner controls directly (Boudreau 2008, Boudreau
and Hagiu 2009, Hagiu 2011).
Social media are transforming businesses in multiple ways. Specifically, users become increasingly
interconnected and that communication influences their purchasing decisions (Godes et al. 2005,
Tucker and Zhang 2011). In the context of multi-sided markets, this implies that a platform is not just
an intermediary between singular, isolated consumers and a number of complementary products.
Rather, due to social media tools and services, the adoption of complementary products by
consumers is influenced by direct network effects (Katz and Shapiro 1985), bandwagon effects
(Banerjee 1992, Dellarocas et al. 2010), or word-of-mouth (Katz and Lazarsfeld 1955, Dellarocas
2003, Godes and Mayzlin 2009). The ability to tap into social media channels affects developers’
decisions of investing in a platform or not, making the management of platforms and multi-sided
markets even more complex.
The managerial challenge is profound and matters for an increasing number of companies. On the
one hand, social media services such as LinkedIn or Facebook initially offered a platform for users to
interact and later opened this platform to third-party developers who build and market
complementary services.1 On the other hand, two-sided markets such as auction, shopping and
other e-commerce platforms are also beginning to heavily integrate social media to enable user
interaction.2 Second, managing social media integration in multi-sided markets is an ongoing process
rather than a one-off optimization problem. Social media facilitates fads and bandwagon processes
and actions by the platform operator and third-party developers must be constantly monitored to
1 Social networking platforms act as two-sided markets as soon as they rely on advertising to finance their
operations. However, in this paper this side is less important as advertisers generally do not engage directly with the other side by offering products consumed on the platform itself (Evans 2008). 2 Services using social media for shopper coordination are often termed social commerce services.

3
prevent dynamics damaging one market side in a way that makes it unattractive for the other
market side to participate.
We study Facebook, the largest social network on the Internet and a platform operator for add-on
programs, in the initiation phase, which is crucial in the lifecycle of a multi-sided market. The market
for Facebook applications was highly dynamic in the early stages, but suffered from a flood of low-
quality applications, which was detrimental to user experience. Facebook undertook a number of
changes to address this. Specifically therefore, we ask if a change in the rules by which Facebook
applications can attract and engage users in February 2008 changed developers’ incentives for
quality provision for applications and ultimately the drivers of what makes for a successful
application.
Managing a platform has the ultimate goal of maximizing monetization opportunities. As revenues
for platform owners are often generated through advertising or transaction-based charges,
managing usage intensity or frequency (which in turn increases advertising effectiveness) is often at
the core of platform management. This may be done through non-price instruments imposing rules
and constraints, creating incentives and shaping demand and supply behavior (Boudreau and Hagiu
2009). Hagiu (2011) identifies a quality/quantity tradeoff, since both higher quality and quantity are
attractive to consumers, but higher quality presents an entry barrier to complementary goods
providers, thus reducing quantity. Casadesus-Masanell and Halaburda (2011) argue that platform
owners may limit the number of applications on a platform to realize larger benefits from
application-level direct network effects. We contribute to the literature by showing that increased
platform quality can be achieved with “soft” quality incentives and no hard exclusion of low-quality
participants is necessary.3 We also argue and demonstrate empirically that a change in “soft”
incentives changes other drivers of application success.
We study applications developed for Facebook and observe their usage between September 2007
and June 2008.4 On Facebook, the amount of information an application can send out to users
critically influences usage intensity. In February 2008, Facebook implemented a rule change
regarding the amount of notifications applications could send out: before February 2008, all
applications could send out the same amount of messages, while thereafter the amount of
notifications permitted was determined by how frequently the notifications were clicked on, a useful
3 Evaluating quality of platform participants and excluding low-quality applications is costly and prone to error.
Circumstantial evidence for this is given by regular debates revolving around applications rejected on Apple’s market for iOS applications. Conversely, not imposing any quality restrictions may lead to a flooding of low-quality applications as observed in the 1983 Atari shock (Coughlan 2004). 4 The application platform was opened in May 2007.

4
proxy for an application’s ability to attract and retain users. This increased incentives for producing
high-quality applications and punished applications that send out information deemed useless or
even annoying by users. To isolate the effects of this change, we focus on a twenty-week time
window around the change. We use this change (assumed to be endogenous to the platform
operator but exogenous for application developers) to analyze how potential drivers of usage
intensity changed in response. This natural experiment-like change in the effectiveness of word-of-
mouth channels therefore allows for a similar identification as for field experiments (Aral and Walker
2011, Goldfarb and Tucker 2011, Animesh et al. 2011).
We use a rich, longitudinal data set on 7,784 applications on the social networking site Facebook.
This setting is useful for several reasons. First, we have data on applications soon after the launch of
the platform, which lets us examine the dynamics of a nascent and dynamic market. Second, our
complete listing of applications on the platform avoids selection and survivor biases. Third, Facebook
is one of the largest and most successful platforms for applications, making it relevant for the entire
industry.
We estimate random- and fixed-effect OLS models and analyze how the drivers of usage intensity
are affected by the rule change. We find that application quality matters more for usage intensity
after the change, in line with Facebook’s stated goals of the change. Conversely, we find that the
rule change led to quantity (as expressed by the number of installations) becoming less important.
The frequency with which applications are updated (a proxy for the degree to which an application is
managed and maintained) gains in importance as a driver for usage intensity. Further, while usage
intensity always declines as applications become older the decline is less severe after the rule
change, which implies that the intervention was successful in keeping adopters engaged over time.
Finally, the portfolio effect of belonging to a family of applications by the same developer becomes
more positive after the change.
The paper proceeds as follows. We first present the industry context and describe Facebook’s rule
change. Thereafter, we discuss the economics of usage intensity as an indicator of application
success. Our empirical model and results follow. We conclude with a discussion and an outlook for
future work.
2. Industry context
2.1. Applications on Facebook
Facebook is the major player in social networking websites (other examples are Google+ or
LinkedIn). Consumers use social networking services to interact with friends, family members, and
5
increasingly business partners. Core components include personal mini-homepages with which a
user creates a digital representation of him-/herself (Boyd and Ellison 2007) as well as different
means to communicate (personal messages, boards, chats) and to exchange different media.5
Facebook is the largest and fastest-growing social network with over 800 million active users, of
which 75% are outside the United States (as of November 2011).6 In May 2007, Facebook launched
an application platform which allows third parties to develop software that deeply integrates into
the social network and enables additional service not currently covered by the core components of
the social network. In May 2008, one year after the platform launched, more than 30,000
applications had been developed, with more than 900 million installations in total.
2.2. Entry of application developers
As in most markets with indirect network effects, platform operators want to encourage a wide
variety of applications and experimentation in parallel (Church and Gandal 2000, Boudreau et al.
2008). Hence, they provide developers with a set of tools that decrease their development costs and
thus entry barriers. This leads to high entry rates both from new entrants as well as from developers
with multiple applications and affects both the users’ experience and the developers’ incentives. On
the one hand, a large variety of applications presents novel challenges for consumers to discover
and adopt applications (Oestreicher-Singer and Sundararajan 2006, Hervas-Drane 2010). On the
other hand, high rates of entry could result in particularly high levels of competition, which in turn
would diminish profits and incentives around the platform (Boudreau 2008).
Facebook encouraged entry of as many developers as possible. The company offered strategic
subsidies to third-party developers (Shapiro and Varian 1998) by providing open and well-
documented application programming interfaces, multiple development languages, free test
facilities, as well as support for developers through developer forums and conferences. Facebook
also has minimal requirements for applications to be included in the official directory and it does not
“police” or discourage developers imitating or producing “copy-cats” of existing applications.
2.3. Adoption and usage of applications
Having a large variety of applications has important consequences for consumers’ product search
and adoption. On Facebook, adoption and usage takes place in a strongly embedded social context.
The functionality provided by the platform operator lets developers build applications designed to
intensify social interactions (Boudreau and Hagiu 2009).
5 For example, Facebook is the largest online photo sharing utility.
6 Source: http://www.facebook.com/press/info.php?statistics, accessed November 3
rd 2011.

6
Thus, application discovery and adoption is highly influenced by a user’s social context. Users are
passively influenced through the visibility of usage patterns such as reviews, ratings or matching
mechanisms (Oestreicher-Singer and Sundararajan 2006, Hervas-Drane 2010). Active forms of social
influence take the form of recommendations which are directly conveyed via predominantly digital
or online word-of-mouth processes (Katz and Lazarsfeld 1955). IS and Marketing scholars have
examined the conditions under which consumers are likely to rely on others’ opinions in their
purchase decisions, the motives for people to spread the word about a product, and the variation in
strength of influence people have on their peers in word-of-mouth communications (Dellarocas
2003, Phelps et al. 2005, Bampo et al. 2008, Agarwal et al. 2009). It is widely acknowledged that in
such contexts bandwagon processes – positive feedback loops where adoption decisions by some
increase the incentive or pressure to adopt for others – are common (Katz and Shapiro 1985, Katz
and Shapiro 1986, Abrahamson and Rosenkopf 1993).7
2.4. Monetization of applications
When Facebook launched its platform for third-parties in May 2007, developers may have been
primarily intrigued by the opportunities to integrate their applications in Facebook’s service.
However, there was also an economic opportunity from revenues generated within the application.
Importantly, Facebook decided not to take a share of transaction sales initially, leaving developers to
capitalize on this revenue stream.8 Facebook left it open to developers to monetize their application
pages through advertising or other transactions that they control themselves. Also, Facebook
deliberately did not impose restrictions on the form of advertising. The most common forms are
advertisements next to the website’s content and core functionality.
Facebook’s objectives are largely aligned with the objectives of their third-party developers and rely
on capitalizing their active user base. Revenues are realized via selling advertising space to brands,
advertisers or Facebook applications that target specific users. Next to each application’s canvas
page (the space allocated to an application), Facebook can place its own advertising. As a
consequence, the more users engage with applications, the more page impressions or time
Facebook is able to sell to advertisers. Consequently, the level of revenue that can be realized is
7 Another feature relates to the costs that users incur in installing and using applications. Due to the dominant
business model of indirect monetization, the vast majority of applications are free to use. Also, due to technical and design features, users can install and use multiple applications in parallel, thus “multi-home” (Rochet and Tirole 2003). 8 Due to the (open) installation process and the lack of a payment system, Facebook could not take a revenue
cut from developers without further development. In contrast, Apple takes a 30% revenue share from all sales in its iTunes store.
7
directly determined by the number of active users of the platform and applications.9 Thus, growing
the platform (applications) and keeping existing users active (and therefore generating transactions
or looking at and clicking on ads) is among their most important objectives.
3. Facebook’s rule change
Facebook users adopt applications through two main channels. First, users of an application can
directly invite friends who are not currently users of the application (invites). Second, Facebook
users get regular updates on friends’ activities from the built-in “News Feed”. To some extent,
applications can send messages to this news feed and signal a friend’s activity in this particular
application (notifications).
Both channels have been influenced by Facebook. In the very first phase of the application platform
(from launch in May to August 2007) invites and notifications could be sent almost without
restrictions. Application developers used this to “spam” many of their users’ friends. In September
2007 Facebook imposed a set of restrictions (the number of invites and notifications by user was
limited). In the following months these rules remained unchanged.10
However, after months of steady growth, on February 6th 2008 Facebook announced a rule change
such that notifications and invites would be allocated based on user feedback. Applications whose
users react more heavily to notifications/invites that are sent out (a measure for relevance of the
notifications/invites), would be able to send out more notifications/invites. One week later,
feedback allocation was launched for notifications, requests, and invites. Facebook motivated this
change by the expectation that the new system “provide[s] users with more compelling notifications
and fewer notifications that they are likely to ignore or consider spam” (Figure 1). Further, they
“hope this change incentivizes developers to improve the quality of their notifications”.
-------------------------------------------------
INSERT FIGURE 1 HERE
-------------------------------------------------
We want to understand how this rule change affected Facebook’s market for applications. Did the
rule change lead to the expected increased quality levels of applications? And was increased quality
from then on a more effective driver of application usage? Finally, how were other drivers of
application usage influenced by the rule change?
9 Gnyawali et al. (2010) have shown a performance-increasing effect of opening up a platform to third-party
codevelopment. 10
To the best of our knowledge based on the official announcements of Facebook to its developers.

8
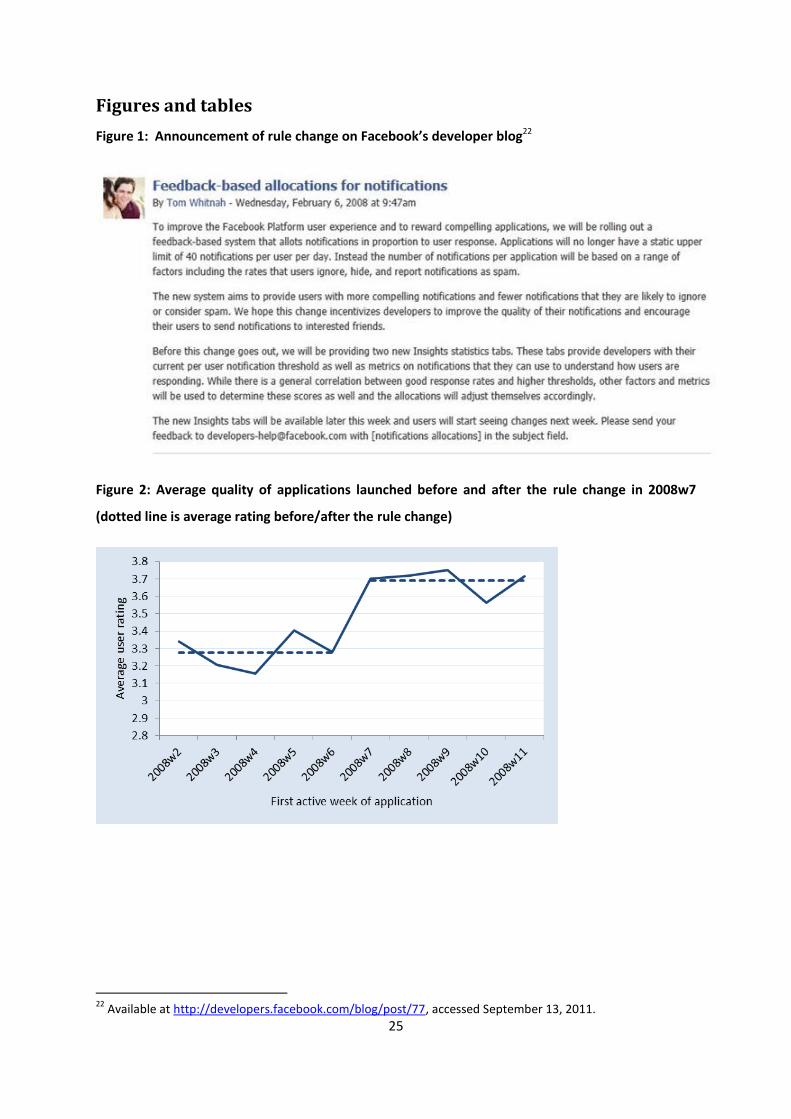
While the second and the third question are addressed in the following sections, we can already get
insights on the first question, i.e. whether the rule change led to increased quality levels of
applications. Figure 2 plots average quality ratings of Facebook applications against their launch
date.11 We see that applications launched after the intervention (in the seventh week of 2008)
immediately achieved a significantly higher average quality of around 0.4 points12.13 This is strong
suggestive evidence that the rule change resulted in higher incentives for quality.
-------------------------------------------------
INSERT FIGURE 2 HERE
-------------------------------------------------
So what could have motivated Facebook to initiate these changes? If application quality had always
been Facebook’s main goal it would be surprising to see no “hard” quality vetting process at the
start of the applications market and if that was not feasible, not even a rule rewarding (notification
and/or application) quality directly, but rather size through the number of notifications per user per
day. While we cannot work out Facebook’s aims (apart from the ones stated in the announcement)
with certainty, the strategic subsidies to developers and the ease of getting applications listed
suggests that inviting entry may have been on top of Facebook’s agenda in the early stages of the
applications market. This was reinforced through highly publicized success stories which created a
gold rush among developers, e.g. the music application iLike grew to several million users within
days. Within weeks, several thousand application developers had signed up for access credentials to
the platform and had started to launch a wide variety of applications. For users, the myriad
applications launched early on helped “educate” them about installing add-on applications to make
the service fresh and exciting. Users learned quickly. Through invites and a flood of notifications in
their news feed, the vast majority of users had installed at least one application within weeks. Also,
many users installed dozens of applications at the same time (multi-homing is comparatively costless
here), sometimes even several with largely identical functionality (e.g. within the first month there
were several enhanced “walls” that allowed posting and exchanging multi-media items).
After the initial enthusiasm, user sentiment towards applications changed. With a larger installed
base of applications and the increasing professionalization of developers in terms of exploiting the
opportunities to use the “viral channels”, the volume of notifications and invites grew exponentially.
11
Data and variables are introduced in section 5. 12
Measured on a five-point Likert scale. 13
In this stage of the application market, applications have still been fairly simple and easy to program. This might explain why application quality reacted immediately to the enactment of the rule change, even though it has only been announced a couple of days earlier.
9
Users became annoyed by constant updates about their friend’s activities and applications. For both
Facebook as the platform operator and the developers this threatened to lead to adverse effects as
instead of adopting and using applications, users would start ignoring notifications and requests.
Facebook’s rule change came precisely during the time when notifications became annoying in the
eyes of users. While the change did not increase entry barriers as such, it became more difficult for
low-quality applications to gather large numbers of engaged users. Quality, as announced by
Facebook itself, was rewarded more directly. Our econometric analysis looks at the actual effects to
assess how this rule change affected the dynamics of applications usage.
4. Economics of usage
4.1. Application quality and usage intensity
The stated aim of Facebook’s rule change was to reward high-quality applications. Given the
monetization opportunities discussed above, an application will likely be considered high-quality if it
keeps users’ interest and engagement. Therefore, the quality as perceived by users and ultimately
reflected in monetization opportunities for application developers and Facebook itself will be closely
linked to the ability to engage users. Hence, it is interesting to see how Facebook’s rule change
affected the relevant measure of application success. Finding the most relevant measure for a free-
to-install application is not trivial. Conventional measures like profits or revenues are either not
meaningful (as far as direct sales revenues are concerned) or not obtainable (as far as advertising
revenues are concerned). The success of free software or goods more generally is therefore often
measured in the number of users or installations. This may be misleading for at least two reasons:
First, the number of installations (typically measured by the number of installation packs
downloaded from the application’s website) may double-count adopters if they repeatedly install
software on different hardware or if they install upgrades to the basic version they already have.
That is, the number of installations may be overstating the actual number of active copies of a piece
of software – especially if it is frequently updated, requiring repeated installations. Second, even if
the number of technically active copies is accurately measured, not all potential users will actually
use it regularly. This is particularly relevant if a good comprises access and use elements, and most
revenues arise from use, not access (Grajek and Kretschmer 2009). In the case of Facebook
applications this would seem especially true as access is free (installing an application is costless) and
usage increases the likelihood that a user will notice the advertisements from which the application
derives its revenues. Hence, usage intensity is a useful metric for application success, which
ultimately will translate to advertising revenues (unmeasured by us).

10
4.2. Drivers of usage intensity
We are interested in how Facebook’s rule change may have affected the drivers of usage intensity in
the market for applications. That is, we are interested in how the drivers of application success have
changed after the rule change.
4.2.1 Application quality
Facebook’s press release explicitly states the intention that “this change incentivizes developers to
improve the quality of their notifications” and “to reward compelling notifications” (Figure 1). That
is, notifications and users’ application experience are linked both through the new invitation process
and the retention effect of in-app notifications. High-quality applications are more likely to be
installed if a user receives an invitation, and they will be used more intensively if the notifications
generated are meaningful. The notification process prior to the change introduced noise in this
process by letting all applications issue the same number of notifications per user. Post-change,
more successful applications could send out more notifications, leading to higher user engagement
and average usage intensity.
Hence, we expect that the effect of quality on usage intensity will increase after Facebook’s rule
change.
4.2.2 Update Activity
The frequency of updates is a choice variable by application developers. As Facebook applications
usually have fairly limited functionality, an application can over time become less attractive for an
individual who has already installed the application. However, user interest can be retained if an
application is regularly updated and improved. Updating an application could include adding new
features, new content, or just changing the application’s appearance. Applications that are actively
managed and updated regularly are therefore expected to better retain their customers and achieve
higher usage intensity. Facebook’s rule change was intended to improve user experience by making
notifications more relevant, and notifications are more likely to be relevant if an application is
managed proactively, thus leading to higher usage intensity.
Hence, the effect of upgrades on usage intensity is likely to increase after Facebook’s rule change.
4.2.3 Installed base effects
The installed base of users of an application can relate to usage intensity through network effects as
well as the composition of users at different points in time (Grajek and Kretschmer 2009, Cabral
2006). If there are network effects at the application level, more users should result in higher usage
intensity. However, for local network effects, i.e. if an application becomes more attractive the more

11
friends of a user have installed it, we do not expect a positive effect of an application’s (global)
installed base on usage intensity. The second mechanism affecting usage intensity through installed
base is the composition of users over time. If adopters are heterogeneous and high-intensity users
adopt early, average usage intensity is expected to decline with a growing installed base (Cabral
2006). Conversely, if diffusion is an epidemic process among users with similar preferences, we do
not expect a positive effect of an application’s installed base on usage intensity. Absent micro-(user-
application-level) data, we cannot disentangle these effects empirically, but we can compare their
relative strength by observing the net effect (Grajek and Kretschmer 2009).
How did Facebook’s rule change affect the role of installed base on usage intensity? As we are
capturing the net effect of user composition and network effects, we assess the effect on both
individual forces to make a prediction on how the net effect changes. User composition is unlikely to
be affected strongly by the rule change as it affects the supply side, but not the demand side (i.e. the
users) of applications. Conversely, the rule change affected the advantage of applications with a
large installed base in that notifications simply could not be sent out with the same frequency as
before. So the same number of installations would result in less updates being sent out.
We therefore expect the impact of network effects to decrease after Facebook’s rule change, leaving
the effect of user heterogeneity as the dominant effect.
4.2.4 Application age
Application age, i.e. the time since which the application has been launched, also drives usage
intensity. Older applications are expected to be used less intensively as usage follows a fad, i.e. users
are only interested in the application for a short time. One goal of Facebook’s rule change was to
reward more compelling applications. Thus, the change helped applications that retain and keep
their users engaged.
We therefore expect usage intensity to decay less rapidly with time after the rule change.
4.2.5 Portfolio effects
Portfolio effects matter in cultural industries in which artists or developers create several products.
For example, Hendricks and Sorensen (2009) find for the music industry that spillovers between
albums exist. Similarly, on Facebook most developers have a portfolio of (often functionally similar)
applications. This may lead to users splitting their time across different applications, or to users
developing a taste for a specific developer’s applications. The net effect of belonging to a large
portfolio is therefore an empirical matter. It is interesting to speculate how Facebook’s rule change
may have changed the role of belonging to such a portfolio. Post-intervention, “new” applications
12
had to attract users by “earning” credit through successful past notifications. As younger
applications had less of a history to fall back on, alternative promotion channels mattered more both
in attracting new users and in keeping existing users’ interest. The alternative channel was cross-
promotion through developers’ application portfolios.
Therefore, we expect a large portfolio to have a more positive effect following the rule change.
5. Empirics
5.1. Data
We use a unique dataset from Facebook’s public directory of applications which included all
applications available on the Facebook platform.14 All application-specific “about”-pages in this
directory have been crawled and parsed daily to extract the variables described below.
Even though our data covers the period of September 1, 2007 to June 30, 2008, we focus on a period
of twenty weeks around the rule change we study. Our observation period falls in the early phase15
of the application platform and was characterized by strong growth in terms of users of Facebook’s
service as well as the number of applications and their users. The number of applications on the
platform grew immensely from around 2,000 in early September 2007 to over 18,000 in early 2008.
We obtained records for 18,552 applications, of which 7,784 were active and contained all variables
in the 20-week time window around the rule change. The records include data on an application’s
entry to the platform, its usage by Facebook members, its developer and finally an assignment to
certain categories. Further, we computed a number of measures by observing changes made to the
directory page as well as from clustering applications by developer name.
Our data is particularly well-suited for analyzing usage intensity for several reasons. First, we have
precise measures for usage and usage intensity. Facebook continuously reports how many users
have interacted with the application within the previous 24 hours. It also specifies the percentage of
all users, i.e. the ratio of active users (last 24 hours) to all users who have installed the application at
any given time. Hence, we observe both an application’s installed base and its usage intensity.
Second, the measures of usage directly indicate the potential for economic success. Third, our data
mitigates selection problems originating from deterred entry and observed survival. Developer entry
to the platform is frequent due to low entry barriers. More importantly, however, entry costs can be
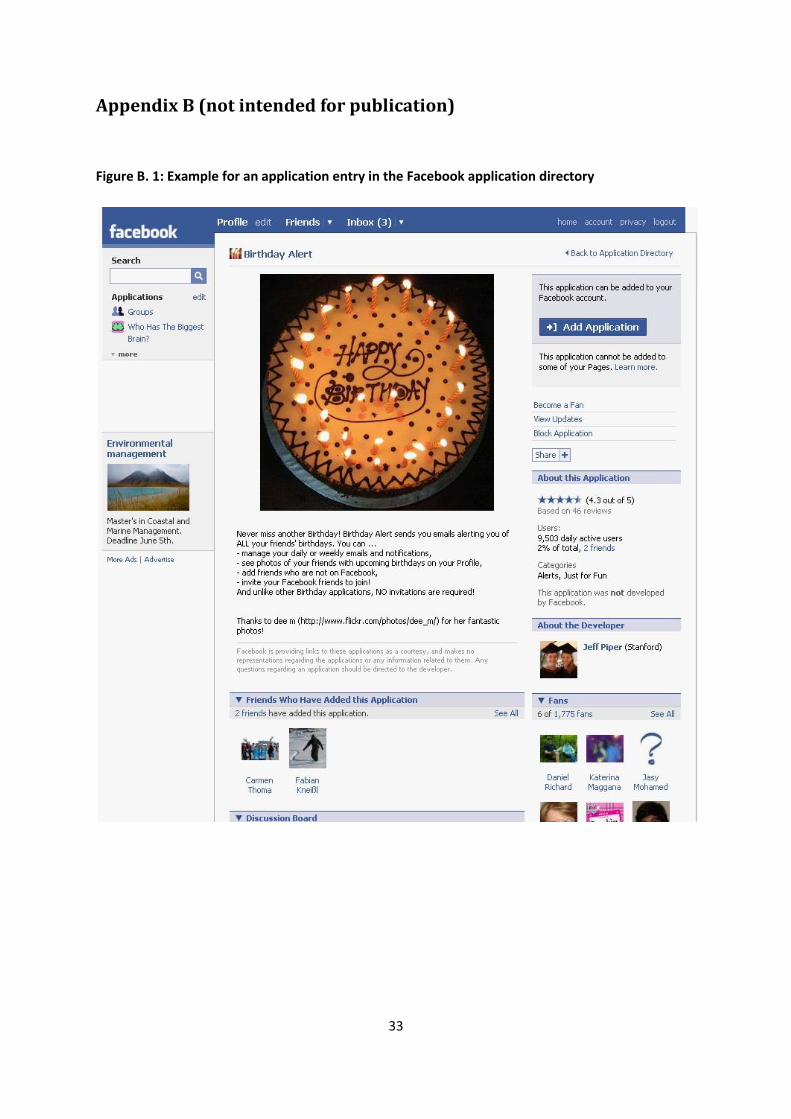
14
Facebook’s application directory has been suspended in July 2011 (as announced on https://developers.facebook.com/blog/post/523/, accessed November 3
rd 2011). See Figure B.1 for an
example of an application page in the directory. 15
Facebook’s platform for applications was launched on May 24, 2007.

13
assumed to be homogeneous. Finally, the dataset includes applications that were successful and
applications that never reached a meaningful user base. Since data is recorded from the first day an
application appears in the directory, information is available independent of the application’s
following success. This is rather unique particularly for studies on Internet-based industries where
determining entry accurately is often difficult due to poor documentation of the early history of a
category or firm. Published accounts on the entities often do not appear before they reach a
“threshold scale” (Eisenmann 2006, p. 1193).
5.2. Variables
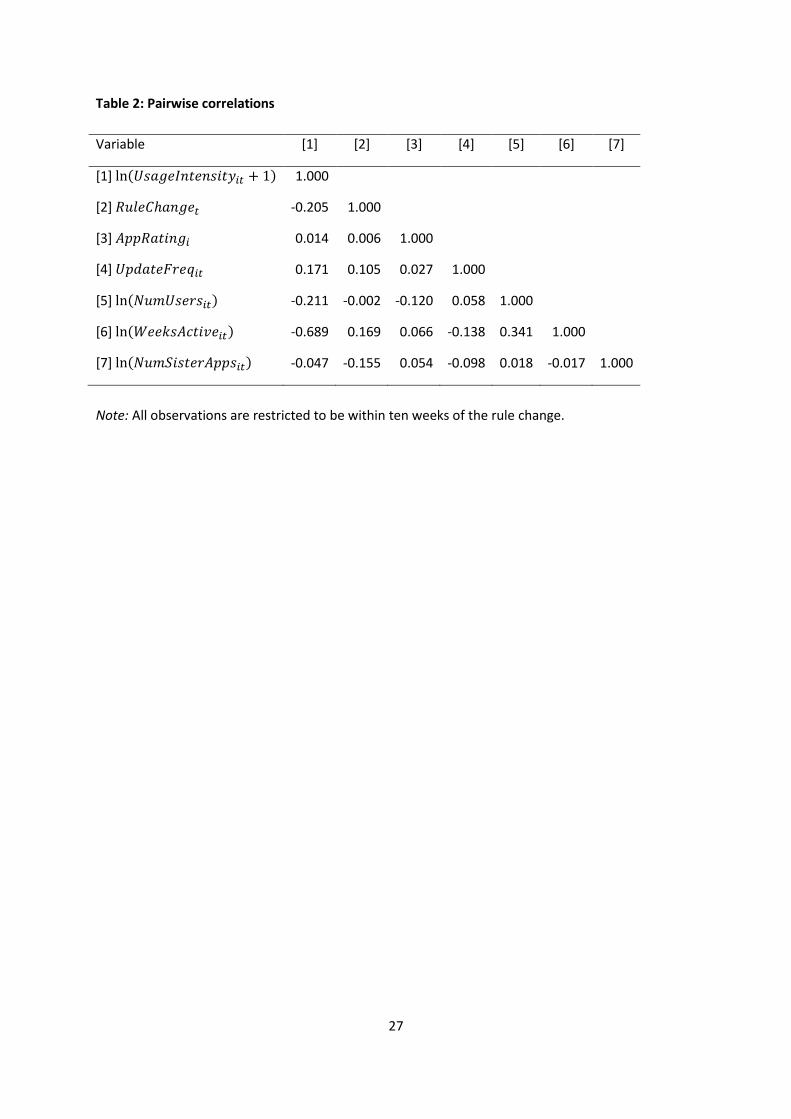
Variable definitions and summary statistics are given in Table 1 and Table 2 gives pairwise
correlations.
-------------------------------------------------
INSERT TABLE 1 HERE
-------------------------------------------------
-------------------------------------------------
INSERT TABLE 2 HERE
-------------------------------------------------
5.2.1 Dependent variable
Our dependent variable is an application ’s usage intensity in week measured as the average
percentage of daily active users. Hence, we observe the percentage of an application’s installed base
of users that uses the application on a given day and form the weekly average. All other time-
dependent variables are also observed on a daily basis and then aggregated up to the weekly level.16
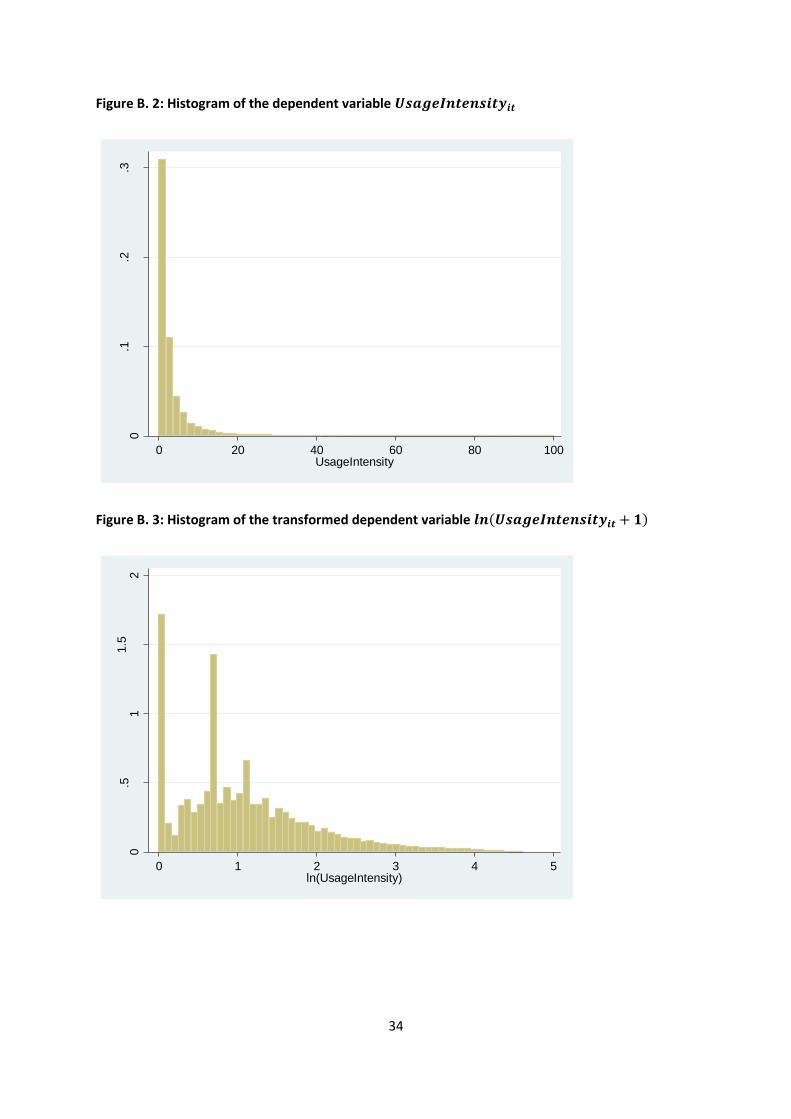
Given the skewness in , we use the variable’s logarithm for our regressions.17
5.2.2 Rule change
As discussed in section 3, Facebook changed the rules in how far applications can send out
notifications in February 2008. We therefore construct a dummy variable which takes
a value of zero before the change (until the sixth week of 2008) and a value of one thereafter.
16
We aggregate data from daily to weekly level to average out weekday-dependent differences in usage intensity. 17
The distribution of the linear form and the logarithm of the variable are displayed in Table B.2 and Table B.3.
14
5.2.3 Application quality ( )
Users can rate applications on a five-point Likert scale. The variable captures the
average user rating of application . We can only construct a time-invariant measure of application
rating as Facebook’s application directory did not report user ratings before February 2008.
5.2.4 Update activity
We observe several events indicating an update of the underlying application: we check if the name
or one of the descriptive elements of an application has changed, if the screenshot was updated, and
if the application category has changed. For each point in time, we calculate an application’s update
intensity as the cumulative number of updates divided by application age
( ).
5.2.5 Installed base
At the application level, we observe the number of Facebook users that have installed an application
on their profile page. As the number of installations of an application is highly skewed, we use the
natural logarithm of .
5.2.6 Application age
We measure the age of an application as the weeks since the application has appeared in the
application directory for the first time. We use the natural logarithm of to allow for
a non-linear decay in usage intensity over time.
5.2.7 Firm portfolio
As developers can release several applications, we measure a firm’s portfolio in the form of sister
applications. is the number of an application ’s sister applications at time .
5.3. Estimation strategy
We proceed in two steps. We first run explorative random-effects regressions to assess how the
direct influence of an application’s perceived quality changes with the rule change. We then use a
more conservative set of fixed-effect regressions (controlling for time-invariant application-specific
drivers of usage intensity) to test how the rule change moderated drivers of usage intensity.
As seen in section 3, the rule change led to an increase in average application quality. Based on this,
we first explore if incentives for providing higher quality have been increased by the rule change, i.e.
does the same level of quality result in higher usage intensity? To address this question, we estimate
the following baseline specification separately in the periods before and after the rule change:

15
In this regression, is regressed on , other drivers of usage intensity,
as well as a set of dummies representing an application’s categories.18 Comparing effect sizes of
before and after the rule change lets us assess if and how the importance of an
application’s perceived quality changed with the rule change.
Clearly, this random-effect estimation strategy poses challenges to identification as many
application-specific characteristics are not controlled for. For example, even if two applications
belong to the same (broad) category “just for fun”, they can induce different levels of involvement,
leading to differences in usage intensity. We therefore treat the results from this model as
exploratory evidence only.
To tackle this drawback and to assess how the drivers of usage intensity are moderated by the rule
change, we run a more restrictive set of fixed-effect regressions. In these models, application-
specific effects capture all time-invariant characteristics that might drive usage intensity. As our
measure for application quality is time-invariant, it is absorbed by the application-specific fixed-
effects and can no longer be identified directly.19 We thus run the following regression:
All time-invariant, application-specific heterogeneity is absorbed by the application fixed-effects .
We then include all identified drivers of usage intensity as main effects as well as in interaction
terms with the rule change. As discussed, the main effect of application quality is absorbed by the
fixed effects. However, the interaction term with the rule change can still be identified and allows
answering if application quality became a more important driver for usage intensity after the rule
change. The other interaction terms also allow identifying the moderating effect of the rule change
on the relative importance of the drivers of usage intensity.
Another concern relates to other possibly unobserved shocks affecting the platform. If these shocks
drive the effectiveness of the identified drivers of usage intensity, the dummy for the rule change
18
Developers can choose up to two out of 22 category labels for each application. Example categories are “just for fun”, “photo”, “chat”, “dating”, or “gaming”. 19
The time-invariant category assignment is also absorbed by the fixed effects.

16
could also capture these shocks and not only the actual rule change. To mitigate this possibility as far
as possible, we restrict our analysis to a short time period around the rule change.20
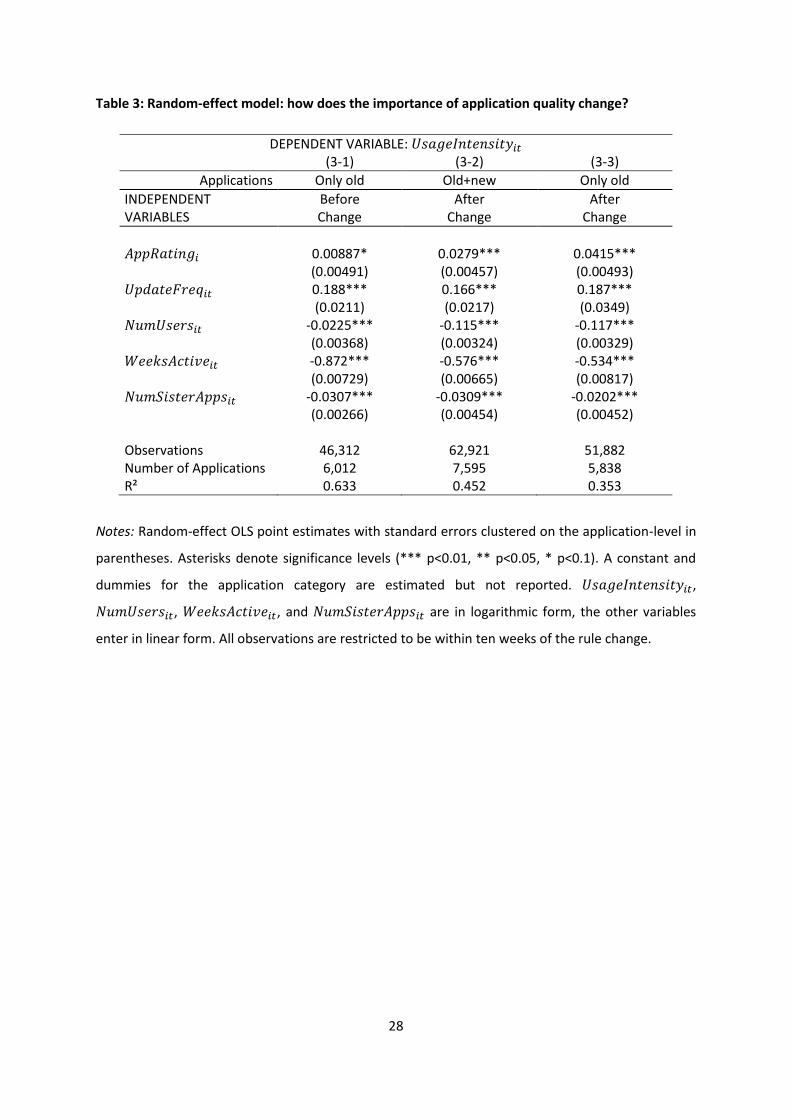
5.4. Results
The results for the random-effects regressions with cluster-robust standard errors at the application-
level are given in Table 1. The sample in column (3-1) is restricted to the ten-week period before the
rule change, whereas columns (3-2) and (3-3) are restricted to the ten weeks after the change. In the
first and third columns, only applications launched before the rule change are included, while the
second column includes newly launched applications. Comparing coefficients in (3-1) and (3-3)
shows how the drivers of usage intensity changed for the same set of applications. By contrast,
comparing coefficients in (3-1) and (3-2) shows how the drivers of usage intensity for the full set of
applications changed.
-------------------------------------------------
INSERT TABLE 3 HERE
-------------------------------------------------
For the explorative random-effects model, we focus on the change in the direct effect of application
quality on usage intensity as well as the main effects of our drivers of usage intensity. The coefficient
of strongly increases after the rule change, i.e. the same quality level as before the
change is rewarded more in terms of usage intensity. The effect of application rating goes up most
for the subsample of applications already on the market.21 In addition to the effect of application
quality we also find that developers actively managing their application, i.e. applications with a
higher update frequency, experience higher usage. The number of users who have installed an
application and the time an application is already on the market are both negative predictors of
usage intensity. Finally, a larger pool of sister applications by the same developer reduces usage
intensity of the focal application.
We now turn to the fixed-effect model to discuss the moderating effects of the rule change on the
drivers of usage intensity. For these regressions, we do not consider the periods before and after the
rule change separately but include a timeframe from ten weeks before until ten weeks after the rule
change and identify the effects from interactions with the dummy variable . The first
column of Table 4 reports the main effects, while interaction effects are included in the second and
20
For the main results, we use a time window from ten weeks before the rule change to ten weeks thereafter. In the robustness section, we restrict the sample to five weeks before and after the rule change. 21
The endogeneity of quality may be a concern for applications launched after the rule change. For earlier ones this is not problematic as the application was introduced (and its quality was fixed) prior to the change.
17
third specifications. The difference between the last two specifications is that in (4-2) all applications
are considered, while in (4-3) only applications launched before the rule change are included.
-------------------------------------------------
INSERT TABLE 4 HERE
-------------------------------------------------
The coefficients on the main effects of update frequency, number of installations, weeks active, and
number of sister applications (presented in the first column) have the same sign and significance as
in the random-effects model. The coefficients also maintain their sign and significance when the
interaction terms are added in columns two and three. As discussed, the main effect of the
application rating is absorbed by the rule change, but the interaction term with the rule change
reveals a clearly increased importance of application rating as the rule change is enacted. The
benefits from higher update frequency increase with the rule change, while the number of an
application’s users becomes an even stronger negative driver of usage intensity. The coefficient for
the interaction of rule change with weeks active as well as with the number of sister applications is
positive and significant, which suggests that applications stay attractive for longer and focal
applications with many sister applications achieve a comparably higher usage intensity. Note that
the size of coefficients for the interaction terms is very similar in size between the full sample and
the sample of applications launched before the rule change.
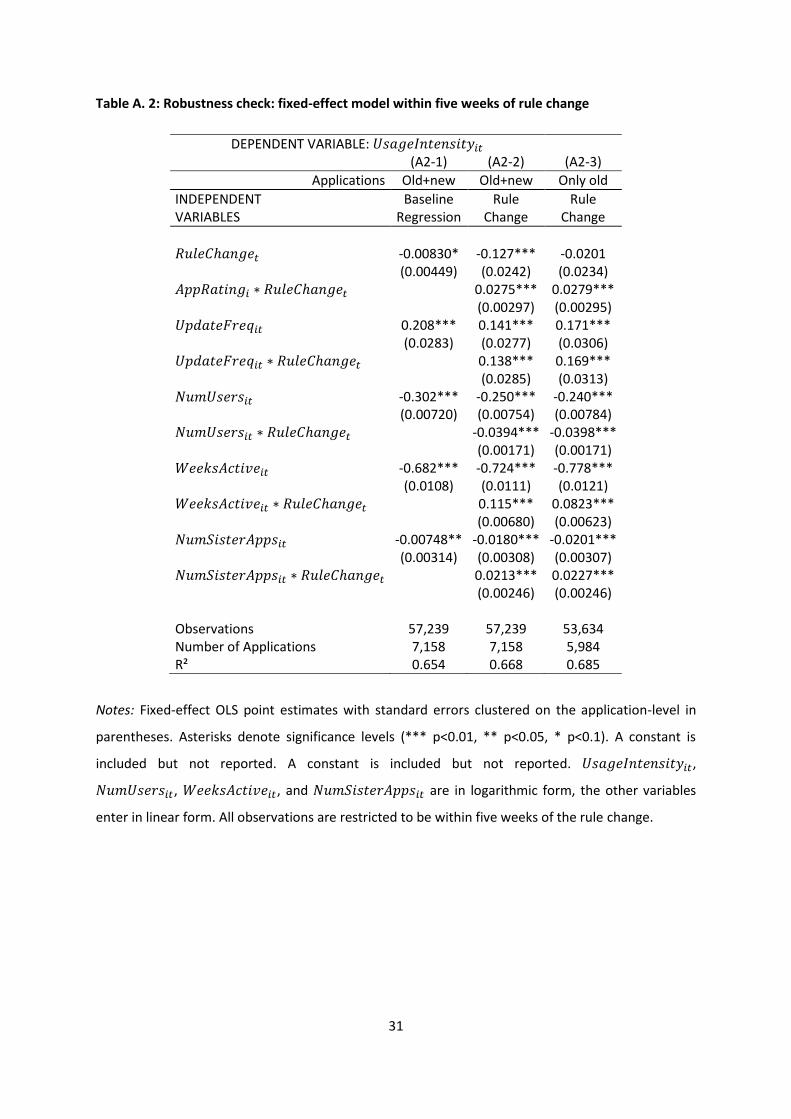
5.5. Robustness checks
We restricted our analysis to a short timeframe around the rule change to avoid confounding the
effects from the rule change with other contemporaneous trends. To test the robustness of our
results, we further restrict the observation window to five weeks around the rule change. Table A.1
presents results for the random-effect model while Table A.2 presents results for the fixed-effect
model. The results with these more challenging restrictions still hold. The effect of application rating
becomes approximately 30% weaker both in the random- and in the fixed-effect models: in the
random-effects model the difference between (A1-1) on the one hand and (A1-2) and (A1-3) on the
other becomes smaller; in the fixed effect model the coefficient of the interaction term decreases
when reducing the sample period.
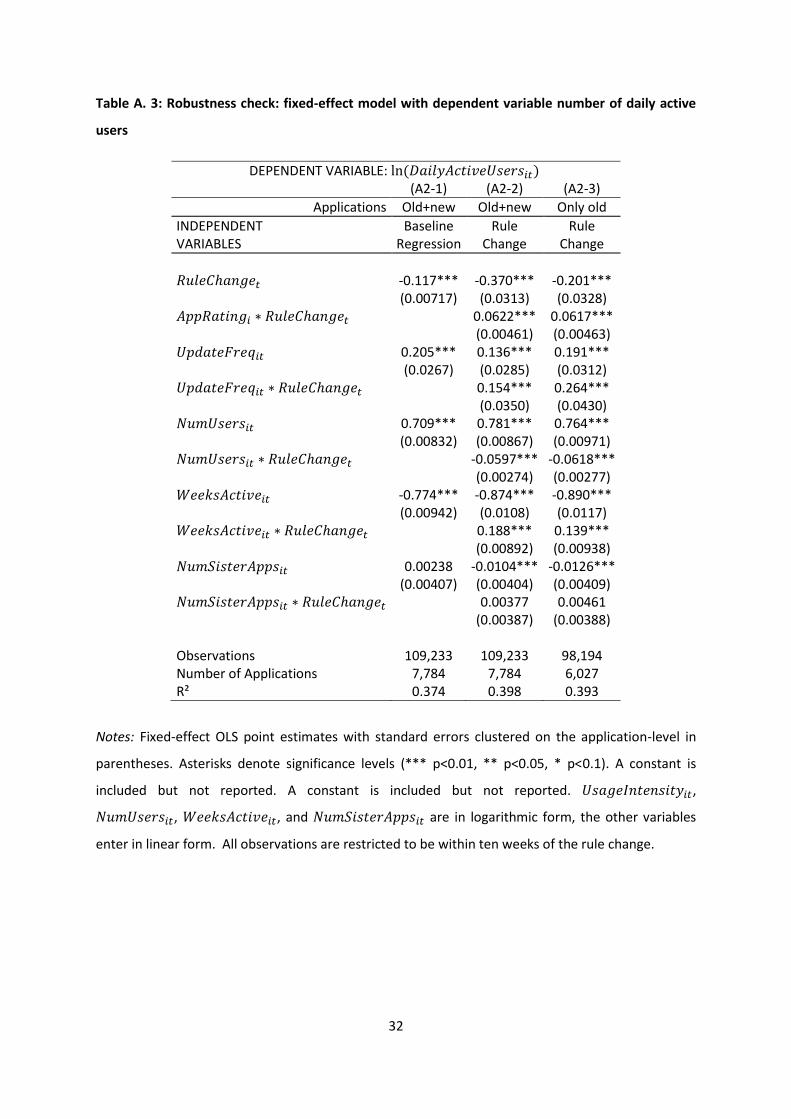
As an additional robustness check, we use the logarithm of the number of daily active users as an
alternative dependent variable. This variable captures total activity for an application instead of the
per-user measure usage intensity and can therefore be interpreted as a proxy for an application’s
total profit potential instead of per-user profit potential. Regarding sign and significance, the results

18
in Table A.3 are very similar to the results for the dependent variable usage intensity. The only
notable difference is that the interaction terms between the number of sister apps and the rule
change lose significance. The stability between our result sets suggests that overall usage is
predominantly driven by usage intensity rather than the sheer number of users.
6. Discussion and conclusion
6.1. Interpretation of the results
Our empirical results show that the rule change initiated by Facebook, the platform owner, had a
profound impact on the determinants of success in the market for Facebook applications. All drivers
of usage intensity, the most meaningful measure of application success, were affected in their
impact on usage intensity by Facebook’s rule change.
Facebook’s move was first and foremost designed to “incentivize developers to improve the quality
of their notifications”. Given the nature of notifications – a term capturing both invitations for new
users (designed to encourage new installations) and activity reports to other existing users (designed
to keep engagement high) – notifications are an important part of a user’s application experience.
The first robust result we find thus confirms Facebook’s stated aim of improving application quality.
This is visible in Figure 1, where there is a marked jump in quality ratings for applications released
after the change, but also reflected in the random-effects regressions which show that quality
matters more (both for old and new applications) after the change. Most rigorous econometrically
are the results controlling for time-invariant application characteristics in Table 4. Here, while we do
not get a coefficient on quality (as it is absorbed by the application fixed-effect), we find that post-
change application rating has a stronger positive impact on usage intensity. Thus, the new way in
which notifications work rewarded the applications which successfully kept users engaged through
compelling notifications.
The frequency of updates positively affects usage intensity. This supports the intuition that actively
managed applications (i.e. frequently updated ones) enjoy higher usage intensity after the rule
change as user engagement is rewarded more. This is especially relevant for older applications that
have been introduced under a regime which did not incentivize high quality greatly. These
applications can “catch up” by actively managing quality (and maintaining user interest through
updates) after the change.
We then consider the net effect of network effects and user composition. In line with expectations,
network effects matter less for usage intensity after the change. There are two related explanations
for this. First, it is more difficult for widely used, but not particularly engaging applications to

19
leverage their sheer size to keep users’ interest. That is, if users receive plenty of notifications from a
particular application, they may eventually start using the application more since the notifications
suggest intense activity. Second, notifications are another mechanism of engaging users. In this case,
users are not simply triggered to engage through friends using the application, but also through
notifications. Thus, the two substitute for each other to some extent, rendering sheer network size
relatively less important.
Another direct implication of the increased quality incentives for applications after the change is the
intuition that applications “age well” post-change. That is, the (negative) fad effect is less
pronounced after Facebook’s intervention. It is interesting to note that this is relevant even though
we control for other factors like update frequency and quality (and other time-invariant
characteristics), so this result indeed suggests that applications decay more slowly as a consequence
of the rule change. “Compelling notifications” are one driver of this, a change in the composition of
active applications is another.
Finally, a firm’s application portfolio becomes a more important driver of usage intensity after the
rule change. Before the change, application developers could rely mostly on the free viral channels
provided by Facebook to distribute their applications and to keep existing users engaged. In this
phase, the advertising space developers had available in each application was probably mostly used
for generating revenues from external advertising networks and not to maintain the own application
network. As Facebook reduced the freely available information, an own “advertising network” of
Facebook applications became an increasingly valuable resource for a developer. Developers with a
network of multiple applications can tap into this resource to maintain usage intensity across their
network.
Our results confirm widespread changes in the success factors and consequently the market
structure of the market for Facebook applications. We do not know the precise goals Facebook had
in mind when initiating this change, but our results are in line with an incentive to reward high-
quality applications and drive low-quality ones out of the market. This may also trigger a
concentration towards one dominant application in every genre as higher quality is rewarded with
further opportunities to capitalize on it. So while keeping entry barriers low helps keeping up the
“long tail” (Anderson 2006), bandwagon behavior (Dellarocas et al. 2010, Duan et al. 2009) may also
lead to a “superstar effect” (Rosen 1981).
One can only surmise that these goals should eventually lead to increased monetization
opportunities for Facebook, which is supported to some extent by the fact that Facebook later
20
implemented a change concerning the way monetary transactions are channeled through the
Facebook website (and that lets Facebook keep a share of revenues).
6.2. Managerial implications
Our results have a number of implications for practice. First, we find that quality can be incentivized
through “soft”, i.e. non-excluding rules. This is an alternative to the costly (and error-prone) “quality
threshold” rule under which the platform owner exerts control over which software appears on the
platform through a vetting and quality assessment process. While such an approach may increase
the average quality of active applications, it may also be counterproductive in a nascent market in
which consumer preferences are not (yet) settled and there may be innovative applications that
would fail the established quality criteria. Second, we find that the drivers of application success are
contingent on the environment set by the platform owner. This includes the promotion channels
available to applications and the opportunity to implement technical (or layout) changes after an
application’s launch.
6.3. Limitations and further research
Our study is not without limitations and is exploratory in several respects. First, our data is
aggregated at the application level. Thus, we can observe changes in the aggregate behavior of users
of an application, but not how an individual’s behavior changes over time. Especially given that post-
change application usage decays less rapidly it would be interesting to gather individual-level data to
see what drives this result. Second, we do not observe profits or revenues, neither by applications
developers or the platform owner, Facebook. Hence, we cannot infer precisely if the rule change
worked in the intended way or if applications developers benefited from this on average. However,
we feel it is reasonable to assume that developers’ actions reveal their preferences and that the
upward shift in quality was a response designed to exploit the new environment. Similarly,
Facebook’s stated aim of increasing quality and user satisfaction is presumably (and plausibly)
related to future (and current) opportunities for monetization for Facebook. Third, we study a
particular episode in the evolution of a single, albeit the most important, social networking platform.
We should be careful therefore in extrapolating the results to other platforms and rule changes.
Nevertheless, our study offers an appealing look into the various ways in which platform owners can
manage their platforms.
In summary, we study the changes in the success factors of Facebook applications following a
change in the way applications could send out notifications. Our results suggest that application
developers respond to “soft” quality incentives by launching better applications, in line with the
goals that Facebook stated when announcing the change in notification rule. This study contributes

21
to the emerging literature on the empirics of platform markets and we hope that it sheds light on
the interaction between rules set by the platform owner and market dynamics in complementary
goods markets.
22
References
ABRAHAMSON, E. & ROSENKOPF, L. 1993. Institutional and competitive bandwagons: Using
mathematical modeling as a tool to explore innovation diffusion. Academy of Management
Review, 18, 487-517.
AGARWAL, R., ANIMESH, A. & PRASAD, K. 2009. Research Note—Social Interactions and the “Digital
Divide”: Explaining Variations in Internet Use. Information Systems Research, 20, 277-294.
ANDERSON, C. 2006. The long tail: How endless choice is creating unlimited demand, London,
Random House.
ANIMESH, A., VISWANATHAN, S. & AGARWAL, R. 2011. Competing “Creatively” in Sponsored Search
Markets: The Effect of Rank, Differentiation Strategy, and Competition on Performance.
Information Systems Research, 22, 153-169.
ARAL, S. & WALKER, D. 2011. Creating Social Contagion Through Viral Product Design: A Randomized
Trial of Peer Influence in Networks. Management Science, 57, 1623-1639.
BAMPO, M., EWING, M. T., MATHER, D. R., STEWART, D. & WALLACE, M. 2008. The Effects of the
Social Structure of Digital Networks on Viral Marketing Performance. Information Systems
Research, 19, 273-290.
BANERJEE, A. V. 1992. A simple model of herd behavior. The Quarterly Journal of Economics, 107,
797.
BOUDREAU, K. 2008. Too Many Complementors? Evidence on Software Firms. Available at SSRN:
http://ssrn.com/abstract=943088.
BOUDREAU, K. & HAGIU, A. 2009. Platform Rules: Regulation of an Ecosystem by a Private Actor. In:
GAWER, A. (ed.) Platforms, Markets and Innovation. Cheltenham, UK and Northampton, MA,
US: Edward Elgar.
BOUDREAU, K., LACETERA, N. & LAKHANI, K. 2008. Parallel search, incentives and problem type:
Revisiting the competition and innovation link. Harvard Business School Technology &
Operations Mgt. Unit Working Papers.
BOYD, D. & ELLISON, N. 2007. Social network sites: Definition, history, and scholarship. Journal of
Computer-Mediated Communication, 13, 210-230.
CABRAL, L. 2006. Equilibrium, epidemic and catastrophe: Diffusion of innovations with network
effects. New Frontiers in the Economics of Innovation and New Technology: Essays in Honor
of Paul David, Edward Elgar, London, 427-437.
CAILLAUD, B. & JULLIEN, B. 2003. Chicken & egg: Competition among intermediation service
providers. RAND Journal of Economics, 34, 309-328.

23
CASADESUS-MASANELL, R. & HALABURDA, H. 2011. When Does a Platform Create Value by Limiting
Choice? Harvard Business School Working Paper 11-030.
CHURCH, J. & GANDAL, N. 2000. Systems Competition, Vertical Merger, and Foreclosure. Journal of
Economics and Management Strategy, 9, 25-51.
COUGHLAN, P. J. 2004. The Golden Age of Home Video Games: from the reign of Atari to the rise of
Nintendo. Harvard Business School Case Study 9-704-487.
DELLAROCAS, C. 2003. The digitization of word of mouth: Promise and challenges of online feedback
mechanisms. Management Science, 49, 1407-1424.
DELLAROCAS, C., GAO, G. & NARAYAN, R. 2010. Are Consumers More Likely to Contribute Online
Reviews for Hit or Niche Products? Journal of Management Information Systems, 27, 127-
158.
DUAN, W., GU, B. & WHINSTON, A. B. 2009. Informational cascades and software adoption on the
internet: an empirical investigation. MIS Quarterly, 33, 23-48.
EISENMANN, T. 2006. Internet companies growth strategies: Determinants of investment intensity
and long-term performance. Strategic Management Journal, 27, 1183-1204.
EVANS, D. 2003. Some empirical aspects of multi-sided platform industries. Review of Network
Economics, 2, 191-209.
EVANS, D. 2008. The economics of the online advertising industry. Review of Network Economics, 7,
359-391.
FARRELL, J. & KLEMPERER, P. 2007. Coordination and Lock-In: Competition with Switching Costs and
Network Effects. In: ARMSTRONG, M. & PORTER, R. (eds.) Handbook of Industrial
Organization. Elsevier.
GNYAWALI, D. R., FAN, W. & PENNER, J. 2010. Competitive Actions and Dynamics in the Digital Age:
An Empirical Investigation of Social Networking Firms. Information Systems Research, 21,
594-613.
GODES, D. & MAYZLIN, D. 2009. Firm-created word-of-mouth communication: Evidence from a field
test. Marketing Science, 28, 721-739.
GODES, D., MAYZLIN, D., CHEN, Y., DAS, S., DELLAROCAS, C., PFEIFFER, B., LIBAI, B., SEN, S., SHI, M. &
VERLEGH, P. 2005. The firm's management of social interactions. Marketing Letters, 16, 415-
428.
GOLDFARB, A. & TUCKER, C. E. 2011. Privacy Regulation and Online Advertising. Management
Science, 57, 57-71.
GRAJEK, M. & KRETSCHMER, T. 2009. Usage and diffusion of cellular telephony, 1998–2004.
International Journal of Industrial Organization, 27, 238-249.

24
HAGIU, A. 2011. Quantity vs. Quality: Exclusion By Platforms With Network Effects. Harvard Business
School Working Paper 11-125.
HENDRICKS, K. & SORENSEN, A. 2009. Information and the skewness of music sales. Journal of
Political Economy, 117, 324-369.
HERVAS-DRANE, A. 2010. Word of mouth and taste matching: A theory of the long tail. NET Institute
Working Paper No. 07-41
KATZ, E. & LAZARSFELD, P. 1955. Personal influence: The part played by people in the flow of mass
communications, Glencoe, IL, Free Press.
KATZ, M. & SHAPIRO, C. 1985. Network Externalities, Competition, and Compatibility. American
Economic Review, 75, 424-440.
KATZ, M. & SHAPIRO, C. 1986. Product compatibility choice in a market with technological progress.
Oxford Economic Papers, 38, 146–65.
OESTREICHER-SINGER, G. & SUNDARARAJAN, A. 2006. Network structure and the long tail of
electronic commerce. Proceedings of the Tenth INFORMS Conference on Information
Systems and Technology (CIST 2006).
PHELPS, J., LEWIS, R., MOBILIO, L., PERRY, D. & RAMAN, N. 2005. Viral marketing or electronic word-
of-mouth advertising: Examining consumer responses and motivations to pass along email.
Journal of Advertising Research, 44, 333-348.
ROCHET, J. & TIROLE, J. 2003. Platform competition in two-sided markets. Journal of the European
Economic Association, 1, 990-1029.
ROSEN, S. 1981. The economics of superstars. American Economic Review, 71, 845-858.
SHAPIRO, C. & VARIAN, H. 1998. Information rules: a strategic guide to the network economy,
Boston, MA, Harvard Business School Press.
TIWANA, A., KONSYNSKI, B. & BUSH, A. A. 2010. Platform Evolution: Coevolution of Platform
Architecture, Governance, and Environmental Dynamics. Information Systems Research, 21,
675-687.
TUCKER, C. & ZHANG, J. 2011. How Does Popularity Information Affect Choices? A Field Experiment.
Management Science, forthcoming.
WHEELWRIGHT, S. & CLARK, K. 1992. Revolutionizing product development: quantum leaps in speed,
efficiency, and quality, New York, Free Press.
25
Figures and tables
Figure 1: Announcement of rule change on Facebook’s developer blog22
Figure 2: Average quality of applications launched before and after the rule change in 2008w7
(dotted line is average rating before/after the rule change)
22
Available at http://developers.facebook.com/blog/post/77, accessed September 13, 2011.

26
Table 1: Variable definitions and summary statistics
Variable Definition Mean SD Min Max
Usage intensity of an application measured as percentage of daily active users of
5.07 8.65 0.14 100
Dummy for the rule change (zero before sixth week of 2008 and one thereafter)
0.58 0.49 0 1
Time-invariant average user rating of an application
3.59 1.38 0.65 5
Total number of updates of an application divided by
0.15 0.24 0 5
Number of users that have installed an application (in million)
0.16 1.08 0 69.86
Weeks since an application has first appeared in Facebook’s application directory
13.97 10.38 0 48
Number of sister applications offered by the same developer
17.64 51.86 0 333
Notes: The number of observations for all variables is 109,233. All observations are restricted to be
within ten weeks of the rule change. Summary statistics are presented in linear form for all variables.
In the regressions, the logarithm of , , , and
is used.
27
Table 2: Pairwise correlations
Variable [1] [2] [3] [4] [5] [6] [7]
[1] 1.000
[2] -0.205 1.000
[3] 0.014 0.006 1.000
[4] 0.171 0.105 0.027 1.000
[5] -0.211 -0.002 -0.120 0.058 1.000
[6] -0.689 0.169 0.066 -0.138 0.341 1.000
[7] -0.047 -0.155 0.054 -0.098 0.018 -0.017 1.000
Note: All observations are restricted to be within ten weeks of the rule change.
28
Table 3: Random-effect model: how does the importance of application quality change?
DEPENDENT VARIABLE: (3-1) (3-2) (3-3)
Applications Only old Old+new Only old
INDEPENDENT Before After After VARIABLES Change Change Change
0.00887* 0.0279*** 0.0415*** (0.00491) (0.00457) (0.00493) 0.188*** 0.166*** 0.187*** (0.0211) (0.0217) (0.0349) -0.0225*** -0.115*** -0.117*** (0.00368) (0.00324) (0.00329) -0.872*** -0.576*** -0.534*** (0.00729) (0.00665) (0.00817) -0.0307*** -0.0309*** -0.0202*** (0.00266) (0.00454) (0.00452) Observations 46,312 62,921 51,882 Number of Applications 6,012 7,595 5,838 R² 0.633 0.452 0.353
Notes: Random-effect OLS point estimates with standard errors clustered on the application-level in
parentheses. Asterisks denote significance levels (*** p<0.01, ** p<0.05, * p<0.1). A constant and
dummies for the application category are estimated but not reported. ,
, , and are in logarithmic form, the other variables
enter in linear form. All observations are restricted to be within ten weeks of the rule change.

29
Table 4: Fixed-effect model: how are the drivers of usage intensity affected by the rule change?
DEPENDENT VARIABLE: (4-1) (4-2) (4-3)
Applications Old+new Old+new Only old
INDEPENDENT Baseline Rule Rule VARIABLES Regression Change Change
0.0100** -0.315*** -0.300*** (0.00490) (0.0223) (0.0224) 0.0377*** 0.0373*** (0.00303) (0.00303) 0.173*** 0.134*** 0.160*** (0.0195) (0.0201) (0.0218) 0.0722*** 0.124*** (0.0246) (0.0297) -0.230*** -0.170*** -0.172*** (0.00595) (0.00615) (0.00663) -0.0411*** -0.0419*** (0.00181) (0.00181) -0.653*** -0.742*** -0.744*** (0.00689) (0.00779) (0.00825) 0.188*** 0.184*** (0.00646) (0.00638) -0.00488* -0.0166*** -0.0167*** (0.00286) (0.00285) (0.00287) 0.0114*** 0.0121*** (0.00255) (0.00254) Observations 109,233 109,233 98,194 Number of Applications 7,784 7,784 6,027 R² 0.692 0.708 0.727
Notes: Fixed-effect OLS point estimates with standard errors clustered on the application-level in
parentheses. Asterisks denote significance levels (*** p<0.01, ** p<0.05, * p<0.1). A constant is
included but not reported. , , , and
are in logarithmic form, the other variables enter in linear form. All observations
are restricted to be within ten weeks of the rule change.

30
Appendix A
Table A. 1: Robustness check: random-effect model within five weeks of rule change
DEPENDENT VARIABLE: (A1-1) (A1-2) (A1-3)
Applications Only old Old+new Only old
INDEPENDENT Before After After VARIABLES Change Change Change
0.0148*** 0.0223*** 0.0354*** (0.00519) (0.00484) (0.00490) 0.172*** 0.194*** 0.264*** (0.0245) (0.0255) (0.0395) -0.00608* -0.122*** -0.113*** (0.00350) (0.00309) (0.00308) -0.864*** -0.526*** -0.516*** (0.00876) (0.00813) (0.0105) -0.0196*** -0.0345*** -0.0307*** (0.00267) (0.00435) (0.00438) Observations 26,283 30,956 27,351 Number of Applications 5,956 6,995 5,821 R² 0.538 0.367 0.368
Notes: Random-effect OLS point estimates with standard errors clustered on the application-level in
parentheses. Asterisks denote significance levels (*** p<0.01, ** p<0.05, * p<0.1). ). A constant and
dummies for the application category are estimated but not reported. ,
, , and are in logarithmic form, the other variables
enter in linear form. All observations are restricted to be within five weeks of the rule change.
31
Table A. 2: Robustness check: fixed-effect model within five weeks of rule change
DEPENDENT VARIABLE: (A2-1) (A2-2) (A2-3)
Applications Old+new Old+new Only old
INDEPENDENT Baseline Rule Rule VARIABLES Regression Change Change
-0.00830* -0.127*** -0.0201 (0.00449) (0.0242) (0.0234) 0.0275*** 0.0279*** (0.00297) (0.00295) 0.208*** 0.141*** 0.171*** (0.0283) (0.0277) (0.0306) 0.138*** 0.169*** (0.0285) (0.0313) -0.302*** -0.250*** -0.240*** (0.00720) (0.00754) (0.00784) -0.0394*** -0.0398*** (0.00171) (0.00171) -0.682*** -0.724*** -0.778*** (0.0108) (0.0111) (0.0121) 0.115*** 0.0823*** (0.00680) (0.00623) -0.00748** -0.0180*** -0.0201*** (0.00314) (0.00308) (0.00307) 0.0213*** 0.0227*** (0.00246) (0.00246) Observations 57,239 57,239 53,634 Number of Applications 7,158 7,158 5,984 R² 0.654 0.668 0.685
Notes: Fixed-effect OLS point estimates with standard errors clustered on the application-level in
parentheses. Asterisks denote significance levels (*** p<0.01, ** p<0.05, * p<0.1). A constant is
included but not reported. A constant is included but not reported. ,
, , and are in logarithmic form, the other variables
enter in linear form. All observations are restricted to be within five weeks of the rule change.
32
Table A. 3: Robustness check: fixed-effect model with dependent variable number of daily active
users
DEPENDENT VARIABLE: (A2-1) (A2-2) (A2-3)
Applications Old+new Old+new Only old
INDEPENDENT Baseline Rule Rule VARIABLES Regression Change Change
-0.117*** -0.370*** -0.201*** (0.00717) (0.0313) (0.0328) 0.0622*** 0.0617*** (0.00461) (0.00463) 0.205*** 0.136*** 0.191*** (0.0267) (0.0285) (0.0312) 0.154*** 0.264*** (0.0350) (0.0430) 0.709*** 0.781*** 0.764*** (0.00832) (0.00867) (0.00971) -0.0597*** -0.0618*** (0.00274) (0.00277) -0.774*** -0.874*** -0.890*** (0.00942) (0.0108) (0.0117) 0.188*** 0.139*** (0.00892) (0.00938) 0.00238 -0.0104*** -0.0126*** (0.00407) (0.00404) (0.00409) 0.00377 0.00461 (0.00387) (0.00388) Observations 109,233 109,233 98,194 Number of Applications 7,784 7,784 6,027 R² 0.374 0.398 0.393
Notes: Fixed-effect OLS point estimates with standard errors clustered on the application-level in
parentheses. Asterisks denote significance levels (*** p<0.01, ** p<0.05, * p<0.1). A constant is
included but not reported. A constant is included but not reported. ,
, , and are in logarithmic form, the other variables
enter in linear form. All observations are restricted to be within ten weeks of the rule change.
33
Appendix B (not intended for publication)
Figure B. 1: Example for an application entry in the Facebook application directory
34
Figure B. 2: Histogram of the dependent variable
Figure B. 3: Histogram of the transformed dependent variable
0.1
.2.3
Density
0 20 40 60 80 100UsageIntensity
0.5
11.5
2
Density
0 1 2 3 4 5ln(UsageIntensity)