incentives from stock option grants: a behavioral approach
TRANSCRIPT

HAL Id halshs-00681607httpshalshsarchives-ouvertesfrhalshs-00681607
Submitted on 27 Mar 2012
HAL is a multi-disciplinary open accessarchive for the deposit and dissemination of sci-entific research documents whether they are pub-lished or not The documents may come fromteaching and research institutions in France orabroad or from public or private research centers
Lrsquoarchive ouverte pluridisciplinaire HAL estdestineacutee au deacutepocirct et agrave la diffusion de documentsscientifiques de niveau recherche publieacutes ou noneacutemanant des eacutetablissements drsquoenseignement et derecherche franccedilais ou eacutetrangers des laboratoirespublics ou priveacutes
Incentives from stock option grants a behavioralapproach
Hamza Bahaji
To cite this versionHamza Bahaji Incentives from stock option grants a behavioral approach 28egraveme confeacuterence in-ternationale de lrsquoAssociation Franccedilaise de Finance May 2011 Montpellier France ppCD Roomhalshs-00681607
1
Incentives from stock option grants a behavioral
approach
Hamza BAHAJI
Universiteacute de Paris Dauphine DRM Finance
Abstract
Purpose ndashThis paper analyzes the valuation of stock options from the perspective of an employee exhibiting
preferences as described by Cumulative Prospect theory (CPT) In addition it elaborates on their incentives
effect and some implications in terms of design aspects
Designmethodologyapproach ndash The paper draws on the CPT framework to derive a continuous time model of
the stock option subjective value using the certainty equivalence principle Numerical simulations are used in
order to analyze the subjective value sensitivity with respect to preferences-related parameters and to investigate
the incentives effect
Findings ndash Consistent with a growing body of empirical and experimental studies the model predicts that the
employee may overestimate the value of his options in-excess of their risk-neutral value Moreover for typical
setting of preferences parameters around the experimental estimates and assuming the company is allowed to
adjust existing compensation when making new stock option grants the model predicts that incentives are
maximized for strike prices set around the stock price at inception This finding is consistent with companiesrsquo
actual compensation practices Finally the model predicts that an executive who is subject to probability
weighting may be more prompted than a risk-neutral executive to act in order to increase the firmrsquos assets
volatility
Originalityvalue ndash This research aims to propose an alternative theoretical framework for the analysis of pay-to-
performance sensitivity of equity-based compensation that takes into account a number of prominent patterns of
employee behavior that Expected Utility theory cannot explain It contributes to recent empirical and theoretical
researches that have advanced CPT framework as a promising candidate for the analysis of equity-based
compensation contracts
JEL Classification J33 J44 G13 G32 M12
Keywords Stock options Cumulative Prospect Theory Incentives Subjective value
DRM-Finance Universiteacute de Paris Dauphine Place du Geacuteneacuteral du Lattre de Tassigny 75 775 Paris Cedex 16 France E-mail
hbahajiyahoofr Acknowledgements the author is grateful to Clotilde NAPP Jean-Franccedilois CASTA Jacques HAMON Farhat SELMI
and Khalid ARDEM for their valuable comments
2
Introduction
Instead of an increasing interest for restricted stock and performance unit plans the 2006 Hewitt
Associates Total Compensation Measurement survey has revealed that stock options are still the most
prevalent long term incentive vehicle1 The stated argument for the large use of executive stock
options is that they align the interests of executives and shareholders since they provide incentives for
the manager to act in order to increase the firm value The use of stock options has even overtaken the
traditional arena of executive population Actually firmsrsquo compensation practices show that stock
options are issued to reward non-executive employees as well This may seem puzzling at first sight in
that the agency argument underlying the use of stock options is no more reliable under the non-
executive employees view because the formers are unlikely to influence the firm value by their
decisions (Spalt 2008) Nevertheless issuance of non-executive stock options results obviously from
an agreement between the firm and the employee upon the terms of the compensation involving stock
options which means that employees may be interested in stock options In order to figure out the
reason why stock options may be attractive to employees it is crucial to assess the utility they receive
from them Moreover understanding how employee evaluates its stock options (ie their subjective
value) allows assessing their incentive power and the implied employee behavior in terms of risk
taking
Most of the theoretical literature on stock options relies on the Expected Utility theory (EUT
henceforth) framework to derive models of option value from the employee perspective These models
predict that the nontransferability of the options and the hedging restrictions faced by the employee
make him value his options below their issuance cost born by the company (ie their risk neutral
value) A seminal work by Lambert et al (1991) has introduced a general theoretical framework to
analyze the valuation of equity based compensation contract from a managerrsquos perspective The
authors studied stock option contracts as a specific example They used the certainty-equivalence
principle to derive the so-called subjective value model Their model assumes that the manager is a
risk-averse agent with a power utility function and that he integrates his stock options in his global
wealth assessment process They proved that the subjective value decreases in risk aversion and
increases in the manager diversification with respect to the company specific risk Moreover they
showed that stock options may not provide incentives for a risk-averse manager to select actions that
increase the variance of the company stock price Hall and Merphy (2000 2002) followed the same
approach to analyze the risk-adjusted value of executive stock options along with their pay-to-
performance sensitivity Their major findings provide an economic rational to observed equity based
compensation practices while perhaps troubling from an efficiency perspective Mainly they showed
that pay-to-performance incentives from stock options when these are granted as an add-on to existing
1 80 of the responding participant companies to the survey have reported that stock option grants represent in
2006 on average about 54 of their global long-term incentives
3
compensation are typically maximized by setting their exercise price around the stock price at
inception In contrast when options grants are assumed to be accompanied by reductions in cash
compensation their model predicts that restricted stocks provide much higher incentives for
executives to increase the firm value and may then be preferred to stock options Henderson (2005)
has built on the previous works to examine the effect on valuation and incentives of market risk and
firm-specific risk She proposed a continuous time utility-based model to value stock options from the
managerrsquos perspective A prominent assumption in his model is allowing the executive to invest the
remainder of his wealth (excluding stock options) in the market portfolio2 and a risk-free asset In
particular her results suggest that stock options do not provide incentives to increase total risk but the
beta of the company instead She also finds that incentives decrease in firm-specific risk whilst they
may either decrease or increase in market risk depending on other factors In addition similar to Hall
and Murphy (2002) the authorrsquos model supports the grant of restricted stocks rather than stock options
under efficient contracting framework
A common finding of the EUT-based models is that the stock options value to a risk-averse
undiversified employee is strictly lower than the value to a risk-neutral well diversified outside
investors This is nevertheless in stark contrast to several surveys and empirical findings documenting
that employees may value their options above their risk-neutral value (ie the so-called Black Scholes
value) Lackerrsquos and Lambertrsquos (2001) research based on a survey of KnowledgeWharton readers
revealed that managers value their options substantially above the Black Scholes value (BS
henceforth) Moreover the survey revealed that younger managers have the most upward bias in the
values they perceive from their options According to the authors these results suggest that managers
do not fully understand the valuation of stock options or possibly their incentive effects Another
argument supporting managers may tend to overestimate their options value is provided by Yermack
(1997) He argues that to the extent that company executives have superior information regarding
company prospects and can time their option grants accordingly they may actually value options
higher than would outside investors do Furthermore relying on behavioral theories recent researches
have found evidence on employees drawing on heuristics and subject to psychological bias while
valuing their options which may lead them to overestimate the value of their options For instance
Devers et al(2007) study examines the effects of endowment and loss aversion on managersrsquo
subjective stock-option valuation Their main findings show that managers endow value from granted
unexercisable options in a way that they value them in excess of their objective value (ie BS value)
In the same vein Sawers et al(2006) drew conclusions from an experiment involving MBA students
consistent with the view that loss-averse managers subjectively overvalue stock options relative to
2 Prior works by Detemple and Sundaresan (1999) and by Cai and Vijh (2004) have used trees approach tied to
specific numerical schemes to study utility-based valuation of executive stock options when the executive can
invest in the Market portfolio
4
restricted stocks and therefore will be less risk-seeking when awarded with stock options and more
risk-seeking when endowed with restricted stocks
Moreover standard normative models fail to predict stock options as part of the compensation
contract Several quantitative studies taking place in principal-agent framework showed that EUT-
based models predict optimal compensation contracts that do not contain convex instruments like
stock options (Holmstrom and Milgrom 1987 Dittmann and Maug 2007) Consistent with these
findings studies focused on the effect of stock option and restricted stock grants on managerial effort
incentives (Jenter 2001 Hall and Murphy 2002 Henderson 2005) conclude that stock options are
inefficient tools for creating incentives for risk-averse managers when they are granted by mean of an
offset of cash compensation
This paper analyzes the valuation of stock options and their incentives effect to an employee
exhibiting preferences as described by Cumulative Prospect Theory (Tversky and Kahneman 1992) It
aims to propose an alternative theoretical framework for the analysis of pay-to-performance sensitivity
of equity-based compensation that takes into account a number of prominent patterns of employee
behavior that standard EUT cannot explain Specifically the key assumption underlying this work
proceeds from Cumulative Prospect Theory (CPT hereafter) and states that the employee choices
under risk display four main features Firstly instead of assessing outcomes based on their
contribution to his final wealth the employee assesses outcomes utility over gains and losses
determined relative to a reference level or a benchmark The second feature is loss-aversion It
conveys the experimental evidence that people are more sensitive to losses than they are to gains In
other words losses loom larger than gains The third feature consists in the principle according to
which people choices display diminishing sensitivity to incremental gains and losses The last piece is
the nonlinear probability processing It involves the well established tendency of individuals to
overweight small probabilities of large gains3 I drew on this theoretical framework to derive a
continuous time model of the stock option subjective value using the certainty equivalence principle I
then performed sensitivity analyses with respect to preferences-related parameters and found that loss
aversion and probability weighting have countervailing effects In particular I showed that the more
the employee is loss averse the less would the option be worth to him In addition I proved that the
option subjective value is increasing in probability weighting degree My analyses also show that for
a given level of option moneyness the subjective value of the option may lie strictly above the BS
value when the effect of probability weighting tends to dominate that of loss-aversion These results
lead to the conclusion that the lottery-like nature of stock-options combining large gains with small
probabilities may make them attractive to employees subject to probability weighting which is
3 There exists a large literature comprising empirical and experimental applications of overweighting small
winning probabilities This literature include notably Thaler and Ziemba (1988) Kachelmeier and Shehata
(1992) Cook and Clotfelter (1993) Loughran and Ritter (1995) and Jullien and Salanie (2000)
5
consistent with the proposition that employee option value estimate may exceed the BS value
(Lambert and Larcker 2001 Hodge et al 2006 Sawers et al 2006 Hallock and Olson 2006
Devers et al 2007)
Furthermore this work elaborates on incentives from stock options and on some implications in
terms of design aspects Following previous researches I defined incentives as the first order
derivative of the subjective value with respect to the stock price A numerical analysis of the incentive
function shows that stock option incentives are increasing in employeersquos degree of probability
weighting and may even lie above incentives for a risk-neutral individual Moreover I considered the
incentive effects of setting the strike price of the option above or below the stock price at inception In
this analysis I relied on Hallrsquos and Murphyrsquos (2002) methodology in solving for the exercise price that
maximizes incentives holding constant the company cost of granting the options Similar to their
approach I explored two situations In the first situation I assumed that the firm is precluded from
changing any component of the employee compensation package In this case the model predicts that
when the effect of probability weighting prevails (ie dominates that of loss-aversion) incentives
could be infinitely increased by granting more and more options at higher and higher strikes which
suggests that employee would be much more interested in premium options instead of discount
options However when loss-aversion effect dominates the model predicts that incentives are
maximized within strike price ranges that may include the grant date stock price depending on the
level of loss-aversion In the second situation the company is assumed to be allowed to adjust existing
compensation when making new stock option grants For typical setting of preferences parameters
around the experimental estimates from CPT (Tversky and Kahneman 1992) the model predicts that
incentives are maximized for strike prices set around the stock price at inception which is consistent
with companiesrsquo actual compensation practices Additional analyses suggest also that loss-averse
employees who are not subject to probability weighting or even with very low degrees of probability
weighting receiving options at high exercise price would willingly accept a cut in compensation to
receive instead deep discount options or restricted shares for those of them displaying more loss-
aversion This result is broadly consistent with Hall and Murphy (2002) and Henderson (2005)
findings for non-diversified risk-averse employees
The last item discussed in this paper is the risk taking incentives implied by stock option grants
Similar to previous studies I defined incentives for risk taking as the first order derivative of the
subjective value with respect to stock price returns volatility The first essential result from this
analysis is that incentives for risk taking are increasing with probability weighting degree In fact
probability weighting leverages the positive effect of volatility on the subjective value through the
convexity of the option payoff Another important finding from the model is that an option-
compensated executive subject to probability weighting may be more prompted than a risk-neutral
executive to act in order to increase assets volatility Moreover consistent with findings from EUT-
6
based models the CPT model predicts that a loss-averse probability-weighting-free executive may not
prefer an increase in the variance of the company stock price return
This work is motivated by recent empirical and theoretical researches on employee compensation
incorporating CPT-based models These models have proved successful in explaining some observed
compensation practices and specifically the almost universal presence of stock options in the
executive compensation contracts that EUT-based models have difficulties accommodating their
existence Therefore they have advanced CPT framework as a promising candidate for the analysis of
equity-based compensation contracts This literature includes in particular Dittmann et al (2008) who
developed a stylized principal-agent model that explain the observed mix of restricted stocks and stock
options in the executive compensation packages It also includes Spalt (2008) who used the CPT
framework and especially the probability weighting feature to prove that stock options may be
attractive to a loss-averse employee subject to probability weighting He then explained the puzzling
phenomenon that riskier firms are prompted to grant more stock-options to non-executive employees
This article proceeds as follows The first section describes the features of stock option value from
the perspective of a representative employee with preferences as described by CPT Throughout this
paper we will refer to this employee as a ldquoCPT employeerdquo This section provides also numerical
analyses on the model sensitivity to preferences-related parameters The next section introduces
incentive effects of stock options for a CPT-employee and examines some design implications in
terms of strike price setting The risk taking incentives question is explored in the third and last
section Appendices provide proofs of the propositions in the first section
1 Stock option value from a CPT-employee perspective
In this section I develop a base-case model for analyzing the value of the stock-option contract
from the perspective of a representative employee with CPT-based preferences (subjective value
henceforth) Specifically I assume that the employee is granted a European call option on the
companyrsquos stock denoted by S with maturity date t T and strike price K These are the traditional
features of executive stock options as reported in Johnson and Tian (2000) and used by prior studies
focused on stock option incentives (Lambert et al 1991 Hall and Murphy 2002 Henderson 2005)
Often in practice stock options are Bermudan-style options Thus my model relies on a naiumlve setting
in that it ignores complications related to early exercise or forfeitures
11 Theoretical framework
111 Stock-option contract
7
The stock option contract is issued in 0t The contract payoff at expiry t T is
T T
h S K
I make the assumption that the employee is not allowed to short-sell the company stock and that
he can earn the risk-free rate r from investing in a riskless asset Moreover the price dynamic of the
stock is given by a geometric Brownian motion represented by the following SDE
t t t tdS r q S dt S dZ (1)
Where t
Z is a standard Brownian motion with respect to the probability measure IP 2
and q are
respectively the total variance of the stock price returns and the dividend yield
112 Risk preferences
Following Tversky and Kahneman (1992) I consider that to each gamble with a continuous
random outcome y IR which the probability density function is denoted by f y the employee
assigns the value
IR
E y v y d f y
(2)
Note that the expectation E
is a function of two distinct functions The first function v
called the value function is assumed of the form
y yv y
y y
where 0 1 and 1 (3)
This formulation has some important features that distinguish it from the standard utility
specification First the utility is defined over gains and losses assessed based on the reference point
denoted by This idea was proposed first by Markowitz (1952) As pointed out by Barberis and
Thaler (2003) it fits naturally the way people perceive attributes in everyday life relative to their
previous levels rather than in absolute fashion The second important feature is the shape of the value
function While it is convex over losses it is concave over gains which represents the observation
from psychology that people are risk averse over gains and become risk-seeking over losses
Moreover the value function has a kink at the origin introduced by the parameter 1 This feature
known as loss-aversion gives a higher sensitivity to losses compared to gains Finally outcomes are
8
treated separately from other components of wealth which reflects the well-documented phenomenon
of narrow framing4 (Thaler 1999)
The second function
a b is called the weighting function It applies to cumulative
probabilities represented by the cumulative probability function F in order to transform them into
decision weights according to
1
1
1
(1 )
(1 )
a
a a a
a bb
b b b
F yy
F y F y
F y
F yy
F y F y
where 028 1a and 028 1b 5 (4)
This function stands for another piece of CPT which is the nonlinear transformation of
probabilities Specifically it captures experimental evidence on people overweighting small
probabilities and being more sensitive to probability spreads at higher probability levels (eg a jump in
probability from 07 to 09 would be more striking to individual than an equal-sized jump from 01 to
03) The degree of probability weighting is controlled separately over gains and losses by the
weighting parameters a and b respectively The more these parameters approach the lower boundary at
028 the more the tails of probability distribution are overweighted For instance when 1a b
probability weighting assumption is relaxed For simplicity these parameters are assumed to be equal
(ie a b ) and the weighting function will be denoted a
in the rest of this paper Finally it is
worth mentioning that this function (i) infinitely-overweights infinitesimal probabilities since
0
lima
p
p
p
and (ii) infinitely-underweights near-one probabilities in that
1
1lim
1
a
p
p
p
12 Stock option subjective value
121 The model
4 Narrow framing refers to people tendency to treat individual gambles separately from other portions of wealth
It stands for an important feature of Mental Accounting the mental process by which individuals formulate
problems for themselves (eg the way they code outcomes) Mental accounting is captured in CPT via the
nonlinear shape of the value function 5 The lower boundary at 028 is a technical condition to insure that a b
p
p
is positive over ]01[ as required by
the following first order condition 1 1 1 0aa
a p a p p p
9
In order to estimate the subjective value of the stock option contract described above I use the
certainty equivalent approach similar to that adopted by Spalt (2008) In particular this value is
defined as the cash amounta
C
that leaves the employee indifferent between this amount and the
uncertain payoff of the contract T
h irrespective of the composition of the remainder of his private
wealth Formally a
C
is the solution of the following equation
=
a
rT
a IP T
T a T
IR
v C e E v h
v h d F S
(5)
The left-hand side of the equation above represents the benefit for the employee from receiving
the cash amount a
C
instead of the stock option contract at the inception of the latter This amount is
assumed to be placed into the risk-free asset over the whole lifetime T of the stock option contract
The other side of the equation gives the expected utility to the employee from receiving the risky
payoff implied by the value function v
Here the expectation a
IPE relies on the transformed
probability measurea
IP
Let a
E
represent the expectation in the right-hand side of (5) It follows from (5) and (3) that
1
1
0
1
rT
a a
a
rT
a
E e if E
C
E e otherw ise
(6)
Where a
E
should write
1 2 3
a a a aE I I I
(61)
With
1
1
x
a a
l
I g x K u du x dx
(62)
1
2
2
l x
a a
l
I K g x u du x dx
(63)
10
2
3
l
a aI x dx
(64)
2
2( )
r q T T x
g x Se
(65)
2
1
ln2
Sr q T
Kl
T
(66)
2
2
ln2
Sr q T
Kl
T
(67)
Here is the Gaussian density function and a
a
pp
p
is the first-order partial derivative
of a
which is defined over 01 as follows
1
1
111
1
111
1
1 11
(1 )1
1
(1 )
1
aaa l
a a
aa a
aaa
la
a a
aa a
p p ppa p x dx
p pp p
p
p p pp
a p x dxp p
p p
(68)
122 Reference point set up
Although CPT specifies the shape of the value function around the reference point it does not
provide guidance on how people set their reference points Neither does most of the psychological
literature relying on the assumption according to which the reference point is the Status quo Instead
this literature admits both the existence and the importance of non-status quo reference points since
ldquothere are situations in which gains and losses are coded relative to an expectation or aspiration level
that differs from the status quordquo (Kahneman and Tversky 1979)
Research on the Disposition Effect6 has paid greater attention to non-status quo reference points
(Shefrin and Statman 1985 Heisler 1998 Odean 1998a Gneezy 1998) These studies have found
6 Disposition effect is a term coined by Shefrin and Statman (1985) to refer to the tendency of individual
investors to hold loser stocks and sell winner stocks defined relative to a purchase price reference point
11
strong evidence that reference points are set in a dynamic fashion In particular Gneezy (1998)
documented that maxima are more effective predictors than are purchase prices
More specifically in studding exercise behavior of stock options holders Huddart and Lang
(1996) Heath et al (1999) and Bahaji (2009) have shown empirically that exercise activity is linked to
share price historical maxima These findings are consistent with employee exercise decisions take
into account the level of share price with respect to non-status quo reference points
In principle employee would update the reference point in a way that fits with his own
expectations regarding the underlying share price at expiry Intuitively the employee could estimate
the intrinsic value of the option based on his future share price forecasts as he can rely on the Black
Scholes value of the option disclosed by the firm Following Spalt (2008) I consider that the reference
point parameter in the model is the BS value7 Beyond the argument of empirical evidence on
employee exercise behavior depending on non-status quo reference points this assumption is
supported by firms common practices in terms of stock option compensation Most of stock-option
designers use the BS model in order to estimate the value of stock options as constituents of the total
compensation package This value is usually announced to the employee at the inception of the
options Moreover the BS model is recommended in the FASB and the IASC guidelines for
determining the fair value of stock options (ie the amount an outside investor with no hedge
restrictions would pay for the option) that needs to be disclosed in the financial statements These
statements comprising the BS value of the stock options are provided to shareholders as well as
stakeholders including employees
123 The impacts of preferences-related parameters a numerical analysis
To provide a concrete outline on the profile of the subjective value yielded by the model relative
to the risk neutral value profile I performed a numerical analysis8 of the value of a 4-year call option
( 4T ) with a strike price 100K For the remaining option-related parameters the figures were
computed assuming no dividend payments ( 0q ) 30 and 3r Moreover I set the
curvature parameter of the value function ( ) and the loss aversion coefficient ( ) to respectively
088 and 225 based on experimental estimates from CPT (Tversky and Kahneman 1992)
7 To be more precise the value used here is the expectation of the option payoff at expiring yielded by the BS
model (ie the nondiscounted BS value) Consistent with this specification the probability measure IP used to
derive the subjective value in (6) is the risk neutral probability measure Moreover ignoring the probability
weighting feature (ie 1a ) this setting allows the subjective value implied by the model to converge towards
the risk neutral value (ie BS value) when the preferences of the employee tend to risk neutrality
(ie 1 ) 8 The integrals in (62) (63) and (64) were computed numerically
12
Figure-1 Option value against the stock price This figure is
a plot of the subjective value computed under different
probability weighting parameters (the blue curves) It
illustrates the profile of the subjective value compared to that
of the risk neutral value (red curve) The Parameters used
are T=4 K=100 σ=30 r=3 q=0 =225 α=088
Figure-2 Sensitivity to probability weighting This figure is
a plot of the partial derivative of the subjective value with
respect to ldquoardquo against both ldquoardquo and the stock price volatility
ldquoσrdquo It exhibits the local effect of probability weighting given
the payoff distribution skewness captured by ldquoσrdquo The
derivative was computed numerically based on the following
parameters T=4 K=S=100 r=3 q=0 =225 α=088
Furthermore in order to calibrate the probability weighting function I used three different values of
the parameter a within the range of values estimated in the experimental literature9
Figure 1 depicts the option value as a function of the stock price The three blue curves represent
the value profiles from the perspective of three CPT employees with the same value function and
different degrees of probability weighting At first sight depending on the degree of probability
weighting and the option moneyness (S
K) the subjective value could lie either under or below the BS
value In contrast standard EUT-based models predict that the option value from a risk-averse
employee perspective is systematically lower than the risk-neutral value (Hall and Murphy 2002
Henderson 2005) These preliminary results are consistent thought with some empirical findings
suggesting that frequently employees are inclined to overestimate the value of their stock-options
compared with the BS value (Lambert and Larcker 2001 Hodge et al 2006 Sawers et al 2006
Hallock and Olson 2006 Devers et al 2007)
9 Tversky and Kahneman (1992) got 065 on average (a=061 for gains and b=069 for losses) These results are
corroborated by Abdellaouirsquos (2000) findings (a=060 for gains and b=070 for losses hence an average of 065)
In addition Camerer and Ho (1994) obtained a=056 for gains whereas Gonzales and Wu (1996) and Bleichrodt
and Pinto (2000) found a=071 and a=067 respectively
13
The results presented in figure 1 show that the option subjective value is increasing in probability
weighting degree (ie decreasing in parameter a ) Actually given the asymmetric profile of the option
payoff the expectation a
E
in the subjective value formula (6) is positively affected by the emphasis
put on the tail of the payoff distribution which is governed by the parameter a the lower a the more
overweighed will be small probabilities and the more underweighted will be medium to large
probabilities This lottery-like nature of an option combining large gains with small probabilities may
make it attractive to a CPT employee subject to probability weighting This preliminary outcome leads
to proposition 1 which stats that
Proposition 1 the value of the stock option contract to a CPT- employee is increasing with
respect to his degree of probability weighting (ie is decreasing with respect to a)
(Proofs are provided in appendix A)
Moreover the effect of probability weighting is expected to increase with the skewness of the
distribution of the underlying stock price which is captured by the volatility parameter given the
Log-normality assumed in the model In order to show that I performed a numerical analysis of the
sensitivity of the subjective value to the probability weighting degree as a function of the volatility
and the parameter a This sensitivity is defined as the partial derivative of subjective value with
respect to a (a
C
a
) The results are reported in figure 2 in the form of a graph It shows that the
sensitivity to parameter a is negative and locally decreasing in volatility That means that the more the
share price is volatile the more the option will be attractive for a CPT employee subject to probability
weighting This supports Spaltrsquos (2008) findings that the effect of probability weighting provides an
economic rationale to riskier firms (ie more volatile firms) for granting more stock options to non-
executive employees
Furthermore I investigate the effect of loss aversion on the subjective value The variable of
interest here is In an analogical sense with the EUT framework the option value from the
perspective of a loss-averse employee is expected to decrease with his degree of loss-aversion To
verify this I computed numerically the first order derivative with respect to (
aC
) crossed over
various levels of and moneyness ranging from 005 to 1 and from 5 to 200 respectively The
outcome is reported in figure 3 It shows that the sensitivity to loss aversion is negative and locally
decreasing in moneyness That means that the more the employee is loss averse the less would the
option be worth to him This conclusion is taken up in proposition 2 hereafter
14
Figure-3 Sensitivity to loss aversion This figure is a plot of the
partial derivative of the subjective value with respect to ldquoλrdquo
against both ldquoλrdquo and the stock price ldquoSrdquo It exhibits the local effect
of loss aversion given the option moneyness The derivative was
computed numerically based on the following parameters T=4
σ=30 K=100 r=3 q=0 a=065 α=088
Figure-4 Sensitivity to the curvature parameter This figure is a
plot of the partial derivative of the subjective value with respect to
ldquoαrdquo against both ldquoαrdquo and the stock price ldquoSrdquo It exhibits the local
effect of the curvature parameter given the option moneyness The
derivative was computed numerically based on the following
parameters T=4 σ=30 K=100 r=3 q=0 a=065 λ =225
Proposition 2 the value of the stock option contract to a CPT- employee is decreasing with
respect to his degree of loss-aversion (ie a decreasing function of λ)
(Proofs are provided in appendix B)
I performed a similar analysis in order to get a view on the effect of the curvature parameter In
the same way I assessed locally the first order derivative with respect to within a range of values
from 005 to 1 and using share prices ranging from 10 to 200 Figure 4 shows that this derivative is
locally increasing with the option moneyness for values of above say 075 It also shows broadly
that the subjective value is an increasing monotone function of over a range of values around the
experimental estimate of 088 (from 07 to 1) irrespective of the option moneyness
2 Incentives from stock-options
Stock-options are incentive tools used within a principal-agent relationship to align the interests of
the agent (employee) on those of the principal (shareholders) The shareholders grant stock options in
15
order to provide the employee with incentives to make efforts that enhance the value of the firm and
thus their own wealth Indeed assuming that employees are aware of how their actions affect the share
price option holdings will prompt them to make efforts that increase share price Therefore the
incentive from a single option grant will depend on the degree of the sensitivity of the subjective value
to the stock price
21 The incentive measure
Following Jensen and Murphy (1990) Hall and Murphy (2000 2002) and others I defined the
incentive effect as the first order derivative of the subjective value with respect to share price (
aC
S
)
which defines how the value from the employee perspective changes with an incremental change in
the stock price As we can see in figure 5 which is a plot of
aC
S
for three values of a incentives
are greatest for in-the-money10
options Also the incentive effect is increasing with the degree of
probability weighting Another observation that can be made from figure 5 is that for sufficiently high
level of probability weighting the option can give much more incentive to increase stock price than is
reflected by the BS delta This is consistent with my previous finding that the subjective value can
overstate the BS value Note that consistently with the EUT-based models when the employee
process probabilities in a linear way ( 1a ) - which means that the probability weighting assumption
is relaxed and only loss-aversion matters - the incentives lie strictly under the BS delta whatever the
level of the option moneyness That is to say that the options are less attractive for both risk-averse
employee and loss-averse employee who are not subject to probability weighting The analysis in
figure 6 supports this It shows that with a hold constant at 065 incentives are decreasing in loss-
aversion Conversely with loss-aversion parameter set to 1 which means that the loss-aversion
effect is neutralized incentives for a representative loss-neutral employee with a degree of probability
weighting equal to experimental estimate of 065 overstate the BS delta
10
The terminology ldquoat-the-moneyrdquo is referring to stock-options with an exercise price equal to the stock price at
inception The expressions ldquoOut-of- the-moneyrdquo and ldquoIn-the-moneyrdquo are also used throughout the paper to refer
to options with strike price respectively below and above the grant date stock price
16
Figure-5 The effect of probability weighting on stock-option
incentives This figure is plots of the partial derivative of the
subjective value with respect to stock price ldquoSrdquo against the option
moneyness It exhibits the combined effects of probability
weighting and option moneyness on incentives The derivatives
were computed numerically assuming three different levels of
probability weighting (see the legend above) and holding the
remaining parameters constant at the following values T=4
σ=30 K=100 r=3 q=0 λ=225 α=088
Figure-6 The effect of loss-aversion on stock-option incentives
This figure is plots of the partial derivative of the subjective value
with respect to stock price ldquoSrdquo against the option moneyness It
exhibits the combined effects of loss-aversion and option
moneyness on incentives The derivatives were computed
numerically assuming three different levels of loss-aversion (see
the legend above) and holding the remaining parameters constant
at the following values T=4 σ=30 K=100 r=3 q=0
a=065 α=088
22 Implications for stock option design optimal strike price
Setting the strike price of standard stock options boils down to defining the threshold against which
the performance is assessed and consequently to determining the likelihood of a final payout As we
have just noticed from figure 5 and figure 6 incentives increases in the option moneyness and
equivalently decreases with strike price In parallel from the shareholders perspective granting in-
the-money options is much more costly than granting out-of-the money or at-the-money options
(recall figure 1) This leads the firm to a trade-off to make when setting the exercise price of the
options in the sense that holding his cost unchanged she could either grant fewer options at a low
strike price or increase the grant size at higher exercise price
I relied on the methodology from Hall and Murphy (2002) in figuring out the optimal exercise price
satisfying the double purpose of maximizing incentives and holding constant the firmrsquos cost of
granting options I also considered two situations In the first situation the firm does not adjust the
existing compensation package when grating additional stock options Thus these additional options
are considered as a pure add-on to existing compensation In the second situation however the
employee and the firm are allowed to bargain efficiently over the terms of the compensation Thus the
17
firm is assumed to fund additional options by an adjustment to other compensation components that
leaves the employee indifferent between his initial package and the new package including the
additional grant
221 Situation 1 Option grant without a compensation offset
When the firm is not allowed to adjust the existing compensation package the optimal strike price
that maximizes incentives for a given amount of firm cost is the solution to the following constrained
optimization problem
m ax
a
K
nC K
S
such that n K c (7)
Where a
nC K
S
denotes the incentives from receiving n options with a strike price K and
K the per-unit cost or the BS value of one option
The optimization problem in (7) is solved numerically by varying the parameter K First the BS
value is computed for a given K which enable to determine the grant size n that leaves the firm cost
constant at c in accordance with the constraint in (7) Then the cost function a
nC K
S
is assessed
based on n and K This procedure is reiterated recursively until the optimal value of K is found
I set the total cost for the firm at euro28 333c (hence a grant of 1000n at-the-money options
based on the retained option-related parameters) As reported in figure 7 I varied the preferences-
related parameters a and within specific ranges in order to figure out the conditions under which an
optimal strike may exist and the robustness of the model predictions The chart on the left-hand side
exhibits the total incentives from the grant as a function of the strike price and the probability
weighting parameter with the loss-aversion held constant at 225 It shows that the convexity and
the monotony of the total incentives function ( a
nC K
S
) shift with the degree of probability
weighting while it is concave and non-monotone over the range of strike prices for low levels of
probability weighting ( 0906a ) it becomes convex and monotonically increasing for higher levels
Moreover for higher level of volatility probability weighting is expected to affect more deeply the
shape of total incentives function (recall figure 2)
Specifically when the effect of probability weighting prevails (ie dominates that of loss-aversion)
the model predicts that incentives could be infinitely increased by granting more and more options at
higher and higher strikes This result suggests that if the employee is subject to a degree of probability
18
weighting that could potentially lead him to overstate the value of the option in excess of the BS value
he would ask for the maximum number of options (as much options as the company could possibly
grant him) at their (highest) breakeven strike the higher the strike price the more small probabilities
of large gains there are and the more valuable become options to him Furthermore this means that
such an employee would be much more interested in premium options instead of discount options
Actually although this result is in stark contrast with the common stock-based compensation practices
that consist in granting broadly at-the-money options it shouldnrsquot be rejected without taking into
account the other factors restricting the number of options the company could issue irrespective of
their strike prices such like capital dilution limits
In addition as we can notice from the plot in the middle of figure 7 the effect of probability
weighting on total incentives could be offset by an increasing loss-aversion This time is varied and
a held constant at 065 which meets the experimental estimate When the loss-aversion effect
dominates the total incentives function tends to non-monotone concave shapes which means that it
admits finite extremas In particular when probability weighting effect is neutralized by setting 1a -
in other words the employee is not subject to probability weighting - total incentives curve tends to
flatten around the optimum (see the green curves on the right-hand side plot) This suggests that there
exists a range of strike prices that yield quasi-similar incentives For instance with loss-aversion set
at 225 optimal strike (as of stock price at inception) is about 142 and lies within a range of
values from 121 to 153 that yield total incentives of about euro530 (rounded figure) With 6
the optimal strike drops by almost 30 (to 112) and total incentives are flat around the maximum
value of euro450 within the range from 91 to 111 Note that these results are consistent with Hallrsquos
and Murphyrsquos (2000 2002) findings relying on the EUT framework Consistently their work
documented that incentive-maximizing strike price exists when the options are considered as an add-
on to existing compensation In addition they showed that total incentives are relatively flat around
the maximum and that optimal strike price decreases for more risk-averse and less diversified
employees
19
Figure-7 Incentives from options grant with total cost of euro28 333 assuming no adjustment to existing compensation package This figure is plots of
incentives (in Keuro) from options grant for a given strike price holding the total BS value of the grant constant at euro28 333 Total incentives are defined as the
partial derivative of the total subjective value of the grant with respect to stock price ldquoSrdquo The sub-figure on the left-hand side depicts total incentives as a
function of the strike price and probability weighting parameter That in the middle is a plot of total incentives against strike price and loss-aversion The
sub-figure on the right-hand side exhibits the combined effect of probability weighting and loss-aversion on the shape of total incentives as a function of
strike price The derivatives were computed numerically based on the following parameters T=4 σ=30 S=100 r=3 q=0 α=088
222 Situation 2 Option grant with an adjustment to existing compensation
Now letrsquos considerer that the company is allowed to make an efficient adjustment to existing
compensation components (cash for example) in order to grant additional options to the employee
The impact of this adjustment should be neutral with regard to the total compensation cost for the
company Moreover assuming this adjustment involves cash compensation it must be attractive to the
employee so that hersquod be willing to give up some cash compensation against extra options grant
Therefore it must leave the employee at his initial total subjective value of the compensation package
It follows that the strike price that maximizes total incentives for a given company cost is the solution
of this following optimization problem
m ax
a
K
nC K
S
subject to a
n K nC K c
and 0n (8)
20
Where c is a fixed constant The constraint in (8) is the aggregation of the company cost constraint
and the employee value constraint used in Henderson (2005)
Similar to that in (7) this optimization problem was solved numerically In this analysis c was
chosen such that for retained parameters the number of granted at-the-money options n is around
1000 hence total cost of euro28 333 Once c is set n is determined from the constraint in (8) for a given
strike price K S then total incentives
anC K
S
are assessed These are depicted in figure 8
The left-hand side sub-figure exhibits total incentives for different levels of K and probability
weighting parameter a with risk aversion held constant at 225 For each combination of K and
a the constraint in (8) is solved for n which allows to determine total incentives The plots indicate
that when the employee is deeply subject to probability weighting ( 0475a )
anC K
S
is
strictly decreasing throughout the depicted range of strike prices (see the curves in blue) In this case
similar to EUT-based studiesrsquo findings (Hall and Murphy 2002 Henderson 2005) incentives are
maximized through restricted stocks grant rather than stock options The intuitive reason behind that
is given that the employee systematically values the options in excess of their BS value efficient
trade-off over compensation allocation is made via the grant of equity-based instruments that
employee values at their actual cost restricted stocks for instance
However for lower degrees of probability weighting (typically 0475 085 a ) the optimal
strike price is not nil and tends to increase with a Specifically the optimization problem is defined
on the right (see the red solid curve) or on the left (see the red dashed curve) of the optimal
strike
K and
anC K
S
admits an infinite branch in
K (ie total incentives are infinite at that
point) The technical reason behind that is that the subjective value is equal to the BS value at the
optimal strike which yields according to the constraint in (8) an infinite grant size
(
lim
K K
n K ) For instance
K ranges from 60 to 195 when a takes values within a range
of value around the experimental estimates ( 055 070a )11
This suggests that depending on the
extent to which employee weights probabilities either grants of discount options or premium options
may result in a Pareto optimum to the contract As a specific example for an employee with
0616a the optimal strike price
K is around 100 which means that for the prevailing setting
the model predicts at-the-money options as optimal in an efficient contracting framework since the
companyrsquos cost of granting these options is equal to their value to the employee In this case granting
11
Optimal strikes are expected to be lower for higher stock price volatility since probability weighting effect
tends to increase with volatility (recall figure 2)
21
options with strike price around the stock price at inception which is consistent with observed
practices results in a perfect reconciliation of the company and the employee respective views Note
that for a similar setting in the previous situation where the options are given as an add-on to existing
compensation the model indicates that incentives from stock options could be infinitely increased by
granting increasingly more options at greater and greater strike price
Furthermore for weak degrees of probability weighting ( 085 a ) the subjective value of the
option lies strictly below the BS value because the effect of loss-aversion tends to dominate that of
probability weighting Thus the total incentives function takes a non-monotone concave shape and
shows finite extremas ranging from 35 to 81 In particular when probability weighting assumption
is relaxed ( 1a ) the function flattens around the maximum and approaches a monotone decreasing
shape with increasing loss-aversion (see sub-figure on the right-hand side) This result suggests that
loss-averse employees who are not subject to probability weighting - even with very low degree of
probability weighting - receiving options at high exercise price would willingly accept a cut in cash
compensation to receive instead deep discount options or restricted shares for those of them displaying
more loss-aversion Again this is broadly consistent with Hallrsquos and Murphyrsquos (2002) and
Hendersonrsquos (2005) findings for non-diversified risk-averse employees
Last but not least the sub-figure in the middle of the main figure is plots of total incentives against
the strike price each of them corresponds to a given level of loss-aversion The purpose of this
analysis consists in showing the effect of loss-aversion on
K by holding a constant at 065 and
varying It mainly shows that loss-aversion has an effect opposite to that of probability weighting
when probability weighting effect is dominant12
(ie the employee may potentially put overstated
value in the option specifically for high strikes) optimal strike increases and total incentives decreased
with loss-aversion Conversely when loss-aversion effect is dominant as stated before the model
yields predictions comparable to that of the EUT-based models
12
See the limit case of 1 where risk-aversion is ignored (the blue dashed curve)
22
Figure-8 Incentives from options grant with total cost of euro28 333 assuming cash compensation is adjusted This figure is plots of incentives (in Keuro) from options grant
for a given strike price holding the total compensation value constant from both company and employee perspectives Total incentives are defined as the partial
derivative of the total subjective value of the grant with respect to stock price ldquoSrdquo The sub-figure on the left-hand side depicts total incentives as a function of the strike
price for varying levels of probability weighting parameter That in the middle is a plot of total incentives against strike price for varying levels of loss-aversion The
sub-figure on the right-hand side exhibits the sole effect of loss-aversion (with no probability weighting) on the shape of total incentives as a function of strike price The
derivatives were computed numerically based on the following parameters T=4 σ=30 S=100 r=3 q=0 α=088
3 Do stock-options provide incentive for risk taking
Earlier studies (Agrawal and Mandelker 1987 DeFusco et al 1990 Hirshleifer and Suh 1992)
have built on insights from standard option pricing theory to predict that option-compensated
managers will be motivated to increase the asset variance and leverage of their firms because the
convexity of the option payoff increase its value as the volatility of the stock price increases Lambert
et al (1991) was the first to call into question this assertion They proved that a non-diversified risk-
averse executive may not necessarily take actions that increase stock price volatility because that
parameter of the distribution of the stock price has two conflicting effects on the subjective value of
the option a positive effect implied by the payoff convexity and a negative effect due to the concavity
of the executiversquos utility function Henderson (2005) draws conclusions from a EUT-base model
consistent with these findings Specifically she finds that stock-options provide incentives for a risk-
averse manager to increase the beta of the company (ie the market risk-to-firm specific risk ratio)
rather than total risk Although there is some empirical evidence supporting the prediction that stock-
options do not systematically encourage risk taking it is still very scarce13
13
See for instance Cohen et al(2000) and Rajgopal and Shevelin (2002)
23
Figure-9 The effect of loss-aversion and probability weighting on risk-taking incentives implied by stock-options This figure is plots
of the partial derivative of the subjective value with respect to stock price volatility ldquoσrdquo against the option moneyness It exhibits on
the one hand the combined effects of loss-aversion and option moneyness (chart on the right-hand side) and on the other hand the
combined effects of probability weighting and option moneyness (chart on the left-hand side) on risk-taking incentives The derivatives
were computed numerically assuming three different levels of loss-aversion and probability weighting (see the legends above) and
holding the remaining parameters constant at the following values T=4 σ=30 K=100 r=3 q=0 α=088
I revisited the risk taking incentives issue from the perspective of an executive with CPT
preferences Similar to previous studies I defined incentives for risk taking as the first order derivative
of the subjective value in (6) with respect to volatility (a
C
)
14 In order to figure out the link
between risk-taking incentives from stock-options and the parameters related to preferences I
performed a numerical analysis on the sensitivity of a
C
to loss-aversion and probability weighting
The results are reported in figure 8 hereafter
The left-hand side subfigure is plots of a
C
as a function of the stock price for several degrees
of probability weighting with loss-aversion held constant at 225 The purpose of the underlying
analysis is to figure out broadly the extent to which a loss-averse executive subject to probability
weighting would prefer a high or low risk given the way the latter influences the option value from his
own perspective The first essential result from this analysis is that incentives for risk taking are
14
Actually the sensitivity of the subjective value to a parameter of the probability distribution of the stock price
provides a measure of the executive incentive to make decisions that influence that parameter
24
increasing with probability weighting degree In fact the probability weighting leverages the positive
effect of volatility on the subjective value through the convexity of the option payoff Another
observation that could be made is that for sufficiently high degree of probability weighting
( 070a )a
C
lies strictly above the conventional BS Vega over the retained range of stock prices
(see the red and the green curves) This means that an option-compensated CPT-executive subject to
probability weighting may be more prompted than a risk-neutral executive to act in order to increase
assets volatility Note that for typical setting of a at 065 the model predicts that a CPT-executive
with a such preferences calibration will have incentives to act in order to increase the volatility of the
stock price by 1 if he targets a 87 cts - increase of the value of his at-the-money 4-year option
In addition when probability weighting is ignored by setting 1a only the effect of loss-aversion
on risk taking incentives is captured The analysis of this effect is reported in the subfigure on the
right-hand side More explicitly this subfigure exhibits plots of a
C
for several levels of with
probability weighting effect neutralized It shows mainly that risk-taking incentives from stock-options
are decreasing with loss-aversion Moreover it appears that a
C
turns negative over a given range
of stock prices where the option is in-the-money Therefore consistent with findings from EUT-based
models the CPT model predicts that a loss-averse executive who is not subject to probability
weighting may not prefer an increase in the variance of the company stock price return As a specific
example an executive with a loss-aversion parameter 6 who processes probabilities in a linear
way (see the yellow curve) and holds 4-year stock options will have incentives to decrease rather than
increase the volatility of the company stock price if the stock price is above 130 the strike price of
his options
In essence incentives for risk taking from stock options - defined as the sensitivity of the
subjective value to the stock price volatility - is subject to two opposite effects under the CPT-based
model a positive effect from the convexity of the optionrsquos payoff leveraged by the probability
weighting feature and a negative effect from the loss-aversion coefficient Therefore there is a mixed
effect on risk taking incentives depending on which of the two effects dominates This will depend
obviously on the option moneyness and the other option-specific parameters
Conclusion
This paper proposes an alternative theoretical model of stock option subjective value to analyze
their incentive effects for employees The model predictions ascertain the ability of CPT to explain
some prominent incentive patterns that EUT models have difficulties to capture It mainly provides
25
arguments on the well documented tendency of employees to frequently value - under some
circumstances - their options in excess of their cost to the company Specifically these results
highlight the economic rational for firms in particular those with higher risk to widely use stock
options in non-executive employee compensation (Spalt 2008)
Loss aversion and probability weighting are the key features driving the subjective value in the
CPT model These parameters have countervailing effects on the modeled subjective value Depending
on which of them is dominant in the preferences calibration the model yields different predictions
regarding incentives Specifically consistent with some behavioral patterns observed in many surveys
and experimental studies on equity-based compensation the model predicts that when the probability
weighting feature prevails the subjective value may overstate the risk-neutral value of the option In
this case assuming the company and the employee bargain efficiently over the compensation
components incentives are maximized for strike prices set around the stock price at inception for a
representative employee with preferences calibration meeting the experimental estimates from CPT
(Tversky and Kahneman 1992) Obviously this finding is consistent with companiesrsquo actual
compensation practices Moreover executives with such preferences profile may be prompted to act in
order to increase share price volatility However when the emphasis is put on the loss-aversion
feature by relaxing the probability weighting assumption the model yields results comparable to
those of EUT-based models In particular the model predicts that loss-averse employees who are not
subject to probability weighting or even with very low degrees of probability weighting receiving
options at high exercise price would willingly accept a cut in compensation to receive instead deep
discount options or restricted shares for those of them displaying more loss-aversion Furthermore the
model shows that loss-averse executives who are processing probabilities in a linear fashion may not
prefer an increase in the variance of the company stock price return
Despite their practical interest the conclusions from the results of this research should not be
drawn without underlining some of its limitations The first one concerns the specification of the CPT
model Actually although the reference point specification in the model is consistent with both
empirical evidence on people setting reference points in a dynamic fashion and firmsrsquo widespread use
of the BS value as a standard for Financial and Human Resources disclosers empirical and
experimental literature is still silent on how people set reference points when assessing complex
gambles like stock option payoffs In addition to keep the model tractable only European-style
options were studied in this paper The model is still however easily extendable to Bermudian-style
options using numerical schemes such like lattice approaches The other limitation of this study is
related to the large heterogeneity in probability weighting that may exist across individuals (Wu and
Gonzalez 1996) The Tverskyrsquos and Kahnemanrsquos (1992) weighting function used in the model
provides only a fit to the median profile
26
Finally this work highlights - as did some previous eminent researches in this field (Dittmann et
al 2008 Splat 2008) - a number of future promising research directions in equity-based
compensation incorporating CPT framework For instant exploring the ability of CTP to explain the
growing use of performance shares plans instead of stock options in employee compensation would be
of great interest for future research Furthermore given that several empirical studies has documented
that employee stock option exercise behavior is also driven by behavioral factors a promising research
direction incorporating CPT is studying its ability to predict exercise patterns
Appendix A proofs of proposition 1
This appendix provides heuristic proofs of proposition 1
To prove that the subjective value a
C
is decreasing in 028 1a it is sufficient to show that
the expectation a
E
is a decreasing function of a Letrsquos first rewrite the expectation in (6) as follows
=
a aIP T IP T
x
a
IR
E v h E v h g x
w x u du x dx
Where
1
2 1
2
g x K x l
w x K g x l x l
x l
with 0 1 and 1 (A1)
Since w x
is derivable over 1IR l an expansion in Taylor series at the first order gives
w x w y x y w y
with 1y IR l
Introducing the expectation operator with respect to the transformed probability measure we have
a aIP IP
x
IP a
E w x w y E x y w y
w y E x u du y w y
(A2)
27
Since w x
is monotone increasing in x we have 0w y Then it follows from (A2) that
proving that a
E
is locally decreasing with respect to a in 1y IR l boils down to showing that
0
x
IP aE x u du
a
(A3)
Noting that
x
au du is positive and convex with respect to 1 1
x l l we
have according to Jensen inequality
IPE xx
IP a IP aE x u du E x u du
Since x follows a standard normal distribution which is symmetric in 0IP
E x we get from
the inequality above by substituting IPE x in the right hand side
0
x
IP aE x u du (A4)
Note that the result in (A4) above showing that the expectation under the transformed
probabilities overstates that under the original probabilities is a consequence of the probability
weighting function feature stated in sect112 which consists in infinitely-overweighting infinitesimal
probabilities and infinitely-underweighting near-one probabilities
Furthermore noting that the convexity of
x
au du with respect to 1 1
x l l
is decreasing in a and using the result in (A4) we have for 028 1 a b
IP IPE x E xx x
IP a IP a IP b IP bE x u du E x u du E x u du E x u du
Or equivalently
x x
IP a IP bE x u du E x u du (A5)
28
This proves that the condition in (A3) holds which means that a
C
is a decreasing function of
028 1a QED
Appendix B proofs of proposition 2
Taking the derivative of the subjective value function in (6) with respect to λ yields
1
1
1
1
1 0
1
a rT
a a
a
a a a rT
EE e if E
C
E E Ee otherw ise
(B1)
Where
1 2 3
a a a aE I I I
(B2)
Using the formulas in equations from (62) to (64) we can rewrite the derivatives in (B2) as follows
1
0
aI
1
2
2
l x
a
a
l
IK g x u du x dx
23
l
a
a
Ix dx
Then substituting these results in place of the derivatives in (B2) we obtain
1 2
2
l lx
a
a a
l
EK g x u du x dx x dx
(B3)
Given that
0
aE
we conclude that
aC
is nonpositive This implies that
aC
is a decreasing
function of QED
29
References
Abdellaoui M (2000) ldquoParameter-Free Elicitation of Utility and Probability Weighting Functionsrdquo
Management Science Vol 46 No 11 pp 1497-1512
Agrawal A Mandelker G (1987) ldquoManagerial incentives and corporate investment and financing
decisionsrdquo Journal of Finance Vol 42 No 4 pp 823-837
Bahaji H (2009) ldquoLe comportement drsquoexercice des porteurs de stock-options une eacutetude empirique
sur le marcheacute Ameacutericainrdquo Working Paper DRM Finance- Universiteacute de Paris Dauphine Paris June
2009
Barberis N and Thaler R(2003) ldquoA survey of behavioral financerdquo in Constantinides G Harris M
and Stulz R (Ed) Handbook of the Economics of Finance North-Holland Amsterdam
Bleichrodt H and Pinto JL (2000) ldquoA Parameter-Free Elicitation of the Probability Weighting
Function in Medical Decision Analysisrdquo Management Science Vol 46 No 11 pp 1485-1496
Cai J and Vijh AM (2004) ldquoExecutive stock and option valuation in a two state variable
framework allowing optimal investment of outside wealth in the risk-free asset and the market
portfoliordquo Working Paper University of Iowa
Camerer C and Ho TH (1994) ldquoViolations of Betweenness Axiom and Nonlinearity in
Probabilityrdquo Journal of Risk and Uncertainty Vol8 No 2 pp 167-196
Cohen RB Hall BJ and Viceira LM (2000) ldquoDo executive stock options encourage risk taking
rdquo Working Paper Harvard Business School
Cook P and Clotfelter C (1993) ldquoThe peculiar scale economies of lottordquo American Economic
Review Vol 83 No3 pp 634-643
DeFusco R Johnson R and Zorn T (1990) ldquoThe effect of executive stock option plans on
stockholders and bondholdersrdquo Journal of Finance Vol45 No 2 pp 617-627
Detemple J and Sundaresan S (1999) ldquoNontraded asset valuation with portfolio constraints a
binomial approachrdquo Review of Financial Studies Vol 12 No 4 pp 835ndash872
Devers C Wiseman R and Holmes M (2007) ldquoThe effects of endowment and loss aversion in
managerial stock option valuationrdquo Academy of Management Journal Vol 50 No 1 pp 191-208
Dittmann I and Maug E (2007) ldquoLower salaries and no options On the optimal structure of
Executive payrdquo The Journal of Finance Vol 62 No 1 pp 303-343
Gneezy U (1998) ldquoUpdating the Reference Level Experimental Evidencerdquo Working paper
University of Haifa
Hall B and Murphy K (2000) ldquoOptimal Exercise prices for executive stock optionsrdquo American
Economic Review Vol 90 No 2 pp 209-214
30
Hall B and Murphy K (2002) ldquoStock options for undiversified executivesrdquo Journal of Accounting
and Economics Vol 33 No 2 pp 3-42
Hallock K and Olson G (2006) ldquoThe value of stock options to non-executive employeesrdquo Working
Paper No 11950 National Bureau of Economic Research Cambridge
Heath C Huddart S and Lang M (1999) ldquoPsychological factors and stock option exerciserdquo
Quarterly Journal of Economics Vol 114 No 2 pp 601-628
Heisler J(1994) ldquoLoss aversion in a futures market an empirical testrdquo Review of Futures Markets
Vol 13 No 3 pp 793ndash822
Henderson V (2005) The impact of the market portfolio on the valuation incentives and optimality
of executive stock options Quantitative Finance Vol 5 No 1 pp 35-47
Hirshleifer D and Suh R (1992) ldquoRisk Managerial Effort and Project Choicerdquo Journal of
Financial Intermediation Vol 2 No 3 pp 308-345
Hodge F Rajgopal S and Shevlin T (2006) ldquoHow do managers value stock options and restricted
stock rdquo Working Paper University of Washington
Holmstrom BR and Milgrom PR (1987) ldquoAggregation and linearity in provision of intertemporal
incentivesrdquo Econometrica Vol 55 No 2 pp 303-328
Huddart S and Lang M (1996) ldquoEmployee stock option exercises an empirical analysisrdquo Journal
of Accounting and Economics Vol 21 No 1 pp 5-43
Jensen M and Murphy KJ (1990) ldquoPerformance pay and top-management incentivesrdquo Journal of
Political Economy Vol 98 No 2 pp 225-264
Jenter D (2001) ldquoUnderstanding high-powered incentivesrdquo Working Paper Harvard Business
School and Economics Departement
Johnson SA and Tian YS (2000) ldquoThe value and incentive effects of non-traditional executive
stock option plansrdquo Journal of Financial Economics Vol 57 No 1 pp 3-34
Jullien B and Salanie B (2000) ldquoEstimating preferences under risk The case of racetrack bettorsrdquo
Journal of Political Economy Vol 108 No 3 pp 503-530
Kachelmeier S and Shehata M (1992) ldquoExamining risk preferences under high monetary incentives
experimental evidence from the Peoplersquos Republic of Chinardquo American Economic Review Vol 82
No 5 pp 1120-1141
Kahneman D and Tversky A (1979) ldquoProspect Theory An analysis of decision under riskrdquo
Econometrica Vol 47 No 2 pp 263-292
Lambert R Lanen W and Larcker D (1989) ldquoExecutive stock option plans and corporate dividend
policyrdquo Journal of Financial and Quantitative Analysis Vol 24 No 4 pp 409-424
Lambert R Larcker D and Verrecchia R (1991) ldquoPortfolio considerations in valuing Executive
Compensationrdquo Journal of Accounting Research Vol 29 No 1 pp 129-149
Lambert R and Larcker D (2001) ldquoHow do employees value (often incorrectly) their stock optionsrdquo
available at knowledgewharton
31
Lewellen W Loderer C and Martin K (1987) ldquoExecutive compensation and executive incentive
problem an empirical analysisrdquo Journal of Accounting and Economics Vol 9 No 3 pp 287-310
Loughran T and Ritter J (1995) ldquoThe new issue puzzlerdquo Journal of Finance Vol 50 No 1 pp 23-
51
Markowitz H (1952) ldquoThe utility of wealthrdquo Journal of Political Economy Vol 60 No 2 pp 151-
158
Odean T (1998a) ldquoAre Investors Reluctant to Realize their Lossesrdquo Journal of Finance Vol 53
No 5 pp 1775ndash1798
Rajgopal S and Shevlin T (2002) ldquoEmpirical evidence on the relation between stock option
compensation and risk askingrdquo Journal of Accounting and Economics Vol 33 No 2 pp 145-171
Shefrin H and Statman M (1985) ldquoThe disposition to sell winners too early and ride losers too long
theory and evidencerdquo Journal of Finance Vol 40 No 3 pp 777-790
Sawers K Wright A and Zamora V (2006) ldquoLoss aversion stock-based compensation and
managerial risk-seeking behaviorrdquo paper presented at the AAA 2007 Management Accounting
Section Meeting available at httpssrncom abstract=864224
Thaler R (1999) ldquoMental Accounting Mattersrdquo Journal of Behavioral Decision Making Vol 12 No
3 pp 183-206
Thaler R and Ziemba W (1988) ldquoParimutuel betting markets Racetracks and lotteriesrdquo Journal of
Economic Perspectives Vol 2 No 2 pp 161-174
Tversky A and Kahneman D (1992) ldquoAdvances in Prospect Theory Cumulative representation of
uncertaintyrdquo Journal of Risk and Uncertainty Vol 5 No 4 pp 297-323
Yermack D (1997) ldquoGood Timing CEO Stock Option Awards and Company News
Announcementsrdquo Journal of Finance Vol 52 No 2 pp 449-476
Wu G and Gonzalez R (1996) ldquoCurvature of the Probability Weighting functionrdquo Management
Science Vol 42 No 12 pp 1676-1690

1
Incentives from stock option grants a behavioral
approach
Hamza BAHAJI
Universiteacute de Paris Dauphine DRM Finance
Abstract
Purpose ndashThis paper analyzes the valuation of stock options from the perspective of an employee exhibiting
preferences as described by Cumulative Prospect theory (CPT) In addition it elaborates on their incentives
effect and some implications in terms of design aspects
Designmethodologyapproach ndash The paper draws on the CPT framework to derive a continuous time model of
the stock option subjective value using the certainty equivalence principle Numerical simulations are used in
order to analyze the subjective value sensitivity with respect to preferences-related parameters and to investigate
the incentives effect
Findings ndash Consistent with a growing body of empirical and experimental studies the model predicts that the
employee may overestimate the value of his options in-excess of their risk-neutral value Moreover for typical
setting of preferences parameters around the experimental estimates and assuming the company is allowed to
adjust existing compensation when making new stock option grants the model predicts that incentives are
maximized for strike prices set around the stock price at inception This finding is consistent with companiesrsquo
actual compensation practices Finally the model predicts that an executive who is subject to probability
weighting may be more prompted than a risk-neutral executive to act in order to increase the firmrsquos assets
volatility
Originalityvalue ndash This research aims to propose an alternative theoretical framework for the analysis of pay-to-
performance sensitivity of equity-based compensation that takes into account a number of prominent patterns of
employee behavior that Expected Utility theory cannot explain It contributes to recent empirical and theoretical
researches that have advanced CPT framework as a promising candidate for the analysis of equity-based
compensation contracts
JEL Classification J33 J44 G13 G32 M12
Keywords Stock options Cumulative Prospect Theory Incentives Subjective value
DRM-Finance Universiteacute de Paris Dauphine Place du Geacuteneacuteral du Lattre de Tassigny 75 775 Paris Cedex 16 France E-mail
hbahajiyahoofr Acknowledgements the author is grateful to Clotilde NAPP Jean-Franccedilois CASTA Jacques HAMON Farhat SELMI
and Khalid ARDEM for their valuable comments
2
Introduction
Instead of an increasing interest for restricted stock and performance unit plans the 2006 Hewitt
Associates Total Compensation Measurement survey has revealed that stock options are still the most
prevalent long term incentive vehicle1 The stated argument for the large use of executive stock
options is that they align the interests of executives and shareholders since they provide incentives for
the manager to act in order to increase the firm value The use of stock options has even overtaken the
traditional arena of executive population Actually firmsrsquo compensation practices show that stock
options are issued to reward non-executive employees as well This may seem puzzling at first sight in
that the agency argument underlying the use of stock options is no more reliable under the non-
executive employees view because the formers are unlikely to influence the firm value by their
decisions (Spalt 2008) Nevertheless issuance of non-executive stock options results obviously from
an agreement between the firm and the employee upon the terms of the compensation involving stock
options which means that employees may be interested in stock options In order to figure out the
reason why stock options may be attractive to employees it is crucial to assess the utility they receive
from them Moreover understanding how employee evaluates its stock options (ie their subjective
value) allows assessing their incentive power and the implied employee behavior in terms of risk
taking
Most of the theoretical literature on stock options relies on the Expected Utility theory (EUT
henceforth) framework to derive models of option value from the employee perspective These models
predict that the nontransferability of the options and the hedging restrictions faced by the employee
make him value his options below their issuance cost born by the company (ie their risk neutral
value) A seminal work by Lambert et al (1991) has introduced a general theoretical framework to
analyze the valuation of equity based compensation contract from a managerrsquos perspective The
authors studied stock option contracts as a specific example They used the certainty-equivalence
principle to derive the so-called subjective value model Their model assumes that the manager is a
risk-averse agent with a power utility function and that he integrates his stock options in his global
wealth assessment process They proved that the subjective value decreases in risk aversion and
increases in the manager diversification with respect to the company specific risk Moreover they
showed that stock options may not provide incentives for a risk-averse manager to select actions that
increase the variance of the company stock price Hall and Merphy (2000 2002) followed the same
approach to analyze the risk-adjusted value of executive stock options along with their pay-to-
performance sensitivity Their major findings provide an economic rational to observed equity based
compensation practices while perhaps troubling from an efficiency perspective Mainly they showed
that pay-to-performance incentives from stock options when these are granted as an add-on to existing
1 80 of the responding participant companies to the survey have reported that stock option grants represent in
2006 on average about 54 of their global long-term incentives
3
compensation are typically maximized by setting their exercise price around the stock price at
inception In contrast when options grants are assumed to be accompanied by reductions in cash
compensation their model predicts that restricted stocks provide much higher incentives for
executives to increase the firm value and may then be preferred to stock options Henderson (2005)
has built on the previous works to examine the effect on valuation and incentives of market risk and
firm-specific risk She proposed a continuous time utility-based model to value stock options from the
managerrsquos perspective A prominent assumption in his model is allowing the executive to invest the
remainder of his wealth (excluding stock options) in the market portfolio2 and a risk-free asset In
particular her results suggest that stock options do not provide incentives to increase total risk but the
beta of the company instead She also finds that incentives decrease in firm-specific risk whilst they
may either decrease or increase in market risk depending on other factors In addition similar to Hall
and Murphy (2002) the authorrsquos model supports the grant of restricted stocks rather than stock options
under efficient contracting framework
A common finding of the EUT-based models is that the stock options value to a risk-averse
undiversified employee is strictly lower than the value to a risk-neutral well diversified outside
investors This is nevertheless in stark contrast to several surveys and empirical findings documenting
that employees may value their options above their risk-neutral value (ie the so-called Black Scholes
value) Lackerrsquos and Lambertrsquos (2001) research based on a survey of KnowledgeWharton readers
revealed that managers value their options substantially above the Black Scholes value (BS
henceforth) Moreover the survey revealed that younger managers have the most upward bias in the
values they perceive from their options According to the authors these results suggest that managers
do not fully understand the valuation of stock options or possibly their incentive effects Another
argument supporting managers may tend to overestimate their options value is provided by Yermack
(1997) He argues that to the extent that company executives have superior information regarding
company prospects and can time their option grants accordingly they may actually value options
higher than would outside investors do Furthermore relying on behavioral theories recent researches
have found evidence on employees drawing on heuristics and subject to psychological bias while
valuing their options which may lead them to overestimate the value of their options For instance
Devers et al(2007) study examines the effects of endowment and loss aversion on managersrsquo
subjective stock-option valuation Their main findings show that managers endow value from granted
unexercisable options in a way that they value them in excess of their objective value (ie BS value)
In the same vein Sawers et al(2006) drew conclusions from an experiment involving MBA students
consistent with the view that loss-averse managers subjectively overvalue stock options relative to
2 Prior works by Detemple and Sundaresan (1999) and by Cai and Vijh (2004) have used trees approach tied to
specific numerical schemes to study utility-based valuation of executive stock options when the executive can
invest in the Market portfolio
4
restricted stocks and therefore will be less risk-seeking when awarded with stock options and more
risk-seeking when endowed with restricted stocks
Moreover standard normative models fail to predict stock options as part of the compensation
contract Several quantitative studies taking place in principal-agent framework showed that EUT-
based models predict optimal compensation contracts that do not contain convex instruments like
stock options (Holmstrom and Milgrom 1987 Dittmann and Maug 2007) Consistent with these
findings studies focused on the effect of stock option and restricted stock grants on managerial effort
incentives (Jenter 2001 Hall and Murphy 2002 Henderson 2005) conclude that stock options are
inefficient tools for creating incentives for risk-averse managers when they are granted by mean of an
offset of cash compensation
This paper analyzes the valuation of stock options and their incentives effect to an employee
exhibiting preferences as described by Cumulative Prospect Theory (Tversky and Kahneman 1992) It
aims to propose an alternative theoretical framework for the analysis of pay-to-performance sensitivity
of equity-based compensation that takes into account a number of prominent patterns of employee
behavior that standard EUT cannot explain Specifically the key assumption underlying this work
proceeds from Cumulative Prospect Theory (CPT hereafter) and states that the employee choices
under risk display four main features Firstly instead of assessing outcomes based on their
contribution to his final wealth the employee assesses outcomes utility over gains and losses
determined relative to a reference level or a benchmark The second feature is loss-aversion It
conveys the experimental evidence that people are more sensitive to losses than they are to gains In
other words losses loom larger than gains The third feature consists in the principle according to
which people choices display diminishing sensitivity to incremental gains and losses The last piece is
the nonlinear probability processing It involves the well established tendency of individuals to
overweight small probabilities of large gains3 I drew on this theoretical framework to derive a
continuous time model of the stock option subjective value using the certainty equivalence principle I
then performed sensitivity analyses with respect to preferences-related parameters and found that loss
aversion and probability weighting have countervailing effects In particular I showed that the more
the employee is loss averse the less would the option be worth to him In addition I proved that the
option subjective value is increasing in probability weighting degree My analyses also show that for
a given level of option moneyness the subjective value of the option may lie strictly above the BS
value when the effect of probability weighting tends to dominate that of loss-aversion These results
lead to the conclusion that the lottery-like nature of stock-options combining large gains with small
probabilities may make them attractive to employees subject to probability weighting which is
3 There exists a large literature comprising empirical and experimental applications of overweighting small
winning probabilities This literature include notably Thaler and Ziemba (1988) Kachelmeier and Shehata
(1992) Cook and Clotfelter (1993) Loughran and Ritter (1995) and Jullien and Salanie (2000)
5
consistent with the proposition that employee option value estimate may exceed the BS value
(Lambert and Larcker 2001 Hodge et al 2006 Sawers et al 2006 Hallock and Olson 2006
Devers et al 2007)
Furthermore this work elaborates on incentives from stock options and on some implications in
terms of design aspects Following previous researches I defined incentives as the first order
derivative of the subjective value with respect to the stock price A numerical analysis of the incentive
function shows that stock option incentives are increasing in employeersquos degree of probability
weighting and may even lie above incentives for a risk-neutral individual Moreover I considered the
incentive effects of setting the strike price of the option above or below the stock price at inception In
this analysis I relied on Hallrsquos and Murphyrsquos (2002) methodology in solving for the exercise price that
maximizes incentives holding constant the company cost of granting the options Similar to their
approach I explored two situations In the first situation I assumed that the firm is precluded from
changing any component of the employee compensation package In this case the model predicts that
when the effect of probability weighting prevails (ie dominates that of loss-aversion) incentives
could be infinitely increased by granting more and more options at higher and higher strikes which
suggests that employee would be much more interested in premium options instead of discount
options However when loss-aversion effect dominates the model predicts that incentives are
maximized within strike price ranges that may include the grant date stock price depending on the
level of loss-aversion In the second situation the company is assumed to be allowed to adjust existing
compensation when making new stock option grants For typical setting of preferences parameters
around the experimental estimates from CPT (Tversky and Kahneman 1992) the model predicts that
incentives are maximized for strike prices set around the stock price at inception which is consistent
with companiesrsquo actual compensation practices Additional analyses suggest also that loss-averse
employees who are not subject to probability weighting or even with very low degrees of probability
weighting receiving options at high exercise price would willingly accept a cut in compensation to
receive instead deep discount options or restricted shares for those of them displaying more loss-
aversion This result is broadly consistent with Hall and Murphy (2002) and Henderson (2005)
findings for non-diversified risk-averse employees
The last item discussed in this paper is the risk taking incentives implied by stock option grants
Similar to previous studies I defined incentives for risk taking as the first order derivative of the
subjective value with respect to stock price returns volatility The first essential result from this
analysis is that incentives for risk taking are increasing with probability weighting degree In fact
probability weighting leverages the positive effect of volatility on the subjective value through the
convexity of the option payoff Another important finding from the model is that an option-
compensated executive subject to probability weighting may be more prompted than a risk-neutral
executive to act in order to increase assets volatility Moreover consistent with findings from EUT-
6
based models the CPT model predicts that a loss-averse probability-weighting-free executive may not
prefer an increase in the variance of the company stock price return
This work is motivated by recent empirical and theoretical researches on employee compensation
incorporating CPT-based models These models have proved successful in explaining some observed
compensation practices and specifically the almost universal presence of stock options in the
executive compensation contracts that EUT-based models have difficulties accommodating their
existence Therefore they have advanced CPT framework as a promising candidate for the analysis of
equity-based compensation contracts This literature includes in particular Dittmann et al (2008) who
developed a stylized principal-agent model that explain the observed mix of restricted stocks and stock
options in the executive compensation packages It also includes Spalt (2008) who used the CPT
framework and especially the probability weighting feature to prove that stock options may be
attractive to a loss-averse employee subject to probability weighting He then explained the puzzling
phenomenon that riskier firms are prompted to grant more stock-options to non-executive employees
This article proceeds as follows The first section describes the features of stock option value from
the perspective of a representative employee with preferences as described by CPT Throughout this
paper we will refer to this employee as a ldquoCPT employeerdquo This section provides also numerical
analyses on the model sensitivity to preferences-related parameters The next section introduces
incentive effects of stock options for a CPT-employee and examines some design implications in
terms of strike price setting The risk taking incentives question is explored in the third and last
section Appendices provide proofs of the propositions in the first section
1 Stock option value from a CPT-employee perspective
In this section I develop a base-case model for analyzing the value of the stock-option contract
from the perspective of a representative employee with CPT-based preferences (subjective value
henceforth) Specifically I assume that the employee is granted a European call option on the
companyrsquos stock denoted by S with maturity date t T and strike price K These are the traditional
features of executive stock options as reported in Johnson and Tian (2000) and used by prior studies
focused on stock option incentives (Lambert et al 1991 Hall and Murphy 2002 Henderson 2005)
Often in practice stock options are Bermudan-style options Thus my model relies on a naiumlve setting
in that it ignores complications related to early exercise or forfeitures
11 Theoretical framework
111 Stock-option contract
7
The stock option contract is issued in 0t The contract payoff at expiry t T is
T T
h S K
I make the assumption that the employee is not allowed to short-sell the company stock and that
he can earn the risk-free rate r from investing in a riskless asset Moreover the price dynamic of the
stock is given by a geometric Brownian motion represented by the following SDE
t t t tdS r q S dt S dZ (1)
Where t
Z is a standard Brownian motion with respect to the probability measure IP 2
and q are
respectively the total variance of the stock price returns and the dividend yield
112 Risk preferences
Following Tversky and Kahneman (1992) I consider that to each gamble with a continuous
random outcome y IR which the probability density function is denoted by f y the employee
assigns the value
IR
E y v y d f y
(2)
Note that the expectation E
is a function of two distinct functions The first function v
called the value function is assumed of the form
y yv y
y y
where 0 1 and 1 (3)
This formulation has some important features that distinguish it from the standard utility
specification First the utility is defined over gains and losses assessed based on the reference point
denoted by This idea was proposed first by Markowitz (1952) As pointed out by Barberis and
Thaler (2003) it fits naturally the way people perceive attributes in everyday life relative to their
previous levels rather than in absolute fashion The second important feature is the shape of the value
function While it is convex over losses it is concave over gains which represents the observation
from psychology that people are risk averse over gains and become risk-seeking over losses
Moreover the value function has a kink at the origin introduced by the parameter 1 This feature
known as loss-aversion gives a higher sensitivity to losses compared to gains Finally outcomes are
8
treated separately from other components of wealth which reflects the well-documented phenomenon
of narrow framing4 (Thaler 1999)
The second function
a b is called the weighting function It applies to cumulative
probabilities represented by the cumulative probability function F in order to transform them into
decision weights according to
1
1
1
(1 )
(1 )
a
a a a
a bb
b b b
F yy
F y F y
F y
F yy
F y F y
where 028 1a and 028 1b 5 (4)
This function stands for another piece of CPT which is the nonlinear transformation of
probabilities Specifically it captures experimental evidence on people overweighting small
probabilities and being more sensitive to probability spreads at higher probability levels (eg a jump in
probability from 07 to 09 would be more striking to individual than an equal-sized jump from 01 to
03) The degree of probability weighting is controlled separately over gains and losses by the
weighting parameters a and b respectively The more these parameters approach the lower boundary at
028 the more the tails of probability distribution are overweighted For instance when 1a b
probability weighting assumption is relaxed For simplicity these parameters are assumed to be equal
(ie a b ) and the weighting function will be denoted a
in the rest of this paper Finally it is
worth mentioning that this function (i) infinitely-overweights infinitesimal probabilities since
0
lima
p
p
p
and (ii) infinitely-underweights near-one probabilities in that
1
1lim
1
a
p
p
p
12 Stock option subjective value
121 The model
4 Narrow framing refers to people tendency to treat individual gambles separately from other portions of wealth
It stands for an important feature of Mental Accounting the mental process by which individuals formulate
problems for themselves (eg the way they code outcomes) Mental accounting is captured in CPT via the
nonlinear shape of the value function 5 The lower boundary at 028 is a technical condition to insure that a b
p
p
is positive over ]01[ as required by
the following first order condition 1 1 1 0aa
a p a p p p
9
In order to estimate the subjective value of the stock option contract described above I use the
certainty equivalent approach similar to that adopted by Spalt (2008) In particular this value is
defined as the cash amounta
C
that leaves the employee indifferent between this amount and the
uncertain payoff of the contract T
h irrespective of the composition of the remainder of his private
wealth Formally a
C
is the solution of the following equation
=
a
rT
a IP T
T a T
IR
v C e E v h
v h d F S
(5)
The left-hand side of the equation above represents the benefit for the employee from receiving
the cash amount a
C
instead of the stock option contract at the inception of the latter This amount is
assumed to be placed into the risk-free asset over the whole lifetime T of the stock option contract
The other side of the equation gives the expected utility to the employee from receiving the risky
payoff implied by the value function v
Here the expectation a
IPE relies on the transformed
probability measurea
IP
Let a
E
represent the expectation in the right-hand side of (5) It follows from (5) and (3) that
1
1
0
1
rT
a a
a
rT
a
E e if E
C
E e otherw ise
(6)
Where a
E
should write
1 2 3
a a a aE I I I
(61)
With
1
1
x
a a
l
I g x K u du x dx
(62)
1
2
2
l x
a a
l
I K g x u du x dx
(63)
10
2
3
l
a aI x dx
(64)
2
2( )
r q T T x
g x Se
(65)
2
1
ln2
Sr q T
Kl
T
(66)
2
2
ln2
Sr q T
Kl
T
(67)
Here is the Gaussian density function and a
a
pp
p
is the first-order partial derivative
of a
which is defined over 01 as follows
1
1
111
1
111
1
1 11
(1 )1
1
(1 )
1
aaa l
a a
aa a
aaa
la
a a
aa a
p p ppa p x dx
p pp p
p
p p pp
a p x dxp p
p p
(68)
122 Reference point set up
Although CPT specifies the shape of the value function around the reference point it does not
provide guidance on how people set their reference points Neither does most of the psychological
literature relying on the assumption according to which the reference point is the Status quo Instead
this literature admits both the existence and the importance of non-status quo reference points since
ldquothere are situations in which gains and losses are coded relative to an expectation or aspiration level
that differs from the status quordquo (Kahneman and Tversky 1979)
Research on the Disposition Effect6 has paid greater attention to non-status quo reference points
(Shefrin and Statman 1985 Heisler 1998 Odean 1998a Gneezy 1998) These studies have found
6 Disposition effect is a term coined by Shefrin and Statman (1985) to refer to the tendency of individual
investors to hold loser stocks and sell winner stocks defined relative to a purchase price reference point
11
strong evidence that reference points are set in a dynamic fashion In particular Gneezy (1998)
documented that maxima are more effective predictors than are purchase prices
More specifically in studding exercise behavior of stock options holders Huddart and Lang
(1996) Heath et al (1999) and Bahaji (2009) have shown empirically that exercise activity is linked to
share price historical maxima These findings are consistent with employee exercise decisions take
into account the level of share price with respect to non-status quo reference points
In principle employee would update the reference point in a way that fits with his own
expectations regarding the underlying share price at expiry Intuitively the employee could estimate
the intrinsic value of the option based on his future share price forecasts as he can rely on the Black
Scholes value of the option disclosed by the firm Following Spalt (2008) I consider that the reference
point parameter in the model is the BS value7 Beyond the argument of empirical evidence on
employee exercise behavior depending on non-status quo reference points this assumption is
supported by firms common practices in terms of stock option compensation Most of stock-option
designers use the BS model in order to estimate the value of stock options as constituents of the total
compensation package This value is usually announced to the employee at the inception of the
options Moreover the BS model is recommended in the FASB and the IASC guidelines for
determining the fair value of stock options (ie the amount an outside investor with no hedge
restrictions would pay for the option) that needs to be disclosed in the financial statements These
statements comprising the BS value of the stock options are provided to shareholders as well as
stakeholders including employees
123 The impacts of preferences-related parameters a numerical analysis
To provide a concrete outline on the profile of the subjective value yielded by the model relative
to the risk neutral value profile I performed a numerical analysis8 of the value of a 4-year call option
( 4T ) with a strike price 100K For the remaining option-related parameters the figures were
computed assuming no dividend payments ( 0q ) 30 and 3r Moreover I set the
curvature parameter of the value function ( ) and the loss aversion coefficient ( ) to respectively
088 and 225 based on experimental estimates from CPT (Tversky and Kahneman 1992)
7 To be more precise the value used here is the expectation of the option payoff at expiring yielded by the BS
model (ie the nondiscounted BS value) Consistent with this specification the probability measure IP used to
derive the subjective value in (6) is the risk neutral probability measure Moreover ignoring the probability
weighting feature (ie 1a ) this setting allows the subjective value implied by the model to converge towards
the risk neutral value (ie BS value) when the preferences of the employee tend to risk neutrality
(ie 1 ) 8 The integrals in (62) (63) and (64) were computed numerically
12
Figure-1 Option value against the stock price This figure is
a plot of the subjective value computed under different
probability weighting parameters (the blue curves) It
illustrates the profile of the subjective value compared to that
of the risk neutral value (red curve) The Parameters used
are T=4 K=100 σ=30 r=3 q=0 =225 α=088
Figure-2 Sensitivity to probability weighting This figure is
a plot of the partial derivative of the subjective value with
respect to ldquoardquo against both ldquoardquo and the stock price volatility
ldquoσrdquo It exhibits the local effect of probability weighting given
the payoff distribution skewness captured by ldquoσrdquo The
derivative was computed numerically based on the following
parameters T=4 K=S=100 r=3 q=0 =225 α=088
Furthermore in order to calibrate the probability weighting function I used three different values of
the parameter a within the range of values estimated in the experimental literature9
Figure 1 depicts the option value as a function of the stock price The three blue curves represent
the value profiles from the perspective of three CPT employees with the same value function and
different degrees of probability weighting At first sight depending on the degree of probability
weighting and the option moneyness (S
K) the subjective value could lie either under or below the BS
value In contrast standard EUT-based models predict that the option value from a risk-averse
employee perspective is systematically lower than the risk-neutral value (Hall and Murphy 2002
Henderson 2005) These preliminary results are consistent thought with some empirical findings
suggesting that frequently employees are inclined to overestimate the value of their stock-options
compared with the BS value (Lambert and Larcker 2001 Hodge et al 2006 Sawers et al 2006
Hallock and Olson 2006 Devers et al 2007)
9 Tversky and Kahneman (1992) got 065 on average (a=061 for gains and b=069 for losses) These results are
corroborated by Abdellaouirsquos (2000) findings (a=060 for gains and b=070 for losses hence an average of 065)
In addition Camerer and Ho (1994) obtained a=056 for gains whereas Gonzales and Wu (1996) and Bleichrodt
and Pinto (2000) found a=071 and a=067 respectively
13
The results presented in figure 1 show that the option subjective value is increasing in probability
weighting degree (ie decreasing in parameter a ) Actually given the asymmetric profile of the option
payoff the expectation a
E
in the subjective value formula (6) is positively affected by the emphasis
put on the tail of the payoff distribution which is governed by the parameter a the lower a the more
overweighed will be small probabilities and the more underweighted will be medium to large
probabilities This lottery-like nature of an option combining large gains with small probabilities may
make it attractive to a CPT employee subject to probability weighting This preliminary outcome leads
to proposition 1 which stats that
Proposition 1 the value of the stock option contract to a CPT- employee is increasing with
respect to his degree of probability weighting (ie is decreasing with respect to a)
(Proofs are provided in appendix A)
Moreover the effect of probability weighting is expected to increase with the skewness of the
distribution of the underlying stock price which is captured by the volatility parameter given the
Log-normality assumed in the model In order to show that I performed a numerical analysis of the
sensitivity of the subjective value to the probability weighting degree as a function of the volatility
and the parameter a This sensitivity is defined as the partial derivative of subjective value with
respect to a (a
C
a
) The results are reported in figure 2 in the form of a graph It shows that the
sensitivity to parameter a is negative and locally decreasing in volatility That means that the more the
share price is volatile the more the option will be attractive for a CPT employee subject to probability
weighting This supports Spaltrsquos (2008) findings that the effect of probability weighting provides an
economic rationale to riskier firms (ie more volatile firms) for granting more stock options to non-
executive employees
Furthermore I investigate the effect of loss aversion on the subjective value The variable of
interest here is In an analogical sense with the EUT framework the option value from the
perspective of a loss-averse employee is expected to decrease with his degree of loss-aversion To
verify this I computed numerically the first order derivative with respect to (
aC
) crossed over
various levels of and moneyness ranging from 005 to 1 and from 5 to 200 respectively The
outcome is reported in figure 3 It shows that the sensitivity to loss aversion is negative and locally
decreasing in moneyness That means that the more the employee is loss averse the less would the
option be worth to him This conclusion is taken up in proposition 2 hereafter
14
Figure-3 Sensitivity to loss aversion This figure is a plot of the
partial derivative of the subjective value with respect to ldquoλrdquo
against both ldquoλrdquo and the stock price ldquoSrdquo It exhibits the local effect
of loss aversion given the option moneyness The derivative was
computed numerically based on the following parameters T=4
σ=30 K=100 r=3 q=0 a=065 α=088
Figure-4 Sensitivity to the curvature parameter This figure is a
plot of the partial derivative of the subjective value with respect to
ldquoαrdquo against both ldquoαrdquo and the stock price ldquoSrdquo It exhibits the local
effect of the curvature parameter given the option moneyness The
derivative was computed numerically based on the following
parameters T=4 σ=30 K=100 r=3 q=0 a=065 λ =225
Proposition 2 the value of the stock option contract to a CPT- employee is decreasing with
respect to his degree of loss-aversion (ie a decreasing function of λ)
(Proofs are provided in appendix B)
I performed a similar analysis in order to get a view on the effect of the curvature parameter In
the same way I assessed locally the first order derivative with respect to within a range of values
from 005 to 1 and using share prices ranging from 10 to 200 Figure 4 shows that this derivative is
locally increasing with the option moneyness for values of above say 075 It also shows broadly
that the subjective value is an increasing monotone function of over a range of values around the
experimental estimate of 088 (from 07 to 1) irrespective of the option moneyness
2 Incentives from stock-options
Stock-options are incentive tools used within a principal-agent relationship to align the interests of
the agent (employee) on those of the principal (shareholders) The shareholders grant stock options in
15
order to provide the employee with incentives to make efforts that enhance the value of the firm and
thus their own wealth Indeed assuming that employees are aware of how their actions affect the share
price option holdings will prompt them to make efforts that increase share price Therefore the
incentive from a single option grant will depend on the degree of the sensitivity of the subjective value
to the stock price
21 The incentive measure
Following Jensen and Murphy (1990) Hall and Murphy (2000 2002) and others I defined the
incentive effect as the first order derivative of the subjective value with respect to share price (
aC
S
)
which defines how the value from the employee perspective changes with an incremental change in
the stock price As we can see in figure 5 which is a plot of
aC
S
for three values of a incentives
are greatest for in-the-money10
options Also the incentive effect is increasing with the degree of
probability weighting Another observation that can be made from figure 5 is that for sufficiently high
level of probability weighting the option can give much more incentive to increase stock price than is
reflected by the BS delta This is consistent with my previous finding that the subjective value can
overstate the BS value Note that consistently with the EUT-based models when the employee
process probabilities in a linear way ( 1a ) - which means that the probability weighting assumption
is relaxed and only loss-aversion matters - the incentives lie strictly under the BS delta whatever the
level of the option moneyness That is to say that the options are less attractive for both risk-averse
employee and loss-averse employee who are not subject to probability weighting The analysis in
figure 6 supports this It shows that with a hold constant at 065 incentives are decreasing in loss-
aversion Conversely with loss-aversion parameter set to 1 which means that the loss-aversion
effect is neutralized incentives for a representative loss-neutral employee with a degree of probability
weighting equal to experimental estimate of 065 overstate the BS delta
10
The terminology ldquoat-the-moneyrdquo is referring to stock-options with an exercise price equal to the stock price at
inception The expressions ldquoOut-of- the-moneyrdquo and ldquoIn-the-moneyrdquo are also used throughout the paper to refer
to options with strike price respectively below and above the grant date stock price
16
Figure-5 The effect of probability weighting on stock-option
incentives This figure is plots of the partial derivative of the
subjective value with respect to stock price ldquoSrdquo against the option
moneyness It exhibits the combined effects of probability
weighting and option moneyness on incentives The derivatives
were computed numerically assuming three different levels of
probability weighting (see the legend above) and holding the
remaining parameters constant at the following values T=4
σ=30 K=100 r=3 q=0 λ=225 α=088
Figure-6 The effect of loss-aversion on stock-option incentives
This figure is plots of the partial derivative of the subjective value
with respect to stock price ldquoSrdquo against the option moneyness It
exhibits the combined effects of loss-aversion and option
moneyness on incentives The derivatives were computed
numerically assuming three different levels of loss-aversion (see
the legend above) and holding the remaining parameters constant
at the following values T=4 σ=30 K=100 r=3 q=0
a=065 α=088
22 Implications for stock option design optimal strike price
Setting the strike price of standard stock options boils down to defining the threshold against which
the performance is assessed and consequently to determining the likelihood of a final payout As we
have just noticed from figure 5 and figure 6 incentives increases in the option moneyness and
equivalently decreases with strike price In parallel from the shareholders perspective granting in-
the-money options is much more costly than granting out-of-the money or at-the-money options
(recall figure 1) This leads the firm to a trade-off to make when setting the exercise price of the
options in the sense that holding his cost unchanged she could either grant fewer options at a low
strike price or increase the grant size at higher exercise price
I relied on the methodology from Hall and Murphy (2002) in figuring out the optimal exercise price
satisfying the double purpose of maximizing incentives and holding constant the firmrsquos cost of
granting options I also considered two situations In the first situation the firm does not adjust the
existing compensation package when grating additional stock options Thus these additional options
are considered as a pure add-on to existing compensation In the second situation however the
employee and the firm are allowed to bargain efficiently over the terms of the compensation Thus the
17
firm is assumed to fund additional options by an adjustment to other compensation components that
leaves the employee indifferent between his initial package and the new package including the
additional grant
221 Situation 1 Option grant without a compensation offset
When the firm is not allowed to adjust the existing compensation package the optimal strike price
that maximizes incentives for a given amount of firm cost is the solution to the following constrained
optimization problem
m ax
a
K
nC K
S
such that n K c (7)
Where a
nC K
S
denotes the incentives from receiving n options with a strike price K and
K the per-unit cost or the BS value of one option
The optimization problem in (7) is solved numerically by varying the parameter K First the BS
value is computed for a given K which enable to determine the grant size n that leaves the firm cost
constant at c in accordance with the constraint in (7) Then the cost function a
nC K
S
is assessed
based on n and K This procedure is reiterated recursively until the optimal value of K is found
I set the total cost for the firm at euro28 333c (hence a grant of 1000n at-the-money options
based on the retained option-related parameters) As reported in figure 7 I varied the preferences-
related parameters a and within specific ranges in order to figure out the conditions under which an
optimal strike may exist and the robustness of the model predictions The chart on the left-hand side
exhibits the total incentives from the grant as a function of the strike price and the probability
weighting parameter with the loss-aversion held constant at 225 It shows that the convexity and
the monotony of the total incentives function ( a
nC K
S
) shift with the degree of probability
weighting while it is concave and non-monotone over the range of strike prices for low levels of
probability weighting ( 0906a ) it becomes convex and monotonically increasing for higher levels
Moreover for higher level of volatility probability weighting is expected to affect more deeply the
shape of total incentives function (recall figure 2)
Specifically when the effect of probability weighting prevails (ie dominates that of loss-aversion)
the model predicts that incentives could be infinitely increased by granting more and more options at
higher and higher strikes This result suggests that if the employee is subject to a degree of probability
18
weighting that could potentially lead him to overstate the value of the option in excess of the BS value
he would ask for the maximum number of options (as much options as the company could possibly
grant him) at their (highest) breakeven strike the higher the strike price the more small probabilities
of large gains there are and the more valuable become options to him Furthermore this means that
such an employee would be much more interested in premium options instead of discount options
Actually although this result is in stark contrast with the common stock-based compensation practices
that consist in granting broadly at-the-money options it shouldnrsquot be rejected without taking into
account the other factors restricting the number of options the company could issue irrespective of
their strike prices such like capital dilution limits
In addition as we can notice from the plot in the middle of figure 7 the effect of probability
weighting on total incentives could be offset by an increasing loss-aversion This time is varied and
a held constant at 065 which meets the experimental estimate When the loss-aversion effect
dominates the total incentives function tends to non-monotone concave shapes which means that it
admits finite extremas In particular when probability weighting effect is neutralized by setting 1a -
in other words the employee is not subject to probability weighting - total incentives curve tends to
flatten around the optimum (see the green curves on the right-hand side plot) This suggests that there
exists a range of strike prices that yield quasi-similar incentives For instance with loss-aversion set
at 225 optimal strike (as of stock price at inception) is about 142 and lies within a range of
values from 121 to 153 that yield total incentives of about euro530 (rounded figure) With 6
the optimal strike drops by almost 30 (to 112) and total incentives are flat around the maximum
value of euro450 within the range from 91 to 111 Note that these results are consistent with Hallrsquos
and Murphyrsquos (2000 2002) findings relying on the EUT framework Consistently their work
documented that incentive-maximizing strike price exists when the options are considered as an add-
on to existing compensation In addition they showed that total incentives are relatively flat around
the maximum and that optimal strike price decreases for more risk-averse and less diversified
employees
19
Figure-7 Incentives from options grant with total cost of euro28 333 assuming no adjustment to existing compensation package This figure is plots of
incentives (in Keuro) from options grant for a given strike price holding the total BS value of the grant constant at euro28 333 Total incentives are defined as the
partial derivative of the total subjective value of the grant with respect to stock price ldquoSrdquo The sub-figure on the left-hand side depicts total incentives as a
function of the strike price and probability weighting parameter That in the middle is a plot of total incentives against strike price and loss-aversion The
sub-figure on the right-hand side exhibits the combined effect of probability weighting and loss-aversion on the shape of total incentives as a function of
strike price The derivatives were computed numerically based on the following parameters T=4 σ=30 S=100 r=3 q=0 α=088
222 Situation 2 Option grant with an adjustment to existing compensation
Now letrsquos considerer that the company is allowed to make an efficient adjustment to existing
compensation components (cash for example) in order to grant additional options to the employee
The impact of this adjustment should be neutral with regard to the total compensation cost for the
company Moreover assuming this adjustment involves cash compensation it must be attractive to the
employee so that hersquod be willing to give up some cash compensation against extra options grant
Therefore it must leave the employee at his initial total subjective value of the compensation package
It follows that the strike price that maximizes total incentives for a given company cost is the solution
of this following optimization problem
m ax
a
K
nC K
S
subject to a
n K nC K c
and 0n (8)
20
Where c is a fixed constant The constraint in (8) is the aggregation of the company cost constraint
and the employee value constraint used in Henderson (2005)
Similar to that in (7) this optimization problem was solved numerically In this analysis c was
chosen such that for retained parameters the number of granted at-the-money options n is around
1000 hence total cost of euro28 333 Once c is set n is determined from the constraint in (8) for a given
strike price K S then total incentives
anC K
S
are assessed These are depicted in figure 8
The left-hand side sub-figure exhibits total incentives for different levels of K and probability
weighting parameter a with risk aversion held constant at 225 For each combination of K and
a the constraint in (8) is solved for n which allows to determine total incentives The plots indicate
that when the employee is deeply subject to probability weighting ( 0475a )
anC K
S
is
strictly decreasing throughout the depicted range of strike prices (see the curves in blue) In this case
similar to EUT-based studiesrsquo findings (Hall and Murphy 2002 Henderson 2005) incentives are
maximized through restricted stocks grant rather than stock options The intuitive reason behind that
is given that the employee systematically values the options in excess of their BS value efficient
trade-off over compensation allocation is made via the grant of equity-based instruments that
employee values at their actual cost restricted stocks for instance
However for lower degrees of probability weighting (typically 0475 085 a ) the optimal
strike price is not nil and tends to increase with a Specifically the optimization problem is defined
on the right (see the red solid curve) or on the left (see the red dashed curve) of the optimal
strike
K and
anC K
S
admits an infinite branch in
K (ie total incentives are infinite at that
point) The technical reason behind that is that the subjective value is equal to the BS value at the
optimal strike which yields according to the constraint in (8) an infinite grant size
(
lim
K K
n K ) For instance
K ranges from 60 to 195 when a takes values within a range
of value around the experimental estimates ( 055 070a )11
This suggests that depending on the
extent to which employee weights probabilities either grants of discount options or premium options
may result in a Pareto optimum to the contract As a specific example for an employee with
0616a the optimal strike price
K is around 100 which means that for the prevailing setting
the model predicts at-the-money options as optimal in an efficient contracting framework since the
companyrsquos cost of granting these options is equal to their value to the employee In this case granting
11
Optimal strikes are expected to be lower for higher stock price volatility since probability weighting effect
tends to increase with volatility (recall figure 2)
21
options with strike price around the stock price at inception which is consistent with observed
practices results in a perfect reconciliation of the company and the employee respective views Note
that for a similar setting in the previous situation where the options are given as an add-on to existing
compensation the model indicates that incentives from stock options could be infinitely increased by
granting increasingly more options at greater and greater strike price
Furthermore for weak degrees of probability weighting ( 085 a ) the subjective value of the
option lies strictly below the BS value because the effect of loss-aversion tends to dominate that of
probability weighting Thus the total incentives function takes a non-monotone concave shape and
shows finite extremas ranging from 35 to 81 In particular when probability weighting assumption
is relaxed ( 1a ) the function flattens around the maximum and approaches a monotone decreasing
shape with increasing loss-aversion (see sub-figure on the right-hand side) This result suggests that
loss-averse employees who are not subject to probability weighting - even with very low degree of
probability weighting - receiving options at high exercise price would willingly accept a cut in cash
compensation to receive instead deep discount options or restricted shares for those of them displaying
more loss-aversion Again this is broadly consistent with Hallrsquos and Murphyrsquos (2002) and
Hendersonrsquos (2005) findings for non-diversified risk-averse employees
Last but not least the sub-figure in the middle of the main figure is plots of total incentives against
the strike price each of them corresponds to a given level of loss-aversion The purpose of this
analysis consists in showing the effect of loss-aversion on
K by holding a constant at 065 and
varying It mainly shows that loss-aversion has an effect opposite to that of probability weighting
when probability weighting effect is dominant12
(ie the employee may potentially put overstated
value in the option specifically for high strikes) optimal strike increases and total incentives decreased
with loss-aversion Conversely when loss-aversion effect is dominant as stated before the model
yields predictions comparable to that of the EUT-based models
12
See the limit case of 1 where risk-aversion is ignored (the blue dashed curve)
22
Figure-8 Incentives from options grant with total cost of euro28 333 assuming cash compensation is adjusted This figure is plots of incentives (in Keuro) from options grant
for a given strike price holding the total compensation value constant from both company and employee perspectives Total incentives are defined as the partial
derivative of the total subjective value of the grant with respect to stock price ldquoSrdquo The sub-figure on the left-hand side depicts total incentives as a function of the strike
price for varying levels of probability weighting parameter That in the middle is a plot of total incentives against strike price for varying levels of loss-aversion The
sub-figure on the right-hand side exhibits the sole effect of loss-aversion (with no probability weighting) on the shape of total incentives as a function of strike price The
derivatives were computed numerically based on the following parameters T=4 σ=30 S=100 r=3 q=0 α=088
3 Do stock-options provide incentive for risk taking
Earlier studies (Agrawal and Mandelker 1987 DeFusco et al 1990 Hirshleifer and Suh 1992)
have built on insights from standard option pricing theory to predict that option-compensated
managers will be motivated to increase the asset variance and leverage of their firms because the
convexity of the option payoff increase its value as the volatility of the stock price increases Lambert
et al (1991) was the first to call into question this assertion They proved that a non-diversified risk-
averse executive may not necessarily take actions that increase stock price volatility because that
parameter of the distribution of the stock price has two conflicting effects on the subjective value of
the option a positive effect implied by the payoff convexity and a negative effect due to the concavity
of the executiversquos utility function Henderson (2005) draws conclusions from a EUT-base model
consistent with these findings Specifically she finds that stock-options provide incentives for a risk-
averse manager to increase the beta of the company (ie the market risk-to-firm specific risk ratio)
rather than total risk Although there is some empirical evidence supporting the prediction that stock-
options do not systematically encourage risk taking it is still very scarce13
13
See for instance Cohen et al(2000) and Rajgopal and Shevelin (2002)
23
Figure-9 The effect of loss-aversion and probability weighting on risk-taking incentives implied by stock-options This figure is plots
of the partial derivative of the subjective value with respect to stock price volatility ldquoσrdquo against the option moneyness It exhibits on
the one hand the combined effects of loss-aversion and option moneyness (chart on the right-hand side) and on the other hand the
combined effects of probability weighting and option moneyness (chart on the left-hand side) on risk-taking incentives The derivatives
were computed numerically assuming three different levels of loss-aversion and probability weighting (see the legends above) and
holding the remaining parameters constant at the following values T=4 σ=30 K=100 r=3 q=0 α=088
I revisited the risk taking incentives issue from the perspective of an executive with CPT
preferences Similar to previous studies I defined incentives for risk taking as the first order derivative
of the subjective value in (6) with respect to volatility (a
C
)
14 In order to figure out the link
between risk-taking incentives from stock-options and the parameters related to preferences I
performed a numerical analysis on the sensitivity of a
C
to loss-aversion and probability weighting
The results are reported in figure 8 hereafter
The left-hand side subfigure is plots of a
C
as a function of the stock price for several degrees
of probability weighting with loss-aversion held constant at 225 The purpose of the underlying
analysis is to figure out broadly the extent to which a loss-averse executive subject to probability
weighting would prefer a high or low risk given the way the latter influences the option value from his
own perspective The first essential result from this analysis is that incentives for risk taking are
14
Actually the sensitivity of the subjective value to a parameter of the probability distribution of the stock price
provides a measure of the executive incentive to make decisions that influence that parameter
24
increasing with probability weighting degree In fact the probability weighting leverages the positive
effect of volatility on the subjective value through the convexity of the option payoff Another
observation that could be made is that for sufficiently high degree of probability weighting
( 070a )a
C
lies strictly above the conventional BS Vega over the retained range of stock prices
(see the red and the green curves) This means that an option-compensated CPT-executive subject to
probability weighting may be more prompted than a risk-neutral executive to act in order to increase
assets volatility Note that for typical setting of a at 065 the model predicts that a CPT-executive
with a such preferences calibration will have incentives to act in order to increase the volatility of the
stock price by 1 if he targets a 87 cts - increase of the value of his at-the-money 4-year option
In addition when probability weighting is ignored by setting 1a only the effect of loss-aversion
on risk taking incentives is captured The analysis of this effect is reported in the subfigure on the
right-hand side More explicitly this subfigure exhibits plots of a
C
for several levels of with
probability weighting effect neutralized It shows mainly that risk-taking incentives from stock-options
are decreasing with loss-aversion Moreover it appears that a
C
turns negative over a given range
of stock prices where the option is in-the-money Therefore consistent with findings from EUT-based
models the CPT model predicts that a loss-averse executive who is not subject to probability
weighting may not prefer an increase in the variance of the company stock price return As a specific
example an executive with a loss-aversion parameter 6 who processes probabilities in a linear
way (see the yellow curve) and holds 4-year stock options will have incentives to decrease rather than
increase the volatility of the company stock price if the stock price is above 130 the strike price of
his options
In essence incentives for risk taking from stock options - defined as the sensitivity of the
subjective value to the stock price volatility - is subject to two opposite effects under the CPT-based
model a positive effect from the convexity of the optionrsquos payoff leveraged by the probability
weighting feature and a negative effect from the loss-aversion coefficient Therefore there is a mixed
effect on risk taking incentives depending on which of the two effects dominates This will depend
obviously on the option moneyness and the other option-specific parameters
Conclusion
This paper proposes an alternative theoretical model of stock option subjective value to analyze
their incentive effects for employees The model predictions ascertain the ability of CPT to explain
some prominent incentive patterns that EUT models have difficulties to capture It mainly provides
25
arguments on the well documented tendency of employees to frequently value - under some
circumstances - their options in excess of their cost to the company Specifically these results
highlight the economic rational for firms in particular those with higher risk to widely use stock
options in non-executive employee compensation (Spalt 2008)
Loss aversion and probability weighting are the key features driving the subjective value in the
CPT model These parameters have countervailing effects on the modeled subjective value Depending
on which of them is dominant in the preferences calibration the model yields different predictions
regarding incentives Specifically consistent with some behavioral patterns observed in many surveys
and experimental studies on equity-based compensation the model predicts that when the probability
weighting feature prevails the subjective value may overstate the risk-neutral value of the option In
this case assuming the company and the employee bargain efficiently over the compensation
components incentives are maximized for strike prices set around the stock price at inception for a
representative employee with preferences calibration meeting the experimental estimates from CPT
(Tversky and Kahneman 1992) Obviously this finding is consistent with companiesrsquo actual
compensation practices Moreover executives with such preferences profile may be prompted to act in
order to increase share price volatility However when the emphasis is put on the loss-aversion
feature by relaxing the probability weighting assumption the model yields results comparable to
those of EUT-based models In particular the model predicts that loss-averse employees who are not
subject to probability weighting or even with very low degrees of probability weighting receiving
options at high exercise price would willingly accept a cut in compensation to receive instead deep
discount options or restricted shares for those of them displaying more loss-aversion Furthermore the
model shows that loss-averse executives who are processing probabilities in a linear fashion may not
prefer an increase in the variance of the company stock price return
Despite their practical interest the conclusions from the results of this research should not be
drawn without underlining some of its limitations The first one concerns the specification of the CPT
model Actually although the reference point specification in the model is consistent with both
empirical evidence on people setting reference points in a dynamic fashion and firmsrsquo widespread use
of the BS value as a standard for Financial and Human Resources disclosers empirical and
experimental literature is still silent on how people set reference points when assessing complex
gambles like stock option payoffs In addition to keep the model tractable only European-style
options were studied in this paper The model is still however easily extendable to Bermudian-style
options using numerical schemes such like lattice approaches The other limitation of this study is
related to the large heterogeneity in probability weighting that may exist across individuals (Wu and
Gonzalez 1996) The Tverskyrsquos and Kahnemanrsquos (1992) weighting function used in the model
provides only a fit to the median profile
26
Finally this work highlights - as did some previous eminent researches in this field (Dittmann et
al 2008 Splat 2008) - a number of future promising research directions in equity-based
compensation incorporating CPT framework For instant exploring the ability of CTP to explain the
growing use of performance shares plans instead of stock options in employee compensation would be
of great interest for future research Furthermore given that several empirical studies has documented
that employee stock option exercise behavior is also driven by behavioral factors a promising research
direction incorporating CPT is studying its ability to predict exercise patterns
Appendix A proofs of proposition 1
This appendix provides heuristic proofs of proposition 1
To prove that the subjective value a
C
is decreasing in 028 1a it is sufficient to show that
the expectation a
E
is a decreasing function of a Letrsquos first rewrite the expectation in (6) as follows
=
a aIP T IP T
x
a
IR
E v h E v h g x
w x u du x dx
Where
1
2 1
2
g x K x l
w x K g x l x l
x l
with 0 1 and 1 (A1)
Since w x
is derivable over 1IR l an expansion in Taylor series at the first order gives
w x w y x y w y
with 1y IR l
Introducing the expectation operator with respect to the transformed probability measure we have
a aIP IP
x
IP a
E w x w y E x y w y
w y E x u du y w y
(A2)
27
Since w x
is monotone increasing in x we have 0w y Then it follows from (A2) that
proving that a
E
is locally decreasing with respect to a in 1y IR l boils down to showing that
0
x
IP aE x u du
a
(A3)
Noting that
x
au du is positive and convex with respect to 1 1
x l l we
have according to Jensen inequality
IPE xx
IP a IP aE x u du E x u du
Since x follows a standard normal distribution which is symmetric in 0IP
E x we get from
the inequality above by substituting IPE x in the right hand side
0
x
IP aE x u du (A4)
Note that the result in (A4) above showing that the expectation under the transformed
probabilities overstates that under the original probabilities is a consequence of the probability
weighting function feature stated in sect112 which consists in infinitely-overweighting infinitesimal
probabilities and infinitely-underweighting near-one probabilities
Furthermore noting that the convexity of
x
au du with respect to 1 1
x l l
is decreasing in a and using the result in (A4) we have for 028 1 a b
IP IPE x E xx x
IP a IP a IP b IP bE x u du E x u du E x u du E x u du
Or equivalently
x x
IP a IP bE x u du E x u du (A5)
28
This proves that the condition in (A3) holds which means that a
C
is a decreasing function of
028 1a QED
Appendix B proofs of proposition 2
Taking the derivative of the subjective value function in (6) with respect to λ yields
1
1
1
1
1 0
1
a rT
a a
a
a a a rT
EE e if E
C
E E Ee otherw ise
(B1)
Where
1 2 3
a a a aE I I I
(B2)
Using the formulas in equations from (62) to (64) we can rewrite the derivatives in (B2) as follows
1
0
aI
1
2
2
l x
a
a
l
IK g x u du x dx
23
l
a
a
Ix dx
Then substituting these results in place of the derivatives in (B2) we obtain
1 2
2
l lx
a
a a
l
EK g x u du x dx x dx
(B3)
Given that
0
aE
we conclude that
aC
is nonpositive This implies that
aC
is a decreasing
function of QED
29
References
Abdellaoui M (2000) ldquoParameter-Free Elicitation of Utility and Probability Weighting Functionsrdquo
Management Science Vol 46 No 11 pp 1497-1512
Agrawal A Mandelker G (1987) ldquoManagerial incentives and corporate investment and financing
decisionsrdquo Journal of Finance Vol 42 No 4 pp 823-837
Bahaji H (2009) ldquoLe comportement drsquoexercice des porteurs de stock-options une eacutetude empirique
sur le marcheacute Ameacutericainrdquo Working Paper DRM Finance- Universiteacute de Paris Dauphine Paris June
2009
Barberis N and Thaler R(2003) ldquoA survey of behavioral financerdquo in Constantinides G Harris M
and Stulz R (Ed) Handbook of the Economics of Finance North-Holland Amsterdam
Bleichrodt H and Pinto JL (2000) ldquoA Parameter-Free Elicitation of the Probability Weighting
Function in Medical Decision Analysisrdquo Management Science Vol 46 No 11 pp 1485-1496
Cai J and Vijh AM (2004) ldquoExecutive stock and option valuation in a two state variable
framework allowing optimal investment of outside wealth in the risk-free asset and the market
portfoliordquo Working Paper University of Iowa
Camerer C and Ho TH (1994) ldquoViolations of Betweenness Axiom and Nonlinearity in
Probabilityrdquo Journal of Risk and Uncertainty Vol8 No 2 pp 167-196
Cohen RB Hall BJ and Viceira LM (2000) ldquoDo executive stock options encourage risk taking
rdquo Working Paper Harvard Business School
Cook P and Clotfelter C (1993) ldquoThe peculiar scale economies of lottordquo American Economic
Review Vol 83 No3 pp 634-643
DeFusco R Johnson R and Zorn T (1990) ldquoThe effect of executive stock option plans on
stockholders and bondholdersrdquo Journal of Finance Vol45 No 2 pp 617-627
Detemple J and Sundaresan S (1999) ldquoNontraded asset valuation with portfolio constraints a
binomial approachrdquo Review of Financial Studies Vol 12 No 4 pp 835ndash872
Devers C Wiseman R and Holmes M (2007) ldquoThe effects of endowment and loss aversion in
managerial stock option valuationrdquo Academy of Management Journal Vol 50 No 1 pp 191-208
Dittmann I and Maug E (2007) ldquoLower salaries and no options On the optimal structure of
Executive payrdquo The Journal of Finance Vol 62 No 1 pp 303-343
Gneezy U (1998) ldquoUpdating the Reference Level Experimental Evidencerdquo Working paper
University of Haifa
Hall B and Murphy K (2000) ldquoOptimal Exercise prices for executive stock optionsrdquo American
Economic Review Vol 90 No 2 pp 209-214
30
Hall B and Murphy K (2002) ldquoStock options for undiversified executivesrdquo Journal of Accounting
and Economics Vol 33 No 2 pp 3-42
Hallock K and Olson G (2006) ldquoThe value of stock options to non-executive employeesrdquo Working
Paper No 11950 National Bureau of Economic Research Cambridge
Heath C Huddart S and Lang M (1999) ldquoPsychological factors and stock option exerciserdquo
Quarterly Journal of Economics Vol 114 No 2 pp 601-628
Heisler J(1994) ldquoLoss aversion in a futures market an empirical testrdquo Review of Futures Markets
Vol 13 No 3 pp 793ndash822
Henderson V (2005) The impact of the market portfolio on the valuation incentives and optimality
of executive stock options Quantitative Finance Vol 5 No 1 pp 35-47
Hirshleifer D and Suh R (1992) ldquoRisk Managerial Effort and Project Choicerdquo Journal of
Financial Intermediation Vol 2 No 3 pp 308-345
Hodge F Rajgopal S and Shevlin T (2006) ldquoHow do managers value stock options and restricted
stock rdquo Working Paper University of Washington
Holmstrom BR and Milgrom PR (1987) ldquoAggregation and linearity in provision of intertemporal
incentivesrdquo Econometrica Vol 55 No 2 pp 303-328
Huddart S and Lang M (1996) ldquoEmployee stock option exercises an empirical analysisrdquo Journal
of Accounting and Economics Vol 21 No 1 pp 5-43
Jensen M and Murphy KJ (1990) ldquoPerformance pay and top-management incentivesrdquo Journal of
Political Economy Vol 98 No 2 pp 225-264
Jenter D (2001) ldquoUnderstanding high-powered incentivesrdquo Working Paper Harvard Business
School and Economics Departement
Johnson SA and Tian YS (2000) ldquoThe value and incentive effects of non-traditional executive
stock option plansrdquo Journal of Financial Economics Vol 57 No 1 pp 3-34
Jullien B and Salanie B (2000) ldquoEstimating preferences under risk The case of racetrack bettorsrdquo
Journal of Political Economy Vol 108 No 3 pp 503-530
Kachelmeier S and Shehata M (1992) ldquoExamining risk preferences under high monetary incentives
experimental evidence from the Peoplersquos Republic of Chinardquo American Economic Review Vol 82
No 5 pp 1120-1141
Kahneman D and Tversky A (1979) ldquoProspect Theory An analysis of decision under riskrdquo
Econometrica Vol 47 No 2 pp 263-292
Lambert R Lanen W and Larcker D (1989) ldquoExecutive stock option plans and corporate dividend
policyrdquo Journal of Financial and Quantitative Analysis Vol 24 No 4 pp 409-424
Lambert R Larcker D and Verrecchia R (1991) ldquoPortfolio considerations in valuing Executive
Compensationrdquo Journal of Accounting Research Vol 29 No 1 pp 129-149
Lambert R and Larcker D (2001) ldquoHow do employees value (often incorrectly) their stock optionsrdquo
available at knowledgewharton
31
Lewellen W Loderer C and Martin K (1987) ldquoExecutive compensation and executive incentive
problem an empirical analysisrdquo Journal of Accounting and Economics Vol 9 No 3 pp 287-310
Loughran T and Ritter J (1995) ldquoThe new issue puzzlerdquo Journal of Finance Vol 50 No 1 pp 23-
51
Markowitz H (1952) ldquoThe utility of wealthrdquo Journal of Political Economy Vol 60 No 2 pp 151-
158
Odean T (1998a) ldquoAre Investors Reluctant to Realize their Lossesrdquo Journal of Finance Vol 53
No 5 pp 1775ndash1798
Rajgopal S and Shevlin T (2002) ldquoEmpirical evidence on the relation between stock option
compensation and risk askingrdquo Journal of Accounting and Economics Vol 33 No 2 pp 145-171
Shefrin H and Statman M (1985) ldquoThe disposition to sell winners too early and ride losers too long
theory and evidencerdquo Journal of Finance Vol 40 No 3 pp 777-790
Sawers K Wright A and Zamora V (2006) ldquoLoss aversion stock-based compensation and
managerial risk-seeking behaviorrdquo paper presented at the AAA 2007 Management Accounting
Section Meeting available at httpssrncom abstract=864224
Thaler R (1999) ldquoMental Accounting Mattersrdquo Journal of Behavioral Decision Making Vol 12 No
3 pp 183-206
Thaler R and Ziemba W (1988) ldquoParimutuel betting markets Racetracks and lotteriesrdquo Journal of
Economic Perspectives Vol 2 No 2 pp 161-174
Tversky A and Kahneman D (1992) ldquoAdvances in Prospect Theory Cumulative representation of
uncertaintyrdquo Journal of Risk and Uncertainty Vol 5 No 4 pp 297-323
Yermack D (1997) ldquoGood Timing CEO Stock Option Awards and Company News
Announcementsrdquo Journal of Finance Vol 52 No 2 pp 449-476
Wu G and Gonzalez R (1996) ldquoCurvature of the Probability Weighting functionrdquo Management
Science Vol 42 No 12 pp 1676-1690

2
Introduction
Instead of an increasing interest for restricted stock and performance unit plans the 2006 Hewitt
Associates Total Compensation Measurement survey has revealed that stock options are still the most
prevalent long term incentive vehicle1 The stated argument for the large use of executive stock
options is that they align the interests of executives and shareholders since they provide incentives for
the manager to act in order to increase the firm value The use of stock options has even overtaken the
traditional arena of executive population Actually firmsrsquo compensation practices show that stock
options are issued to reward non-executive employees as well This may seem puzzling at first sight in
that the agency argument underlying the use of stock options is no more reliable under the non-
executive employees view because the formers are unlikely to influence the firm value by their
decisions (Spalt 2008) Nevertheless issuance of non-executive stock options results obviously from
an agreement between the firm and the employee upon the terms of the compensation involving stock
options which means that employees may be interested in stock options In order to figure out the
reason why stock options may be attractive to employees it is crucial to assess the utility they receive
from them Moreover understanding how employee evaluates its stock options (ie their subjective
value) allows assessing their incentive power and the implied employee behavior in terms of risk
taking
Most of the theoretical literature on stock options relies on the Expected Utility theory (EUT
henceforth) framework to derive models of option value from the employee perspective These models
predict that the nontransferability of the options and the hedging restrictions faced by the employee
make him value his options below their issuance cost born by the company (ie their risk neutral
value) A seminal work by Lambert et al (1991) has introduced a general theoretical framework to
analyze the valuation of equity based compensation contract from a managerrsquos perspective The
authors studied stock option contracts as a specific example They used the certainty-equivalence
principle to derive the so-called subjective value model Their model assumes that the manager is a
risk-averse agent with a power utility function and that he integrates his stock options in his global
wealth assessment process They proved that the subjective value decreases in risk aversion and
increases in the manager diversification with respect to the company specific risk Moreover they
showed that stock options may not provide incentives for a risk-averse manager to select actions that
increase the variance of the company stock price Hall and Merphy (2000 2002) followed the same
approach to analyze the risk-adjusted value of executive stock options along with their pay-to-
performance sensitivity Their major findings provide an economic rational to observed equity based
compensation practices while perhaps troubling from an efficiency perspective Mainly they showed
that pay-to-performance incentives from stock options when these are granted as an add-on to existing
1 80 of the responding participant companies to the survey have reported that stock option grants represent in
2006 on average about 54 of their global long-term incentives
3
compensation are typically maximized by setting their exercise price around the stock price at
inception In contrast when options grants are assumed to be accompanied by reductions in cash
compensation their model predicts that restricted stocks provide much higher incentives for
executives to increase the firm value and may then be preferred to stock options Henderson (2005)
has built on the previous works to examine the effect on valuation and incentives of market risk and
firm-specific risk She proposed a continuous time utility-based model to value stock options from the
managerrsquos perspective A prominent assumption in his model is allowing the executive to invest the
remainder of his wealth (excluding stock options) in the market portfolio2 and a risk-free asset In
particular her results suggest that stock options do not provide incentives to increase total risk but the
beta of the company instead She also finds that incentives decrease in firm-specific risk whilst they
may either decrease or increase in market risk depending on other factors In addition similar to Hall
and Murphy (2002) the authorrsquos model supports the grant of restricted stocks rather than stock options
under efficient contracting framework
A common finding of the EUT-based models is that the stock options value to a risk-averse
undiversified employee is strictly lower than the value to a risk-neutral well diversified outside
investors This is nevertheless in stark contrast to several surveys and empirical findings documenting
that employees may value their options above their risk-neutral value (ie the so-called Black Scholes
value) Lackerrsquos and Lambertrsquos (2001) research based on a survey of KnowledgeWharton readers
revealed that managers value their options substantially above the Black Scholes value (BS
henceforth) Moreover the survey revealed that younger managers have the most upward bias in the
values they perceive from their options According to the authors these results suggest that managers
do not fully understand the valuation of stock options or possibly their incentive effects Another
argument supporting managers may tend to overestimate their options value is provided by Yermack
(1997) He argues that to the extent that company executives have superior information regarding
company prospects and can time their option grants accordingly they may actually value options
higher than would outside investors do Furthermore relying on behavioral theories recent researches
have found evidence on employees drawing on heuristics and subject to psychological bias while
valuing their options which may lead them to overestimate the value of their options For instance
Devers et al(2007) study examines the effects of endowment and loss aversion on managersrsquo
subjective stock-option valuation Their main findings show that managers endow value from granted
unexercisable options in a way that they value them in excess of their objective value (ie BS value)
In the same vein Sawers et al(2006) drew conclusions from an experiment involving MBA students
consistent with the view that loss-averse managers subjectively overvalue stock options relative to
2 Prior works by Detemple and Sundaresan (1999) and by Cai and Vijh (2004) have used trees approach tied to
specific numerical schemes to study utility-based valuation of executive stock options when the executive can
invest in the Market portfolio
4
restricted stocks and therefore will be less risk-seeking when awarded with stock options and more
risk-seeking when endowed with restricted stocks
Moreover standard normative models fail to predict stock options as part of the compensation
contract Several quantitative studies taking place in principal-agent framework showed that EUT-
based models predict optimal compensation contracts that do not contain convex instruments like
stock options (Holmstrom and Milgrom 1987 Dittmann and Maug 2007) Consistent with these
findings studies focused on the effect of stock option and restricted stock grants on managerial effort
incentives (Jenter 2001 Hall and Murphy 2002 Henderson 2005) conclude that stock options are
inefficient tools for creating incentives for risk-averse managers when they are granted by mean of an
offset of cash compensation
This paper analyzes the valuation of stock options and their incentives effect to an employee
exhibiting preferences as described by Cumulative Prospect Theory (Tversky and Kahneman 1992) It
aims to propose an alternative theoretical framework for the analysis of pay-to-performance sensitivity
of equity-based compensation that takes into account a number of prominent patterns of employee
behavior that standard EUT cannot explain Specifically the key assumption underlying this work
proceeds from Cumulative Prospect Theory (CPT hereafter) and states that the employee choices
under risk display four main features Firstly instead of assessing outcomes based on their
contribution to his final wealth the employee assesses outcomes utility over gains and losses
determined relative to a reference level or a benchmark The second feature is loss-aversion It
conveys the experimental evidence that people are more sensitive to losses than they are to gains In
other words losses loom larger than gains The third feature consists in the principle according to
which people choices display diminishing sensitivity to incremental gains and losses The last piece is
the nonlinear probability processing It involves the well established tendency of individuals to
overweight small probabilities of large gains3 I drew on this theoretical framework to derive a
continuous time model of the stock option subjective value using the certainty equivalence principle I
then performed sensitivity analyses with respect to preferences-related parameters and found that loss
aversion and probability weighting have countervailing effects In particular I showed that the more
the employee is loss averse the less would the option be worth to him In addition I proved that the
option subjective value is increasing in probability weighting degree My analyses also show that for
a given level of option moneyness the subjective value of the option may lie strictly above the BS
value when the effect of probability weighting tends to dominate that of loss-aversion These results
lead to the conclusion that the lottery-like nature of stock-options combining large gains with small
probabilities may make them attractive to employees subject to probability weighting which is
3 There exists a large literature comprising empirical and experimental applications of overweighting small
winning probabilities This literature include notably Thaler and Ziemba (1988) Kachelmeier and Shehata
(1992) Cook and Clotfelter (1993) Loughran and Ritter (1995) and Jullien and Salanie (2000)
5
consistent with the proposition that employee option value estimate may exceed the BS value
(Lambert and Larcker 2001 Hodge et al 2006 Sawers et al 2006 Hallock and Olson 2006
Devers et al 2007)
Furthermore this work elaborates on incentives from stock options and on some implications in
terms of design aspects Following previous researches I defined incentives as the first order
derivative of the subjective value with respect to the stock price A numerical analysis of the incentive
function shows that stock option incentives are increasing in employeersquos degree of probability
weighting and may even lie above incentives for a risk-neutral individual Moreover I considered the
incentive effects of setting the strike price of the option above or below the stock price at inception In
this analysis I relied on Hallrsquos and Murphyrsquos (2002) methodology in solving for the exercise price that
maximizes incentives holding constant the company cost of granting the options Similar to their
approach I explored two situations In the first situation I assumed that the firm is precluded from
changing any component of the employee compensation package In this case the model predicts that
when the effect of probability weighting prevails (ie dominates that of loss-aversion) incentives
could be infinitely increased by granting more and more options at higher and higher strikes which
suggests that employee would be much more interested in premium options instead of discount
options However when loss-aversion effect dominates the model predicts that incentives are
maximized within strike price ranges that may include the grant date stock price depending on the
level of loss-aversion In the second situation the company is assumed to be allowed to adjust existing
compensation when making new stock option grants For typical setting of preferences parameters
around the experimental estimates from CPT (Tversky and Kahneman 1992) the model predicts that
incentives are maximized for strike prices set around the stock price at inception which is consistent
with companiesrsquo actual compensation practices Additional analyses suggest also that loss-averse
employees who are not subject to probability weighting or even with very low degrees of probability
weighting receiving options at high exercise price would willingly accept a cut in compensation to
receive instead deep discount options or restricted shares for those of them displaying more loss-
aversion This result is broadly consistent with Hall and Murphy (2002) and Henderson (2005)
findings for non-diversified risk-averse employees
The last item discussed in this paper is the risk taking incentives implied by stock option grants
Similar to previous studies I defined incentives for risk taking as the first order derivative of the
subjective value with respect to stock price returns volatility The first essential result from this
analysis is that incentives for risk taking are increasing with probability weighting degree In fact
probability weighting leverages the positive effect of volatility on the subjective value through the
convexity of the option payoff Another important finding from the model is that an option-
compensated executive subject to probability weighting may be more prompted than a risk-neutral
executive to act in order to increase assets volatility Moreover consistent with findings from EUT-
6
based models the CPT model predicts that a loss-averse probability-weighting-free executive may not
prefer an increase in the variance of the company stock price return
This work is motivated by recent empirical and theoretical researches on employee compensation
incorporating CPT-based models These models have proved successful in explaining some observed
compensation practices and specifically the almost universal presence of stock options in the
executive compensation contracts that EUT-based models have difficulties accommodating their
existence Therefore they have advanced CPT framework as a promising candidate for the analysis of
equity-based compensation contracts This literature includes in particular Dittmann et al (2008) who
developed a stylized principal-agent model that explain the observed mix of restricted stocks and stock
options in the executive compensation packages It also includes Spalt (2008) who used the CPT
framework and especially the probability weighting feature to prove that stock options may be
attractive to a loss-averse employee subject to probability weighting He then explained the puzzling
phenomenon that riskier firms are prompted to grant more stock-options to non-executive employees
This article proceeds as follows The first section describes the features of stock option value from
the perspective of a representative employee with preferences as described by CPT Throughout this
paper we will refer to this employee as a ldquoCPT employeerdquo This section provides also numerical
analyses on the model sensitivity to preferences-related parameters The next section introduces
incentive effects of stock options for a CPT-employee and examines some design implications in
terms of strike price setting The risk taking incentives question is explored in the third and last
section Appendices provide proofs of the propositions in the first section
1 Stock option value from a CPT-employee perspective
In this section I develop a base-case model for analyzing the value of the stock-option contract
from the perspective of a representative employee with CPT-based preferences (subjective value
henceforth) Specifically I assume that the employee is granted a European call option on the
companyrsquos stock denoted by S with maturity date t T and strike price K These are the traditional
features of executive stock options as reported in Johnson and Tian (2000) and used by prior studies
focused on stock option incentives (Lambert et al 1991 Hall and Murphy 2002 Henderson 2005)
Often in practice stock options are Bermudan-style options Thus my model relies on a naiumlve setting
in that it ignores complications related to early exercise or forfeitures
11 Theoretical framework
111 Stock-option contract
7
The stock option contract is issued in 0t The contract payoff at expiry t T is
T T
h S K
I make the assumption that the employee is not allowed to short-sell the company stock and that
he can earn the risk-free rate r from investing in a riskless asset Moreover the price dynamic of the
stock is given by a geometric Brownian motion represented by the following SDE
t t t tdS r q S dt S dZ (1)
Where t
Z is a standard Brownian motion with respect to the probability measure IP 2
and q are
respectively the total variance of the stock price returns and the dividend yield
112 Risk preferences
Following Tversky and Kahneman (1992) I consider that to each gamble with a continuous
random outcome y IR which the probability density function is denoted by f y the employee
assigns the value
IR
E y v y d f y
(2)
Note that the expectation E
is a function of two distinct functions The first function v
called the value function is assumed of the form
y yv y
y y
where 0 1 and 1 (3)
This formulation has some important features that distinguish it from the standard utility
specification First the utility is defined over gains and losses assessed based on the reference point
denoted by This idea was proposed first by Markowitz (1952) As pointed out by Barberis and
Thaler (2003) it fits naturally the way people perceive attributes in everyday life relative to their
previous levels rather than in absolute fashion The second important feature is the shape of the value
function While it is convex over losses it is concave over gains which represents the observation
from psychology that people are risk averse over gains and become risk-seeking over losses
Moreover the value function has a kink at the origin introduced by the parameter 1 This feature
known as loss-aversion gives a higher sensitivity to losses compared to gains Finally outcomes are
8
treated separately from other components of wealth which reflects the well-documented phenomenon
of narrow framing4 (Thaler 1999)
The second function
a b is called the weighting function It applies to cumulative
probabilities represented by the cumulative probability function F in order to transform them into
decision weights according to
1
1
1
(1 )
(1 )
a
a a a
a bb
b b b
F yy
F y F y
F y
F yy
F y F y
where 028 1a and 028 1b 5 (4)
This function stands for another piece of CPT which is the nonlinear transformation of
probabilities Specifically it captures experimental evidence on people overweighting small
probabilities and being more sensitive to probability spreads at higher probability levels (eg a jump in
probability from 07 to 09 would be more striking to individual than an equal-sized jump from 01 to
03) The degree of probability weighting is controlled separately over gains and losses by the
weighting parameters a and b respectively The more these parameters approach the lower boundary at
028 the more the tails of probability distribution are overweighted For instance when 1a b
probability weighting assumption is relaxed For simplicity these parameters are assumed to be equal
(ie a b ) and the weighting function will be denoted a
in the rest of this paper Finally it is
worth mentioning that this function (i) infinitely-overweights infinitesimal probabilities since
0
lima
p
p
p
and (ii) infinitely-underweights near-one probabilities in that
1
1lim
1
a
p
p
p
12 Stock option subjective value
121 The model
4 Narrow framing refers to people tendency to treat individual gambles separately from other portions of wealth
It stands for an important feature of Mental Accounting the mental process by which individuals formulate
problems for themselves (eg the way they code outcomes) Mental accounting is captured in CPT via the
nonlinear shape of the value function 5 The lower boundary at 028 is a technical condition to insure that a b
p
p
is positive over ]01[ as required by
the following first order condition 1 1 1 0aa
a p a p p p
9
In order to estimate the subjective value of the stock option contract described above I use the
certainty equivalent approach similar to that adopted by Spalt (2008) In particular this value is
defined as the cash amounta
C
that leaves the employee indifferent between this amount and the
uncertain payoff of the contract T
h irrespective of the composition of the remainder of his private
wealth Formally a
C
is the solution of the following equation
=
a
rT
a IP T
T a T
IR
v C e E v h
v h d F S
(5)
The left-hand side of the equation above represents the benefit for the employee from receiving
the cash amount a
C
instead of the stock option contract at the inception of the latter This amount is
assumed to be placed into the risk-free asset over the whole lifetime T of the stock option contract
The other side of the equation gives the expected utility to the employee from receiving the risky
payoff implied by the value function v
Here the expectation a
IPE relies on the transformed
probability measurea
IP
Let a
E
represent the expectation in the right-hand side of (5) It follows from (5) and (3) that
1
1
0
1
rT
a a
a
rT
a
E e if E
C
E e otherw ise
(6)
Where a
E
should write
1 2 3
a a a aE I I I
(61)
With
1
1
x
a a
l
I g x K u du x dx
(62)
1
2
2
l x
a a
l
I K g x u du x dx
(63)
10
2
3
l
a aI x dx
(64)
2
2( )
r q T T x
g x Se
(65)
2
1
ln2
Sr q T
Kl
T
(66)
2
2
ln2
Sr q T
Kl
T
(67)
Here is the Gaussian density function and a
a
pp
p
is the first-order partial derivative
of a
which is defined over 01 as follows
1
1
111
1
111
1
1 11
(1 )1
1
(1 )
1
aaa l
a a
aa a
aaa
la
a a
aa a
p p ppa p x dx
p pp p
p
p p pp
a p x dxp p
p p
(68)
122 Reference point set up
Although CPT specifies the shape of the value function around the reference point it does not
provide guidance on how people set their reference points Neither does most of the psychological
literature relying on the assumption according to which the reference point is the Status quo Instead
this literature admits both the existence and the importance of non-status quo reference points since
ldquothere are situations in which gains and losses are coded relative to an expectation or aspiration level
that differs from the status quordquo (Kahneman and Tversky 1979)
Research on the Disposition Effect6 has paid greater attention to non-status quo reference points
(Shefrin and Statman 1985 Heisler 1998 Odean 1998a Gneezy 1998) These studies have found
6 Disposition effect is a term coined by Shefrin and Statman (1985) to refer to the tendency of individual
investors to hold loser stocks and sell winner stocks defined relative to a purchase price reference point
11
strong evidence that reference points are set in a dynamic fashion In particular Gneezy (1998)
documented that maxima are more effective predictors than are purchase prices
More specifically in studding exercise behavior of stock options holders Huddart and Lang
(1996) Heath et al (1999) and Bahaji (2009) have shown empirically that exercise activity is linked to
share price historical maxima These findings are consistent with employee exercise decisions take
into account the level of share price with respect to non-status quo reference points
In principle employee would update the reference point in a way that fits with his own
expectations regarding the underlying share price at expiry Intuitively the employee could estimate
the intrinsic value of the option based on his future share price forecasts as he can rely on the Black
Scholes value of the option disclosed by the firm Following Spalt (2008) I consider that the reference
point parameter in the model is the BS value7 Beyond the argument of empirical evidence on
employee exercise behavior depending on non-status quo reference points this assumption is
supported by firms common practices in terms of stock option compensation Most of stock-option
designers use the BS model in order to estimate the value of stock options as constituents of the total
compensation package This value is usually announced to the employee at the inception of the
options Moreover the BS model is recommended in the FASB and the IASC guidelines for
determining the fair value of stock options (ie the amount an outside investor with no hedge
restrictions would pay for the option) that needs to be disclosed in the financial statements These
statements comprising the BS value of the stock options are provided to shareholders as well as
stakeholders including employees
123 The impacts of preferences-related parameters a numerical analysis
To provide a concrete outline on the profile of the subjective value yielded by the model relative
to the risk neutral value profile I performed a numerical analysis8 of the value of a 4-year call option
( 4T ) with a strike price 100K For the remaining option-related parameters the figures were
computed assuming no dividend payments ( 0q ) 30 and 3r Moreover I set the
curvature parameter of the value function ( ) and the loss aversion coefficient ( ) to respectively
088 and 225 based on experimental estimates from CPT (Tversky and Kahneman 1992)
7 To be more precise the value used here is the expectation of the option payoff at expiring yielded by the BS
model (ie the nondiscounted BS value) Consistent with this specification the probability measure IP used to
derive the subjective value in (6) is the risk neutral probability measure Moreover ignoring the probability
weighting feature (ie 1a ) this setting allows the subjective value implied by the model to converge towards
the risk neutral value (ie BS value) when the preferences of the employee tend to risk neutrality
(ie 1 ) 8 The integrals in (62) (63) and (64) were computed numerically
12
Figure-1 Option value against the stock price This figure is
a plot of the subjective value computed under different
probability weighting parameters (the blue curves) It
illustrates the profile of the subjective value compared to that
of the risk neutral value (red curve) The Parameters used
are T=4 K=100 σ=30 r=3 q=0 =225 α=088
Figure-2 Sensitivity to probability weighting This figure is
a plot of the partial derivative of the subjective value with
respect to ldquoardquo against both ldquoardquo and the stock price volatility
ldquoσrdquo It exhibits the local effect of probability weighting given
the payoff distribution skewness captured by ldquoσrdquo The
derivative was computed numerically based on the following
parameters T=4 K=S=100 r=3 q=0 =225 α=088
Furthermore in order to calibrate the probability weighting function I used three different values of
the parameter a within the range of values estimated in the experimental literature9
Figure 1 depicts the option value as a function of the stock price The three blue curves represent
the value profiles from the perspective of three CPT employees with the same value function and
different degrees of probability weighting At first sight depending on the degree of probability
weighting and the option moneyness (S
K) the subjective value could lie either under or below the BS
value In contrast standard EUT-based models predict that the option value from a risk-averse
employee perspective is systematically lower than the risk-neutral value (Hall and Murphy 2002
Henderson 2005) These preliminary results are consistent thought with some empirical findings
suggesting that frequently employees are inclined to overestimate the value of their stock-options
compared with the BS value (Lambert and Larcker 2001 Hodge et al 2006 Sawers et al 2006
Hallock and Olson 2006 Devers et al 2007)
9 Tversky and Kahneman (1992) got 065 on average (a=061 for gains and b=069 for losses) These results are
corroborated by Abdellaouirsquos (2000) findings (a=060 for gains and b=070 for losses hence an average of 065)
In addition Camerer and Ho (1994) obtained a=056 for gains whereas Gonzales and Wu (1996) and Bleichrodt
and Pinto (2000) found a=071 and a=067 respectively
13
The results presented in figure 1 show that the option subjective value is increasing in probability
weighting degree (ie decreasing in parameter a ) Actually given the asymmetric profile of the option
payoff the expectation a
E
in the subjective value formula (6) is positively affected by the emphasis
put on the tail of the payoff distribution which is governed by the parameter a the lower a the more
overweighed will be small probabilities and the more underweighted will be medium to large
probabilities This lottery-like nature of an option combining large gains with small probabilities may
make it attractive to a CPT employee subject to probability weighting This preliminary outcome leads
to proposition 1 which stats that
Proposition 1 the value of the stock option contract to a CPT- employee is increasing with
respect to his degree of probability weighting (ie is decreasing with respect to a)
(Proofs are provided in appendix A)
Moreover the effect of probability weighting is expected to increase with the skewness of the
distribution of the underlying stock price which is captured by the volatility parameter given the
Log-normality assumed in the model In order to show that I performed a numerical analysis of the
sensitivity of the subjective value to the probability weighting degree as a function of the volatility
and the parameter a This sensitivity is defined as the partial derivative of subjective value with
respect to a (a
C
a
) The results are reported in figure 2 in the form of a graph It shows that the
sensitivity to parameter a is negative and locally decreasing in volatility That means that the more the
share price is volatile the more the option will be attractive for a CPT employee subject to probability
weighting This supports Spaltrsquos (2008) findings that the effect of probability weighting provides an
economic rationale to riskier firms (ie more volatile firms) for granting more stock options to non-
executive employees
Furthermore I investigate the effect of loss aversion on the subjective value The variable of
interest here is In an analogical sense with the EUT framework the option value from the
perspective of a loss-averse employee is expected to decrease with his degree of loss-aversion To
verify this I computed numerically the first order derivative with respect to (
aC
) crossed over
various levels of and moneyness ranging from 005 to 1 and from 5 to 200 respectively The
outcome is reported in figure 3 It shows that the sensitivity to loss aversion is negative and locally
decreasing in moneyness That means that the more the employee is loss averse the less would the
option be worth to him This conclusion is taken up in proposition 2 hereafter
14
Figure-3 Sensitivity to loss aversion This figure is a plot of the
partial derivative of the subjective value with respect to ldquoλrdquo
against both ldquoλrdquo and the stock price ldquoSrdquo It exhibits the local effect
of loss aversion given the option moneyness The derivative was
computed numerically based on the following parameters T=4
σ=30 K=100 r=3 q=0 a=065 α=088
Figure-4 Sensitivity to the curvature parameter This figure is a
plot of the partial derivative of the subjective value with respect to
ldquoαrdquo against both ldquoαrdquo and the stock price ldquoSrdquo It exhibits the local
effect of the curvature parameter given the option moneyness The
derivative was computed numerically based on the following
parameters T=4 σ=30 K=100 r=3 q=0 a=065 λ =225
Proposition 2 the value of the stock option contract to a CPT- employee is decreasing with
respect to his degree of loss-aversion (ie a decreasing function of λ)
(Proofs are provided in appendix B)
I performed a similar analysis in order to get a view on the effect of the curvature parameter In
the same way I assessed locally the first order derivative with respect to within a range of values
from 005 to 1 and using share prices ranging from 10 to 200 Figure 4 shows that this derivative is
locally increasing with the option moneyness for values of above say 075 It also shows broadly
that the subjective value is an increasing monotone function of over a range of values around the
experimental estimate of 088 (from 07 to 1) irrespective of the option moneyness
2 Incentives from stock-options
Stock-options are incentive tools used within a principal-agent relationship to align the interests of
the agent (employee) on those of the principal (shareholders) The shareholders grant stock options in
15
order to provide the employee with incentives to make efforts that enhance the value of the firm and
thus their own wealth Indeed assuming that employees are aware of how their actions affect the share
price option holdings will prompt them to make efforts that increase share price Therefore the
incentive from a single option grant will depend on the degree of the sensitivity of the subjective value
to the stock price
21 The incentive measure
Following Jensen and Murphy (1990) Hall and Murphy (2000 2002) and others I defined the
incentive effect as the first order derivative of the subjective value with respect to share price (
aC
S
)
which defines how the value from the employee perspective changes with an incremental change in
the stock price As we can see in figure 5 which is a plot of
aC
S
for three values of a incentives
are greatest for in-the-money10
options Also the incentive effect is increasing with the degree of
probability weighting Another observation that can be made from figure 5 is that for sufficiently high
level of probability weighting the option can give much more incentive to increase stock price than is
reflected by the BS delta This is consistent with my previous finding that the subjective value can
overstate the BS value Note that consistently with the EUT-based models when the employee
process probabilities in a linear way ( 1a ) - which means that the probability weighting assumption
is relaxed and only loss-aversion matters - the incentives lie strictly under the BS delta whatever the
level of the option moneyness That is to say that the options are less attractive for both risk-averse
employee and loss-averse employee who are not subject to probability weighting The analysis in
figure 6 supports this It shows that with a hold constant at 065 incentives are decreasing in loss-
aversion Conversely with loss-aversion parameter set to 1 which means that the loss-aversion
effect is neutralized incentives for a representative loss-neutral employee with a degree of probability
weighting equal to experimental estimate of 065 overstate the BS delta
10
The terminology ldquoat-the-moneyrdquo is referring to stock-options with an exercise price equal to the stock price at
inception The expressions ldquoOut-of- the-moneyrdquo and ldquoIn-the-moneyrdquo are also used throughout the paper to refer
to options with strike price respectively below and above the grant date stock price
16
Figure-5 The effect of probability weighting on stock-option
incentives This figure is plots of the partial derivative of the
subjective value with respect to stock price ldquoSrdquo against the option
moneyness It exhibits the combined effects of probability
weighting and option moneyness on incentives The derivatives
were computed numerically assuming three different levels of
probability weighting (see the legend above) and holding the
remaining parameters constant at the following values T=4
σ=30 K=100 r=3 q=0 λ=225 α=088
Figure-6 The effect of loss-aversion on stock-option incentives
This figure is plots of the partial derivative of the subjective value
with respect to stock price ldquoSrdquo against the option moneyness It
exhibits the combined effects of loss-aversion and option
moneyness on incentives The derivatives were computed
numerically assuming three different levels of loss-aversion (see
the legend above) and holding the remaining parameters constant
at the following values T=4 σ=30 K=100 r=3 q=0
a=065 α=088
22 Implications for stock option design optimal strike price
Setting the strike price of standard stock options boils down to defining the threshold against which
the performance is assessed and consequently to determining the likelihood of a final payout As we
have just noticed from figure 5 and figure 6 incentives increases in the option moneyness and
equivalently decreases with strike price In parallel from the shareholders perspective granting in-
the-money options is much more costly than granting out-of-the money or at-the-money options
(recall figure 1) This leads the firm to a trade-off to make when setting the exercise price of the
options in the sense that holding his cost unchanged she could either grant fewer options at a low
strike price or increase the grant size at higher exercise price
I relied on the methodology from Hall and Murphy (2002) in figuring out the optimal exercise price
satisfying the double purpose of maximizing incentives and holding constant the firmrsquos cost of
granting options I also considered two situations In the first situation the firm does not adjust the
existing compensation package when grating additional stock options Thus these additional options
are considered as a pure add-on to existing compensation In the second situation however the
employee and the firm are allowed to bargain efficiently over the terms of the compensation Thus the
17
firm is assumed to fund additional options by an adjustment to other compensation components that
leaves the employee indifferent between his initial package and the new package including the
additional grant
221 Situation 1 Option grant without a compensation offset
When the firm is not allowed to adjust the existing compensation package the optimal strike price
that maximizes incentives for a given amount of firm cost is the solution to the following constrained
optimization problem
m ax
a
K
nC K
S
such that n K c (7)
Where a
nC K
S
denotes the incentives from receiving n options with a strike price K and
K the per-unit cost or the BS value of one option
The optimization problem in (7) is solved numerically by varying the parameter K First the BS
value is computed for a given K which enable to determine the grant size n that leaves the firm cost
constant at c in accordance with the constraint in (7) Then the cost function a
nC K
S
is assessed
based on n and K This procedure is reiterated recursively until the optimal value of K is found
I set the total cost for the firm at euro28 333c (hence a grant of 1000n at-the-money options
based on the retained option-related parameters) As reported in figure 7 I varied the preferences-
related parameters a and within specific ranges in order to figure out the conditions under which an
optimal strike may exist and the robustness of the model predictions The chart on the left-hand side
exhibits the total incentives from the grant as a function of the strike price and the probability
weighting parameter with the loss-aversion held constant at 225 It shows that the convexity and
the monotony of the total incentives function ( a
nC K
S
) shift with the degree of probability
weighting while it is concave and non-monotone over the range of strike prices for low levels of
probability weighting ( 0906a ) it becomes convex and monotonically increasing for higher levels
Moreover for higher level of volatility probability weighting is expected to affect more deeply the
shape of total incentives function (recall figure 2)
Specifically when the effect of probability weighting prevails (ie dominates that of loss-aversion)
the model predicts that incentives could be infinitely increased by granting more and more options at
higher and higher strikes This result suggests that if the employee is subject to a degree of probability
18
weighting that could potentially lead him to overstate the value of the option in excess of the BS value
he would ask for the maximum number of options (as much options as the company could possibly
grant him) at their (highest) breakeven strike the higher the strike price the more small probabilities
of large gains there are and the more valuable become options to him Furthermore this means that
such an employee would be much more interested in premium options instead of discount options
Actually although this result is in stark contrast with the common stock-based compensation practices
that consist in granting broadly at-the-money options it shouldnrsquot be rejected without taking into
account the other factors restricting the number of options the company could issue irrespective of
their strike prices such like capital dilution limits
In addition as we can notice from the plot in the middle of figure 7 the effect of probability
weighting on total incentives could be offset by an increasing loss-aversion This time is varied and
a held constant at 065 which meets the experimental estimate When the loss-aversion effect
dominates the total incentives function tends to non-monotone concave shapes which means that it
admits finite extremas In particular when probability weighting effect is neutralized by setting 1a -
in other words the employee is not subject to probability weighting - total incentives curve tends to
flatten around the optimum (see the green curves on the right-hand side plot) This suggests that there
exists a range of strike prices that yield quasi-similar incentives For instance with loss-aversion set
at 225 optimal strike (as of stock price at inception) is about 142 and lies within a range of
values from 121 to 153 that yield total incentives of about euro530 (rounded figure) With 6
the optimal strike drops by almost 30 (to 112) and total incentives are flat around the maximum
value of euro450 within the range from 91 to 111 Note that these results are consistent with Hallrsquos
and Murphyrsquos (2000 2002) findings relying on the EUT framework Consistently their work
documented that incentive-maximizing strike price exists when the options are considered as an add-
on to existing compensation In addition they showed that total incentives are relatively flat around
the maximum and that optimal strike price decreases for more risk-averse and less diversified
employees
19
Figure-7 Incentives from options grant with total cost of euro28 333 assuming no adjustment to existing compensation package This figure is plots of
incentives (in Keuro) from options grant for a given strike price holding the total BS value of the grant constant at euro28 333 Total incentives are defined as the
partial derivative of the total subjective value of the grant with respect to stock price ldquoSrdquo The sub-figure on the left-hand side depicts total incentives as a
function of the strike price and probability weighting parameter That in the middle is a plot of total incentives against strike price and loss-aversion The
sub-figure on the right-hand side exhibits the combined effect of probability weighting and loss-aversion on the shape of total incentives as a function of
strike price The derivatives were computed numerically based on the following parameters T=4 σ=30 S=100 r=3 q=0 α=088
222 Situation 2 Option grant with an adjustment to existing compensation
Now letrsquos considerer that the company is allowed to make an efficient adjustment to existing
compensation components (cash for example) in order to grant additional options to the employee
The impact of this adjustment should be neutral with regard to the total compensation cost for the
company Moreover assuming this adjustment involves cash compensation it must be attractive to the
employee so that hersquod be willing to give up some cash compensation against extra options grant
Therefore it must leave the employee at his initial total subjective value of the compensation package
It follows that the strike price that maximizes total incentives for a given company cost is the solution
of this following optimization problem
m ax
a
K
nC K
S
subject to a
n K nC K c
and 0n (8)
20
Where c is a fixed constant The constraint in (8) is the aggregation of the company cost constraint
and the employee value constraint used in Henderson (2005)
Similar to that in (7) this optimization problem was solved numerically In this analysis c was
chosen such that for retained parameters the number of granted at-the-money options n is around
1000 hence total cost of euro28 333 Once c is set n is determined from the constraint in (8) for a given
strike price K S then total incentives
anC K
S
are assessed These are depicted in figure 8
The left-hand side sub-figure exhibits total incentives for different levels of K and probability
weighting parameter a with risk aversion held constant at 225 For each combination of K and
a the constraint in (8) is solved for n which allows to determine total incentives The plots indicate
that when the employee is deeply subject to probability weighting ( 0475a )
anC K
S
is
strictly decreasing throughout the depicted range of strike prices (see the curves in blue) In this case
similar to EUT-based studiesrsquo findings (Hall and Murphy 2002 Henderson 2005) incentives are
maximized through restricted stocks grant rather than stock options The intuitive reason behind that
is given that the employee systematically values the options in excess of their BS value efficient
trade-off over compensation allocation is made via the grant of equity-based instruments that
employee values at their actual cost restricted stocks for instance
However for lower degrees of probability weighting (typically 0475 085 a ) the optimal
strike price is not nil and tends to increase with a Specifically the optimization problem is defined
on the right (see the red solid curve) or on the left (see the red dashed curve) of the optimal
strike
K and
anC K
S
admits an infinite branch in
K (ie total incentives are infinite at that
point) The technical reason behind that is that the subjective value is equal to the BS value at the
optimal strike which yields according to the constraint in (8) an infinite grant size
(
lim
K K
n K ) For instance
K ranges from 60 to 195 when a takes values within a range
of value around the experimental estimates ( 055 070a )11
This suggests that depending on the
extent to which employee weights probabilities either grants of discount options or premium options
may result in a Pareto optimum to the contract As a specific example for an employee with
0616a the optimal strike price
K is around 100 which means that for the prevailing setting
the model predicts at-the-money options as optimal in an efficient contracting framework since the
companyrsquos cost of granting these options is equal to their value to the employee In this case granting
11
Optimal strikes are expected to be lower for higher stock price volatility since probability weighting effect
tends to increase with volatility (recall figure 2)
21
options with strike price around the stock price at inception which is consistent with observed
practices results in a perfect reconciliation of the company and the employee respective views Note
that for a similar setting in the previous situation where the options are given as an add-on to existing
compensation the model indicates that incentives from stock options could be infinitely increased by
granting increasingly more options at greater and greater strike price
Furthermore for weak degrees of probability weighting ( 085 a ) the subjective value of the
option lies strictly below the BS value because the effect of loss-aversion tends to dominate that of
probability weighting Thus the total incentives function takes a non-monotone concave shape and
shows finite extremas ranging from 35 to 81 In particular when probability weighting assumption
is relaxed ( 1a ) the function flattens around the maximum and approaches a monotone decreasing
shape with increasing loss-aversion (see sub-figure on the right-hand side) This result suggests that
loss-averse employees who are not subject to probability weighting - even with very low degree of
probability weighting - receiving options at high exercise price would willingly accept a cut in cash
compensation to receive instead deep discount options or restricted shares for those of them displaying
more loss-aversion Again this is broadly consistent with Hallrsquos and Murphyrsquos (2002) and
Hendersonrsquos (2005) findings for non-diversified risk-averse employees
Last but not least the sub-figure in the middle of the main figure is plots of total incentives against
the strike price each of them corresponds to a given level of loss-aversion The purpose of this
analysis consists in showing the effect of loss-aversion on
K by holding a constant at 065 and
varying It mainly shows that loss-aversion has an effect opposite to that of probability weighting
when probability weighting effect is dominant12
(ie the employee may potentially put overstated
value in the option specifically for high strikes) optimal strike increases and total incentives decreased
with loss-aversion Conversely when loss-aversion effect is dominant as stated before the model
yields predictions comparable to that of the EUT-based models
12
See the limit case of 1 where risk-aversion is ignored (the blue dashed curve)
22
Figure-8 Incentives from options grant with total cost of euro28 333 assuming cash compensation is adjusted This figure is plots of incentives (in Keuro) from options grant
for a given strike price holding the total compensation value constant from both company and employee perspectives Total incentives are defined as the partial
derivative of the total subjective value of the grant with respect to stock price ldquoSrdquo The sub-figure on the left-hand side depicts total incentives as a function of the strike
price for varying levels of probability weighting parameter That in the middle is a plot of total incentives against strike price for varying levels of loss-aversion The
sub-figure on the right-hand side exhibits the sole effect of loss-aversion (with no probability weighting) on the shape of total incentives as a function of strike price The
derivatives were computed numerically based on the following parameters T=4 σ=30 S=100 r=3 q=0 α=088
3 Do stock-options provide incentive for risk taking
Earlier studies (Agrawal and Mandelker 1987 DeFusco et al 1990 Hirshleifer and Suh 1992)
have built on insights from standard option pricing theory to predict that option-compensated
managers will be motivated to increase the asset variance and leverage of their firms because the
convexity of the option payoff increase its value as the volatility of the stock price increases Lambert
et al (1991) was the first to call into question this assertion They proved that a non-diversified risk-
averse executive may not necessarily take actions that increase stock price volatility because that
parameter of the distribution of the stock price has two conflicting effects on the subjective value of
the option a positive effect implied by the payoff convexity and a negative effect due to the concavity
of the executiversquos utility function Henderson (2005) draws conclusions from a EUT-base model
consistent with these findings Specifically she finds that stock-options provide incentives for a risk-
averse manager to increase the beta of the company (ie the market risk-to-firm specific risk ratio)
rather than total risk Although there is some empirical evidence supporting the prediction that stock-
options do not systematically encourage risk taking it is still very scarce13
13
See for instance Cohen et al(2000) and Rajgopal and Shevelin (2002)
23
Figure-9 The effect of loss-aversion and probability weighting on risk-taking incentives implied by stock-options This figure is plots
of the partial derivative of the subjective value with respect to stock price volatility ldquoσrdquo against the option moneyness It exhibits on
the one hand the combined effects of loss-aversion and option moneyness (chart on the right-hand side) and on the other hand the
combined effects of probability weighting and option moneyness (chart on the left-hand side) on risk-taking incentives The derivatives
were computed numerically assuming three different levels of loss-aversion and probability weighting (see the legends above) and
holding the remaining parameters constant at the following values T=4 σ=30 K=100 r=3 q=0 α=088
I revisited the risk taking incentives issue from the perspective of an executive with CPT
preferences Similar to previous studies I defined incentives for risk taking as the first order derivative
of the subjective value in (6) with respect to volatility (a
C
)
14 In order to figure out the link
between risk-taking incentives from stock-options and the parameters related to preferences I
performed a numerical analysis on the sensitivity of a
C
to loss-aversion and probability weighting
The results are reported in figure 8 hereafter
The left-hand side subfigure is plots of a
C
as a function of the stock price for several degrees
of probability weighting with loss-aversion held constant at 225 The purpose of the underlying
analysis is to figure out broadly the extent to which a loss-averse executive subject to probability
weighting would prefer a high or low risk given the way the latter influences the option value from his
own perspective The first essential result from this analysis is that incentives for risk taking are
14
Actually the sensitivity of the subjective value to a parameter of the probability distribution of the stock price
provides a measure of the executive incentive to make decisions that influence that parameter
24
increasing with probability weighting degree In fact the probability weighting leverages the positive
effect of volatility on the subjective value through the convexity of the option payoff Another
observation that could be made is that for sufficiently high degree of probability weighting
( 070a )a
C
lies strictly above the conventional BS Vega over the retained range of stock prices
(see the red and the green curves) This means that an option-compensated CPT-executive subject to
probability weighting may be more prompted than a risk-neutral executive to act in order to increase
assets volatility Note that for typical setting of a at 065 the model predicts that a CPT-executive
with a such preferences calibration will have incentives to act in order to increase the volatility of the
stock price by 1 if he targets a 87 cts - increase of the value of his at-the-money 4-year option
In addition when probability weighting is ignored by setting 1a only the effect of loss-aversion
on risk taking incentives is captured The analysis of this effect is reported in the subfigure on the
right-hand side More explicitly this subfigure exhibits plots of a
C
for several levels of with
probability weighting effect neutralized It shows mainly that risk-taking incentives from stock-options
are decreasing with loss-aversion Moreover it appears that a
C
turns negative over a given range
of stock prices where the option is in-the-money Therefore consistent with findings from EUT-based
models the CPT model predicts that a loss-averse executive who is not subject to probability
weighting may not prefer an increase in the variance of the company stock price return As a specific
example an executive with a loss-aversion parameter 6 who processes probabilities in a linear
way (see the yellow curve) and holds 4-year stock options will have incentives to decrease rather than
increase the volatility of the company stock price if the stock price is above 130 the strike price of
his options
In essence incentives for risk taking from stock options - defined as the sensitivity of the
subjective value to the stock price volatility - is subject to two opposite effects under the CPT-based
model a positive effect from the convexity of the optionrsquos payoff leveraged by the probability
weighting feature and a negative effect from the loss-aversion coefficient Therefore there is a mixed
effect on risk taking incentives depending on which of the two effects dominates This will depend
obviously on the option moneyness and the other option-specific parameters
Conclusion
This paper proposes an alternative theoretical model of stock option subjective value to analyze
their incentive effects for employees The model predictions ascertain the ability of CPT to explain
some prominent incentive patterns that EUT models have difficulties to capture It mainly provides
25
arguments on the well documented tendency of employees to frequently value - under some
circumstances - their options in excess of their cost to the company Specifically these results
highlight the economic rational for firms in particular those with higher risk to widely use stock
options in non-executive employee compensation (Spalt 2008)
Loss aversion and probability weighting are the key features driving the subjective value in the
CPT model These parameters have countervailing effects on the modeled subjective value Depending
on which of them is dominant in the preferences calibration the model yields different predictions
regarding incentives Specifically consistent with some behavioral patterns observed in many surveys
and experimental studies on equity-based compensation the model predicts that when the probability
weighting feature prevails the subjective value may overstate the risk-neutral value of the option In
this case assuming the company and the employee bargain efficiently over the compensation
components incentives are maximized for strike prices set around the stock price at inception for a
representative employee with preferences calibration meeting the experimental estimates from CPT
(Tversky and Kahneman 1992) Obviously this finding is consistent with companiesrsquo actual
compensation practices Moreover executives with such preferences profile may be prompted to act in
order to increase share price volatility However when the emphasis is put on the loss-aversion
feature by relaxing the probability weighting assumption the model yields results comparable to
those of EUT-based models In particular the model predicts that loss-averse employees who are not
subject to probability weighting or even with very low degrees of probability weighting receiving
options at high exercise price would willingly accept a cut in compensation to receive instead deep
discount options or restricted shares for those of them displaying more loss-aversion Furthermore the
model shows that loss-averse executives who are processing probabilities in a linear fashion may not
prefer an increase in the variance of the company stock price return
Despite their practical interest the conclusions from the results of this research should not be
drawn without underlining some of its limitations The first one concerns the specification of the CPT
model Actually although the reference point specification in the model is consistent with both
empirical evidence on people setting reference points in a dynamic fashion and firmsrsquo widespread use
of the BS value as a standard for Financial and Human Resources disclosers empirical and
experimental literature is still silent on how people set reference points when assessing complex
gambles like stock option payoffs In addition to keep the model tractable only European-style
options were studied in this paper The model is still however easily extendable to Bermudian-style
options using numerical schemes such like lattice approaches The other limitation of this study is
related to the large heterogeneity in probability weighting that may exist across individuals (Wu and
Gonzalez 1996) The Tverskyrsquos and Kahnemanrsquos (1992) weighting function used in the model
provides only a fit to the median profile
26
Finally this work highlights - as did some previous eminent researches in this field (Dittmann et
al 2008 Splat 2008) - a number of future promising research directions in equity-based
compensation incorporating CPT framework For instant exploring the ability of CTP to explain the
growing use of performance shares plans instead of stock options in employee compensation would be
of great interest for future research Furthermore given that several empirical studies has documented
that employee stock option exercise behavior is also driven by behavioral factors a promising research
direction incorporating CPT is studying its ability to predict exercise patterns
Appendix A proofs of proposition 1
This appendix provides heuristic proofs of proposition 1
To prove that the subjective value a
C
is decreasing in 028 1a it is sufficient to show that
the expectation a
E
is a decreasing function of a Letrsquos first rewrite the expectation in (6) as follows
=
a aIP T IP T
x
a
IR
E v h E v h g x
w x u du x dx
Where
1
2 1
2
g x K x l
w x K g x l x l
x l
with 0 1 and 1 (A1)
Since w x
is derivable over 1IR l an expansion in Taylor series at the first order gives
w x w y x y w y
with 1y IR l
Introducing the expectation operator with respect to the transformed probability measure we have
a aIP IP
x
IP a
E w x w y E x y w y
w y E x u du y w y
(A2)
27
Since w x
is monotone increasing in x we have 0w y Then it follows from (A2) that
proving that a
E
is locally decreasing with respect to a in 1y IR l boils down to showing that
0
x
IP aE x u du
a
(A3)
Noting that
x
au du is positive and convex with respect to 1 1
x l l we
have according to Jensen inequality
IPE xx
IP a IP aE x u du E x u du
Since x follows a standard normal distribution which is symmetric in 0IP
E x we get from
the inequality above by substituting IPE x in the right hand side
0
x
IP aE x u du (A4)
Note that the result in (A4) above showing that the expectation under the transformed
probabilities overstates that under the original probabilities is a consequence of the probability
weighting function feature stated in sect112 which consists in infinitely-overweighting infinitesimal
probabilities and infinitely-underweighting near-one probabilities
Furthermore noting that the convexity of
x
au du with respect to 1 1
x l l
is decreasing in a and using the result in (A4) we have for 028 1 a b
IP IPE x E xx x
IP a IP a IP b IP bE x u du E x u du E x u du E x u du
Or equivalently
x x
IP a IP bE x u du E x u du (A5)
28
This proves that the condition in (A3) holds which means that a
C
is a decreasing function of
028 1a QED
Appendix B proofs of proposition 2
Taking the derivative of the subjective value function in (6) with respect to λ yields
1
1
1
1
1 0
1
a rT
a a
a
a a a rT
EE e if E
C
E E Ee otherw ise
(B1)
Where
1 2 3
a a a aE I I I
(B2)
Using the formulas in equations from (62) to (64) we can rewrite the derivatives in (B2) as follows
1
0
aI
1
2
2
l x
a
a
l
IK g x u du x dx
23
l
a
a
Ix dx
Then substituting these results in place of the derivatives in (B2) we obtain
1 2
2
l lx
a
a a
l
EK g x u du x dx x dx
(B3)
Given that
0
aE
we conclude that
aC
is nonpositive This implies that
aC
is a decreasing
function of QED
29
References
Abdellaoui M (2000) ldquoParameter-Free Elicitation of Utility and Probability Weighting Functionsrdquo
Management Science Vol 46 No 11 pp 1497-1512
Agrawal A Mandelker G (1987) ldquoManagerial incentives and corporate investment and financing
decisionsrdquo Journal of Finance Vol 42 No 4 pp 823-837
Bahaji H (2009) ldquoLe comportement drsquoexercice des porteurs de stock-options une eacutetude empirique
sur le marcheacute Ameacutericainrdquo Working Paper DRM Finance- Universiteacute de Paris Dauphine Paris June
2009
Barberis N and Thaler R(2003) ldquoA survey of behavioral financerdquo in Constantinides G Harris M
and Stulz R (Ed) Handbook of the Economics of Finance North-Holland Amsterdam
Bleichrodt H and Pinto JL (2000) ldquoA Parameter-Free Elicitation of the Probability Weighting
Function in Medical Decision Analysisrdquo Management Science Vol 46 No 11 pp 1485-1496
Cai J and Vijh AM (2004) ldquoExecutive stock and option valuation in a two state variable
framework allowing optimal investment of outside wealth in the risk-free asset and the market
portfoliordquo Working Paper University of Iowa
Camerer C and Ho TH (1994) ldquoViolations of Betweenness Axiom and Nonlinearity in
Probabilityrdquo Journal of Risk and Uncertainty Vol8 No 2 pp 167-196
Cohen RB Hall BJ and Viceira LM (2000) ldquoDo executive stock options encourage risk taking
rdquo Working Paper Harvard Business School
Cook P and Clotfelter C (1993) ldquoThe peculiar scale economies of lottordquo American Economic
Review Vol 83 No3 pp 634-643
DeFusco R Johnson R and Zorn T (1990) ldquoThe effect of executive stock option plans on
stockholders and bondholdersrdquo Journal of Finance Vol45 No 2 pp 617-627
Detemple J and Sundaresan S (1999) ldquoNontraded asset valuation with portfolio constraints a
binomial approachrdquo Review of Financial Studies Vol 12 No 4 pp 835ndash872
Devers C Wiseman R and Holmes M (2007) ldquoThe effects of endowment and loss aversion in
managerial stock option valuationrdquo Academy of Management Journal Vol 50 No 1 pp 191-208
Dittmann I and Maug E (2007) ldquoLower salaries and no options On the optimal structure of
Executive payrdquo The Journal of Finance Vol 62 No 1 pp 303-343
Gneezy U (1998) ldquoUpdating the Reference Level Experimental Evidencerdquo Working paper
University of Haifa
Hall B and Murphy K (2000) ldquoOptimal Exercise prices for executive stock optionsrdquo American
Economic Review Vol 90 No 2 pp 209-214
30
Hall B and Murphy K (2002) ldquoStock options for undiversified executivesrdquo Journal of Accounting
and Economics Vol 33 No 2 pp 3-42
Hallock K and Olson G (2006) ldquoThe value of stock options to non-executive employeesrdquo Working
Paper No 11950 National Bureau of Economic Research Cambridge
Heath C Huddart S and Lang M (1999) ldquoPsychological factors and stock option exerciserdquo
Quarterly Journal of Economics Vol 114 No 2 pp 601-628
Heisler J(1994) ldquoLoss aversion in a futures market an empirical testrdquo Review of Futures Markets
Vol 13 No 3 pp 793ndash822
Henderson V (2005) The impact of the market portfolio on the valuation incentives and optimality
of executive stock options Quantitative Finance Vol 5 No 1 pp 35-47
Hirshleifer D and Suh R (1992) ldquoRisk Managerial Effort and Project Choicerdquo Journal of
Financial Intermediation Vol 2 No 3 pp 308-345
Hodge F Rajgopal S and Shevlin T (2006) ldquoHow do managers value stock options and restricted
stock rdquo Working Paper University of Washington
Holmstrom BR and Milgrom PR (1987) ldquoAggregation and linearity in provision of intertemporal
incentivesrdquo Econometrica Vol 55 No 2 pp 303-328
Huddart S and Lang M (1996) ldquoEmployee stock option exercises an empirical analysisrdquo Journal
of Accounting and Economics Vol 21 No 1 pp 5-43
Jensen M and Murphy KJ (1990) ldquoPerformance pay and top-management incentivesrdquo Journal of
Political Economy Vol 98 No 2 pp 225-264
Jenter D (2001) ldquoUnderstanding high-powered incentivesrdquo Working Paper Harvard Business
School and Economics Departement
Johnson SA and Tian YS (2000) ldquoThe value and incentive effects of non-traditional executive
stock option plansrdquo Journal of Financial Economics Vol 57 No 1 pp 3-34
Jullien B and Salanie B (2000) ldquoEstimating preferences under risk The case of racetrack bettorsrdquo
Journal of Political Economy Vol 108 No 3 pp 503-530
Kachelmeier S and Shehata M (1992) ldquoExamining risk preferences under high monetary incentives
experimental evidence from the Peoplersquos Republic of Chinardquo American Economic Review Vol 82
No 5 pp 1120-1141
Kahneman D and Tversky A (1979) ldquoProspect Theory An analysis of decision under riskrdquo
Econometrica Vol 47 No 2 pp 263-292
Lambert R Lanen W and Larcker D (1989) ldquoExecutive stock option plans and corporate dividend
policyrdquo Journal of Financial and Quantitative Analysis Vol 24 No 4 pp 409-424
Lambert R Larcker D and Verrecchia R (1991) ldquoPortfolio considerations in valuing Executive
Compensationrdquo Journal of Accounting Research Vol 29 No 1 pp 129-149
Lambert R and Larcker D (2001) ldquoHow do employees value (often incorrectly) their stock optionsrdquo
available at knowledgewharton
31
Lewellen W Loderer C and Martin K (1987) ldquoExecutive compensation and executive incentive
problem an empirical analysisrdquo Journal of Accounting and Economics Vol 9 No 3 pp 287-310
Loughran T and Ritter J (1995) ldquoThe new issue puzzlerdquo Journal of Finance Vol 50 No 1 pp 23-
51
Markowitz H (1952) ldquoThe utility of wealthrdquo Journal of Political Economy Vol 60 No 2 pp 151-
158
Odean T (1998a) ldquoAre Investors Reluctant to Realize their Lossesrdquo Journal of Finance Vol 53
No 5 pp 1775ndash1798
Rajgopal S and Shevlin T (2002) ldquoEmpirical evidence on the relation between stock option
compensation and risk askingrdquo Journal of Accounting and Economics Vol 33 No 2 pp 145-171
Shefrin H and Statman M (1985) ldquoThe disposition to sell winners too early and ride losers too long
theory and evidencerdquo Journal of Finance Vol 40 No 3 pp 777-790
Sawers K Wright A and Zamora V (2006) ldquoLoss aversion stock-based compensation and
managerial risk-seeking behaviorrdquo paper presented at the AAA 2007 Management Accounting
Section Meeting available at httpssrncom abstract=864224
Thaler R (1999) ldquoMental Accounting Mattersrdquo Journal of Behavioral Decision Making Vol 12 No
3 pp 183-206
Thaler R and Ziemba W (1988) ldquoParimutuel betting markets Racetracks and lotteriesrdquo Journal of
Economic Perspectives Vol 2 No 2 pp 161-174
Tversky A and Kahneman D (1992) ldquoAdvances in Prospect Theory Cumulative representation of
uncertaintyrdquo Journal of Risk and Uncertainty Vol 5 No 4 pp 297-323
Yermack D (1997) ldquoGood Timing CEO Stock Option Awards and Company News
Announcementsrdquo Journal of Finance Vol 52 No 2 pp 449-476
Wu G and Gonzalez R (1996) ldquoCurvature of the Probability Weighting functionrdquo Management
Science Vol 42 No 12 pp 1676-1690

3
compensation are typically maximized by setting their exercise price around the stock price at
inception In contrast when options grants are assumed to be accompanied by reductions in cash
compensation their model predicts that restricted stocks provide much higher incentives for
executives to increase the firm value and may then be preferred to stock options Henderson (2005)
has built on the previous works to examine the effect on valuation and incentives of market risk and
firm-specific risk She proposed a continuous time utility-based model to value stock options from the
managerrsquos perspective A prominent assumption in his model is allowing the executive to invest the
remainder of his wealth (excluding stock options) in the market portfolio2 and a risk-free asset In
particular her results suggest that stock options do not provide incentives to increase total risk but the
beta of the company instead She also finds that incentives decrease in firm-specific risk whilst they
may either decrease or increase in market risk depending on other factors In addition similar to Hall
and Murphy (2002) the authorrsquos model supports the grant of restricted stocks rather than stock options
under efficient contracting framework
A common finding of the EUT-based models is that the stock options value to a risk-averse
undiversified employee is strictly lower than the value to a risk-neutral well diversified outside
investors This is nevertheless in stark contrast to several surveys and empirical findings documenting
that employees may value their options above their risk-neutral value (ie the so-called Black Scholes
value) Lackerrsquos and Lambertrsquos (2001) research based on a survey of KnowledgeWharton readers
revealed that managers value their options substantially above the Black Scholes value (BS
henceforth) Moreover the survey revealed that younger managers have the most upward bias in the
values they perceive from their options According to the authors these results suggest that managers
do not fully understand the valuation of stock options or possibly their incentive effects Another
argument supporting managers may tend to overestimate their options value is provided by Yermack
(1997) He argues that to the extent that company executives have superior information regarding
company prospects and can time their option grants accordingly they may actually value options
higher than would outside investors do Furthermore relying on behavioral theories recent researches
have found evidence on employees drawing on heuristics and subject to psychological bias while
valuing their options which may lead them to overestimate the value of their options For instance
Devers et al(2007) study examines the effects of endowment and loss aversion on managersrsquo
subjective stock-option valuation Their main findings show that managers endow value from granted
unexercisable options in a way that they value them in excess of their objective value (ie BS value)
In the same vein Sawers et al(2006) drew conclusions from an experiment involving MBA students
consistent with the view that loss-averse managers subjectively overvalue stock options relative to
2 Prior works by Detemple and Sundaresan (1999) and by Cai and Vijh (2004) have used trees approach tied to
specific numerical schemes to study utility-based valuation of executive stock options when the executive can
invest in the Market portfolio
4
restricted stocks and therefore will be less risk-seeking when awarded with stock options and more
risk-seeking when endowed with restricted stocks
Moreover standard normative models fail to predict stock options as part of the compensation
contract Several quantitative studies taking place in principal-agent framework showed that EUT-
based models predict optimal compensation contracts that do not contain convex instruments like
stock options (Holmstrom and Milgrom 1987 Dittmann and Maug 2007) Consistent with these
findings studies focused on the effect of stock option and restricted stock grants on managerial effort
incentives (Jenter 2001 Hall and Murphy 2002 Henderson 2005) conclude that stock options are
inefficient tools for creating incentives for risk-averse managers when they are granted by mean of an
offset of cash compensation
This paper analyzes the valuation of stock options and their incentives effect to an employee
exhibiting preferences as described by Cumulative Prospect Theory (Tversky and Kahneman 1992) It
aims to propose an alternative theoretical framework for the analysis of pay-to-performance sensitivity
of equity-based compensation that takes into account a number of prominent patterns of employee
behavior that standard EUT cannot explain Specifically the key assumption underlying this work
proceeds from Cumulative Prospect Theory (CPT hereafter) and states that the employee choices
under risk display four main features Firstly instead of assessing outcomes based on their
contribution to his final wealth the employee assesses outcomes utility over gains and losses
determined relative to a reference level or a benchmark The second feature is loss-aversion It
conveys the experimental evidence that people are more sensitive to losses than they are to gains In
other words losses loom larger than gains The third feature consists in the principle according to
which people choices display diminishing sensitivity to incremental gains and losses The last piece is
the nonlinear probability processing It involves the well established tendency of individuals to
overweight small probabilities of large gains3 I drew on this theoretical framework to derive a
continuous time model of the stock option subjective value using the certainty equivalence principle I
then performed sensitivity analyses with respect to preferences-related parameters and found that loss
aversion and probability weighting have countervailing effects In particular I showed that the more
the employee is loss averse the less would the option be worth to him In addition I proved that the
option subjective value is increasing in probability weighting degree My analyses also show that for
a given level of option moneyness the subjective value of the option may lie strictly above the BS
value when the effect of probability weighting tends to dominate that of loss-aversion These results
lead to the conclusion that the lottery-like nature of stock-options combining large gains with small
probabilities may make them attractive to employees subject to probability weighting which is
3 There exists a large literature comprising empirical and experimental applications of overweighting small
winning probabilities This literature include notably Thaler and Ziemba (1988) Kachelmeier and Shehata
(1992) Cook and Clotfelter (1993) Loughran and Ritter (1995) and Jullien and Salanie (2000)
5
consistent with the proposition that employee option value estimate may exceed the BS value
(Lambert and Larcker 2001 Hodge et al 2006 Sawers et al 2006 Hallock and Olson 2006
Devers et al 2007)
Furthermore this work elaborates on incentives from stock options and on some implications in
terms of design aspects Following previous researches I defined incentives as the first order
derivative of the subjective value with respect to the stock price A numerical analysis of the incentive
function shows that stock option incentives are increasing in employeersquos degree of probability
weighting and may even lie above incentives for a risk-neutral individual Moreover I considered the
incentive effects of setting the strike price of the option above or below the stock price at inception In
this analysis I relied on Hallrsquos and Murphyrsquos (2002) methodology in solving for the exercise price that
maximizes incentives holding constant the company cost of granting the options Similar to their
approach I explored two situations In the first situation I assumed that the firm is precluded from
changing any component of the employee compensation package In this case the model predicts that
when the effect of probability weighting prevails (ie dominates that of loss-aversion) incentives
could be infinitely increased by granting more and more options at higher and higher strikes which
suggests that employee would be much more interested in premium options instead of discount
options However when loss-aversion effect dominates the model predicts that incentives are
maximized within strike price ranges that may include the grant date stock price depending on the
level of loss-aversion In the second situation the company is assumed to be allowed to adjust existing
compensation when making new stock option grants For typical setting of preferences parameters
around the experimental estimates from CPT (Tversky and Kahneman 1992) the model predicts that
incentives are maximized for strike prices set around the stock price at inception which is consistent
with companiesrsquo actual compensation practices Additional analyses suggest also that loss-averse
employees who are not subject to probability weighting or even with very low degrees of probability
weighting receiving options at high exercise price would willingly accept a cut in compensation to
receive instead deep discount options or restricted shares for those of them displaying more loss-
aversion This result is broadly consistent with Hall and Murphy (2002) and Henderson (2005)
findings for non-diversified risk-averse employees
The last item discussed in this paper is the risk taking incentives implied by stock option grants
Similar to previous studies I defined incentives for risk taking as the first order derivative of the
subjective value with respect to stock price returns volatility The first essential result from this
analysis is that incentives for risk taking are increasing with probability weighting degree In fact
probability weighting leverages the positive effect of volatility on the subjective value through the
convexity of the option payoff Another important finding from the model is that an option-
compensated executive subject to probability weighting may be more prompted than a risk-neutral
executive to act in order to increase assets volatility Moreover consistent with findings from EUT-
6
based models the CPT model predicts that a loss-averse probability-weighting-free executive may not
prefer an increase in the variance of the company stock price return
This work is motivated by recent empirical and theoretical researches on employee compensation
incorporating CPT-based models These models have proved successful in explaining some observed
compensation practices and specifically the almost universal presence of stock options in the
executive compensation contracts that EUT-based models have difficulties accommodating their
existence Therefore they have advanced CPT framework as a promising candidate for the analysis of
equity-based compensation contracts This literature includes in particular Dittmann et al (2008) who
developed a stylized principal-agent model that explain the observed mix of restricted stocks and stock
options in the executive compensation packages It also includes Spalt (2008) who used the CPT
framework and especially the probability weighting feature to prove that stock options may be
attractive to a loss-averse employee subject to probability weighting He then explained the puzzling
phenomenon that riskier firms are prompted to grant more stock-options to non-executive employees
This article proceeds as follows The first section describes the features of stock option value from
the perspective of a representative employee with preferences as described by CPT Throughout this
paper we will refer to this employee as a ldquoCPT employeerdquo This section provides also numerical
analyses on the model sensitivity to preferences-related parameters The next section introduces
incentive effects of stock options for a CPT-employee and examines some design implications in
terms of strike price setting The risk taking incentives question is explored in the third and last
section Appendices provide proofs of the propositions in the first section
1 Stock option value from a CPT-employee perspective
In this section I develop a base-case model for analyzing the value of the stock-option contract
from the perspective of a representative employee with CPT-based preferences (subjective value
henceforth) Specifically I assume that the employee is granted a European call option on the
companyrsquos stock denoted by S with maturity date t T and strike price K These are the traditional
features of executive stock options as reported in Johnson and Tian (2000) and used by prior studies
focused on stock option incentives (Lambert et al 1991 Hall and Murphy 2002 Henderson 2005)
Often in practice stock options are Bermudan-style options Thus my model relies on a naiumlve setting
in that it ignores complications related to early exercise or forfeitures
11 Theoretical framework
111 Stock-option contract
7
The stock option contract is issued in 0t The contract payoff at expiry t T is
T T
h S K
I make the assumption that the employee is not allowed to short-sell the company stock and that
he can earn the risk-free rate r from investing in a riskless asset Moreover the price dynamic of the
stock is given by a geometric Brownian motion represented by the following SDE
t t t tdS r q S dt S dZ (1)
Where t
Z is a standard Brownian motion with respect to the probability measure IP 2
and q are
respectively the total variance of the stock price returns and the dividend yield
112 Risk preferences
Following Tversky and Kahneman (1992) I consider that to each gamble with a continuous
random outcome y IR which the probability density function is denoted by f y the employee
assigns the value
IR
E y v y d f y
(2)
Note that the expectation E
is a function of two distinct functions The first function v
called the value function is assumed of the form
y yv y
y y
where 0 1 and 1 (3)
This formulation has some important features that distinguish it from the standard utility
specification First the utility is defined over gains and losses assessed based on the reference point
denoted by This idea was proposed first by Markowitz (1952) As pointed out by Barberis and
Thaler (2003) it fits naturally the way people perceive attributes in everyday life relative to their
previous levels rather than in absolute fashion The second important feature is the shape of the value
function While it is convex over losses it is concave over gains which represents the observation
from psychology that people are risk averse over gains and become risk-seeking over losses
Moreover the value function has a kink at the origin introduced by the parameter 1 This feature
known as loss-aversion gives a higher sensitivity to losses compared to gains Finally outcomes are
8
treated separately from other components of wealth which reflects the well-documented phenomenon
of narrow framing4 (Thaler 1999)
The second function
a b is called the weighting function It applies to cumulative
probabilities represented by the cumulative probability function F in order to transform them into
decision weights according to
1
1
1
(1 )
(1 )
a
a a a
a bb
b b b
F yy
F y F y
F y
F yy
F y F y
where 028 1a and 028 1b 5 (4)
This function stands for another piece of CPT which is the nonlinear transformation of
probabilities Specifically it captures experimental evidence on people overweighting small
probabilities and being more sensitive to probability spreads at higher probability levels (eg a jump in
probability from 07 to 09 would be more striking to individual than an equal-sized jump from 01 to
03) The degree of probability weighting is controlled separately over gains and losses by the
weighting parameters a and b respectively The more these parameters approach the lower boundary at
028 the more the tails of probability distribution are overweighted For instance when 1a b
probability weighting assumption is relaxed For simplicity these parameters are assumed to be equal
(ie a b ) and the weighting function will be denoted a
in the rest of this paper Finally it is
worth mentioning that this function (i) infinitely-overweights infinitesimal probabilities since
0
lima
p
p
p
and (ii) infinitely-underweights near-one probabilities in that
1
1lim
1
a
p
p
p
12 Stock option subjective value
121 The model
4 Narrow framing refers to people tendency to treat individual gambles separately from other portions of wealth
It stands for an important feature of Mental Accounting the mental process by which individuals formulate
problems for themselves (eg the way they code outcomes) Mental accounting is captured in CPT via the
nonlinear shape of the value function 5 The lower boundary at 028 is a technical condition to insure that a b
p
p
is positive over ]01[ as required by
the following first order condition 1 1 1 0aa
a p a p p p
9
In order to estimate the subjective value of the stock option contract described above I use the
certainty equivalent approach similar to that adopted by Spalt (2008) In particular this value is
defined as the cash amounta
C
that leaves the employee indifferent between this amount and the
uncertain payoff of the contract T
h irrespective of the composition of the remainder of his private
wealth Formally a
C
is the solution of the following equation
=
a
rT
a IP T
T a T
IR
v C e E v h
v h d F S
(5)
The left-hand side of the equation above represents the benefit for the employee from receiving
the cash amount a
C
instead of the stock option contract at the inception of the latter This amount is
assumed to be placed into the risk-free asset over the whole lifetime T of the stock option contract
The other side of the equation gives the expected utility to the employee from receiving the risky
payoff implied by the value function v
Here the expectation a
IPE relies on the transformed
probability measurea
IP
Let a
E
represent the expectation in the right-hand side of (5) It follows from (5) and (3) that
1
1
0
1
rT
a a
a
rT
a
E e if E
C
E e otherw ise
(6)
Where a
E
should write
1 2 3
a a a aE I I I
(61)
With
1
1
x
a a
l
I g x K u du x dx
(62)
1
2
2
l x
a a
l
I K g x u du x dx
(63)
10
2
3
l
a aI x dx
(64)
2
2( )
r q T T x
g x Se
(65)
2
1
ln2
Sr q T
Kl
T
(66)
2
2
ln2
Sr q T
Kl
T
(67)
Here is the Gaussian density function and a
a
pp
p
is the first-order partial derivative
of a
which is defined over 01 as follows
1
1
111
1
111
1
1 11
(1 )1
1
(1 )
1
aaa l
a a
aa a
aaa
la
a a
aa a
p p ppa p x dx
p pp p
p
p p pp
a p x dxp p
p p
(68)
122 Reference point set up
Although CPT specifies the shape of the value function around the reference point it does not
provide guidance on how people set their reference points Neither does most of the psychological
literature relying on the assumption according to which the reference point is the Status quo Instead
this literature admits both the existence and the importance of non-status quo reference points since
ldquothere are situations in which gains and losses are coded relative to an expectation or aspiration level
that differs from the status quordquo (Kahneman and Tversky 1979)
Research on the Disposition Effect6 has paid greater attention to non-status quo reference points
(Shefrin and Statman 1985 Heisler 1998 Odean 1998a Gneezy 1998) These studies have found
6 Disposition effect is a term coined by Shefrin and Statman (1985) to refer to the tendency of individual
investors to hold loser stocks and sell winner stocks defined relative to a purchase price reference point
11
strong evidence that reference points are set in a dynamic fashion In particular Gneezy (1998)
documented that maxima are more effective predictors than are purchase prices
More specifically in studding exercise behavior of stock options holders Huddart and Lang
(1996) Heath et al (1999) and Bahaji (2009) have shown empirically that exercise activity is linked to
share price historical maxima These findings are consistent with employee exercise decisions take
into account the level of share price with respect to non-status quo reference points
In principle employee would update the reference point in a way that fits with his own
expectations regarding the underlying share price at expiry Intuitively the employee could estimate
the intrinsic value of the option based on his future share price forecasts as he can rely on the Black
Scholes value of the option disclosed by the firm Following Spalt (2008) I consider that the reference
point parameter in the model is the BS value7 Beyond the argument of empirical evidence on
employee exercise behavior depending on non-status quo reference points this assumption is
supported by firms common practices in terms of stock option compensation Most of stock-option
designers use the BS model in order to estimate the value of stock options as constituents of the total
compensation package This value is usually announced to the employee at the inception of the
options Moreover the BS model is recommended in the FASB and the IASC guidelines for
determining the fair value of stock options (ie the amount an outside investor with no hedge
restrictions would pay for the option) that needs to be disclosed in the financial statements These
statements comprising the BS value of the stock options are provided to shareholders as well as
stakeholders including employees
123 The impacts of preferences-related parameters a numerical analysis
To provide a concrete outline on the profile of the subjective value yielded by the model relative
to the risk neutral value profile I performed a numerical analysis8 of the value of a 4-year call option
( 4T ) with a strike price 100K For the remaining option-related parameters the figures were
computed assuming no dividend payments ( 0q ) 30 and 3r Moreover I set the
curvature parameter of the value function ( ) and the loss aversion coefficient ( ) to respectively
088 and 225 based on experimental estimates from CPT (Tversky and Kahneman 1992)
7 To be more precise the value used here is the expectation of the option payoff at expiring yielded by the BS
model (ie the nondiscounted BS value) Consistent with this specification the probability measure IP used to
derive the subjective value in (6) is the risk neutral probability measure Moreover ignoring the probability
weighting feature (ie 1a ) this setting allows the subjective value implied by the model to converge towards
the risk neutral value (ie BS value) when the preferences of the employee tend to risk neutrality
(ie 1 ) 8 The integrals in (62) (63) and (64) were computed numerically
12
Figure-1 Option value against the stock price This figure is
a plot of the subjective value computed under different
probability weighting parameters (the blue curves) It
illustrates the profile of the subjective value compared to that
of the risk neutral value (red curve) The Parameters used
are T=4 K=100 σ=30 r=3 q=0 =225 α=088
Figure-2 Sensitivity to probability weighting This figure is
a plot of the partial derivative of the subjective value with
respect to ldquoardquo against both ldquoardquo and the stock price volatility
ldquoσrdquo It exhibits the local effect of probability weighting given
the payoff distribution skewness captured by ldquoσrdquo The
derivative was computed numerically based on the following
parameters T=4 K=S=100 r=3 q=0 =225 α=088
Furthermore in order to calibrate the probability weighting function I used three different values of
the parameter a within the range of values estimated in the experimental literature9
Figure 1 depicts the option value as a function of the stock price The three blue curves represent
the value profiles from the perspective of three CPT employees with the same value function and
different degrees of probability weighting At first sight depending on the degree of probability
weighting and the option moneyness (S
K) the subjective value could lie either under or below the BS
value In contrast standard EUT-based models predict that the option value from a risk-averse
employee perspective is systematically lower than the risk-neutral value (Hall and Murphy 2002
Henderson 2005) These preliminary results are consistent thought with some empirical findings
suggesting that frequently employees are inclined to overestimate the value of their stock-options
compared with the BS value (Lambert and Larcker 2001 Hodge et al 2006 Sawers et al 2006
Hallock and Olson 2006 Devers et al 2007)
9 Tversky and Kahneman (1992) got 065 on average (a=061 for gains and b=069 for losses) These results are
corroborated by Abdellaouirsquos (2000) findings (a=060 for gains and b=070 for losses hence an average of 065)
In addition Camerer and Ho (1994) obtained a=056 for gains whereas Gonzales and Wu (1996) and Bleichrodt
and Pinto (2000) found a=071 and a=067 respectively
13
The results presented in figure 1 show that the option subjective value is increasing in probability
weighting degree (ie decreasing in parameter a ) Actually given the asymmetric profile of the option
payoff the expectation a
E
in the subjective value formula (6) is positively affected by the emphasis
put on the tail of the payoff distribution which is governed by the parameter a the lower a the more
overweighed will be small probabilities and the more underweighted will be medium to large
probabilities This lottery-like nature of an option combining large gains with small probabilities may
make it attractive to a CPT employee subject to probability weighting This preliminary outcome leads
to proposition 1 which stats that
Proposition 1 the value of the stock option contract to a CPT- employee is increasing with
respect to his degree of probability weighting (ie is decreasing with respect to a)
(Proofs are provided in appendix A)
Moreover the effect of probability weighting is expected to increase with the skewness of the
distribution of the underlying stock price which is captured by the volatility parameter given the
Log-normality assumed in the model In order to show that I performed a numerical analysis of the
sensitivity of the subjective value to the probability weighting degree as a function of the volatility
and the parameter a This sensitivity is defined as the partial derivative of subjective value with
respect to a (a
C
a
) The results are reported in figure 2 in the form of a graph It shows that the
sensitivity to parameter a is negative and locally decreasing in volatility That means that the more the
share price is volatile the more the option will be attractive for a CPT employee subject to probability
weighting This supports Spaltrsquos (2008) findings that the effect of probability weighting provides an
economic rationale to riskier firms (ie more volatile firms) for granting more stock options to non-
executive employees
Furthermore I investigate the effect of loss aversion on the subjective value The variable of
interest here is In an analogical sense with the EUT framework the option value from the
perspective of a loss-averse employee is expected to decrease with his degree of loss-aversion To
verify this I computed numerically the first order derivative with respect to (
aC
) crossed over
various levels of and moneyness ranging from 005 to 1 and from 5 to 200 respectively The
outcome is reported in figure 3 It shows that the sensitivity to loss aversion is negative and locally
decreasing in moneyness That means that the more the employee is loss averse the less would the
option be worth to him This conclusion is taken up in proposition 2 hereafter
14
Figure-3 Sensitivity to loss aversion This figure is a plot of the
partial derivative of the subjective value with respect to ldquoλrdquo
against both ldquoλrdquo and the stock price ldquoSrdquo It exhibits the local effect
of loss aversion given the option moneyness The derivative was
computed numerically based on the following parameters T=4
σ=30 K=100 r=3 q=0 a=065 α=088
Figure-4 Sensitivity to the curvature parameter This figure is a
plot of the partial derivative of the subjective value with respect to
ldquoαrdquo against both ldquoαrdquo and the stock price ldquoSrdquo It exhibits the local
effect of the curvature parameter given the option moneyness The
derivative was computed numerically based on the following
parameters T=4 σ=30 K=100 r=3 q=0 a=065 λ =225
Proposition 2 the value of the stock option contract to a CPT- employee is decreasing with
respect to his degree of loss-aversion (ie a decreasing function of λ)
(Proofs are provided in appendix B)
I performed a similar analysis in order to get a view on the effect of the curvature parameter In
the same way I assessed locally the first order derivative with respect to within a range of values
from 005 to 1 and using share prices ranging from 10 to 200 Figure 4 shows that this derivative is
locally increasing with the option moneyness for values of above say 075 It also shows broadly
that the subjective value is an increasing monotone function of over a range of values around the
experimental estimate of 088 (from 07 to 1) irrespective of the option moneyness
2 Incentives from stock-options
Stock-options are incentive tools used within a principal-agent relationship to align the interests of
the agent (employee) on those of the principal (shareholders) The shareholders grant stock options in
15
order to provide the employee with incentives to make efforts that enhance the value of the firm and
thus their own wealth Indeed assuming that employees are aware of how their actions affect the share
price option holdings will prompt them to make efforts that increase share price Therefore the
incentive from a single option grant will depend on the degree of the sensitivity of the subjective value
to the stock price
21 The incentive measure
Following Jensen and Murphy (1990) Hall and Murphy (2000 2002) and others I defined the
incentive effect as the first order derivative of the subjective value with respect to share price (
aC
S
)
which defines how the value from the employee perspective changes with an incremental change in
the stock price As we can see in figure 5 which is a plot of
aC
S
for three values of a incentives
are greatest for in-the-money10
options Also the incentive effect is increasing with the degree of
probability weighting Another observation that can be made from figure 5 is that for sufficiently high
level of probability weighting the option can give much more incentive to increase stock price than is
reflected by the BS delta This is consistent with my previous finding that the subjective value can
overstate the BS value Note that consistently with the EUT-based models when the employee
process probabilities in a linear way ( 1a ) - which means that the probability weighting assumption
is relaxed and only loss-aversion matters - the incentives lie strictly under the BS delta whatever the
level of the option moneyness That is to say that the options are less attractive for both risk-averse
employee and loss-averse employee who are not subject to probability weighting The analysis in
figure 6 supports this It shows that with a hold constant at 065 incentives are decreasing in loss-
aversion Conversely with loss-aversion parameter set to 1 which means that the loss-aversion
effect is neutralized incentives for a representative loss-neutral employee with a degree of probability
weighting equal to experimental estimate of 065 overstate the BS delta
10
The terminology ldquoat-the-moneyrdquo is referring to stock-options with an exercise price equal to the stock price at
inception The expressions ldquoOut-of- the-moneyrdquo and ldquoIn-the-moneyrdquo are also used throughout the paper to refer
to options with strike price respectively below and above the grant date stock price
16
Figure-5 The effect of probability weighting on stock-option
incentives This figure is plots of the partial derivative of the
subjective value with respect to stock price ldquoSrdquo against the option
moneyness It exhibits the combined effects of probability
weighting and option moneyness on incentives The derivatives
were computed numerically assuming three different levels of
probability weighting (see the legend above) and holding the
remaining parameters constant at the following values T=4
σ=30 K=100 r=3 q=0 λ=225 α=088
Figure-6 The effect of loss-aversion on stock-option incentives
This figure is plots of the partial derivative of the subjective value
with respect to stock price ldquoSrdquo against the option moneyness It
exhibits the combined effects of loss-aversion and option
moneyness on incentives The derivatives were computed
numerically assuming three different levels of loss-aversion (see
the legend above) and holding the remaining parameters constant
at the following values T=4 σ=30 K=100 r=3 q=0
a=065 α=088
22 Implications for stock option design optimal strike price
Setting the strike price of standard stock options boils down to defining the threshold against which
the performance is assessed and consequently to determining the likelihood of a final payout As we
have just noticed from figure 5 and figure 6 incentives increases in the option moneyness and
equivalently decreases with strike price In parallel from the shareholders perspective granting in-
the-money options is much more costly than granting out-of-the money or at-the-money options
(recall figure 1) This leads the firm to a trade-off to make when setting the exercise price of the
options in the sense that holding his cost unchanged she could either grant fewer options at a low
strike price or increase the grant size at higher exercise price
I relied on the methodology from Hall and Murphy (2002) in figuring out the optimal exercise price
satisfying the double purpose of maximizing incentives and holding constant the firmrsquos cost of
granting options I also considered two situations In the first situation the firm does not adjust the
existing compensation package when grating additional stock options Thus these additional options
are considered as a pure add-on to existing compensation In the second situation however the
employee and the firm are allowed to bargain efficiently over the terms of the compensation Thus the
17
firm is assumed to fund additional options by an adjustment to other compensation components that
leaves the employee indifferent between his initial package and the new package including the
additional grant
221 Situation 1 Option grant without a compensation offset
When the firm is not allowed to adjust the existing compensation package the optimal strike price
that maximizes incentives for a given amount of firm cost is the solution to the following constrained
optimization problem
m ax
a
K
nC K
S
such that n K c (7)
Where a
nC K
S
denotes the incentives from receiving n options with a strike price K and
K the per-unit cost or the BS value of one option
The optimization problem in (7) is solved numerically by varying the parameter K First the BS
value is computed for a given K which enable to determine the grant size n that leaves the firm cost
constant at c in accordance with the constraint in (7) Then the cost function a
nC K
S
is assessed
based on n and K This procedure is reiterated recursively until the optimal value of K is found
I set the total cost for the firm at euro28 333c (hence a grant of 1000n at-the-money options
based on the retained option-related parameters) As reported in figure 7 I varied the preferences-
related parameters a and within specific ranges in order to figure out the conditions under which an
optimal strike may exist and the robustness of the model predictions The chart on the left-hand side
exhibits the total incentives from the grant as a function of the strike price and the probability
weighting parameter with the loss-aversion held constant at 225 It shows that the convexity and
the monotony of the total incentives function ( a
nC K
S
) shift with the degree of probability
weighting while it is concave and non-monotone over the range of strike prices for low levels of
probability weighting ( 0906a ) it becomes convex and monotonically increasing for higher levels
Moreover for higher level of volatility probability weighting is expected to affect more deeply the
shape of total incentives function (recall figure 2)
Specifically when the effect of probability weighting prevails (ie dominates that of loss-aversion)
the model predicts that incentives could be infinitely increased by granting more and more options at
higher and higher strikes This result suggests that if the employee is subject to a degree of probability
18
weighting that could potentially lead him to overstate the value of the option in excess of the BS value
he would ask for the maximum number of options (as much options as the company could possibly
grant him) at their (highest) breakeven strike the higher the strike price the more small probabilities
of large gains there are and the more valuable become options to him Furthermore this means that
such an employee would be much more interested in premium options instead of discount options
Actually although this result is in stark contrast with the common stock-based compensation practices
that consist in granting broadly at-the-money options it shouldnrsquot be rejected without taking into
account the other factors restricting the number of options the company could issue irrespective of
their strike prices such like capital dilution limits
In addition as we can notice from the plot in the middle of figure 7 the effect of probability
weighting on total incentives could be offset by an increasing loss-aversion This time is varied and
a held constant at 065 which meets the experimental estimate When the loss-aversion effect
dominates the total incentives function tends to non-monotone concave shapes which means that it
admits finite extremas In particular when probability weighting effect is neutralized by setting 1a -
in other words the employee is not subject to probability weighting - total incentives curve tends to
flatten around the optimum (see the green curves on the right-hand side plot) This suggests that there
exists a range of strike prices that yield quasi-similar incentives For instance with loss-aversion set
at 225 optimal strike (as of stock price at inception) is about 142 and lies within a range of
values from 121 to 153 that yield total incentives of about euro530 (rounded figure) With 6
the optimal strike drops by almost 30 (to 112) and total incentives are flat around the maximum
value of euro450 within the range from 91 to 111 Note that these results are consistent with Hallrsquos
and Murphyrsquos (2000 2002) findings relying on the EUT framework Consistently their work
documented that incentive-maximizing strike price exists when the options are considered as an add-
on to existing compensation In addition they showed that total incentives are relatively flat around
the maximum and that optimal strike price decreases for more risk-averse and less diversified
employees
19
Figure-7 Incentives from options grant with total cost of euro28 333 assuming no adjustment to existing compensation package This figure is plots of
incentives (in Keuro) from options grant for a given strike price holding the total BS value of the grant constant at euro28 333 Total incentives are defined as the
partial derivative of the total subjective value of the grant with respect to stock price ldquoSrdquo The sub-figure on the left-hand side depicts total incentives as a
function of the strike price and probability weighting parameter That in the middle is a plot of total incentives against strike price and loss-aversion The
sub-figure on the right-hand side exhibits the combined effect of probability weighting and loss-aversion on the shape of total incentives as a function of
strike price The derivatives were computed numerically based on the following parameters T=4 σ=30 S=100 r=3 q=0 α=088
222 Situation 2 Option grant with an adjustment to existing compensation
Now letrsquos considerer that the company is allowed to make an efficient adjustment to existing
compensation components (cash for example) in order to grant additional options to the employee
The impact of this adjustment should be neutral with regard to the total compensation cost for the
company Moreover assuming this adjustment involves cash compensation it must be attractive to the
employee so that hersquod be willing to give up some cash compensation against extra options grant
Therefore it must leave the employee at his initial total subjective value of the compensation package
It follows that the strike price that maximizes total incentives for a given company cost is the solution
of this following optimization problem
m ax
a
K
nC K
S
subject to a
n K nC K c
and 0n (8)
20
Where c is a fixed constant The constraint in (8) is the aggregation of the company cost constraint
and the employee value constraint used in Henderson (2005)
Similar to that in (7) this optimization problem was solved numerically In this analysis c was
chosen such that for retained parameters the number of granted at-the-money options n is around
1000 hence total cost of euro28 333 Once c is set n is determined from the constraint in (8) for a given
strike price K S then total incentives
anC K
S
are assessed These are depicted in figure 8
The left-hand side sub-figure exhibits total incentives for different levels of K and probability
weighting parameter a with risk aversion held constant at 225 For each combination of K and
a the constraint in (8) is solved for n which allows to determine total incentives The plots indicate
that when the employee is deeply subject to probability weighting ( 0475a )
anC K
S
is
strictly decreasing throughout the depicted range of strike prices (see the curves in blue) In this case
similar to EUT-based studiesrsquo findings (Hall and Murphy 2002 Henderson 2005) incentives are
maximized through restricted stocks grant rather than stock options The intuitive reason behind that
is given that the employee systematically values the options in excess of their BS value efficient
trade-off over compensation allocation is made via the grant of equity-based instruments that
employee values at their actual cost restricted stocks for instance
However for lower degrees of probability weighting (typically 0475 085 a ) the optimal
strike price is not nil and tends to increase with a Specifically the optimization problem is defined
on the right (see the red solid curve) or on the left (see the red dashed curve) of the optimal
strike
K and
anC K
S
admits an infinite branch in
K (ie total incentives are infinite at that
point) The technical reason behind that is that the subjective value is equal to the BS value at the
optimal strike which yields according to the constraint in (8) an infinite grant size
(
lim
K K
n K ) For instance
K ranges from 60 to 195 when a takes values within a range
of value around the experimental estimates ( 055 070a )11
This suggests that depending on the
extent to which employee weights probabilities either grants of discount options or premium options
may result in a Pareto optimum to the contract As a specific example for an employee with
0616a the optimal strike price
K is around 100 which means that for the prevailing setting
the model predicts at-the-money options as optimal in an efficient contracting framework since the
companyrsquos cost of granting these options is equal to their value to the employee In this case granting
11
Optimal strikes are expected to be lower for higher stock price volatility since probability weighting effect
tends to increase with volatility (recall figure 2)
21
options with strike price around the stock price at inception which is consistent with observed
practices results in a perfect reconciliation of the company and the employee respective views Note
that for a similar setting in the previous situation where the options are given as an add-on to existing
compensation the model indicates that incentives from stock options could be infinitely increased by
granting increasingly more options at greater and greater strike price
Furthermore for weak degrees of probability weighting ( 085 a ) the subjective value of the
option lies strictly below the BS value because the effect of loss-aversion tends to dominate that of
probability weighting Thus the total incentives function takes a non-monotone concave shape and
shows finite extremas ranging from 35 to 81 In particular when probability weighting assumption
is relaxed ( 1a ) the function flattens around the maximum and approaches a monotone decreasing
shape with increasing loss-aversion (see sub-figure on the right-hand side) This result suggests that
loss-averse employees who are not subject to probability weighting - even with very low degree of
probability weighting - receiving options at high exercise price would willingly accept a cut in cash
compensation to receive instead deep discount options or restricted shares for those of them displaying
more loss-aversion Again this is broadly consistent with Hallrsquos and Murphyrsquos (2002) and
Hendersonrsquos (2005) findings for non-diversified risk-averse employees
Last but not least the sub-figure in the middle of the main figure is plots of total incentives against
the strike price each of them corresponds to a given level of loss-aversion The purpose of this
analysis consists in showing the effect of loss-aversion on
K by holding a constant at 065 and
varying It mainly shows that loss-aversion has an effect opposite to that of probability weighting
when probability weighting effect is dominant12
(ie the employee may potentially put overstated
value in the option specifically for high strikes) optimal strike increases and total incentives decreased
with loss-aversion Conversely when loss-aversion effect is dominant as stated before the model
yields predictions comparable to that of the EUT-based models
12
See the limit case of 1 where risk-aversion is ignored (the blue dashed curve)
22
Figure-8 Incentives from options grant with total cost of euro28 333 assuming cash compensation is adjusted This figure is plots of incentives (in Keuro) from options grant
for a given strike price holding the total compensation value constant from both company and employee perspectives Total incentives are defined as the partial
derivative of the total subjective value of the grant with respect to stock price ldquoSrdquo The sub-figure on the left-hand side depicts total incentives as a function of the strike
price for varying levels of probability weighting parameter That in the middle is a plot of total incentives against strike price for varying levels of loss-aversion The
sub-figure on the right-hand side exhibits the sole effect of loss-aversion (with no probability weighting) on the shape of total incentives as a function of strike price The
derivatives were computed numerically based on the following parameters T=4 σ=30 S=100 r=3 q=0 α=088
3 Do stock-options provide incentive for risk taking
Earlier studies (Agrawal and Mandelker 1987 DeFusco et al 1990 Hirshleifer and Suh 1992)
have built on insights from standard option pricing theory to predict that option-compensated
managers will be motivated to increase the asset variance and leverage of their firms because the
convexity of the option payoff increase its value as the volatility of the stock price increases Lambert
et al (1991) was the first to call into question this assertion They proved that a non-diversified risk-
averse executive may not necessarily take actions that increase stock price volatility because that
parameter of the distribution of the stock price has two conflicting effects on the subjective value of
the option a positive effect implied by the payoff convexity and a negative effect due to the concavity
of the executiversquos utility function Henderson (2005) draws conclusions from a EUT-base model
consistent with these findings Specifically she finds that stock-options provide incentives for a risk-
averse manager to increase the beta of the company (ie the market risk-to-firm specific risk ratio)
rather than total risk Although there is some empirical evidence supporting the prediction that stock-
options do not systematically encourage risk taking it is still very scarce13
13
See for instance Cohen et al(2000) and Rajgopal and Shevelin (2002)
23
Figure-9 The effect of loss-aversion and probability weighting on risk-taking incentives implied by stock-options This figure is plots
of the partial derivative of the subjective value with respect to stock price volatility ldquoσrdquo against the option moneyness It exhibits on
the one hand the combined effects of loss-aversion and option moneyness (chart on the right-hand side) and on the other hand the
combined effects of probability weighting and option moneyness (chart on the left-hand side) on risk-taking incentives The derivatives
were computed numerically assuming three different levels of loss-aversion and probability weighting (see the legends above) and
holding the remaining parameters constant at the following values T=4 σ=30 K=100 r=3 q=0 α=088
I revisited the risk taking incentives issue from the perspective of an executive with CPT
preferences Similar to previous studies I defined incentives for risk taking as the first order derivative
of the subjective value in (6) with respect to volatility (a
C
)
14 In order to figure out the link
between risk-taking incentives from stock-options and the parameters related to preferences I
performed a numerical analysis on the sensitivity of a
C
to loss-aversion and probability weighting
The results are reported in figure 8 hereafter
The left-hand side subfigure is plots of a
C
as a function of the stock price for several degrees
of probability weighting with loss-aversion held constant at 225 The purpose of the underlying
analysis is to figure out broadly the extent to which a loss-averse executive subject to probability
weighting would prefer a high or low risk given the way the latter influences the option value from his
own perspective The first essential result from this analysis is that incentives for risk taking are
14
Actually the sensitivity of the subjective value to a parameter of the probability distribution of the stock price
provides a measure of the executive incentive to make decisions that influence that parameter
24
increasing with probability weighting degree In fact the probability weighting leverages the positive
effect of volatility on the subjective value through the convexity of the option payoff Another
observation that could be made is that for sufficiently high degree of probability weighting
( 070a )a
C
lies strictly above the conventional BS Vega over the retained range of stock prices
(see the red and the green curves) This means that an option-compensated CPT-executive subject to
probability weighting may be more prompted than a risk-neutral executive to act in order to increase
assets volatility Note that for typical setting of a at 065 the model predicts that a CPT-executive
with a such preferences calibration will have incentives to act in order to increase the volatility of the
stock price by 1 if he targets a 87 cts - increase of the value of his at-the-money 4-year option
In addition when probability weighting is ignored by setting 1a only the effect of loss-aversion
on risk taking incentives is captured The analysis of this effect is reported in the subfigure on the
right-hand side More explicitly this subfigure exhibits plots of a
C
for several levels of with
probability weighting effect neutralized It shows mainly that risk-taking incentives from stock-options
are decreasing with loss-aversion Moreover it appears that a
C
turns negative over a given range
of stock prices where the option is in-the-money Therefore consistent with findings from EUT-based
models the CPT model predicts that a loss-averse executive who is not subject to probability
weighting may not prefer an increase in the variance of the company stock price return As a specific
example an executive with a loss-aversion parameter 6 who processes probabilities in a linear
way (see the yellow curve) and holds 4-year stock options will have incentives to decrease rather than
increase the volatility of the company stock price if the stock price is above 130 the strike price of
his options
In essence incentives for risk taking from stock options - defined as the sensitivity of the
subjective value to the stock price volatility - is subject to two opposite effects under the CPT-based
model a positive effect from the convexity of the optionrsquos payoff leveraged by the probability
weighting feature and a negative effect from the loss-aversion coefficient Therefore there is a mixed
effect on risk taking incentives depending on which of the two effects dominates This will depend
obviously on the option moneyness and the other option-specific parameters
Conclusion
This paper proposes an alternative theoretical model of stock option subjective value to analyze
their incentive effects for employees The model predictions ascertain the ability of CPT to explain
some prominent incentive patterns that EUT models have difficulties to capture It mainly provides
25
arguments on the well documented tendency of employees to frequently value - under some
circumstances - their options in excess of their cost to the company Specifically these results
highlight the economic rational for firms in particular those with higher risk to widely use stock
options in non-executive employee compensation (Spalt 2008)
Loss aversion and probability weighting are the key features driving the subjective value in the
CPT model These parameters have countervailing effects on the modeled subjective value Depending
on which of them is dominant in the preferences calibration the model yields different predictions
regarding incentives Specifically consistent with some behavioral patterns observed in many surveys
and experimental studies on equity-based compensation the model predicts that when the probability
weighting feature prevails the subjective value may overstate the risk-neutral value of the option In
this case assuming the company and the employee bargain efficiently over the compensation
components incentives are maximized for strike prices set around the stock price at inception for a
representative employee with preferences calibration meeting the experimental estimates from CPT
(Tversky and Kahneman 1992) Obviously this finding is consistent with companiesrsquo actual
compensation practices Moreover executives with such preferences profile may be prompted to act in
order to increase share price volatility However when the emphasis is put on the loss-aversion
feature by relaxing the probability weighting assumption the model yields results comparable to
those of EUT-based models In particular the model predicts that loss-averse employees who are not
subject to probability weighting or even with very low degrees of probability weighting receiving
options at high exercise price would willingly accept a cut in compensation to receive instead deep
discount options or restricted shares for those of them displaying more loss-aversion Furthermore the
model shows that loss-averse executives who are processing probabilities in a linear fashion may not
prefer an increase in the variance of the company stock price return
Despite their practical interest the conclusions from the results of this research should not be
drawn without underlining some of its limitations The first one concerns the specification of the CPT
model Actually although the reference point specification in the model is consistent with both
empirical evidence on people setting reference points in a dynamic fashion and firmsrsquo widespread use
of the BS value as a standard for Financial and Human Resources disclosers empirical and
experimental literature is still silent on how people set reference points when assessing complex
gambles like stock option payoffs In addition to keep the model tractable only European-style
options were studied in this paper The model is still however easily extendable to Bermudian-style
options using numerical schemes such like lattice approaches The other limitation of this study is
related to the large heterogeneity in probability weighting that may exist across individuals (Wu and
Gonzalez 1996) The Tverskyrsquos and Kahnemanrsquos (1992) weighting function used in the model
provides only a fit to the median profile
26
Finally this work highlights - as did some previous eminent researches in this field (Dittmann et
al 2008 Splat 2008) - a number of future promising research directions in equity-based
compensation incorporating CPT framework For instant exploring the ability of CTP to explain the
growing use of performance shares plans instead of stock options in employee compensation would be
of great interest for future research Furthermore given that several empirical studies has documented
that employee stock option exercise behavior is also driven by behavioral factors a promising research
direction incorporating CPT is studying its ability to predict exercise patterns
Appendix A proofs of proposition 1
This appendix provides heuristic proofs of proposition 1
To prove that the subjective value a
C
is decreasing in 028 1a it is sufficient to show that
the expectation a
E
is a decreasing function of a Letrsquos first rewrite the expectation in (6) as follows
=
a aIP T IP T
x
a
IR
E v h E v h g x
w x u du x dx
Where
1
2 1
2
g x K x l
w x K g x l x l
x l
with 0 1 and 1 (A1)
Since w x
is derivable over 1IR l an expansion in Taylor series at the first order gives
w x w y x y w y
with 1y IR l
Introducing the expectation operator with respect to the transformed probability measure we have
a aIP IP
x
IP a
E w x w y E x y w y
w y E x u du y w y
(A2)
27
Since w x
is monotone increasing in x we have 0w y Then it follows from (A2) that
proving that a
E
is locally decreasing with respect to a in 1y IR l boils down to showing that
0
x
IP aE x u du
a
(A3)
Noting that
x
au du is positive and convex with respect to 1 1
x l l we
have according to Jensen inequality
IPE xx
IP a IP aE x u du E x u du
Since x follows a standard normal distribution which is symmetric in 0IP
E x we get from
the inequality above by substituting IPE x in the right hand side
0
x
IP aE x u du (A4)
Note that the result in (A4) above showing that the expectation under the transformed
probabilities overstates that under the original probabilities is a consequence of the probability
weighting function feature stated in sect112 which consists in infinitely-overweighting infinitesimal
probabilities and infinitely-underweighting near-one probabilities
Furthermore noting that the convexity of
x
au du with respect to 1 1
x l l
is decreasing in a and using the result in (A4) we have for 028 1 a b
IP IPE x E xx x
IP a IP a IP b IP bE x u du E x u du E x u du E x u du
Or equivalently
x x
IP a IP bE x u du E x u du (A5)
28
This proves that the condition in (A3) holds which means that a
C
is a decreasing function of
028 1a QED
Appendix B proofs of proposition 2
Taking the derivative of the subjective value function in (6) with respect to λ yields
1
1
1
1
1 0
1
a rT
a a
a
a a a rT
EE e if E
C
E E Ee otherw ise
(B1)
Where
1 2 3
a a a aE I I I
(B2)
Using the formulas in equations from (62) to (64) we can rewrite the derivatives in (B2) as follows
1
0
aI
1
2
2
l x
a
a
l
IK g x u du x dx
23
l
a
a
Ix dx
Then substituting these results in place of the derivatives in (B2) we obtain
1 2
2
l lx
a
a a
l
EK g x u du x dx x dx
(B3)
Given that
0
aE
we conclude that
aC
is nonpositive This implies that
aC
is a decreasing
function of QED
29
References
Abdellaoui M (2000) ldquoParameter-Free Elicitation of Utility and Probability Weighting Functionsrdquo
Management Science Vol 46 No 11 pp 1497-1512
Agrawal A Mandelker G (1987) ldquoManagerial incentives and corporate investment and financing
decisionsrdquo Journal of Finance Vol 42 No 4 pp 823-837
Bahaji H (2009) ldquoLe comportement drsquoexercice des porteurs de stock-options une eacutetude empirique
sur le marcheacute Ameacutericainrdquo Working Paper DRM Finance- Universiteacute de Paris Dauphine Paris June
2009
Barberis N and Thaler R(2003) ldquoA survey of behavioral financerdquo in Constantinides G Harris M
and Stulz R (Ed) Handbook of the Economics of Finance North-Holland Amsterdam
Bleichrodt H and Pinto JL (2000) ldquoA Parameter-Free Elicitation of the Probability Weighting
Function in Medical Decision Analysisrdquo Management Science Vol 46 No 11 pp 1485-1496
Cai J and Vijh AM (2004) ldquoExecutive stock and option valuation in a two state variable
framework allowing optimal investment of outside wealth in the risk-free asset and the market
portfoliordquo Working Paper University of Iowa
Camerer C and Ho TH (1994) ldquoViolations of Betweenness Axiom and Nonlinearity in
Probabilityrdquo Journal of Risk and Uncertainty Vol8 No 2 pp 167-196
Cohen RB Hall BJ and Viceira LM (2000) ldquoDo executive stock options encourage risk taking
rdquo Working Paper Harvard Business School
Cook P and Clotfelter C (1993) ldquoThe peculiar scale economies of lottordquo American Economic
Review Vol 83 No3 pp 634-643
DeFusco R Johnson R and Zorn T (1990) ldquoThe effect of executive stock option plans on
stockholders and bondholdersrdquo Journal of Finance Vol45 No 2 pp 617-627
Detemple J and Sundaresan S (1999) ldquoNontraded asset valuation with portfolio constraints a
binomial approachrdquo Review of Financial Studies Vol 12 No 4 pp 835ndash872
Devers C Wiseman R and Holmes M (2007) ldquoThe effects of endowment and loss aversion in
managerial stock option valuationrdquo Academy of Management Journal Vol 50 No 1 pp 191-208
Dittmann I and Maug E (2007) ldquoLower salaries and no options On the optimal structure of
Executive payrdquo The Journal of Finance Vol 62 No 1 pp 303-343
Gneezy U (1998) ldquoUpdating the Reference Level Experimental Evidencerdquo Working paper
University of Haifa
Hall B and Murphy K (2000) ldquoOptimal Exercise prices for executive stock optionsrdquo American
Economic Review Vol 90 No 2 pp 209-214
30
Hall B and Murphy K (2002) ldquoStock options for undiversified executivesrdquo Journal of Accounting
and Economics Vol 33 No 2 pp 3-42
Hallock K and Olson G (2006) ldquoThe value of stock options to non-executive employeesrdquo Working
Paper No 11950 National Bureau of Economic Research Cambridge
Heath C Huddart S and Lang M (1999) ldquoPsychological factors and stock option exerciserdquo
Quarterly Journal of Economics Vol 114 No 2 pp 601-628
Heisler J(1994) ldquoLoss aversion in a futures market an empirical testrdquo Review of Futures Markets
Vol 13 No 3 pp 793ndash822
Henderson V (2005) The impact of the market portfolio on the valuation incentives and optimality
of executive stock options Quantitative Finance Vol 5 No 1 pp 35-47
Hirshleifer D and Suh R (1992) ldquoRisk Managerial Effort and Project Choicerdquo Journal of
Financial Intermediation Vol 2 No 3 pp 308-345
Hodge F Rajgopal S and Shevlin T (2006) ldquoHow do managers value stock options and restricted
stock rdquo Working Paper University of Washington
Holmstrom BR and Milgrom PR (1987) ldquoAggregation and linearity in provision of intertemporal
incentivesrdquo Econometrica Vol 55 No 2 pp 303-328
Huddart S and Lang M (1996) ldquoEmployee stock option exercises an empirical analysisrdquo Journal
of Accounting and Economics Vol 21 No 1 pp 5-43
Jensen M and Murphy KJ (1990) ldquoPerformance pay and top-management incentivesrdquo Journal of
Political Economy Vol 98 No 2 pp 225-264
Jenter D (2001) ldquoUnderstanding high-powered incentivesrdquo Working Paper Harvard Business
School and Economics Departement
Johnson SA and Tian YS (2000) ldquoThe value and incentive effects of non-traditional executive
stock option plansrdquo Journal of Financial Economics Vol 57 No 1 pp 3-34
Jullien B and Salanie B (2000) ldquoEstimating preferences under risk The case of racetrack bettorsrdquo
Journal of Political Economy Vol 108 No 3 pp 503-530
Kachelmeier S and Shehata M (1992) ldquoExamining risk preferences under high monetary incentives
experimental evidence from the Peoplersquos Republic of Chinardquo American Economic Review Vol 82
No 5 pp 1120-1141
Kahneman D and Tversky A (1979) ldquoProspect Theory An analysis of decision under riskrdquo
Econometrica Vol 47 No 2 pp 263-292
Lambert R Lanen W and Larcker D (1989) ldquoExecutive stock option plans and corporate dividend
policyrdquo Journal of Financial and Quantitative Analysis Vol 24 No 4 pp 409-424
Lambert R Larcker D and Verrecchia R (1991) ldquoPortfolio considerations in valuing Executive
Compensationrdquo Journal of Accounting Research Vol 29 No 1 pp 129-149
Lambert R and Larcker D (2001) ldquoHow do employees value (often incorrectly) their stock optionsrdquo
available at knowledgewharton
31
Lewellen W Loderer C and Martin K (1987) ldquoExecutive compensation and executive incentive
problem an empirical analysisrdquo Journal of Accounting and Economics Vol 9 No 3 pp 287-310
Loughran T and Ritter J (1995) ldquoThe new issue puzzlerdquo Journal of Finance Vol 50 No 1 pp 23-
51
Markowitz H (1952) ldquoThe utility of wealthrdquo Journal of Political Economy Vol 60 No 2 pp 151-
158
Odean T (1998a) ldquoAre Investors Reluctant to Realize their Lossesrdquo Journal of Finance Vol 53
No 5 pp 1775ndash1798
Rajgopal S and Shevlin T (2002) ldquoEmpirical evidence on the relation between stock option
compensation and risk askingrdquo Journal of Accounting and Economics Vol 33 No 2 pp 145-171
Shefrin H and Statman M (1985) ldquoThe disposition to sell winners too early and ride losers too long
theory and evidencerdquo Journal of Finance Vol 40 No 3 pp 777-790
Sawers K Wright A and Zamora V (2006) ldquoLoss aversion stock-based compensation and
managerial risk-seeking behaviorrdquo paper presented at the AAA 2007 Management Accounting
Section Meeting available at httpssrncom abstract=864224
Thaler R (1999) ldquoMental Accounting Mattersrdquo Journal of Behavioral Decision Making Vol 12 No
3 pp 183-206
Thaler R and Ziemba W (1988) ldquoParimutuel betting markets Racetracks and lotteriesrdquo Journal of
Economic Perspectives Vol 2 No 2 pp 161-174
Tversky A and Kahneman D (1992) ldquoAdvances in Prospect Theory Cumulative representation of
uncertaintyrdquo Journal of Risk and Uncertainty Vol 5 No 4 pp 297-323
Yermack D (1997) ldquoGood Timing CEO Stock Option Awards and Company News
Announcementsrdquo Journal of Finance Vol 52 No 2 pp 449-476
Wu G and Gonzalez R (1996) ldquoCurvature of the Probability Weighting functionrdquo Management
Science Vol 42 No 12 pp 1676-1690
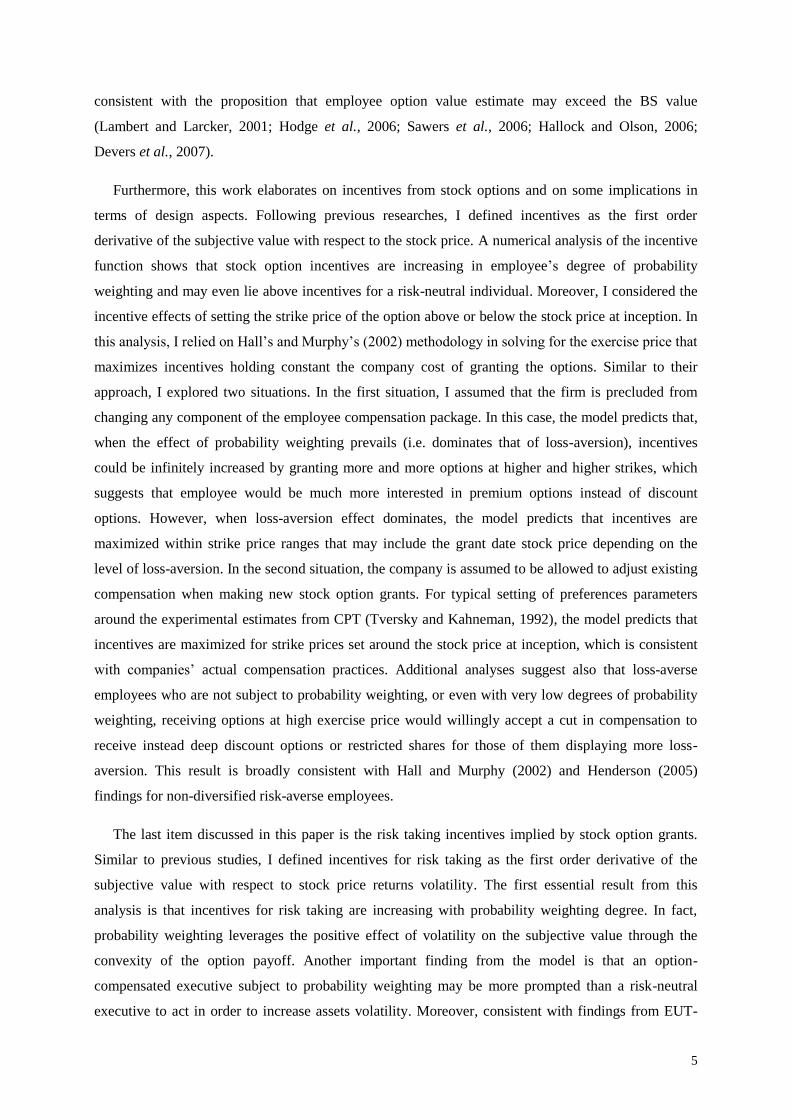

10
2
3
l
a aI x dx
(64)
2
2( )
r q T T x
g x Se
(65)
2
1
ln2
Sr q T
Kl
T
(66)
2
2
ln2
Sr q T
Kl
T
(67)
Here is the Gaussian density function and a
a
pp
p
is the first-order partial derivative
of a
which is defined over 01 as follows
1
1
111
1
111
1
1 11
(1 )1
1
(1 )
1
aaa l
a a
aa a
aaa
la
a a
aa a
p p ppa p x dx
p pp p
p
p p pp
a p x dxp p
p p
(68)
122 Reference point set up
Although CPT specifies the shape of the value function around the reference point it does not
provide guidance on how people set their reference points Neither does most of the psychological
literature relying on the assumption according to which the reference point is the Status quo Instead
this literature admits both the existence and the importance of non-status quo reference points since
ldquothere are situations in which gains and losses are coded relative to an expectation or aspiration level
that differs from the status quordquo (Kahneman and Tversky 1979)
Research on the Disposition Effect6 has paid greater attention to non-status quo reference points
(Shefrin and Statman 1985 Heisler 1998 Odean 1998a Gneezy 1998) These studies have found
6 Disposition effect is a term coined by Shefrin and Statman (1985) to refer to the tendency of individual
investors to hold loser stocks and sell winner stocks defined relative to a purchase price reference point
11
strong evidence that reference points are set in a dynamic fashion In particular Gneezy (1998)
documented that maxima are more effective predictors than are purchase prices
More specifically in studding exercise behavior of stock options holders Huddart and Lang
(1996) Heath et al (1999) and Bahaji (2009) have shown empirically that exercise activity is linked to
share price historical maxima These findings are consistent with employee exercise decisions take
into account the level of share price with respect to non-status quo reference points
In principle employee would update the reference point in a way that fits with his own
expectations regarding the underlying share price at expiry Intuitively the employee could estimate
the intrinsic value of the option based on his future share price forecasts as he can rely on the Black
Scholes value of the option disclosed by the firm Following Spalt (2008) I consider that the reference
point parameter in the model is the BS value7 Beyond the argument of empirical evidence on
employee exercise behavior depending on non-status quo reference points this assumption is
supported by firms common practices in terms of stock option compensation Most of stock-option
designers use the BS model in order to estimate the value of stock options as constituents of the total
compensation package This value is usually announced to the employee at the inception of the
options Moreover the BS model is recommended in the FASB and the IASC guidelines for
determining the fair value of stock options (ie the amount an outside investor with no hedge
restrictions would pay for the option) that needs to be disclosed in the financial statements These
statements comprising the BS value of the stock options are provided to shareholders as well as
stakeholders including employees
123 The impacts of preferences-related parameters a numerical analysis
To provide a concrete outline on the profile of the subjective value yielded by the model relative
to the risk neutral value profile I performed a numerical analysis8 of the value of a 4-year call option
( 4T ) with a strike price 100K For the remaining option-related parameters the figures were
computed assuming no dividend payments ( 0q ) 30 and 3r Moreover I set the
curvature parameter of the value function ( ) and the loss aversion coefficient ( ) to respectively
088 and 225 based on experimental estimates from CPT (Tversky and Kahneman 1992)
7 To be more precise the value used here is the expectation of the option payoff at expiring yielded by the BS
model (ie the nondiscounted BS value) Consistent with this specification the probability measure IP used to
derive the subjective value in (6) is the risk neutral probability measure Moreover ignoring the probability
weighting feature (ie 1a ) this setting allows the subjective value implied by the model to converge towards
the risk neutral value (ie BS value) when the preferences of the employee tend to risk neutrality
(ie 1 ) 8 The integrals in (62) (63) and (64) were computed numerically
12
Figure-1 Option value against the stock price This figure is
a plot of the subjective value computed under different
probability weighting parameters (the blue curves) It
illustrates the profile of the subjective value compared to that
of the risk neutral value (red curve) The Parameters used
are T=4 K=100 σ=30 r=3 q=0 =225 α=088
Figure-2 Sensitivity to probability weighting This figure is
a plot of the partial derivative of the subjective value with
respect to ldquoardquo against both ldquoardquo and the stock price volatility
ldquoσrdquo It exhibits the local effect of probability weighting given
the payoff distribution skewness captured by ldquoσrdquo The
derivative was computed numerically based on the following
parameters T=4 K=S=100 r=3 q=0 =225 α=088
Furthermore in order to calibrate the probability weighting function I used three different values of
the parameter a within the range of values estimated in the experimental literature9
Figure 1 depicts the option value as a function of the stock price The three blue curves represent
the value profiles from the perspective of three CPT employees with the same value function and
different degrees of probability weighting At first sight depending on the degree of probability
weighting and the option moneyness (S
K) the subjective value could lie either under or below the BS
value In contrast standard EUT-based models predict that the option value from a risk-averse
employee perspective is systematically lower than the risk-neutral value (Hall and Murphy 2002
Henderson 2005) These preliminary results are consistent thought with some empirical findings
suggesting that frequently employees are inclined to overestimate the value of their stock-options
compared with the BS value (Lambert and Larcker 2001 Hodge et al 2006 Sawers et al 2006
Hallock and Olson 2006 Devers et al 2007)
9 Tversky and Kahneman (1992) got 065 on average (a=061 for gains and b=069 for losses) These results are
corroborated by Abdellaouirsquos (2000) findings (a=060 for gains and b=070 for losses hence an average of 065)
In addition Camerer and Ho (1994) obtained a=056 for gains whereas Gonzales and Wu (1996) and Bleichrodt
and Pinto (2000) found a=071 and a=067 respectively
13
The results presented in figure 1 show that the option subjective value is increasing in probability
weighting degree (ie decreasing in parameter a ) Actually given the asymmetric profile of the option
payoff the expectation a
E
in the subjective value formula (6) is positively affected by the emphasis
put on the tail of the payoff distribution which is governed by the parameter a the lower a the more
overweighed will be small probabilities and the more underweighted will be medium to large
probabilities This lottery-like nature of an option combining large gains with small probabilities may
make it attractive to a CPT employee subject to probability weighting This preliminary outcome leads
to proposition 1 which stats that
Proposition 1 the value of the stock option contract to a CPT- employee is increasing with
respect to his degree of probability weighting (ie is decreasing with respect to a)
(Proofs are provided in appendix A)
Moreover the effect of probability weighting is expected to increase with the skewness of the
distribution of the underlying stock price which is captured by the volatility parameter given the
Log-normality assumed in the model In order to show that I performed a numerical analysis of the
sensitivity of the subjective value to the probability weighting degree as a function of the volatility
and the parameter a This sensitivity is defined as the partial derivative of subjective value with
respect to a (a
C
a
) The results are reported in figure 2 in the form of a graph It shows that the
sensitivity to parameter a is negative and locally decreasing in volatility That means that the more the
share price is volatile the more the option will be attractive for a CPT employee subject to probability
weighting This supports Spaltrsquos (2008) findings that the effect of probability weighting provides an
economic rationale to riskier firms (ie more volatile firms) for granting more stock options to non-
executive employees
Furthermore I investigate the effect of loss aversion on the subjective value The variable of
interest here is In an analogical sense with the EUT framework the option value from the
perspective of a loss-averse employee is expected to decrease with his degree of loss-aversion To
verify this I computed numerically the first order derivative with respect to (
aC
) crossed over
various levels of and moneyness ranging from 005 to 1 and from 5 to 200 respectively The
outcome is reported in figure 3 It shows that the sensitivity to loss aversion is negative and locally
decreasing in moneyness That means that the more the employee is loss averse the less would the
option be worth to him This conclusion is taken up in proposition 2 hereafter
14
Figure-3 Sensitivity to loss aversion This figure is a plot of the
partial derivative of the subjective value with respect to ldquoλrdquo
against both ldquoλrdquo and the stock price ldquoSrdquo It exhibits the local effect
of loss aversion given the option moneyness The derivative was
computed numerically based on the following parameters T=4
σ=30 K=100 r=3 q=0 a=065 α=088
Figure-4 Sensitivity to the curvature parameter This figure is a
plot of the partial derivative of the subjective value with respect to
ldquoαrdquo against both ldquoαrdquo and the stock price ldquoSrdquo It exhibits the local
effect of the curvature parameter given the option moneyness The
derivative was computed numerically based on the following
parameters T=4 σ=30 K=100 r=3 q=0 a=065 λ =225
Proposition 2 the value of the stock option contract to a CPT- employee is decreasing with
respect to his degree of loss-aversion (ie a decreasing function of λ)
(Proofs are provided in appendix B)
I performed a similar analysis in order to get a view on the effect of the curvature parameter In
the same way I assessed locally the first order derivative with respect to within a range of values
from 005 to 1 and using share prices ranging from 10 to 200 Figure 4 shows that this derivative is
locally increasing with the option moneyness for values of above say 075 It also shows broadly
that the subjective value is an increasing monotone function of over a range of values around the
experimental estimate of 088 (from 07 to 1) irrespective of the option moneyness
2 Incentives from stock-options
Stock-options are incentive tools used within a principal-agent relationship to align the interests of
the agent (employee) on those of the principal (shareholders) The shareholders grant stock options in
15
order to provide the employee with incentives to make efforts that enhance the value of the firm and
thus their own wealth Indeed assuming that employees are aware of how their actions affect the share
price option holdings will prompt them to make efforts that increase share price Therefore the
incentive from a single option grant will depend on the degree of the sensitivity of the subjective value
to the stock price
21 The incentive measure
Following Jensen and Murphy (1990) Hall and Murphy (2000 2002) and others I defined the
incentive effect as the first order derivative of the subjective value with respect to share price (
aC
S
)
which defines how the value from the employee perspective changes with an incremental change in
the stock price As we can see in figure 5 which is a plot of
aC
S
for three values of a incentives
are greatest for in-the-money10
options Also the incentive effect is increasing with the degree of
probability weighting Another observation that can be made from figure 5 is that for sufficiently high
level of probability weighting the option can give much more incentive to increase stock price than is
reflected by the BS delta This is consistent with my previous finding that the subjective value can
overstate the BS value Note that consistently with the EUT-based models when the employee
process probabilities in a linear way ( 1a ) - which means that the probability weighting assumption
is relaxed and only loss-aversion matters - the incentives lie strictly under the BS delta whatever the
level of the option moneyness That is to say that the options are less attractive for both risk-averse
employee and loss-averse employee who are not subject to probability weighting The analysis in
figure 6 supports this It shows that with a hold constant at 065 incentives are decreasing in loss-
aversion Conversely with loss-aversion parameter set to 1 which means that the loss-aversion
effect is neutralized incentives for a representative loss-neutral employee with a degree of probability
weighting equal to experimental estimate of 065 overstate the BS delta
10
The terminology ldquoat-the-moneyrdquo is referring to stock-options with an exercise price equal to the stock price at
inception The expressions ldquoOut-of- the-moneyrdquo and ldquoIn-the-moneyrdquo are also used throughout the paper to refer
to options with strike price respectively below and above the grant date stock price
16
Figure-5 The effect of probability weighting on stock-option
incentives This figure is plots of the partial derivative of the
subjective value with respect to stock price ldquoSrdquo against the option
moneyness It exhibits the combined effects of probability
weighting and option moneyness on incentives The derivatives
were computed numerically assuming three different levels of
probability weighting (see the legend above) and holding the
remaining parameters constant at the following values T=4
σ=30 K=100 r=3 q=0 λ=225 α=088
Figure-6 The effect of loss-aversion on stock-option incentives
This figure is plots of the partial derivative of the subjective value
with respect to stock price ldquoSrdquo against the option moneyness It
exhibits the combined effects of loss-aversion and option
moneyness on incentives The derivatives were computed
numerically assuming three different levels of loss-aversion (see
the legend above) and holding the remaining parameters constant
at the following values T=4 σ=30 K=100 r=3 q=0
a=065 α=088
22 Implications for stock option design optimal strike price
Setting the strike price of standard stock options boils down to defining the threshold against which
the performance is assessed and consequently to determining the likelihood of a final payout As we
have just noticed from figure 5 and figure 6 incentives increases in the option moneyness and
equivalently decreases with strike price In parallel from the shareholders perspective granting in-
the-money options is much more costly than granting out-of-the money or at-the-money options
(recall figure 1) This leads the firm to a trade-off to make when setting the exercise price of the
options in the sense that holding his cost unchanged she could either grant fewer options at a low
strike price or increase the grant size at higher exercise price
I relied on the methodology from Hall and Murphy (2002) in figuring out the optimal exercise price
satisfying the double purpose of maximizing incentives and holding constant the firmrsquos cost of
granting options I also considered two situations In the first situation the firm does not adjust the
existing compensation package when grating additional stock options Thus these additional options
are considered as a pure add-on to existing compensation In the second situation however the
employee and the firm are allowed to bargain efficiently over the terms of the compensation Thus the
17
firm is assumed to fund additional options by an adjustment to other compensation components that
leaves the employee indifferent between his initial package and the new package including the
additional grant
221 Situation 1 Option grant without a compensation offset
When the firm is not allowed to adjust the existing compensation package the optimal strike price
that maximizes incentives for a given amount of firm cost is the solution to the following constrained
optimization problem
m ax
a
K
nC K
S
such that n K c (7)
Where a
nC K
S
denotes the incentives from receiving n options with a strike price K and
K the per-unit cost or the BS value of one option
The optimization problem in (7) is solved numerically by varying the parameter K First the BS
value is computed for a given K which enable to determine the grant size n that leaves the firm cost
constant at c in accordance with the constraint in (7) Then the cost function a
nC K
S
is assessed
based on n and K This procedure is reiterated recursively until the optimal value of K is found
I set the total cost for the firm at euro28 333c (hence a grant of 1000n at-the-money options
based on the retained option-related parameters) As reported in figure 7 I varied the preferences-
related parameters a and within specific ranges in order to figure out the conditions under which an
optimal strike may exist and the robustness of the model predictions The chart on the left-hand side
exhibits the total incentives from the grant as a function of the strike price and the probability
weighting parameter with the loss-aversion held constant at 225 It shows that the convexity and
the monotony of the total incentives function ( a
nC K
S
) shift with the degree of probability
weighting while it is concave and non-monotone over the range of strike prices for low levels of
probability weighting ( 0906a ) it becomes convex and monotonically increasing for higher levels
Moreover for higher level of volatility probability weighting is expected to affect more deeply the
shape of total incentives function (recall figure 2)
Specifically when the effect of probability weighting prevails (ie dominates that of loss-aversion)
the model predicts that incentives could be infinitely increased by granting more and more options at
higher and higher strikes This result suggests that if the employee is subject to a degree of probability
18
weighting that could potentially lead him to overstate the value of the option in excess of the BS value
he would ask for the maximum number of options (as much options as the company could possibly
grant him) at their (highest) breakeven strike the higher the strike price the more small probabilities
of large gains there are and the more valuable become options to him Furthermore this means that
such an employee would be much more interested in premium options instead of discount options
Actually although this result is in stark contrast with the common stock-based compensation practices
that consist in granting broadly at-the-money options it shouldnrsquot be rejected without taking into
account the other factors restricting the number of options the company could issue irrespective of
their strike prices such like capital dilution limits
In addition as we can notice from the plot in the middle of figure 7 the effect of probability
weighting on total incentives could be offset by an increasing loss-aversion This time is varied and
a held constant at 065 which meets the experimental estimate When the loss-aversion effect
dominates the total incentives function tends to non-monotone concave shapes which means that it
admits finite extremas In particular when probability weighting effect is neutralized by setting 1a -
in other words the employee is not subject to probability weighting - total incentives curve tends to
flatten around the optimum (see the green curves on the right-hand side plot) This suggests that there
exists a range of strike prices that yield quasi-similar incentives For instance with loss-aversion set
at 225 optimal strike (as of stock price at inception) is about 142 and lies within a range of
values from 121 to 153 that yield total incentives of about euro530 (rounded figure) With 6
the optimal strike drops by almost 30 (to 112) and total incentives are flat around the maximum
value of euro450 within the range from 91 to 111 Note that these results are consistent with Hallrsquos
and Murphyrsquos (2000 2002) findings relying on the EUT framework Consistently their work
documented that incentive-maximizing strike price exists when the options are considered as an add-
on to existing compensation In addition they showed that total incentives are relatively flat around
the maximum and that optimal strike price decreases for more risk-averse and less diversified
employees
19
Figure-7 Incentives from options grant with total cost of euro28 333 assuming no adjustment to existing compensation package This figure is plots of
incentives (in Keuro) from options grant for a given strike price holding the total BS value of the grant constant at euro28 333 Total incentives are defined as the
partial derivative of the total subjective value of the grant with respect to stock price ldquoSrdquo The sub-figure on the left-hand side depicts total incentives as a
function of the strike price and probability weighting parameter That in the middle is a plot of total incentives against strike price and loss-aversion The
sub-figure on the right-hand side exhibits the combined effect of probability weighting and loss-aversion on the shape of total incentives as a function of
strike price The derivatives were computed numerically based on the following parameters T=4 σ=30 S=100 r=3 q=0 α=088
222 Situation 2 Option grant with an adjustment to existing compensation
Now letrsquos considerer that the company is allowed to make an efficient adjustment to existing
compensation components (cash for example) in order to grant additional options to the employee
The impact of this adjustment should be neutral with regard to the total compensation cost for the
company Moreover assuming this adjustment involves cash compensation it must be attractive to the
employee so that hersquod be willing to give up some cash compensation against extra options grant
Therefore it must leave the employee at his initial total subjective value of the compensation package
It follows that the strike price that maximizes total incentives for a given company cost is the solution
of this following optimization problem
m ax
a
K
nC K
S
subject to a
n K nC K c
and 0n (8)
20
Where c is a fixed constant The constraint in (8) is the aggregation of the company cost constraint
and the employee value constraint used in Henderson (2005)
Similar to that in (7) this optimization problem was solved numerically In this analysis c was
chosen such that for retained parameters the number of granted at-the-money options n is around
1000 hence total cost of euro28 333 Once c is set n is determined from the constraint in (8) for a given
strike price K S then total incentives
anC K
S
are assessed These are depicted in figure 8
The left-hand side sub-figure exhibits total incentives for different levels of K and probability
weighting parameter a with risk aversion held constant at 225 For each combination of K and
a the constraint in (8) is solved for n which allows to determine total incentives The plots indicate
that when the employee is deeply subject to probability weighting ( 0475a )
anC K
S
is
strictly decreasing throughout the depicted range of strike prices (see the curves in blue) In this case
similar to EUT-based studiesrsquo findings (Hall and Murphy 2002 Henderson 2005) incentives are
maximized through restricted stocks grant rather than stock options The intuitive reason behind that
is given that the employee systematically values the options in excess of their BS value efficient
trade-off over compensation allocation is made via the grant of equity-based instruments that
employee values at their actual cost restricted stocks for instance
However for lower degrees of probability weighting (typically 0475 085 a ) the optimal
strike price is not nil and tends to increase with a Specifically the optimization problem is defined
on the right (see the red solid curve) or on the left (see the red dashed curve) of the optimal
strike
K and
anC K
S
admits an infinite branch in
K (ie total incentives are infinite at that
point) The technical reason behind that is that the subjective value is equal to the BS value at the
optimal strike which yields according to the constraint in (8) an infinite grant size
(
lim
K K
n K ) For instance
K ranges from 60 to 195 when a takes values within a range
of value around the experimental estimates ( 055 070a )11
This suggests that depending on the
extent to which employee weights probabilities either grants of discount options or premium options
may result in a Pareto optimum to the contract As a specific example for an employee with
0616a the optimal strike price
K is around 100 which means that for the prevailing setting
the model predicts at-the-money options as optimal in an efficient contracting framework since the
companyrsquos cost of granting these options is equal to their value to the employee In this case granting
11
Optimal strikes are expected to be lower for higher stock price volatility since probability weighting effect
tends to increase with volatility (recall figure 2)
21
options with strike price around the stock price at inception which is consistent with observed
practices results in a perfect reconciliation of the company and the employee respective views Note
that for a similar setting in the previous situation where the options are given as an add-on to existing
compensation the model indicates that incentives from stock options could be infinitely increased by
granting increasingly more options at greater and greater strike price
Furthermore for weak degrees of probability weighting ( 085 a ) the subjective value of the
option lies strictly below the BS value because the effect of loss-aversion tends to dominate that of
probability weighting Thus the total incentives function takes a non-monotone concave shape and
shows finite extremas ranging from 35 to 81 In particular when probability weighting assumption
is relaxed ( 1a ) the function flattens around the maximum and approaches a monotone decreasing
shape with increasing loss-aversion (see sub-figure on the right-hand side) This result suggests that
loss-averse employees who are not subject to probability weighting - even with very low degree of
probability weighting - receiving options at high exercise price would willingly accept a cut in cash
compensation to receive instead deep discount options or restricted shares for those of them displaying
more loss-aversion Again this is broadly consistent with Hallrsquos and Murphyrsquos (2002) and
Hendersonrsquos (2005) findings for non-diversified risk-averse employees
Last but not least the sub-figure in the middle of the main figure is plots of total incentives against
the strike price each of them corresponds to a given level of loss-aversion The purpose of this
analysis consists in showing the effect of loss-aversion on
K by holding a constant at 065 and
varying It mainly shows that loss-aversion has an effect opposite to that of probability weighting
when probability weighting effect is dominant12
(ie the employee may potentially put overstated
value in the option specifically for high strikes) optimal strike increases and total incentives decreased
with loss-aversion Conversely when loss-aversion effect is dominant as stated before the model
yields predictions comparable to that of the EUT-based models
12
See the limit case of 1 where risk-aversion is ignored (the blue dashed curve)
22
Figure-8 Incentives from options grant with total cost of euro28 333 assuming cash compensation is adjusted This figure is plots of incentives (in Keuro) from options grant
for a given strike price holding the total compensation value constant from both company and employee perspectives Total incentives are defined as the partial
derivative of the total subjective value of the grant with respect to stock price ldquoSrdquo The sub-figure on the left-hand side depicts total incentives as a function of the strike
price for varying levels of probability weighting parameter That in the middle is a plot of total incentives against strike price for varying levels of loss-aversion The
sub-figure on the right-hand side exhibits the sole effect of loss-aversion (with no probability weighting) on the shape of total incentives as a function of strike price The
derivatives were computed numerically based on the following parameters T=4 σ=30 S=100 r=3 q=0 α=088
3 Do stock-options provide incentive for risk taking
Earlier studies (Agrawal and Mandelker 1987 DeFusco et al 1990 Hirshleifer and Suh 1992)
have built on insights from standard option pricing theory to predict that option-compensated
managers will be motivated to increase the asset variance and leverage of their firms because the
convexity of the option payoff increase its value as the volatility of the stock price increases Lambert
et al (1991) was the first to call into question this assertion They proved that a non-diversified risk-
averse executive may not necessarily take actions that increase stock price volatility because that
parameter of the distribution of the stock price has two conflicting effects on the subjective value of
the option a positive effect implied by the payoff convexity and a negative effect due to the concavity
of the executiversquos utility function Henderson (2005) draws conclusions from a EUT-base model
consistent with these findings Specifically she finds that stock-options provide incentives for a risk-
averse manager to increase the beta of the company (ie the market risk-to-firm specific risk ratio)
rather than total risk Although there is some empirical evidence supporting the prediction that stock-
options do not systematically encourage risk taking it is still very scarce13
13
See for instance Cohen et al(2000) and Rajgopal and Shevelin (2002)
23
Figure-9 The effect of loss-aversion and probability weighting on risk-taking incentives implied by stock-options This figure is plots
of the partial derivative of the subjective value with respect to stock price volatility ldquoσrdquo against the option moneyness It exhibits on
the one hand the combined effects of loss-aversion and option moneyness (chart on the right-hand side) and on the other hand the
combined effects of probability weighting and option moneyness (chart on the left-hand side) on risk-taking incentives The derivatives
were computed numerically assuming three different levels of loss-aversion and probability weighting (see the legends above) and
holding the remaining parameters constant at the following values T=4 σ=30 K=100 r=3 q=0 α=088
I revisited the risk taking incentives issue from the perspective of an executive with CPT
preferences Similar to previous studies I defined incentives for risk taking as the first order derivative
of the subjective value in (6) with respect to volatility (a
C
)
14 In order to figure out the link
between risk-taking incentives from stock-options and the parameters related to preferences I
performed a numerical analysis on the sensitivity of a
C
to loss-aversion and probability weighting
The results are reported in figure 8 hereafter
The left-hand side subfigure is plots of a
C
as a function of the stock price for several degrees
of probability weighting with loss-aversion held constant at 225 The purpose of the underlying
analysis is to figure out broadly the extent to which a loss-averse executive subject to probability
weighting would prefer a high or low risk given the way the latter influences the option value from his
own perspective The first essential result from this analysis is that incentives for risk taking are
14
Actually the sensitivity of the subjective value to a parameter of the probability distribution of the stock price
provides a measure of the executive incentive to make decisions that influence that parameter
24
increasing with probability weighting degree In fact the probability weighting leverages the positive
effect of volatility on the subjective value through the convexity of the option payoff Another
observation that could be made is that for sufficiently high degree of probability weighting
( 070a )a
C
lies strictly above the conventional BS Vega over the retained range of stock prices
(see the red and the green curves) This means that an option-compensated CPT-executive subject to
probability weighting may be more prompted than a risk-neutral executive to act in order to increase
assets volatility Note that for typical setting of a at 065 the model predicts that a CPT-executive
with a such preferences calibration will have incentives to act in order to increase the volatility of the
stock price by 1 if he targets a 87 cts - increase of the value of his at-the-money 4-year option
In addition when probability weighting is ignored by setting 1a only the effect of loss-aversion
on risk taking incentives is captured The analysis of this effect is reported in the subfigure on the
right-hand side More explicitly this subfigure exhibits plots of a
C
for several levels of with
probability weighting effect neutralized It shows mainly that risk-taking incentives from stock-options
are decreasing with loss-aversion Moreover it appears that a
C
turns negative over a given range
of stock prices where the option is in-the-money Therefore consistent with findings from EUT-based
models the CPT model predicts that a loss-averse executive who is not subject to probability
weighting may not prefer an increase in the variance of the company stock price return As a specific
example an executive with a loss-aversion parameter 6 who processes probabilities in a linear
way (see the yellow curve) and holds 4-year stock options will have incentives to decrease rather than
increase the volatility of the company stock price if the stock price is above 130 the strike price of
his options
In essence incentives for risk taking from stock options - defined as the sensitivity of the
subjective value to the stock price volatility - is subject to two opposite effects under the CPT-based
model a positive effect from the convexity of the optionrsquos payoff leveraged by the probability
weighting feature and a negative effect from the loss-aversion coefficient Therefore there is a mixed
effect on risk taking incentives depending on which of the two effects dominates This will depend
obviously on the option moneyness and the other option-specific parameters
Conclusion
This paper proposes an alternative theoretical model of stock option subjective value to analyze
their incentive effects for employees The model predictions ascertain the ability of CPT to explain
some prominent incentive patterns that EUT models have difficulties to capture It mainly provides
25
arguments on the well documented tendency of employees to frequently value - under some
circumstances - their options in excess of their cost to the company Specifically these results
highlight the economic rational for firms in particular those with higher risk to widely use stock
options in non-executive employee compensation (Spalt 2008)
Loss aversion and probability weighting are the key features driving the subjective value in the
CPT model These parameters have countervailing effects on the modeled subjective value Depending
on which of them is dominant in the preferences calibration the model yields different predictions
regarding incentives Specifically consistent with some behavioral patterns observed in many surveys
and experimental studies on equity-based compensation the model predicts that when the probability
weighting feature prevails the subjective value may overstate the risk-neutral value of the option In
this case assuming the company and the employee bargain efficiently over the compensation
components incentives are maximized for strike prices set around the stock price at inception for a
representative employee with preferences calibration meeting the experimental estimates from CPT
(Tversky and Kahneman 1992) Obviously this finding is consistent with companiesrsquo actual
compensation practices Moreover executives with such preferences profile may be prompted to act in
order to increase share price volatility However when the emphasis is put on the loss-aversion
feature by relaxing the probability weighting assumption the model yields results comparable to
those of EUT-based models In particular the model predicts that loss-averse employees who are not
subject to probability weighting or even with very low degrees of probability weighting receiving
options at high exercise price would willingly accept a cut in compensation to receive instead deep
discount options or restricted shares for those of them displaying more loss-aversion Furthermore the
model shows that loss-averse executives who are processing probabilities in a linear fashion may not
prefer an increase in the variance of the company stock price return
Despite their practical interest the conclusions from the results of this research should not be
drawn without underlining some of its limitations The first one concerns the specification of the CPT
model Actually although the reference point specification in the model is consistent with both
empirical evidence on people setting reference points in a dynamic fashion and firmsrsquo widespread use
of the BS value as a standard for Financial and Human Resources disclosers empirical and
experimental literature is still silent on how people set reference points when assessing complex
gambles like stock option payoffs In addition to keep the model tractable only European-style
options were studied in this paper The model is still however easily extendable to Bermudian-style
options using numerical schemes such like lattice approaches The other limitation of this study is
related to the large heterogeneity in probability weighting that may exist across individuals (Wu and
Gonzalez 1996) The Tverskyrsquos and Kahnemanrsquos (1992) weighting function used in the model
provides only a fit to the median profile
26
Finally this work highlights - as did some previous eminent researches in this field (Dittmann et
al 2008 Splat 2008) - a number of future promising research directions in equity-based
compensation incorporating CPT framework For instant exploring the ability of CTP to explain the
growing use of performance shares plans instead of stock options in employee compensation would be
of great interest for future research Furthermore given that several empirical studies has documented
that employee stock option exercise behavior is also driven by behavioral factors a promising research
direction incorporating CPT is studying its ability to predict exercise patterns
Appendix A proofs of proposition 1
This appendix provides heuristic proofs of proposition 1
To prove that the subjective value a
C
is decreasing in 028 1a it is sufficient to show that
the expectation a
E
is a decreasing function of a Letrsquos first rewrite the expectation in (6) as follows
=
a aIP T IP T
x
a
IR
E v h E v h g x
w x u du x dx
Where
1
2 1
2
g x K x l
w x K g x l x l
x l
with 0 1 and 1 (A1)
Since w x
is derivable over 1IR l an expansion in Taylor series at the first order gives
w x w y x y w y
with 1y IR l
Introducing the expectation operator with respect to the transformed probability measure we have
a aIP IP
x
IP a
E w x w y E x y w y
w y E x u du y w y
(A2)
27
Since w x
is monotone increasing in x we have 0w y Then it follows from (A2) that
proving that a
E
is locally decreasing with respect to a in 1y IR l boils down to showing that
0
x
IP aE x u du
a
(A3)
Noting that
x
au du is positive and convex with respect to 1 1
x l l we
have according to Jensen inequality
IPE xx
IP a IP aE x u du E x u du
Since x follows a standard normal distribution which is symmetric in 0IP
E x we get from
the inequality above by substituting IPE x in the right hand side
0
x
IP aE x u du (A4)
Note that the result in (A4) above showing that the expectation under the transformed
probabilities overstates that under the original probabilities is a consequence of the probability
weighting function feature stated in sect112 which consists in infinitely-overweighting infinitesimal
probabilities and infinitely-underweighting near-one probabilities
Furthermore noting that the convexity of
x
au du with respect to 1 1
x l l
is decreasing in a and using the result in (A4) we have for 028 1 a b
IP IPE x E xx x
IP a IP a IP b IP bE x u du E x u du E x u du E x u du
Or equivalently
x x
IP a IP bE x u du E x u du (A5)
28
This proves that the condition in (A3) holds which means that a
C
is a decreasing function of
028 1a QED
Appendix B proofs of proposition 2
Taking the derivative of the subjective value function in (6) with respect to λ yields
1
1
1
1
1 0
1
a rT
a a
a
a a a rT
EE e if E
C
E E Ee otherw ise
(B1)
Where
1 2 3
a a a aE I I I
(B2)
Using the formulas in equations from (62) to (64) we can rewrite the derivatives in (B2) as follows
1
0
aI
1
2
2
l x
a
a
l
IK g x u du x dx
23
l
a
a
Ix dx
Then substituting these results in place of the derivatives in (B2) we obtain
1 2
2
l lx
a
a a
l
EK g x u du x dx x dx
(B3)
Given that
0
aE
we conclude that
aC
is nonpositive This implies that
aC
is a decreasing
function of QED
29
References
Abdellaoui M (2000) ldquoParameter-Free Elicitation of Utility and Probability Weighting Functionsrdquo
Management Science Vol 46 No 11 pp 1497-1512
Agrawal A Mandelker G (1987) ldquoManagerial incentives and corporate investment and financing
decisionsrdquo Journal of Finance Vol 42 No 4 pp 823-837
Bahaji H (2009) ldquoLe comportement drsquoexercice des porteurs de stock-options une eacutetude empirique
sur le marcheacute Ameacutericainrdquo Working Paper DRM Finance- Universiteacute de Paris Dauphine Paris June
2009
Barberis N and Thaler R(2003) ldquoA survey of behavioral financerdquo in Constantinides G Harris M
and Stulz R (Ed) Handbook of the Economics of Finance North-Holland Amsterdam
Bleichrodt H and Pinto JL (2000) ldquoA Parameter-Free Elicitation of the Probability Weighting
Function in Medical Decision Analysisrdquo Management Science Vol 46 No 11 pp 1485-1496
Cai J and Vijh AM (2004) ldquoExecutive stock and option valuation in a two state variable
framework allowing optimal investment of outside wealth in the risk-free asset and the market
portfoliordquo Working Paper University of Iowa
Camerer C and Ho TH (1994) ldquoViolations of Betweenness Axiom and Nonlinearity in
Probabilityrdquo Journal of Risk and Uncertainty Vol8 No 2 pp 167-196
Cohen RB Hall BJ and Viceira LM (2000) ldquoDo executive stock options encourage risk taking
rdquo Working Paper Harvard Business School
Cook P and Clotfelter C (1993) ldquoThe peculiar scale economies of lottordquo American Economic
Review Vol 83 No3 pp 634-643
DeFusco R Johnson R and Zorn T (1990) ldquoThe effect of executive stock option plans on
stockholders and bondholdersrdquo Journal of Finance Vol45 No 2 pp 617-627
Detemple J and Sundaresan S (1999) ldquoNontraded asset valuation with portfolio constraints a
binomial approachrdquo Review of Financial Studies Vol 12 No 4 pp 835ndash872
Devers C Wiseman R and Holmes M (2007) ldquoThe effects of endowment and loss aversion in
managerial stock option valuationrdquo Academy of Management Journal Vol 50 No 1 pp 191-208
Dittmann I and Maug E (2007) ldquoLower salaries and no options On the optimal structure of
Executive payrdquo The Journal of Finance Vol 62 No 1 pp 303-343
Gneezy U (1998) ldquoUpdating the Reference Level Experimental Evidencerdquo Working paper
University of Haifa
Hall B and Murphy K (2000) ldquoOptimal Exercise prices for executive stock optionsrdquo American
Economic Review Vol 90 No 2 pp 209-214
30
Hall B and Murphy K (2002) ldquoStock options for undiversified executivesrdquo Journal of Accounting
and Economics Vol 33 No 2 pp 3-42
Hallock K and Olson G (2006) ldquoThe value of stock options to non-executive employeesrdquo Working
Paper No 11950 National Bureau of Economic Research Cambridge
Heath C Huddart S and Lang M (1999) ldquoPsychological factors and stock option exerciserdquo
Quarterly Journal of Economics Vol 114 No 2 pp 601-628
Heisler J(1994) ldquoLoss aversion in a futures market an empirical testrdquo Review of Futures Markets
Vol 13 No 3 pp 793ndash822
Henderson V (2005) The impact of the market portfolio on the valuation incentives and optimality
of executive stock options Quantitative Finance Vol 5 No 1 pp 35-47
Hirshleifer D and Suh R (1992) ldquoRisk Managerial Effort and Project Choicerdquo Journal of
Financial Intermediation Vol 2 No 3 pp 308-345
Hodge F Rajgopal S and Shevlin T (2006) ldquoHow do managers value stock options and restricted
stock rdquo Working Paper University of Washington
Holmstrom BR and Milgrom PR (1987) ldquoAggregation and linearity in provision of intertemporal
incentivesrdquo Econometrica Vol 55 No 2 pp 303-328
Huddart S and Lang M (1996) ldquoEmployee stock option exercises an empirical analysisrdquo Journal
of Accounting and Economics Vol 21 No 1 pp 5-43
Jensen M and Murphy KJ (1990) ldquoPerformance pay and top-management incentivesrdquo Journal of
Political Economy Vol 98 No 2 pp 225-264
Jenter D (2001) ldquoUnderstanding high-powered incentivesrdquo Working Paper Harvard Business
School and Economics Departement
Johnson SA and Tian YS (2000) ldquoThe value and incentive effects of non-traditional executive
stock option plansrdquo Journal of Financial Economics Vol 57 No 1 pp 3-34
Jullien B and Salanie B (2000) ldquoEstimating preferences under risk The case of racetrack bettorsrdquo
Journal of Political Economy Vol 108 No 3 pp 503-530
Kachelmeier S and Shehata M (1992) ldquoExamining risk preferences under high monetary incentives
experimental evidence from the Peoplersquos Republic of Chinardquo American Economic Review Vol 82
No 5 pp 1120-1141
Kahneman D and Tversky A (1979) ldquoProspect Theory An analysis of decision under riskrdquo
Econometrica Vol 47 No 2 pp 263-292
Lambert R Lanen W and Larcker D (1989) ldquoExecutive stock option plans and corporate dividend
policyrdquo Journal of Financial and Quantitative Analysis Vol 24 No 4 pp 409-424
Lambert R Larcker D and Verrecchia R (1991) ldquoPortfolio considerations in valuing Executive
Compensationrdquo Journal of Accounting Research Vol 29 No 1 pp 129-149
Lambert R and Larcker D (2001) ldquoHow do employees value (often incorrectly) their stock optionsrdquo
available at knowledgewharton
31
Lewellen W Loderer C and Martin K (1987) ldquoExecutive compensation and executive incentive
problem an empirical analysisrdquo Journal of Accounting and Economics Vol 9 No 3 pp 287-310
Loughran T and Ritter J (1995) ldquoThe new issue puzzlerdquo Journal of Finance Vol 50 No 1 pp 23-
51
Markowitz H (1952) ldquoThe utility of wealthrdquo Journal of Political Economy Vol 60 No 2 pp 151-
158
Odean T (1998a) ldquoAre Investors Reluctant to Realize their Lossesrdquo Journal of Finance Vol 53
No 5 pp 1775ndash1798
Rajgopal S and Shevlin T (2002) ldquoEmpirical evidence on the relation between stock option
compensation and risk askingrdquo Journal of Accounting and Economics Vol 33 No 2 pp 145-171
Shefrin H and Statman M (1985) ldquoThe disposition to sell winners too early and ride losers too long
theory and evidencerdquo Journal of Finance Vol 40 No 3 pp 777-790
Sawers K Wright A and Zamora V (2006) ldquoLoss aversion stock-based compensation and
managerial risk-seeking behaviorrdquo paper presented at the AAA 2007 Management Accounting
Section Meeting available at httpssrncom abstract=864224
Thaler R (1999) ldquoMental Accounting Mattersrdquo Journal of Behavioral Decision Making Vol 12 No
3 pp 183-206
Thaler R and Ziemba W (1988) ldquoParimutuel betting markets Racetracks and lotteriesrdquo Journal of
Economic Perspectives Vol 2 No 2 pp 161-174
Tversky A and Kahneman D (1992) ldquoAdvances in Prospect Theory Cumulative representation of
uncertaintyrdquo Journal of Risk and Uncertainty Vol 5 No 4 pp 297-323
Yermack D (1997) ldquoGood Timing CEO Stock Option Awards and Company News
Announcementsrdquo Journal of Finance Vol 52 No 2 pp 449-476
Wu G and Gonzalez R (1996) ldquoCurvature of the Probability Weighting functionrdquo Management
Science Vol 42 No 12 pp 1676-1690

11
strong evidence that reference points are set in a dynamic fashion In particular Gneezy (1998)
documented that maxima are more effective predictors than are purchase prices
More specifically in studding exercise behavior of stock options holders Huddart and Lang
(1996) Heath et al (1999) and Bahaji (2009) have shown empirically that exercise activity is linked to
share price historical maxima These findings are consistent with employee exercise decisions take
into account the level of share price with respect to non-status quo reference points
In principle employee would update the reference point in a way that fits with his own
expectations regarding the underlying share price at expiry Intuitively the employee could estimate
the intrinsic value of the option based on his future share price forecasts as he can rely on the Black
Scholes value of the option disclosed by the firm Following Spalt (2008) I consider that the reference
point parameter in the model is the BS value7 Beyond the argument of empirical evidence on
employee exercise behavior depending on non-status quo reference points this assumption is
supported by firms common practices in terms of stock option compensation Most of stock-option
designers use the BS model in order to estimate the value of stock options as constituents of the total
compensation package This value is usually announced to the employee at the inception of the
options Moreover the BS model is recommended in the FASB and the IASC guidelines for
determining the fair value of stock options (ie the amount an outside investor with no hedge
restrictions would pay for the option) that needs to be disclosed in the financial statements These
statements comprising the BS value of the stock options are provided to shareholders as well as
stakeholders including employees
123 The impacts of preferences-related parameters a numerical analysis
To provide a concrete outline on the profile of the subjective value yielded by the model relative
to the risk neutral value profile I performed a numerical analysis8 of the value of a 4-year call option
( 4T ) with a strike price 100K For the remaining option-related parameters the figures were
computed assuming no dividend payments ( 0q ) 30 and 3r Moreover I set the
curvature parameter of the value function ( ) and the loss aversion coefficient ( ) to respectively
088 and 225 based on experimental estimates from CPT (Tversky and Kahneman 1992)
7 To be more precise the value used here is the expectation of the option payoff at expiring yielded by the BS
model (ie the nondiscounted BS value) Consistent with this specification the probability measure IP used to
derive the subjective value in (6) is the risk neutral probability measure Moreover ignoring the probability
weighting feature (ie 1a ) this setting allows the subjective value implied by the model to converge towards
the risk neutral value (ie BS value) when the preferences of the employee tend to risk neutrality
(ie 1 ) 8 The integrals in (62) (63) and (64) were computed numerically
12
Figure-1 Option value against the stock price This figure is
a plot of the subjective value computed under different
probability weighting parameters (the blue curves) It
illustrates the profile of the subjective value compared to that
of the risk neutral value (red curve) The Parameters used
are T=4 K=100 σ=30 r=3 q=0 =225 α=088
Figure-2 Sensitivity to probability weighting This figure is
a plot of the partial derivative of the subjective value with
respect to ldquoardquo against both ldquoardquo and the stock price volatility
ldquoσrdquo It exhibits the local effect of probability weighting given
the payoff distribution skewness captured by ldquoσrdquo The
derivative was computed numerically based on the following
parameters T=4 K=S=100 r=3 q=0 =225 α=088
Furthermore in order to calibrate the probability weighting function I used three different values of
the parameter a within the range of values estimated in the experimental literature9
Figure 1 depicts the option value as a function of the stock price The three blue curves represent
the value profiles from the perspective of three CPT employees with the same value function and
different degrees of probability weighting At first sight depending on the degree of probability
weighting and the option moneyness (S
K) the subjective value could lie either under or below the BS
value In contrast standard EUT-based models predict that the option value from a risk-averse
employee perspective is systematically lower than the risk-neutral value (Hall and Murphy 2002
Henderson 2005) These preliminary results are consistent thought with some empirical findings
suggesting that frequently employees are inclined to overestimate the value of their stock-options
compared with the BS value (Lambert and Larcker 2001 Hodge et al 2006 Sawers et al 2006
Hallock and Olson 2006 Devers et al 2007)
9 Tversky and Kahneman (1992) got 065 on average (a=061 for gains and b=069 for losses) These results are
corroborated by Abdellaouirsquos (2000) findings (a=060 for gains and b=070 for losses hence an average of 065)
In addition Camerer and Ho (1994) obtained a=056 for gains whereas Gonzales and Wu (1996) and Bleichrodt
and Pinto (2000) found a=071 and a=067 respectively
13
The results presented in figure 1 show that the option subjective value is increasing in probability
weighting degree (ie decreasing in parameter a ) Actually given the asymmetric profile of the option
payoff the expectation a
E
in the subjective value formula (6) is positively affected by the emphasis
put on the tail of the payoff distribution which is governed by the parameter a the lower a the more
overweighed will be small probabilities and the more underweighted will be medium to large
probabilities This lottery-like nature of an option combining large gains with small probabilities may
make it attractive to a CPT employee subject to probability weighting This preliminary outcome leads
to proposition 1 which stats that
Proposition 1 the value of the stock option contract to a CPT- employee is increasing with
respect to his degree of probability weighting (ie is decreasing with respect to a)
(Proofs are provided in appendix A)
Moreover the effect of probability weighting is expected to increase with the skewness of the
distribution of the underlying stock price which is captured by the volatility parameter given the
Log-normality assumed in the model In order to show that I performed a numerical analysis of the
sensitivity of the subjective value to the probability weighting degree as a function of the volatility
and the parameter a This sensitivity is defined as the partial derivative of subjective value with
respect to a (a
C
a
) The results are reported in figure 2 in the form of a graph It shows that the
sensitivity to parameter a is negative and locally decreasing in volatility That means that the more the
share price is volatile the more the option will be attractive for a CPT employee subject to probability
weighting This supports Spaltrsquos (2008) findings that the effect of probability weighting provides an
economic rationale to riskier firms (ie more volatile firms) for granting more stock options to non-
executive employees
Furthermore I investigate the effect of loss aversion on the subjective value The variable of
interest here is In an analogical sense with the EUT framework the option value from the
perspective of a loss-averse employee is expected to decrease with his degree of loss-aversion To
verify this I computed numerically the first order derivative with respect to (
aC
) crossed over
various levels of and moneyness ranging from 005 to 1 and from 5 to 200 respectively The
outcome is reported in figure 3 It shows that the sensitivity to loss aversion is negative and locally
decreasing in moneyness That means that the more the employee is loss averse the less would the
option be worth to him This conclusion is taken up in proposition 2 hereafter
14
Figure-3 Sensitivity to loss aversion This figure is a plot of the
partial derivative of the subjective value with respect to ldquoλrdquo
against both ldquoλrdquo and the stock price ldquoSrdquo It exhibits the local effect
of loss aversion given the option moneyness The derivative was
computed numerically based on the following parameters T=4
σ=30 K=100 r=3 q=0 a=065 α=088
Figure-4 Sensitivity to the curvature parameter This figure is a
plot of the partial derivative of the subjective value with respect to
ldquoαrdquo against both ldquoαrdquo and the stock price ldquoSrdquo It exhibits the local
effect of the curvature parameter given the option moneyness The
derivative was computed numerically based on the following
parameters T=4 σ=30 K=100 r=3 q=0 a=065 λ =225
Proposition 2 the value of the stock option contract to a CPT- employee is decreasing with
respect to his degree of loss-aversion (ie a decreasing function of λ)
(Proofs are provided in appendix B)
I performed a similar analysis in order to get a view on the effect of the curvature parameter In
the same way I assessed locally the first order derivative with respect to within a range of values
from 005 to 1 and using share prices ranging from 10 to 200 Figure 4 shows that this derivative is
locally increasing with the option moneyness for values of above say 075 It also shows broadly
that the subjective value is an increasing monotone function of over a range of values around the
experimental estimate of 088 (from 07 to 1) irrespective of the option moneyness
2 Incentives from stock-options
Stock-options are incentive tools used within a principal-agent relationship to align the interests of
the agent (employee) on those of the principal (shareholders) The shareholders grant stock options in
15
order to provide the employee with incentives to make efforts that enhance the value of the firm and
thus their own wealth Indeed assuming that employees are aware of how their actions affect the share
price option holdings will prompt them to make efforts that increase share price Therefore the
incentive from a single option grant will depend on the degree of the sensitivity of the subjective value
to the stock price
21 The incentive measure
Following Jensen and Murphy (1990) Hall and Murphy (2000 2002) and others I defined the
incentive effect as the first order derivative of the subjective value with respect to share price (
aC
S
)
which defines how the value from the employee perspective changes with an incremental change in
the stock price As we can see in figure 5 which is a plot of
aC
S
for three values of a incentives
are greatest for in-the-money10
options Also the incentive effect is increasing with the degree of
probability weighting Another observation that can be made from figure 5 is that for sufficiently high
level of probability weighting the option can give much more incentive to increase stock price than is
reflected by the BS delta This is consistent with my previous finding that the subjective value can
overstate the BS value Note that consistently with the EUT-based models when the employee
process probabilities in a linear way ( 1a ) - which means that the probability weighting assumption
is relaxed and only loss-aversion matters - the incentives lie strictly under the BS delta whatever the
level of the option moneyness That is to say that the options are less attractive for both risk-averse
employee and loss-averse employee who are not subject to probability weighting The analysis in
figure 6 supports this It shows that with a hold constant at 065 incentives are decreasing in loss-
aversion Conversely with loss-aversion parameter set to 1 which means that the loss-aversion
effect is neutralized incentives for a representative loss-neutral employee with a degree of probability
weighting equal to experimental estimate of 065 overstate the BS delta
10
The terminology ldquoat-the-moneyrdquo is referring to stock-options with an exercise price equal to the stock price at
inception The expressions ldquoOut-of- the-moneyrdquo and ldquoIn-the-moneyrdquo are also used throughout the paper to refer
to options with strike price respectively below and above the grant date stock price
16
Figure-5 The effect of probability weighting on stock-option
incentives This figure is plots of the partial derivative of the
subjective value with respect to stock price ldquoSrdquo against the option
moneyness It exhibits the combined effects of probability
weighting and option moneyness on incentives The derivatives
were computed numerically assuming three different levels of
probability weighting (see the legend above) and holding the
remaining parameters constant at the following values T=4
σ=30 K=100 r=3 q=0 λ=225 α=088
Figure-6 The effect of loss-aversion on stock-option incentives
This figure is plots of the partial derivative of the subjective value
with respect to stock price ldquoSrdquo against the option moneyness It
exhibits the combined effects of loss-aversion and option
moneyness on incentives The derivatives were computed
numerically assuming three different levels of loss-aversion (see
the legend above) and holding the remaining parameters constant
at the following values T=4 σ=30 K=100 r=3 q=0
a=065 α=088
22 Implications for stock option design optimal strike price
Setting the strike price of standard stock options boils down to defining the threshold against which
the performance is assessed and consequently to determining the likelihood of a final payout As we
have just noticed from figure 5 and figure 6 incentives increases in the option moneyness and
equivalently decreases with strike price In parallel from the shareholders perspective granting in-
the-money options is much more costly than granting out-of-the money or at-the-money options
(recall figure 1) This leads the firm to a trade-off to make when setting the exercise price of the
options in the sense that holding his cost unchanged she could either grant fewer options at a low
strike price or increase the grant size at higher exercise price
I relied on the methodology from Hall and Murphy (2002) in figuring out the optimal exercise price
satisfying the double purpose of maximizing incentives and holding constant the firmrsquos cost of
granting options I also considered two situations In the first situation the firm does not adjust the
existing compensation package when grating additional stock options Thus these additional options
are considered as a pure add-on to existing compensation In the second situation however the
employee and the firm are allowed to bargain efficiently over the terms of the compensation Thus the
17
firm is assumed to fund additional options by an adjustment to other compensation components that
leaves the employee indifferent between his initial package and the new package including the
additional grant
221 Situation 1 Option grant without a compensation offset
When the firm is not allowed to adjust the existing compensation package the optimal strike price
that maximizes incentives for a given amount of firm cost is the solution to the following constrained
optimization problem
m ax
a
K
nC K
S
such that n K c (7)
Where a
nC K
S
denotes the incentives from receiving n options with a strike price K and
K the per-unit cost or the BS value of one option
The optimization problem in (7) is solved numerically by varying the parameter K First the BS
value is computed for a given K which enable to determine the grant size n that leaves the firm cost
constant at c in accordance with the constraint in (7) Then the cost function a
nC K
S
is assessed
based on n and K This procedure is reiterated recursively until the optimal value of K is found
I set the total cost for the firm at euro28 333c (hence a grant of 1000n at-the-money options
based on the retained option-related parameters) As reported in figure 7 I varied the preferences-
related parameters a and within specific ranges in order to figure out the conditions under which an
optimal strike may exist and the robustness of the model predictions The chart on the left-hand side
exhibits the total incentives from the grant as a function of the strike price and the probability
weighting parameter with the loss-aversion held constant at 225 It shows that the convexity and
the monotony of the total incentives function ( a
nC K
S
) shift with the degree of probability
weighting while it is concave and non-monotone over the range of strike prices for low levels of
probability weighting ( 0906a ) it becomes convex and monotonically increasing for higher levels
Moreover for higher level of volatility probability weighting is expected to affect more deeply the
shape of total incentives function (recall figure 2)
Specifically when the effect of probability weighting prevails (ie dominates that of loss-aversion)
the model predicts that incentives could be infinitely increased by granting more and more options at
higher and higher strikes This result suggests that if the employee is subject to a degree of probability
18
weighting that could potentially lead him to overstate the value of the option in excess of the BS value
he would ask for the maximum number of options (as much options as the company could possibly
grant him) at their (highest) breakeven strike the higher the strike price the more small probabilities
of large gains there are and the more valuable become options to him Furthermore this means that
such an employee would be much more interested in premium options instead of discount options
Actually although this result is in stark contrast with the common stock-based compensation practices
that consist in granting broadly at-the-money options it shouldnrsquot be rejected without taking into
account the other factors restricting the number of options the company could issue irrespective of
their strike prices such like capital dilution limits
In addition as we can notice from the plot in the middle of figure 7 the effect of probability
weighting on total incentives could be offset by an increasing loss-aversion This time is varied and
a held constant at 065 which meets the experimental estimate When the loss-aversion effect
dominates the total incentives function tends to non-monotone concave shapes which means that it
admits finite extremas In particular when probability weighting effect is neutralized by setting 1a -
in other words the employee is not subject to probability weighting - total incentives curve tends to
flatten around the optimum (see the green curves on the right-hand side plot) This suggests that there
exists a range of strike prices that yield quasi-similar incentives For instance with loss-aversion set
at 225 optimal strike (as of stock price at inception) is about 142 and lies within a range of
values from 121 to 153 that yield total incentives of about euro530 (rounded figure) With 6
the optimal strike drops by almost 30 (to 112) and total incentives are flat around the maximum
value of euro450 within the range from 91 to 111 Note that these results are consistent with Hallrsquos
and Murphyrsquos (2000 2002) findings relying on the EUT framework Consistently their work
documented that incentive-maximizing strike price exists when the options are considered as an add-
on to existing compensation In addition they showed that total incentives are relatively flat around
the maximum and that optimal strike price decreases for more risk-averse and less diversified
employees
19
Figure-7 Incentives from options grant with total cost of euro28 333 assuming no adjustment to existing compensation package This figure is plots of
incentives (in Keuro) from options grant for a given strike price holding the total BS value of the grant constant at euro28 333 Total incentives are defined as the
partial derivative of the total subjective value of the grant with respect to stock price ldquoSrdquo The sub-figure on the left-hand side depicts total incentives as a
function of the strike price and probability weighting parameter That in the middle is a plot of total incentives against strike price and loss-aversion The
sub-figure on the right-hand side exhibits the combined effect of probability weighting and loss-aversion on the shape of total incentives as a function of
strike price The derivatives were computed numerically based on the following parameters T=4 σ=30 S=100 r=3 q=0 α=088
222 Situation 2 Option grant with an adjustment to existing compensation
Now letrsquos considerer that the company is allowed to make an efficient adjustment to existing
compensation components (cash for example) in order to grant additional options to the employee
The impact of this adjustment should be neutral with regard to the total compensation cost for the
company Moreover assuming this adjustment involves cash compensation it must be attractive to the
employee so that hersquod be willing to give up some cash compensation against extra options grant
Therefore it must leave the employee at his initial total subjective value of the compensation package
It follows that the strike price that maximizes total incentives for a given company cost is the solution
of this following optimization problem
m ax
a
K
nC K
S
subject to a
n K nC K c
and 0n (8)
20
Where c is a fixed constant The constraint in (8) is the aggregation of the company cost constraint
and the employee value constraint used in Henderson (2005)
Similar to that in (7) this optimization problem was solved numerically In this analysis c was
chosen such that for retained parameters the number of granted at-the-money options n is around
1000 hence total cost of euro28 333 Once c is set n is determined from the constraint in (8) for a given
strike price K S then total incentives
anC K
S
are assessed These are depicted in figure 8
The left-hand side sub-figure exhibits total incentives for different levels of K and probability
weighting parameter a with risk aversion held constant at 225 For each combination of K and
a the constraint in (8) is solved for n which allows to determine total incentives The plots indicate
that when the employee is deeply subject to probability weighting ( 0475a )
anC K
S
is
strictly decreasing throughout the depicted range of strike prices (see the curves in blue) In this case
similar to EUT-based studiesrsquo findings (Hall and Murphy 2002 Henderson 2005) incentives are
maximized through restricted stocks grant rather than stock options The intuitive reason behind that
is given that the employee systematically values the options in excess of their BS value efficient
trade-off over compensation allocation is made via the grant of equity-based instruments that
employee values at their actual cost restricted stocks for instance
However for lower degrees of probability weighting (typically 0475 085 a ) the optimal
strike price is not nil and tends to increase with a Specifically the optimization problem is defined
on the right (see the red solid curve) or on the left (see the red dashed curve) of the optimal
strike
K and
anC K
S
admits an infinite branch in
K (ie total incentives are infinite at that
point) The technical reason behind that is that the subjective value is equal to the BS value at the
optimal strike which yields according to the constraint in (8) an infinite grant size
(
lim
K K
n K ) For instance
K ranges from 60 to 195 when a takes values within a range
of value around the experimental estimates ( 055 070a )11
This suggests that depending on the
extent to which employee weights probabilities either grants of discount options or premium options
may result in a Pareto optimum to the contract As a specific example for an employee with
0616a the optimal strike price
K is around 100 which means that for the prevailing setting
the model predicts at-the-money options as optimal in an efficient contracting framework since the
companyrsquos cost of granting these options is equal to their value to the employee In this case granting
11
Optimal strikes are expected to be lower for higher stock price volatility since probability weighting effect
tends to increase with volatility (recall figure 2)
21
options with strike price around the stock price at inception which is consistent with observed
practices results in a perfect reconciliation of the company and the employee respective views Note
that for a similar setting in the previous situation where the options are given as an add-on to existing
compensation the model indicates that incentives from stock options could be infinitely increased by
granting increasingly more options at greater and greater strike price
Furthermore for weak degrees of probability weighting ( 085 a ) the subjective value of the
option lies strictly below the BS value because the effect of loss-aversion tends to dominate that of
probability weighting Thus the total incentives function takes a non-monotone concave shape and
shows finite extremas ranging from 35 to 81 In particular when probability weighting assumption
is relaxed ( 1a ) the function flattens around the maximum and approaches a monotone decreasing
shape with increasing loss-aversion (see sub-figure on the right-hand side) This result suggests that
loss-averse employees who are not subject to probability weighting - even with very low degree of
probability weighting - receiving options at high exercise price would willingly accept a cut in cash
compensation to receive instead deep discount options or restricted shares for those of them displaying
more loss-aversion Again this is broadly consistent with Hallrsquos and Murphyrsquos (2002) and
Hendersonrsquos (2005) findings for non-diversified risk-averse employees
Last but not least the sub-figure in the middle of the main figure is plots of total incentives against
the strike price each of them corresponds to a given level of loss-aversion The purpose of this
analysis consists in showing the effect of loss-aversion on
K by holding a constant at 065 and
varying It mainly shows that loss-aversion has an effect opposite to that of probability weighting
when probability weighting effect is dominant12
(ie the employee may potentially put overstated
value in the option specifically for high strikes) optimal strike increases and total incentives decreased
with loss-aversion Conversely when loss-aversion effect is dominant as stated before the model
yields predictions comparable to that of the EUT-based models
12
See the limit case of 1 where risk-aversion is ignored (the blue dashed curve)
22
Figure-8 Incentives from options grant with total cost of euro28 333 assuming cash compensation is adjusted This figure is plots of incentives (in Keuro) from options grant
for a given strike price holding the total compensation value constant from both company and employee perspectives Total incentives are defined as the partial
derivative of the total subjective value of the grant with respect to stock price ldquoSrdquo The sub-figure on the left-hand side depicts total incentives as a function of the strike
price for varying levels of probability weighting parameter That in the middle is a plot of total incentives against strike price for varying levels of loss-aversion The
sub-figure on the right-hand side exhibits the sole effect of loss-aversion (with no probability weighting) on the shape of total incentives as a function of strike price The
derivatives were computed numerically based on the following parameters T=4 σ=30 S=100 r=3 q=0 α=088
3 Do stock-options provide incentive for risk taking
Earlier studies (Agrawal and Mandelker 1987 DeFusco et al 1990 Hirshleifer and Suh 1992)
have built on insights from standard option pricing theory to predict that option-compensated
managers will be motivated to increase the asset variance and leverage of their firms because the
convexity of the option payoff increase its value as the volatility of the stock price increases Lambert
et al (1991) was the first to call into question this assertion They proved that a non-diversified risk-
averse executive may not necessarily take actions that increase stock price volatility because that
parameter of the distribution of the stock price has two conflicting effects on the subjective value of
the option a positive effect implied by the payoff convexity and a negative effect due to the concavity
of the executiversquos utility function Henderson (2005) draws conclusions from a EUT-base model
consistent with these findings Specifically she finds that stock-options provide incentives for a risk-
averse manager to increase the beta of the company (ie the market risk-to-firm specific risk ratio)
rather than total risk Although there is some empirical evidence supporting the prediction that stock-
options do not systematically encourage risk taking it is still very scarce13
13
See for instance Cohen et al(2000) and Rajgopal and Shevelin (2002)
23
Figure-9 The effect of loss-aversion and probability weighting on risk-taking incentives implied by stock-options This figure is plots
of the partial derivative of the subjective value with respect to stock price volatility ldquoσrdquo against the option moneyness It exhibits on
the one hand the combined effects of loss-aversion and option moneyness (chart on the right-hand side) and on the other hand the
combined effects of probability weighting and option moneyness (chart on the left-hand side) on risk-taking incentives The derivatives
were computed numerically assuming three different levels of loss-aversion and probability weighting (see the legends above) and
holding the remaining parameters constant at the following values T=4 σ=30 K=100 r=3 q=0 α=088
I revisited the risk taking incentives issue from the perspective of an executive with CPT
preferences Similar to previous studies I defined incentives for risk taking as the first order derivative
of the subjective value in (6) with respect to volatility (a
C
)
14 In order to figure out the link
between risk-taking incentives from stock-options and the parameters related to preferences I
performed a numerical analysis on the sensitivity of a
C
to loss-aversion and probability weighting
The results are reported in figure 8 hereafter
The left-hand side subfigure is plots of a
C
as a function of the stock price for several degrees
of probability weighting with loss-aversion held constant at 225 The purpose of the underlying
analysis is to figure out broadly the extent to which a loss-averse executive subject to probability
weighting would prefer a high or low risk given the way the latter influences the option value from his
own perspective The first essential result from this analysis is that incentives for risk taking are
14
Actually the sensitivity of the subjective value to a parameter of the probability distribution of the stock price
provides a measure of the executive incentive to make decisions that influence that parameter
24
increasing with probability weighting degree In fact the probability weighting leverages the positive
effect of volatility on the subjective value through the convexity of the option payoff Another
observation that could be made is that for sufficiently high degree of probability weighting
( 070a )a
C
lies strictly above the conventional BS Vega over the retained range of stock prices
(see the red and the green curves) This means that an option-compensated CPT-executive subject to
probability weighting may be more prompted than a risk-neutral executive to act in order to increase
assets volatility Note that for typical setting of a at 065 the model predicts that a CPT-executive
with a such preferences calibration will have incentives to act in order to increase the volatility of the
stock price by 1 if he targets a 87 cts - increase of the value of his at-the-money 4-year option
In addition when probability weighting is ignored by setting 1a only the effect of loss-aversion
on risk taking incentives is captured The analysis of this effect is reported in the subfigure on the
right-hand side More explicitly this subfigure exhibits plots of a
C
for several levels of with
probability weighting effect neutralized It shows mainly that risk-taking incentives from stock-options
are decreasing with loss-aversion Moreover it appears that a
C
turns negative over a given range
of stock prices where the option is in-the-money Therefore consistent with findings from EUT-based
models the CPT model predicts that a loss-averse executive who is not subject to probability
weighting may not prefer an increase in the variance of the company stock price return As a specific
example an executive with a loss-aversion parameter 6 who processes probabilities in a linear
way (see the yellow curve) and holds 4-year stock options will have incentives to decrease rather than
increase the volatility of the company stock price if the stock price is above 130 the strike price of
his options
In essence incentives for risk taking from stock options - defined as the sensitivity of the
subjective value to the stock price volatility - is subject to two opposite effects under the CPT-based
model a positive effect from the convexity of the optionrsquos payoff leveraged by the probability
weighting feature and a negative effect from the loss-aversion coefficient Therefore there is a mixed
effect on risk taking incentives depending on which of the two effects dominates This will depend
obviously on the option moneyness and the other option-specific parameters
Conclusion
This paper proposes an alternative theoretical model of stock option subjective value to analyze
their incentive effects for employees The model predictions ascertain the ability of CPT to explain
some prominent incentive patterns that EUT models have difficulties to capture It mainly provides
25
arguments on the well documented tendency of employees to frequently value - under some
circumstances - their options in excess of their cost to the company Specifically these results
highlight the economic rational for firms in particular those with higher risk to widely use stock
options in non-executive employee compensation (Spalt 2008)
Loss aversion and probability weighting are the key features driving the subjective value in the
CPT model These parameters have countervailing effects on the modeled subjective value Depending
on which of them is dominant in the preferences calibration the model yields different predictions
regarding incentives Specifically consistent with some behavioral patterns observed in many surveys
and experimental studies on equity-based compensation the model predicts that when the probability
weighting feature prevails the subjective value may overstate the risk-neutral value of the option In
this case assuming the company and the employee bargain efficiently over the compensation
components incentives are maximized for strike prices set around the stock price at inception for a
representative employee with preferences calibration meeting the experimental estimates from CPT
(Tversky and Kahneman 1992) Obviously this finding is consistent with companiesrsquo actual
compensation practices Moreover executives with such preferences profile may be prompted to act in
order to increase share price volatility However when the emphasis is put on the loss-aversion
feature by relaxing the probability weighting assumption the model yields results comparable to
those of EUT-based models In particular the model predicts that loss-averse employees who are not
subject to probability weighting or even with very low degrees of probability weighting receiving
options at high exercise price would willingly accept a cut in compensation to receive instead deep
discount options or restricted shares for those of them displaying more loss-aversion Furthermore the
model shows that loss-averse executives who are processing probabilities in a linear fashion may not
prefer an increase in the variance of the company stock price return
Despite their practical interest the conclusions from the results of this research should not be
drawn without underlining some of its limitations The first one concerns the specification of the CPT
model Actually although the reference point specification in the model is consistent with both
empirical evidence on people setting reference points in a dynamic fashion and firmsrsquo widespread use
of the BS value as a standard for Financial and Human Resources disclosers empirical and
experimental literature is still silent on how people set reference points when assessing complex
gambles like stock option payoffs In addition to keep the model tractable only European-style
options were studied in this paper The model is still however easily extendable to Bermudian-style
options using numerical schemes such like lattice approaches The other limitation of this study is
related to the large heterogeneity in probability weighting that may exist across individuals (Wu and
Gonzalez 1996) The Tverskyrsquos and Kahnemanrsquos (1992) weighting function used in the model
provides only a fit to the median profile
26
Finally this work highlights - as did some previous eminent researches in this field (Dittmann et
al 2008 Splat 2008) - a number of future promising research directions in equity-based
compensation incorporating CPT framework For instant exploring the ability of CTP to explain the
growing use of performance shares plans instead of stock options in employee compensation would be
of great interest for future research Furthermore given that several empirical studies has documented
that employee stock option exercise behavior is also driven by behavioral factors a promising research
direction incorporating CPT is studying its ability to predict exercise patterns
Appendix A proofs of proposition 1
This appendix provides heuristic proofs of proposition 1
To prove that the subjective value a
C
is decreasing in 028 1a it is sufficient to show that
the expectation a
E
is a decreasing function of a Letrsquos first rewrite the expectation in (6) as follows
=
a aIP T IP T
x
a
IR
E v h E v h g x
w x u du x dx
Where
1
2 1
2
g x K x l
w x K g x l x l
x l
with 0 1 and 1 (A1)
Since w x
is derivable over 1IR l an expansion in Taylor series at the first order gives
w x w y x y w y
with 1y IR l
Introducing the expectation operator with respect to the transformed probability measure we have
a aIP IP
x
IP a
E w x w y E x y w y
w y E x u du y w y
(A2)
27
Since w x
is monotone increasing in x we have 0w y Then it follows from (A2) that
proving that a
E
is locally decreasing with respect to a in 1y IR l boils down to showing that
0
x
IP aE x u du
a
(A3)
Noting that
x
au du is positive and convex with respect to 1 1
x l l we
have according to Jensen inequality
IPE xx
IP a IP aE x u du E x u du
Since x follows a standard normal distribution which is symmetric in 0IP
E x we get from
the inequality above by substituting IPE x in the right hand side
0
x
IP aE x u du (A4)
Note that the result in (A4) above showing that the expectation under the transformed
probabilities overstates that under the original probabilities is a consequence of the probability
weighting function feature stated in sect112 which consists in infinitely-overweighting infinitesimal
probabilities and infinitely-underweighting near-one probabilities
Furthermore noting that the convexity of
x
au du with respect to 1 1
x l l
is decreasing in a and using the result in (A4) we have for 028 1 a b
IP IPE x E xx x
IP a IP a IP b IP bE x u du E x u du E x u du E x u du
Or equivalently
x x
IP a IP bE x u du E x u du (A5)
28
This proves that the condition in (A3) holds which means that a
C
is a decreasing function of
028 1a QED
Appendix B proofs of proposition 2
Taking the derivative of the subjective value function in (6) with respect to λ yields
1
1
1
1
1 0
1
a rT
a a
a
a a a rT
EE e if E
C
E E Ee otherw ise
(B1)
Where
1 2 3
a a a aE I I I
(B2)
Using the formulas in equations from (62) to (64) we can rewrite the derivatives in (B2) as follows
1
0
aI
1
2
2
l x
a
a
l
IK g x u du x dx
23
l
a
a
Ix dx
Then substituting these results in place of the derivatives in (B2) we obtain
1 2
2
l lx
a
a a
l
EK g x u du x dx x dx
(B3)
Given that
0
aE
we conclude that
aC
is nonpositive This implies that
aC
is a decreasing
function of QED
29
References
Abdellaoui M (2000) ldquoParameter-Free Elicitation of Utility and Probability Weighting Functionsrdquo
Management Science Vol 46 No 11 pp 1497-1512
Agrawal A Mandelker G (1987) ldquoManagerial incentives and corporate investment and financing
decisionsrdquo Journal of Finance Vol 42 No 4 pp 823-837
Bahaji H (2009) ldquoLe comportement drsquoexercice des porteurs de stock-options une eacutetude empirique
sur le marcheacute Ameacutericainrdquo Working Paper DRM Finance- Universiteacute de Paris Dauphine Paris June
2009
Barberis N and Thaler R(2003) ldquoA survey of behavioral financerdquo in Constantinides G Harris M
and Stulz R (Ed) Handbook of the Economics of Finance North-Holland Amsterdam
Bleichrodt H and Pinto JL (2000) ldquoA Parameter-Free Elicitation of the Probability Weighting
Function in Medical Decision Analysisrdquo Management Science Vol 46 No 11 pp 1485-1496
Cai J and Vijh AM (2004) ldquoExecutive stock and option valuation in a two state variable
framework allowing optimal investment of outside wealth in the risk-free asset and the market
portfoliordquo Working Paper University of Iowa
Camerer C and Ho TH (1994) ldquoViolations of Betweenness Axiom and Nonlinearity in
Probabilityrdquo Journal of Risk and Uncertainty Vol8 No 2 pp 167-196
Cohen RB Hall BJ and Viceira LM (2000) ldquoDo executive stock options encourage risk taking
rdquo Working Paper Harvard Business School
Cook P and Clotfelter C (1993) ldquoThe peculiar scale economies of lottordquo American Economic
Review Vol 83 No3 pp 634-643
DeFusco R Johnson R and Zorn T (1990) ldquoThe effect of executive stock option plans on
stockholders and bondholdersrdquo Journal of Finance Vol45 No 2 pp 617-627
Detemple J and Sundaresan S (1999) ldquoNontraded asset valuation with portfolio constraints a
binomial approachrdquo Review of Financial Studies Vol 12 No 4 pp 835ndash872
Devers C Wiseman R and Holmes M (2007) ldquoThe effects of endowment and loss aversion in
managerial stock option valuationrdquo Academy of Management Journal Vol 50 No 1 pp 191-208
Dittmann I and Maug E (2007) ldquoLower salaries and no options On the optimal structure of
Executive payrdquo The Journal of Finance Vol 62 No 1 pp 303-343
Gneezy U (1998) ldquoUpdating the Reference Level Experimental Evidencerdquo Working paper
University of Haifa
Hall B and Murphy K (2000) ldquoOptimal Exercise prices for executive stock optionsrdquo American
Economic Review Vol 90 No 2 pp 209-214
30
Hall B and Murphy K (2002) ldquoStock options for undiversified executivesrdquo Journal of Accounting
and Economics Vol 33 No 2 pp 3-42
Hallock K and Olson G (2006) ldquoThe value of stock options to non-executive employeesrdquo Working
Paper No 11950 National Bureau of Economic Research Cambridge
Heath C Huddart S and Lang M (1999) ldquoPsychological factors and stock option exerciserdquo
Quarterly Journal of Economics Vol 114 No 2 pp 601-628
Heisler J(1994) ldquoLoss aversion in a futures market an empirical testrdquo Review of Futures Markets
Vol 13 No 3 pp 793ndash822
Henderson V (2005) The impact of the market portfolio on the valuation incentives and optimality
of executive stock options Quantitative Finance Vol 5 No 1 pp 35-47
Hirshleifer D and Suh R (1992) ldquoRisk Managerial Effort and Project Choicerdquo Journal of
Financial Intermediation Vol 2 No 3 pp 308-345
Hodge F Rajgopal S and Shevlin T (2006) ldquoHow do managers value stock options and restricted
stock rdquo Working Paper University of Washington
Holmstrom BR and Milgrom PR (1987) ldquoAggregation and linearity in provision of intertemporal
incentivesrdquo Econometrica Vol 55 No 2 pp 303-328
Huddart S and Lang M (1996) ldquoEmployee stock option exercises an empirical analysisrdquo Journal
of Accounting and Economics Vol 21 No 1 pp 5-43
Jensen M and Murphy KJ (1990) ldquoPerformance pay and top-management incentivesrdquo Journal of
Political Economy Vol 98 No 2 pp 225-264
Jenter D (2001) ldquoUnderstanding high-powered incentivesrdquo Working Paper Harvard Business
School and Economics Departement
Johnson SA and Tian YS (2000) ldquoThe value and incentive effects of non-traditional executive
stock option plansrdquo Journal of Financial Economics Vol 57 No 1 pp 3-34
Jullien B and Salanie B (2000) ldquoEstimating preferences under risk The case of racetrack bettorsrdquo
Journal of Political Economy Vol 108 No 3 pp 503-530
Kachelmeier S and Shehata M (1992) ldquoExamining risk preferences under high monetary incentives
experimental evidence from the Peoplersquos Republic of Chinardquo American Economic Review Vol 82
No 5 pp 1120-1141
Kahneman D and Tversky A (1979) ldquoProspect Theory An analysis of decision under riskrdquo
Econometrica Vol 47 No 2 pp 263-292
Lambert R Lanen W and Larcker D (1989) ldquoExecutive stock option plans and corporate dividend
policyrdquo Journal of Financial and Quantitative Analysis Vol 24 No 4 pp 409-424
Lambert R Larcker D and Verrecchia R (1991) ldquoPortfolio considerations in valuing Executive
Compensationrdquo Journal of Accounting Research Vol 29 No 1 pp 129-149
Lambert R and Larcker D (2001) ldquoHow do employees value (often incorrectly) their stock optionsrdquo
available at knowledgewharton
31
Lewellen W Loderer C and Martin K (1987) ldquoExecutive compensation and executive incentive
problem an empirical analysisrdquo Journal of Accounting and Economics Vol 9 No 3 pp 287-310
Loughran T and Ritter J (1995) ldquoThe new issue puzzlerdquo Journal of Finance Vol 50 No 1 pp 23-
51
Markowitz H (1952) ldquoThe utility of wealthrdquo Journal of Political Economy Vol 60 No 2 pp 151-
158
Odean T (1998a) ldquoAre Investors Reluctant to Realize their Lossesrdquo Journal of Finance Vol 53
No 5 pp 1775ndash1798
Rajgopal S and Shevlin T (2002) ldquoEmpirical evidence on the relation between stock option
compensation and risk askingrdquo Journal of Accounting and Economics Vol 33 No 2 pp 145-171
Shefrin H and Statman M (1985) ldquoThe disposition to sell winners too early and ride losers too long
theory and evidencerdquo Journal of Finance Vol 40 No 3 pp 777-790
Sawers K Wright A and Zamora V (2006) ldquoLoss aversion stock-based compensation and
managerial risk-seeking behaviorrdquo paper presented at the AAA 2007 Management Accounting
Section Meeting available at httpssrncom abstract=864224
Thaler R (1999) ldquoMental Accounting Mattersrdquo Journal of Behavioral Decision Making Vol 12 No
3 pp 183-206
Thaler R and Ziemba W (1988) ldquoParimutuel betting markets Racetracks and lotteriesrdquo Journal of
Economic Perspectives Vol 2 No 2 pp 161-174
Tversky A and Kahneman D (1992) ldquoAdvances in Prospect Theory Cumulative representation of
uncertaintyrdquo Journal of Risk and Uncertainty Vol 5 No 4 pp 297-323
Yermack D (1997) ldquoGood Timing CEO Stock Option Awards and Company News
Announcementsrdquo Journal of Finance Vol 52 No 2 pp 449-476
Wu G and Gonzalez R (1996) ldquoCurvature of the Probability Weighting functionrdquo Management
Science Vol 42 No 12 pp 1676-1690

12
Figure-1 Option value against the stock price This figure is
a plot of the subjective value computed under different
probability weighting parameters (the blue curves) It
illustrates the profile of the subjective value compared to that
of the risk neutral value (red curve) The Parameters used
are T=4 K=100 σ=30 r=3 q=0 =225 α=088
Figure-2 Sensitivity to probability weighting This figure is
a plot of the partial derivative of the subjective value with
respect to ldquoardquo against both ldquoardquo and the stock price volatility
ldquoσrdquo It exhibits the local effect of probability weighting given
the payoff distribution skewness captured by ldquoσrdquo The
derivative was computed numerically based on the following
parameters T=4 K=S=100 r=3 q=0 =225 α=088
Furthermore in order to calibrate the probability weighting function I used three different values of
the parameter a within the range of values estimated in the experimental literature9
Figure 1 depicts the option value as a function of the stock price The three blue curves represent
the value profiles from the perspective of three CPT employees with the same value function and
different degrees of probability weighting At first sight depending on the degree of probability
weighting and the option moneyness (S
K) the subjective value could lie either under or below the BS
value In contrast standard EUT-based models predict that the option value from a risk-averse
employee perspective is systematically lower than the risk-neutral value (Hall and Murphy 2002
Henderson 2005) These preliminary results are consistent thought with some empirical findings
suggesting that frequently employees are inclined to overestimate the value of their stock-options
compared with the BS value (Lambert and Larcker 2001 Hodge et al 2006 Sawers et al 2006
Hallock and Olson 2006 Devers et al 2007)
9 Tversky and Kahneman (1992) got 065 on average (a=061 for gains and b=069 for losses) These results are
corroborated by Abdellaouirsquos (2000) findings (a=060 for gains and b=070 for losses hence an average of 065)
In addition Camerer and Ho (1994) obtained a=056 for gains whereas Gonzales and Wu (1996) and Bleichrodt
and Pinto (2000) found a=071 and a=067 respectively
13
The results presented in figure 1 show that the option subjective value is increasing in probability
weighting degree (ie decreasing in parameter a ) Actually given the asymmetric profile of the option
payoff the expectation a
E
in the subjective value formula (6) is positively affected by the emphasis
put on the tail of the payoff distribution which is governed by the parameter a the lower a the more
overweighed will be small probabilities and the more underweighted will be medium to large
probabilities This lottery-like nature of an option combining large gains with small probabilities may
make it attractive to a CPT employee subject to probability weighting This preliminary outcome leads
to proposition 1 which stats that
Proposition 1 the value of the stock option contract to a CPT- employee is increasing with
respect to his degree of probability weighting (ie is decreasing with respect to a)
(Proofs are provided in appendix A)
Moreover the effect of probability weighting is expected to increase with the skewness of the
distribution of the underlying stock price which is captured by the volatility parameter given the
Log-normality assumed in the model In order to show that I performed a numerical analysis of the
sensitivity of the subjective value to the probability weighting degree as a function of the volatility
and the parameter a This sensitivity is defined as the partial derivative of subjective value with
respect to a (a
C
a
) The results are reported in figure 2 in the form of a graph It shows that the
sensitivity to parameter a is negative and locally decreasing in volatility That means that the more the
share price is volatile the more the option will be attractive for a CPT employee subject to probability
weighting This supports Spaltrsquos (2008) findings that the effect of probability weighting provides an
economic rationale to riskier firms (ie more volatile firms) for granting more stock options to non-
executive employees
Furthermore I investigate the effect of loss aversion on the subjective value The variable of
interest here is In an analogical sense with the EUT framework the option value from the
perspective of a loss-averse employee is expected to decrease with his degree of loss-aversion To
verify this I computed numerically the first order derivative with respect to (
aC
) crossed over
various levels of and moneyness ranging from 005 to 1 and from 5 to 200 respectively The
outcome is reported in figure 3 It shows that the sensitivity to loss aversion is negative and locally
decreasing in moneyness That means that the more the employee is loss averse the less would the
option be worth to him This conclusion is taken up in proposition 2 hereafter
14
Figure-3 Sensitivity to loss aversion This figure is a plot of the
partial derivative of the subjective value with respect to ldquoλrdquo
against both ldquoλrdquo and the stock price ldquoSrdquo It exhibits the local effect
of loss aversion given the option moneyness The derivative was
computed numerically based on the following parameters T=4
σ=30 K=100 r=3 q=0 a=065 α=088
Figure-4 Sensitivity to the curvature parameter This figure is a
plot of the partial derivative of the subjective value with respect to
ldquoαrdquo against both ldquoαrdquo and the stock price ldquoSrdquo It exhibits the local
effect of the curvature parameter given the option moneyness The
derivative was computed numerically based on the following
parameters T=4 σ=30 K=100 r=3 q=0 a=065 λ =225
Proposition 2 the value of the stock option contract to a CPT- employee is decreasing with
respect to his degree of loss-aversion (ie a decreasing function of λ)
(Proofs are provided in appendix B)
I performed a similar analysis in order to get a view on the effect of the curvature parameter In
the same way I assessed locally the first order derivative with respect to within a range of values
from 005 to 1 and using share prices ranging from 10 to 200 Figure 4 shows that this derivative is
locally increasing with the option moneyness for values of above say 075 It also shows broadly
that the subjective value is an increasing monotone function of over a range of values around the
experimental estimate of 088 (from 07 to 1) irrespective of the option moneyness
2 Incentives from stock-options
Stock-options are incentive tools used within a principal-agent relationship to align the interests of
the agent (employee) on those of the principal (shareholders) The shareholders grant stock options in
15
order to provide the employee with incentives to make efforts that enhance the value of the firm and
thus their own wealth Indeed assuming that employees are aware of how their actions affect the share
price option holdings will prompt them to make efforts that increase share price Therefore the
incentive from a single option grant will depend on the degree of the sensitivity of the subjective value
to the stock price
21 The incentive measure
Following Jensen and Murphy (1990) Hall and Murphy (2000 2002) and others I defined the
incentive effect as the first order derivative of the subjective value with respect to share price (
aC
S
)
which defines how the value from the employee perspective changes with an incremental change in
the stock price As we can see in figure 5 which is a plot of
aC
S
for three values of a incentives
are greatest for in-the-money10
options Also the incentive effect is increasing with the degree of
probability weighting Another observation that can be made from figure 5 is that for sufficiently high
level of probability weighting the option can give much more incentive to increase stock price than is
reflected by the BS delta This is consistent with my previous finding that the subjective value can
overstate the BS value Note that consistently with the EUT-based models when the employee
process probabilities in a linear way ( 1a ) - which means that the probability weighting assumption
is relaxed and only loss-aversion matters - the incentives lie strictly under the BS delta whatever the
level of the option moneyness That is to say that the options are less attractive for both risk-averse
employee and loss-averse employee who are not subject to probability weighting The analysis in
figure 6 supports this It shows that with a hold constant at 065 incentives are decreasing in loss-
aversion Conversely with loss-aversion parameter set to 1 which means that the loss-aversion
effect is neutralized incentives for a representative loss-neutral employee with a degree of probability
weighting equal to experimental estimate of 065 overstate the BS delta
10
The terminology ldquoat-the-moneyrdquo is referring to stock-options with an exercise price equal to the stock price at
inception The expressions ldquoOut-of- the-moneyrdquo and ldquoIn-the-moneyrdquo are also used throughout the paper to refer
to options with strike price respectively below and above the grant date stock price
16
Figure-5 The effect of probability weighting on stock-option
incentives This figure is plots of the partial derivative of the
subjective value with respect to stock price ldquoSrdquo against the option
moneyness It exhibits the combined effects of probability
weighting and option moneyness on incentives The derivatives
were computed numerically assuming three different levels of
probability weighting (see the legend above) and holding the
remaining parameters constant at the following values T=4
σ=30 K=100 r=3 q=0 λ=225 α=088
Figure-6 The effect of loss-aversion on stock-option incentives
This figure is plots of the partial derivative of the subjective value
with respect to stock price ldquoSrdquo against the option moneyness It
exhibits the combined effects of loss-aversion and option
moneyness on incentives The derivatives were computed
numerically assuming three different levels of loss-aversion (see
the legend above) and holding the remaining parameters constant
at the following values T=4 σ=30 K=100 r=3 q=0
a=065 α=088
22 Implications for stock option design optimal strike price
Setting the strike price of standard stock options boils down to defining the threshold against which
the performance is assessed and consequently to determining the likelihood of a final payout As we
have just noticed from figure 5 and figure 6 incentives increases in the option moneyness and
equivalently decreases with strike price In parallel from the shareholders perspective granting in-
the-money options is much more costly than granting out-of-the money or at-the-money options
(recall figure 1) This leads the firm to a trade-off to make when setting the exercise price of the
options in the sense that holding his cost unchanged she could either grant fewer options at a low
strike price or increase the grant size at higher exercise price
I relied on the methodology from Hall and Murphy (2002) in figuring out the optimal exercise price
satisfying the double purpose of maximizing incentives and holding constant the firmrsquos cost of
granting options I also considered two situations In the first situation the firm does not adjust the
existing compensation package when grating additional stock options Thus these additional options
are considered as a pure add-on to existing compensation In the second situation however the
employee and the firm are allowed to bargain efficiently over the terms of the compensation Thus the
17
firm is assumed to fund additional options by an adjustment to other compensation components that
leaves the employee indifferent between his initial package and the new package including the
additional grant
221 Situation 1 Option grant without a compensation offset
When the firm is not allowed to adjust the existing compensation package the optimal strike price
that maximizes incentives for a given amount of firm cost is the solution to the following constrained
optimization problem
m ax
a
K
nC K
S
such that n K c (7)
Where a
nC K
S
denotes the incentives from receiving n options with a strike price K and
K the per-unit cost or the BS value of one option
The optimization problem in (7) is solved numerically by varying the parameter K First the BS
value is computed for a given K which enable to determine the grant size n that leaves the firm cost
constant at c in accordance with the constraint in (7) Then the cost function a
nC K
S
is assessed
based on n and K This procedure is reiterated recursively until the optimal value of K is found
I set the total cost for the firm at euro28 333c (hence a grant of 1000n at-the-money options
based on the retained option-related parameters) As reported in figure 7 I varied the preferences-
related parameters a and within specific ranges in order to figure out the conditions under which an
optimal strike may exist and the robustness of the model predictions The chart on the left-hand side
exhibits the total incentives from the grant as a function of the strike price and the probability
weighting parameter with the loss-aversion held constant at 225 It shows that the convexity and
the monotony of the total incentives function ( a
nC K
S
) shift with the degree of probability
weighting while it is concave and non-monotone over the range of strike prices for low levels of
probability weighting ( 0906a ) it becomes convex and monotonically increasing for higher levels
Moreover for higher level of volatility probability weighting is expected to affect more deeply the
shape of total incentives function (recall figure 2)
Specifically when the effect of probability weighting prevails (ie dominates that of loss-aversion)
the model predicts that incentives could be infinitely increased by granting more and more options at
higher and higher strikes This result suggests that if the employee is subject to a degree of probability
18
weighting that could potentially lead him to overstate the value of the option in excess of the BS value
he would ask for the maximum number of options (as much options as the company could possibly
grant him) at their (highest) breakeven strike the higher the strike price the more small probabilities
of large gains there are and the more valuable become options to him Furthermore this means that
such an employee would be much more interested in premium options instead of discount options
Actually although this result is in stark contrast with the common stock-based compensation practices
that consist in granting broadly at-the-money options it shouldnrsquot be rejected without taking into
account the other factors restricting the number of options the company could issue irrespective of
their strike prices such like capital dilution limits
In addition as we can notice from the plot in the middle of figure 7 the effect of probability
weighting on total incentives could be offset by an increasing loss-aversion This time is varied and
a held constant at 065 which meets the experimental estimate When the loss-aversion effect
dominates the total incentives function tends to non-monotone concave shapes which means that it
admits finite extremas In particular when probability weighting effect is neutralized by setting 1a -
in other words the employee is not subject to probability weighting - total incentives curve tends to
flatten around the optimum (see the green curves on the right-hand side plot) This suggests that there
exists a range of strike prices that yield quasi-similar incentives For instance with loss-aversion set
at 225 optimal strike (as of stock price at inception) is about 142 and lies within a range of
values from 121 to 153 that yield total incentives of about euro530 (rounded figure) With 6
the optimal strike drops by almost 30 (to 112) and total incentives are flat around the maximum
value of euro450 within the range from 91 to 111 Note that these results are consistent with Hallrsquos
and Murphyrsquos (2000 2002) findings relying on the EUT framework Consistently their work
documented that incentive-maximizing strike price exists when the options are considered as an add-
on to existing compensation In addition they showed that total incentives are relatively flat around
the maximum and that optimal strike price decreases for more risk-averse and less diversified
employees
19
Figure-7 Incentives from options grant with total cost of euro28 333 assuming no adjustment to existing compensation package This figure is plots of
incentives (in Keuro) from options grant for a given strike price holding the total BS value of the grant constant at euro28 333 Total incentives are defined as the
partial derivative of the total subjective value of the grant with respect to stock price ldquoSrdquo The sub-figure on the left-hand side depicts total incentives as a
function of the strike price and probability weighting parameter That in the middle is a plot of total incentives against strike price and loss-aversion The
sub-figure on the right-hand side exhibits the combined effect of probability weighting and loss-aversion on the shape of total incentives as a function of
strike price The derivatives were computed numerically based on the following parameters T=4 σ=30 S=100 r=3 q=0 α=088
222 Situation 2 Option grant with an adjustment to existing compensation
Now letrsquos considerer that the company is allowed to make an efficient adjustment to existing
compensation components (cash for example) in order to grant additional options to the employee
The impact of this adjustment should be neutral with regard to the total compensation cost for the
company Moreover assuming this adjustment involves cash compensation it must be attractive to the
employee so that hersquod be willing to give up some cash compensation against extra options grant
Therefore it must leave the employee at his initial total subjective value of the compensation package
It follows that the strike price that maximizes total incentives for a given company cost is the solution
of this following optimization problem
m ax
a
K
nC K
S
subject to a
n K nC K c
and 0n (8)
20
Where c is a fixed constant The constraint in (8) is the aggregation of the company cost constraint
and the employee value constraint used in Henderson (2005)
Similar to that in (7) this optimization problem was solved numerically In this analysis c was
chosen such that for retained parameters the number of granted at-the-money options n is around
1000 hence total cost of euro28 333 Once c is set n is determined from the constraint in (8) for a given
strike price K S then total incentives
anC K
S
are assessed These are depicted in figure 8
The left-hand side sub-figure exhibits total incentives for different levels of K and probability
weighting parameter a with risk aversion held constant at 225 For each combination of K and
a the constraint in (8) is solved for n which allows to determine total incentives The plots indicate
that when the employee is deeply subject to probability weighting ( 0475a )
anC K
S
is
strictly decreasing throughout the depicted range of strike prices (see the curves in blue) In this case
similar to EUT-based studiesrsquo findings (Hall and Murphy 2002 Henderson 2005) incentives are
maximized through restricted stocks grant rather than stock options The intuitive reason behind that
is given that the employee systematically values the options in excess of their BS value efficient
trade-off over compensation allocation is made via the grant of equity-based instruments that
employee values at their actual cost restricted stocks for instance
However for lower degrees of probability weighting (typically 0475 085 a ) the optimal
strike price is not nil and tends to increase with a Specifically the optimization problem is defined
on the right (see the red solid curve) or on the left (see the red dashed curve) of the optimal
strike
K and
anC K
S
admits an infinite branch in
K (ie total incentives are infinite at that
point) The technical reason behind that is that the subjective value is equal to the BS value at the
optimal strike which yields according to the constraint in (8) an infinite grant size
(
lim
K K
n K ) For instance
K ranges from 60 to 195 when a takes values within a range
of value around the experimental estimates ( 055 070a )11
This suggests that depending on the
extent to which employee weights probabilities either grants of discount options or premium options
may result in a Pareto optimum to the contract As a specific example for an employee with
0616a the optimal strike price
K is around 100 which means that for the prevailing setting
the model predicts at-the-money options as optimal in an efficient contracting framework since the
companyrsquos cost of granting these options is equal to their value to the employee In this case granting
11
Optimal strikes are expected to be lower for higher stock price volatility since probability weighting effect
tends to increase with volatility (recall figure 2)
21
options with strike price around the stock price at inception which is consistent with observed
practices results in a perfect reconciliation of the company and the employee respective views Note
that for a similar setting in the previous situation where the options are given as an add-on to existing
compensation the model indicates that incentives from stock options could be infinitely increased by
granting increasingly more options at greater and greater strike price
Furthermore for weak degrees of probability weighting ( 085 a ) the subjective value of the
option lies strictly below the BS value because the effect of loss-aversion tends to dominate that of
probability weighting Thus the total incentives function takes a non-monotone concave shape and
shows finite extremas ranging from 35 to 81 In particular when probability weighting assumption
is relaxed ( 1a ) the function flattens around the maximum and approaches a monotone decreasing
shape with increasing loss-aversion (see sub-figure on the right-hand side) This result suggests that
loss-averse employees who are not subject to probability weighting - even with very low degree of
probability weighting - receiving options at high exercise price would willingly accept a cut in cash
compensation to receive instead deep discount options or restricted shares for those of them displaying
more loss-aversion Again this is broadly consistent with Hallrsquos and Murphyrsquos (2002) and
Hendersonrsquos (2005) findings for non-diversified risk-averse employees
Last but not least the sub-figure in the middle of the main figure is plots of total incentives against
the strike price each of them corresponds to a given level of loss-aversion The purpose of this
analysis consists in showing the effect of loss-aversion on
K by holding a constant at 065 and
varying It mainly shows that loss-aversion has an effect opposite to that of probability weighting
when probability weighting effect is dominant12
(ie the employee may potentially put overstated
value in the option specifically for high strikes) optimal strike increases and total incentives decreased
with loss-aversion Conversely when loss-aversion effect is dominant as stated before the model
yields predictions comparable to that of the EUT-based models
12
See the limit case of 1 where risk-aversion is ignored (the blue dashed curve)
22
Figure-8 Incentives from options grant with total cost of euro28 333 assuming cash compensation is adjusted This figure is plots of incentives (in Keuro) from options grant
for a given strike price holding the total compensation value constant from both company and employee perspectives Total incentives are defined as the partial
derivative of the total subjective value of the grant with respect to stock price ldquoSrdquo The sub-figure on the left-hand side depicts total incentives as a function of the strike
price for varying levels of probability weighting parameter That in the middle is a plot of total incentives against strike price for varying levels of loss-aversion The
sub-figure on the right-hand side exhibits the sole effect of loss-aversion (with no probability weighting) on the shape of total incentives as a function of strike price The
derivatives were computed numerically based on the following parameters T=4 σ=30 S=100 r=3 q=0 α=088
3 Do stock-options provide incentive for risk taking
Earlier studies (Agrawal and Mandelker 1987 DeFusco et al 1990 Hirshleifer and Suh 1992)
have built on insights from standard option pricing theory to predict that option-compensated
managers will be motivated to increase the asset variance and leverage of their firms because the
convexity of the option payoff increase its value as the volatility of the stock price increases Lambert
et al (1991) was the first to call into question this assertion They proved that a non-diversified risk-
averse executive may not necessarily take actions that increase stock price volatility because that
parameter of the distribution of the stock price has two conflicting effects on the subjective value of
the option a positive effect implied by the payoff convexity and a negative effect due to the concavity
of the executiversquos utility function Henderson (2005) draws conclusions from a EUT-base model
consistent with these findings Specifically she finds that stock-options provide incentives for a risk-
averse manager to increase the beta of the company (ie the market risk-to-firm specific risk ratio)
rather than total risk Although there is some empirical evidence supporting the prediction that stock-
options do not systematically encourage risk taking it is still very scarce13
13
See for instance Cohen et al(2000) and Rajgopal and Shevelin (2002)
23
Figure-9 The effect of loss-aversion and probability weighting on risk-taking incentives implied by stock-options This figure is plots
of the partial derivative of the subjective value with respect to stock price volatility ldquoσrdquo against the option moneyness It exhibits on
the one hand the combined effects of loss-aversion and option moneyness (chart on the right-hand side) and on the other hand the
combined effects of probability weighting and option moneyness (chart on the left-hand side) on risk-taking incentives The derivatives
were computed numerically assuming three different levels of loss-aversion and probability weighting (see the legends above) and
holding the remaining parameters constant at the following values T=4 σ=30 K=100 r=3 q=0 α=088
I revisited the risk taking incentives issue from the perspective of an executive with CPT
preferences Similar to previous studies I defined incentives for risk taking as the first order derivative
of the subjective value in (6) with respect to volatility (a
C
)
14 In order to figure out the link
between risk-taking incentives from stock-options and the parameters related to preferences I
performed a numerical analysis on the sensitivity of a
C
to loss-aversion and probability weighting
The results are reported in figure 8 hereafter
The left-hand side subfigure is plots of a
C
as a function of the stock price for several degrees
of probability weighting with loss-aversion held constant at 225 The purpose of the underlying
analysis is to figure out broadly the extent to which a loss-averse executive subject to probability
weighting would prefer a high or low risk given the way the latter influences the option value from his
own perspective The first essential result from this analysis is that incentives for risk taking are
14
Actually the sensitivity of the subjective value to a parameter of the probability distribution of the stock price
provides a measure of the executive incentive to make decisions that influence that parameter
24
increasing with probability weighting degree In fact the probability weighting leverages the positive
effect of volatility on the subjective value through the convexity of the option payoff Another
observation that could be made is that for sufficiently high degree of probability weighting
( 070a )a
C
lies strictly above the conventional BS Vega over the retained range of stock prices
(see the red and the green curves) This means that an option-compensated CPT-executive subject to
probability weighting may be more prompted than a risk-neutral executive to act in order to increase
assets volatility Note that for typical setting of a at 065 the model predicts that a CPT-executive
with a such preferences calibration will have incentives to act in order to increase the volatility of the
stock price by 1 if he targets a 87 cts - increase of the value of his at-the-money 4-year option
In addition when probability weighting is ignored by setting 1a only the effect of loss-aversion
on risk taking incentives is captured The analysis of this effect is reported in the subfigure on the
right-hand side More explicitly this subfigure exhibits plots of a
C
for several levels of with
probability weighting effect neutralized It shows mainly that risk-taking incentives from stock-options
are decreasing with loss-aversion Moreover it appears that a
C
turns negative over a given range
of stock prices where the option is in-the-money Therefore consistent with findings from EUT-based
models the CPT model predicts that a loss-averse executive who is not subject to probability
weighting may not prefer an increase in the variance of the company stock price return As a specific
example an executive with a loss-aversion parameter 6 who processes probabilities in a linear
way (see the yellow curve) and holds 4-year stock options will have incentives to decrease rather than
increase the volatility of the company stock price if the stock price is above 130 the strike price of
his options
In essence incentives for risk taking from stock options - defined as the sensitivity of the
subjective value to the stock price volatility - is subject to two opposite effects under the CPT-based
model a positive effect from the convexity of the optionrsquos payoff leveraged by the probability
weighting feature and a negative effect from the loss-aversion coefficient Therefore there is a mixed
effect on risk taking incentives depending on which of the two effects dominates This will depend
obviously on the option moneyness and the other option-specific parameters
Conclusion
This paper proposes an alternative theoretical model of stock option subjective value to analyze
their incentive effects for employees The model predictions ascertain the ability of CPT to explain
some prominent incentive patterns that EUT models have difficulties to capture It mainly provides
25
arguments on the well documented tendency of employees to frequently value - under some
circumstances - their options in excess of their cost to the company Specifically these results
highlight the economic rational for firms in particular those with higher risk to widely use stock
options in non-executive employee compensation (Spalt 2008)
Loss aversion and probability weighting are the key features driving the subjective value in the
CPT model These parameters have countervailing effects on the modeled subjective value Depending
on which of them is dominant in the preferences calibration the model yields different predictions
regarding incentives Specifically consistent with some behavioral patterns observed in many surveys
and experimental studies on equity-based compensation the model predicts that when the probability
weighting feature prevails the subjective value may overstate the risk-neutral value of the option In
this case assuming the company and the employee bargain efficiently over the compensation
components incentives are maximized for strike prices set around the stock price at inception for a
representative employee with preferences calibration meeting the experimental estimates from CPT
(Tversky and Kahneman 1992) Obviously this finding is consistent with companiesrsquo actual
compensation practices Moreover executives with such preferences profile may be prompted to act in
order to increase share price volatility However when the emphasis is put on the loss-aversion
feature by relaxing the probability weighting assumption the model yields results comparable to
those of EUT-based models In particular the model predicts that loss-averse employees who are not
subject to probability weighting or even with very low degrees of probability weighting receiving
options at high exercise price would willingly accept a cut in compensation to receive instead deep
discount options or restricted shares for those of them displaying more loss-aversion Furthermore the
model shows that loss-averse executives who are processing probabilities in a linear fashion may not
prefer an increase in the variance of the company stock price return
Despite their practical interest the conclusions from the results of this research should not be
drawn without underlining some of its limitations The first one concerns the specification of the CPT
model Actually although the reference point specification in the model is consistent with both
empirical evidence on people setting reference points in a dynamic fashion and firmsrsquo widespread use
of the BS value as a standard for Financial and Human Resources disclosers empirical and
experimental literature is still silent on how people set reference points when assessing complex
gambles like stock option payoffs In addition to keep the model tractable only European-style
options were studied in this paper The model is still however easily extendable to Bermudian-style
options using numerical schemes such like lattice approaches The other limitation of this study is
related to the large heterogeneity in probability weighting that may exist across individuals (Wu and
Gonzalez 1996) The Tverskyrsquos and Kahnemanrsquos (1992) weighting function used in the model
provides only a fit to the median profile
26
Finally this work highlights - as did some previous eminent researches in this field (Dittmann et
al 2008 Splat 2008) - a number of future promising research directions in equity-based
compensation incorporating CPT framework For instant exploring the ability of CTP to explain the
growing use of performance shares plans instead of stock options in employee compensation would be
of great interest for future research Furthermore given that several empirical studies has documented
that employee stock option exercise behavior is also driven by behavioral factors a promising research
direction incorporating CPT is studying its ability to predict exercise patterns
Appendix A proofs of proposition 1
This appendix provides heuristic proofs of proposition 1
To prove that the subjective value a
C
is decreasing in 028 1a it is sufficient to show that
the expectation a
E
is a decreasing function of a Letrsquos first rewrite the expectation in (6) as follows
=
a aIP T IP T
x
a
IR
E v h E v h g x
w x u du x dx
Where
1
2 1
2
g x K x l
w x K g x l x l
x l
with 0 1 and 1 (A1)
Since w x
is derivable over 1IR l an expansion in Taylor series at the first order gives
w x w y x y w y
with 1y IR l
Introducing the expectation operator with respect to the transformed probability measure we have
a aIP IP
x
IP a
E w x w y E x y w y
w y E x u du y w y
(A2)
27
Since w x
is monotone increasing in x we have 0w y Then it follows from (A2) that
proving that a
E
is locally decreasing with respect to a in 1y IR l boils down to showing that
0
x
IP aE x u du
a
(A3)
Noting that
x
au du is positive and convex with respect to 1 1
x l l we
have according to Jensen inequality
IPE xx
IP a IP aE x u du E x u du
Since x follows a standard normal distribution which is symmetric in 0IP
E x we get from
the inequality above by substituting IPE x in the right hand side
0
x
IP aE x u du (A4)
Note that the result in (A4) above showing that the expectation under the transformed
probabilities overstates that under the original probabilities is a consequence of the probability
weighting function feature stated in sect112 which consists in infinitely-overweighting infinitesimal
probabilities and infinitely-underweighting near-one probabilities
Furthermore noting that the convexity of
x
au du with respect to 1 1
x l l
is decreasing in a and using the result in (A4) we have for 028 1 a b
IP IPE x E xx x
IP a IP a IP b IP bE x u du E x u du E x u du E x u du
Or equivalently
x x
IP a IP bE x u du E x u du (A5)
28
This proves that the condition in (A3) holds which means that a
C
is a decreasing function of
028 1a QED
Appendix B proofs of proposition 2
Taking the derivative of the subjective value function in (6) with respect to λ yields
1
1
1
1
1 0
1
a rT
a a
a
a a a rT
EE e if E
C
E E Ee otherw ise
(B1)
Where
1 2 3
a a a aE I I I
(B2)
Using the formulas in equations from (62) to (64) we can rewrite the derivatives in (B2) as follows
1
0
aI
1
2
2
l x
a
a
l
IK g x u du x dx
23
l
a
a
Ix dx
Then substituting these results in place of the derivatives in (B2) we obtain
1 2
2
l lx
a
a a
l
EK g x u du x dx x dx
(B3)
Given that
0
aE
we conclude that
aC
is nonpositive This implies that
aC
is a decreasing
function of QED
29
References
Abdellaoui M (2000) ldquoParameter-Free Elicitation of Utility and Probability Weighting Functionsrdquo
Management Science Vol 46 No 11 pp 1497-1512
Agrawal A Mandelker G (1987) ldquoManagerial incentives and corporate investment and financing
decisionsrdquo Journal of Finance Vol 42 No 4 pp 823-837
Bahaji H (2009) ldquoLe comportement drsquoexercice des porteurs de stock-options une eacutetude empirique
sur le marcheacute Ameacutericainrdquo Working Paper DRM Finance- Universiteacute de Paris Dauphine Paris June
2009
Barberis N and Thaler R(2003) ldquoA survey of behavioral financerdquo in Constantinides G Harris M
and Stulz R (Ed) Handbook of the Economics of Finance North-Holland Amsterdam
Bleichrodt H and Pinto JL (2000) ldquoA Parameter-Free Elicitation of the Probability Weighting
Function in Medical Decision Analysisrdquo Management Science Vol 46 No 11 pp 1485-1496
Cai J and Vijh AM (2004) ldquoExecutive stock and option valuation in a two state variable
framework allowing optimal investment of outside wealth in the risk-free asset and the market
portfoliordquo Working Paper University of Iowa
Camerer C and Ho TH (1994) ldquoViolations of Betweenness Axiom and Nonlinearity in
Probabilityrdquo Journal of Risk and Uncertainty Vol8 No 2 pp 167-196
Cohen RB Hall BJ and Viceira LM (2000) ldquoDo executive stock options encourage risk taking
rdquo Working Paper Harvard Business School
Cook P and Clotfelter C (1993) ldquoThe peculiar scale economies of lottordquo American Economic
Review Vol 83 No3 pp 634-643
DeFusco R Johnson R and Zorn T (1990) ldquoThe effect of executive stock option plans on
stockholders and bondholdersrdquo Journal of Finance Vol45 No 2 pp 617-627
Detemple J and Sundaresan S (1999) ldquoNontraded asset valuation with portfolio constraints a
binomial approachrdquo Review of Financial Studies Vol 12 No 4 pp 835ndash872
Devers C Wiseman R and Holmes M (2007) ldquoThe effects of endowment and loss aversion in
managerial stock option valuationrdquo Academy of Management Journal Vol 50 No 1 pp 191-208
Dittmann I and Maug E (2007) ldquoLower salaries and no options On the optimal structure of
Executive payrdquo The Journal of Finance Vol 62 No 1 pp 303-343
Gneezy U (1998) ldquoUpdating the Reference Level Experimental Evidencerdquo Working paper
University of Haifa
Hall B and Murphy K (2000) ldquoOptimal Exercise prices for executive stock optionsrdquo American
Economic Review Vol 90 No 2 pp 209-214
30
Hall B and Murphy K (2002) ldquoStock options for undiversified executivesrdquo Journal of Accounting
and Economics Vol 33 No 2 pp 3-42
Hallock K and Olson G (2006) ldquoThe value of stock options to non-executive employeesrdquo Working
Paper No 11950 National Bureau of Economic Research Cambridge
Heath C Huddart S and Lang M (1999) ldquoPsychological factors and stock option exerciserdquo
Quarterly Journal of Economics Vol 114 No 2 pp 601-628
Heisler J(1994) ldquoLoss aversion in a futures market an empirical testrdquo Review of Futures Markets
Vol 13 No 3 pp 793ndash822
Henderson V (2005) The impact of the market portfolio on the valuation incentives and optimality
of executive stock options Quantitative Finance Vol 5 No 1 pp 35-47
Hirshleifer D and Suh R (1992) ldquoRisk Managerial Effort and Project Choicerdquo Journal of
Financial Intermediation Vol 2 No 3 pp 308-345
Hodge F Rajgopal S and Shevlin T (2006) ldquoHow do managers value stock options and restricted
stock rdquo Working Paper University of Washington
Holmstrom BR and Milgrom PR (1987) ldquoAggregation and linearity in provision of intertemporal
incentivesrdquo Econometrica Vol 55 No 2 pp 303-328
Huddart S and Lang M (1996) ldquoEmployee stock option exercises an empirical analysisrdquo Journal
of Accounting and Economics Vol 21 No 1 pp 5-43
Jensen M and Murphy KJ (1990) ldquoPerformance pay and top-management incentivesrdquo Journal of
Political Economy Vol 98 No 2 pp 225-264
Jenter D (2001) ldquoUnderstanding high-powered incentivesrdquo Working Paper Harvard Business
School and Economics Departement
Johnson SA and Tian YS (2000) ldquoThe value and incentive effects of non-traditional executive
stock option plansrdquo Journal of Financial Economics Vol 57 No 1 pp 3-34
Jullien B and Salanie B (2000) ldquoEstimating preferences under risk The case of racetrack bettorsrdquo
Journal of Political Economy Vol 108 No 3 pp 503-530
Kachelmeier S and Shehata M (1992) ldquoExamining risk preferences under high monetary incentives
experimental evidence from the Peoplersquos Republic of Chinardquo American Economic Review Vol 82
No 5 pp 1120-1141
Kahneman D and Tversky A (1979) ldquoProspect Theory An analysis of decision under riskrdquo
Econometrica Vol 47 No 2 pp 263-292
Lambert R Lanen W and Larcker D (1989) ldquoExecutive stock option plans and corporate dividend
policyrdquo Journal of Financial and Quantitative Analysis Vol 24 No 4 pp 409-424
Lambert R Larcker D and Verrecchia R (1991) ldquoPortfolio considerations in valuing Executive
Compensationrdquo Journal of Accounting Research Vol 29 No 1 pp 129-149
Lambert R and Larcker D (2001) ldquoHow do employees value (often incorrectly) their stock optionsrdquo
available at knowledgewharton
31
Lewellen W Loderer C and Martin K (1987) ldquoExecutive compensation and executive incentive
problem an empirical analysisrdquo Journal of Accounting and Economics Vol 9 No 3 pp 287-310
Loughran T and Ritter J (1995) ldquoThe new issue puzzlerdquo Journal of Finance Vol 50 No 1 pp 23-
51
Markowitz H (1952) ldquoThe utility of wealthrdquo Journal of Political Economy Vol 60 No 2 pp 151-
158
Odean T (1998a) ldquoAre Investors Reluctant to Realize their Lossesrdquo Journal of Finance Vol 53
No 5 pp 1775ndash1798
Rajgopal S and Shevlin T (2002) ldquoEmpirical evidence on the relation between stock option
compensation and risk askingrdquo Journal of Accounting and Economics Vol 33 No 2 pp 145-171
Shefrin H and Statman M (1985) ldquoThe disposition to sell winners too early and ride losers too long
theory and evidencerdquo Journal of Finance Vol 40 No 3 pp 777-790
Sawers K Wright A and Zamora V (2006) ldquoLoss aversion stock-based compensation and
managerial risk-seeking behaviorrdquo paper presented at the AAA 2007 Management Accounting
Section Meeting available at httpssrncom abstract=864224
Thaler R (1999) ldquoMental Accounting Mattersrdquo Journal of Behavioral Decision Making Vol 12 No
3 pp 183-206
Thaler R and Ziemba W (1988) ldquoParimutuel betting markets Racetracks and lotteriesrdquo Journal of
Economic Perspectives Vol 2 No 2 pp 161-174
Tversky A and Kahneman D (1992) ldquoAdvances in Prospect Theory Cumulative representation of
uncertaintyrdquo Journal of Risk and Uncertainty Vol 5 No 4 pp 297-323
Yermack D (1997) ldquoGood Timing CEO Stock Option Awards and Company News
Announcementsrdquo Journal of Finance Vol 52 No 2 pp 449-476
Wu G and Gonzalez R (1996) ldquoCurvature of the Probability Weighting functionrdquo Management
Science Vol 42 No 12 pp 1676-1690

13
The results presented in figure 1 show that the option subjective value is increasing in probability
weighting degree (ie decreasing in parameter a ) Actually given the asymmetric profile of the option
payoff the expectation a
E
in the subjective value formula (6) is positively affected by the emphasis
put on the tail of the payoff distribution which is governed by the parameter a the lower a the more
overweighed will be small probabilities and the more underweighted will be medium to large
probabilities This lottery-like nature of an option combining large gains with small probabilities may
make it attractive to a CPT employee subject to probability weighting This preliminary outcome leads
to proposition 1 which stats that
Proposition 1 the value of the stock option contract to a CPT- employee is increasing with
respect to his degree of probability weighting (ie is decreasing with respect to a)
(Proofs are provided in appendix A)
Moreover the effect of probability weighting is expected to increase with the skewness of the
distribution of the underlying stock price which is captured by the volatility parameter given the
Log-normality assumed in the model In order to show that I performed a numerical analysis of the
sensitivity of the subjective value to the probability weighting degree as a function of the volatility
and the parameter a This sensitivity is defined as the partial derivative of subjective value with
respect to a (a
C
a
) The results are reported in figure 2 in the form of a graph It shows that the
sensitivity to parameter a is negative and locally decreasing in volatility That means that the more the
share price is volatile the more the option will be attractive for a CPT employee subject to probability
weighting This supports Spaltrsquos (2008) findings that the effect of probability weighting provides an
economic rationale to riskier firms (ie more volatile firms) for granting more stock options to non-
executive employees
Furthermore I investigate the effect of loss aversion on the subjective value The variable of
interest here is In an analogical sense with the EUT framework the option value from the
perspective of a loss-averse employee is expected to decrease with his degree of loss-aversion To
verify this I computed numerically the first order derivative with respect to (
aC
) crossed over
various levels of and moneyness ranging from 005 to 1 and from 5 to 200 respectively The
outcome is reported in figure 3 It shows that the sensitivity to loss aversion is negative and locally
decreasing in moneyness That means that the more the employee is loss averse the less would the
option be worth to him This conclusion is taken up in proposition 2 hereafter
14
Figure-3 Sensitivity to loss aversion This figure is a plot of the
partial derivative of the subjective value with respect to ldquoλrdquo
against both ldquoλrdquo and the stock price ldquoSrdquo It exhibits the local effect
of loss aversion given the option moneyness The derivative was
computed numerically based on the following parameters T=4
σ=30 K=100 r=3 q=0 a=065 α=088
Figure-4 Sensitivity to the curvature parameter This figure is a
plot of the partial derivative of the subjective value with respect to
ldquoαrdquo against both ldquoαrdquo and the stock price ldquoSrdquo It exhibits the local
effect of the curvature parameter given the option moneyness The
derivative was computed numerically based on the following
parameters T=4 σ=30 K=100 r=3 q=0 a=065 λ =225
Proposition 2 the value of the stock option contract to a CPT- employee is decreasing with
respect to his degree of loss-aversion (ie a decreasing function of λ)
(Proofs are provided in appendix B)
I performed a similar analysis in order to get a view on the effect of the curvature parameter In
the same way I assessed locally the first order derivative with respect to within a range of values
from 005 to 1 and using share prices ranging from 10 to 200 Figure 4 shows that this derivative is
locally increasing with the option moneyness for values of above say 075 It also shows broadly
that the subjective value is an increasing monotone function of over a range of values around the
experimental estimate of 088 (from 07 to 1) irrespective of the option moneyness
2 Incentives from stock-options
Stock-options are incentive tools used within a principal-agent relationship to align the interests of
the agent (employee) on those of the principal (shareholders) The shareholders grant stock options in
15
order to provide the employee with incentives to make efforts that enhance the value of the firm and
thus their own wealth Indeed assuming that employees are aware of how their actions affect the share
price option holdings will prompt them to make efforts that increase share price Therefore the
incentive from a single option grant will depend on the degree of the sensitivity of the subjective value
to the stock price
21 The incentive measure
Following Jensen and Murphy (1990) Hall and Murphy (2000 2002) and others I defined the
incentive effect as the first order derivative of the subjective value with respect to share price (
aC
S
)
which defines how the value from the employee perspective changes with an incremental change in
the stock price As we can see in figure 5 which is a plot of
aC
S
for three values of a incentives
are greatest for in-the-money10
options Also the incentive effect is increasing with the degree of
probability weighting Another observation that can be made from figure 5 is that for sufficiently high
level of probability weighting the option can give much more incentive to increase stock price than is
reflected by the BS delta This is consistent with my previous finding that the subjective value can
overstate the BS value Note that consistently with the EUT-based models when the employee
process probabilities in a linear way ( 1a ) - which means that the probability weighting assumption
is relaxed and only loss-aversion matters - the incentives lie strictly under the BS delta whatever the
level of the option moneyness That is to say that the options are less attractive for both risk-averse
employee and loss-averse employee who are not subject to probability weighting The analysis in
figure 6 supports this It shows that with a hold constant at 065 incentives are decreasing in loss-
aversion Conversely with loss-aversion parameter set to 1 which means that the loss-aversion
effect is neutralized incentives for a representative loss-neutral employee with a degree of probability
weighting equal to experimental estimate of 065 overstate the BS delta
10
The terminology ldquoat-the-moneyrdquo is referring to stock-options with an exercise price equal to the stock price at
inception The expressions ldquoOut-of- the-moneyrdquo and ldquoIn-the-moneyrdquo are also used throughout the paper to refer
to options with strike price respectively below and above the grant date stock price
16
Figure-5 The effect of probability weighting on stock-option
incentives This figure is plots of the partial derivative of the
subjective value with respect to stock price ldquoSrdquo against the option
moneyness It exhibits the combined effects of probability
weighting and option moneyness on incentives The derivatives
were computed numerically assuming three different levels of
probability weighting (see the legend above) and holding the
remaining parameters constant at the following values T=4
σ=30 K=100 r=3 q=0 λ=225 α=088
Figure-6 The effect of loss-aversion on stock-option incentives
This figure is plots of the partial derivative of the subjective value
with respect to stock price ldquoSrdquo against the option moneyness It
exhibits the combined effects of loss-aversion and option
moneyness on incentives The derivatives were computed
numerically assuming three different levels of loss-aversion (see
the legend above) and holding the remaining parameters constant
at the following values T=4 σ=30 K=100 r=3 q=0
a=065 α=088
22 Implications for stock option design optimal strike price
Setting the strike price of standard stock options boils down to defining the threshold against which
the performance is assessed and consequently to determining the likelihood of a final payout As we
have just noticed from figure 5 and figure 6 incentives increases in the option moneyness and
equivalently decreases with strike price In parallel from the shareholders perspective granting in-
the-money options is much more costly than granting out-of-the money or at-the-money options
(recall figure 1) This leads the firm to a trade-off to make when setting the exercise price of the
options in the sense that holding his cost unchanged she could either grant fewer options at a low
strike price or increase the grant size at higher exercise price
I relied on the methodology from Hall and Murphy (2002) in figuring out the optimal exercise price
satisfying the double purpose of maximizing incentives and holding constant the firmrsquos cost of
granting options I also considered two situations In the first situation the firm does not adjust the
existing compensation package when grating additional stock options Thus these additional options
are considered as a pure add-on to existing compensation In the second situation however the
employee and the firm are allowed to bargain efficiently over the terms of the compensation Thus the
17
firm is assumed to fund additional options by an adjustment to other compensation components that
leaves the employee indifferent between his initial package and the new package including the
additional grant
221 Situation 1 Option grant without a compensation offset
When the firm is not allowed to adjust the existing compensation package the optimal strike price
that maximizes incentives for a given amount of firm cost is the solution to the following constrained
optimization problem
m ax
a
K
nC K
S
such that n K c (7)
Where a
nC K
S
denotes the incentives from receiving n options with a strike price K and
K the per-unit cost or the BS value of one option
The optimization problem in (7) is solved numerically by varying the parameter K First the BS
value is computed for a given K which enable to determine the grant size n that leaves the firm cost
constant at c in accordance with the constraint in (7) Then the cost function a
nC K
S
is assessed
based on n and K This procedure is reiterated recursively until the optimal value of K is found
I set the total cost for the firm at euro28 333c (hence a grant of 1000n at-the-money options
based on the retained option-related parameters) As reported in figure 7 I varied the preferences-
related parameters a and within specific ranges in order to figure out the conditions under which an
optimal strike may exist and the robustness of the model predictions The chart on the left-hand side
exhibits the total incentives from the grant as a function of the strike price and the probability
weighting parameter with the loss-aversion held constant at 225 It shows that the convexity and
the monotony of the total incentives function ( a
nC K
S
) shift with the degree of probability
weighting while it is concave and non-monotone over the range of strike prices for low levels of
probability weighting ( 0906a ) it becomes convex and monotonically increasing for higher levels
Moreover for higher level of volatility probability weighting is expected to affect more deeply the
shape of total incentives function (recall figure 2)
Specifically when the effect of probability weighting prevails (ie dominates that of loss-aversion)
the model predicts that incentives could be infinitely increased by granting more and more options at
higher and higher strikes This result suggests that if the employee is subject to a degree of probability
18
weighting that could potentially lead him to overstate the value of the option in excess of the BS value
he would ask for the maximum number of options (as much options as the company could possibly
grant him) at their (highest) breakeven strike the higher the strike price the more small probabilities
of large gains there are and the more valuable become options to him Furthermore this means that
such an employee would be much more interested in premium options instead of discount options
Actually although this result is in stark contrast with the common stock-based compensation practices
that consist in granting broadly at-the-money options it shouldnrsquot be rejected without taking into
account the other factors restricting the number of options the company could issue irrespective of
their strike prices such like capital dilution limits
In addition as we can notice from the plot in the middle of figure 7 the effect of probability
weighting on total incentives could be offset by an increasing loss-aversion This time is varied and
a held constant at 065 which meets the experimental estimate When the loss-aversion effect
dominates the total incentives function tends to non-monotone concave shapes which means that it
admits finite extremas In particular when probability weighting effect is neutralized by setting 1a -
in other words the employee is not subject to probability weighting - total incentives curve tends to
flatten around the optimum (see the green curves on the right-hand side plot) This suggests that there
exists a range of strike prices that yield quasi-similar incentives For instance with loss-aversion set
at 225 optimal strike (as of stock price at inception) is about 142 and lies within a range of
values from 121 to 153 that yield total incentives of about euro530 (rounded figure) With 6
the optimal strike drops by almost 30 (to 112) and total incentives are flat around the maximum
value of euro450 within the range from 91 to 111 Note that these results are consistent with Hallrsquos
and Murphyrsquos (2000 2002) findings relying on the EUT framework Consistently their work
documented that incentive-maximizing strike price exists when the options are considered as an add-
on to existing compensation In addition they showed that total incentives are relatively flat around
the maximum and that optimal strike price decreases for more risk-averse and less diversified
employees
19
Figure-7 Incentives from options grant with total cost of euro28 333 assuming no adjustment to existing compensation package This figure is plots of
incentives (in Keuro) from options grant for a given strike price holding the total BS value of the grant constant at euro28 333 Total incentives are defined as the
partial derivative of the total subjective value of the grant with respect to stock price ldquoSrdquo The sub-figure on the left-hand side depicts total incentives as a
function of the strike price and probability weighting parameter That in the middle is a plot of total incentives against strike price and loss-aversion The
sub-figure on the right-hand side exhibits the combined effect of probability weighting and loss-aversion on the shape of total incentives as a function of
strike price The derivatives were computed numerically based on the following parameters T=4 σ=30 S=100 r=3 q=0 α=088
222 Situation 2 Option grant with an adjustment to existing compensation
Now letrsquos considerer that the company is allowed to make an efficient adjustment to existing
compensation components (cash for example) in order to grant additional options to the employee
The impact of this adjustment should be neutral with regard to the total compensation cost for the
company Moreover assuming this adjustment involves cash compensation it must be attractive to the
employee so that hersquod be willing to give up some cash compensation against extra options grant
Therefore it must leave the employee at his initial total subjective value of the compensation package
It follows that the strike price that maximizes total incentives for a given company cost is the solution
of this following optimization problem
m ax
a
K
nC K
S
subject to a
n K nC K c
and 0n (8)
20
Where c is a fixed constant The constraint in (8) is the aggregation of the company cost constraint
and the employee value constraint used in Henderson (2005)
Similar to that in (7) this optimization problem was solved numerically In this analysis c was
chosen such that for retained parameters the number of granted at-the-money options n is around
1000 hence total cost of euro28 333 Once c is set n is determined from the constraint in (8) for a given
strike price K S then total incentives
anC K
S
are assessed These are depicted in figure 8
The left-hand side sub-figure exhibits total incentives for different levels of K and probability
weighting parameter a with risk aversion held constant at 225 For each combination of K and
a the constraint in (8) is solved for n which allows to determine total incentives The plots indicate
that when the employee is deeply subject to probability weighting ( 0475a )
anC K
S
is
strictly decreasing throughout the depicted range of strike prices (see the curves in blue) In this case
similar to EUT-based studiesrsquo findings (Hall and Murphy 2002 Henderson 2005) incentives are
maximized through restricted stocks grant rather than stock options The intuitive reason behind that
is given that the employee systematically values the options in excess of their BS value efficient
trade-off over compensation allocation is made via the grant of equity-based instruments that
employee values at their actual cost restricted stocks for instance
However for lower degrees of probability weighting (typically 0475 085 a ) the optimal
strike price is not nil and tends to increase with a Specifically the optimization problem is defined
on the right (see the red solid curve) or on the left (see the red dashed curve) of the optimal
strike
K and
anC K
S
admits an infinite branch in
K (ie total incentives are infinite at that
point) The technical reason behind that is that the subjective value is equal to the BS value at the
optimal strike which yields according to the constraint in (8) an infinite grant size
(
lim
K K
n K ) For instance
K ranges from 60 to 195 when a takes values within a range
of value around the experimental estimates ( 055 070a )11
This suggests that depending on the
extent to which employee weights probabilities either grants of discount options or premium options
may result in a Pareto optimum to the contract As a specific example for an employee with
0616a the optimal strike price
K is around 100 which means that for the prevailing setting
the model predicts at-the-money options as optimal in an efficient contracting framework since the
companyrsquos cost of granting these options is equal to their value to the employee In this case granting
11
Optimal strikes are expected to be lower for higher stock price volatility since probability weighting effect
tends to increase with volatility (recall figure 2)
21
options with strike price around the stock price at inception which is consistent with observed
practices results in a perfect reconciliation of the company and the employee respective views Note
that for a similar setting in the previous situation where the options are given as an add-on to existing
compensation the model indicates that incentives from stock options could be infinitely increased by
granting increasingly more options at greater and greater strike price
Furthermore for weak degrees of probability weighting ( 085 a ) the subjective value of the
option lies strictly below the BS value because the effect of loss-aversion tends to dominate that of
probability weighting Thus the total incentives function takes a non-monotone concave shape and
shows finite extremas ranging from 35 to 81 In particular when probability weighting assumption
is relaxed ( 1a ) the function flattens around the maximum and approaches a monotone decreasing
shape with increasing loss-aversion (see sub-figure on the right-hand side) This result suggests that
loss-averse employees who are not subject to probability weighting - even with very low degree of
probability weighting - receiving options at high exercise price would willingly accept a cut in cash
compensation to receive instead deep discount options or restricted shares for those of them displaying
more loss-aversion Again this is broadly consistent with Hallrsquos and Murphyrsquos (2002) and
Hendersonrsquos (2005) findings for non-diversified risk-averse employees
Last but not least the sub-figure in the middle of the main figure is plots of total incentives against
the strike price each of them corresponds to a given level of loss-aversion The purpose of this
analysis consists in showing the effect of loss-aversion on
K by holding a constant at 065 and
varying It mainly shows that loss-aversion has an effect opposite to that of probability weighting
when probability weighting effect is dominant12
(ie the employee may potentially put overstated
value in the option specifically for high strikes) optimal strike increases and total incentives decreased
with loss-aversion Conversely when loss-aversion effect is dominant as stated before the model
yields predictions comparable to that of the EUT-based models
12
See the limit case of 1 where risk-aversion is ignored (the blue dashed curve)
22
Figure-8 Incentives from options grant with total cost of euro28 333 assuming cash compensation is adjusted This figure is plots of incentives (in Keuro) from options grant
for a given strike price holding the total compensation value constant from both company and employee perspectives Total incentives are defined as the partial
derivative of the total subjective value of the grant with respect to stock price ldquoSrdquo The sub-figure on the left-hand side depicts total incentives as a function of the strike
price for varying levels of probability weighting parameter That in the middle is a plot of total incentives against strike price for varying levels of loss-aversion The
sub-figure on the right-hand side exhibits the sole effect of loss-aversion (with no probability weighting) on the shape of total incentives as a function of strike price The
derivatives were computed numerically based on the following parameters T=4 σ=30 S=100 r=3 q=0 α=088
3 Do stock-options provide incentive for risk taking
Earlier studies (Agrawal and Mandelker 1987 DeFusco et al 1990 Hirshleifer and Suh 1992)
have built on insights from standard option pricing theory to predict that option-compensated
managers will be motivated to increase the asset variance and leverage of their firms because the
convexity of the option payoff increase its value as the volatility of the stock price increases Lambert
et al (1991) was the first to call into question this assertion They proved that a non-diversified risk-
averse executive may not necessarily take actions that increase stock price volatility because that
parameter of the distribution of the stock price has two conflicting effects on the subjective value of
the option a positive effect implied by the payoff convexity and a negative effect due to the concavity
of the executiversquos utility function Henderson (2005) draws conclusions from a EUT-base model
consistent with these findings Specifically she finds that stock-options provide incentives for a risk-
averse manager to increase the beta of the company (ie the market risk-to-firm specific risk ratio)
rather than total risk Although there is some empirical evidence supporting the prediction that stock-
options do not systematically encourage risk taking it is still very scarce13
13
See for instance Cohen et al(2000) and Rajgopal and Shevelin (2002)
23
Figure-9 The effect of loss-aversion and probability weighting on risk-taking incentives implied by stock-options This figure is plots
of the partial derivative of the subjective value with respect to stock price volatility ldquoσrdquo against the option moneyness It exhibits on
the one hand the combined effects of loss-aversion and option moneyness (chart on the right-hand side) and on the other hand the
combined effects of probability weighting and option moneyness (chart on the left-hand side) on risk-taking incentives The derivatives
were computed numerically assuming three different levels of loss-aversion and probability weighting (see the legends above) and
holding the remaining parameters constant at the following values T=4 σ=30 K=100 r=3 q=0 α=088
I revisited the risk taking incentives issue from the perspective of an executive with CPT
preferences Similar to previous studies I defined incentives for risk taking as the first order derivative
of the subjective value in (6) with respect to volatility (a
C
)
14 In order to figure out the link
between risk-taking incentives from stock-options and the parameters related to preferences I
performed a numerical analysis on the sensitivity of a
C
to loss-aversion and probability weighting
The results are reported in figure 8 hereafter
The left-hand side subfigure is plots of a
C
as a function of the stock price for several degrees
of probability weighting with loss-aversion held constant at 225 The purpose of the underlying
analysis is to figure out broadly the extent to which a loss-averse executive subject to probability
weighting would prefer a high or low risk given the way the latter influences the option value from his
own perspective The first essential result from this analysis is that incentives for risk taking are
14
Actually the sensitivity of the subjective value to a parameter of the probability distribution of the stock price
provides a measure of the executive incentive to make decisions that influence that parameter
24
increasing with probability weighting degree In fact the probability weighting leverages the positive
effect of volatility on the subjective value through the convexity of the option payoff Another
observation that could be made is that for sufficiently high degree of probability weighting
( 070a )a
C
lies strictly above the conventional BS Vega over the retained range of stock prices
(see the red and the green curves) This means that an option-compensated CPT-executive subject to
probability weighting may be more prompted than a risk-neutral executive to act in order to increase
assets volatility Note that for typical setting of a at 065 the model predicts that a CPT-executive
with a such preferences calibration will have incentives to act in order to increase the volatility of the
stock price by 1 if he targets a 87 cts - increase of the value of his at-the-money 4-year option
In addition when probability weighting is ignored by setting 1a only the effect of loss-aversion
on risk taking incentives is captured The analysis of this effect is reported in the subfigure on the
right-hand side More explicitly this subfigure exhibits plots of a
C
for several levels of with
probability weighting effect neutralized It shows mainly that risk-taking incentives from stock-options
are decreasing with loss-aversion Moreover it appears that a
C
turns negative over a given range
of stock prices where the option is in-the-money Therefore consistent with findings from EUT-based
models the CPT model predicts that a loss-averse executive who is not subject to probability
weighting may not prefer an increase in the variance of the company stock price return As a specific
example an executive with a loss-aversion parameter 6 who processes probabilities in a linear
way (see the yellow curve) and holds 4-year stock options will have incentives to decrease rather than
increase the volatility of the company stock price if the stock price is above 130 the strike price of
his options
In essence incentives for risk taking from stock options - defined as the sensitivity of the
subjective value to the stock price volatility - is subject to two opposite effects under the CPT-based
model a positive effect from the convexity of the optionrsquos payoff leveraged by the probability
weighting feature and a negative effect from the loss-aversion coefficient Therefore there is a mixed
effect on risk taking incentives depending on which of the two effects dominates This will depend
obviously on the option moneyness and the other option-specific parameters
Conclusion
This paper proposes an alternative theoretical model of stock option subjective value to analyze
their incentive effects for employees The model predictions ascertain the ability of CPT to explain
some prominent incentive patterns that EUT models have difficulties to capture It mainly provides
25
arguments on the well documented tendency of employees to frequently value - under some
circumstances - their options in excess of their cost to the company Specifically these results
highlight the economic rational for firms in particular those with higher risk to widely use stock
options in non-executive employee compensation (Spalt 2008)
Loss aversion and probability weighting are the key features driving the subjective value in the
CPT model These parameters have countervailing effects on the modeled subjective value Depending
on which of them is dominant in the preferences calibration the model yields different predictions
regarding incentives Specifically consistent with some behavioral patterns observed in many surveys
and experimental studies on equity-based compensation the model predicts that when the probability
weighting feature prevails the subjective value may overstate the risk-neutral value of the option In
this case assuming the company and the employee bargain efficiently over the compensation
components incentives are maximized for strike prices set around the stock price at inception for a
representative employee with preferences calibration meeting the experimental estimates from CPT
(Tversky and Kahneman 1992) Obviously this finding is consistent with companiesrsquo actual
compensation practices Moreover executives with such preferences profile may be prompted to act in
order to increase share price volatility However when the emphasis is put on the loss-aversion
feature by relaxing the probability weighting assumption the model yields results comparable to
those of EUT-based models In particular the model predicts that loss-averse employees who are not
subject to probability weighting or even with very low degrees of probability weighting receiving
options at high exercise price would willingly accept a cut in compensation to receive instead deep
discount options or restricted shares for those of them displaying more loss-aversion Furthermore the
model shows that loss-averse executives who are processing probabilities in a linear fashion may not
prefer an increase in the variance of the company stock price return
Despite their practical interest the conclusions from the results of this research should not be
drawn without underlining some of its limitations The first one concerns the specification of the CPT
model Actually although the reference point specification in the model is consistent with both
empirical evidence on people setting reference points in a dynamic fashion and firmsrsquo widespread use
of the BS value as a standard for Financial and Human Resources disclosers empirical and
experimental literature is still silent on how people set reference points when assessing complex
gambles like stock option payoffs In addition to keep the model tractable only European-style
options were studied in this paper The model is still however easily extendable to Bermudian-style
options using numerical schemes such like lattice approaches The other limitation of this study is
related to the large heterogeneity in probability weighting that may exist across individuals (Wu and
Gonzalez 1996) The Tverskyrsquos and Kahnemanrsquos (1992) weighting function used in the model
provides only a fit to the median profile
26
Finally this work highlights - as did some previous eminent researches in this field (Dittmann et
al 2008 Splat 2008) - a number of future promising research directions in equity-based
compensation incorporating CPT framework For instant exploring the ability of CTP to explain the
growing use of performance shares plans instead of stock options in employee compensation would be
of great interest for future research Furthermore given that several empirical studies has documented
that employee stock option exercise behavior is also driven by behavioral factors a promising research
direction incorporating CPT is studying its ability to predict exercise patterns
Appendix A proofs of proposition 1
This appendix provides heuristic proofs of proposition 1
To prove that the subjective value a
C
is decreasing in 028 1a it is sufficient to show that
the expectation a
E
is a decreasing function of a Letrsquos first rewrite the expectation in (6) as follows
=
a aIP T IP T
x
a
IR
E v h E v h g x
w x u du x dx
Where
1
2 1
2
g x K x l
w x K g x l x l
x l
with 0 1 and 1 (A1)
Since w x
is derivable over 1IR l an expansion in Taylor series at the first order gives
w x w y x y w y
with 1y IR l
Introducing the expectation operator with respect to the transformed probability measure we have
a aIP IP
x
IP a
E w x w y E x y w y
w y E x u du y w y
(A2)
27
Since w x
is monotone increasing in x we have 0w y Then it follows from (A2) that
proving that a
E
is locally decreasing with respect to a in 1y IR l boils down to showing that
0
x
IP aE x u du
a
(A3)
Noting that
x
au du is positive and convex with respect to 1 1
x l l we
have according to Jensen inequality
IPE xx
IP a IP aE x u du E x u du
Since x follows a standard normal distribution which is symmetric in 0IP
E x we get from
the inequality above by substituting IPE x in the right hand side
0
x
IP aE x u du (A4)
Note that the result in (A4) above showing that the expectation under the transformed
probabilities overstates that under the original probabilities is a consequence of the probability
weighting function feature stated in sect112 which consists in infinitely-overweighting infinitesimal
probabilities and infinitely-underweighting near-one probabilities
Furthermore noting that the convexity of
x
au du with respect to 1 1
x l l
is decreasing in a and using the result in (A4) we have for 028 1 a b
IP IPE x E xx x
IP a IP a IP b IP bE x u du E x u du E x u du E x u du
Or equivalently
x x
IP a IP bE x u du E x u du (A5)
28
This proves that the condition in (A3) holds which means that a
C
is a decreasing function of
028 1a QED
Appendix B proofs of proposition 2
Taking the derivative of the subjective value function in (6) with respect to λ yields
1
1
1
1
1 0
1
a rT
a a
a
a a a rT
EE e if E
C
E E Ee otherw ise
(B1)
Where
1 2 3
a a a aE I I I
(B2)
Using the formulas in equations from (62) to (64) we can rewrite the derivatives in (B2) as follows
1
0
aI
1
2
2
l x
a
a
l
IK g x u du x dx
23
l
a
a
Ix dx
Then substituting these results in place of the derivatives in (B2) we obtain
1 2
2
l lx
a
a a
l
EK g x u du x dx x dx
(B3)
Given that
0
aE
we conclude that
aC
is nonpositive This implies that
aC
is a decreasing
function of QED
29
References
Abdellaoui M (2000) ldquoParameter-Free Elicitation of Utility and Probability Weighting Functionsrdquo
Management Science Vol 46 No 11 pp 1497-1512
Agrawal A Mandelker G (1987) ldquoManagerial incentives and corporate investment and financing
decisionsrdquo Journal of Finance Vol 42 No 4 pp 823-837
Bahaji H (2009) ldquoLe comportement drsquoexercice des porteurs de stock-options une eacutetude empirique
sur le marcheacute Ameacutericainrdquo Working Paper DRM Finance- Universiteacute de Paris Dauphine Paris June
2009
Barberis N and Thaler R(2003) ldquoA survey of behavioral financerdquo in Constantinides G Harris M
and Stulz R (Ed) Handbook of the Economics of Finance North-Holland Amsterdam
Bleichrodt H and Pinto JL (2000) ldquoA Parameter-Free Elicitation of the Probability Weighting
Function in Medical Decision Analysisrdquo Management Science Vol 46 No 11 pp 1485-1496
Cai J and Vijh AM (2004) ldquoExecutive stock and option valuation in a two state variable
framework allowing optimal investment of outside wealth in the risk-free asset and the market
portfoliordquo Working Paper University of Iowa
Camerer C and Ho TH (1994) ldquoViolations of Betweenness Axiom and Nonlinearity in
Probabilityrdquo Journal of Risk and Uncertainty Vol8 No 2 pp 167-196
Cohen RB Hall BJ and Viceira LM (2000) ldquoDo executive stock options encourage risk taking
rdquo Working Paper Harvard Business School
Cook P and Clotfelter C (1993) ldquoThe peculiar scale economies of lottordquo American Economic
Review Vol 83 No3 pp 634-643
DeFusco R Johnson R and Zorn T (1990) ldquoThe effect of executive stock option plans on
stockholders and bondholdersrdquo Journal of Finance Vol45 No 2 pp 617-627
Detemple J and Sundaresan S (1999) ldquoNontraded asset valuation with portfolio constraints a
binomial approachrdquo Review of Financial Studies Vol 12 No 4 pp 835ndash872
Devers C Wiseman R and Holmes M (2007) ldquoThe effects of endowment and loss aversion in
managerial stock option valuationrdquo Academy of Management Journal Vol 50 No 1 pp 191-208
Dittmann I and Maug E (2007) ldquoLower salaries and no options On the optimal structure of
Executive payrdquo The Journal of Finance Vol 62 No 1 pp 303-343
Gneezy U (1998) ldquoUpdating the Reference Level Experimental Evidencerdquo Working paper
University of Haifa
Hall B and Murphy K (2000) ldquoOptimal Exercise prices for executive stock optionsrdquo American
Economic Review Vol 90 No 2 pp 209-214
30
Hall B and Murphy K (2002) ldquoStock options for undiversified executivesrdquo Journal of Accounting
and Economics Vol 33 No 2 pp 3-42
Hallock K and Olson G (2006) ldquoThe value of stock options to non-executive employeesrdquo Working
Paper No 11950 National Bureau of Economic Research Cambridge
Heath C Huddart S and Lang M (1999) ldquoPsychological factors and stock option exerciserdquo
Quarterly Journal of Economics Vol 114 No 2 pp 601-628
Heisler J(1994) ldquoLoss aversion in a futures market an empirical testrdquo Review of Futures Markets
Vol 13 No 3 pp 793ndash822
Henderson V (2005) The impact of the market portfolio on the valuation incentives and optimality
of executive stock options Quantitative Finance Vol 5 No 1 pp 35-47
Hirshleifer D and Suh R (1992) ldquoRisk Managerial Effort and Project Choicerdquo Journal of
Financial Intermediation Vol 2 No 3 pp 308-345
Hodge F Rajgopal S and Shevlin T (2006) ldquoHow do managers value stock options and restricted
stock rdquo Working Paper University of Washington
Holmstrom BR and Milgrom PR (1987) ldquoAggregation and linearity in provision of intertemporal
incentivesrdquo Econometrica Vol 55 No 2 pp 303-328
Huddart S and Lang M (1996) ldquoEmployee stock option exercises an empirical analysisrdquo Journal
of Accounting and Economics Vol 21 No 1 pp 5-43
Jensen M and Murphy KJ (1990) ldquoPerformance pay and top-management incentivesrdquo Journal of
Political Economy Vol 98 No 2 pp 225-264
Jenter D (2001) ldquoUnderstanding high-powered incentivesrdquo Working Paper Harvard Business
School and Economics Departement
Johnson SA and Tian YS (2000) ldquoThe value and incentive effects of non-traditional executive
stock option plansrdquo Journal of Financial Economics Vol 57 No 1 pp 3-34
Jullien B and Salanie B (2000) ldquoEstimating preferences under risk The case of racetrack bettorsrdquo
Journal of Political Economy Vol 108 No 3 pp 503-530
Kachelmeier S and Shehata M (1992) ldquoExamining risk preferences under high monetary incentives
experimental evidence from the Peoplersquos Republic of Chinardquo American Economic Review Vol 82
No 5 pp 1120-1141
Kahneman D and Tversky A (1979) ldquoProspect Theory An analysis of decision under riskrdquo
Econometrica Vol 47 No 2 pp 263-292
Lambert R Lanen W and Larcker D (1989) ldquoExecutive stock option plans and corporate dividend
policyrdquo Journal of Financial and Quantitative Analysis Vol 24 No 4 pp 409-424
Lambert R Larcker D and Verrecchia R (1991) ldquoPortfolio considerations in valuing Executive
Compensationrdquo Journal of Accounting Research Vol 29 No 1 pp 129-149
Lambert R and Larcker D (2001) ldquoHow do employees value (often incorrectly) their stock optionsrdquo
available at knowledgewharton
31
Lewellen W Loderer C and Martin K (1987) ldquoExecutive compensation and executive incentive
problem an empirical analysisrdquo Journal of Accounting and Economics Vol 9 No 3 pp 287-310
Loughran T and Ritter J (1995) ldquoThe new issue puzzlerdquo Journal of Finance Vol 50 No 1 pp 23-
51
Markowitz H (1952) ldquoThe utility of wealthrdquo Journal of Political Economy Vol 60 No 2 pp 151-
158
Odean T (1998a) ldquoAre Investors Reluctant to Realize their Lossesrdquo Journal of Finance Vol 53
No 5 pp 1775ndash1798
Rajgopal S and Shevlin T (2002) ldquoEmpirical evidence on the relation between stock option
compensation and risk askingrdquo Journal of Accounting and Economics Vol 33 No 2 pp 145-171
Shefrin H and Statman M (1985) ldquoThe disposition to sell winners too early and ride losers too long
theory and evidencerdquo Journal of Finance Vol 40 No 3 pp 777-790
Sawers K Wright A and Zamora V (2006) ldquoLoss aversion stock-based compensation and
managerial risk-seeking behaviorrdquo paper presented at the AAA 2007 Management Accounting
Section Meeting available at httpssrncom abstract=864224
Thaler R (1999) ldquoMental Accounting Mattersrdquo Journal of Behavioral Decision Making Vol 12 No
3 pp 183-206
Thaler R and Ziemba W (1988) ldquoParimutuel betting markets Racetracks and lotteriesrdquo Journal of
Economic Perspectives Vol 2 No 2 pp 161-174
Tversky A and Kahneman D (1992) ldquoAdvances in Prospect Theory Cumulative representation of
uncertaintyrdquo Journal of Risk and Uncertainty Vol 5 No 4 pp 297-323
Yermack D (1997) ldquoGood Timing CEO Stock Option Awards and Company News
Announcementsrdquo Journal of Finance Vol 52 No 2 pp 449-476
Wu G and Gonzalez R (1996) ldquoCurvature of the Probability Weighting functionrdquo Management
Science Vol 42 No 12 pp 1676-1690
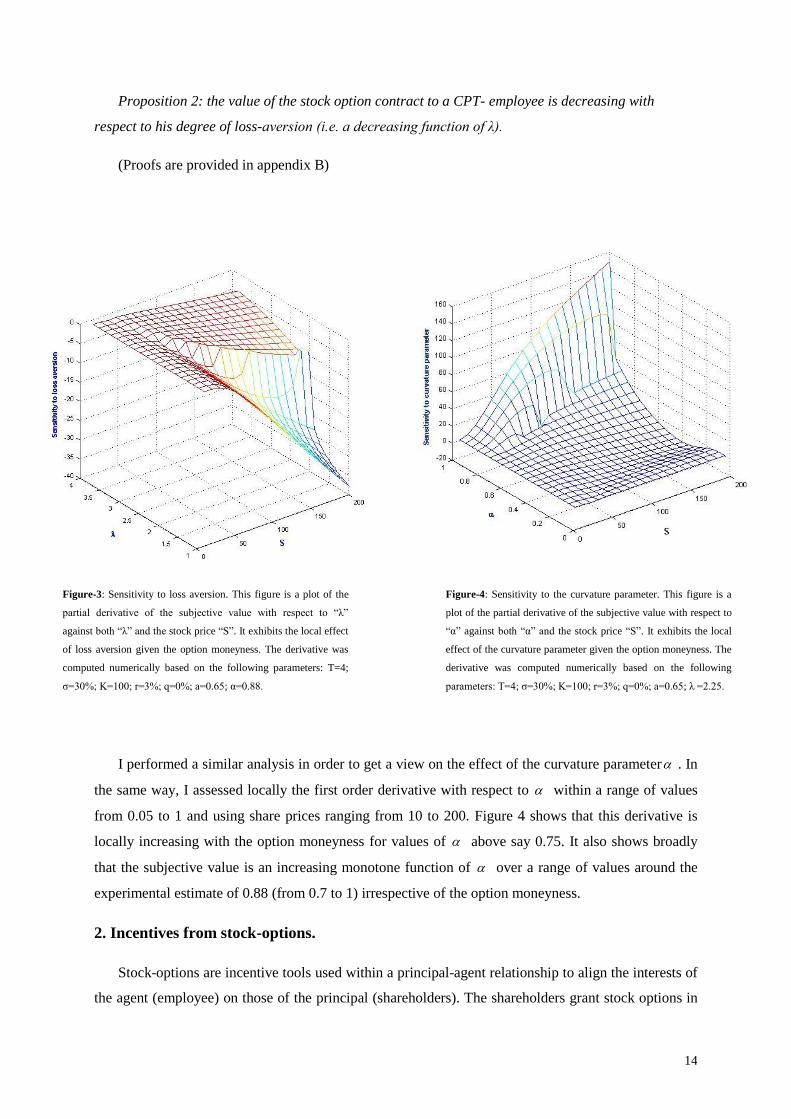
14
Figure-3 Sensitivity to loss aversion This figure is a plot of the
partial derivative of the subjective value with respect to ldquoλrdquo
against both ldquoλrdquo and the stock price ldquoSrdquo It exhibits the local effect
of loss aversion given the option moneyness The derivative was
computed numerically based on the following parameters T=4
σ=30 K=100 r=3 q=0 a=065 α=088
Figure-4 Sensitivity to the curvature parameter This figure is a
plot of the partial derivative of the subjective value with respect to
ldquoαrdquo against both ldquoαrdquo and the stock price ldquoSrdquo It exhibits the local
effect of the curvature parameter given the option moneyness The
derivative was computed numerically based on the following
parameters T=4 σ=30 K=100 r=3 q=0 a=065 λ =225
Proposition 2 the value of the stock option contract to a CPT- employee is decreasing with
respect to his degree of loss-aversion (ie a decreasing function of λ)
(Proofs are provided in appendix B)
I performed a similar analysis in order to get a view on the effect of the curvature parameter In
the same way I assessed locally the first order derivative with respect to within a range of values
from 005 to 1 and using share prices ranging from 10 to 200 Figure 4 shows that this derivative is
locally increasing with the option moneyness for values of above say 075 It also shows broadly
that the subjective value is an increasing monotone function of over a range of values around the
experimental estimate of 088 (from 07 to 1) irrespective of the option moneyness
2 Incentives from stock-options
Stock-options are incentive tools used within a principal-agent relationship to align the interests of
the agent (employee) on those of the principal (shareholders) The shareholders grant stock options in
15
order to provide the employee with incentives to make efforts that enhance the value of the firm and
thus their own wealth Indeed assuming that employees are aware of how their actions affect the share
price option holdings will prompt them to make efforts that increase share price Therefore the
incentive from a single option grant will depend on the degree of the sensitivity of the subjective value
to the stock price
21 The incentive measure
Following Jensen and Murphy (1990) Hall and Murphy (2000 2002) and others I defined the
incentive effect as the first order derivative of the subjective value with respect to share price (
aC
S
)
which defines how the value from the employee perspective changes with an incremental change in
the stock price As we can see in figure 5 which is a plot of
aC
S
for three values of a incentives
are greatest for in-the-money10
options Also the incentive effect is increasing with the degree of
probability weighting Another observation that can be made from figure 5 is that for sufficiently high
level of probability weighting the option can give much more incentive to increase stock price than is
reflected by the BS delta This is consistent with my previous finding that the subjective value can
overstate the BS value Note that consistently with the EUT-based models when the employee
process probabilities in a linear way ( 1a ) - which means that the probability weighting assumption
is relaxed and only loss-aversion matters - the incentives lie strictly under the BS delta whatever the
level of the option moneyness That is to say that the options are less attractive for both risk-averse
employee and loss-averse employee who are not subject to probability weighting The analysis in
figure 6 supports this It shows that with a hold constant at 065 incentives are decreasing in loss-
aversion Conversely with loss-aversion parameter set to 1 which means that the loss-aversion
effect is neutralized incentives for a representative loss-neutral employee with a degree of probability
weighting equal to experimental estimate of 065 overstate the BS delta
10
The terminology ldquoat-the-moneyrdquo is referring to stock-options with an exercise price equal to the stock price at
inception The expressions ldquoOut-of- the-moneyrdquo and ldquoIn-the-moneyrdquo are also used throughout the paper to refer
to options with strike price respectively below and above the grant date stock price
16
Figure-5 The effect of probability weighting on stock-option
incentives This figure is plots of the partial derivative of the
subjective value with respect to stock price ldquoSrdquo against the option
moneyness It exhibits the combined effects of probability
weighting and option moneyness on incentives The derivatives
were computed numerically assuming three different levels of
probability weighting (see the legend above) and holding the
remaining parameters constant at the following values T=4
σ=30 K=100 r=3 q=0 λ=225 α=088
Figure-6 The effect of loss-aversion on stock-option incentives
This figure is plots of the partial derivative of the subjective value
with respect to stock price ldquoSrdquo against the option moneyness It
exhibits the combined effects of loss-aversion and option
moneyness on incentives The derivatives were computed
numerically assuming three different levels of loss-aversion (see
the legend above) and holding the remaining parameters constant
at the following values T=4 σ=30 K=100 r=3 q=0
a=065 α=088
22 Implications for stock option design optimal strike price
Setting the strike price of standard stock options boils down to defining the threshold against which
the performance is assessed and consequently to determining the likelihood of a final payout As we
have just noticed from figure 5 and figure 6 incentives increases in the option moneyness and
equivalently decreases with strike price In parallel from the shareholders perspective granting in-
the-money options is much more costly than granting out-of-the money or at-the-money options
(recall figure 1) This leads the firm to a trade-off to make when setting the exercise price of the
options in the sense that holding his cost unchanged she could either grant fewer options at a low
strike price or increase the grant size at higher exercise price
I relied on the methodology from Hall and Murphy (2002) in figuring out the optimal exercise price
satisfying the double purpose of maximizing incentives and holding constant the firmrsquos cost of
granting options I also considered two situations In the first situation the firm does not adjust the
existing compensation package when grating additional stock options Thus these additional options
are considered as a pure add-on to existing compensation In the second situation however the
employee and the firm are allowed to bargain efficiently over the terms of the compensation Thus the
17
firm is assumed to fund additional options by an adjustment to other compensation components that
leaves the employee indifferent between his initial package and the new package including the
additional grant
221 Situation 1 Option grant without a compensation offset
When the firm is not allowed to adjust the existing compensation package the optimal strike price
that maximizes incentives for a given amount of firm cost is the solution to the following constrained
optimization problem
m ax
a
K
nC K
S
such that n K c (7)
Where a
nC K
S
denotes the incentives from receiving n options with a strike price K and
K the per-unit cost or the BS value of one option
The optimization problem in (7) is solved numerically by varying the parameter K First the BS
value is computed for a given K which enable to determine the grant size n that leaves the firm cost
constant at c in accordance with the constraint in (7) Then the cost function a
nC K
S
is assessed
based on n and K This procedure is reiterated recursively until the optimal value of K is found
I set the total cost for the firm at euro28 333c (hence a grant of 1000n at-the-money options
based on the retained option-related parameters) As reported in figure 7 I varied the preferences-
related parameters a and within specific ranges in order to figure out the conditions under which an
optimal strike may exist and the robustness of the model predictions The chart on the left-hand side
exhibits the total incentives from the grant as a function of the strike price and the probability
weighting parameter with the loss-aversion held constant at 225 It shows that the convexity and
the monotony of the total incentives function ( a
nC K
S
) shift with the degree of probability
weighting while it is concave and non-monotone over the range of strike prices for low levels of
probability weighting ( 0906a ) it becomes convex and monotonically increasing for higher levels
Moreover for higher level of volatility probability weighting is expected to affect more deeply the
shape of total incentives function (recall figure 2)
Specifically when the effect of probability weighting prevails (ie dominates that of loss-aversion)
the model predicts that incentives could be infinitely increased by granting more and more options at
higher and higher strikes This result suggests that if the employee is subject to a degree of probability
18
weighting that could potentially lead him to overstate the value of the option in excess of the BS value
he would ask for the maximum number of options (as much options as the company could possibly
grant him) at their (highest) breakeven strike the higher the strike price the more small probabilities
of large gains there are and the more valuable become options to him Furthermore this means that
such an employee would be much more interested in premium options instead of discount options
Actually although this result is in stark contrast with the common stock-based compensation practices
that consist in granting broadly at-the-money options it shouldnrsquot be rejected without taking into
account the other factors restricting the number of options the company could issue irrespective of
their strike prices such like capital dilution limits
In addition as we can notice from the plot in the middle of figure 7 the effect of probability
weighting on total incentives could be offset by an increasing loss-aversion This time is varied and
a held constant at 065 which meets the experimental estimate When the loss-aversion effect
dominates the total incentives function tends to non-monotone concave shapes which means that it
admits finite extremas In particular when probability weighting effect is neutralized by setting 1a -
in other words the employee is not subject to probability weighting - total incentives curve tends to
flatten around the optimum (see the green curves on the right-hand side plot) This suggests that there
exists a range of strike prices that yield quasi-similar incentives For instance with loss-aversion set
at 225 optimal strike (as of stock price at inception) is about 142 and lies within a range of
values from 121 to 153 that yield total incentives of about euro530 (rounded figure) With 6
the optimal strike drops by almost 30 (to 112) and total incentives are flat around the maximum
value of euro450 within the range from 91 to 111 Note that these results are consistent with Hallrsquos
and Murphyrsquos (2000 2002) findings relying on the EUT framework Consistently their work
documented that incentive-maximizing strike price exists when the options are considered as an add-
on to existing compensation In addition they showed that total incentives are relatively flat around
the maximum and that optimal strike price decreases for more risk-averse and less diversified
employees
19
Figure-7 Incentives from options grant with total cost of euro28 333 assuming no adjustment to existing compensation package This figure is plots of
incentives (in Keuro) from options grant for a given strike price holding the total BS value of the grant constant at euro28 333 Total incentives are defined as the
partial derivative of the total subjective value of the grant with respect to stock price ldquoSrdquo The sub-figure on the left-hand side depicts total incentives as a
function of the strike price and probability weighting parameter That in the middle is a plot of total incentives against strike price and loss-aversion The
sub-figure on the right-hand side exhibits the combined effect of probability weighting and loss-aversion on the shape of total incentives as a function of
strike price The derivatives were computed numerically based on the following parameters T=4 σ=30 S=100 r=3 q=0 α=088
222 Situation 2 Option grant with an adjustment to existing compensation
Now letrsquos considerer that the company is allowed to make an efficient adjustment to existing
compensation components (cash for example) in order to grant additional options to the employee
The impact of this adjustment should be neutral with regard to the total compensation cost for the
company Moreover assuming this adjustment involves cash compensation it must be attractive to the
employee so that hersquod be willing to give up some cash compensation against extra options grant
Therefore it must leave the employee at his initial total subjective value of the compensation package
It follows that the strike price that maximizes total incentives for a given company cost is the solution
of this following optimization problem
m ax
a
K
nC K
S
subject to a
n K nC K c
and 0n (8)
20
Where c is a fixed constant The constraint in (8) is the aggregation of the company cost constraint
and the employee value constraint used in Henderson (2005)
Similar to that in (7) this optimization problem was solved numerically In this analysis c was
chosen such that for retained parameters the number of granted at-the-money options n is around
1000 hence total cost of euro28 333 Once c is set n is determined from the constraint in (8) for a given
strike price K S then total incentives
anC K
S
are assessed These are depicted in figure 8
The left-hand side sub-figure exhibits total incentives for different levels of K and probability
weighting parameter a with risk aversion held constant at 225 For each combination of K and
a the constraint in (8) is solved for n which allows to determine total incentives The plots indicate
that when the employee is deeply subject to probability weighting ( 0475a )
anC K
S
is
strictly decreasing throughout the depicted range of strike prices (see the curves in blue) In this case
similar to EUT-based studiesrsquo findings (Hall and Murphy 2002 Henderson 2005) incentives are
maximized through restricted stocks grant rather than stock options The intuitive reason behind that
is given that the employee systematically values the options in excess of their BS value efficient
trade-off over compensation allocation is made via the grant of equity-based instruments that
employee values at their actual cost restricted stocks for instance
However for lower degrees of probability weighting (typically 0475 085 a ) the optimal
strike price is not nil and tends to increase with a Specifically the optimization problem is defined
on the right (see the red solid curve) or on the left (see the red dashed curve) of the optimal
strike
K and
anC K
S
admits an infinite branch in
K (ie total incentives are infinite at that
point) The technical reason behind that is that the subjective value is equal to the BS value at the
optimal strike which yields according to the constraint in (8) an infinite grant size
(
lim
K K
n K ) For instance
K ranges from 60 to 195 when a takes values within a range
of value around the experimental estimates ( 055 070a )11
This suggests that depending on the
extent to which employee weights probabilities either grants of discount options or premium options
may result in a Pareto optimum to the contract As a specific example for an employee with
0616a the optimal strike price
K is around 100 which means that for the prevailing setting
the model predicts at-the-money options as optimal in an efficient contracting framework since the
companyrsquos cost of granting these options is equal to their value to the employee In this case granting
11
Optimal strikes are expected to be lower for higher stock price volatility since probability weighting effect
tends to increase with volatility (recall figure 2)
21
options with strike price around the stock price at inception which is consistent with observed
practices results in a perfect reconciliation of the company and the employee respective views Note
that for a similar setting in the previous situation where the options are given as an add-on to existing
compensation the model indicates that incentives from stock options could be infinitely increased by
granting increasingly more options at greater and greater strike price
Furthermore for weak degrees of probability weighting ( 085 a ) the subjective value of the
option lies strictly below the BS value because the effect of loss-aversion tends to dominate that of
probability weighting Thus the total incentives function takes a non-monotone concave shape and
shows finite extremas ranging from 35 to 81 In particular when probability weighting assumption
is relaxed ( 1a ) the function flattens around the maximum and approaches a monotone decreasing
shape with increasing loss-aversion (see sub-figure on the right-hand side) This result suggests that
loss-averse employees who are not subject to probability weighting - even with very low degree of
probability weighting - receiving options at high exercise price would willingly accept a cut in cash
compensation to receive instead deep discount options or restricted shares for those of them displaying
more loss-aversion Again this is broadly consistent with Hallrsquos and Murphyrsquos (2002) and
Hendersonrsquos (2005) findings for non-diversified risk-averse employees
Last but not least the sub-figure in the middle of the main figure is plots of total incentives against
the strike price each of them corresponds to a given level of loss-aversion The purpose of this
analysis consists in showing the effect of loss-aversion on
K by holding a constant at 065 and
varying It mainly shows that loss-aversion has an effect opposite to that of probability weighting
when probability weighting effect is dominant12
(ie the employee may potentially put overstated
value in the option specifically for high strikes) optimal strike increases and total incentives decreased
with loss-aversion Conversely when loss-aversion effect is dominant as stated before the model
yields predictions comparable to that of the EUT-based models
12
See the limit case of 1 where risk-aversion is ignored (the blue dashed curve)
22
Figure-8 Incentives from options grant with total cost of euro28 333 assuming cash compensation is adjusted This figure is plots of incentives (in Keuro) from options grant
for a given strike price holding the total compensation value constant from both company and employee perspectives Total incentives are defined as the partial
derivative of the total subjective value of the grant with respect to stock price ldquoSrdquo The sub-figure on the left-hand side depicts total incentives as a function of the strike
price for varying levels of probability weighting parameter That in the middle is a plot of total incentives against strike price for varying levels of loss-aversion The
sub-figure on the right-hand side exhibits the sole effect of loss-aversion (with no probability weighting) on the shape of total incentives as a function of strike price The
derivatives were computed numerically based on the following parameters T=4 σ=30 S=100 r=3 q=0 α=088
3 Do stock-options provide incentive for risk taking
Earlier studies (Agrawal and Mandelker 1987 DeFusco et al 1990 Hirshleifer and Suh 1992)
have built on insights from standard option pricing theory to predict that option-compensated
managers will be motivated to increase the asset variance and leverage of their firms because the
convexity of the option payoff increase its value as the volatility of the stock price increases Lambert
et al (1991) was the first to call into question this assertion They proved that a non-diversified risk-
averse executive may not necessarily take actions that increase stock price volatility because that
parameter of the distribution of the stock price has two conflicting effects on the subjective value of
the option a positive effect implied by the payoff convexity and a negative effect due to the concavity
of the executiversquos utility function Henderson (2005) draws conclusions from a EUT-base model
consistent with these findings Specifically she finds that stock-options provide incentives for a risk-
averse manager to increase the beta of the company (ie the market risk-to-firm specific risk ratio)
rather than total risk Although there is some empirical evidence supporting the prediction that stock-
options do not systematically encourage risk taking it is still very scarce13
13
See for instance Cohen et al(2000) and Rajgopal and Shevelin (2002)
23
Figure-9 The effect of loss-aversion and probability weighting on risk-taking incentives implied by stock-options This figure is plots
of the partial derivative of the subjective value with respect to stock price volatility ldquoσrdquo against the option moneyness It exhibits on
the one hand the combined effects of loss-aversion and option moneyness (chart on the right-hand side) and on the other hand the
combined effects of probability weighting and option moneyness (chart on the left-hand side) on risk-taking incentives The derivatives
were computed numerically assuming three different levels of loss-aversion and probability weighting (see the legends above) and
holding the remaining parameters constant at the following values T=4 σ=30 K=100 r=3 q=0 α=088
I revisited the risk taking incentives issue from the perspective of an executive with CPT
preferences Similar to previous studies I defined incentives for risk taking as the first order derivative
of the subjective value in (6) with respect to volatility (a
C
)
14 In order to figure out the link
between risk-taking incentives from stock-options and the parameters related to preferences I
performed a numerical analysis on the sensitivity of a
C
to loss-aversion and probability weighting
The results are reported in figure 8 hereafter
The left-hand side subfigure is plots of a
C
as a function of the stock price for several degrees
of probability weighting with loss-aversion held constant at 225 The purpose of the underlying
analysis is to figure out broadly the extent to which a loss-averse executive subject to probability
weighting would prefer a high or low risk given the way the latter influences the option value from his
own perspective The first essential result from this analysis is that incentives for risk taking are
14
Actually the sensitivity of the subjective value to a parameter of the probability distribution of the stock price
provides a measure of the executive incentive to make decisions that influence that parameter
24
increasing with probability weighting degree In fact the probability weighting leverages the positive
effect of volatility on the subjective value through the convexity of the option payoff Another
observation that could be made is that for sufficiently high degree of probability weighting
( 070a )a
C
lies strictly above the conventional BS Vega over the retained range of stock prices
(see the red and the green curves) This means that an option-compensated CPT-executive subject to
probability weighting may be more prompted than a risk-neutral executive to act in order to increase
assets volatility Note that for typical setting of a at 065 the model predicts that a CPT-executive
with a such preferences calibration will have incentives to act in order to increase the volatility of the
stock price by 1 if he targets a 87 cts - increase of the value of his at-the-money 4-year option
In addition when probability weighting is ignored by setting 1a only the effect of loss-aversion
on risk taking incentives is captured The analysis of this effect is reported in the subfigure on the
right-hand side More explicitly this subfigure exhibits plots of a
C
for several levels of with
probability weighting effect neutralized It shows mainly that risk-taking incentives from stock-options
are decreasing with loss-aversion Moreover it appears that a
C
turns negative over a given range
of stock prices where the option is in-the-money Therefore consistent with findings from EUT-based
models the CPT model predicts that a loss-averse executive who is not subject to probability
weighting may not prefer an increase in the variance of the company stock price return As a specific
example an executive with a loss-aversion parameter 6 who processes probabilities in a linear
way (see the yellow curve) and holds 4-year stock options will have incentives to decrease rather than
increase the volatility of the company stock price if the stock price is above 130 the strike price of
his options
In essence incentives for risk taking from stock options - defined as the sensitivity of the
subjective value to the stock price volatility - is subject to two opposite effects under the CPT-based
model a positive effect from the convexity of the optionrsquos payoff leveraged by the probability
weighting feature and a negative effect from the loss-aversion coefficient Therefore there is a mixed
effect on risk taking incentives depending on which of the two effects dominates This will depend
obviously on the option moneyness and the other option-specific parameters
Conclusion
This paper proposes an alternative theoretical model of stock option subjective value to analyze
their incentive effects for employees The model predictions ascertain the ability of CPT to explain
some prominent incentive patterns that EUT models have difficulties to capture It mainly provides
25
arguments on the well documented tendency of employees to frequently value - under some
circumstances - their options in excess of their cost to the company Specifically these results
highlight the economic rational for firms in particular those with higher risk to widely use stock
options in non-executive employee compensation (Spalt 2008)
Loss aversion and probability weighting are the key features driving the subjective value in the
CPT model These parameters have countervailing effects on the modeled subjective value Depending
on which of them is dominant in the preferences calibration the model yields different predictions
regarding incentives Specifically consistent with some behavioral patterns observed in many surveys
and experimental studies on equity-based compensation the model predicts that when the probability
weighting feature prevails the subjective value may overstate the risk-neutral value of the option In
this case assuming the company and the employee bargain efficiently over the compensation
components incentives are maximized for strike prices set around the stock price at inception for a
representative employee with preferences calibration meeting the experimental estimates from CPT
(Tversky and Kahneman 1992) Obviously this finding is consistent with companiesrsquo actual
compensation practices Moreover executives with such preferences profile may be prompted to act in
order to increase share price volatility However when the emphasis is put on the loss-aversion
feature by relaxing the probability weighting assumption the model yields results comparable to
those of EUT-based models In particular the model predicts that loss-averse employees who are not
subject to probability weighting or even with very low degrees of probability weighting receiving
options at high exercise price would willingly accept a cut in compensation to receive instead deep
discount options or restricted shares for those of them displaying more loss-aversion Furthermore the
model shows that loss-averse executives who are processing probabilities in a linear fashion may not
prefer an increase in the variance of the company stock price return
Despite their practical interest the conclusions from the results of this research should not be
drawn without underlining some of its limitations The first one concerns the specification of the CPT
model Actually although the reference point specification in the model is consistent with both
empirical evidence on people setting reference points in a dynamic fashion and firmsrsquo widespread use
of the BS value as a standard for Financial and Human Resources disclosers empirical and
experimental literature is still silent on how people set reference points when assessing complex
gambles like stock option payoffs In addition to keep the model tractable only European-style
options were studied in this paper The model is still however easily extendable to Bermudian-style
options using numerical schemes such like lattice approaches The other limitation of this study is
related to the large heterogeneity in probability weighting that may exist across individuals (Wu and
Gonzalez 1996) The Tverskyrsquos and Kahnemanrsquos (1992) weighting function used in the model
provides only a fit to the median profile
26
Finally this work highlights - as did some previous eminent researches in this field (Dittmann et
al 2008 Splat 2008) - a number of future promising research directions in equity-based
compensation incorporating CPT framework For instant exploring the ability of CTP to explain the
growing use of performance shares plans instead of stock options in employee compensation would be
of great interest for future research Furthermore given that several empirical studies has documented
that employee stock option exercise behavior is also driven by behavioral factors a promising research
direction incorporating CPT is studying its ability to predict exercise patterns
Appendix A proofs of proposition 1
This appendix provides heuristic proofs of proposition 1
To prove that the subjective value a
C
is decreasing in 028 1a it is sufficient to show that
the expectation a
E
is a decreasing function of a Letrsquos first rewrite the expectation in (6) as follows
=
a aIP T IP T
x
a
IR
E v h E v h g x
w x u du x dx
Where
1
2 1
2
g x K x l
w x K g x l x l
x l
with 0 1 and 1 (A1)
Since w x
is derivable over 1IR l an expansion in Taylor series at the first order gives
w x w y x y w y
with 1y IR l
Introducing the expectation operator with respect to the transformed probability measure we have
a aIP IP
x
IP a
E w x w y E x y w y
w y E x u du y w y
(A2)
27
Since w x
is monotone increasing in x we have 0w y Then it follows from (A2) that
proving that a
E
is locally decreasing with respect to a in 1y IR l boils down to showing that
0
x
IP aE x u du
a
(A3)
Noting that
x
au du is positive and convex with respect to 1 1
x l l we
have according to Jensen inequality
IPE xx
IP a IP aE x u du E x u du
Since x follows a standard normal distribution which is symmetric in 0IP
E x we get from
the inequality above by substituting IPE x in the right hand side
0
x
IP aE x u du (A4)
Note that the result in (A4) above showing that the expectation under the transformed
probabilities overstates that under the original probabilities is a consequence of the probability
weighting function feature stated in sect112 which consists in infinitely-overweighting infinitesimal
probabilities and infinitely-underweighting near-one probabilities
Furthermore noting that the convexity of
x
au du with respect to 1 1
x l l
is decreasing in a and using the result in (A4) we have for 028 1 a b
IP IPE x E xx x
IP a IP a IP b IP bE x u du E x u du E x u du E x u du
Or equivalently
x x
IP a IP bE x u du E x u du (A5)
28
This proves that the condition in (A3) holds which means that a
C
is a decreasing function of
028 1a QED
Appendix B proofs of proposition 2
Taking the derivative of the subjective value function in (6) with respect to λ yields
1
1
1
1
1 0
1
a rT
a a
a
a a a rT
EE e if E
C
E E Ee otherw ise
(B1)
Where
1 2 3
a a a aE I I I
(B2)
Using the formulas in equations from (62) to (64) we can rewrite the derivatives in (B2) as follows
1
0
aI
1
2
2
l x
a
a
l
IK g x u du x dx
23
l
a
a
Ix dx
Then substituting these results in place of the derivatives in (B2) we obtain
1 2
2
l lx
a
a a
l
EK g x u du x dx x dx
(B3)
Given that
0
aE
we conclude that
aC
is nonpositive This implies that
aC
is a decreasing
function of QED
29
References
Abdellaoui M (2000) ldquoParameter-Free Elicitation of Utility and Probability Weighting Functionsrdquo
Management Science Vol 46 No 11 pp 1497-1512
Agrawal A Mandelker G (1987) ldquoManagerial incentives and corporate investment and financing
decisionsrdquo Journal of Finance Vol 42 No 4 pp 823-837
Bahaji H (2009) ldquoLe comportement drsquoexercice des porteurs de stock-options une eacutetude empirique
sur le marcheacute Ameacutericainrdquo Working Paper DRM Finance- Universiteacute de Paris Dauphine Paris June
2009
Barberis N and Thaler R(2003) ldquoA survey of behavioral financerdquo in Constantinides G Harris M
and Stulz R (Ed) Handbook of the Economics of Finance North-Holland Amsterdam
Bleichrodt H and Pinto JL (2000) ldquoA Parameter-Free Elicitation of the Probability Weighting
Function in Medical Decision Analysisrdquo Management Science Vol 46 No 11 pp 1485-1496
Cai J and Vijh AM (2004) ldquoExecutive stock and option valuation in a two state variable
framework allowing optimal investment of outside wealth in the risk-free asset and the market
portfoliordquo Working Paper University of Iowa
Camerer C and Ho TH (1994) ldquoViolations of Betweenness Axiom and Nonlinearity in
Probabilityrdquo Journal of Risk and Uncertainty Vol8 No 2 pp 167-196
Cohen RB Hall BJ and Viceira LM (2000) ldquoDo executive stock options encourage risk taking
rdquo Working Paper Harvard Business School
Cook P and Clotfelter C (1993) ldquoThe peculiar scale economies of lottordquo American Economic
Review Vol 83 No3 pp 634-643
DeFusco R Johnson R and Zorn T (1990) ldquoThe effect of executive stock option plans on
stockholders and bondholdersrdquo Journal of Finance Vol45 No 2 pp 617-627
Detemple J and Sundaresan S (1999) ldquoNontraded asset valuation with portfolio constraints a
binomial approachrdquo Review of Financial Studies Vol 12 No 4 pp 835ndash872
Devers C Wiseman R and Holmes M (2007) ldquoThe effects of endowment and loss aversion in
managerial stock option valuationrdquo Academy of Management Journal Vol 50 No 1 pp 191-208
Dittmann I and Maug E (2007) ldquoLower salaries and no options On the optimal structure of
Executive payrdquo The Journal of Finance Vol 62 No 1 pp 303-343
Gneezy U (1998) ldquoUpdating the Reference Level Experimental Evidencerdquo Working paper
University of Haifa
Hall B and Murphy K (2000) ldquoOptimal Exercise prices for executive stock optionsrdquo American
Economic Review Vol 90 No 2 pp 209-214
30
Hall B and Murphy K (2002) ldquoStock options for undiversified executivesrdquo Journal of Accounting
and Economics Vol 33 No 2 pp 3-42
Hallock K and Olson G (2006) ldquoThe value of stock options to non-executive employeesrdquo Working
Paper No 11950 National Bureau of Economic Research Cambridge
Heath C Huddart S and Lang M (1999) ldquoPsychological factors and stock option exerciserdquo
Quarterly Journal of Economics Vol 114 No 2 pp 601-628
Heisler J(1994) ldquoLoss aversion in a futures market an empirical testrdquo Review of Futures Markets
Vol 13 No 3 pp 793ndash822
Henderson V (2005) The impact of the market portfolio on the valuation incentives and optimality
of executive stock options Quantitative Finance Vol 5 No 1 pp 35-47
Hirshleifer D and Suh R (1992) ldquoRisk Managerial Effort and Project Choicerdquo Journal of
Financial Intermediation Vol 2 No 3 pp 308-345
Hodge F Rajgopal S and Shevlin T (2006) ldquoHow do managers value stock options and restricted
stock rdquo Working Paper University of Washington
Holmstrom BR and Milgrom PR (1987) ldquoAggregation and linearity in provision of intertemporal
incentivesrdquo Econometrica Vol 55 No 2 pp 303-328
Huddart S and Lang M (1996) ldquoEmployee stock option exercises an empirical analysisrdquo Journal
of Accounting and Economics Vol 21 No 1 pp 5-43
Jensen M and Murphy KJ (1990) ldquoPerformance pay and top-management incentivesrdquo Journal of
Political Economy Vol 98 No 2 pp 225-264
Jenter D (2001) ldquoUnderstanding high-powered incentivesrdquo Working Paper Harvard Business
School and Economics Departement
Johnson SA and Tian YS (2000) ldquoThe value and incentive effects of non-traditional executive
stock option plansrdquo Journal of Financial Economics Vol 57 No 1 pp 3-34
Jullien B and Salanie B (2000) ldquoEstimating preferences under risk The case of racetrack bettorsrdquo
Journal of Political Economy Vol 108 No 3 pp 503-530
Kachelmeier S and Shehata M (1992) ldquoExamining risk preferences under high monetary incentives
experimental evidence from the Peoplersquos Republic of Chinardquo American Economic Review Vol 82
No 5 pp 1120-1141
Kahneman D and Tversky A (1979) ldquoProspect Theory An analysis of decision under riskrdquo
Econometrica Vol 47 No 2 pp 263-292
Lambert R Lanen W and Larcker D (1989) ldquoExecutive stock option plans and corporate dividend
policyrdquo Journal of Financial and Quantitative Analysis Vol 24 No 4 pp 409-424
Lambert R Larcker D and Verrecchia R (1991) ldquoPortfolio considerations in valuing Executive
Compensationrdquo Journal of Accounting Research Vol 29 No 1 pp 129-149
Lambert R and Larcker D (2001) ldquoHow do employees value (often incorrectly) their stock optionsrdquo
available at knowledgewharton
31
Lewellen W Loderer C and Martin K (1987) ldquoExecutive compensation and executive incentive
problem an empirical analysisrdquo Journal of Accounting and Economics Vol 9 No 3 pp 287-310
Loughran T and Ritter J (1995) ldquoThe new issue puzzlerdquo Journal of Finance Vol 50 No 1 pp 23-
51
Markowitz H (1952) ldquoThe utility of wealthrdquo Journal of Political Economy Vol 60 No 2 pp 151-
158
Odean T (1998a) ldquoAre Investors Reluctant to Realize their Lossesrdquo Journal of Finance Vol 53
No 5 pp 1775ndash1798
Rajgopal S and Shevlin T (2002) ldquoEmpirical evidence on the relation between stock option
compensation and risk askingrdquo Journal of Accounting and Economics Vol 33 No 2 pp 145-171
Shefrin H and Statman M (1985) ldquoThe disposition to sell winners too early and ride losers too long
theory and evidencerdquo Journal of Finance Vol 40 No 3 pp 777-790
Sawers K Wright A and Zamora V (2006) ldquoLoss aversion stock-based compensation and
managerial risk-seeking behaviorrdquo paper presented at the AAA 2007 Management Accounting
Section Meeting available at httpssrncom abstract=864224
Thaler R (1999) ldquoMental Accounting Mattersrdquo Journal of Behavioral Decision Making Vol 12 No
3 pp 183-206
Thaler R and Ziemba W (1988) ldquoParimutuel betting markets Racetracks and lotteriesrdquo Journal of
Economic Perspectives Vol 2 No 2 pp 161-174
Tversky A and Kahneman D (1992) ldquoAdvances in Prospect Theory Cumulative representation of
uncertaintyrdquo Journal of Risk and Uncertainty Vol 5 No 4 pp 297-323
Yermack D (1997) ldquoGood Timing CEO Stock Option Awards and Company News
Announcementsrdquo Journal of Finance Vol 52 No 2 pp 449-476
Wu G and Gonzalez R (1996) ldquoCurvature of the Probability Weighting functionrdquo Management
Science Vol 42 No 12 pp 1676-1690

23
Figure-9 The effect of loss-aversion and probability weighting on risk-taking incentives implied by stock-options This figure is plots
of the partial derivative of the subjective value with respect to stock price volatility ldquoσrdquo against the option moneyness It exhibits on
the one hand the combined effects of loss-aversion and option moneyness (chart on the right-hand side) and on the other hand the
combined effects of probability weighting and option moneyness (chart on the left-hand side) on risk-taking incentives The derivatives
were computed numerically assuming three different levels of loss-aversion and probability weighting (see the legends above) and
holding the remaining parameters constant at the following values T=4 σ=30 K=100 r=3 q=0 α=088
I revisited the risk taking incentives issue from the perspective of an executive with CPT
preferences Similar to previous studies I defined incentives for risk taking as the first order derivative
of the subjective value in (6) with respect to volatility (a
C
)
14 In order to figure out the link
between risk-taking incentives from stock-options and the parameters related to preferences I
performed a numerical analysis on the sensitivity of a
C
to loss-aversion and probability weighting
The results are reported in figure 8 hereafter
The left-hand side subfigure is plots of a
C
as a function of the stock price for several degrees
of probability weighting with loss-aversion held constant at 225 The purpose of the underlying
analysis is to figure out broadly the extent to which a loss-averse executive subject to probability
weighting would prefer a high or low risk given the way the latter influences the option value from his
own perspective The first essential result from this analysis is that incentives for risk taking are
14
Actually the sensitivity of the subjective value to a parameter of the probability distribution of the stock price
provides a measure of the executive incentive to make decisions that influence that parameter
24
increasing with probability weighting degree In fact the probability weighting leverages the positive
effect of volatility on the subjective value through the convexity of the option payoff Another
observation that could be made is that for sufficiently high degree of probability weighting
( 070a )a
C
lies strictly above the conventional BS Vega over the retained range of stock prices
(see the red and the green curves) This means that an option-compensated CPT-executive subject to
probability weighting may be more prompted than a risk-neutral executive to act in order to increase
assets volatility Note that for typical setting of a at 065 the model predicts that a CPT-executive
with a such preferences calibration will have incentives to act in order to increase the volatility of the
stock price by 1 if he targets a 87 cts - increase of the value of his at-the-money 4-year option
In addition when probability weighting is ignored by setting 1a only the effect of loss-aversion
on risk taking incentives is captured The analysis of this effect is reported in the subfigure on the
right-hand side More explicitly this subfigure exhibits plots of a
C
for several levels of with
probability weighting effect neutralized It shows mainly that risk-taking incentives from stock-options
are decreasing with loss-aversion Moreover it appears that a
C
turns negative over a given range
of stock prices where the option is in-the-money Therefore consistent with findings from EUT-based
models the CPT model predicts that a loss-averse executive who is not subject to probability
weighting may not prefer an increase in the variance of the company stock price return As a specific
example an executive with a loss-aversion parameter 6 who processes probabilities in a linear
way (see the yellow curve) and holds 4-year stock options will have incentives to decrease rather than
increase the volatility of the company stock price if the stock price is above 130 the strike price of
his options
In essence incentives for risk taking from stock options - defined as the sensitivity of the
subjective value to the stock price volatility - is subject to two opposite effects under the CPT-based
model a positive effect from the convexity of the optionrsquos payoff leveraged by the probability
weighting feature and a negative effect from the loss-aversion coefficient Therefore there is a mixed
effect on risk taking incentives depending on which of the two effects dominates This will depend
obviously on the option moneyness and the other option-specific parameters
Conclusion
This paper proposes an alternative theoretical model of stock option subjective value to analyze
their incentive effects for employees The model predictions ascertain the ability of CPT to explain
some prominent incentive patterns that EUT models have difficulties to capture It mainly provides
25
arguments on the well documented tendency of employees to frequently value - under some
circumstances - their options in excess of their cost to the company Specifically these results
highlight the economic rational for firms in particular those with higher risk to widely use stock
options in non-executive employee compensation (Spalt 2008)
Loss aversion and probability weighting are the key features driving the subjective value in the
CPT model These parameters have countervailing effects on the modeled subjective value Depending
on which of them is dominant in the preferences calibration the model yields different predictions
regarding incentives Specifically consistent with some behavioral patterns observed in many surveys
and experimental studies on equity-based compensation the model predicts that when the probability
weighting feature prevails the subjective value may overstate the risk-neutral value of the option In
this case assuming the company and the employee bargain efficiently over the compensation
components incentives are maximized for strike prices set around the stock price at inception for a
representative employee with preferences calibration meeting the experimental estimates from CPT
(Tversky and Kahneman 1992) Obviously this finding is consistent with companiesrsquo actual
compensation practices Moreover executives with such preferences profile may be prompted to act in
order to increase share price volatility However when the emphasis is put on the loss-aversion
feature by relaxing the probability weighting assumption the model yields results comparable to
those of EUT-based models In particular the model predicts that loss-averse employees who are not
subject to probability weighting or even with very low degrees of probability weighting receiving
options at high exercise price would willingly accept a cut in compensation to receive instead deep
discount options or restricted shares for those of them displaying more loss-aversion Furthermore the
model shows that loss-averse executives who are processing probabilities in a linear fashion may not
prefer an increase in the variance of the company stock price return
Despite their practical interest the conclusions from the results of this research should not be
drawn without underlining some of its limitations The first one concerns the specification of the CPT
model Actually although the reference point specification in the model is consistent with both
empirical evidence on people setting reference points in a dynamic fashion and firmsrsquo widespread use
of the BS value as a standard for Financial and Human Resources disclosers empirical and
experimental literature is still silent on how people set reference points when assessing complex
gambles like stock option payoffs In addition to keep the model tractable only European-style
options were studied in this paper The model is still however easily extendable to Bermudian-style
options using numerical schemes such like lattice approaches The other limitation of this study is
related to the large heterogeneity in probability weighting that may exist across individuals (Wu and
Gonzalez 1996) The Tverskyrsquos and Kahnemanrsquos (1992) weighting function used in the model
provides only a fit to the median profile
26
Finally this work highlights - as did some previous eminent researches in this field (Dittmann et
al 2008 Splat 2008) - a number of future promising research directions in equity-based
compensation incorporating CPT framework For instant exploring the ability of CTP to explain the
growing use of performance shares plans instead of stock options in employee compensation would be
of great interest for future research Furthermore given that several empirical studies has documented
that employee stock option exercise behavior is also driven by behavioral factors a promising research
direction incorporating CPT is studying its ability to predict exercise patterns
Appendix A proofs of proposition 1
This appendix provides heuristic proofs of proposition 1
To prove that the subjective value a
C
is decreasing in 028 1a it is sufficient to show that
the expectation a
E
is a decreasing function of a Letrsquos first rewrite the expectation in (6) as follows
=
a aIP T IP T
x
a
IR
E v h E v h g x
w x u du x dx
Where
1
2 1
2
g x K x l
w x K g x l x l
x l
with 0 1 and 1 (A1)
Since w x
is derivable over 1IR l an expansion in Taylor series at the first order gives
w x w y x y w y
with 1y IR l
Introducing the expectation operator with respect to the transformed probability measure we have
a aIP IP
x
IP a
E w x w y E x y w y
w y E x u du y w y
(A2)
27
Since w x
is monotone increasing in x we have 0w y Then it follows from (A2) that
proving that a
E
is locally decreasing with respect to a in 1y IR l boils down to showing that
0
x
IP aE x u du
a
(A3)
Noting that
x
au du is positive and convex with respect to 1 1
x l l we
have according to Jensen inequality
IPE xx
IP a IP aE x u du E x u du
Since x follows a standard normal distribution which is symmetric in 0IP
E x we get from
the inequality above by substituting IPE x in the right hand side
0
x
IP aE x u du (A4)
Note that the result in (A4) above showing that the expectation under the transformed
probabilities overstates that under the original probabilities is a consequence of the probability
weighting function feature stated in sect112 which consists in infinitely-overweighting infinitesimal
probabilities and infinitely-underweighting near-one probabilities
Furthermore noting that the convexity of
x
au du with respect to 1 1
x l l
is decreasing in a and using the result in (A4) we have for 028 1 a b
IP IPE x E xx x
IP a IP a IP b IP bE x u du E x u du E x u du E x u du
Or equivalently
x x
IP a IP bE x u du E x u du (A5)
28
This proves that the condition in (A3) holds which means that a
C
is a decreasing function of
028 1a QED
Appendix B proofs of proposition 2
Taking the derivative of the subjective value function in (6) with respect to λ yields
1
1
1
1
1 0
1
a rT
a a
a
a a a rT
EE e if E
C
E E Ee otherw ise
(B1)
Where
1 2 3
a a a aE I I I
(B2)
Using the formulas in equations from (62) to (64) we can rewrite the derivatives in (B2) as follows
1
0
aI
1
2
2
l x
a
a
l
IK g x u du x dx
23
l
a
a
Ix dx
Then substituting these results in place of the derivatives in (B2) we obtain
1 2
2
l lx
a
a a
l
EK g x u du x dx x dx
(B3)
Given that
0
aE
we conclude that
aC
is nonpositive This implies that
aC
is a decreasing
function of QED
29
References
Abdellaoui M (2000) ldquoParameter-Free Elicitation of Utility and Probability Weighting Functionsrdquo
Management Science Vol 46 No 11 pp 1497-1512
Agrawal A Mandelker G (1987) ldquoManagerial incentives and corporate investment and financing
decisionsrdquo Journal of Finance Vol 42 No 4 pp 823-837
Bahaji H (2009) ldquoLe comportement drsquoexercice des porteurs de stock-options une eacutetude empirique
sur le marcheacute Ameacutericainrdquo Working Paper DRM Finance- Universiteacute de Paris Dauphine Paris June
2009
Barberis N and Thaler R(2003) ldquoA survey of behavioral financerdquo in Constantinides G Harris M
and Stulz R (Ed) Handbook of the Economics of Finance North-Holland Amsterdam
Bleichrodt H and Pinto JL (2000) ldquoA Parameter-Free Elicitation of the Probability Weighting
Function in Medical Decision Analysisrdquo Management Science Vol 46 No 11 pp 1485-1496
Cai J and Vijh AM (2004) ldquoExecutive stock and option valuation in a two state variable
framework allowing optimal investment of outside wealth in the risk-free asset and the market
portfoliordquo Working Paper University of Iowa
Camerer C and Ho TH (1994) ldquoViolations of Betweenness Axiom and Nonlinearity in
Probabilityrdquo Journal of Risk and Uncertainty Vol8 No 2 pp 167-196
Cohen RB Hall BJ and Viceira LM (2000) ldquoDo executive stock options encourage risk taking
rdquo Working Paper Harvard Business School
Cook P and Clotfelter C (1993) ldquoThe peculiar scale economies of lottordquo American Economic
Review Vol 83 No3 pp 634-643
DeFusco R Johnson R and Zorn T (1990) ldquoThe effect of executive stock option plans on
stockholders and bondholdersrdquo Journal of Finance Vol45 No 2 pp 617-627
Detemple J and Sundaresan S (1999) ldquoNontraded asset valuation with portfolio constraints a
binomial approachrdquo Review of Financial Studies Vol 12 No 4 pp 835ndash872
Devers C Wiseman R and Holmes M (2007) ldquoThe effects of endowment and loss aversion in
managerial stock option valuationrdquo Academy of Management Journal Vol 50 No 1 pp 191-208
Dittmann I and Maug E (2007) ldquoLower salaries and no options On the optimal structure of
Executive payrdquo The Journal of Finance Vol 62 No 1 pp 303-343
Gneezy U (1998) ldquoUpdating the Reference Level Experimental Evidencerdquo Working paper
University of Haifa
Hall B and Murphy K (2000) ldquoOptimal Exercise prices for executive stock optionsrdquo American
Economic Review Vol 90 No 2 pp 209-214
30
Hall B and Murphy K (2002) ldquoStock options for undiversified executivesrdquo Journal of Accounting
and Economics Vol 33 No 2 pp 3-42
Hallock K and Olson G (2006) ldquoThe value of stock options to non-executive employeesrdquo Working
Paper No 11950 National Bureau of Economic Research Cambridge
Heath C Huddart S and Lang M (1999) ldquoPsychological factors and stock option exerciserdquo
Quarterly Journal of Economics Vol 114 No 2 pp 601-628
Heisler J(1994) ldquoLoss aversion in a futures market an empirical testrdquo Review of Futures Markets
Vol 13 No 3 pp 793ndash822
Henderson V (2005) The impact of the market portfolio on the valuation incentives and optimality
of executive stock options Quantitative Finance Vol 5 No 1 pp 35-47
Hirshleifer D and Suh R (1992) ldquoRisk Managerial Effort and Project Choicerdquo Journal of
Financial Intermediation Vol 2 No 3 pp 308-345
Hodge F Rajgopal S and Shevlin T (2006) ldquoHow do managers value stock options and restricted
stock rdquo Working Paper University of Washington
Holmstrom BR and Milgrom PR (1987) ldquoAggregation and linearity in provision of intertemporal
incentivesrdquo Econometrica Vol 55 No 2 pp 303-328
Huddart S and Lang M (1996) ldquoEmployee stock option exercises an empirical analysisrdquo Journal
of Accounting and Economics Vol 21 No 1 pp 5-43
Jensen M and Murphy KJ (1990) ldquoPerformance pay and top-management incentivesrdquo Journal of
Political Economy Vol 98 No 2 pp 225-264
Jenter D (2001) ldquoUnderstanding high-powered incentivesrdquo Working Paper Harvard Business
School and Economics Departement
Johnson SA and Tian YS (2000) ldquoThe value and incentive effects of non-traditional executive
stock option plansrdquo Journal of Financial Economics Vol 57 No 1 pp 3-34
Jullien B and Salanie B (2000) ldquoEstimating preferences under risk The case of racetrack bettorsrdquo
Journal of Political Economy Vol 108 No 3 pp 503-530
Kachelmeier S and Shehata M (1992) ldquoExamining risk preferences under high monetary incentives
experimental evidence from the Peoplersquos Republic of Chinardquo American Economic Review Vol 82
No 5 pp 1120-1141
Kahneman D and Tversky A (1979) ldquoProspect Theory An analysis of decision under riskrdquo
Econometrica Vol 47 No 2 pp 263-292
Lambert R Lanen W and Larcker D (1989) ldquoExecutive stock option plans and corporate dividend
policyrdquo Journal of Financial and Quantitative Analysis Vol 24 No 4 pp 409-424
Lambert R Larcker D and Verrecchia R (1991) ldquoPortfolio considerations in valuing Executive
Compensationrdquo Journal of Accounting Research Vol 29 No 1 pp 129-149
Lambert R and Larcker D (2001) ldquoHow do employees value (often incorrectly) their stock optionsrdquo
available at knowledgewharton
31
Lewellen W Loderer C and Martin K (1987) ldquoExecutive compensation and executive incentive
problem an empirical analysisrdquo Journal of Accounting and Economics Vol 9 No 3 pp 287-310
Loughran T and Ritter J (1995) ldquoThe new issue puzzlerdquo Journal of Finance Vol 50 No 1 pp 23-
51
Markowitz H (1952) ldquoThe utility of wealthrdquo Journal of Political Economy Vol 60 No 2 pp 151-
158
Odean T (1998a) ldquoAre Investors Reluctant to Realize their Lossesrdquo Journal of Finance Vol 53
No 5 pp 1775ndash1798
Rajgopal S and Shevlin T (2002) ldquoEmpirical evidence on the relation between stock option
compensation and risk askingrdquo Journal of Accounting and Economics Vol 33 No 2 pp 145-171
Shefrin H and Statman M (1985) ldquoThe disposition to sell winners too early and ride losers too long
theory and evidencerdquo Journal of Finance Vol 40 No 3 pp 777-790
Sawers K Wright A and Zamora V (2006) ldquoLoss aversion stock-based compensation and
managerial risk-seeking behaviorrdquo paper presented at the AAA 2007 Management Accounting
Section Meeting available at httpssrncom abstract=864224
Thaler R (1999) ldquoMental Accounting Mattersrdquo Journal of Behavioral Decision Making Vol 12 No
3 pp 183-206
Thaler R and Ziemba W (1988) ldquoParimutuel betting markets Racetracks and lotteriesrdquo Journal of
Economic Perspectives Vol 2 No 2 pp 161-174
Tversky A and Kahneman D (1992) ldquoAdvances in Prospect Theory Cumulative representation of
uncertaintyrdquo Journal of Risk and Uncertainty Vol 5 No 4 pp 297-323
Yermack D (1997) ldquoGood Timing CEO Stock Option Awards and Company News
Announcementsrdquo Journal of Finance Vol 52 No 2 pp 449-476
Wu G and Gonzalez R (1996) ldquoCurvature of the Probability Weighting functionrdquo Management
Science Vol 42 No 12 pp 1676-1690