incident detection on urban freeways
TRANSCRIPT

INCIDENT DETECTION ON URBAN FREEWAYS Conrad L. Dudek and Carroll J. Messer,
Texas Transportation Institute, Texas A&M University; and Nelson B. Nuckles, City of Dallas
An automatic incident-detection model using the standard normal deviate (SND) of the control variable (energy or lane occupancy) was proposed, developed, and evaluated. Two strategies were tested using a 3- and 5-minute data base for each control variable. Strategy A required one SND value to be critical; strategy H required two _successive_ S:N'P values _ to _b_e critical. Strategy B, using lane occupancy with a 5-minutetime base, produced the best results. It detected 92 percent of the 35 incidents studied during moderate and heavy flow, with a computer response time of 1.1 minutes and a 1 percent false-alarm rate during the peak period. Based on a limited sample size, the study indicated that the SND model was as effective as the composite model, which was considered to be the best existing model. Because the SND model does not require separate distribution curves for various traffic conditions, it may be a more attractive model for an operational system. Relationships were developed and presented that identify sensor spacing requirements for an incident-detection system using a station model.
•OCCURRENCE of an accident or other lane blockage incident on a freeway reduces the capacity of that section of freeway significantly below normal. Freeway incidents occur randomly, are unpredictable, and result in what is termed nonrecurrent congestion. Moskowitz (1) believes that the ingle most important problem in urban freeway traffic operations fs the determination of a methodology to detect stopped vehicles and the necessary steps to remove the stoppage. West (2) indicates that the nonrecurring freeway congestion due to incidents is responsible for as much motorist delay in the urban area as is the recurring congestion due to geometric bottlenecks. Thus, automatic detection of incidents is a very important function of a corridor surveillance, control, and information system.
This paper is concerned with the development, testing, and evaluation oI automatic · cident-detection..al:;orithmsJor_urba:n..lreewa.ys. .he-emtJhasis-is-di-rccted-towai'dincident detection during medium- and heavy-flow traffic conditions.
PREVIOUS WORK ON INCIDENT -DETECTION MODELS
Six approaches to the automatic detection and location of incidents on the John C. Lodge Freeway in Detroit during the peak period were explored by Courage and Levin (3). These approaches were based on vehicle storage, kinetic energy, energy differ ential (longitudinal), energy distribution (transverse), speed-density characteristics, and metering rates. The researchers conducted limited studies to test the feasibility of the six incident-detection approaches. It was concluded by Courage and Levin that all models demonstrated some ability to detect incidents and may, therefore, merit further consideration. The models exhibited a high false-alarm rate, and the researchers felt that considerable refinement would be required to produce an operational incident-detection scheme.
Publication of this paper sponsored by Committee on Freeway Operations.
12

13
California developed an incident-detection model for use on the Los Angeles freeway system (4). The California model consists of three sequential tests all based on occupancy changes at the upstream and downstream stations of a subsystem. An incident is signaled only when the threshold values for all three variables are exceeded, indicating that the sequence of events associated with a typical capacity-reducing incident has occurred. Like most of the models developed by Courage and Levin, the California model requires that cumulative distribution curves be drawn for each location.
Whitson et al. (5) suggested a detection model using volume as the controlling parameter. A runniilg 5-minute mean of the flow rate was plotted with corresponding upper and lower limits that were a constant 2 standard deviations away from the mean. An incident was detected when the 1-minute flow rate fell below the lower limit for 30 seconds. This model was not fully evaluated with field data.
Cook and Cleveland (~ conducted a study on the John C. Lodge Freeway in which the California model and the first five models developed by Courage and Levin were analyzed. These latter models were referred to as the subsystem shock wave model, station energy model, subsystem energy model, station discontinuity model, and subsys -tern discontinuity model respectively. Cook and Cleveland also combined Courage and Levin's energy distribution model with the speed-density model into a composite model as a means of improving the reliability of detection techniques. In addition, exponential smoothing of traffic stream variables was investigated as an approach to incident detection. Because of the limited work with this latter technique, definite conclusions as to its applicability could not be reached. The effectiveness of the former seven models analyzed was determined, based on a set of 50 incidents. The results of the analysis are given in Table 1.
Cook and Cleveland observed specific weaknesses in the models studied. Particularly, inasmuch as the threshold values for Courage and Levin's models were set at a 1 percent level, the level of false alarms would also be 1 percent. The threshold levels could not be made more stringent without reducing model effectiveness. Cook and Cleveland observed that in most cases the threshold values could be estimated as 1 standard deviatio:1 away from the mean value. They suggested that a more effective method for determining the threshold may be the use of real-time estimates of the standard deviation of the parameter values. Thus, the false-alarm rate possibly could be reduced, and the thresholds would be responsive to such factors as time of day, day of week, and environmental conditions. This approach might also eliminate the need for separate frequency distribution curves for each freeway station and for different periods of the day or weather conditions.
In :i;elated work, Dudek, Messer, and Friebele (!J !!_) developed control logic for automatic operation of safety warning signs at three locations on the Gulf Freeway in Houston. The control logic is not an incident-detection algorithm, but it is responsive to stoppage waves and activates the warning system when a stoppage wave is predicted or sensed downstream of one of the critical overpasses. The logic also turns the system off when the conditions on the freeway no longer warrant the alert provided by the warning system. Three control algorithms were developed using one of the following control variables: energy, speed, or lane occupancy. Each program has been successfully implemented on an operating freeway. The logic using the energy variable has been operating the safety warning system on the Gulf Freeway since April 3, 1972, and the system has responded very satisfactorily to the shock waves on the freeway. Of significance is the fact that, barring the occurrence of hardware failures, the warning system responds to shock waves with a high degree of reliability and is operating such that no false alarms are generated. These are two important criteria for establishing incident-detection algorithms as well.
FACTORS AFFECTING INCIDENT DETECTION
Incident-Detection Time
Incident-detection time can be defined as the elapsed time from the moment the incident occurs until it is detected. In an automatic incident-detection system using a station model, the detection time will be influenced by the following two components:
14
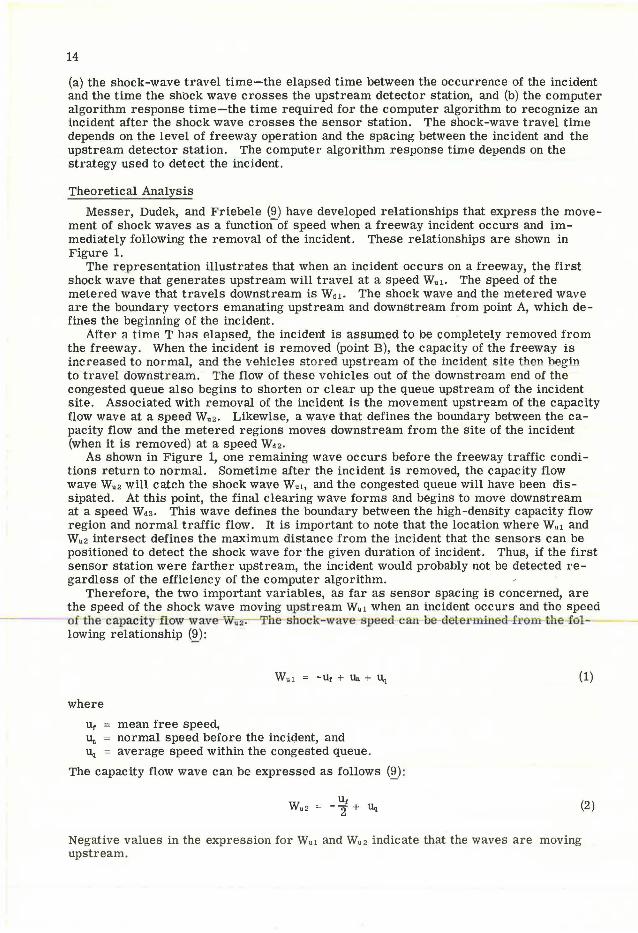
(a) the shock-wave travel time-the elapsed time between the occurrence of the incident and the time the shock wave crosses the upstream detector station, and (b} the computer algorithm response time-the time required for the computer algorithm to recognize an incident after the shock wave crosses the sensor station. The shock-wave travel time depends on the level of freeway operation and the spacing between the incident and the upstream detector station. The computer algorithm response time depends on the strategy used to detect the incident .
Theoretical Analysis
Messer, Dudek, and Friebele (9) have developed relationships that express the movement of shock waves as a function-of speed when a freeway incident occurs and immediately following the removal of the incident. These relationships are shown in Figure 1.
The representation illustrates that when an incident occurs on a freeway, the first shock wave that generates upstream will travel at a speed Wu1 · The speed of the metered wave that travels downstream is Wdl. The shock wave and the metered wave are the boundary vectors emanating upstream and downstream from point A, which defines the beginning of the incident.
After a timP. T h::iR P.lapRed, the incident is assumed to be completely removed from the freeway. When the incident is removed (point B), the capacity of the freeway is increased to normal, and the vehicles stored upstream of the incident site then begin to travel downstr eam. The flow of these vehicles out of the downstream end of the congested queue also begins to shorten or clear up the queue upstream of the incident site. Associated with removal of the incident is the movement upstream of the capacity flow wave at a speed Wu 2. Likewise, a wave that defines the boundary between the capacity flow and the metered regions moves downstream from the site of the incident (when it is removed) at a speed Wd 2·
As shown in Figure 1, one remaining wave occurs before the freeway traffic conditions return to normal . Sometime after the incident is removed, the capacity flow wave Wu 2 will catch the shock wave Wu1, and the congested queue will have been dissipated. At this point, the final clearing wave forms and begins to move downstream at a speed Wd3· This wave defines the boundary between the high-density capacity flow region and normal traffic flow . It is important to note that the location where Wu1 and Wu2 intersect defines the maximum distance from the incident that the sensors can be positioned to detect the shock wave forthe given duration of incident. Thus, if the first sensor station were farther upstream, the incident would probably not be detected regardless of the efficiency of the computer algorithm.
Therefore, the two important variables, as far as sensor spacing is concerned, are the speed of the shock wave moving upstream Wu1 when an incident occurs and the speed
----~o·f-the-capacity-ftow wave-WiJ2 . he-shock-w~ve-t1peed-1..-an b ·cl t e1 n i.ned-f-i•em the-f-al lowing relationship (~):
-Ut + Un + l.lq (1)
where
u, mean free speed, u,. = normal speed before the incic;lent, and 1.1q = average speed within the congested queue.
The capacity flow wave can be expressed as follows (Q) :
(2)
Negative values in the expression for Wu1 and Wu2 indicate that the waves are moving upstream.

Table 1. Review of individual detection model performance(§).
Average Time Lag for First Incidents
Specific to Detection Detected Model Incidents (minutes) (percent)
Composite Yes 0. 81 96 Station discontinuity Yes 2.07 90 Subsystem discontinuity No (bottlenecks,
also) 2.14 74 Subsystem energy No (bottlenecks,
also) 5.83 58 Station energy No 2.58 56 California Yes 0.96 52 Subsystem shock wave No 3.06 32
Figure 1. Model of freeway traffic conditions due to an accident (fil.
NORMAL FLOW, n
~ QUEUE FLOW, q
NORMAL FLOW, n
'G-,.. " v ,,, "'
v 9
DIST MICE
METERED FLOW, m
Figure 2. Sensor spacings for incident duration of 2 minutes or more.
FalseAlarm Rate {percent)
1 1
-0.1 1
lNCIDENT CAPACITY OPERATING CAPACITY ~ O' SIG
. 0
RE SPONSE TIMES
UNSATISFACTORY
• 5 . 60 . 5 • 0 . 5
OPERATING SPEED/FREE SPEED, u/uf ·'· .s .6
SENSOR SPACINGS (MILES) It = Required Detection Time (Dt) - Computer Algorithm Respons e Time (Rt)
c w 1-u w 1-w c Vl 1-z w c u z
u.. 0
1-z w u a: w 0..
.9 1. 0

16
It has also been shown that the average speed within the congested queue u.i can be expressed as a function of the flow during incident conditions and the available capacity under normal conditions as follows (~ :
(3)
where
q the flow under incident conditions and q• = the available capacity under normal conditions.
Sensor Spacing
'T'he maximnm sensor spacing required to detect the shock wave resulting from an incident is the intersect distance between the shock wave traveling upstream at a speed of Wu1 and the capacity flow wave propagating upstream at a speed of Wu2· It is noted, from Eqs. 1, 2, and 3, that the wave speeds Wu1 and Wu2 are functions of the flow during incident conditions q and the available capacity under normal condition q
0• The inter
section distance of the two waves is a function of the wave speeds and the incident duration. Thus, the lower the level of s e r vice is before an incident, the farther upstream the intersection of the two waves will occur for a given duration of incident. Likewise, the longer the incident duration for a given set of operating conditions, the farther upstream the intersection of the two waves will occur. It is therefore necessary to select the minimum duration of incident and the level of freeway operations during which the incident must be detected in order to determine sensor spacing requirements. For example, the operating agency may decide that all incidents of 2 minutes or more must be detected while the freeway is operating at speeds up to 50 mph (80 km/ hour).
Another criterion that must be established is the required incident-detection time. Because incident -detection time is influenced by the shock-wave travel time and the computer algorithm response time, these two factors will affect sensor spacing re quirements. The shock-wave travel time is affected by the freeway operational characteris tics previously described. The computer algorithm response time is a function of the particular algorithm selected for incident detection. For a given duration of incident, freeway level of service, and incident-detection time, the sensor spacing requirements will be influenced by the response time of the incident-detection algorithm. Thus, if the algorithm provides a fast response, the sensors can be positioned farther apart than for a sluggish algorithm.
From Eqs. 1, 2, and 3, two graphs were developed that relate maximum sensor s15acmg tcr1ror-m<ll oper-atnrg s~, ·equiTed rrcident • dete-ction-tim , and-percentage-o incidents that will be detected, based on characteristics observed on the Gulf Freeway in Houston. Figure 2 shows sensor spacings for incidents of 2 minutes or more; Figure 3 shows sensor spacings for incidents of 4 minutes or more. The available detection time (available shock-wave travel time) It is the difference between the required incident-detection time D\ and the computer algorithm response time Rt. The assumption inherent in the two figures is that incidents occur randomly and uniformly over the freeway section. These figures were developed using the following characteristics measured on the Gulf Freeway:
u, 60 mph (97 km/ hour) 2, 880 vph (one-lane blockage) 5, 560 vph
0.516
Two hypothetical examples are presented that illustrate the use of Figures l! and~. Both examples assume that the computer algorithm can detect an incident as soon as the shock wave reaches the upstream sensors, that is, Rt = 0:

Figure 3. Sensor spacings for incident duration of 4 minutes or more.
. 0
INCIDENT CAPACITY .OPERATING CAl'ACIT'i = 0•516
RESPONSE TIMES
UNSATISFACTORY
. s . 0 .65 . 0 . 5
OPERATING SPEED/FREE SPEED, u/uf .3 .4 . 5 .6 ,7 .8
SENSOR SPACINGS (MILES)
It = Required Detection Time (Dt) - Computer Algorithm Response Time (Rt)
Figure 4. Schematic of incident detection strategies A and B.
Start
Store Data Previous n Periods,
xl, x2 •• ·Xn
Compute X, s
Collect Data Next Period,
xn ... l
Compute SNDn+l _
x - " SND = n+l n+l R
No Enter Stoppage Wave Program
Incident Detected by Strategy A
Collect Data Next Period,
xn+2
Compute SNDn+2
llo Enter Stoppage Wave Program
Inoiden t De teated by Strategy B
Enter Stoppage Wave Program
LL 0
1-z: w u
"" w "-
.9 1.0

18
1. The problem is to determine the maximum sensor spacing for a freeway incident detection system. The system should be capable of detecting all incidents blocking a freeway lane for 2 or more minutes while the freeway is operating at speeds up to 48 mph (77 km/ hour), i.e., u/ llf = 0.80. The system should be capable of detecting the incidents within 2 minutes after they occur. From Figure 2, it is determined that the maximum sensor spacing to satisfy the above requirements is 0. 1 mile (0.16 km). Note that if the s ensors a r e spaced 0.4 mile (0.6 km) apart, only 25 percent of the incidents would be detected within the 2-minute incident-detection requirement.
2. The problem is to estimate the percentage of incidents that will be detected by an incident-detection system having a given sensor spacing. The sensors are spaced 0.5 mile (0.8 km) apart. The system should be capable of detecting incidents that block a freeway lane for 4 minutes or more while the freeway is operating at speeds up to 40 mph (64 km/hour), i.e., u/u, = 0.67. The system should be capable of detecting the incidents within 2 minutes after they occur. From Figure 3, it is observed that the system will detect approximately 70 percent of the incidents. Note thnt the sensor spacing to detect 100 percent of the incidents is approximately 0.37 mile (0.6 km).
The foregoing results apply to only those freeways that have the same traffic operating conditions as the Gulf Freeway. When these conditions are different, separate curves as shown in Figures 2 and 3 would need to be developed by using Eqs. 1, 2, and 3. Also, this discussion applies to station incident-detection models that use the upstream sensor station to analyze the discontinuity in flow.
INCIDENT-DETECTION MODEL DEVELOPMENT
Cook and Cleveland (6) suggested inherent weaknesses in the existing incidentdetection models. Most- models require development of frequency distributions for the measured traffic variable as the procedure for identifying threshold values for incident detection. Because of the hourly and daily variations in traffic flow and the effects attributed to pavement and environmental conditions, several frequency distributions would be required for each set of conditions at each freeway sensor station. It may be diffic ul.t to account for all variables involved. Ti tlu:eshold values are set at th 1 percent level, the level of false alarms will also be 1 percent. The threshold values cannot be made more stringent without reducing model effectiveness in terms of detecting incidents.
Standard Normal Deviate Model
One approach to circumvent the given weaknesses is to consider the rate of change of the control traffic variable rather than an absolute threshold vaiue. It is hypothesized thaLa...high-rate-oLchang~-the-control--v.a.r-iable--w.m-refl.ect.-an inc.ident--situat-ion-as~distinguished from a normal demand-capacity problem caused by geometrics. The statistic proposed for the control function is the standard normal deviate (SND) of the control variable. The concept is to evaluate the trends in the control variable (e.g., occupancy, energy) and to recognize when the variable changes rapidly in relationship to expected changes caused by normal fluctuations in traffic flow.
The SND is a standardized measure of the deviation from the mean in units of the standard deviation and is expressed by the following relationship:
where
SND = x - x s
x = a given value from the data set, x = mean of data set, and s = standard deviation of data set.
(4)
In the application of SND to incident detection, the above variables take on the following meaning:

19
x = value of control variable at time t, x = mean of control variable over previous n sampling periods, and s = standard deviation of control variable over previous n sampling periods.
The value of SND will thus reflect the degree to which the control variable has changed in relationship to the average trends measured during previous intervals. A large SND value would reflect a major change in operating conditions on the freeway.
The overall incident-detection concept suggested in this paper is to incorporate an incident-detection algorithm with a stoppage-wave-detection algorithm previously developed for operation of the safety warning devices on the Gulf Freeway (7, 8). When stoppage waves are detected by the latter algorithm, each wave will be an3.l.yzed by the incident-detection algorithm to ascertain whether the waves resulted from a freeway incident (e.g., accident, stalled vehicle) in contrast with a geometric bottleneck. The model proposed is a station model that detects incidents that occur downstream of the sensor station.
Operational Approaches
Two operational approaches or strategies are identified and evaluated. Strategy A requires one SND value to be critical; strategy B requires two successive SND values to be critical. These strategies are consistent with techniques developed in earlier research on incident detection. Schematics of strategies A and B are shown in Figure 4.
STUDY METHOD
The SND incident-detection model was tested and evaluated on the Gulf Freeway in Houston. The facility is a 6-lane freeway with surveillance and control implemented in the inbound direction only. For the purposes of this study, five inbound freeway locations having double-loop sensors on each lane, as shown in Figure 5, were used to evaluate the model.
Lane occupancy and energy were evaluated as control variables. Energy was computed from volume and speed measurements.
The SND models were tested using 3- and 5-minute time bases. The first method used data from the previous 3-minute sampling periods to compute the mean x and standard deviations. The second method considered parameters from the previous 5 minutes. With the two strategies A and B, two variables of energy and occupancy, and two time bases, a total of eight combinations were tested.
Data were collected during 35 incidents that occurred on the inbound section of the Gulf Freeway. Three peak-hour periods (7 to 8 a.m.) in which no incidents were observed were used for the investigation of false alarms. These peak hours had many slowdowns and stoppage waves that provided a good test for the SND model. The percentage of false alarms in this paper refers to the percent of analysis time periods during operation that a false alarm is indicated. For example, because the computer evaluated the system once each minute, two false alarms during a 2-hour operational period would result in a false-alarm percentage of (2/ 120)(100) = 1. 7 percent.
RESULTS OF SND MODEL ANALYSIS
Characteristics of Incidents Evaluated
Because the duration of an incident and the operating conditions on the freeway both influence the capabilities for incident detection, it was of particular interest to evaluate the characteristics of the 35 incidents. Cumulative distributions of the duration of incidents and the operating speed/ free speed ratio (u/ u,) are shown in Figures 6 and 7 respectively. The results show that 11 percent of the incidents studied blocked a freeway lane for a duration of 2 minutes or less. Approximately 90 percent of the incidents occurred when the freeway was operating at or below 50 mph (80 km/hour), i.e., u/ u, = 0.83 .

Figure 5. Schematic of Gulf Freeway~
TELEPHONE .,
WOODRIDGE GRIGGS WAYSIDE
S.H.B.S T. DUMBLE CULLEN ., ~ ~I R.R . \ ~ \ \ ·= ~:::P< - .,,,... s *I \ .S::: 6 6 \ ~ 6 \~I ? ~ \ E TELEPHONE I I
I 2,850' 3,000' ... •·.. , .
Figure 6. Duration of incidents investigated.
~ 100 ...J
:3 CY UJ
zz 80 03 -o I- :r ~VI => z C>O 60-""~ "';52 z:::> -c > <%'. Z 40-I<
:r ~I-z: VI UJ VI C> UJ _ _,
20-'-' "'"'' -o "-0
I- 0 z UJ
ll.-Double Loop Detectors in Each Lane
'-' "'
5 10 15 20 25 30< UJ <>- DURATION OF INCIDENT - MINUTES
Figure 7. Operating speed/free speed ratio of incidents investigated.
0 I-
...J 100 "" :::> CY UJ
0
~ 80 ~z 4--~
=>::C -....VI :::> 60-I-« «
:r; C'":I--z -z >< « :r;
1, 0 :r; I-
VI VI I- VI ZUJ UJ ...J C>
-"' 20 uo z -"-0
I-0 -z
UJ '-' .4 .t! 1.0 c:: UJ U/Uf <>-
c
.s::;
~ 0 E

21
Effectiveness of SND Models
The effectiveness of the incident-detection models can be evaluated in part by the percent of incidents detected and the frequency of false alarms. Cumulative distributions of the percent of incidents detected and the percent of false alarms for each strategy, variable, and time base tested were developed. Distributions using strategy B with lane occupancy as the control variable with a 5-minute time base are shown in Figure 8.
A study of the distributions indicated that there is probably an optimum SND value that can be used for each strategy. One would need to trade off incident-detection capabilities with false alarms. The authors decided that SND values producing results approaching 90 percent incident detection and 1 percent false alarms would be the critical SND values. Based on this selection, the performance of the strategies was evaluated and is given in Table 2.
With strategy A, which required only one SND value to be critical, the occupancy and energy variables both detected 86 percent of the incidents studied. The performance of the occupancy variable was considered somewhat better, however, because of the lower frequency of false alarms . Changing the time base seemed to have little effect on the performance of the variables.
Strategy B, which required two successive SND values to be critical, resulted in a higher percentage of incidents detected using occupancy and a lower percentage using energy in comparison to strategy A. Both variables resulted in a lower frequency of false alarms. Changing the time base did not affect the performance of the energy variable. However, a larger time base using the occupancy variable resulted in a higher percentage of incidents detected.
A review of Table 2 shows that strategy B, using a 5-minute time base with lane occupancy as the control variable, resulted in the best performance . This approach detected 92 percent of the 3 5 incidents with an average computer response time of 1.1 minutes. The false-alarm level during the peak period was 1.3 percent.
Comparison of SND Model to Other Detection Models
It was interesting to compare the SND model to existing incident-detection models to evaluate their relative performances. It is not appropriate to use the results reported in the literature directly because the conditions are different from those on the Gulf Freeway. In particular, the sensor spacings and the relative location of the incidents to the sensors do not compare with the Gulf Freeway data. The conditions must be the same to permit a fair comparison. Unfortunately, during the early stages of the research reported here, sufficient data were not collected for the other models. As of this writing, data for only 26 incidents are available for proper comparison. Therefore, these results should be considered as provisional and not necessarily conclusive.
So that a good comparison could be realized, distribution curves similar to those discussed by Courage and Levin (3) and Cook and Cleveland (6) were developed at each sensor at the five sensor stations -on the Gulf Freeway for the most effective models reported in the literature. These distribution curves permitted the authors to select critical values that would result in approximately the same percentage of false alarms for each model. The percent of incidents detected was then determined using these critical values.
A comparison of the SND model to the existing incident-detection models is presented in Table 3. The results indicate that the SND model is as effective as the composite model. The SND and composite model detected 26 and 25 incidents while operating at a 1 percent level of false alarms during the peak period. The station discontinuity and subsystem discontinuity models detected 22 and 23 incidents while operating at a 1 percent level of false alarms during the peak period. Inasmuch as the SND model does not require separate distribution curves for various traffic conditions, it appears that it may be a more attractive model for an operational system.

22
Figure 8. Performance curves using lane occupancy, strategy B, and 5-minute time base.
(J)
z 0
10
j:: 9 0 z 0 u 8 a:: ::J 0 I
~ <{ w
0
10
20
30
0 z <{
w I-<{ a:: w 0 0 ::;: c.:l ~ a:: ::J
"-c.:l 6 z
INCIDENTS DETECTED 0 40
a:: ::J 0 5 (J) ::;: a:: <{
-;}_ 4 w (J) ...J <{ u. u. 0
~ 2 <!
0;;: Wo I- ...J
50 &l u. I- >-W> 0 <{ (J) w
60 ~ .1.
w 0 u
70 ~ u. 0 w
1-z FALS ~ ALARMS
80 c.:l <{ 1-z w
~ 1 a:: w "-
0 2 ,, 8 10 1 1 l STANDARD NORMAL DEVIATE
Table 2. Effectiveness of SND detection strategies.
Aver age Computer
Time Critical Response Base SND T ime
Strategy Variable (minutes) Values (minutes )
A Occupancy 5 6 0. 5 Occupancy 3 6 0.7 Ene r gy 5 -4 0. 8 Energy 3 -3 0.3
B Occupancy 5 4 1.1 Oacup311c-;--3 Energy 5 -3 1.1 Ene rgy 3 -3 1.1
1 During moderate arid heavy flow conditions. bouring peak periods.
Table 3. Comparison of incident-detection models.
False Alarms Control per Station
Model Vari able (pe rcent)
Station discontinuity Energy Subsystem discontinuity Energy Composite Ene rgy '/, SND, strategy B, 5-minute
time base Occupancy
1 Based on 26 observed incidents during peak and off-peak periods.
18 2
Standard Deviation Compute r Response Tim e
1.1 1.9 2.6 0.7
0.6 .$
0.5 0.5
O<
Incidents Detected' (percent)
86 86 86 86
92 \) __
83 83
90 u a:: w "-
100
False Alarms' (percent)
1.7 2.0 2.4 2.5
1.3 1.4 1 .4 1.4
False Alarms Number of per subsystem Incidents (percent) Detected'
22 1 23 •;, 25
26

23
SUMMARY AND DISCUSSION OF RESULTS
The results of the study indicated that the 5-minute occupancy SND model using strategy B produced the best results of the strategies and variables tested. The model detected 92 percent of the 3 5 incidents that occurred during moderate and heavy flow and operated with 1.3 percent false alarms during the peak period on the Gulf Freeway system. Although the control parameter could be changed to detect a higher percentage of incidents on the existing system, the desire for this capability would be at the expense of a higher frequency of false alarms.
The failure by the model to detect all the incidents could conceivably be caused from one or a combination of the following: (a) failure in the model logic, (b) very short duration of an incident, (c) sensor spacing, and (d) a high operating speed before an incident. The SND model depends on the passage of a shock wave over a set of sensors. If the shock wave passes over the sensors, its effect must be noticeable. As discussed earlier, the duration of the incident, the sensor spacing, and the normal operating speed of the freeway before occurrence of the incident affect the passage of the shock wave over the sensors.
An analysis of the data revealed that, of the three incidents missed by the 5-minute occupancy SND model, one incident blocked the freeway for only 2 minutes. The relative location of the incident to the upstream detectors was a factor in the lack of detection. The other two incidents that were not detected occurred when the operating speeds were 48 and 53 mph (77 and 85 km/ hour) respectively. The relative degree of queuing was lessened and contributed to the model's failure.
It is important to emphasize that the efficiency of the strategies using the SND model evaluated in this paper apply to the Gulf Freeway with the given sensor spacings shown in Figure 5. It is the opinion of the authors that the 5-minute occupancy model is capable of detecting close to 100 percent of the incidents of 2-minute duration or more during moderate and heavy flow if the sensor spacing were adequate.
The authors wish to reemphasize that the inability of the SND and other incidentdetection models to detect all the incidents is not necessarily a reflection of the individual model inadequacies. The duration of an incident, the sensor spacing, the relative location of the incident to the sensors, and the operating conditions immediately before the incident are all important factors that affect the capabilities of any incidentdetection model. Therefore, the results of incident-detection model capabilities reported in the literature must be placed in proper perspective.
It is the belief of the authors that, with proper sensor spacing, it is possible to approach 100 percent detection of incidents blocking a freeway lane for a duration equal to or greater than a preselected time during moderate or heavy flow. One of the most perplexing problems is the frequency of false alarms during the peak periods. A falsealarm rate of 1 percent outwardly appears insignificant. However, the false-alarm rate applies to each sensor station or each subsystem (depending on the model). Therefore, the number of false alarms can become very significant in an operational system. Greater effort should be directed toward minimizing and ideally eliminating the falsealarm problem.
ACKNOWLEDGMENT
This paper discusses one phase of a research project on the development of urban traffic management and control systems conducted by the Texas Transportation Institute and the Texas Highway Department in cooperation with the Federal Highway Administration. This paper reflects the views of the authors, who are responsible for the facts and the accuracy of the data presented. The contents do not necessarily reflect the official views or policies of the Federal Highway Administration. This paper does not constitute a standard, specification, or regulation.
REFERENCES
1. Moskowitz, K. Analysis and Projection of Research on Traffic Surveillance, Communication, and Control. NCHRP Report 84, 1970.
24
2. West, J. Proposed Real-Time Surveillance and Control System for Los Angeles. Paper presented to HRB Committee on Freeway Operations, Aug. 1969.
3. Courage, K. G., and Levin, M. A Freeway Corridor Surveillance Information and Control System. Texas Transportation Institute, Texas A&M Univ., College station, Res . Rept. 488-8, Dec. 1968, 349 pp.
4. Schaefer, W. E. California Freeway Surveillance System. California Division of Highways, Department of Public Wor ks, Nov. 1969.
5. Whitson, R.H., Buhr, J. H., Drew, D. R., and Mccasland, W.R. Real-Time Evaluation of Freeway Quality of Traffic Service. Highway Research Record 289, 1969, pp. 38-50.
6. Cook, A. R., and Cleveland, D. E. The Detection of Freeway Capacity Reducing Incidents by Traffic stream Measurements. HSRI Preliminary Rept. TrS-1, 1970. See also their paper in this Record.
7. Dudek, C. L., Messer, c. J., and Friebele, J. D. Investigation of Lane Occupancy as a Control Variable for a Safety Warning System for Urban Freeways. Texas Transportation TnstitntP., ReA. Rept. 165-6, March 1973.
8. Dudek, C. L., and Messer, C. J. Detecting stoppage Waves for Freeway Control. Highway Research Record 469, 1973, pp. 1-15.
9. Messer, C. J., Dudek, C. L., and Friebele, J. D. Method for Predicting Travel Time and Other Operational Measures in Real-Time During Freeway Incident Conditions. Highway Research Record 461, 1973, pp. 1-16.