including cognitive aspects in multiple criteria decision
TRANSCRIPT
Noname manuscript No.(will be inserted by the editor)
Including Cognitive Aspects in Multiple Criteria DecisionAnalysis
João Carneiro · Luís Conceição · Diogo Martinho ·Goreti Marreiros · Paulo Novais
Received: date / Accepted: date
Abstract Many Multiple Criteria Decision Analysis (MCDA) methods have been proposedover the last decades. Some of the most known methods share some similarities in theway they are used and configured. However, we live in a time of change and nowadaysthe decision-making process (especially when done in group) is even more demanding anddynamic. In this work, we propose a Multiple Criteria Decision Analysis method that in-cludes cognitive aspects (Cognitive Analytic Process). By taking advantage of aspects suchas expertise level, credibility and behaviour style of the decision-makers, we propose amethod that relates these aspects with problem configurations (alternatives and criteria pref-erences) done by each decision-maker. In this work, we evaluated the Cognitive AnalyticProcess (CAP) in terms of configuration costs and the capability to enhance the qualityof the decision. We have used the satisfaction level as a metric to compare our method withother known MCDA methods in literature (Utility function, AHP and TOPSIS). Our methodproved to be capable to achieve higher satisfaction levels compared to other MCDA meth-ods, especially when the decision suggested by CAP is different from the one proposed bythose methods.
Keywords Multiple Criteria Decision Analysis · Cognitive decision-making · Groupdecision-making · Behavioural decision theory · AHP · TOPSIS
João Carneiro (�) · Luís Conceição · Diogo Martinho · Goreti MarreirosGECAD - Research Group on Intelligent Engineering and Computing for Advanced Innovation and Devel-opment, Institute of Engineering, Polytechnic of Porto, Porto 4200-072, PortugalE-mail: [email protected]
Luís ConceiçãoE-mail: [email protected]
Diogo MartinhoE-mail: [email protected]
Goreti MarreirosE-mail: [email protected]
João Carneiro · Paulo NovaisALGORITMI Centre, University of Minho, Guimarães 4800-058, PortugalE-mail: [email protected]
2 João Carneiro et al.
1 Introduction
Making decisions is intrinsic to the human being. Each action, more or less significant,conscious or unconsciously, results in a decision. Therefore, we could say we are all naturaldecision-makers (Saaty, 2008). The decision-making process can be seen as selecting oneor more alternatives to be the solution for a certain problem/task (Chen, 2000).
Nowadays most of the decision-making processes happening in organizations are donein group (Luthans, 2011; Simon, 1965). There are many advantages related to group decision-making: to improve the quality of the decision, to share workloads, to gain support amongstakeholders, to train less experienced group members and due to the majority of organogramsexisting nowadays (Dennis, 1996; Huber, 1984). However, due to market globalization andthe firms’ internationalization it is very hard to match each top managers’ agenda, makingit difficult for them to meet in the same space or time (Carneiro et al, 2015d). Therefore,it is no surprise that more techniques, models, methods and tools that support groups andindividuals in the decision-making process are being developed.
Multiple Criteria Decision Analysis (MCDA) methods are one of the techniques used tosupport the decision-making process. MCDA is considered appropriate to deal with conflict-ing opinions and also qualitative and quantitative objectives (Ram et al, 2011; Golmoham-madi and Mellat-Parast, 2012). MCDA provides a framework which deals with complex de-cision problems. In order to reach a consensus, a MCDA framework allows decision-makersto share information through problem configurations (Dehe and Bamford, 2015). Through-out the last decades, a wide variety of analytical models have been proposed in literature(Tavana et al, 2010). Some of the most acknowledged MCDA methods in literature are: ER,ELECTRE, PROMETHEE, AHP, ANP, TOPSIS, MACBETH (Figueira et al, 2005). Eventhough there is a very decent amount of work proposed under the topic of MCDA, the is-sues associated to MCDA are easy to identify. Tavana, Sodenkamp, and Suhl (2010) haveidentified certain issues such as: deficiencies when considering objective and subjective cri-teria, imprecise information due to the lack of the decision-makers’ expertise, unavailabilityof data and time constraint, etc. Besides these issues, we can still include the lack of in-formation about each decision-maker (Levy, 2007), the difficulty or impossibility for eachdecision-maker to express how he intends to face the decision-making process (Rahim andMagner, 1995) and the difficulty (the cost) associated to problems configuration (Dehe andBamford, 2015).
The area of decision-making has always been very studied in literature. Since the earlydays of psychology and economy there has been a clear interest to study the topic ofdecision-making (Edwards, 1954; Simon, 1959, 1986). If economists have always lookedat decision-making in a completely rational perspective, psychologists look at decision-making in a perspective which allows them to understand the individual judgement and thedecision-making concerning both irrational and rational aspects of behaviour (Simon, 1986).It is evident that most of the existent MCDA methods have been based in an economic per-spective which we could call as the rational choice. In 1979, Herbert Simon (Simon, 1979)pointed the interest of economists to explore domains that belonged, traditionally, to po-litical sciences, sociology, and psychology. This interest is very similar to what happensnowadays between computer science researchers and those same domains (Castelfranchi,1994; Smith and Conrey, 2007; Falcone and Castelfranchi, 2001; Bates et al, 1994; Ogielaand Ogiela, 2014b,a). It is known that cognitive aspects are present and affect the individualduring the decision-making process (Schwarz, 2000). Therefore it is assumed to be neces-sary to consider cognitive aspects in order to make a correct representation of the interestsof decision-makers. With that being said, it can then claim that including cognitive aspects
Including Cognitive Aspects in Multiple Criteria Decision Analysis 3
allow obtaining better decisions which are fundamentally more adjusted to the real interestsof decision-makers.
In this work, we present a new MCDA method named as Cognitive Analytical Process(CAP). CAP allowed decision-makers to represent their preferences about a problem (crite-ria and alternatives) and also represent what we referred as their intentions, being directedtowards supporting group decision-making. Decision-makers could: express their intentionsby selecting a behaviour style that better represents how they intend to face the decision-making process, select an expertise level about the topic being discussed and select whichdecision-makers involved in the same process they consider to be more credible. CAP is ananalytic method that aims to provide a decision based on the values mentioned in the previ-ous configurations and that maximizes the satisfaction level of the group and of each one ofthe decision-makers.
The rest of the paper is organized as follows: in the next section is presented the back-ground, where we enumerated the essential methods to define our proposal, in the followingsection (3) we presented our approach, where the Cognitive Analytic Process is describedand the model is formulated. In Section 4 it is shown the evaluation and results of this workand in Section 5 the discussion is presented. Finally, some conclusions were taken in Section6, along with the work to be done hereafter.
2 Background
It is easy to find in literature several authors which refer to the importance of psychologicaland cognitive aspects in the decision-making context (Schwenk, 1988; Frith and Singer,2008; Schwarz, 2000). Moreover, there are authors which defend that the quality of thedecision decreases when theses aspects are not considered (Simon, 1987a). Some authorsconsider that including cognitive and psychological aspects help to achieve decisions withhigher quality (Simon, 1987a; Fenton-O’Creevy et al, 2011). Having all these evidences intoaccount it becomes clear how a decision made using automatic mechanisms can be affected.There are many factors and knowledge which may be lost when the human interaction stopsexisting, even if there can be other advantages associated (Kiesler et al, 1984). By using atypical multi-criteria problem configuration, how will the system manager knowledge andexpertise levels of each decision-maker? Will it be fair to weight all configurations as thesame? How to deal with different intentions which the decision-maker may have in eachdecision-making scenario? In this work we intend to answer these questions as well as verifyif our method manages to achieve higher results (compared to other methods) by consideringsome of these points.
In this section, the models used by CAP are presented and allow us to better understandhow it works. Besides this, it is explained the reasons why behaviour styles, credibility andexpertise are considered by CAP as well as how they relate with the topic of group decision-making. All these points have been discussed in some of our most recent works (Carneiroet al, 2015c,b,a; Martinho et al, 2015), and they have been used because according to thework published in (Carneiro et al, 2015c) they are part of a multi-criteria configurationtemplate that proved to be very easy and fast to configure. This fact was important due tobig concerns related to the usability and the resources needed to use CAP. The descriptionnext presented for each point is based in the analysis done previously in (Carneiro et al,2015c).
4 João Carneiro et al.
2.1 Behaviour Style
The behaviour style can be seen as the expected behavior or the desirable behaviour. Insome of our previous works, we studied the difference between using the decision-maker’spersonality or to create the possibility for the decision-maker to select the conflict styleor the behaviour that he intended to use (to read more about this see Martinho, Carneiro,Marreiros, and Novais (2015)). During our life, we are constantly presented with the need tomake decisions. Some decisions are less relevant, others are not. Fundamentally, when weare taking decisions in group, and independently of our personality, we express and behavedifferently according to different situations such as: the topic of the problem to be solved, toconsider the others decision-makers as more expert than us, to intend to be pleasant and try topursue other decision-makers’ goals, the level of the interest on the topic, the mood, etc. Thismeans that in a hypothetical scenario where a decision-maker and his family are decidingfrom a group of alternatives to choose a restaurant to celebrate his son’s birthday, maybehis main concern is to satisfy his son’s preferred alternative. However, he still has his ownpreferences regardless of the kind of behaviour he shows during the negotiation process.In (Martinho et al, 2015), 5 behaviour styles were considered: Dominating, Integrating,Compromising, Obliging and Avoiding. These styles differentiate from each other by whatwas thought to be 4 essential dimensions for this context:
1. Concern for Self – This dimension was related to the individual’s concern for his ownopinion above the others since he was likely to adapt a more one-sided attitude duringthe decision-making process by making statements, questions and requests that detailedthat opinion;
2. Concern for others – This dimension was related to the individual’s concern for otherindividuals’ opinion. He adapted a more altruist attitude during the decision-makingprocess, tried to understand other opinions and made an effort to reach a decision thatbenefited or pleased most of the participants;
3. Activity – This dimension was related to the effort put into the decision-making processby the individual, meaning that the more active an individual was, the more questionsand statements and requests he was likely to make;
4. Resistance to change – This dimension was related to how hard or easy it was for anindividual to accept other opinions.
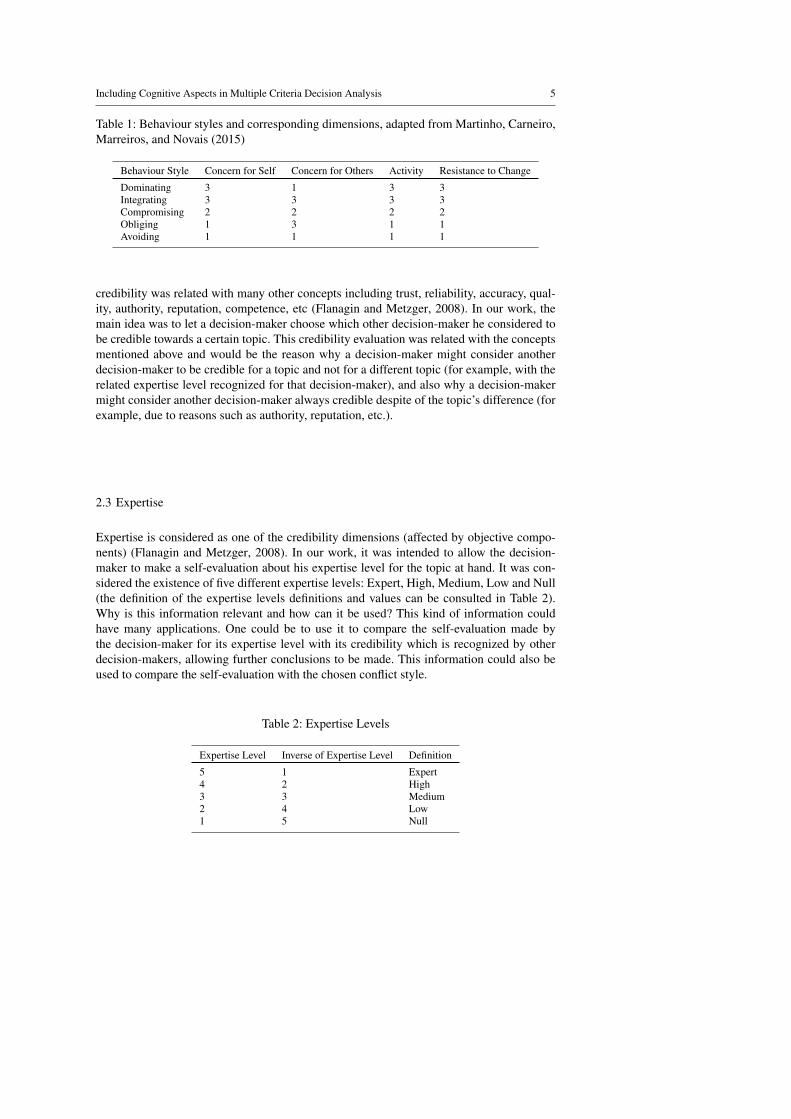
In Table 1, we describe each behaviour style by providing a value for every dimension(Concern for Self, Concern for Others, Activity and Resistance to Change) mentioned be-fore. The numeric values (1, 2 or 3 for low, mid and high respectively) given to each dimen-sion are correlated with the definitions established by Rahim and Magner (1995) (to learnmore about this correlation see Rahim and Magner (1995); Martinho, Carneiro, Marreiros,and Novais (2015)).
2.2 Credibility
There is not a universally accepted definition for credibility. Besides that, the study of cred-ibility is highly multi-disciplinary and some of the suggested definitions are related to theirarea of operation (Flanagin and Metzger, 2008). In our work, it was considered the defini-tion proposed by Flanagin and Metzger (2008) when they said that “the overarching viewis that credibility is the believability of a source or message, which is made up of two pri-mary dimensions: trustworthiness and expertise”. Trustworthiness was related with subjec-tive components while expertise was related with more objective components. The notion of
Including Cognitive Aspects in Multiple Criteria Decision Analysis 5
Table 1: Behaviour styles and corresponding dimensions, adapted from Martinho, Carneiro,Marreiros, and Novais (2015)
Behaviour Style Concern for Self Concern for Others Activity Resistance to Change
Dominating 3 1 3 3Integrating 3 3 3 3Compromising 2 2 2 2Obliging 1 3 1 1Avoiding 1 1 1 1
credibility was related with many other concepts including trust, reliability, accuracy, qual-ity, authority, reputation, competence, etc (Flanagin and Metzger, 2008). In our work, themain idea was to let a decision-maker choose which other decision-maker he considered tobe credible towards a certain topic. This credibility evaluation was related with the conceptsmentioned above and would be the reason why a decision-maker might consider anotherdecision-maker to be credible for a topic and not for a different topic (for example, with therelated expertise level recognized for that decision-maker), and also why a decision-makermight consider another decision-maker always credible despite of the topic’s difference (forexample, due to reasons such as authority, reputation, etc.).
2.3 Expertise
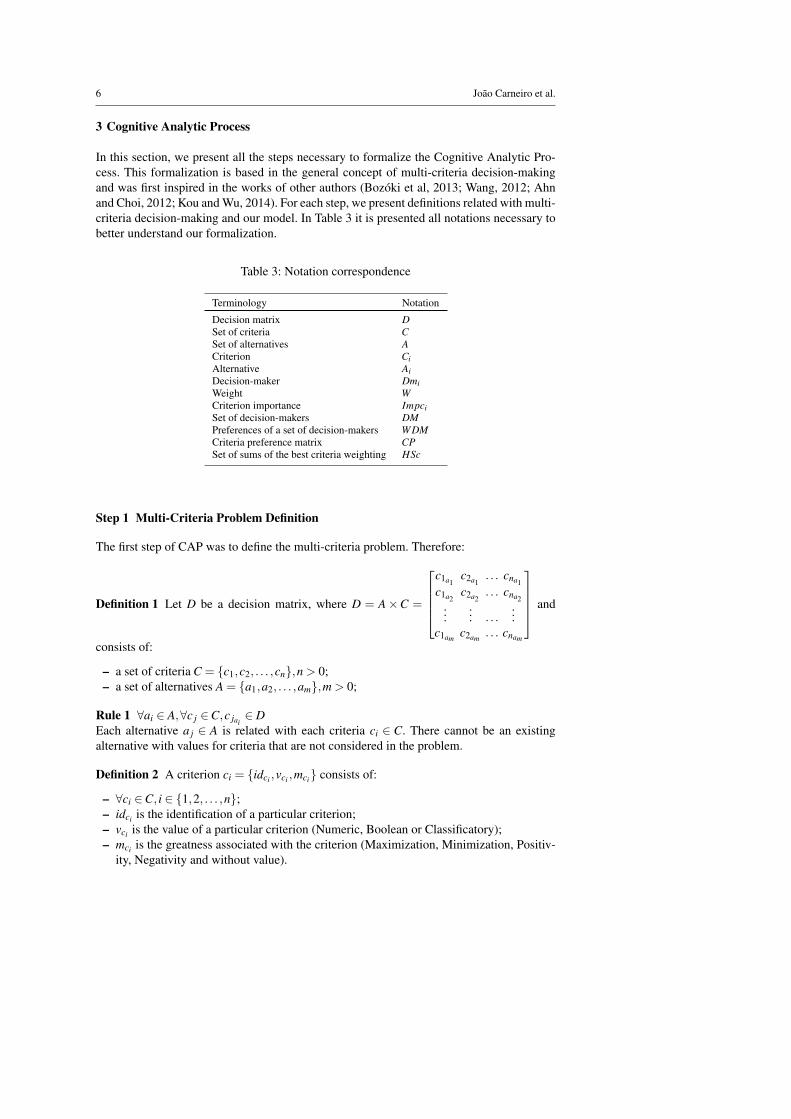
Expertise is considered as one of the credibility dimensions (affected by objective compo-nents) (Flanagin and Metzger, 2008). In our work, it was intended to allow the decision-maker to make a self-evaluation about his expertise level for the topic at hand. It was con-sidered the existence of five different expertise levels: Expert, High, Medium, Low and Null(the definition of the expertise levels definitions and values can be consulted in Table 2).Why is this information relevant and how can it be used? This kind of information couldhave many applications. One could be to use it to compare the self-evaluation made bythe decision-maker for its expertise level with its credibility which is recognized by otherdecision-makers, allowing further conclusions to be made. This information could also beused to compare the self-evaluation with the chosen conflict style.
Table 2: Expertise Levels
Expertise Level Inverse of Expertise Level Definition
5 1 Expert4 2 High3 3 Medium2 4 Low1 5 Null
6 João Carneiro et al.
3 Cognitive Analytic Process
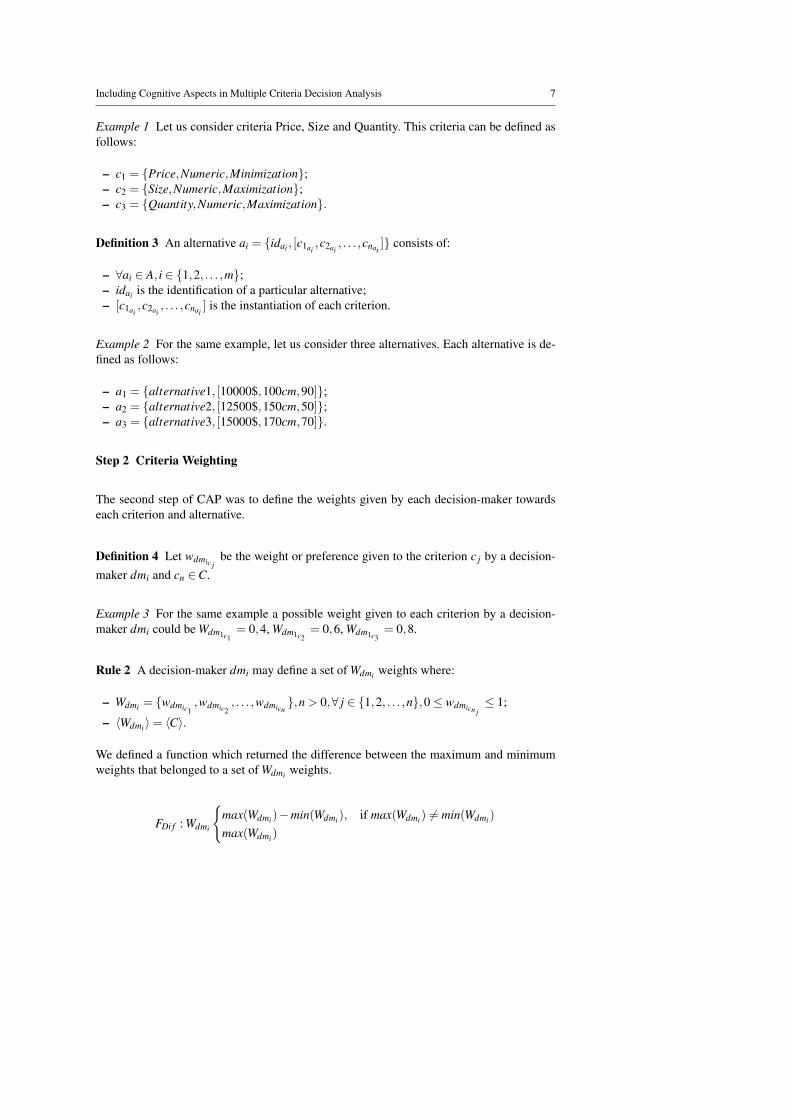
In this section, we present all the steps necessary to formalize the Cognitive Analytic Pro-cess. This formalization is based in the general concept of multi-criteria decision-makingand was first inspired in the works of other authors (Bozóki et al, 2013; Wang, 2012; Ahnand Choi, 2012; Kou and Wu, 2014). For each step, we present definitions related with multi-criteria decision-making and our model. In Table 3 it is presented all notations necessary tobetter understand our formalization.
Table 3: Notation correspondence
Terminology Notation
Decision matrix DSet of criteria CSet of alternatives ACriterion CiAlternative AiDecision-maker DmiWeight WCriterion importance ImpciSet of decision-makers DMPreferences of a set of decision-makers WDMCriteria preference matrix CPSet of sums of the best criteria weighting HSc
Step 1 Multi-Criteria Problem Definition
The first step of CAP was to define the multi-criteria problem. Therefore:
Definition 1 Let D be a decision matrix, where D = A×C =
c1a1
c2a1. . . cna1
c1a2c2a2
. . . cna2...
... . . ....
c1am c2am . . . cnam
and
consists of:
– a set of criteria C = {c1,c2, . . . ,cn},n > 0;– a set of alternatives A = {a1,a2, . . . ,am},m > 0;
Rule 1 ∀ai ∈ A,∀c j ∈C,c jai∈ D
Each alternative a j ∈ A is related with each criteria ci ∈ C. There cannot be an existingalternative with values for criteria that are not considered in the problem.
Definition 2 A criterion ci = {idci ,vci ,mci} consists of:
– ∀ci ∈C, i ∈ {1,2, . . . ,n};– idci is the identification of a particular criterion;– vci is the value of a particular criterion (Numeric, Boolean or Classificatory);– mci is the greatness associated with the criterion (Maximization, Minimization, Positiv-
ity, Negativity and without value).
Including Cognitive Aspects in Multiple Criteria Decision Analysis 7
Example 1 Let us consider criteria Price, Size and Quantity. This criteria can be defined asfollows:
– c1 = {Price,Numeric,Minimization};– c2 = {Size,Numeric,Maximization};– c3 = {Quantity,Numeric,Maximization}.
Definition 3 An alternative ai = {idai , [c1ai,c2ai
, . . . ,cnai]} consists of:
– ∀ai ∈ A, i ∈ {1,2, . . . ,m};– idai is the identification of a particular alternative;– [c1ai
,c2ai, . . . ,cnai
] is the instantiation of each criterion.
Example 2 For the same example, let us consider three alternatives. Each alternative is de-fined as follows:
– a1 = {alternative1, [10000$,100cm,90]};– a2 = {alternative2, [12500$,150cm,50]};– a3 = {alternative3, [15000$,170cm,70]}.
Step 2 Criteria Weighting
The second step of CAP was to define the weights given by each decision-maker towardseach criterion and alternative.
Definition 4 Let wdmic jbe the weight or preference given to the criterion c j by a decision-
maker dmi and cn ∈C.
Example 3 For the same example a possible weight given to each criterion by a decision-maker dmi could be Wdm1c1
= 0,4, Wdm1c2= 0,6, Wdm1c3
= 0,8.
Rule 2 A decision-maker dmi may define a set of Wdmi weights where:
– Wdmi = {wdmic1,wdmic2
, . . . ,wdmicn},n > 0,∀ j ∈ {1,2, . . . ,n},0≤ wdmicn j
≤ 1;
– 〈Wdmi〉= 〈C〉.
We defined a function which returned the difference between the maximum and minimumweights that belonged to a set of Wdmi weights.
FDi f : Wdmi
{max(Wdmi)−min(Wdmi), if max(Wdmi) 6= min(Wdmi)
max(Wdmi)
8 João Carneiro et al.
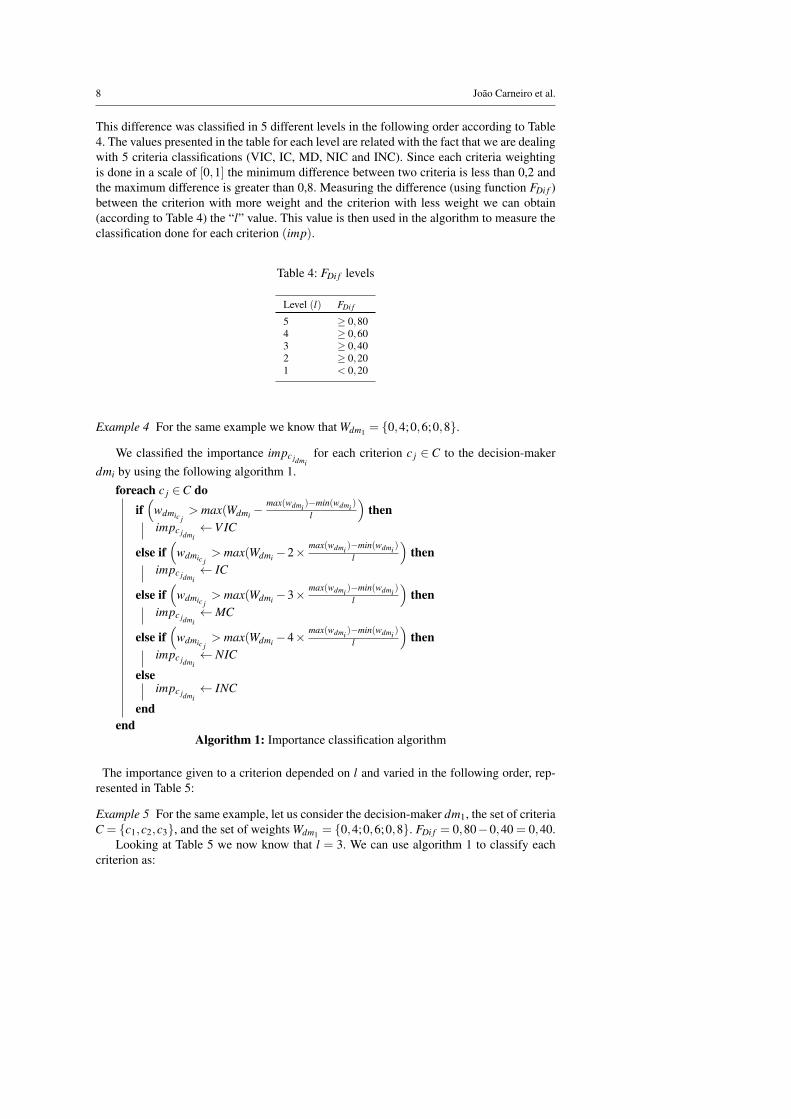
This difference was classified in 5 different levels in the following order according to Table4. The values presented in the table for each level are related with the fact that we are dealingwith 5 criteria classifications (VIC, IC, MD, NIC and INC). Since each criteria weightingis done in a scale of [0,1] the minimum difference between two criteria is less than 0,2 andthe maximum difference is greater than 0,8. Measuring the difference (using function FDi f )between the criterion with more weight and the criterion with less weight we can obtain(according to Table 4) the “l” value. This value is then used in the algorithm to measure theclassification done for each criterion (imp).
Table 4: FDi f levels
Level (l) FDi f
5 ≥ 0,804 ≥ 0,603 ≥ 0,402 ≥ 0,201 < 0,20
Example 4 For the same example we know that Wdm1 = {0,4;0,6;0,8}.
We classified the importance impc jdmifor each criterion c j ∈ C to the decision-maker
dmi by using the following algorithm 1.foreach c j ∈C do
if(
wdmic j> max(Wdmi −
max(wdmi )−min(wdmi )
l
)then
impc jdmi←V IC
else if(
wdmic j> max(Wdmi −2× max(wdmi )−min(wdmi )
l
)then
impc jdmi← IC
else if(
wdmic j> max(Wdmi −3× max(wdmi )−min(wdmi )
l
)then
impc jdmi←MC
else if(
wdmic j> max(Wdmi −4× max(wdmi )−min(wdmi )
l
)then
impc jdmi← NIC
elseimpc jdmi
← INC
endend
Algorithm 1: Importance classification algorithm
The importance given to a criterion depended on l and varied in the following order, rep-resented in Table 5:
Example 5 For the same example, let us consider the decision-maker dm1, the set of criteriaC = {c1,c2,c3}, and the set of weights Wdm1 = {0,4;0,6;0,8}. FDi f = 0,80−0,40 = 0,40.
Looking at Table 5 we now know that l = 3. We can use algorithm 1 to classify eachcriterion as:
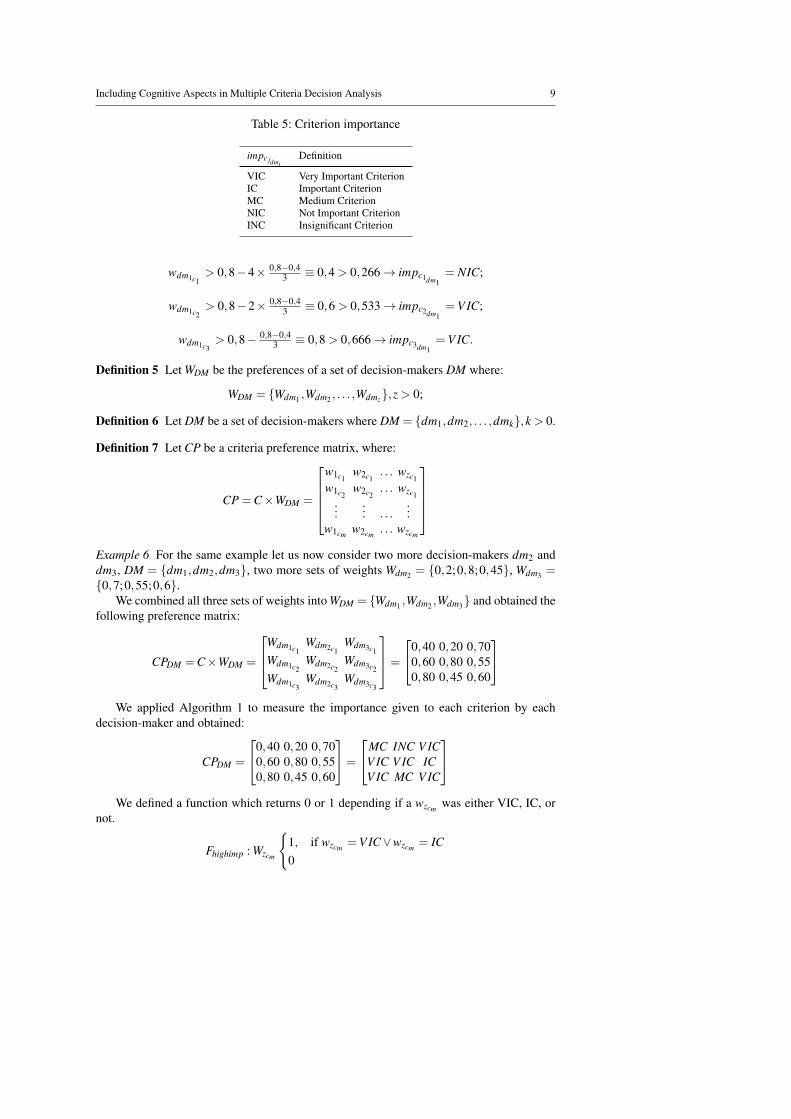
Including Cognitive Aspects in Multiple Criteria Decision Analysis 9
Table 5: Criterion importance
impc jdmiDefinition
VIC Very Important CriterionIC Important CriterionMC Medium CriterionNIC Not Important CriterionINC Insignificant Criterion
wdm1c1> 0,8−4× 0,8−0,4
3 ≡ 0,4 > 0,266→ impc1dm1= NIC;
wdm1c2> 0,8−2× 0,8−0,4
3 ≡ 0,6 > 0,533→ impc2dm1=V IC;
wdm1c3> 0,8− 0,8−0,4
3 ≡ 0,8 > 0,666→ impc3dm1=V IC.
Definition 5 Let WDM be the preferences of a set of decision-makers DM where:
WDM = {Wdm1 ,Wdm2 , . . . ,Wdmz},z > 0;
Definition 6 Let DM be a set of decision-makers where DM = {dm1,dm2, . . . ,dmk},k > 0.
Definition 7 Let CP be a criteria preference matrix, where:
CP =C×WDM =
w1c1
w2c1. . . wzc1
w1c2w2c2
. . . wzc1...
... . . ....
w1cm w2cm . . . wzcm
Example 6 For the same example let us now consider two more decision-makers dm2 anddm3, DM = {dm1,dm2,dm3}, two more sets of weights Wdm2 = {0,2;0,8;0,45}, Wdm3 ={0,7;0,55;0,6}.
We combined all three sets of weights into WDM = {Wdm1 ,Wdm2 ,Wdm3} and obtained thefollowing preference matrix:
CPDM =C×WDM =
Wdm1c1Wdm2c1
Wdm3c1Wdm1c2
Wdm2c2Wdm3c2
Wdm1c3Wdm2c3
Wdm3c3
=
0,40 0,20 0,700,60 0,80 0,550,80 0,45 0,60
We applied Algorithm 1 to measure the importance given to each criterion by each
decision-maker and obtained:
CPDM =
0,40 0,20 0,700,60 0,80 0,550,80 0,45 0,60
=
MC INC V ICV IC V IC ICV IC MC V IC
We defined a function which returns 0 or 1 depending if a wzcm was either VIC, IC, or
not.
Fhighimp : Wzcm
{1, if wzcm =V IC∨wzcm = IC0
10 João Carneiro et al.
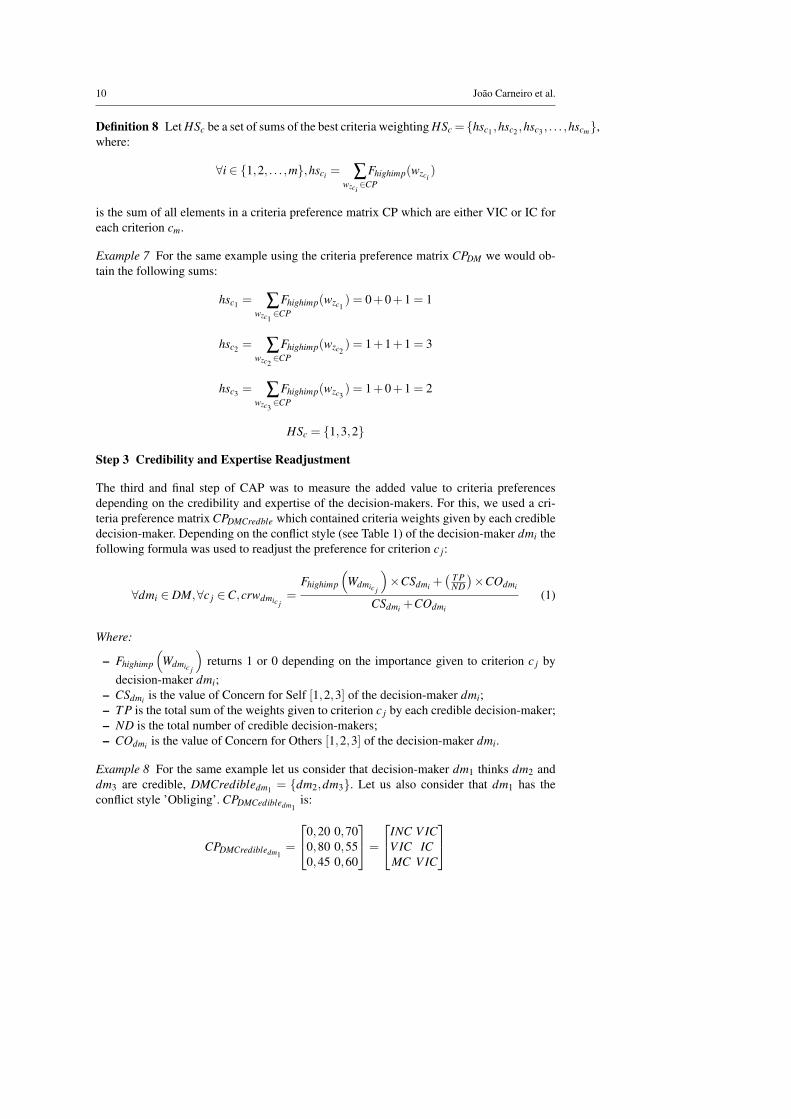
Definition 8 Let HSc be a set of sums of the best criteria weighting HSc = {hsc1 ,hsc2 ,hsc3 , . . . ,hscm},where:
∀i ∈ {1,2, . . . ,m},hsci = ∑wzci∈CP
Fhighimp(wzci)
is the sum of all elements in a criteria preference matrix CP which are either VIC or IC foreach criterion cm.
Example 7 For the same example using the criteria preference matrix CPDM we would ob-tain the following sums:
hsc1 = ∑wzc1∈CP
Fhighimp(wzc1) = 0+0+1 = 1
hsc2 = ∑wzc2∈CP
Fhighimp(wzc2) = 1+1+1 = 3
hsc3 = ∑wzc3∈CP
Fhighimp(wzc3) = 1+0+1 = 2
HSc = {1,3,2}
Step 3 Credibility and Expertise Readjustment
The third and final step of CAP was to measure the added value to criteria preferencesdepending on the credibility and expertise of the decision-makers. For this, we used a cri-teria preference matrix CPDMCredble which contained criteria weights given by each credibledecision-maker. Depending on the conflict style (see Table 1) of the decision-maker dmi thefollowing formula was used to readjust the preference for criterion c j:
∀dmi ∈ DM,∀c j ∈C,crwdmic j=
Fhighimp
(Wdmic j
)×CSdmi +
( T PND
)×COdmi
CSdmi +COdmi
(1)
Where:
– Fhighimp
(Wdmic j
)returns 1 or 0 depending on the importance given to criterion c j by
decision-maker dmi;– CSdmi is the value of Concern for Self [1,2,3] of the decision-maker dmi;– T P is the total sum of the weights given to criterion c j by each credible decision-maker;– ND is the total number of credible decision-makers;– COdmi is the value of Concern for Others [1,2,3] of the decision-maker dmi.
Example 8 For the same example let us consider that decision-maker dm1 thinks dm2 anddm3 are credible, DMCredibledm1 = {dm2,dm3}. Let us also consider that dm1 has theconflict style ’Obliging’. CPDMCedibledm1
is:
CPDMCredibledm1=
0,20 0,700,80 0,550,45 0,60
=
INC V ICV IC ICMC V IC
Including Cognitive Aspects in Multiple Criteria Decision Analysis 11
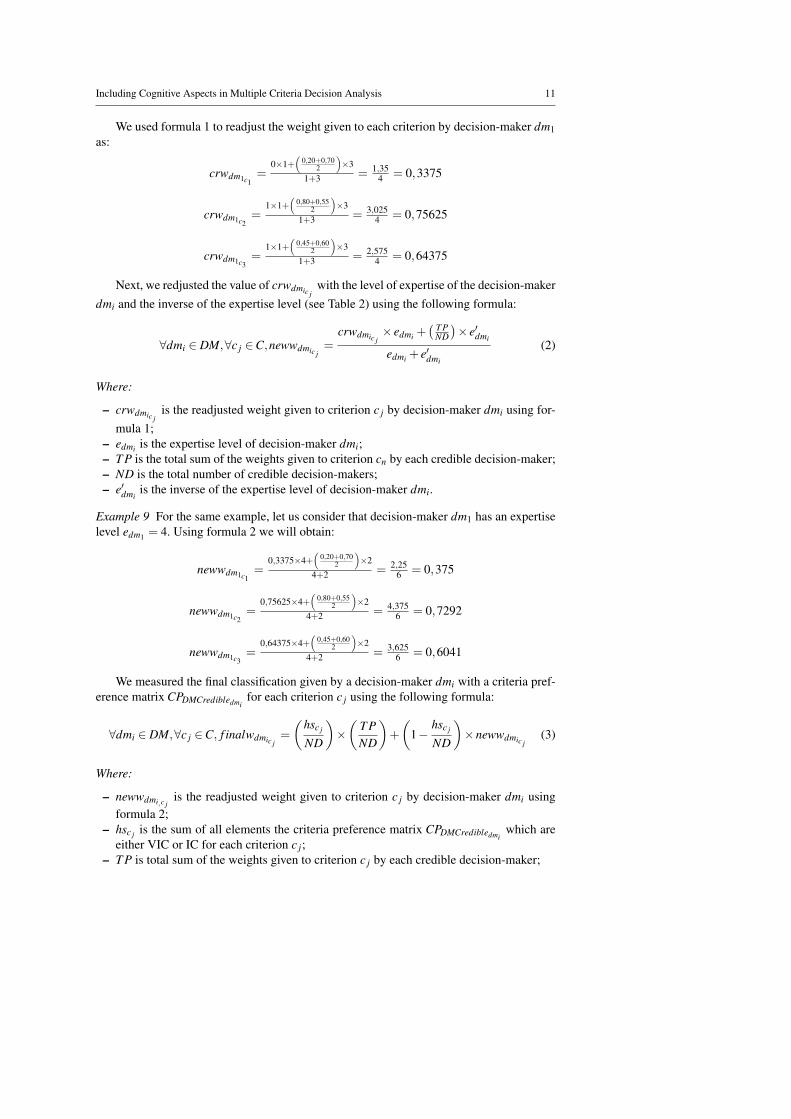
We used formula 1 to readjust the weight given to each criterion by decision-maker dm1as:
crwdm1c1=
0×1+(
0,20+0,702
)×3
1+3 = 1,354 = 0,3375
crwdm1c2=
1×1+(
0,80+0,552
)×3
1+3 = 3,0254 = 0,75625
crwdm1c3=
1×1+(
0,45+0,602
)×3
1+3 = 2,5754 = 0,64375
Next, we redjusted the value of crwdmic jwith the level of expertise of the decision-maker
dmi and the inverse of the expertise level (see Table 2) using the following formula:
∀dmi ∈ DM,∀c j ∈C,newwdmic j=
crwdmic j× edmi +
( T PND
)× e′dmi
edmi + e′dmi
(2)
Where:
– crwdmic jis the readjusted weight given to criterion c j by decision-maker dmi using for-
mula 1;– edmi is the expertise level of decision-maker dmi;– T P is the total sum of the weights given to criterion cn by each credible decision-maker;– ND is the total number of credible decision-makers;– e′dmi
is the inverse of the expertise level of decision-maker dmi.
Example 9 For the same example, let us consider that decision-maker dm1 has an expertiselevel edm1 = 4. Using formula 2 we will obtain:
newwdm1c1=
0,3375×4+(
0,20+0,702
)×2
4+2 = 2,256 = 0,375
newwdm1c2=
0,75625×4+(
0,80+0,552
)×2
4+2 = 4,3756 = 0,7292
newwdm1c3=
0,64375×4+(
0,45+0,602
)×2
4+2 = 3,6256 = 0,6041
We measured the final classification given by a decision-maker dmi with a criteria pref-erence matrix CPDMCredibledmi
for each criterion c j using the following formula:
∀dmi ∈ DM,∀c j ∈C, f inalwdmic j=
(hsc j
ND
)×(
T PND
)+
(1−
hsc j
ND
)×newwdmic j
(3)
Where:
– newwdmi,c jis the readjusted weight given to criterion c j by decision-maker dmi using
formula 2;– hsc j is the sum of all elements the criteria preference matrix CPDMCredibledmi
which areeither VIC or IC for each criterion c j;
– T P is total sum of the weights given to criterion c j by each credible decision-maker;
12 João Carneiro et al.
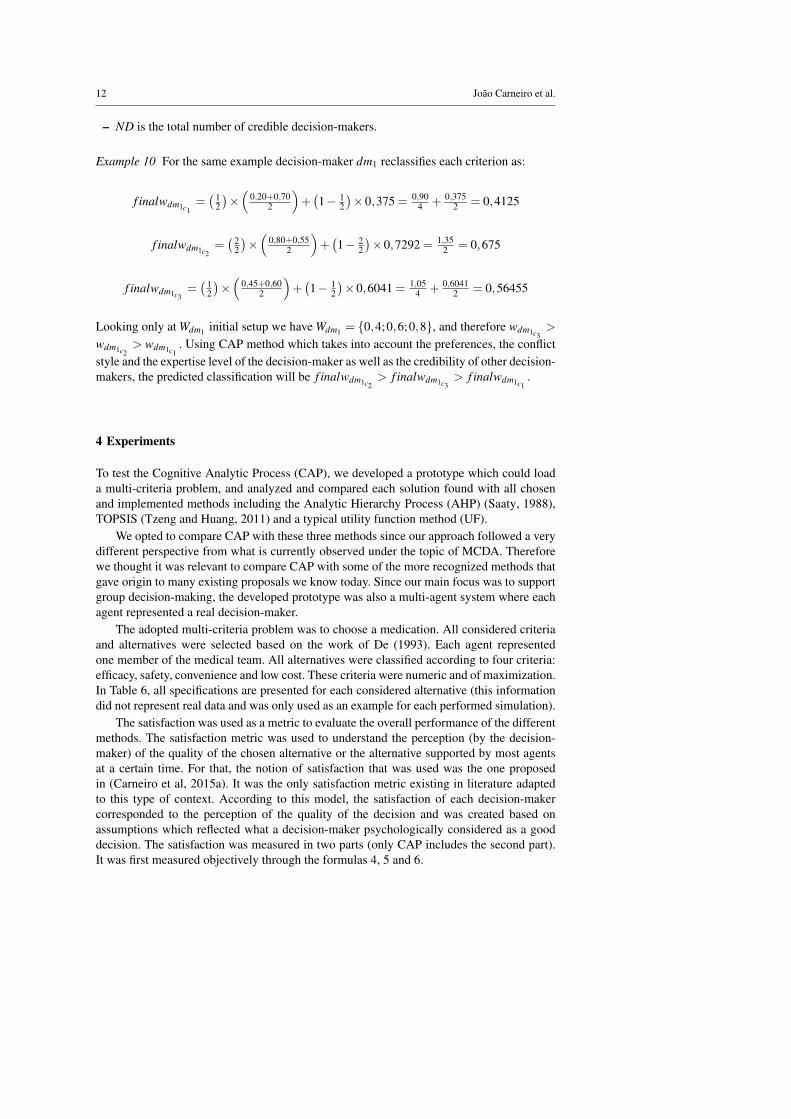
– ND is the total number of credible decision-makers.
Example 10 For the same example decision-maker dm1 reclassifies each criterion as:
f inalwdm1c1=( 1
2
)×(
0,20+0,702
)+(1− 1
2
)×0,375 = 0,90
4 + 0,3752 = 0,4125
f inalwdm1c2=( 2
2
)×(
0,80+0,552
)+(1− 2
2
)×0,7292 = 1,35
2 = 0,675
f inalwdm1c3=( 1
2
)×(
0,45+0,602
)+(1− 1
2
)×0,6041 = 1,05
4 + 0,60412 = 0,56455
Looking only at Wdm1 initial setup we have Wdm1 = {0,4;0,6;0,8}, and therefore wdm1c3>
wdm1c2> wdm1c1
. Using CAP method which takes into account the preferences, the conflictstyle and the expertise level of the decision-maker as well as the credibility of other decision-makers, the predicted classification will be f inalwdm1c2
> f inalwdm1c3> f inalwdm1c1
.
4 Experiments
To test the Cognitive Analytic Process (CAP), we developed a prototype which could loada multi-criteria problem, and analyzed and compared each solution found with all chosenand implemented methods including the Analytic Hierarchy Process (AHP) (Saaty, 1988),TOPSIS (Tzeng and Huang, 2011) and a typical utility function method (UF).
We opted to compare CAP with these three methods since our approach followed a verydifferent perspective from what is currently observed under the topic of MCDA. Thereforewe thought it was relevant to compare CAP with some of the more recognized methods thatgave origin to many existing proposals we know today. Since our main focus was to supportgroup decision-making, the developed prototype was also a multi-agent system where eachagent represented a real decision-maker.
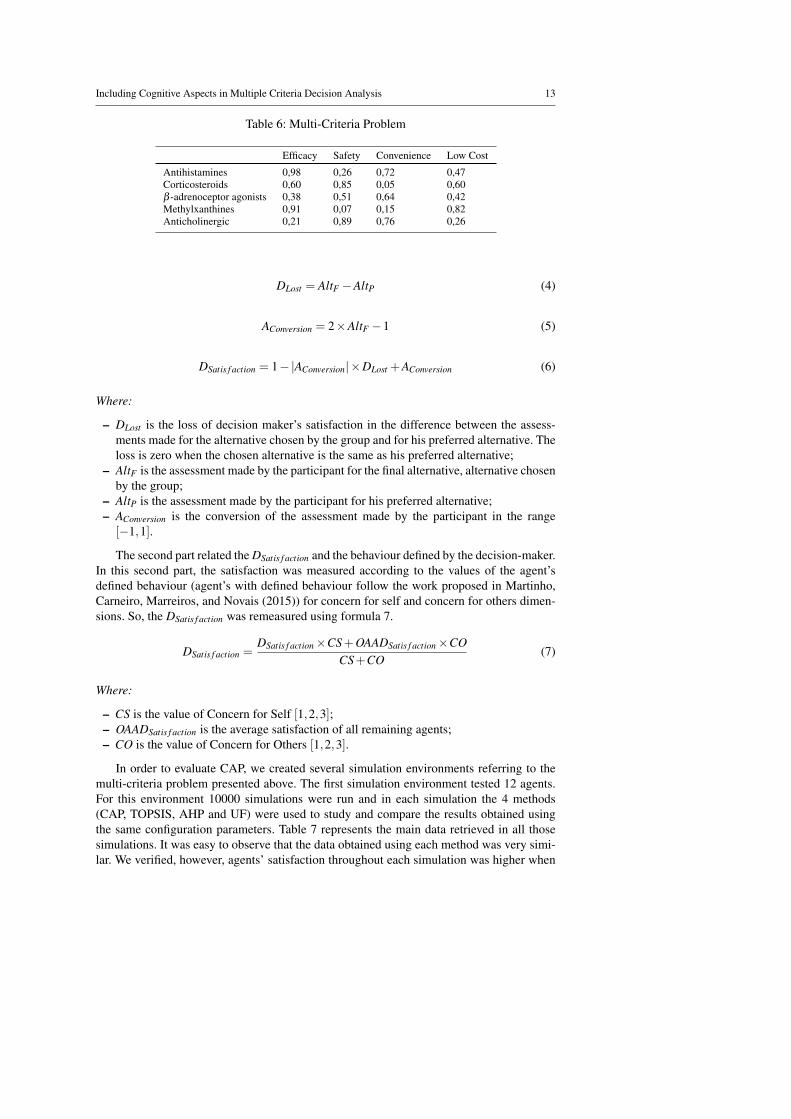
The adopted multi-criteria problem was to choose a medication. All considered criteriaand alternatives were selected based on the work of De (1993). Each agent representedone member of the medical team. All alternatives were classified according to four criteria:efficacy, safety, convenience and low cost. These criteria were numeric and of maximization.In Table 6, all specifications are presented for each considered alternative (this informationdid not represent real data and was only used as an example for each performed simulation).
The satisfaction was used as a metric to evaluate the overall performance of the differentmethods. The satisfaction metric was used to understand the perception (by the decision-maker) of the quality of the chosen alternative or the alternative supported by most agentsat a certain time. For that, the notion of satisfaction that was used was the one proposedin (Carneiro et al, 2015a). It was the only satisfaction metric existing in literature adaptedto this type of context. According to this model, the satisfaction of each decision-makercorresponded to the perception of the quality of the decision and was created based onassumptions which reflected what a decision-maker psychologically considered as a gooddecision. The satisfaction was measured in two parts (only CAP includes the second part).It was first measured objectively through the formulas 4, 5 and 6.
Including Cognitive Aspects in Multiple Criteria Decision Analysis 13
Table 6: Multi-Criteria Problem
Efficacy Safety Convenience Low Cost
Antihistamines 0,98 0,26 0,72 0,47Corticosteroids 0,60 0,85 0,05 0,60β -adrenoceptor agonists 0,38 0,51 0,64 0,42Methylxanthines 0,91 0,07 0,15 0,82Anticholinergic 0,21 0,89 0,76 0,26
DLost = AltF −AltP (4)
AConversion = 2×AltF −1 (5)
DSatis f action = 1−|AConversion|×DLost +AConversion (6)
Where:
– DLost is the loss of decision maker’s satisfaction in the difference between the assess-ments made for the alternative chosen by the group and for his preferred alternative. Theloss is zero when the chosen alternative is the same as his preferred alternative;
– AltF is the assessment made by the participant for the final alternative, alternative chosenby the group;
– AltP is the assessment made by the participant for his preferred alternative;– AConversion is the conversion of the assessment made by the participant in the range
[−1,1].
The second part related the DSatis f action and the behaviour defined by the decision-maker.In this second part, the satisfaction was measured according to the values of the agent’sdefined behaviour (agent’s with defined behaviour follow the work proposed in Martinho,Carneiro, Marreiros, and Novais (2015)) for concern for self and concern for others dimen-sions. So, the DSatis f action was remeasured using formula 7.
DSatis f action =DSatis f action×CS+OAADSatis f action×CO
CS+CO(7)
Where:
– CS is the value of Concern for Self [1,2,3];– OAADSatis f action is the average satisfaction of all remaining agents;– CO is the value of Concern for Others [1,2,3].
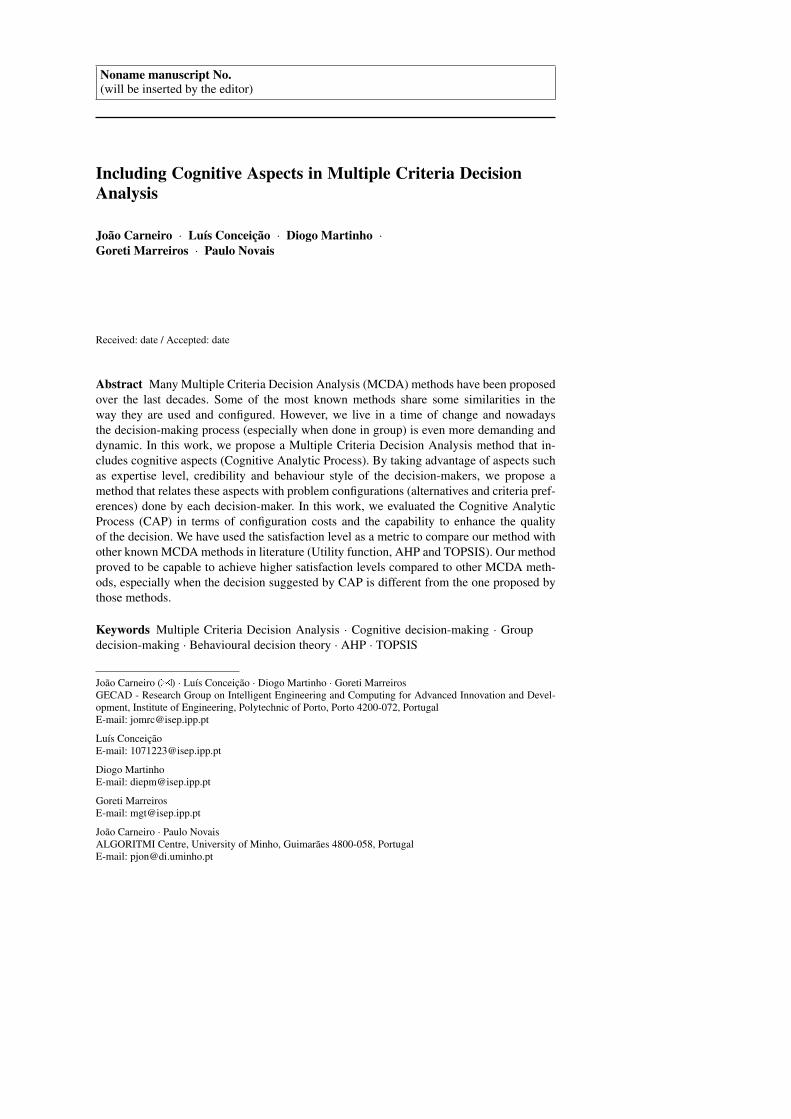
In order to evaluate CAP, we created several simulation environments referring to themulti-criteria problem presented above. The first simulation environment tested 12 agents.For this environment 10000 simulations were run and in each simulation the 4 methods(CAP, TOPSIS, AHP and UF) were used to study and compare the results obtained usingthe same configuration parameters. Table 7 represents the main data retrieved in all thosesimulations. It was easy to observe that the data obtained using each method was very simi-lar. We verified, however, agents’ satisfaction throughout each simulation was higher when
14 João Carneiro et al.
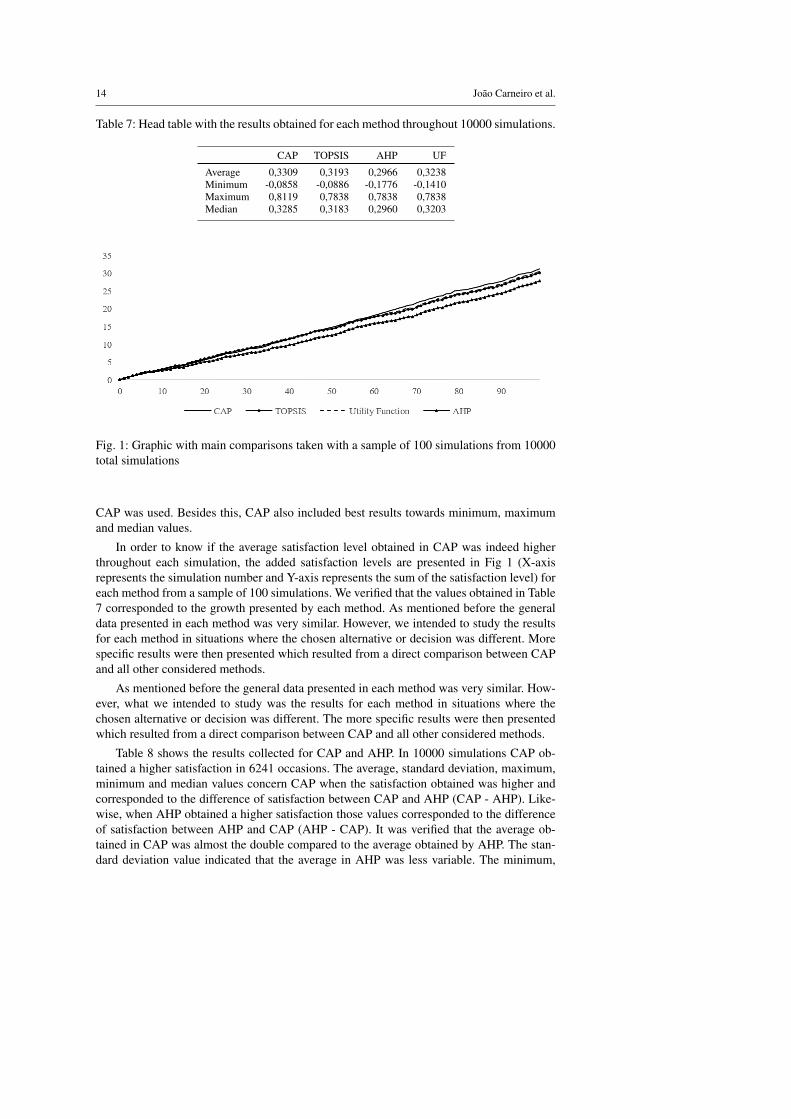
Table 7: Head table with the results obtained for each method throughout 10000 simulations.
CAP TOPSIS AHP UF
Average 0,3309 0,3193 0,2966 0,3238Minimum -0,0858 -0,0886 -0,1776 -0,1410Maximum 0,8119 0,7838 0,7838 0,7838Median 0,3285 0,3183 0,2960 0,3203
Fig. 1: Graphic with main comparisons taken with a sample of 100 simulations from 10000total simulations
CAP was used. Besides this, CAP also included best results towards minimum, maximumand median values.
In order to know if the average satisfaction level obtained in CAP was indeed higherthroughout each simulation, the added satisfaction levels are presented in Fig 1 (X-axisrepresents the simulation number and Y-axis represents the sum of the satisfaction level) foreach method from a sample of 100 simulations. We verified that the values obtained in Table7 corresponded to the growth presented by each method. As mentioned before the generaldata presented in each method was very similar. However, we intended to study the resultsfor each method in situations where the chosen alternative or decision was different. Morespecific results were then presented which resulted from a direct comparison between CAPand all other considered methods.
As mentioned before the general data presented in each method was very similar. How-ever, what we intended to study was the results for each method in situations where thechosen alternative or decision was different. The more specific results were then presentedwhich resulted from a direct comparison between CAP and all other considered methods.
Table 8 shows the results collected for CAP and AHP. In 10000 simulations CAP ob-tained a higher satisfaction in 6241 occasions. The average, standard deviation, maximum,minimum and median values concern CAP when the satisfaction obtained was higher andcorresponded to the difference of satisfaction between CAP and AHP (CAP - AHP). Like-wise, when AHP obtained a higher satisfaction those values corresponded to the differenceof satisfaction between AHP and CAP (AHP - CAP). It was verified that the average ob-tained in CAP was almost the double compared to the average obtained by AHP. The stan-dard deviation value indicated that the average in AHP was less variable. The minimum,
Including Cognitive Aspects in Multiple Criteria Decision Analysis 15
maximum and median values obtained by CAP were all higher compared to the values ob-tained by AHP.
Table 8: Comparison between CAP and AHP in 10000 simulations
CAP AHP
Count 6241 3759Average 0,0830 0,0464Standard Deviation 0,0726 0,0375Maximum 0,4408 0,2706Minimum 2,3872×10⁻⁶ 4,5927×10⁻⁶
Median 0,0614 0,0381
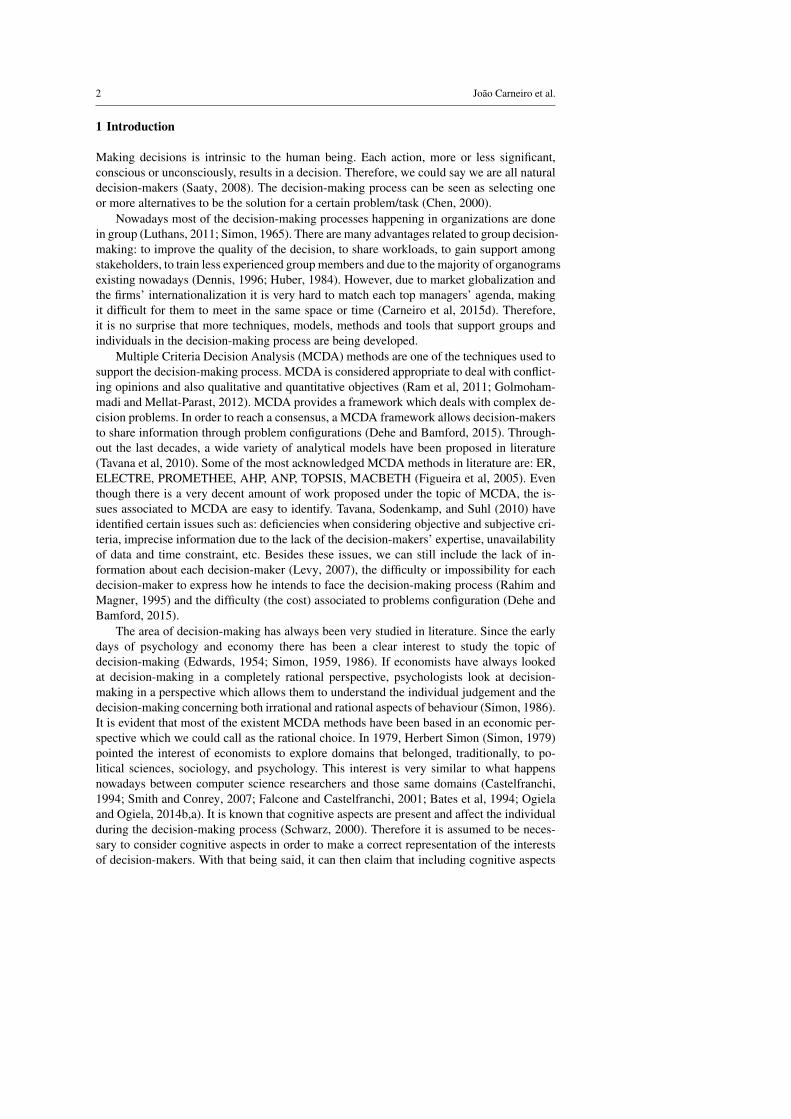
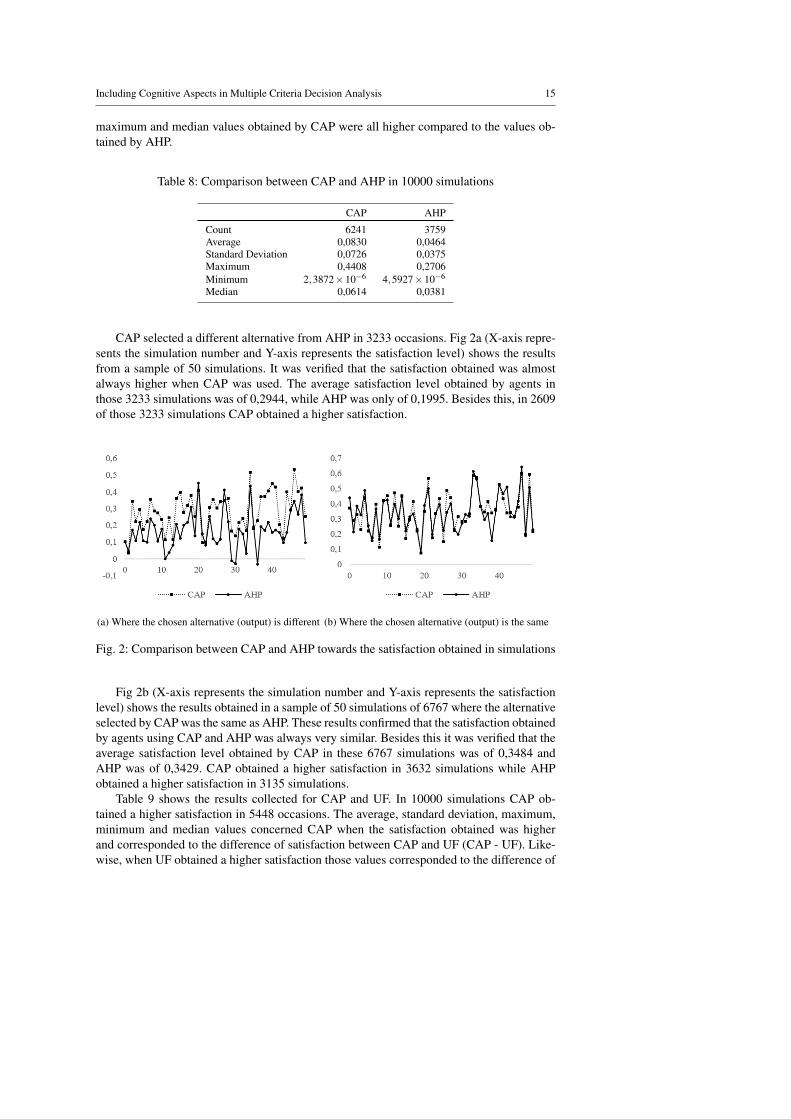
CAP selected a different alternative from AHP in 3233 occasions. Fig 2a (X-axis repre-sents the simulation number and Y-axis represents the satisfaction level) shows the resultsfrom a sample of 50 simulations. It was verified that the satisfaction obtained was almostalways higher when CAP was used. The average satisfaction level obtained by agents inthose 3233 simulations was of 0,2944, while AHP was only of 0,1995. Besides this, in 2609of those 3233 simulations CAP obtained a higher satisfaction.
(a) Where the chosen alternative (output) is different (b) Where the chosen alternative (output) is the same
Fig. 2: Comparison between CAP and AHP towards the satisfaction obtained in simulations
Fig 2b (X-axis represents the simulation number and Y-axis represents the satisfactionlevel) shows the results obtained in a sample of 50 simulations of 6767 where the alternativeselected by CAP was the same as AHP. These results confirmed that the satisfaction obtainedby agents using CAP and AHP was always very similar. Besides this it was verified that theaverage satisfaction level obtained by CAP in these 6767 simulations was of 0,3484 andAHP was of 0,3429. CAP obtained a higher satisfaction in 3632 simulations while AHPobtained a higher satisfaction in 3135 simulations.
Table 9 shows the results collected for CAP and UF. In 10000 simulations CAP ob-tained a higher satisfaction in 5448 occasions. The average, standard deviation, maximum,minimum and median values concerned CAP when the satisfaction obtained was higherand corresponded to the difference of satisfaction between CAP and UF (CAP - UF). Like-wise, when UF obtained a higher satisfaction those values corresponded to the difference of
16 João Carneiro et al.
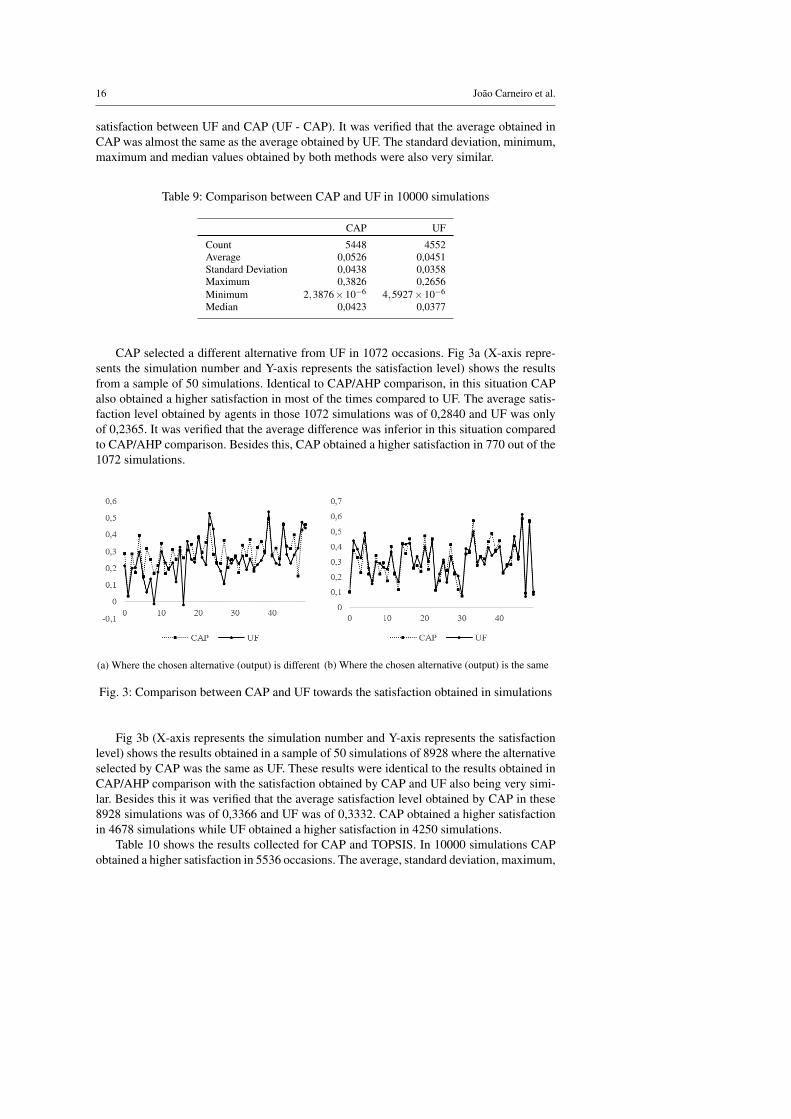
satisfaction between UF and CAP (UF - CAP). It was verified that the average obtained inCAP was almost the same as the average obtained by UF. The standard deviation, minimum,maximum and median values obtained by both methods were also very similar.
Table 9: Comparison between CAP and UF in 10000 simulations
CAP UF
Count 5448 4552Average 0,0526 0,0451Standard Deviation 0,0438 0,0358Maximum 0,3826 0,2656Minimum 2,3876×10⁻⁶ 4,5927×10⁻⁶
Median 0,0423 0,0377
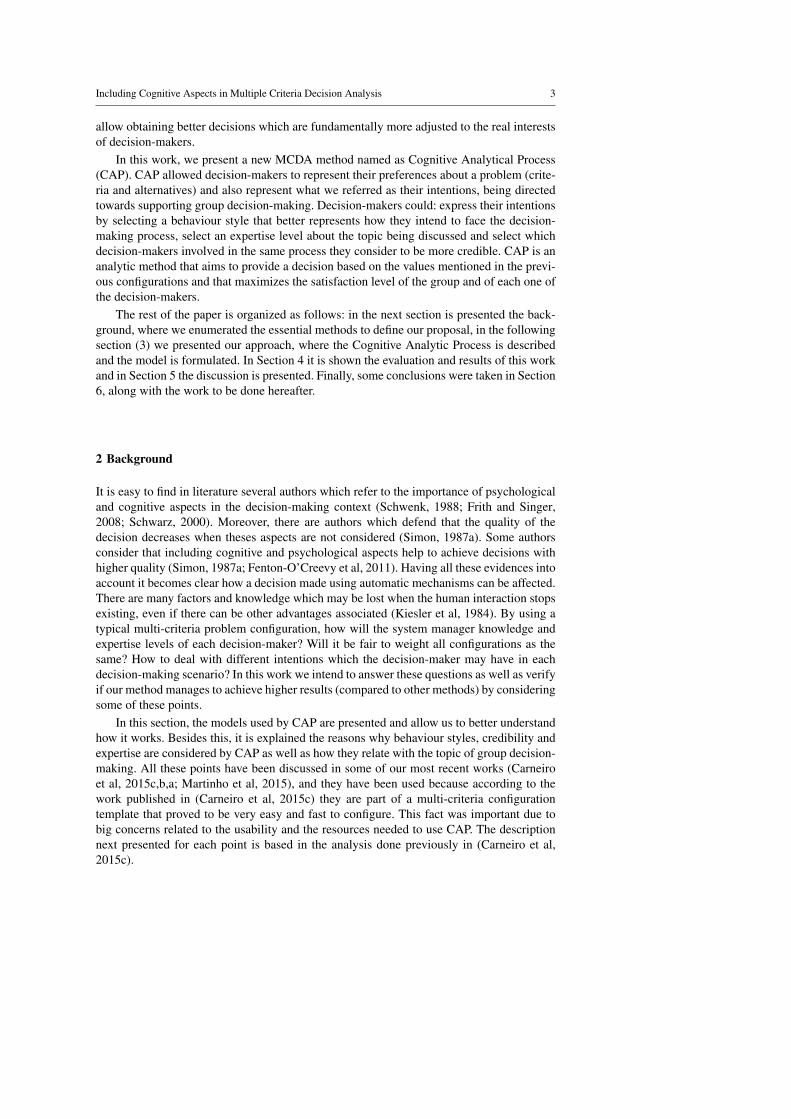
CAP selected a different alternative from UF in 1072 occasions. Fig 3a (X-axis repre-sents the simulation number and Y-axis represents the satisfaction level) shows the resultsfrom a sample of 50 simulations. Identical to CAP/AHP comparison, in this situation CAPalso obtained a higher satisfaction in most of the times compared to UF. The average satis-faction level obtained by agents in those 1072 simulations was of 0,2840 and UF was onlyof 0,2365. It was verified that the average difference was inferior in this situation comparedto CAP/AHP comparison. Besides this, CAP obtained a higher satisfaction in 770 out of the1072 simulations.
(a) Where the chosen alternative (output) is different (b) Where the chosen alternative (output) is the same
Fig. 3: Comparison between CAP and UF towards the satisfaction obtained in simulations
Fig 3b (X-axis represents the simulation number and Y-axis represents the satisfactionlevel) shows the results obtained in a sample of 50 simulations of 8928 where the alternativeselected by CAP was the same as UF. These results were identical to the results obtained inCAP/AHP comparison with the satisfaction obtained by CAP and UF also being very simi-lar. Besides this it was verified that the average satisfaction level obtained by CAP in these8928 simulations was of 0,3366 and UF was of 0,3332. CAP obtained a higher satisfactionin 4678 simulations while UF obtained a higher satisfaction in 4250 simulations.
Table 10 shows the results collected for CAP and TOPSIS. In 10000 simulations CAPobtained a higher satisfaction in 5536 occasions. The average, standard deviation, maximum,
Including Cognitive Aspects in Multiple Criteria Decision Analysis 17
minimum and median values concerned CAP when the satisfaction obtained was higher andcorresponded to the difference of satisfaction between CAP and TOPSIS (CAP - TOPSIS).Likewise, when TOPSIS obtained a higher satisfaction those values corresponded to thedifference of satisfaction between TOPSIS and CAP (TOPSIS - CAP). It was verified thatthe average obtained in CAP was almost the same as the average obtained by TOPSIS. Thestandard deviation, minimum, maximum and median values obtained by both methods werealso very similar.
Table 10: Comparison between CAP and TOPSIS in 10000 simulations
CAP TOPSIS
Count 5536 4464Average 0,0580 0,0460Standard Deviation 0,0506 0,0366Maximum 0,3826 0,2589Minimum 2,3872×10⁻⁶ 4,5927×10⁻⁶
Median 0,0423 0,0377
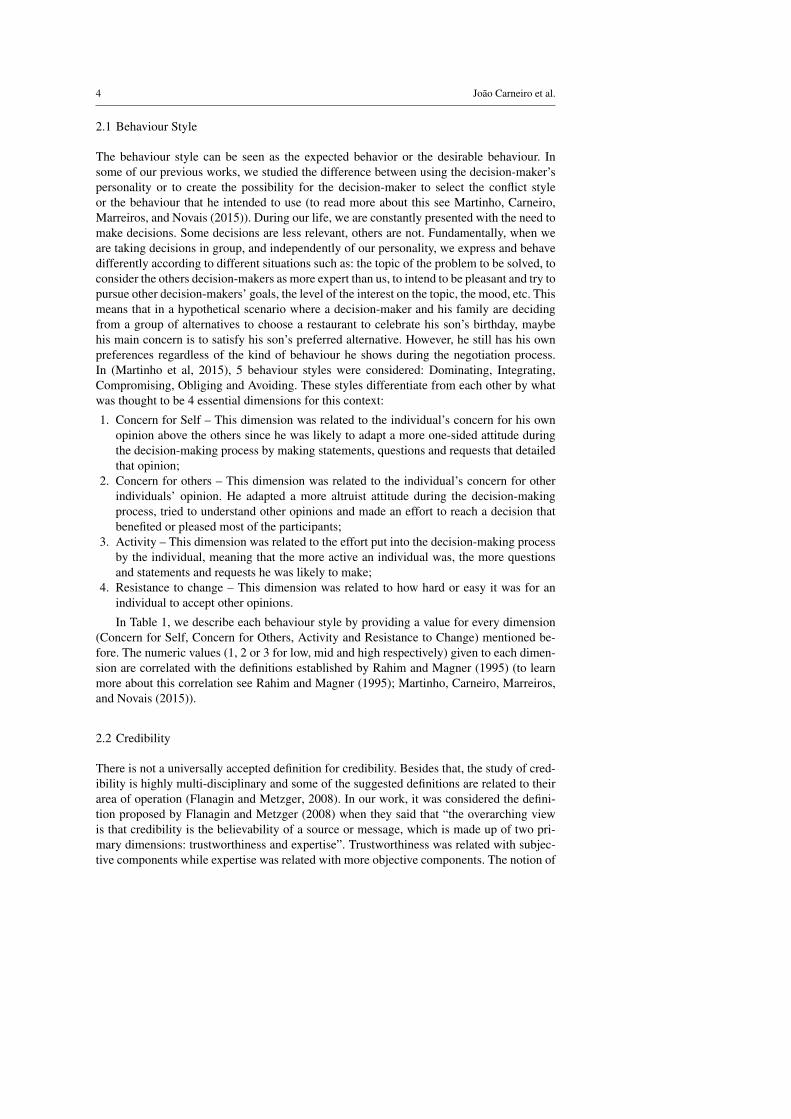
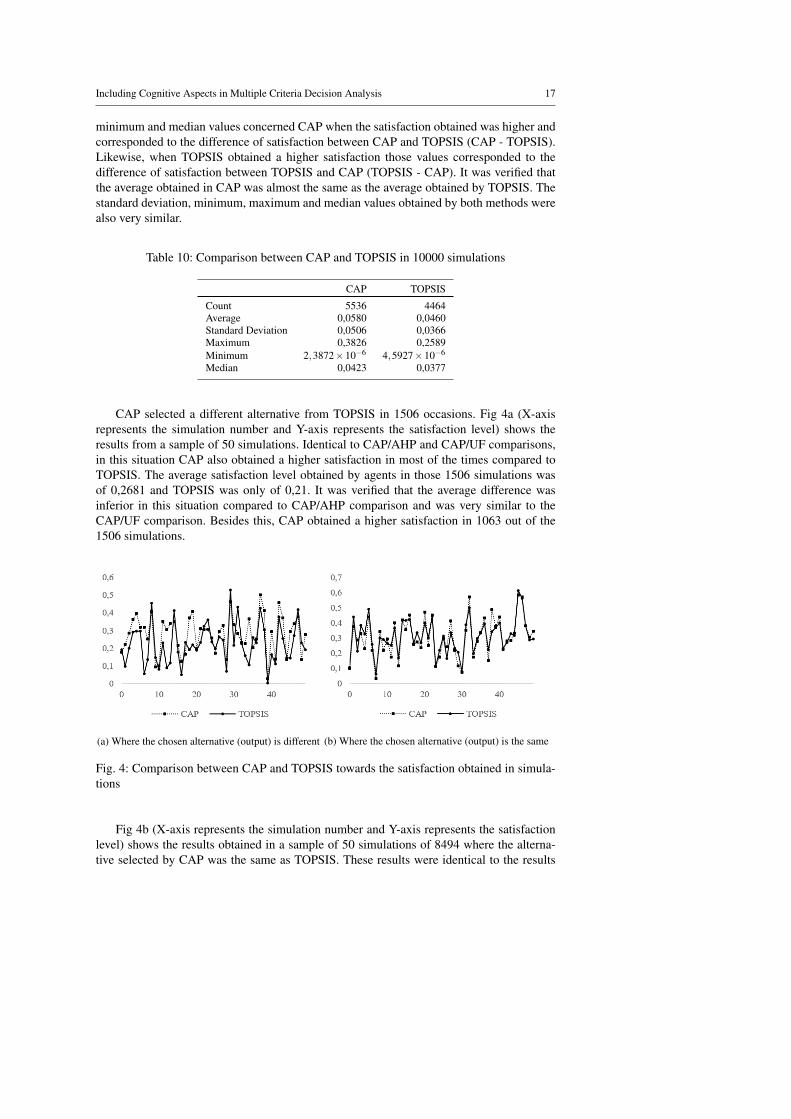
CAP selected a different alternative from TOPSIS in 1506 occasions. Fig 4a (X-axisrepresents the simulation number and Y-axis represents the satisfaction level) shows theresults from a sample of 50 simulations. Identical to CAP/AHP and CAP/UF comparisons,in this situation CAP also obtained a higher satisfaction in most of the times compared toTOPSIS. The average satisfaction level obtained by agents in those 1506 simulations wasof 0,2681 and TOPSIS was only of 0,21. It was verified that the average difference wasinferior in this situation compared to CAP/AHP comparison and was very similar to theCAP/UF comparison. Besides this, CAP obtained a higher satisfaction in 1063 out of the1506 simulations.
(a) Where the chosen alternative (output) is different (b) Where the chosen alternative (output) is the same
Fig. 4: Comparison between CAP and TOPSIS towards the satisfaction obtained in simula-tions
Fig 4b (X-axis represents the simulation number and Y-axis represents the satisfactionlevel) shows the results obtained in a sample of 50 simulations of 8494 where the alterna-tive selected by CAP was the same as TOPSIS. These results were identical to the results
18 João Carneiro et al.
obtained in CAP/UF comparison with the satisfaction obtained by CAP and TOPSIS alsobeing very similar. Besides this it was verified that the average satisfaction level obtained byCAP in these 8494 simulations was of 0,3421 and TOPSIS was of 0,3380. CAP obtained ahigher satisfaction in 4473 simulations while TOPSIS obtained a higher satisfaction in 4021simulations.
To close the study on this simulation environment (10000 simulations) we comparedthe number of times when each method obtained the best satisfaction compared with theother methods. Table 11 shows the data collected. It was verified that the satisfaction levelobtained was higher by CAP in 5195 simulations, by AHP in 191 simulations, UF in 308simulations and TOPSIS in only 48 simulations. In situations when more than one methodobtained the same highest satisfaction level it was possible to observe that CAP obtained thesame result and the remaining methods increased significantly. It was possible to concludethat in 4258 simulations more than one method achieved the same highest satisfaction level.Because of that it was important to figure if CAP obtained much worse results. Average sat-isfaction values obtained in the 4805 simulations when CAP did not achieve the best resultswere of 0,2975, 0,2833, 0,3238 and 0,3204 for AHP, CAP UF and TOPSIS respectively.
Table 11: Satisfaction comparison between all methods
AHP CAP UF TOPSIS
Best 191 5195 308 48Best or Equal 3516 5195 4317 4272
Another point that was studied was related with the differences between criteria weight-ing and rankings comparison done by each method. In Table 12, it is presented the valuesobtained by each method for criteria weighting and rankings comparison in 4 simulations.In each simulation a random agent was selected and used as reference. For this problem (nottoo complex, with just 4 criteria) it was verified that AHP and TOPSIS obtained the samecriteria ranking (in all simulations) even with different criteria weighting. In case of CAP, thecriteria ranking was similar to AHP and TOPSIS but with some differences. For example, inthe second simulation, CAP classified “Safety” and “Convenience” as VIC while AHP andTOPSIS classified those same criteria differently even though their weighting was very simi-lar. Another interesting fact that was verified was related with how AHP and TOPSIS criteriaranking was always done based on the weighting value which resulted in a sequential order(1,2,3, . . . ,n). In case of CAP criteria ranking this order was not necessarily sequential andthere were situations where two or more criteria were given the same rank. For example inthe second simulation, CAP ranking classified two criteria as VIC and two criteria as INCin a scale with the following decreasing order: VIC, IC, MC, NIC and INC.
For the last study, a simulation environment was created to understand how the resultsobtained by each method varied depending on the number of agents (decision-makers)involved in the decision-making process. 1000 simulations were run for each group ofdecision-makers (2, 4, 8, 10, 20, 30, 40, 50, 100, 200, 300, 400 and 500 agents) totaling13000 simulations. Similarly to previous procedure, CAP was compared directly with eachother method. The main goals were to measure the variation of the average satisfaction levelobtained by each method with the variation of the number of decision-makers involved inthe process and also measure how that variation brought each method closer according tothe number of equivalent decisions.
Including Cognitive Aspects in Multiple Criteria Decision Analysis 19
Table 12: Example of criteria ranking according to each method
Simulations Criteria CAP AHP TOPSISWeight(%) Rank Weight(%) Rank Weight(%) Rank
1
Efficacy - MC 14,35 3 23,15 3Safety - VIC 58,49 1 45,37 1Convenience - INC 4,55 4 1,85 4Low cost - IC 22,61 2 29,63 2
2
Efficacy - INC 5,10 3 0,50 3Safety - VIC 45,86 1 49,74 1Convenience - VIC 43,93 2 49,24 2Low cost - INC 5,10 3 0,50 3
3
Efficacy - VIC 44,49 1 43,47 1Safety - INC 5,16 4 3,86 4Convenience - NIC 7,76 3 9,66 3Low cost - VIC 42,56 2 42,99 2
4
Efficacy - MC 16,38 3 25,47 3Safety - VIC 55,66 1 43,39 1Convenience - INC 4,58 4 0,94 4Low cost - IC 23,36 2 30,18 2
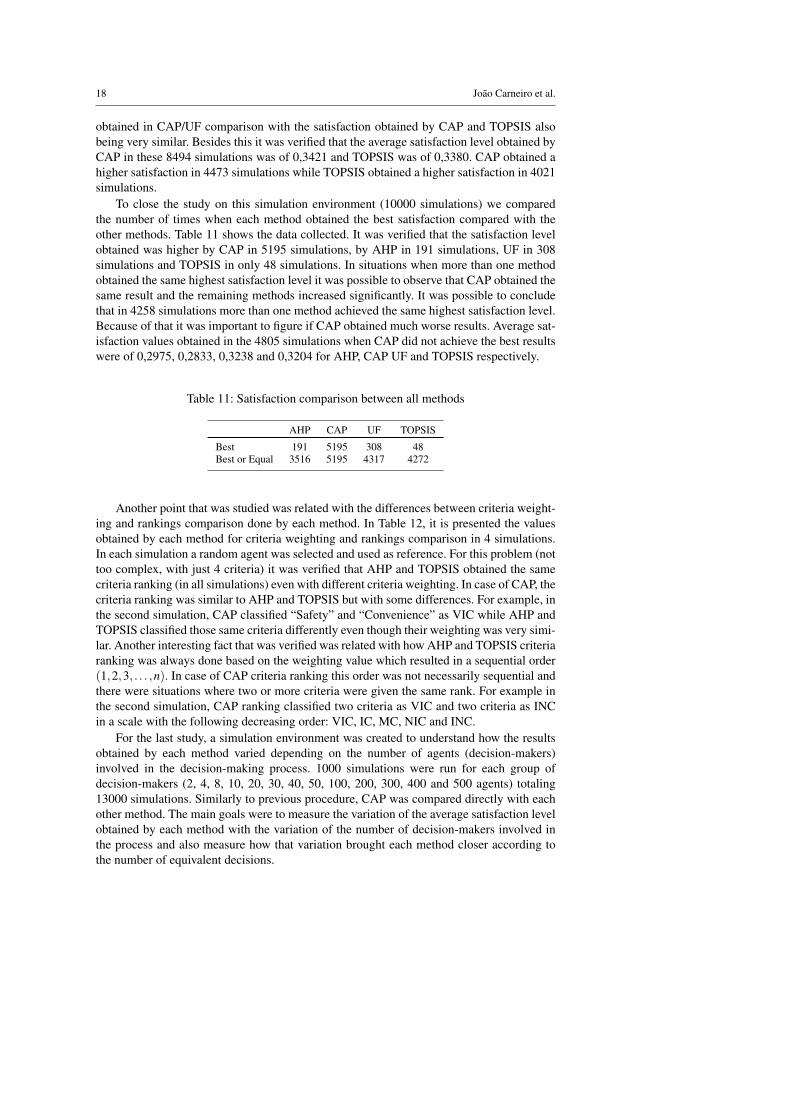
Fig 5a (X-axis represents the number of agents and Y-axis represents the satisfactionlevel) shows the average satisfaction level obtained by CAP and AHP (when the achieveddecisions were different) for each set of 1000 simulations done with each group of decision-makers (2, 4, 8, 10, ..., 500). It was verified that the satisfaction obtained by AHP wasrelatively the same throughout each scenario. In case of CAP the average satisfaction levelobtained was higher when there were a small number of decision-makers involved in theprocess and decreased and stayed relatively constant as the number of decision-makers in-volved in the process increased. However, the average satisfaction level obtained by CAPwas always higher compared to AHP in all scenarios, more particularly when the number ofdecision-makers was less than 20.
(a) Satisfaction obtained (b) Average number of different and same decision
Fig. 5: Comparison between CAP and AHP
Fig 5b (X-axis represents the number of agents and Y-axis represents the number ofsimulations) shows the number of times in each scenario when CAP and AHP reached same
20 João Carneiro et al.
or different decisions. It was possible to notice that there were more different decisions whenthe number of decision-makers involved in the process ranged from 30 to 100. Decisionswere least different when 500 decision-makers participated in the process (83,3%).
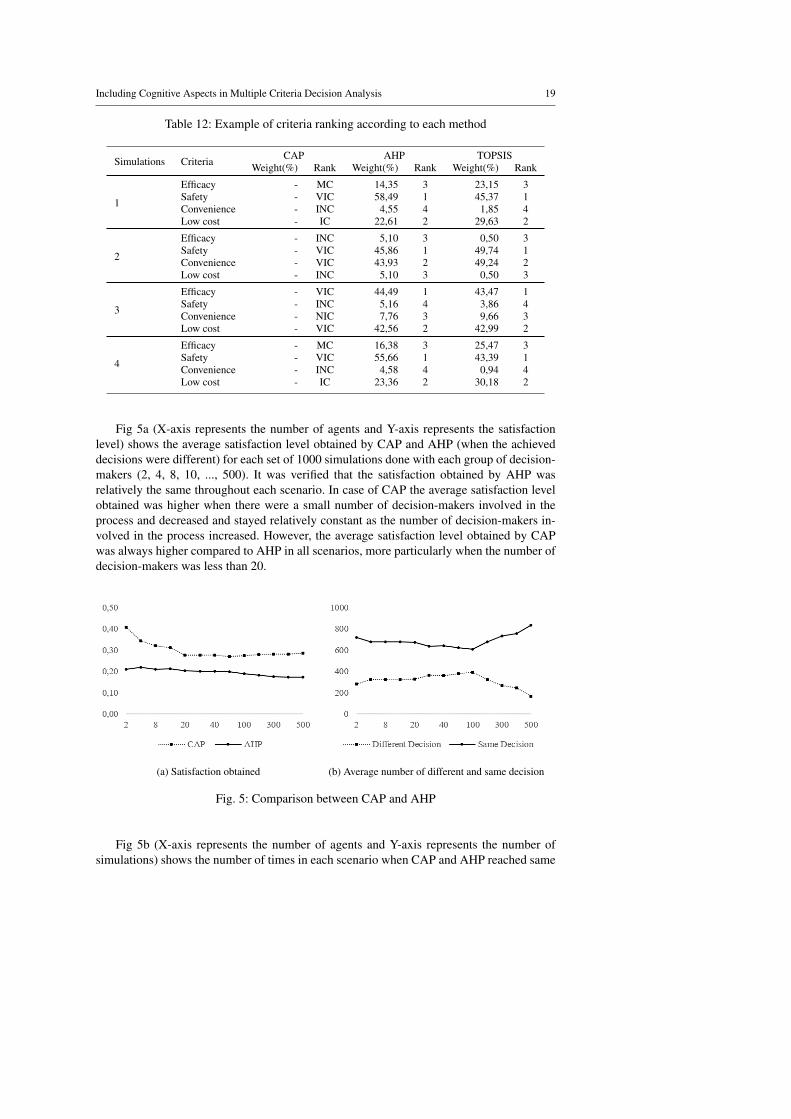
Fig 6a (X-axis represents the number of agents and Y-axis represents the satisfactionlevel) shows the average satisfaction level obtained by CAP and UF (when the achieveddecisions were different) for each set of 1000 simulations done with each group of decision-makers (2, 4, 8, 10, ..., 500). It was verified that the average satisfaction level obtained inboth methods was very similar. However, CAP still obtained better results compared withUF in each scenario. In scenarios where more than 100 decision-makers were considered(200, 300, 400 and 500) there was no average satisfaction level obtained as both methodsalways reached the same decision.
(a) Satisfaction obtained (b) Average number of different and same decisions
Fig. 6: Comparison between CAP and UF
As can be seen in Fig 6b (X-axis represents the number of agents and Y-axis representsthe number of simulations) when the number of decision-makers involved in the process ishigher than 100 both methods always reached the same decision. It was also verified thatthe most significant difference in the decisions reached by both methods occurred between2 and 20 participant agents.
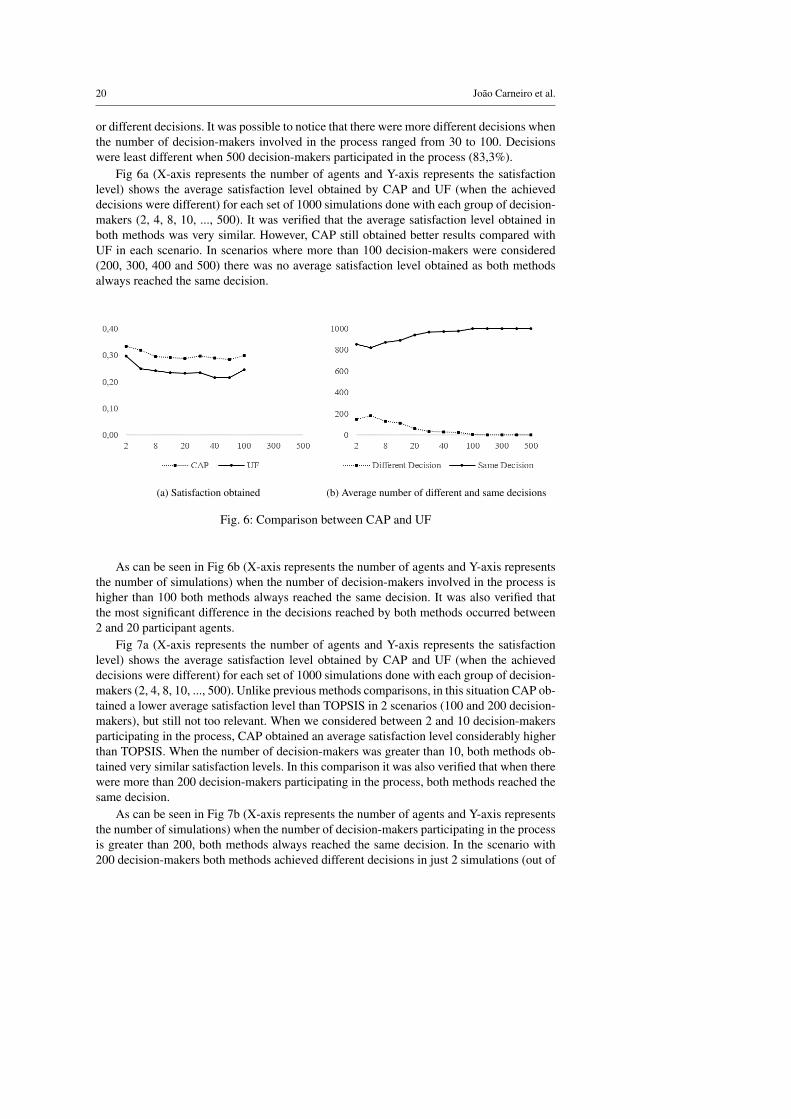
Fig 7a (X-axis represents the number of agents and Y-axis represents the satisfactionlevel) shows the average satisfaction level obtained by CAP and UF (when the achieveddecisions were different) for each set of 1000 simulations done with each group of decision-makers (2, 4, 8, 10, ..., 500). Unlike previous methods comparisons, in this situation CAP ob-tained a lower average satisfaction level than TOPSIS in 2 scenarios (100 and 200 decision-makers), but still not too relevant. When we considered between 2 and 10 decision-makersparticipating in the process, CAP obtained an average satisfaction level considerably higherthan TOPSIS. When the number of decision-makers was greater than 10, both methods ob-tained very similar satisfaction levels. In this comparison it was also verified that when therewere more than 200 decision-makers participating in the process, both methods reached thesame decision.
As can be seen in Fig 7b (X-axis represents the number of agents and Y-axis representsthe number of simulations) when the number of decision-makers participating in the processis greater than 200, both methods always reached the same decision. In the scenario with200 decision-makers both methods achieved different decisions in just 2 simulations (out of
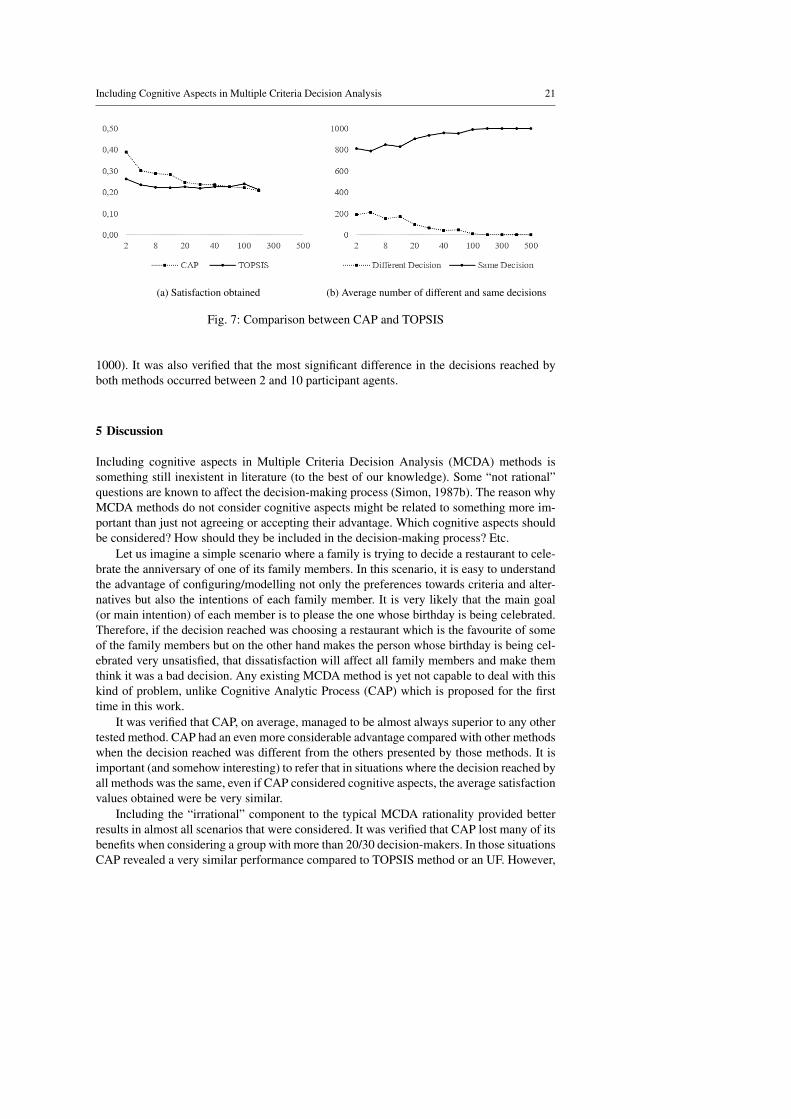
Including Cognitive Aspects in Multiple Criteria Decision Analysis 21
(a) Satisfaction obtained (b) Average number of different and same decisions
Fig. 7: Comparison between CAP and TOPSIS
1000). It was also verified that the most significant difference in the decisions reached byboth methods occurred between 2 and 10 participant agents.
5 Discussion
Including cognitive aspects in Multiple Criteria Decision Analysis (MCDA) methods issomething still inexistent in literature (to the best of our knowledge). Some “not rational”questions are known to affect the decision-making process (Simon, 1987b). The reason whyMCDA methods do not consider cognitive aspects might be related to something more im-portant than just not agreeing or accepting their advantage. Which cognitive aspects shouldbe considered? How should they be included in the decision-making process? Etc.
Let us imagine a simple scenario where a family is trying to decide a restaurant to cele-brate the anniversary of one of its family members. In this scenario, it is easy to understandthe advantage of configuring/modelling not only the preferences towards criteria and alter-natives but also the intentions of each family member. It is very likely that the main goal(or main intention) of each member is to please the one whose birthday is being celebrated.Therefore, if the decision reached was choosing a restaurant which is the favourite of someof the family members but on the other hand makes the person whose birthday is being cel-ebrated very unsatisfied, that dissatisfaction will affect all family members and make themthink it was a bad decision. Any existing MCDA method is yet not capable to deal with thiskind of problem, unlike Cognitive Analytic Process (CAP) which is proposed for the firsttime in this work.
It was verified that CAP, on average, managed to be almost always superior to any othertested method. CAP had an even more considerable advantage compared with other methodswhen the decision reached was different from the others presented by those methods. It isimportant (and somehow interesting) to refer that in situations where the decision reached byall methods was the same, even if CAP considered cognitive aspects, the average satisfactionvalues obtained were be very similar.
Including the “irrational” component to the typical MCDA rationality provided betterresults in almost all scenarios that were considered. It was verified that CAP lost many of itsbenefits when considering a group with more than 20/30 decision-makers. In those situationsCAP revealed a very similar performance compared to TOPSIS method or an UF. However,
22 João Carneiro et al.
this situation was a good example to consider cognitive aspects in CAP correctly. The in-tentions of each decision-maker in a very large group would be diluted. It is unthinkable toconsider using cognitive aspects, for example, for each voter in presidential elections of acountry. CAP was advantageous especially when the group decision-makers varied between2 and 20 elements. This allowed us to conclude that including cognitive aspects could bevery irrelevant if we were dealing with very large groups of decision-makers.
It must also not be forgotten that CAP was very easy to configure and did not requiremore data than what was presented in (Carneiro et al, 2015c). On the other hand, using AHPwhich is considered to have a very high configuration cost (Dehe and Bamford, 2015) mightresult in decision-makers refusing or rejecting to use software with such kind of approach.
With this work a new hypothesis of research is raised: The advantages identified inthis work by using CAP method will be even more evident in real scenarios. This happensbecause it is mathematically impossible to define agents that can create and imagine typicalintentions of a human being in very specific real contexts.
6 Conclusion and Future Work
Nowadays the decisions made by managers and executives are mostly performed in groups.Thereby, group decision-making is a process in which a group of people, called participants,act collectively analyzing a set of variables, considering and evaluating the available alter-natives in order to select one or more solutions. The number of participants involved in theprocess is variable and all of them may be at the same space/place at the same time or eithergeographically dispersed at different times.
Usually, Multiple Criteria Decision Analysis (MCDA) methods are techniques used tosupport the decision-making process. MCDA methods allow decision-makers to make a cer-tain multi-criteria problem configuration and based on that configuration a solution will besuggested (supposedly the best). MCDA methods, however, have certain problems (accord-ing to literature) due to the completely analytical and rational way in which the multi-criteriaproblems are considered.
In this work, we presented Cognitive Analytic Process (CAP) which is MCDA methodthat included cognitive aspects in its analysis and that let decision-makers configure not onlytheir preferences (criteria and alternatives) but also their intentions. CAP allowed decision-makers to configure a multi-criteria problem (criteria and alternatives) as well as their be-haviour style (which could be seen as their position before the problem and the decision-making group), their expertise level and select which other decision-maker was credible ornot. It also had the advantage of only requiring information that allowed fast configurations(resulting in a very high level of usability) with the particularity that CAP worked even if thedecision-maker did not configure any of the points mentioned before. This way, CAP couldprocess all the information and suggested a solution combining the rational component withthe irrational dimension (which is sometimes difficult to explain by decision-makers them-selves).
The results achieved in this work confirmed the advantage of what was being expressedin literature for many decades. Considering cognitive aspects brought advantages to thegroup decision-making process and allowed reaching higher quality decisions and with moresatisfaction. Moreover, we made this idea computationally feasible. CAP demonstrated thatit could almost always be superior than some of the most acknowledged MCDA methodsexisting in literature. Besides this, CAP demonstrated that it was especially useful in processthat included a maximum number of 20 decision-makers.
Including Cognitive Aspects in Multiple Criteria Decision Analysis 23
As future work, there are still some points to be studied. In first place, we intend tocompare CAP with most recent MCDA methods. After that, we intend to compare CAPwith those methods in a case of study with real decision-makers, since we believe that in areal environment CAP is capable to be even better than other MCDA methods. Finally, wewant to learn with all these processes and work in shaping CAP to make it an even strongerand more complete MCDA method.
Acknowledgements This work was supported by COMPETE Programme (operational programme for com-petitiveness) within project POCI-01-0145-FEDER-007043, by National Funds through the FCT – Fundaçãopara a Ciência e a Tecnologia (Portuguese Foundation for Science and Technology) within the ProjectsUID/CEC/00319/2013, UID/EEA/00760/2013, and the João Carneiro PhD grant with the reference SFRH/BD/89697/2012.
References
Ahn B, Choi S (2012) Aggregation of ordinal data using ordered weighted averaging oper-ator weights. Annals of Operations Research 201(1):1–16
Bates J, et al (1994) The role of emotion in believable agents. Communications of the ACM37(7):122–125
Bozóki S, Dezso L, Poesz A, Temesi J (2013) Analysis of pairwise comparison matrices: anempirical research. Annals of Operations Research 211(1):511–528
Carneiro J, Marreiros G, Novais P (2015a) Using satisfaction analysis to predict decisionquality. International Journal of Artificial IntelligenceTM 13(1):45–57
Carneiro J, Martinho D, Marreiros G, Novais P (2015b) Defining Agents’ Behaviour forNegotiation Contexts, Springer, pp 3–14
Carneiro J, Martinho D, Marreiros G, Novais P (2015c) A general template to configuremulti-criteria problems in ubiquitous gdss. International Journal of Software Engineeringand Its Applications 9:193–206, DOI 10.14257/astl.205.97.17
Carneiro J, Santos R, Marreiros G, Novais P (2015d) Ubigdss: A theoretical model to pre-dict decision-makers’ sat-isfaction. International Journal of Multimedia and UbiquitousEngineering 10(7):191–200
Castelfranchi C (1994) Guarantees for autonomy in cognitive agent architecture. In: Intelli-gent agents, Springer, pp 56–70
Chen CT (2000) Extensions of the topsis for group decision-making under fuzzy environ-ment. Fuzzy sets and systems 114(1):1–9
De VT (1993) Presenting clinical pharmacology and therapeutics: a problem based approachfor choosing and prescribing drugs. British journal of clinical pharmacology 35(6):581–586
Dehe B, Bamford D (2015) Development, test and comparison of two multiple criteria deci-sion analysis (mcda) models: A case of healthcare infrastructure location. Expert Systemswith Applications 42(19):6717–6727
Dennis AR (1996) Information exchange and use in small group decision making. SmallGroup Research 27(4):532–550
Edwards W (1954) The theory of decision making. Psychological bulletin 51(4):380Falcone R, Castelfranchi C (2001) Social trust: A cognitive approach. In: Trust and decep-
tion in virtual societies, Springer, pp 55–90Fenton-O’Creevy M, Soane E, Nicholson N, Willman P (2011) Thinking, feeling and de-
ciding: The influence of emotions on the decision making and performance of traders.Journal of Organizational Behavior 32(8):1044–1061
24 João Carneiro et al.
Figueira J, Greco S, Ehrgott M (2005) Multiple criteria decision analysis: state of the artsurveys, vol 78. Springer Science & Business Media
Flanagin AJ, Metzger MJ (2008) Digital media and youth: Unparalleled opportunity andunprecedented responsibility. Digital media, youth, and credibility pp 5–27
Frith CD, Singer T (2008) The role of social cognition in decision making. PhilosophicalTransactions of the Royal Society of London B: Biological Sciences 363(1511):3875–3886
Golmohammadi D, Mellat-Parast M (2012) Developing a grey-based decision-makingmodel for supplier selection. International Journal of Production Economics 137(2):191–200
Huber GP (1984) Issues in the design of group decision support sytems. MIS quarterly pp195–204
Kiesler S, Siegel J, McGuire TW (1984) Social psychological aspects of computer-mediatedcommunication. American psychologist 39(10):1123
Kou G, Wu W (2014) Multi-criteria decision analysis for emergency medical service assess-ment. Annals of Operations Research 223(1):239–254
Levy G (2007) Decision making in committees: Transparency, reputation, and voting rules.The American Economic Review pp 150–168
Luthans F (2011) Organizational behavior. McGraw-Hill/Irwin 46:594, DOI 10.1146/annurev.psych.46.1.59
Martinho D, Carneiro J, Marreiros G, Novais P (2015) Dealing with agents’ behaviour in thedecision-making process. In: Workshop Proceedings of the 11th International Conferenceon Intelligent Environments, IOS Press, vol 19, p 4
Ogiela L, Ogiela MR (2014a) Cognitive systems and bio-inspired computing in homelandsecurity. Journal of Network and Computer Applications 38:34–42
Ogiela L, Ogiela MR (2014b) Cognitive systems for intelligent business informationmanagement in cognitive economy. International Journal of Information Management34(6):751–760
Rahim MA, Magner NR (1995) Confirmatory factor analysis of the styles of handling in-terpersonal conflict: first-order factor model and its invariance across groups. Journal ofapplied psychology 80(1):122
Ram C, Montibeller G, Morton A (2011) Extending the use of scenario planning andmcda for the evaluation of strategic options. Journal of the Operational Research Soci-ety 62(5):817–829
Saaty TL (1988) What is the analytic hierarchy process? SpringerSaaty TL (2008) Decision making with the analytic hierarchy process. International journal
of services sciences 1(1):83–98Schwarz N (2000) Emotion, cognition, and decision making. Cognition & Emotion
14(4):433–440Schwenk CR (1988) The cognitive perspective on strategic decision making. Journal of
management studies 25(1):41–55Simon HA (1959) Theories of decision-making in economics and behavioral science. The
American economic review 49(3):253–283Simon HA (1965) Administrative behavior, vol 4. Cambridge Univ PressSimon HA (1979) Rational decision making in business organizations. The American Eco-
nomic Review 64:493–514, DOI 10.2307/1808698Simon HA (1986) Rationality in psychology and economics. Journal of Business pp S209–
S224

Including Cognitive Aspects in Multiple Criteria Decision Analysis 25
Simon HA (1987a) Making management decisions: The role of intuition and emotion. TheAcademy of Management Executive (1987-1989) pp 57–64
Simon HA (1987b) Making management decisions: The role of intuition and emotion. TheAcademy of Management Executive (1987-1989) pp 57–64
Smith ER, Conrey FR (2007) Agent-based modeling: A new approach for theory buildingin social psychology. Personality and social psychology review 11(1):87–104
Tavana M, Sodenkamp MA, Suhl L (2010) A soft multi-criteria decision analysis modelwith application to the european union enlargement. Annals of Operations Research181(1):393–421
Tzeng GH, Huang JJ (2011) Multiple attribute decision making: methods and applications.CRC press
Wang J (2012) Robust optimization analysis for multiple attribute decision making problemswith imprecise information. Annals of Operations Research 197(1):109–122