including economic transition scenarios … … · this document presents a ... accompanies the...
TRANSCRIPT

French Environment &Energy Management Agency
Summary
ADEME ENERGYTRANSITION SCENARIOS
20302050
INCLUDING A MACRO-
ECONOMICEVALUATION
Preamble ADEME, the French Environment and Energy Management Agency, is a public agency reporting to the Ministry of Ecology, Sustainable Development and Energy and the Ministry of Higher Education and Research. In 2012 the agency drew up a long-term scenario entitled “ADEME Energy Transition Scenarios 2030-2050”. This document presents a summary of the report. The full version can be viewed online on the ADEME website.
With this work ADEME offers a proactive energy vision for all stakeholders – experts, the general public, decision-makers, etc. – focusing on two main areas of expertise: managing energy conservation and developing renewable energy production using proven or demonstration-phase technologies.
These scenarios identify a possible pathway for the energy transition in France. They are based on two time horizons and two separate methodologies. One projection, applicable from the present day, seeks to maximise potential energy savings and renewable energy production in an ambitious but realistic manner, up to 2030. The second exercise is a normative scenario that targets a fourfold reduction in greenhouse gas emissions generated in France by 2050, compared to 1990 levels.
The analysis presented in this document is primarily based on an exploration of different scenarios that allow for the achievement of ambitious energy and environmental targets under technically, economically and socially feasibleconditions. This analysis is supplemented by a macroeconomic analysis.
These projections, particularly for 2030, do not rely on radical changes in lifestyle, lower comfort levels or hypothetical major technological breakthroughs. They show that by using technologies and organisational changes that are currently within our reach, we have the means to achieve these long-term goals. The scenarios are based on assumptions of significant growth, both economic (1.8% per year) and demographic (0.4% a year). The 2050 scenario shows that with sustained growth, a fourfold reduction in greenhouse gas emissions is achievable. By supporting the green economy, which embraces business activities of the future such as renewable energy production, energy recovery from waste, recycling and eco-design – “resources” that are all available within France – we can move towards robust and sustainable growth.
The present economic crisis should not halt our efforts. Greater energy efficiency means higher employment.Breaking our dependency on fossil fuels is the way to anticipate future economic conditions – fossil energy prices will inevitably rise during the coming decades – and to reduce our vulnerability to imports that have become a significant burden (€69 billion in 2012) and comply with our international commitments to reduce our greenhouse gas emissions. Acting now clearly has a cost, especially during the first years, but the macroeconomic evaluation that accompanies the 2030-2050 Energy Transition scenarios show that in addition to environmental benefits, the energytransition could also have a beneficial impact on the French economy.

Maximising France’s potential for saving energy and developing renewable energy sources 1. Energy demand: starting to reduce consumption
Up to 2030, the buildings sector (residential and tertiary) is the largest contributor to lower energy consumption, with 15 mtoe in savings (over 50% of anticipated savings) thanks to the renovation of an average of 500,000 dwellingsper year. The transport sector contributes 8 mtoe (30% of total savings), as the greater structural changes required in this sector will take longer to establish.
Energy scenario to 2030 at a glance
151 mtoe
123 mtoe
2010 2030
-18%-28mtoe
2. Towards a sustainable and diversified energy supply
Starting from the current situation in which nearly 90% of energy production is dependent on non-renewableenergy sources, investments in renewable energy sources will lead to a more balanced situation in which renewablesaccount for 35% of the energy mix.
3. Greenhouse gas emissions reduced by 40%
The 2030 scenario allows for a 40% reduction in greenhouse gas (GHG) emissions between1990 and 2030. The decarbonising of energy supplies occurs in the residential and tertiary sectors in particular, but also in industry and in electricity and heat production.
151mtoe 123 mtoe
Conventional energy sourcesRenewable energy sources
12% 35%
2010 2030
20102030
Electricity OthersMotor fuels0
10
20
30
40
50
17%
47%
14%
44%
6%9%
Renewable energy sources as percentages
525MTC02 EQ
1990 2030 313MTC02EQ
-40%

A vision of French society in which the country has achieved a fourfold reduction in its greenhouse gas emissions (compared to 1990) thanks to energy savings, greater efficiency and renewable energy.
1. Total energy consumption nearly halved in relation to 2010
Between 2010 and 2050, the transport and buildings sectors each contribute 40% to the drop in energy consumption. By 2050, mobility services account for 30% of urban passenger travel, thanks to car-sharing and car-pooling.
Energy scenario to 2050 at a glance
151 mtoe
123 mtoe
2010 2030
-47%
2050 82 mtoe
-69mtoe
2. Sustainable energy resources
With over 55% of renewable energy sources in the energy mix, the increase in renewable electricity (wind and photovoltaic energy), in addition to biogas (for transport and in the supply grid) will reduce the carbon content of energy produced and consumed. The available quantities of biogas and the development of electric vehicles allow us to envisage energy independence from oil for transport.
3. Fourfold reduction in greenhouse gas emissions
The shift to forms of mobility that no longer depend on carbonaceous resources, efforts to renovate and build housing that consumes less energy, and investment in renewable energy sources are the main ways to achieve the fourfold reduction in greenhouse gas emissions. These changes are accompanied by changes in diet (reduction of excessive carbohydrate and protein consumption and a more even balance between animal and plant proteins), and by the adoption of more sustainable practices in agriculture.
123 mtoe 82 mtoe
Conventional energy sourcesRenewable energy sources
35%12% >55%*
*3 proposed scenarios: see page 41or the full document on the ADEME website
2030151 mtoe2010 2050
*3 proposed scenarios: see page 41or the full document on the ADEME website
2010
2030
2050
Electricity OthersMotor fuels0
10
20
30
40
50
60
70
80
17%
47%ND*
14%
44%
55%
6%9%
66%
Renewable energy as percentages
-75%525MTC02EQ
1990 2050 131MTC02EQ
2030 313MTC02EQ

SCENARIO TO 2030
SCENARIO TO 2050
Contents
Buildings and urban organisationTransport and mobilityFood, agriculture and land useIndustry and industrial processesTotal energy consumptionRenewable energy productionFinal energy consumption by sourceEnvironmental factors
Buildings and urban organisationTransport and mobilityFood, agriculture and land useIndustry and industrial processesTotal energy consumptionRenewable energy productionFinal energy consumption by sourceEnvironmental factors
page 07page 09page 11page 13page 15page 16 page 19page 20
page 23page 25page 27page 29page 31page 32page 34page 35
page 22
page 06
APPENDICES
MACROECONOMIC EVALUATION
page 42
page 37

SCENARIO TO
2030
6
© L
aure
nt M
igna
ux/M
ETL-
MED
DE

7
The buildings sector (comprising residential and tertiary buildings) accounts for over 40% of thedelivered energy consumed in France today.
An ambitious construction and energy-efficiency renovation plan
To reduce consumption in this key sector, this scenario posits that an ambitious new building and energy-efficiencyrenovation plan for residential and tertiary buildings is implemented by 2030.It is assumed that 350,000 new dwellings are built each year. It should be possible to balance construction of new multi-family housing and single-family houses in 2030 (compared to the current share of 58% for single-family houses and 42% for multi-family housing). These new buildings are intended to form part of a new system of urban organisation requiring less commuting, and limiting land area that is paved over; however, the system of urban organisation up to 2030 has already been largely determined by the current housing stock. On average, 500,000 dwellings par year would be retrofitted to be more energy-efficient.By 2030, the entire social housing stock built before 2005 could thus be renovated, in addition to 5 million single-family houses (over half of which were built before 1975), which amounts to one-third of all single-family houses.
More efficient equipment and facilities for at least the same level of comfort
With regard to the two main categories of consumption in residential buildings, the level of comfort is assumed toremain the same, i.e. temperature in buildings and volumes of domestic hot water used. Overall energy needs diminish due to insulation retrofits and are met by more energy-efficient technologies than with current appliances.
- For space heating, heat pumps (HP), particularly reversible air-source heat pumps, equip 20% of total housing stock, especially electrically heated homes. These HPs will have a performance coefficient of 4 in 2030, compared to an average of 3 today. The widespread prevalence of this equipment is also linked to the ongoing trend to use air conditioning in certain regions. Gas-heated dwellings are increasingly equipped with condensing boilers.Towards the end of the period, hybrid and micro-cogeneration systems are progressively installed in the housing stock.
- For domestic hot water, electric water heaters (joule-effect heaters) are increasingly replaced by thermodynamic water heaters (TWH), which can halve household hot water consumption and, to a lesser extent, by individual solar water heaters (ISWH).However, without major breakthroughs in terms of costs and performance in France, developments which are notyet foreseeable, ISWHs will spread slowly throughout the housing stock, with an estimated penetration rate of 10%of dwellings in 2030.Average electricity consumption per square metre in housing thus drops by nearly a third between 2010 and 2030,from 190 kWh/m2 of final energy* per year to 130 kWh/m2 per year, for all uses.
Buildings and urban organisation
44.3 mtoe
32.6 mtoe
0
10
20
30
40
50
Air conditioningSpecific electricity usesLighting CookingHot waterHeating
2010 2030
ENERGY CONSUMPTION IN RESIDENTIAL CONSTRUCTION IN 2010 AND 2030, BY TYPE OF USE
* To avoid confusion, changes in electricity consumption are expressed in terms of final energy, rather than in primary energy,as the energy mixes for electricity and heating will evolve over time.

8
Specific uses at best remain stable
With regard to specific uses of electricity, the average housing stock in 2030 is assumed to be equipped with the best technologies available today. The equipment rate per household for each category of white goods (domestic appliances) and brown goods (televisions, etc.), has increased. The emergence of consumption for new uses is also accounted for, and becomes the fastest growing item among specific uses. Overall, technical progress, combined with the proliferation of uses, means that the best we can expect is for specific electricity consumption to remain stable.
Tertiary buildings
The assumptions made concerning the structural growth of GDP have an impact on business activity and thus on energy consumption in the tertiary sector. The increase in building surface area is considered to be related to the risein the number of employees: the surface area per employee is assumed to be constant between now and 2030. Airconditioned surface area increases while heating requirements diminish due to building renovations. In addition, equipment becomes more efficient, as in the residential scenario.
ENERGY CONSUMPTION IN THE RESIDENTIAL SECTOR IN 2010 AND 2030, BY ENERGY VECTOR
(13.7) Electricity(13.9) Gas(1.6) Heat(6.6) Wood fuel(0) Solar thermal(1) HP & TWH calories(7.3) Other OPs*(0.2) Coal
(10.8) Electricity(8.2) Gas(3.4) Heat(6.5) Wood fuel(0.2) Solar thermal(2.6) HP & TWH calories(0.8) Other OPs*(0) Coal
44.3 mtoe
32.6 mtoe
2010 2030
-11.7mtoe
Dire
ct u
ses
*OP: oil products
Net
wor
ks
Dire
ct u
ses
Net
wor
ks
ENERGY CONSUMPTION OF TERTIARY BUILDINGS IN 2030 (MTOE), BY VECTOR
18.6 mtoe
2030(9.9) Electricity(3.4) Gas(2.7) Heat(1.1) Wood fuel(0.1) Solar thermal(0.8) TWH calories(0.6) Other OPs*(0) Coal
Dire
ct u
ses
Net
wor
ks22.1 mtoe
18.6 mtoe
2010 2030
-16%-3.5mtoe
ENERGY CONSUMPTION IN THE TERTIARY SECTOR IN 2010 AND 2030 (FINAL MTOE)
Ambitious targets to reduce energy consumption: 350,000 new dwellings built per year and 500,000 old dwellings renovated each year
9
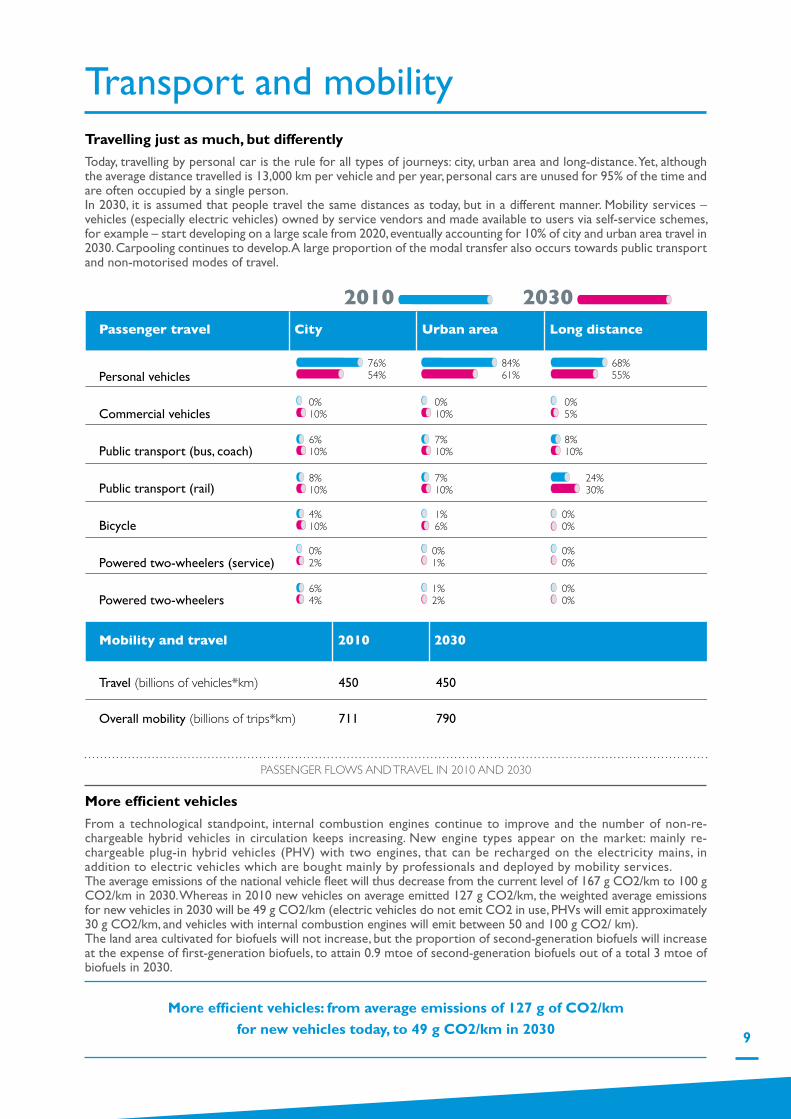
Transport and mobilityTravelling just as much, but differently
Today, travelling by personal car is the rule for all types of journeys: city, urban area and long-distance. Yet, although the average distance travelled is 13,000 km per vehicle and per year, personal cars are unused for 95% of the time and are often occupied by a single person.In 2030, it is assumed that people travel the same distances as today, but in a different manner. Mobility services – vehicles (especially electric vehicles) owned by service vendors and made available to users via self-service schemes, for example – start developing on a large scale from 2020, eventually accounting for 10% of city and urban area travel in 2030. Carpooling continues to develop. A large proportion of the modal transfer also occurs towards public transport and non-motorised modes of travel.
More efficient vehicles
From a technological standpoint, internal combustion engines continue to improve and the number of non-re-chargeable hybrid vehicles in circulation keeps increasing. New engine types appear on the market: mainly re-chargeable plug-in hybrid vehicles (PHV) with two engines, that can be recharged on the electricity mains, in addition to electric vehicles which are bought mainly by professionals and deployed by mobility services. The average emissions of the national vehicle fleet will thus decrease from the current level of 167 g CO2/km to 100 g CO2/km in 2030. Whereas in 2010 new vehicles on average emitted 127 g CO2/km, the weighted average emissions for new vehicles in 2030 will be 49 g CO2/km (electric vehicles do not emit CO2 in use, PHVs will emit approximately 30 g CO2/km, and vehicles with internal combustion engines will emit between 50 and 100 g CO2/ km).The land area cultivated for biofuels will not increase, but the proportion of second-generation biofuels will increaseat the expense of first-generation biofuels, to attain 0.9 mtoe of second-generation biofuels out of a total 3 mtoe of biofuels in 2030.
Personal vehicles
Commercial vehicles
Public transport (bus, coach)
Public transport (rail)
Bicycle
Powered two-wheelers (service)
Powered two-wheelers
Travel (billions of vehicles*km)
Overall mobility (billions of trips*km)
450
711
450
790
Passenger travel City Urban area Long distance
Mobility and travel 2010 2030
20302010
76%54%
0%10%
6%10%
8%10%
4%10%
0%2%
6%4%
84%61%
0%10%
7%10%
7%10%
1%6%
0%1%
1%2%
68%55%
0%5%
8%10%
24%30%
0%0%
0%0%
0%0%
PASSENGER FLOWS AND TRAVEL IN 2010 AND 2030
More efficient vehicles: from average emissions of 127 g of CO2/km for new vehicles today, to 49 g CO2/km in 2030

10
Road haulage still predominates for freight transport
Growth in GDP has a strong impact on freight transport. Our hypothesis is that freight transport will be partly decoupled from GDP, and will be rising by 0.8% per year in 2030 (compared to 2.1% per year today). We also posit significant modal transfers to rail transport (which returns to its 1990 level) and inland waterway transport. Road haulage will continue to increase, however, and freight transport requirements (in tonne.kilometres) will continue to grow up to 2030.
Sales
2010 2030
100%
10%
22%
68%
2,2 million127 g CO2/km
2 million49 g CO2/km
Stock
2010 2030
100%
35 million165 g CO2/km
35 million100 g CO2/km
ICE vehicles Plug-in hybrid vehicles Electric vehicles
4%7%
89%
VEHICLE SALES AND FLEETS
FREIGHT TRANSPORT IN GTKM BY MODE IN 2030
Gtkm 2010Gtkm 2030
Road Rail Inland Waterway TOTAL0
100
200
300
400
500
(1.1) Electricity(2.4) Biofuels(7.8) Petrol(31.2) Diesel(1.5) Jet fuel
(1.8) Electricity(3) Biofuels(7.1) Petrol(22.3) Diesel(1.5) Jet fuel
44 mtoe
35.8 mtoe
2010 2030
-8.2mtoe
Dire
ct u
ses
ENERGY BALANCE FOR THE TRANSPORT AND MOBILITY SECTOR (EXCLUDING INTERNATIONAL AIR TRANSPORT) BY VECTOR
44 mtoe
35.8 mtoe
2010 2030
-19%-9.2mtoe
ENERGY CONSUMPTION IN THE TRANSPORT SECTOR (FINAL MTOE) FROM 2010-2030

11
Although the agricultural sector consumes little energy (accounting for less than 3% of final energy), it is responsible for significant quantities of greenhouse gas emissions (almost 18% of national emissions) linked mainly to agricultural practices and the size of livestock herds.
Diet
The 2030 scenario does not assume any significant changes in the French diet. However, an ambitious policy makesit possible to cut avoidable food wastes in half, in accordance with European targets. Import and export volumes ofagricultural products and foodstuffs are considered to be stable. Current trends to lower meat consumption continue to prevail.
Agricultural practices and productionsAgricultural practices evolve gradually with the development of “integrated” production techniques on 10% of usable agricultural land (UAL), which limit the use of inputs, optimise the effects of organic amendments and employ minimal soil tillage techniques whenever possible, while making greater use of crop rotation.The Grenelle (French environmental consultation process and legislation) target for organic farming to be established on 20% of UAL is attained.The other main changes are:- a decrease of approximately 25% in the energy consumption of buildings, equipment and machinery- a reduction of approximately 20% in the consumption of synthetic nitrogen fertilisers- greater autonomy where the protein content of animal feed is concerned (fewer imports of soybean oil cake), associated with the reintroduction of dedicated crops.The aforementioned changes concerning wastes and excessive consumption lead to an 11% decrease in livestockrelated impacts.
Energy consumption in the agricultural sector (tractors, greenhouses and agricultural buildings) decreases from a total of 4 mtoe in 2010 to 3 mtoe in 2030.
Land use
Very little land is released. Afforestation (planting of trees in areas long devoid of trees) continues, with a slight increase of 0.2 M ha of forested land between 2010 and 2030.The current rate of soil sealing (62,000 ha per year) is halved by 2030.
Food, agriculture and land use

20% of the usable agricultural land is organicly farmed by 2030 and 10% is cultivated according
to“integrated”production principles
© L
aure
nt M
igna
ux/M
ETL-
MED
DE
13
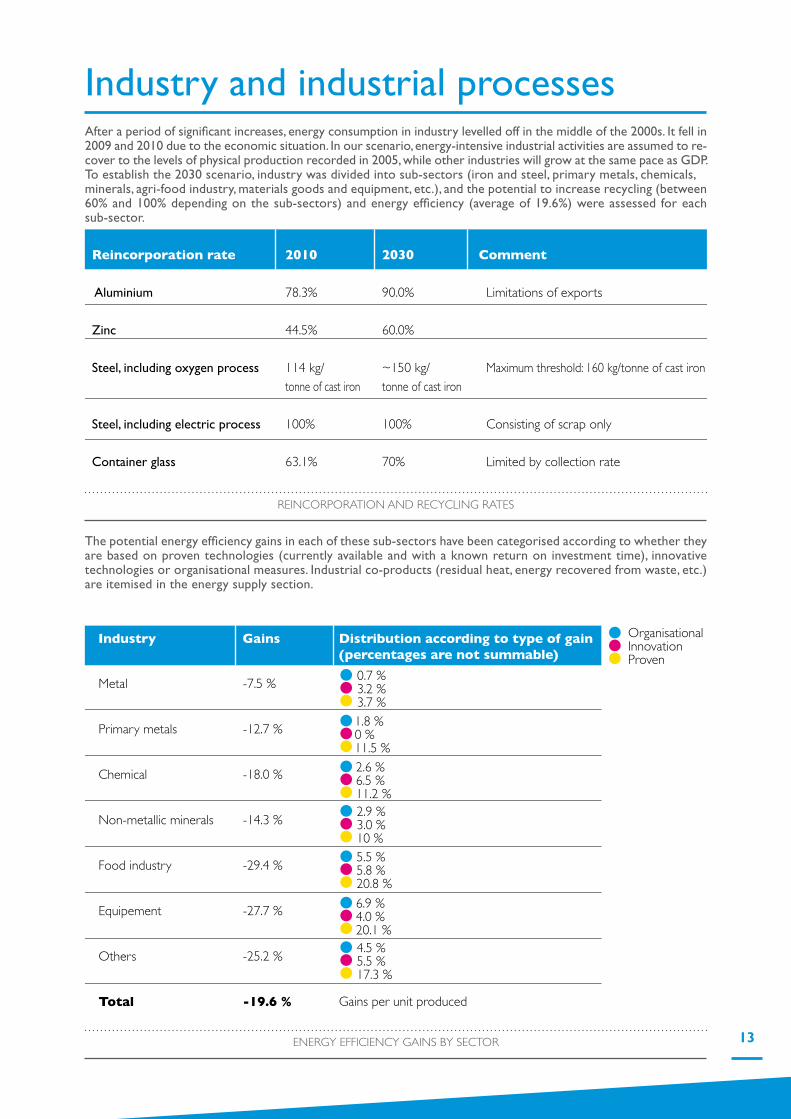
Industry and industrial processesAfter a period of significant increases, energy consumption in industry levelled off in the middle of the 2000s. It fell in2009 and 2010 due to the economic situation. In our scenario, energy-intensive industrial activities are assumed to re-cover to the levels of physical production recorded in 2005, while other industries will grow at the same pace as GDP. To establish the 2030 scenario, industry was divided into sub-sectors (iron and steel, primary metals, chemicals,minerals, agri-food industry, materials goods and equipment, etc.), and the potential to increase recycling (between 60% and 100% depending on the sub-sectors) and energy efficiency (average of 19.6%) were assessed for each sub-sector.
The potential energy efficiency gains in each of these sub-sectors have been categorised according to whether theyare based on proven technologies (currently available and with a known return on investment time), innovative technologies or organisational measures. Industrial co-products (residual heat, energy recovered from waste, etc.) are itemised in the energy supply section.
Reincorporation rate 2010 2030 Comment
Aluminium 78.3% 90.0% Limitations of exports
Zinc 44.5% 60.0%
Steel, including oxygen process 114 kg/ ~150 kg/ Maximum threshold: 160 kg/tonne of cast iron tonne of cast iron tonne of cast iron
Steel, including electric process 100% 100% Consisting of scrap only
Container glass 63.1% 70% Limited by collection rate
REINCORPORATION AND RECYCLING RATES
ENERGY EFFICIENCY GAINS BY SECTOR
Metal -7.5 % Primary metals -12.7 % Chemical -18.0 % Non-metallic minerals -14.3 % Food industry -29.4 % Equipement -27.7 % Others -25.2 % Total -19.6 %
OrganisationalInnovationProven
Gains per unit produced
0.7 %3.2 %3.7 %1.8 %0 %11.5 %2.6 %6.5 %11.2 %2.9 %3.0 %10 %5.5 %5.8 %20.8 %6.9 %4.0 %20.1 %4.5 % 5.5 %17.3 %
Industry Gains Distribution according to type of gain (percentages are not summable)

ENERGY CONSUMPTION IN INDUSTRY IN 2010 AND 2030 (FINAL MTOE)
(27%) Electricity(27%) Gas(0,9%) Heat(1%) Direct biogas(8%) Wood fuel(1,5%) Solar thermal(17%) Other OPs(2,6%) Waste(15%) Coal
33.2 mtoe
2030
ElectricityGasHeatDirect biogasWood fuelSolar thermalOther OPsWasteCoal
33.2 mtoe
2030
36.5 mtoe
2010
9
8.9
0.30.32.6
0.5
5.7
0.9
5
10.3
11.3
0.41.7
7.1
0.5
5.1
*Coke consumption is includedin the coal figure
Usa
ges d
irect
sRé
seau
x
14

15ENERGY CONSUMPTION BY VECTOR (FINAL MTOE)
In 2030, there is a total drop in final energy consumption of 28 mtoe, a decrease of nearly 18% compared to 2010. The buildings sector (residential and tertiary) accounts for 54 % of
this reduction (15.2 mtoe) and the transport sector accounts for 30% (8.2 mtoe).
-28mtoe
-18%151 mtoe
123 mtoe
2010 2030
20102030
Residential Commercial Transport Agriculture Industry0
10
20
30
40
50
-27%
-16%
-19%
-25%
-9%
(37.7) Electricity(31.5) Gas(3.2) Heat(0.0) Direct biogas(8.8) Wood fuel(0.0) Solar thermal(1.0) HP & TWH calories(2.4) Liquid biofuels(40.9) Petrol/diesel/jet fuel(19.5) Other OPs(0.5) Waste(5.5) Coal
(32.5) Electricity(21.5) Gas(6.3) Heat(0.3) Direct biogas(10.1) Wood fuel(0.8) Solar thermal(3.4) HP & TWH calories(3) Liquid biofuels(31.3) Petrol/diesel/jet fuel(7.9) Other OPs(0.9) Waste(5.1) Coal
151 mtoe
123 mtoe
2010 2030
-28mtoe
ENERGY CONSUMPTION FROM 2010-2030 BY SECTOR
ENERGY CONSUMPTION IN 2010 AND 2030 (FINAL MTOE)
Total energy consumption

16
SOLID BIOMASS FUELS
Renewable energy productionThe resources available for each renewable energy source (RES) have been analysed and detailed information about each resource is provided in the full report. The resources listed are the potential amounts that can be exploited under given technical and economic conditions. The partial exploitation of certain resources in the scenario is explained by diversification of the energy mix or the existence of local constraints.
1.Biomass
An ambitious plan to exploit forestry resources is assumed to be implemented, boosting the harvest rate of natural forest growth from 48% at present to 75% in 2030.
The assumptions underlying these results include the increased use of timber forestry resources in the building industry (construction and renovation) and the exploitation of non-forest resources.Total accessible resources for combustion biomass thus rise to 18 mtoe by 2030.
Biomass for methanation constitutes a significant and still largely unexploited resource. Assuming the installation of 600 biogas plants per year (which is half the German rate), there will be an accessible resource of 6 mtoe of primary energy in 2030, with approximately 50% for final use in the gas grid, 30% for cogeneration and 20% for direct use as heat. 2. Wind power
At an installation rate of 1.5 GW per year there are 34 GW of exploitable onshore wind resources by 2030 (the existing capacity in Germany today). There are 12 GW of offshore resources in 2030.
3. Photovoltaic (PV)
There are 33 GW of exploitable PV resources in 2030, at an average installation rate of 1.55 GW per year. Groundmounted plants are operated only at sites without land-use conflicts.
4. Hydroelectricity
The growth potential for hydroelectricity is relatively limited. By 2030, the potential electrical power storage capacity of Energy Transfer Pumping Stations (ETPS) increases from 5.5 GW to 7 GW.
Solid biomass fuels 2010 2030
Forest
Natural growth (including branchwood) 115 Mm3/year 122 Mm3/year
Forest harvesting rate 48 % 75 %
Harvesting rate (Mm3) 55 92 - Timber for building in Mm3 22 30 - Wood for industry (Mm3) 12 12 - Fuelwood and stumps (Mm3) 21 (4.7 mtoe) 50 (11.3 mtoe)
Other biomass
Waste wood (mtoe) 1.2 3.4
Agricultural residues, hedges, agroforestry, trees in urban environments 0 3.3
TOTAL biomass solid fuels(mtoe) 5.9 18

© T
hier
ry D
egen
/MET
L-M
EDD
E
By 2030, we can harness 34 GW of onshore wind power resources (the same as in Germany today)

18
PRIMARY ENERGY SOURCES IN 2030 (MTOE)
PROPORTION OF RES IN EACH NETWORK IN 2030
Vector 2030
Renewable Energy Sources (RES) Solid biomass fuels 16
Wind 8.6
Biogas 5.8
Geothermal 3.5
Hydroelectric 4.1
Photovoltaic 3.4
Biofuels excluding wood 7.9
Ambient air calories 1.8
Solar thermal 1.0
Waste 1.4
Marine 0.4
Total RES 54 Non-renewable Nuclear 56.1
Natural gas 23.7
Oil 42.2
Coal 5.1
Waste 1.4
Grand total 182
(9%) DWIP
(9%) Photovoltaic solar(48%) Nuclear
(22%) Wind
(11%) Hydroelectric
(2%) Biogas(1%) DWIP(1%) Wood fuel (0%) Geothermal
(1%) Marine(0%) Residual heat
(5%) Gas network
Electricity mix (Balanced at hourly intervals)
RES share
47 %
(25%) Gaz network
(11%) Geothermal
(2%) Solarthermal
(5%) Biogas
(5%) Residual heat
(45%) Wood fuel
District heating mix
RES share
75 %
Natural gasBiogas
Gas network mix
RES share
14 %

19
Sources mtoe
Electricity grid Wind 7.2 32.5 Hydroelectric 3.4
Photovoltaic 2.9
Nuclear 15.6
Methanation 0.6
DWIP 0.3
Wood fuel 0.3
Geothermal 0.1
Marine 0.4
Residual heat 0.1
Gas network 1.7
Gas network Methanation 3.0 21.5 BtG 0.0
Hydrogen 0.0
Natural gas 18.5
District heating Methanation 0.3 6.3 DWIP 0.5
Residual heat 0.3
Wood fuel 2.8
Geothermal 0.7
Solar thermal 0.1
Gas network 1.6
Direct gas Methanation 0.3
Wood fuel 10.1
Solar thermal 0.8
HP and rotary heat exchanger calories 3.4
Liquid biofuels 3.0
Petrol/Diesel/Jet fuel 31.3
Other OPs 7.9
Waste 0.9
Carbon 5.1
Final energy consumption by source
20
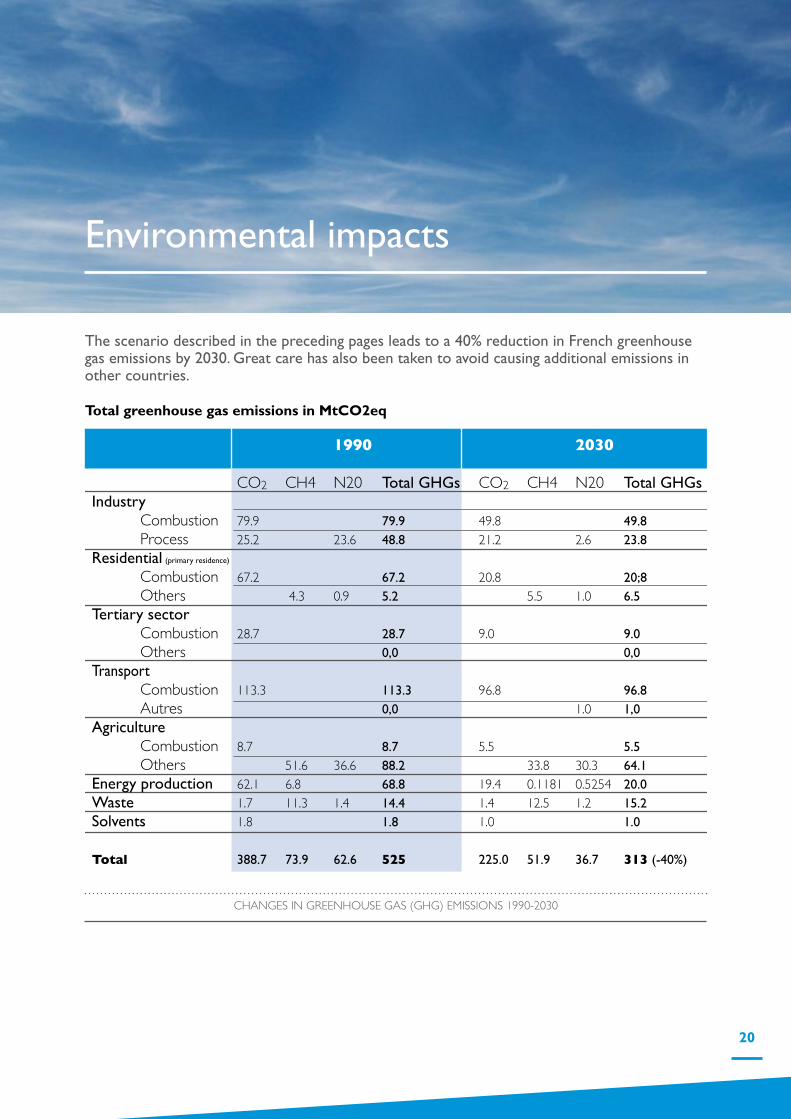
Environmental impacts
The scenario described in the preceding pages leads to a 40% reduction in French greenhousegas emissions by 2030. Great care has also been taken to avoid causing additional emissions inother countries.
Total greenhouse gas emissions in MtCO2eq
1990 2030
CO2 CH4 N20 Total GHGs CO2 CH4 N20 Total GHGsIndustry Combustion 79.9 79.9 49.8 49.8 Process 25.2 23.6 48.8 21.2 2.6 23.8Residential (primary residence) Combustion 67.2 67.2 20.8 20;8 Others 4.3 0.9 5.2 5.5 1.0 6.5Tertiary sector Combustion 28.7 28.7 9.0 9.0 Others 0,0 0,0Transport Combustion 113.3 113.3 96.8 96.8 Autres 0,0 1.0 1,0Agriculture Combustion 8.7 8.7 5.5 5.5 Others 51.6 36.6 88.2 33.8 30.3 64.1Energy production 62.1 6.8 68.8 19.4 0.1181 0.5254 20.0Waste 1.7 11.3 1.4 14.4 1.4 12.5 1.2 15.2Solvents 1.8 1.8 1.0 1.0 Total 388.7 73.9 62.6 525 225.0 51.9 36.7 313 (-40%)
CHANGES IN GREENHOUSE GAS (GHG) EMISSIONS 1990-2030

21
© L
aure
nt M
igna
ux/M
ETL-
MED
DE
Air quality
The impact of this scenario on atmospheric emissions (pollutants, pollutant precursors) and on air quality in highlyurbanised areas was evaluated in collaboration with the Centre for Teaching and Research on the AtmosphericEnvironment (CEREA), the Inter-University Laboratory for Atmospheric Systems (LISA) and the Inter-ProfessionalTechnical Centre for Atmospheric Pollution Studies (CITEPA).
On the basis of changes in pollutant emission factors (mass of pollutants and precursors emitted per km travelled orkg of biomass burned) and using the most efficient technologies currently known, the projected emissions for nitrogen oxide (NOx), de PM2.5, SO2, and non-methane volatile organic compounds (NMVOC) point towards a significant drop in pollutant emissions by 2030 in the framework of the ADEME energy scenario. NOx emissions from district heating networks will require special attention, and call for specially designed solutions.
With regard to air quality, sensitivity analysis for 2030 shows that the reduction in pollutant emissions from road transport has a positive impact. However, this positive effect is not proportional to the drop in emissions, given thenon-linear relationships between pollutant emissions and precursors on the one hand, and air quality on the other. Additional work is required to assess the impact on air quality of the emission projections for all energy and non-energy sectors. Finally, in light of ongoing climate change, these analyses will be extended to include photochemicalozone, a pollutant induced by solar radiation.
POLLUTANT EMISSIONS
Pollutants Emissions Emissions Change Change in emissions in 2010 (t) in 2030 (t) in emissions (%) by sector (%)
NOx 779 393 263 987 -66% District heating: residential and tertiary use -29% Agriculture -97% Electricity production: Refineries – Industries -47% Road traffic (+ abrasions) and non-road mobile machinery -82% PM2,5 144 655 50 248 -65% District heating: residential and tertiary use -64% Agriculture -98% Electricity production: Refineries – Industries -43% Road traffic (+ abrasions) and non-road mobile machinery -76% SO2 255 252 73 681 -71% District heating: residential and tertiary use -74% Agriculture -75% Electricity production: Refineries – Industries -67% Road traffic (+ abrasions) and non-road mobile machinery -99% COVNM 282 347 90 334 -68% District heating: residential and tertiary use -68% Agriculture -98% Electricity production: Refineries – Industries -17% Road traffic (+ abrasions) and non-road mobile machinery -78%

22
2050
© A
rnau
d Bo
uiss
ou/M
ETL-
MED
DE
SCENARIO TO
23
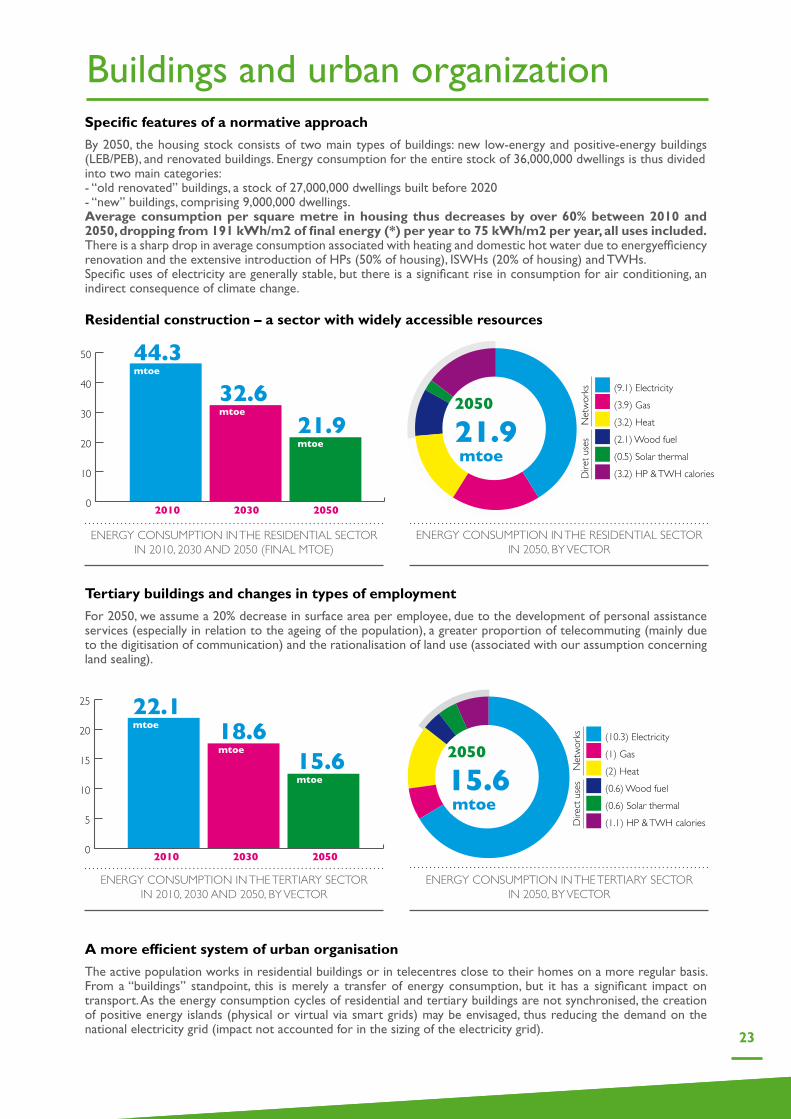
Specific features of a normative approach
By 2050, the housing stock consists of two main types of buildings: new low-energy and positive-energy buildings (LEB/PEB), and renovated buildings. Energy consumption for the entire stock of 36,000,000 dwellings is thus dividedinto two main categories:- “old renovated” buildings, a stock of 27,000,000 dwellings built before 2020- “new” buildings, comprising 9,000,000 dwellings.Average consumption per square metre in housing thus decreases by over 60% between 2010 and 2050, dropping from 191 kWh/m2 of final energy (*) per year to 75 kWh/m2 per year, all uses included.There is a sharp drop in average consumption associated with heating and domestic hot water due to energyefficiencyrenovation and the extensive introduction of HPs (50% of housing), ISWHs (20% of housing) and TWHs.Specific uses of electricity are generally stable, but there is a significant rise in consumption for air conditioning, an indirect consequence of climate change.
Residential construction – a sector with widely accessible resources
A more efficient system of urban organisation
The active population works in residential buildings or in telecentres close to their homes on a more regular basis. From a “buildings” standpoint, this is merely a transfer of energy consumption, but it has a significant impact on transport. As the energy consumption cycles of residential and tertiary buildings are not synchronised, the creation of positive energy islands (physical or virtual via smart grids) may be envisaged, thus reducing the demand on the national electricity grid (impact not accounted for in the sizing of the electricity grid).
Tertiary buildings and changes in types of employment
For 2050, we assume a 20% decrease in surface area per employee, due to the development of personal assistance services (especially in relation to the ageing of the population), a greater proportion of telecommuting (mainly due to the digitisation of communication) and the rationalisation of land use (associated with our assumption concerning land sealing).
Buildings and urban organization
ENERGY CONSUMPTION IN THE RESIDENTIAL SECTOR IN 2010, 2030 AND 2050 (FINAL MTOE)
0
10
20
30
40
50
2010 2030 2050
44.3mtoe
32.6mtoe
21.9mtoe
ENERGY CONSUMPTION IN THE RESIDENTIAL SECTOR IN 2050, BY VECTOR
(9.1) Electricity(3.9) Gas(3.2) Heat(2.1) Wood fuel(0.5) Solar thermal(3.2) HP & TWH calories
21.9 mtoe
2050
Dire
t use
sN
etw
orks
ENERGY CONSUMPTION IN THE TERTIARY SECTOR IN 2010, 2030 AND 2050, BY VECTOR
0
5
10
15
20
25
2010 2030 2050
22.1mtoe 18.6
mtoe15.6mtoe
ENERGY CONSUMPTION IN THE TERTIARY SECTOR IN 2050, BY VECTOR
(10.3) Electricity(1) Gas(2) Heat(0.6) Wood fuel(0.6) Solar thermal(1.1) HP & TWH calories
15.6 mtoe
2050
Dire
ct u
ses
Net
wor
ks

© L
aure
nt M
igna
ux/M
ETL-
MED
DE
In our 2050 scenario, average energy consumption per square metre of housing will decrease by over
60% between 2010 and 2050
25
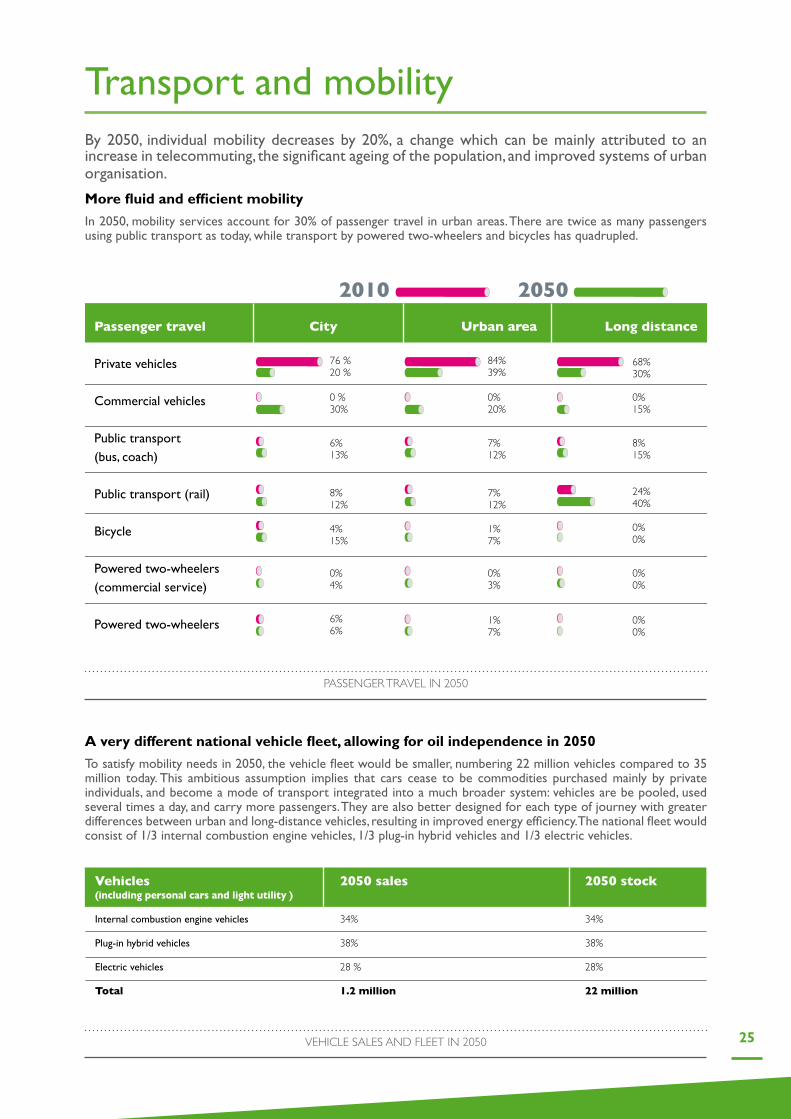
Transport and mobilityBy 2050, individual mobility decreases by 20%, a change which can be mainly attributed to an increase in telecommuting, the significant ageing of the population, and improved systems of urban organisation.
More fluid and efficient mobility
In 2050, mobility services account for 30% of passenger travel in urban areas. There are twice as many passengers using public transport as today, while transport by powered two-wheelers and bicycles has quadrupled.
PASSENGER TRAVEL IN 2050
VEHICLE SALES AND FLEET IN 2050
20502010Passenger travel City Urban area Long distance
Private vehicles
Commercial vehicles
Public transport(bus, coach) Public transport (rail)
Bicycle Powered two-wheelers (commercial service)
Powered two-wheelers
84%39%
76 %20 %
68%30%
0 %30%
0%20%
0%15%
6%13%
8%15%
7%12%
8%12%
24%40%
7%12%
4%15%
1%7%
0%0%
0%4%
0%3%
0%0%
6%6%
0%0%
1%7%
A very different national vehicle fleet, allowing for oil independence in 2050
To satisfy mobility needs in 2050, the vehicle fleet would be smaller, numbering 22 million vehicles compared to 35 million today. This ambitious assumption implies that cars cease to be commodities purchased mainly by private individuals, and become a mode of transport integrated into a much broader system: vehicles are be pooled, used several times a day, and carry more passengers. They are also better designed for each type of journey with greater differences between urban and long-distance vehicles, resulting in improved energy efficiency. The national fleet would consist of 1/3 internal combustion engine vehicles, 1/3 plug-in hybrid vehicles and 1/3 electric vehicles.
Vehicles 2050 sales 2050 stock(including personal cars and light utility ) Internal combustion engine vehicles 34% 34% Plug-in hybrid vehicles 38% 38% Electric vehicles 28 % 28% Total 1.2 million 22 million
26
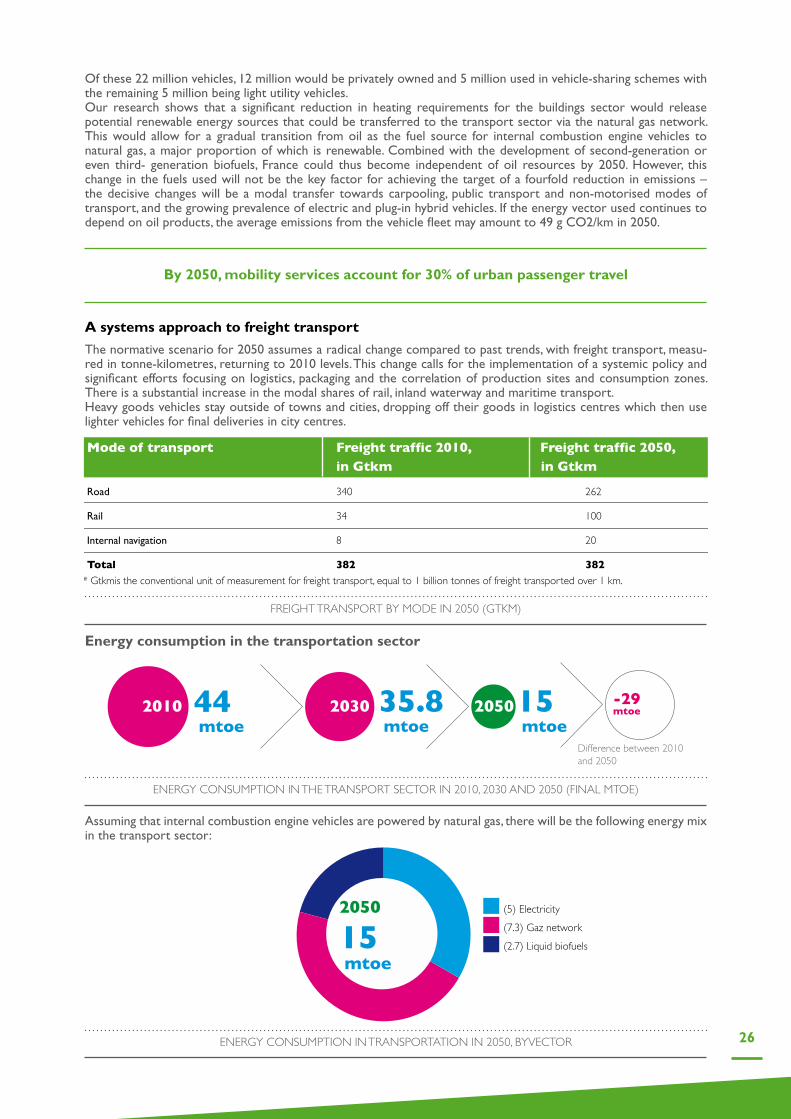
Of these 22 million vehicles, 12 million would be privately owned and 5 million used in vehicle-sharing schemes with the remaining 5 million being light utility vehicles.Our research shows that a significant reduction in heating requirements for the buildings sector would release potential renewable energy sources that could be transferred to the transport sector via the natural gas network. This would allow for a gradual transition from oil as the fuel source for internal combustion engine vehicles to natural gas, a major proportion of which is renewable. Combined with the development of second-generation or even third- generation biofuels, France could thus become independent of oil resources by 2050. However, this change in the fuels used will not be the key factor for achieving the target of a fourfold reduction in emissions – the decisive changes will be a modal transfer towards carpooling, public transport and non-motorised modes of transport, and the growing prevalence of electric and plug-in hybrid vehicles. If the energy vector used continues to depend on oil products, the average emissions from the vehicle fleet may amount to 49 g CO2/km in 2050.
A systems approach to freight transport
The normative scenario for 2050 assumes a radical change compared to past trends, with freight transport, measu-red in tonne-kilometres, returning to 2010 levels. This change calls for the implementation of a systemic policy and significant efforts focusing on logistics, packaging and the correlation of production sites and consumption zones. There is a substantial increase in the modal shares of rail, inland waterway and maritime transport.Heavy goods vehicles stay outside of towns and cities, dropping off their goods in logistics centres which then use lighter vehicles for final deliveries in city centres.
Energy consumption in the transportation sector
Assuming that internal combustion engine vehicles are powered by natural gas, there will be the following energy mix in the transport sector:
FREIGHT TRANSPORT BY MODE IN 2050 (GTKM)
Mode of transport Freight traffic 2010, Freight traffic 2050, in Gtkm in Gtkm Road 340 262 Rail 34 100 Internal navigation 8 20 Total 382 382
* Gtkmis the conventional unit of measurement for freight transport, equal to 1 billion tonnes of freight transported over 1 km.
(5) Electricity(7.3) Gaz network(2.7) Liquid biofuels 15
mtoe
2050
ENERGY CONSUMPTION IN THE TRANSPORT SECTOR IN 2010, 2030 AND 2050 (FINAL MTOE)
44 mtoe
35.8 mtoe
2010 2030 15 mtoe
2050 -29mtoe
Difference between 2010 and 2050
By 2050, mobility services account for 30% of urban passenger travel
ENERGY CONSUMPTION IN TRANSPORTATION IN 2050, BYVECTOR

27
Food, agriculture and land useThe scenario assumes that there is no change to the 2010 energy balance between imports and exports. Additional research will be required for a more detailed analysis of the place of French agricultural production within Europe and in the global agricultural landscape.
Food consumption
For 2050, changes in diet are posited, moving towards the FAO (Food and Agriculture Organization) recommendations, without fully attaining them. The scenario assumes a reduction in the excessive consumption of simple carbo-hydrates and proteins, and a more equal balance between animal and plant proteins. A drastic reduction (-60%) in food wastage is assumed to take place. The nutritive potential of French farming is improved due to the drop in individual protein and energy consumption. Consumption of dairy products is reduced by 25%, offset by diversified sources of calcium.
DIET IN 2010 AND 2050
2010 2050 Total proteins 113 g/day/person (including 40 g plant-based) 86 g/day/person (including 43 g plant-based) Energy 3324 kcal/pers/day 3270 kcal/pers/day Nutritive potential Energy 140 million / million Energy 136 million / million proteins 95 / Animal proteins 65 million proteins 113 / Animal proteins 79 million
dietin g/day/person
2010
(9) Other(316) Cereals
(93) Sugars
(524) Fruit et vegetables
(64) Oils
(12) Legumes and nuts(208) Alcoholicbeverages
(266) Meatand offal
(616) Milk
(174) Potatoes(34) Eggs
2050
(397) Cereals
(83) Sugars
(661) Fruitet vegetables
(78) Oils(27) Legumes and nuts
(55) Other
(162) Alcoholicbeverages
(165) Meatand offal
(435) Milk
(151) Potatoes(29) Eggs
(in number of people fed)
dietin g/day/person

28
Agricultural practices and production
Agricultural production systems are moving towards more sustainable practices, while maintaining high levels of productivity. “Integrated” production occupies 60% of the usable agricultural area, with organic farming accounting for 30% and conventional farming the remaining 10%.
The main determining factors of the scenario concern: • A significant reduction in the consumption of mineral nitrogen fertilisers (-37 %) by rationalising practices, extending rotations and increasing leguminous crop cultivation; • Ploughless or minimal tillage of the soil (fuel savings, preservation of soil quality, etc.); • Substantial reduction in energy consumption for the heating of buildings and greenhouses; • Shifting of the focus in cattle farming towards grassland farming systems that promote the maintenance of permanent pastures and carbon storage; • Protein self-sufficiency target of 75% for animal feed; • Massive increase in methanation (50% of manure processed); • Increase in intercropping (improved biodiversity, fewer inputs, etc.); • Systematic planting of intermediate crops to preserve soil quality; • Large increase in land areas covered by hedgerows (+1.7 Mha compared to 2010) and agroforestry.
The proposed agricultural models are characterised by their greater diversity, the increased exploitation of natural resources and the quest to achieve a balanced ecosystem. The 2050 scenario takes climate change effects into account (assumptions derived from the INRA Climator project). These effects are growing irrigation needs -- +30%, attaining 4 billion m3 of water annually. This increase is attenuated, however, compared to a business-as-usual scenario.Livestock populations for white meat production remain fairly constant between now and 2050. The downward trend in bovine meat consumption observed over the last three decades continues. Cereal, fruit and vegetable production increase.
Land use
It is assumed that the currently rising rate of soil sealing will fall under the impetus of public policies from 2015, ceasing entirely in 2030. Moreover, afforestation continues. Energy consumption in the agricultural sector falls by 25% from 4 mtoe in 2010 to 3 mtoe in 2050.
ENERGY CONSUMPTION IN THE AGRICULTURAL SECTOR IN 2010, 2030 AND 2050 (FINAL MTOE )
4 mtoe
3 mtoe
2010 2030 3 mtoe
2050-1mtoe-25%
Difference between 2010and 2050
GHG emissions from the agricultural sector are halved between 2010 and 2050, while energy consumption decreases from 4 mtoe to 3 mtoe

29
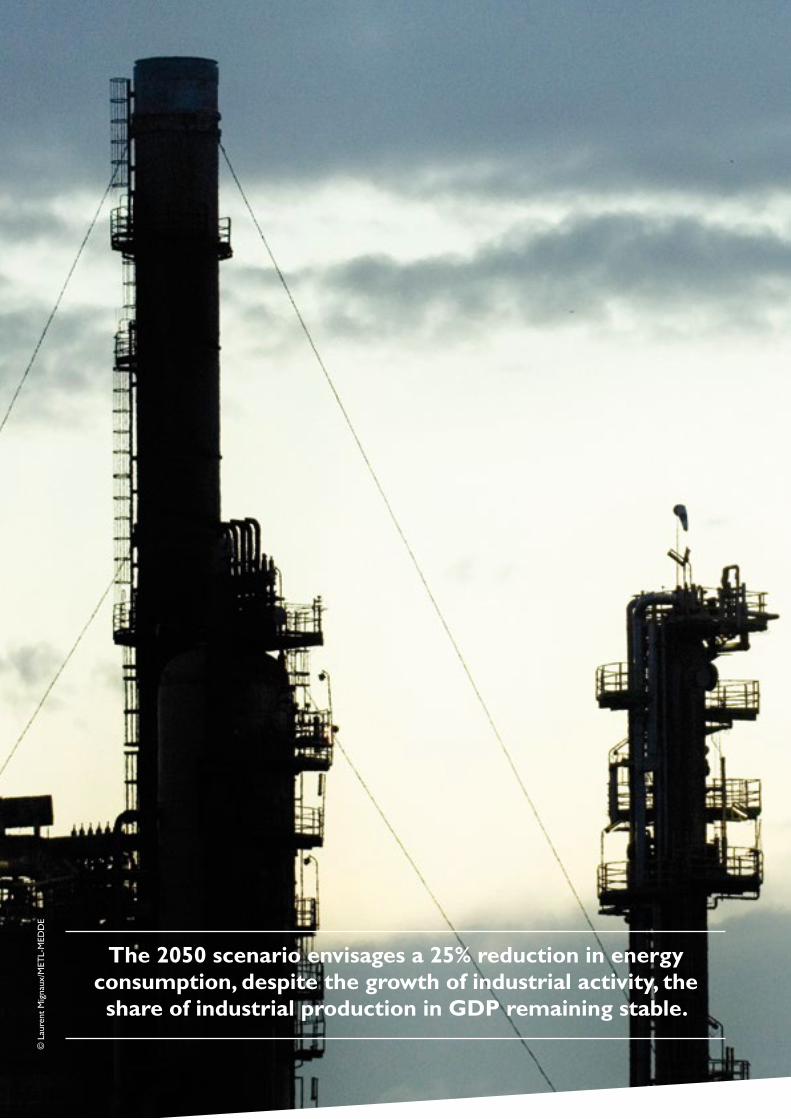
Industry and industrial processesIn the scenario projected for 2050, the structural changes undertaken up to 2030 continue and the efficiency gains between 2030 and 2050 are assumed to be the same as between 2010 and 2030. Energy consumption is consequently reduced by over 25%, despite the growth in business activity (the sector’s share in GDP is maintained and physical production is stabilised at the levels achieved in the 2030 scenario). This is a preliminary approach which must be supplemented by additional work.
ENERGY CONSUMPTION IN THE INDUSTRIAL SECTOR IN 2050, BY VECTOR
(7.5) Electricity(5.9) Gas(0.2) Heat(0.3) Direct biogas(2) Wood fuel(0.5) Solar thermal(5.5) Other OPs(0.8) Waste(4) Coal
26.7 mtoe
2050
Dire
ct u
ses
ENERGY CONSUMPTION IN THE INDUSTRIAL SECTOR IN 2010, 2030 AND 2050 (FINAL MTOE )
36.5 mtoe
33.2 mtoe
2010 2030 26.7 mtoe
2050-9.8mtoe-27%
Difference between 2010and 2050
© L
aure
nt M
igna
ux/M
ETL-
MED
DE
The 2050 scenario envisages a 25% reduction in energy consumption, despite the growth of industrial activity, the share of industrial production in GDP remaining stable.
31
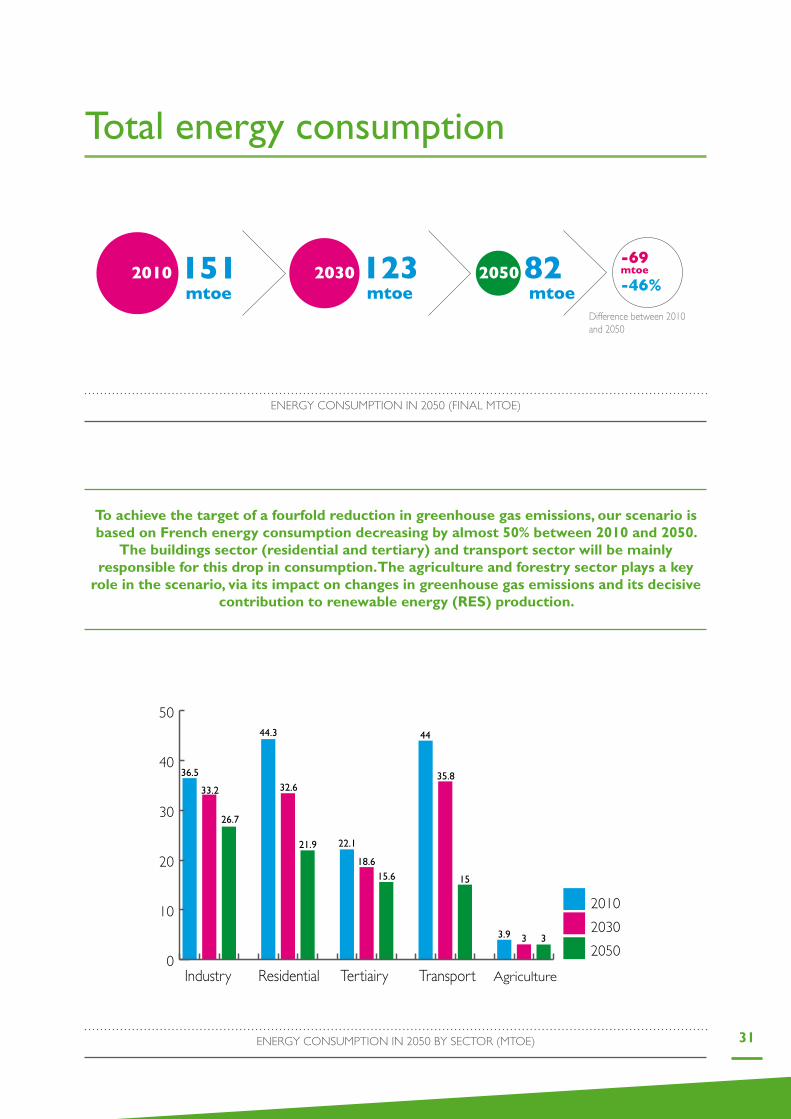
Total energy consumption
ENERGY CONSUMPTION IN 2050 (FINAL MTOE)
ENERGY CONSUMPTION IN 2050 BY SECTOR (MTOE)
151 mtoe
123 mtoe
2010 2030 82 mtoe
2050-69mtoe-46%
Difference between 2010 and 2050
201020302050
Industry Residential Tertiairy Transport Agriculture0
10
20
30
40
50
33.2
26.7
44.3
32.6
21.9 22.1
18.615.6
44
35.8
15
3.9 3 3
36.5
To achieve the target of a fourfold reduction in greenhouse gas emissions, our scenario is based on French energy consumption decreasing by almost 50% between 2010 and 2050.
The buildings sector (residential and tertiary) and transport sector will be mainly responsible for this drop in consumption. The agriculture and forestry sector plays a key
role in the scenario, via its impact on changes in greenhouse gas emissions and its decisive contribution to renewable energy (RES) production.

32
Renewable energy productionEach individual renewable energy source (RES) has been assessed, and detailed information about each ressource is provided in the full report. The available resources mentioned are the potential amounts that can be exploited under given technical and economic conditions. The partial exploitation of certain resources in the scenario can be explained by the diversification of the energy mix or the existence of local constraints.
1.Biomass
By Maintaining a 75% harvest rate of natural annual forest growth, a yearly 21 mtoe of wood fuel are made availableby 2050. In accordance with the agricultural scenario, the total accessible resource for methanation can be increased to 9 mtoe of primary energy in 2050.
2. Wind powerThe exploitable potential for onshore wind power in 2050 is 40 GW. The exploitable offshore potential in 2050 is 30 GW.
3. Photovoltaic (PV)
The exploitable potential for photovoltaic power rises to 65 GW in 2050.
4. Hydroelectricity
A marine ETPS may be built by 2050.
Three electricity mix scenarios have been developed (see the full document for detailed descriptions). The “High” scenario sees the share of nuclear power in electricity production remaining stable at approximately 50% in 2050, as in 2030. The “Median” scenario assumes that the share of nuclear power in energy production continues to fall, to 25% in 2050. The “Low” scenario envisages an 18% share for nuclear power in electricity production in 2050, implying the maximum exploitation of potential RESs. The ranges shown in the table below cover the values for the three alternative scenarios.
Vectors 2050
RES Solid biomass fuels 17.1
Wind 9.1 - 13.9
Biogas 8.8
Geothermal 5.1 - 6
Hydroelectric 4.3 - 5.8
Photovoltaic 3.6 - 6
Biofuel materials excluding wood 5.6
Ambient air calories 2.4
Solar thermal 1.8
Waste 1.3
Marine 0.5 - 3.9
Non-renewable Nuclear 21.6 - 57.6
Natural gas 11.9
Oil 5.9
Coal 4.0
Waste 1.4
Grand total 117 - 140
PRIMARY ENERGY SOURCES IN 2050 (MTOE)

33
PROPORTION OF RESS IN EACH NETWORK IN 2050
(48%) Wood fuel
District heating mix
(0%) Gas network
(29%) Geothermal
(3%) Solar thermal(5%) Biogas
(9%) DWIP
(6%) Residual heat
RES share
100 %Methanation 25.1%BtG : 23.4%Hydrogen : 7.4%Natural gas : 44.1%
Gas network mix
RES share
56 %
© M
EDD
TL
- Arn
aud
Boui
ssou
34
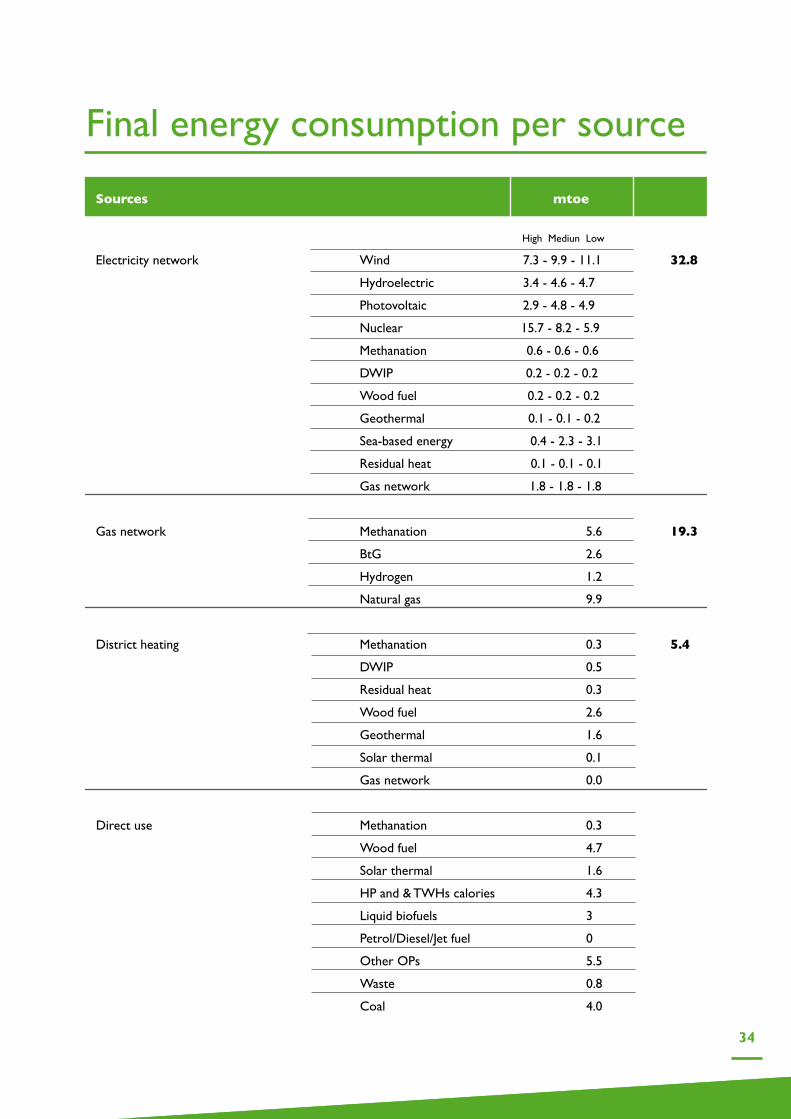
Sources mtoe
High Mediun Low
Electricity network Wind 7.3 - 9.9 - 11.1 32.8 Hydroelectric 3.4 - 4.6 - 4.7
Photovoltaic 2.9 - 4.8 - 4.9
Nuclear 15.7 - 8.2 - 5.9
Methanation 0.6 - 0.6 - 0.6
DWIP 0.2 - 0.2 - 0.2
Wood fuel 0.2 - 0.2 - 0.2
Geothermal 0.1 - 0.1 - 0.2
Sea-based energy 0.4 - 2.3 - 3.1
Residual heat 0.1 - 0.1 - 0.1
Gas network 1.8 - 1.8 - 1.8
Gas network Methanation 5.6 19.3 BtG 2.6
Hydrogen 1.2
Natural gas 9.9
District heating Methanation 0.3 5.4 DWIP 0.5
Residual heat 0.3
Wood fuel 2.6
Geothermal 1.6
Solar thermal 0.1
Gas network 0.0
Direct use Methanation 0.3
Wood fuel 4.7
Solar thermal 1.6
HP and & TWHs calories 4.3
Liquid biofuels 3
Petrol/Diesel/Jet fuel 0
Other OPs 5.5
Waste 0.8
Coal 4.0
Final energy consumption per source

35
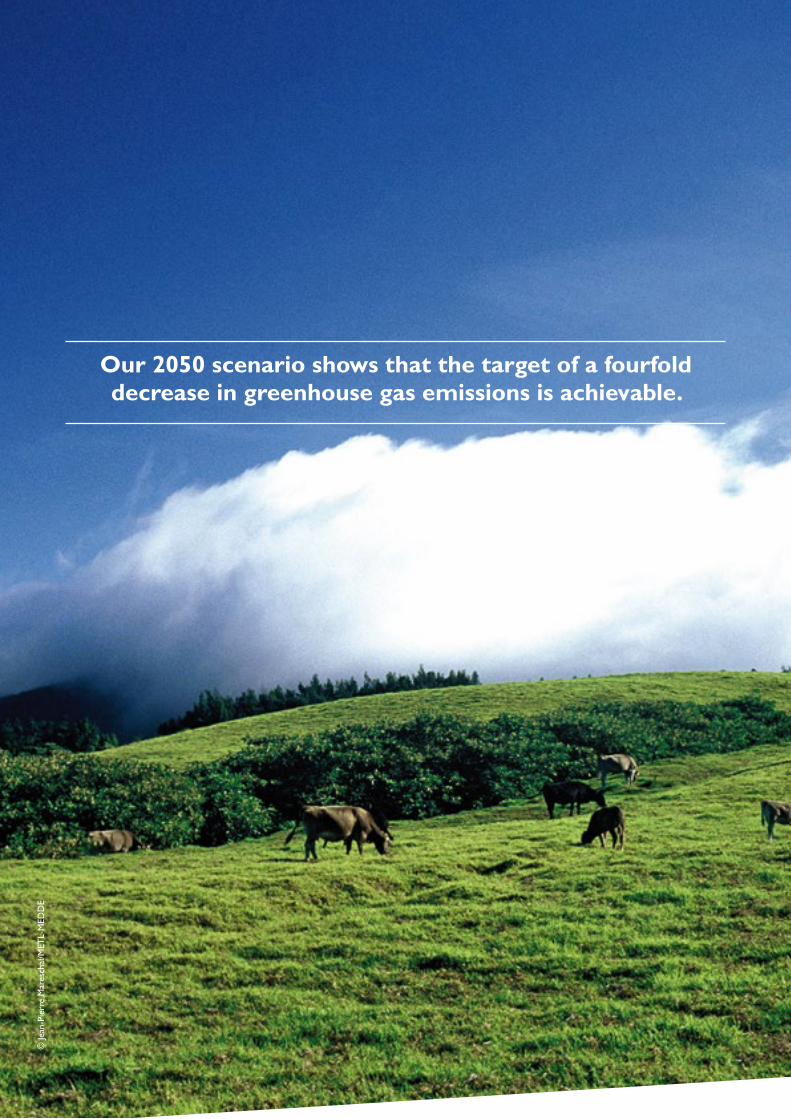
Environmental impactsOur 2050 scenario analysis shows that the target of a fourfold decrease in greenhouse gas emissions is achievable.Indeed, further reduction is possible, because the scenario does not take into account breakthrough technologies or technologies which are currently being developed (carbon capture, storage and recovery). Carbon storage by soils, which is not included in the official data, is positive in the ADEME scenario (in contrast to a business-as-usual scenario).
Total greenhouse gas emissions in MtC02 eq
1990 2050
CO2 CH4 N20 Total GHGs CO2 CH4 N20 Total GHGsIndustry Combustion 79.9 79.9 35.5 35.5 Process 25.2 23.6 48.8 17.1 1.8 18.8Residential (primary residence) Combustion 67.2 67.2 4.8 4.8 Others 4.3 0.9 5.2 0.1 0.0 0.1Tertiary Combustion 28.7 28.7 1.3 1.3 Others 0.0 0.0Transport Combustion 113.3 113.3 8.5 8.5 Others 0.0 0.0 0.0Agriculture Combustion 8.7 8.7 3.9 3.9 Others 51.6 36.6 88.2 22.0 24.9 46.9Energy production 62.1 6.8 68.8 3.1 0.0 3.1Waste 1.7 11.3 1.4 14.4 0.7 6.3 0.6 7.6Solvents 1.8 1.8 10.5 0.5 Total 388.7 73.9 62.6 525 75.4 28.4 27.3 131 (-75%)
CHANGES IN GREENHOUSE GAS (GHG) EMISSIONS 1990-2050
© Je
an-P
ierr
e M
ares
chal
/MET
L-M
EDD
E
Our 2050 scenario shows that the target of a fourfold decrease in greenhouse gas emissions is achievable.

MACROECONOMIC EVALUATION
20302050
37

38
The identification and quantification of the resources released following the adoption of more energy-efficient practices, and of the technical potential for energy efficiency and the development of renewable energy sources, were supplemented by a macroeconomic evaluation of scenarios envisaging the exploitation of these technical possibilities and resources. What are the expected impacts on gross domestic product (GDP), employment and the trade balance? Are these technical proposals for achieving the target of a fourfold reduction in greenhouse gas emissions economically viable, and do they represent an opportunity for growth?
Changes in macroeconomic indicators under different scenarios
To perform this evaluation, ADEME used a “Multisectoral Macroeconomic Model for Evaluating Energy and Environ-mental Policies (ThreeME), which the agency has been developing since 2008 in conjunction with the French Economic Observatory (OFCE), an economic research centre at the Institute of Political Studies. ThreeME is an economic forecasting model used to assess the effects of public policy measures on business production and employment, and the repercussions for consumption, the trade balance, public accounts, and national income (GDP).
The macroeconomic evaluation carried out using the ThreeME model reveals the gains or losses generated by the implementation of our scenarios for 2030 – 2050, compared to a business-as-usual scenario. Changes in energy prices for the different economic operators and the relative proportion of the energy bill in their spending can also be simulated. The results depend on the modelling principles used (which, in this case, are comparable to other macroeconomic forecasting models used by INSEE), the calibration of the baseline year and certain other assumptions.
One trend-based scenario and three alternative energy scenario analyses
In the business-as-usual scenario used as a baseline, the shares of the different energy sources remain stable in the energy mix, the instruments currently used to combat climate change are not modified, the economy is growing at a rate of 1.8% and fossil fuel prices change according to IEA forecasts. Final energy consumption amounts to 170 mtoe in 2010, 156 mtoe in 2030 and 138 mtoe in 2050.
2010 2020 2030 2040 2050
Renewable sourcesOilNatural gasThermal power stationsNuclear power stationsCoal
0
50
100
150
200
250
300
CHANGES IN THE ENERGY MIX IN MTOE OF PRIMARY ENERGY - SOURCE: THREEME 2013
BASELINE SCENARIO
39
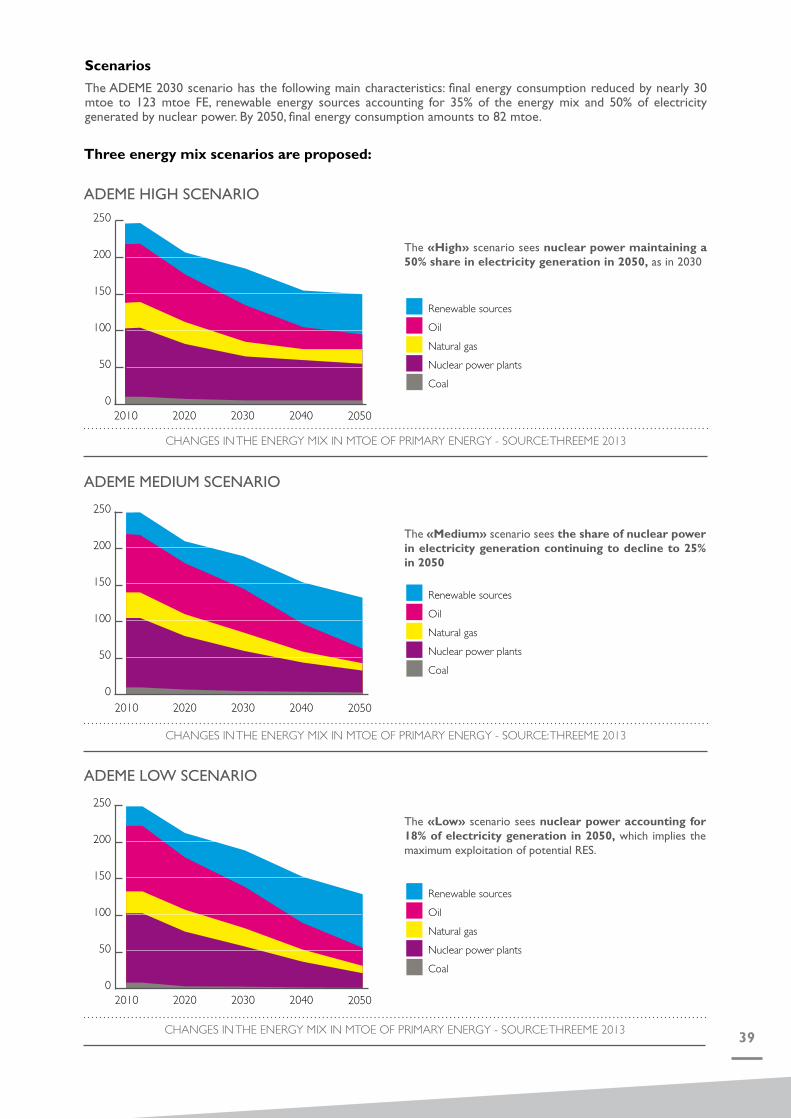
Three energy mix scenarios are proposed:
Scenarios
The ADEME 2030 scenario has the following main characteristics: final energy consumption reduced by nearly 30 mtoe to 123 mtoe FE, renewable energy sources accounting for 35% of the energy mix and 50% of electricity generated by nuclear power. By 2050, final energy consumption amounts to 82 mtoe.
The «High» scenario sees nuclear power maintaining a 50% share in electricity generation in 2050, as in 2030
The «Medium» scenario sees the share of nuclear power in electricity generation continuing to decline to 25% in 2050
The «Low» scenario sees nuclear power accounting for 18% of electricity generation in 2050, which implies the maximum exploitation of potential RES.
0
50
100
150
200
250
2010 2020 2030 2040 2050
0
50
100
150
200
250
2010 2020 2030 2040 2050
0
50
100
150
200
250
2010 2020 2030 2040 2050
CHANGES IN THE ENERGY MIX IN MTOE OF PRIMARY ENERGY - SOURCE: THREEME 2013
CHANGES IN THE ENERGY MIX IN MTOE OF PRIMARY ENERGY - SOURCE: THREEME 2013
CHANGES IN THE ENERGY MIX IN MTOE OF PRIMARY ENERGY - SOURCE: THREEME 2013
Renewable sourcesOilNatural gasNuclear power plantsCoal
Renewable sourcesOilNatural gasNuclear power plantsCoal
Renewable sourcesOilNatural gasNuclear power plantsCoal
ADEME HIGH SCENARIO
ADEME MEDIUM SCENARIO
ADEME LOW SCENARIO

40
DEVIATION FROM THE BASELINE SCENARIO IN INDEX POINTS – SOURCE: THREEME 2013
DEVIATION FROM THE BASELINE SCENARIO – SOURCE: THREEME 2013
(1) For a GDP index of 100 in the baseline scenario, the index rises to 101.8 in the ADEME projection for 2030
0
0.5
1
1.5
2
2.5
3
3.5
2013 2020 2030 2040 2050
GDP High scenarioGDP Medium scenario
GDP Low scenario
0
200000
400000
600000
800000
1000000
2030 2050
Employment Low scenarioEmployment Medium scenarioEmployment High scenario
A long-term improvement in macroeconomic indicators
This evaluation focused solely on conventional macroeconomic indicators such as GDP, which take into account only recorded financial transactions. Losses or gains in well-being, associated with changes in behaviour (decrease in individual mobility, other modes of energy consumption, etc.) and changes in climate and environment trends, are not evaluated due to the lack of consensus concerning their definitions and measurement tools.
In 2030, the implementation of the ADEME scenario results in a 1.9-point increase in GDP compared to the baseline scenario.1 In 2050, the projection leads to a rise of 3.3 GDP points in the Low scenario, 3.1 GDP points in the Medium scenario and 2.7 GDP points in the High scenario. In other words, the energy transition could generate gains equivalent to nearly two years of additional growth over the 2013-2050 period. This result can be attributed mainly to increased employment and the reduction of the trade deficit.

41
GROSS DISPOSABLE HOUSEHOLD INCOME EXCLUDING ENERGY AND DEBT BURDEN REMAINS CONSTANT (BILLIONS OF EUROS)
0
500
1000
1500
2000
2500
2006 2020
1050
1050
1276
1288
1549
1572
2269
2370
2030 2050
Baseline scenarioADEME Medium scenario
This macroeconomic evaluation of the 2030-2050 scenario using the ThreeME model demonstrates that the recessionary impacts of public energy transition policies such as the drop in business activity linked to the decrease in energy production, the rise in the cost of electricity generation and the increase in environmental taxation, are offset by expansionary effects, such as increased employment associated with the development of new business activities (e.g. energy-efficiency renovation of buildings), the medium-term reduction in energy bills (allowing for increased consumption in other areas), the redistribution of environmental tax revenues to households (in the form of income tax reductions) and companies (in the form of lower charges) and a medium-term improvement in the trade balance (drop in imports, particularly of fossil fuels). In addition to its positive environmental aspects, the energy transition is thus also expected to be beneficial for the French economy in general.
In 2030, job creation is boosted by 329,000 positions compared to the baseline scenario. In 2050, 825,000 jobs are created in the Medium scenario (+874,000 jobs are created in the Low scenario and +691,000 jobs are created in the High scenario). In the Medium scenario, the unemployment rate as a percentage of the active population decreases by 1.5 points in 2050, compared to the baseline scenario.
In the short term, the trade deficit rises by 0.4% of GDP compared to the baseline scenario, due to an increase in capital goods imports, which is linked to the development of renewable energy production and a slight drop in French exports, following a rise in energy prices. After 2010, the trade deficit gradually decreases in line with reductions in energy costs and also declines in relation to the baseline scenario, by 1% of GDP in the Low scenario, 1.1% of GDP in the Medium scenario and 1.2% of GDP in the High scenario, by 2050.
Between 2014 and 2030, household energy bills increase due to rising prices and higher energy taxes. They then decrease, despite the continuous rise in energy prices, due to lower energy consumption. The energy transition leads to increased household purchasing power, with a rise in gross disposable income of over €100 billion – excluding energy bills and minus household debt incurred for energy efficiency investments (in the housing and motor vehicle sectors) by 2050 compared to the baseline scenario. This is the result of job creation and the reduction in energy bills in the medium term.

APPENDICES
In 2012, ADEME asked its technical and economic departments to develop forward-looking energyscenarios up to 2030 and 2050. The results, “ADEME Energy Transition Scenarios 2030-2050», are summarised here.This in-house project has enabled the Agency to propose proactive energy and climate scenarios focusing on the management of energy consumption and the development of renewable energy supplies. These scenarios identify a possible pathway towards energy transition in France, address key environmental issues and identify green growth sectors and the changes that must be made to French energy production facilities.
Two time horizons and two separate methodologies
Méthodology
Target
Sectors considered
Main indicators
Economic indicators
Consideration of the consequencesof climate change
ResultsPrimary energy (% 2010) Delivered energy (% 2010) GHGs (% 1990)
ADEME Vision 2030
Exploratory
Proactive trend-based
All sectors of energy consumption, excluding energy production
Energy, GHGs (CO2, CH4, N20), pollutants emissions, air quality
GDP, employment, investments, trade balance, energy prices
No
182 mtoe (-30 %)123 mtoe (-18 %) 313 Mt CO2eq (-40 %)
ADEME Vision 2050
Normative
75% reduction in GHG emissions
Yes for buildings and agriculture (AIB scenario of the IPCC report)
Not available82 mtoe (-46 %)131 Mt CO2eq (-75 %)
42

38
For both scenarios, the demographic changes in question are derived from the INSEE “high birth- rate” scenario i.e. 68,531,000 inhabitants in 2030 compared to 62,881,000 today. The INSEE assumption of a decrease in the number of people per household has also been adopted (2.17 people per household in 2030 compared to 2.31 today). The International Energy Agency’s (IEA) macroeconomic parameters have been used for oil, natural gas and coal prices in 2030, and the French Strategic Analysis Centre’s (CAS) parameters have been adopted for GDP growth, i.e. an average of 1.8% per year over the period.
Factors
OilGasCoalStructural increase of the GDP
2010 value 2030 value
78.1 134.57.5 1399.2 115.9
Units Source
$2010/baril AIE WEO 2011$2010/Mtu AIE WEO 2011$2010/tonne AIE WEO 2011
1.8 % per year over the period CAS
SCENARIO UP TO
2030Macroeconomic and demographic outlook

For the 2050 time horizon, the trends used for the 2030 scenario analysis have been extended.The demographic changes in question are derived from the INSEE “high birth-rate” scenario i.e.74,130,000 inhabitants in 2050, compared to 62,881,000 today. The INSEE assumption of a decrease in the number of people per household has also been adopted (2.05 people per house-hold in 2050 compared to 2.31 today). The significant ageing of the population has been taken into account. There are major alterations to the age pyramid, with an additional 9 million people over 65 years old, an age group that will constitute a quarter of the French population.
SCENARIO UP TO
2050Macroeconomic and demographic outlook
Factors 2010 value 2050 value Unit Source
Oil 78.1 231 $2010/barrel Continuation of IEA WEO trend
Gas 7.5 22 $2010/Mtu Continuation of IEA WEO trend
Coal 99.2 128 $2010/tonne Continuation of IEA WEO trend
Structural 1.8 % per year over the period Continuation of CAS trend
44

List of abbreviations and acronyms
INSEE: Institut National de la Statistique et des Etudes Economiques (French Institute forStatistics and Economic Studies)IAE: International Energy AgencyBtG: Biomass to Gas CAS: Centre d’Analyse Stratégique (Strategic Analysis Centre)ISWH: Individual solar water heaterTWH: Thermodynamic water heaterGHG: Greenhouse gasINRA: Institut National de la Recherche Agronomique (French National Institute for Agricultural Research)kWh: kilowatt hourmtoe: 1million toeHP: Heat pumpGDP: Gross Domestic ProductOP: Oil productsPV: Photovoltaictoe: tonnes of oil equivalentDWIP: Domestic Waste Incineration Plant
Units, definitions and conversion factors
toe: Quantity of energy contained in one tonne of oil
Common energy conversions
Diesel (t) Gasoline (t) Biomass (t) Electricity (MWh) Natural gas (MBTU) Coal (t)
1 toe 0.95 1.05 0.22 11.63 36.7 0.62

French Environment &Energy Management Agency
ABOUT ADEME
Having played a central role in environmental issues for
two decades, ADEME – the French Environment and
Energy Management Agency – is active in the implementation
of public policies in the areas of the environment, energy
and sustainable development. ADEME provides expertise
and advisory services to businesses, local authorities and
communities, government bodies and the public at large,
enabling them to establish and consolidate their environmental
action. As part of this work, the agency helps finance
projects, from research to implementation, in the following
areas: waste management, soil conservation, energy efficiency
and renewable energy, air quality and noise abatement.
ADEME is a public agency reporting to the Ministry of
Ecology, Sustainable Development and Energy and to the
Ministry of Higher Education and Research. www.ademe.fr
Cov
er p
hoto
: © A
rnau
d Bo
uiss
ou/M
ETL-
MED
DE
794
2
ISBN
978
-2-3
5838
-685
-2
may
201
4