inclusive business models for sorghum and ... - hope...
TRANSCRIPT

1
INCLUSIVE BUSINESS MODELS FOR SORGHUM AND
MILLETS: THREE CASE STUDIES
Alastair Orr
Catherine Mwema
9 October 2012
International Crops Research Institute for the Semi-Arid Tropics
(ICRISAT), PO Box 39063-00623 Nairobi, Kenya
2
Contents
Page
Executive Summary
5
1 Introduction
6
2 Objectives
6
3 Conceptual Framework
7
4 Data and methods
9
5 Lesiolo Grain Handlers Ltd, Kenya
10
6 Smart Logistics Solutions Ltd, Kenya
17
7 LEAD project, Uganda
24
8 Comparative Performance
28
References
34

3
List of Tables
Page Table 1. Typology of business model drivers 8 Table 2: Partial budget for WRS, Lesiolo Grain Handlers Ltd., 2009 12 Table 3: Marginal Rate of Return (MRR), WRS 13 Table 4: Socio-economic differences between WRS participants and non-participants
15
Table 5: Factors constraining participation in WRS (% non-participants reporting) 16 Table 6: Smart Logistics business model costs (2012) 20
Table 7. Partial budgets for sorghum, 2012 season 21 Table 8: Rate of Return on Investment for sorghum production (2012) 22 Table 9: Unga Mills Ltd finger millet margins (2009) 26 Table 10: Partial budget for finger millet in Uganda, 2009 27 Table 11: Comparison of case studies 28
List of Figures
Figure 1. Typology of business models linking smallholders to markets 7 Figure 2: Warehouse Receipt System, Lesiolo Grain Handlers Ltd, Kenya, 2012 11 Figure 3. Weekly wholesale prices for maize, sorghum, and millet, Kenya, 2011 14 Figure 4: Smart Logistics business model (2012) 19 Figure 5: LEAD Project Business Model 25 Figure 6: Profitability of three business models for growers 31

4
Acronyms
AGMARK Agricultural Market Development Trust COMESA Common Market of Eastern and Southern Africa C&F Cost and Freight CGA Cereal Growers association COBO Community Based Outgrower Structure EAML East African Maltings Limited EABL East African Breweries Limited EAGC East African Grain Council ESA East and Southern Africa EUCORD European Cooperative for Rural development FCI Farm Concern International FGD Focus Group Discussion FIPS Farm Inputs Promotions FOB Free on Board KS Kenya shilling LEAD Livelihoods and Enterprise Development LGHL Lesiolo Grain Handlers Limited MLI Market Linkages Initiative MOA Ministry of Agriculture MRR Marginal Rate of Return NCPB National Cereal Produce Board PO Producer Organisation P4P Purchase For Progress RATIN Regional Agricultural Trade Intelligence Network ROI Return on Investment UCE Uganda Commodity exchange UGX Uganda shilling USAID United States Agency for International Development WFP World Food Programme WRS Warehouse Receipt System

5
Executive Summary
Inclusive business models combine profitability with the potential for poverty reduction by linking smallholders with markets. This report analyses three business models relevant for sorghum and millets in east and southern Africa. These are: The Warehouse Receipt System operated by Lesiolo Grain Handlers Limited (LHGL) (Kenya), the contract sorghum grower model operated by Smart Logistics Solutions Ltd (SLS) (Kenya), and the contract finger millet grower system operated by the LEAD Project (Uganda). The performance of these business models was evaluated in terms of their design, profitability, and inclusiveness.
The WRS is a producer-driven model that depends on the willingness and ability of producers to store grain until prices rise. The case-study of the WRS operated by LHGL showed low uptake by maize growers due to constraints imposed by low awareness among growers, a minimum 10 t threshold of grain accepted for storage, and the distance to the store. In 2011, only 600 to of maize entered the WRS from five farmer groups. Although the WRS was profitable for maize growers, the seasonal rise in prices was much lower for sorghum and millets, which greatly reduced the potential benefits of WRS for these crops. A recent survey of participants showed that the WRS was inclusive, with high rates of participation from small maize producers and from women.
The Smart Logistics business model is a buyer-driven model driven by the growing market for clear sorghum beer. Smart Logistics acts as an intermediary for the brewery industry, supplying seed to producer groups, monitoring quality, and offering higher prices than local brokers. The model is profitable for growers, intermediary, and buyer. Volumes supplied to the industry have grown but are still not sufficient to meet demand. The model is inclusive with the majority of producers belonging to all-female groups, and collective farming to reduce unit costs. Of the three models studied, this has the greatest potential.
The LEAD business model was designed to provide Unga Millers Ltd in Nairobi with an annual supply of 6,000 t of finger millet. However, the model proved unworkable. No finger millet was ever delivered. The business model was profitable for Ugandan growers and for the buyer. The model was also inclusive, with finger millet supplied smallholders organized in producer organizations, where almost half the members were women. However, the model failed because it was intermediary-driven. Changes to the original design by the LEAD management team delayed the start of the project while the small company appointed to bulk, clean, and ship finger millet to Nairobi was unfitted for this role.

6
1. Introduction
Smallholders in Africa have limited access to markets. Attempts to overcome this market failure have resulted in several innovative business models. These include collective marketing to reduce transaction costs, negotiate forward contracts, and earn higher prices for growers, Warehouse Receipt Systems (WRS) that allow smallholders to store commodities until prices rise, and contract farming that provides buyers with a reliable supply of high quality products, and links growers directly to buyers. However, experience with these business models has been largely confined to high-value export crops. There is limited knowledge on the performance of these models with lower-value, staple food crops. This report reviews experience with innovative business models for sorghum and millets in East and Southern Africa (ESA). The review is based on three case-studies, which were purposively selected because of their relevance for sorghum and millets, scale of operations, and the availability of information.1
The report focuses on three research questions about the business models under review:
1. How do they work? 2. How profitable are they? 3. How inclusive are they?
1. Objectives
The general objective of this report is to evaluate the design and performance of three inclusive business models linking smallholders to markets. The three specific objectives are to:
1. Describe the design of these business models; 2. Evaluate the profitability of these business models; and 3. Assess the inclusiveness of these business models.
1 Other recent studies include case studies of four business models in ESA by COMPETE (2011) and the mid-term evaluation of the Purchase for Progress (P4P) programme (WFP, 2011).
7
3. Conceptual framework
A business model describes the rationale of how an organization creates, delivers, and captures value (Osterwalder, 2006). An inclusive business model has been defined as: “business models which do not leave behind small-scale farmers and in which the voices and needs of those actors in developing countries are recognized” (Vorley et al (2009): 187)
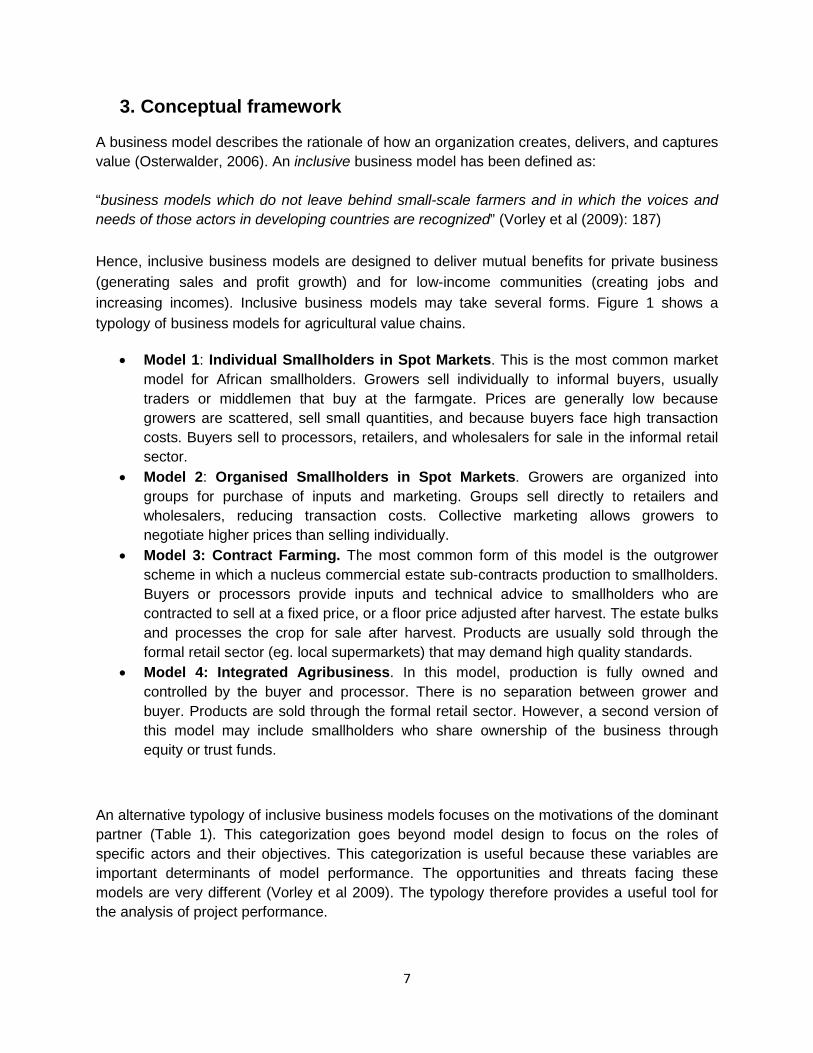
Hence, inclusive business models are designed to deliver mutual benefits for private business (generating sales and profit growth) and for low-income communities (creating jobs and increasing incomes). Inclusive business models may take several forms. Figure 1 shows a typology of business models for agricultural value chains.
• Model 1: Individual Smallholders in Spot Markets. This is the most common market model for African smallholders. Growers sell individually to informal buyers, usually traders or middlemen that buy at the farmgate. Prices are generally low because growers are scattered, sell small quantities, and because buyers face high transaction costs. Buyers sell to processors, retailers, and wholesalers for sale in the informal retail sector.
• Model 2: Organised Smallholders in Spot Markets. Growers are organized into groups for purchase of inputs and marketing. Groups sell directly to retailers and wholesalers, reducing transaction costs. Collective marketing allows growers to negotiate higher prices than selling individually.
• Model 3: Contract Farming. The most common form of this model is the outgrower scheme in which a nucleus commercial estate sub-contracts production to smallholders. Buyers or processors provide inputs and technical advice to smallholders who are contracted to sell at a fixed price, or a floor price adjusted after harvest. The estate bulks and processes the crop for sale after harvest. Products are usually sold through the formal retail sector (eg. local supermarkets) that may demand high quality standards.
• Model 4: Integrated Agribusiness. In this model, production is fully owned and controlled by the buyer and processor. There is no separation between grower and buyer. Products are sold through the formal retail sector. However, a second version of this model may include smallholders who share ownership of the business through equity or trust funds.
An alternative typology of inclusive business models focuses on the motivations of the dominant partner (Table 1). This categorization goes beyond model design to focus on the roles of specific actors and their objectives. This categorization is useful because these variables are important determinants of model performance. The opportunities and threats facing these models are very different (Vorley et al 2009). The typology therefore provides a useful tool for the analysis of project performance.

8
Figure 1: Typology of business models linking smallholders to markets
Farm Consumption
of Own Production
Consumers
Consumption
Informal Retailers and
Wholesalers
Formal Retailers
Retailing
Processors
Integrated Agribusiness
Wholesaling Processors/ Assembly Traders
Farmer Groups
Processing/ assembly
Farming Farmers Contract Farmers
Inputs Agro Input Dealers
Processor input
depots
Model No. 0 1 2 3 4 Type Subsistence
Farming Smallholders
in Spot Markets
Farmer Groups
Contract Farming
Integrated Agribusiness
Source: Haggblade et al (2012)

9
Table 1. Typology of business model drivers
Type Driver Objectives Producer-driven Smallholders New markets
Higher market price Buyer-driven Large farmers
Processors Exporters Retailers
Stabilise market position Increase supply Assure supply
Intermediary-driven Traders, wholesalers
NGOs and other support agencies
Supply more discerning customers
‘Make markets work for the poor’
Source: Vorley et al (2009).
In ESA, inclusive business models for agriculture have adopted Models 2 and 3 (Figure 1). Model 3 has been used in value chains for high value crops, particularly crops with large export markets, such as coffee, tea, flowers (Barrett et al 2012), horticulture (Neven et al 2009; Rao and Quaim, 2011), and milk (IFAD, 2010). Experience with inclusive business models for low-value staple food crops is more limited. However, recent studies include the Cereal Growers Association (CGA) in Kenya and Tanzania, Farm Concern International (FCI) in Kenya and Uganda, and the Agricultural Market Development Trust (AGMARK) in Kenya and Uganda (COMPETE, 2011). A common feature of these models is the provision of grain storage and market information for cereal growers. Several inclusive business models target markets for farm inputs. These include the Real IPM Company, a private company in Kenya, which markets Gro-Plus, a 500 g seed-treatment pack for small farmers, and the Farm Input Promotion-Africa, a not-for-profit company that markets small, affordable packs of seed and fertilisers (Hall et al 2010).
4. Data and Methods
The report is based on three main types of evidence. First, we conducted personal interviews with key informants. The interviews were made using a checklist that covered the three specific research objectives (design, profitability, inclusion). For the Smart Logistics case study, we interviewed growers at the Maliku collection centre, Kitui district. We interviewed representatives (secretaries and chairmen) of three farmer groups (Wendo wa maliku, Walanyo and Kalimani Self Help Groups), and conducted a Focus Group Discussion (FGD) on their experience with Smart Logistics Ltd and developed a partial budget for sorghum production. The LEAD case study was based on interviews with former LEAD staff, either in person or by telephone. A list of persons met and/or contacted is provided in Appendix 1.
Secondly, we collected relevant reports, documents, and statistical information either directly from the key informants, or the internet. The Warehouse Receipt System operated by Lesiolo Grain Handlers Limited was the subject of a recent M.Sc. thesis (Mutai, 2011). The reference

10
year for the data collected was 2009. With permission from the author, our discussion uses information from this source.
Thirdly, we reviewed relevant literature on innovative business models, with particular reference to experience in ESA.
The profitability of the business models was evaluated using gross margin analysis. The marginal rate of return (MRR) measures the change in net benefits (marginal net benefits) divided by the change in costs (marginal costs). The MRR indicates what farmers can expect to gain in return when they decide to change from one practice to another. The Return on Investment (ROI) is expressed as the net benefits divided by the costs. The computed ROI estimates the returns the grower is expected to gain after investing in the variable costs of production and selling. The benefit-cost ratio measures the gross returns minus total variable costs.
5. Lesiolo Grain Handlers Ltd., Kenya
5.1 Design
The company
Lesiolo Grain Handlers Limited (LGHL) is a private company registered in 1999 which started operations in 2003. It provides post-harvest management for wheat, maize, barley, and sorghum. LGHL has one site two depots where grain is stored, one in Lanet and a second site leased from the National Cereal Produce Board (NCPB). LGHL provides services in the drying, cleaning, fumigation, bagging, and storing of grain. Apart from these services, LGHL also buys wheat, maize, sorghum, beans and soybeans from farmers for sale to local processing companies. Their biggest single customer is East African Breweries Limited (EABL) and barley accounts for 80% of the volume of crops that they store. LGHL was the first operator to be certified by Eastern Africa Grain Council (EAGC) to offer a Warehouse Receipt System (WRS) in Kenya. This system has been operational since 2007. Originally the WRS was only for wheat but now includes maize. Currently it does not include sorghum or millets.
The business model
Under the WRS suppliers must deposit a minimum 10 t maize or wheat into certified LGHL silos. LGHL then gives them a warehouse receipt (WR) which the suppliers may present to Equity Bank for credit, using the WR as collateral. This allows growers to store their crop until prices rise. in order to sell. The bank offers up to 80 % of the value of the stored with a constant Interest rate of 12% for farmers (a rate below the market rate of 23%). The depositor may be a producer, farmer group, trader, exporter, processor or indeed any individual or corporate body. The Warehouse Operator (WO) holds the stored commodity by way of safe custody, meaning they are legally liable to make good any value lost through theft or damage by fire and other catastrophes but they have no legal or beneficial interest in the commodity.

11
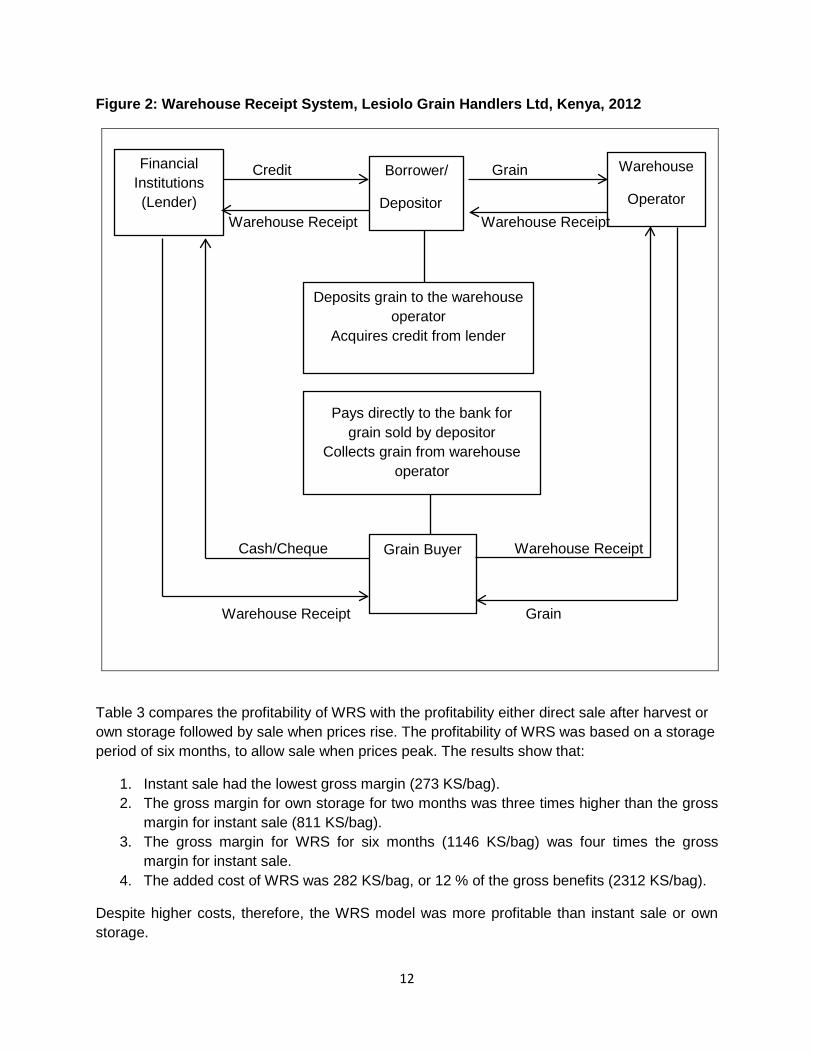
Figure 2 shows the nine steps in the WRS process:
1. The grower transports the grain to a certified warehouse. On delivery the grain is checked to ensure that it meets the stipulated quality standards.
2. If the grain passes the quality inspection and the quantity is above the 10 t minimum set by the WO, the WO stores the grain and issues a WR to the depositor.
3. The grower presents the WR to a bank. 4. The bank offers the grower short-term financing, which is a proportion of the market
value of the grain deposited in the warehouse. The WR remains with the bank. 5. When market prices improve, the grower sells the grain and the buyer is instructed to
pay directly to the bank. 6. Once the buyer has paid the bank, the bank provides the buyer with a copy of the WR. 7. The buyer presents the WR to the WO. 8. The WO gives the grain to the buyer. 9. The bank deducts the loan and interest from the cash deposited by the buyer, and the
WO recovers the storage charges. The grower then receives the balance.
5.2 Profitability
Gross margin analysis
The profitability of the WRS for growers depends on several variables:
1. The difference in the price of grain between storage and sale; 2. The cost of delivery and storage; and 3. The cost of interest charged by the bank.
The profitability of the WRS can be compared with two alternatives: instant sale after harvest and own storage in a locally-made granary. Instant sale occurs mostly within the first month after harvesting. During this period, traders and middlemen travel round the farms with lorries buying produce at low prices. The farmers have limited powers of negotiation and the traders are the sole price setters. Farmers’ urgent need for cash leaves them with no alternative except to sell their crop at a low price determined by the trader, even though they know that prices will rise. Other farmers take the initiative to store their grain in their own granary or in a rented store. However, the pressing need for cash may force them to sell before prices reach their peak. By contrast, by offering finance to meet their cash needs before they sell their grain, the WRS offers growers an incentive to wait until prices are highest. On average, own storage was carried out for two months before the farmers sold their maize (Mutai, unpublished). Unlike instant sale, growers incur some transport cost taking the maize to market and other costs associated with storage.
12
Figure 2: Warehouse Receipt System, Lesiolo Grain Handlers Ltd, Kenya, 2012
Credit Grain
Warehouse Receipt Warehouse Receipt
Cash/Cheque Warehouse Receipt
Warehouse Receipt Grain
Table 3 compares the profitability of WRS with the profitability either direct sale after harvest or own storage followed by sale when prices rise. The profitability of WRS was based on a storage period of six months, to allow sale when prices peak. The results show that:
1. Instant sale had the lowest gross margin (273 KS/bag). 2. The gross margin for own storage for two months was three times higher than the gross
margin for instant sale (811 KS/bag). 3. The gross margin for WRS for six months (1146 KS/bag) was four times the gross
margin for instant sale. 4. The added cost of WRS was 282 KS/bag, or 12 % of the gross benefits (2312 KS/bag).
Despite higher costs, therefore, the WRS model was more profitable than instant sale or own storage.
Financial Institutions (Lender)
Borrower/
Depositor
Deposits grain to the warehouse operator
Acquires credit from lender
Warehouse
Operator
Pays directly to the bank for grain sold by depositor
Collects grain from warehouse operator
Grain Buyer

13
Table 2: Partial budget for WRS, Lesiolo Grain Handlers Ltd., 2009
Figures in Kenya Shillings per 90 kg bag of maize
Months Total
1 2 3 4 5 6
Instant sale
Benefits 1157 - - - - - 1157
Production cost 884 - - - - - 884
Gross Margin 273 - - - - - 273 Own storage
Benefits - 1910 - - - - 1910
Production cost 884 - - - - - 884
Transport cost - 50 - - - - 50
Fumigation 15 - - - - - 15
Storage losses - 100 - - - - 100
Rent on stores 25 25 - - - - 50
Gross Margin -924 1735 - - - - 811 WRS
Benefits - - - - - 2312 2312
Production cost 884 - - - - - 884
Storage costs 9 9 9 9 9 9 54
Fumigation - - 10 - - 10 20
Loading - - - - - 10 10
Offloading 10 - - - - - 10
Transport 50 - - - - - 50
Interest on loan - - - - - 138 138
Gross Margin -953 -9 -19 -9 -9 2145 1146 Source: Lesiolo Grain Handlers & Mutai, (2011)

14
Marginal Rate of Return
Table 4 shows the MRR for the three alternatives methods of sale. The results show that the WRS gave a higher rate of return (4.1) than own storage (3.5) when growers switched from instant sale. For every additional shilling invested in the WRS, the grower will recover the shilling and earn a return of KES 4.1.
Table 3: Marginal Rate of Return (MRR), WRS
Figures in Kenya Shillings per 90 kg bag of maize
Instant sale Own storage WRS Revenue 1157 1910 2312 Variable Costs 884 1099 1166 ∆ in revenue from instant sale
753 402
∆ in costs from instant sale
215 282 MRR
3.5 4.1
Profitability for sorghum
The profitability for warehouse storage of sorghum and millet was estimated by comparing the seasonal price changes for these crops with that for maize. To compare prices, we used the period for the “short rains” (October-December) in eastern Kenya, which is the main growing season for sorghum and millets.2 We compared prices after harvesting and three weeks’ drying (February), two months after harvest (April) and six months after harvest (July) for the three crops. Prices are wholesale prices for the calendar year 2011. Figure 3 shows that six months after harvest, the wholesale price of sorghum had risen by 21%, while the price of millets had risen by 12 % storing sorghum. By contrast, the price of maize had risen by 158%. Two months after harvest, the price of sorghum and millets had risen by only 2-17 % compared with 47 % for maize. This suggests that the seasonal price rises for sorghum and millets in Kenya are not high enough to justify storage through the WRS.
2 The “long rains” are normally from March to May, but these are not reliable and rarely occur in eastern Kenya. Most grain production in Kenya is in the short rains.

15
Figure 3. Weekly wholesale prices for maize, sorghum, and millet, Kenya 2011.
Prices (KS/kg) Change in price (%)
Instant sale Own storage WRS WRS Own storage Month of sale February April July July April Maize 19 28 49 158 47 Sorghum 29 34 35 21 17 Millet 50 51 56 12 2
Source: RATIN website.
5.3 Inclusion
The inclusiveness of the business model was evaluated by previous research, based on a random sample of 178 farm households in Mauche and Gilgil divisions, Nakuru district, surveyed in 2010 (Mutai, 2011). Of the maize growers surveyed, 73 % were aware of the WRS. This figure was below expected given that the WRS system was introduced in 2007 and that the survey was conducted in Nakuru county where LHGL is located. Low awareness may reflect limited publicity for the system. Of those aware of the WRS, 39 % did not participate. This figure is higher than those who were aware and participated.
Table 4 compares socio-economic indicators between households participating and not participating in the WRS.
05
1015202530354045505560
Jan
(Wk
1)
Jan
(Wk
3)
Jan/
Feb
(Wk
5)
Feb
(Wk
7)
Feb/
Mar
(Wk
9)
Mar
(Wk
11)
Mar
/Apr
(Wk
13)
Apr (
Wk
15)
Apr (
Wk
17)
May
(Wk
19)
May
(Wk
21)
Jun
(Wk
23)
Jun
(Wk
25)
Jul (
Wk
27)
Jul (
Wk
29)
Jul/A
ug (W
k 31
)
Aug
(Wk
33)
Aug/
Sep
(Wk
35)
Sep
(Wk
37)
Sep
(Wk
39)
Oct
(Wk
41)
Oct
(Wk
43)
Nov
(Wk
45)
Nov
(Wk
47)
Dec
(Wk
49)
Dec
(Wk
51)
Aver
age
wee
kly
who
lesa
le p
rices
(KS/
kg)
Sorghum Maize Millet

16
Table 4: Socio-economic differences between WRS participants and non-participants
Socio-economic indicator
Participants (n=48)
Non-participants (n=130)
All households (n=178)
Household size (no.) 4.8 5.2 5.1 Female-headed households (no.)
18 37 55
Member of Farmer Group (no.)
38 25 63
Farm size (acres) 4.3 3.8 3.9 Area planted to maize (acres)
2.9 2.5 3.5
Maize harvested (90 kg bags)
21.4 15.2 16.9
Distance to warehouse (km)
29 41 37
Source: Mutai (2011): 23-24.
Multivariate analysis revealed that the farm household’s decision to participate in the WRS depended on several variables. The variables that positively affected participation were:
1. Female-headed household 2. Membership of a farmer group 3. Area planted to maize 4. Value of off-farm income
By contrast, participation was negatively affected by the distance between the household and the warehouse.
Eighty percent of households using the WRS belonged to a group, compared to 19 % that did not participate. Since female-headed households were more likely to be members of a farmer group, they were also more likely to participate in the WRS. Access to off-farm income also facilitated use of the WRS by providing households with alternative sources of income and reducing the need for instant sale of maize after harvest.
Farmers were also asked what they considered the major challenge preventing participation in the WRS (Table 5). Among non-participants, 70 % reported the greatest challenge to be transporting maize to the warehouse. Recent increases in fuel prices have resulted in a rapid increase in transport costs. Poor road infrastructure might be another reason for the high transport costs charged to farmers which bars them from participating in the WRS. Fifty-three percent cited low farm productivity as a challenge to participation. Since the warehouse operator requires at least 10 t to offer this service, low maize production means that growers cannot raise the volumes required for storage in the WRS. Half the non-participants mentioned grain quality as an important challenge. However, only 22 % blamed challenges with running farmer groups as a reason for non-participation.

17
Table 5: Factors constraining participation in WRS (% non-participants reporting)
Constraints Yes (n=130)
Transport 70
Low farm productivity 53
Attaining maize quality 50
Financial challenges 27
Farmer group challenges 22
Source: Mutai (2011): 33.
6. Smart Logistics Solutions Limited, Kenya
6.1 Design
The company
Smart Logistics Ltd. started operations in 2006 as a small-scale business buying sorghum from farmers and selling to East African Maltings Limited (EAML) for brewing, which supplies malt to breeries. Rose Mutuku, the director, was formerly procurement manager for East African Breweries Limited (EABL). Over time, the company has found more buyers but EAML still remains its major client. The company currently has four major buyers: EAML (sorghum), Nutrofood (soybeans) and World Food Programme (WFP) through the Purchase for Progress (P4P) programme (sorghum, beans and maize). Smart Logistics mainly buys crops on contract and not through the open market.
Through a grant from the Market Linkages Initiative (MLI) funded by USAID, Smart Logistics managed to build eight village aggregation centres (each with a capacity of 200 t.) which smallholders use to bulk their sorghum. Smart Logistics has also constructed a grain bulking center in Machakos with a capacity of 10,000 t. When the company started in 2009 it supplied just 20 t of sorghum. In 2011, Smart Logistics handled 2,000 t of sorghum, of which 1,500 t came directly from growers and 500 t came from its own appointed agents.
The business model
To maximize volumes, Smart Logistics uses two sources of supply. The first source of supply is a smallholder outgrower model, known as the COBO: CO-Community, B-Based, O-Out growers, S-Structure. In this model growers are organized into groups with at least 15 members. Ten farmer groups come together to form a set, referred to as a production unit. Each member of a production unit is expected to grow at least two acres of sorghum. Five production units form one COBO. The 10 farmer groups each nominate a representative for the COBO committee. Each COBO has a field officer employed by Smart Logistics, who supports the

18
members of the COBO and links with the Ministry of Agriculture that provides extension services to the groups. The field officer holds pre-planting, pre-harvest and post-harvest meetings with growers. Before planting, the officer distributes seeds, the cost to be deducted after harvesting. In the post-harvest meeting, a review of what happened during the season is made.
The second source of supply is buying agents, appointed by Smart Logistics, who buy sorghum at a price lower than that offered by Smart Logistics to members of the COBO, but higher than the price offered by brokers. The role of the agent in this model is to:
1. Help to create price uniformity in the sorghum market; 2. Function as an alternative bank, where the farmer has pressing cash needs; and 3. Help accumulate the volumes required by Smart Logistics.
Once the growers have harvested they sell their sorghum to Smart Logistic marketing agents, or
through the Smart Logistic voucher system. In the voucher system, the farmer delivers sorghum
to the aggregation centre, which may either be one of the eight permanent centres or a satellite
centre rented for the harvest season. At the aggregation centre, the field officers make quality
checks, which include checking the amount of foreign matter, the size of the seeds and the
colour (the recommended colour is white), after which the grain is weighed and bagged. Once
satisfied with the quality, the field officer issues the grower with a receipt. The receipt has three
main components: bio-data of the grower; payment instruction details (names, account No.,
bank and branch names); production (the quantity, quality, and net value of the sorghum sold by
the grower). Each aggregation centre has 600 – 1,000 farmers with at least two acres planted to
sorghum. The target volume of sorghum for each centre is a minimum of 10 t. Last season,
however, the volume of sorghum collected per an aggregation center was between three and
five tons.
Based on the receipts issued by Smart Logistics, farmers are paid by the Equity and Co-
operative banks. Each receipt has a unique WR which Smart Logistics sends to the bank as an
instruction for payment. The receipt has three copies: farmers, accountants, and a book copy.
The farmer then issues the receipt to the bank for payments or the money can be directly
deposited to the farmers’ bank account if the farmer has an account. After delivery, it takes
approximately seven days before payments are made, though sometimes payment is delayed
up to one month. These delays could be as a result of capital needs of the company or field
delays, where the field officer delays to take the receipts to the office in time due to the
aggregation activities. By contrast, agents pay on the spot and hence supplement the
company’s working capital.

19
Sorghum aggregated from the different collection centres and agents is brought to Smart
Logistics’ bulking center in Machakos. Smart Logistics makes a contract with each
set/production unit and a Local Purchase Order (LPO) is issued to the set. At the moment, SLC
has 10 sets. The sorghum is shipped to East African Maltings (EAML) in Nairobi, which supplies
quality raw materials in the form of malt, barley and sorghum to the brewing units of East African
Breweries Limited (EABL). EAML have their own laboratories in which they test sorghum for
quality. EAML encourages sorghum suppliers to bring a sample for testing to ensure that quality
standards are maintained.. Payment is made within 15 working days after delivery through the
bank.
The European Cooperative for Rural Development (EUCORD) coordinates the supply of
sorghum to EAML through a number of partners, including Smart Logistics, AFRICA Harvest,
and others.
6.3 Profitability
Smart Logistics
Table 5 shows the costs incurred by Smart Logistics in sourcing and shipping sorghum to EAML in Nairobi. Smart Logistics delivers sorghum to EAML at a price of 30 KS/kg and buys the same from farmers at 22 Ks/kg. Total costs average 6 KS/kg, and the estimated mark-up for Smart Logistics is 2 KS/kg of sorghum. However, this margin may be reduced by hidden and unforeseen costs, such as illegal payments at police check-posts, payments to the local council, vehicle breakdowns during transportation (shipping is outsourced to private contractors). Profits therefore depend on maximizing the volume of sorghum supplied.

20
Figure 4: Smart Logistics business model (2012)
Bank (payments)
Bulking Centre (SL offices)
Farmers
Village Aggregation
Centers (Voucher system)
EAML (Client)
Agents
(Spot cash)
EUCORD

21
Table 6: Smart Logistics business model costs (2012) Figures are Kenyan Shillings per 90 kg bag of sorghum
Variable costs Costs (Ks/bag) Percent
Transport 90 16.7
Cess 45 8.3 Aggregation 90 16.7
Loading & offloading 90 16.7 Weighing & packaging 90 16.7 Administration 90 16.7
Handling losses (pouring, weight loss) 45 8.3 Total 540 100.0 Source: Smart Logistics
Growers
Profitability for growers was estimated through a Focus Group Discussion (FGD) with farmers selling sorghum to the Smart Logistics in the Maliku aggregation centre in Kitui, Eastern Province. The FGD was conducted in mid-September 2012 when the crop had been harvested. Farmers grew sorghum both individually and collectively. In collective farming, growers rented land, and threshing and winnowing were done collectively. By contrast, in individual farming, threshing and winnowing is done by community work parties known as muethya, for which the farmer has to provide a variety of food and provide local brew. Individual farmers sold sorghum either to a private broker or to Smart Logistics, whereas collective farmers sold only to Smart Logistics. Table 7 shows partial budgets for these three scenarios. Budgets are presented for both a cash-cost and full-cost basis, which includes the imputed cost of family labour. The results show that:
1. The gross margin for growers was significantly higher when selling to Smart Logistics than when selling to brokers. For example, on a cash-cost basis, the gross margin for individual farmers was six times higher selling to Smart Logistics (1,122 KS/bag compared to 190 KS/bag selling to brokers)
2. Higher gross margins selling to Smart Logistics reflected the higher price paid to growers (22 KS/kg) compared to the price paid by brokers (12 KS/kg).
3. Gross margins for group farming were higher than for individual farming, whether calculated on a cash or full-cost basis. Ploughing and transport costs are lower for group

22
farming since these services are provided by group members who offer a lower charge to the group.
Table 7. Partial budgets for sorghum, 2012 season Figures in Kenya Shillings per 90 kg bag of sorghum Method Full-cost basis Cash-cost basis Type of farming Individual Group Individual Group Buyer SL Brokers SL SL Brokers SL Revenue 1,980 1,080 1,980 1,980 1,080 1,980 Land clearing 80 80 80 40 40 40 Ploughing 200 200 100 200 200 100 Seeds 48 50 48 48 50 48 Planting 40 40 40 0 0 0 Bird scaring 300 300 300 0 0 0 1st weeding 160 160 160 160 160 0 2nd weeding 80 80 80 80 80 0 Harvesting 80 80 80 80 80 0 Threshing 140 140 40 140 140 0 Winnowing 80 80 40 80 80 0 Bagging 0 30 0 0 30 0 Transport 30 30 15 30 30 15 TVC 1,238 1,270 983 858 890 203 Gross margins 742 -190 997 1,122 190 1,777 Source: Maliku Farmers’ Groups, Kitui Notes: 1. Planting and bird scaring are done by family members only (including children). 2. Weeding and land clearing are done by two family members (husband and wife). 3. There are no bagging costs for selling to Smart Logistics since they provide bags.
Rate of Return on Investment
Table 8 compares the rate of return for the three business scenarios. The results show that:
1. Group farming is the most profitable method amongst the three. It gives a return of KS 8.75 on cash-cost basis which means that for every KS invested in group farming, the farmers get their shilling and an extra KS 8.75.Selling to brokers gives the least return (0.21).
2. Farming individually then selling to brokers has a negative return (-0.15) on full-cost basis. For every shilling spent in production, the farmer loses 0.15 KS when he sells to the brokers.

23
Table 8: Rate of Return on Investment for sorghum production (2012)
Method Full-cost basis Cash-cost basis Type of farming Individual Group Individual Group Buyer Brokers SL SL Brokers SL SL Gross margin -190 742 997 190 1,122 1,717 TVC 1,270 1,238 983 890 858 203 Rate of return -0.15 0.6 1.01 0.21 1.31 8.75 Source: Table 7 6.4 Inclusion Maliku collection centre When aggregation began in 2009, the number of growers in Maliku aggregation centre was 200-300 rising to 400-450 growers in 2010 and 500-550 growers in 2011. In 2012, Maliku aggregation centre had 700-800 growers. In 2009 all group members were women but over time the proportion of male growers has increased, though their share remains low. Currently, members plant between four to six acres of sorghum. Of the total sorghum they produce, at least 15-20 90 kg bags are sold to Smart Logistics; the remainder is usually sold to brokers for immediate cash needs, or stored for household consumption. Of the 23 farmer groups that serve this aggregation centre, 15 (65%) were all-women groups, 3 (13%) were all-male groups, and 5 (22%) were mixed groups. With an average of 20 members per group, the female group members outnumbered their male counterparts six to one. Young people (aged below 25) currently make up 15% of the participants. Constraints Growing demand for sorghum from EABL has increased price incentives for growers and the area planted to sorghum. According to one of the three groups interviewed, before contract farming in 2008, the market price was 3 KS/kg and the group farmed only three acres of sorghum, but in 2012 the group farmed 10 acres of sorghum. Sorghum has expanded at the expense of maize and beans, reflecting its growing popularity as a cash crop. The majority of growers who sell to Smart Logistics are members of producer groups. Growers who are not group members produce low volumes of sorghum mainly for consumption and sell any surplus to brokers. Growers identified several challenges they faced in the business model. In order of importance, these were:
1. Recurrent droughts (for the last four years they have experienced poor rains); 2. Time lag in receiving payments;

24
3. High production costs, especially for threshing and winnowing; 4. Birds (quelea) reducing yields; and 5. Lack of drying material.
7. Livelihoods and Enterprise Development (LEAD) Project, Uganda
7.1 Design
The project
Livelihoods and Enterprises for Agricultural Development (LEAD) is a USAID-funded project to improve livelihoods for smallholders in rural Uganda. The project has a 5-year funding period (2009-2014). As well as targeting value-chains for coffee and maize, between 2009 and 2012 LEAD also targeted the value-chain for finger millet. The idea originated with the CEO of Unga Mills Limited, which is also a member of the East African Grain Council (EAGC) in order to secure a supply of finger millet for Unga and to promote regional trade. Project activities were based in the Teso sub-region, the centre of finger millet production in Uganda. The project targeted 17,000 millet growers in seven districts. After just two seasons, however, LEAD abandoned work with finger millet. In this case-study, we explore the reasons for the failure of the LEAD project to create a value-chain for finger millet in Uganda.
The business model
The LEAD business model involved four major partners.
Unga Millers Ltd. is the oldest milling company in Kenya (founded 1891) and Kenya’s third biggest finger millet processor, after Mombasa Maize Millers and Pembe. Products include porridge (uji), pure finger millet flour, and animal/poultry feed made from by-products. Unga processes about 500 tons of finger millet per month. Full capacity is 700 tons/month. No finger millet is sourced from Kenya because it is either consumed on farm or made into local brew. Previous attempts by Unga to establish farmer groups in Kenya to supply finger millet proved unsuccessful. Consequently, all Unga’s finger millet is imported from Uganda and Tanzania.3 Unga’s advantage is that they have a history of flour production, a branded product, and see finger millet as a niche market. With ban on exports from Tanzania imposed in 2008n and the consequent increase in prices, sales of millet flour fell due to price resistance from consumers.
In the LEAD model, Unga places a forward contract for supply of finger millet from Uganda and guarantees growers a floor price, which is 60 % of the market price. Unga is willing to set a floor price because it is the dominant producer in Kenya. Since there is no grain exchange to determine the price, the floor price is based on historical trends and Unga’s ‘gut’ feeling about the market. Unga pays for the finger millet at the time of purchase. In 2010, the contract was for
3 In January 2008, Tanzania banned export of cereals (including finger millet) in response to high food prices. The ban was lifted in April 2010. According to Unga Mills, this led to a 60 % rise in the price of finger millet.
25
1000 t, rising to 4,000 t in 2012 and 6,000 t in 2013. Informally, Unga agreed to take all the finger millet it could get.
The LEAD project plays three roles: First, LEAD contracts Producer Organisations (POs) to produce and sell the required volume of finger millet to Unga. LEAD works with 11,000 POs in Uganda, with an average of 25 farmers in each PO. Focus is on staple food crops, including maize, sorghum, and millet. However, growers are not forced to sell their finger millet to Unga. Second, LEAD provided training to POs in millet production using Farmer Field Schools (FFS) and in collective marketing. After one year, the POS graduate and are run by trained lead farmers. LEAD also links the POs to input suppliers like Victoria Seed, and with seed traders. The POs also do trials of finger miller with researchers at Serere. They grow Seremi 1 and Seremi 2 finger millet varieties supplied by Victoria Seeds, a private seed company in Uganda. Third, LEAD facilitated a Memorandum of Understanding between Buyer, seller, the Bank, and LEAD. LEAD negotiated the “structured trade facility” provided by Equity Bank.
The World Food Programme (WFP) provided storage for finger millet in its Gulu warehouse. In 2009, only WFP had licensed warehouses. These are “licensed” because they meet certain standards and have insurance. The licence issued by the Ugandan Commodity Exchange (UCE). The warehouse cleans, dries, bags, and labels the finger millet and makes sure that it meets Unga’s quality specifications. As part of the UCE, the warehouse is licensed to issue receipts.
Equity Bank is Kenya’s largest bank in terms of market penetration and recently extended operations into Uganda by buying Uganda Microfinance Ltd. In the LEAD business model, Equity Bank provides a “structured trade facility” ie a loan based on the quantity deposited in the warehouse. Hence the commodity is the collateral for the loan. After the warehouse issues a warehouse receipt, Equity Bank advances 60 % of the floor price to the POs, which then distribute this to their members. After Unga pays for the finger millet, Equity Bank deducts the advance paid to growers, its fees and interest, and warehouse fees from the Unga payment, and pays the balance to the POs. The POs then distribute the net payments to their members.
7.2 Profitability
Unga Millers Ltd
Table 9 shows the costs for Unga Millers. The price of finger millet after transport from field to warehouse averaged 566,000 UGX/ton. Warehouse storage (including offloading, weighing, cleaning, etc) added 36,222 UGX/ton. The cost of shipping finger millet from Uganda to Nairobi (including rail costs, customs clearing, etc) averaged 237,028 UGX/ton. The C&F price of finger millet in Nairobi averaged 839,250 UGX/ton.

26
Figure 5: LEAD Project Business Model
Source: LEAD (2009).
Growers
Profitability for finger millet growers was estimated by LEAD at 16,000 UGX per 90 kg bag (Table 10). The cost-benefit ratio was 1.46. Of total production costs, inputs accounted for 9,702 UGX/bag (28 %), labour accounted for 24,300 (70 %), and transport from farm to warehouse 900 UGX/bag for 34,002 UGX/bag (2%). Labour costs for post-harvest were half of total labour costs.
Although selling finger millet through the LEAD Project was profitable for growers, the sale to Unga is based upon a contract price of $ 375-425 per t C&F Nairobi. As soon as the harvest period is over, however, millet prices increase rapidly with demand from local brewers. In 2009, for example, the millet price rose to 1,150 UGX/kg (+/- $ 500mt) with no requirement for quality / export documentation / transport (Perline, 2009: 29-30). With a price of 1,150 UGX/kg, the profitability for growers rose to 68,598 UGX per 90 kg bag compared to 16,038 UGX per 90 kg bag selling to Unga Millers. Thus, the benefit from the increase in production accrued primarily to Unga Millers Ltd, which purchased millet for cash immediately after harvest before prices rose.

27
Table 9: Unga Mills Ltd finger millet margins (2009).
Figures are Ugandan Shillings per ton of finger millet
Per ton (farm to store) Total cost (UGX/t) Percent Off truck to store price 566,000 67.44 Truck to scale 2,000 0.24 Weighing/Tallying 2,000 0.24 Scale to stack 2,000 0.24 Raw material to cleaner 2,000 0.24 Operating Cleaner 12,000 1.43 Bags 90 kg 7,222 0.86 Weighing 2,000 0.24 Stitching 2,000 0.24 Cleaner to stack 2,000 0.24 Weight loss - Fumigation 3,000 0.36 In store 602,222 71.76 Per ton (shipment to Nairobi) Ex store 602,222 71.76 Loading/offloading 2,250 0.27 Transport to rail 11,250 1.34 Handling COMESA certificate 25 0.00 Phytosanitary certificate 10 0.00 Certificate of origin 25 0.00 Clearing agent 1,125 0.13 Exporters margin 6,169 0.74 Estimated FOB Uganda 623,076 74.24 Transport to Nairobi (rail) 76,500 9.12 C&F Nairobi 839,250 100.00 Per 90 kg bag 75,540 Source: Reworked from Perline (2009)

28
Table 10: Partial budget for finger millet in Uganda, 2009
Figures in Ugandan shillings (UGX) per 90 kg bag
Revenues (UGX) Yield (kg) 90 Price (UGX/kg) 566 Gross benefits 50,940 Costs (UGX) Materials Seed 792 Fertiliser 4,860 Pre-ploughing herbicides 4,050 Subtotal 9,702 Labour Ploughing 9,900 Applying herbicides 900 Planting 2,250 Weeding 2,250 Bird scaring 1,800 Harvesting and threshing 2,700 Drying and cleaning 2,700 Transport to store 900 Packing 900 Subtotal 24,300 Transport to collection store 900 Total costs 34,902 Net benefits 16,038 Benefit-cost ratio 1.46 Source: Reworked from Perline (2009).
7.3 Inclusion
The LEAD M&E database provided information for 37 producer organisations in Bukedea and Kumi districts linked to the finger millet value chain. The total membership was 847 members, of whom 383 members (45 %) were female. Of these 847 members, 527 (62 %) were finger millet growers. No figures were available for the share of male and female farmers growing finger millet, or the average quantity sold per grower.
8. Comparative Performance
In this section we evaluate the performance of these three business models in terms of their design, profitability, and inclusiveness.

29
8.1 Design
Table 11 compares the three case-studies along two axes: the business model (Figure 1), and the main driver in the business model (Table 1). Table 11: Comparison of case studies
Business Model/Driver
2 3 4 5 Individual
Smallholders in Spot Markets
Organised Smallholders in Spot Markets
Contract Farming Integrated Agribusiness
Producer-driven
Lesiolo Grain Handlers Ltd.
Buyer-driven Smart Logistic Solutions Ltd.
Intermediary-driven
Livelihood and Enterprise
Development (LEAD)
Lesiolo Grain Handlers Ltd. The WRS operated by LGHL fits Model 3, where organized smallholders sell in spot markets. Smallholders may use the WRS individually but, as we have seen, organized smallholders have an advantage because they can meet the threshold for storage (10 t) and have lower transaction costs. The weakness of this design is that it is producer-driven. Performance depends on the ability and willingness of growers to use the WRS. Unfortunately, experience so far suggests that this has not been forthcoming. In 2011, LGHL stored approximately 80,000 t of grain, of which 50,000 t (63 %) was barley, 20,000 t (25%) was wheat, and 10,000 t (12%) was maize. No sorghum or millet was stored. The WRS operates only for wheat and maize. Of the 30,000 t of wheat and maize stored, only 800 t (3 %) entered the WRS. Most of this came from three clients:
1. Gogar Farm, Kabarak, a large commercial grower. 2. Menengai Feed Lots, growers but also traders buying from smallholders. 3. Five farmer groups, averaging 10 members each, who deposited 600 t.
Depositors only use the WRS if they require cash to meet immediate financial obligations. However, the majority of clients depositing grain require only storage. Most clients storing grain are not growers but traders who sell when prices rise. The 600 t entering the WRS from five farmer groups is too large a quantity to represent own production. This suggests that these farmer groups also operate as traders, buying grain from other smallholders after harvest. The small number of farmer groups using the WRS reflects barriers to access faced by smallholders. As we have seen, these include the minimum threshold required, distance from the warehouse, and lack of knowledge about how the system operates.

30
Smart Logistics Solutions Ltd Smart Logistics uses a Contract Farming model, in which organized groups (COBOs) are supplied with seed and technical advice, receive a fixed price, and deliver the crop for bulking and delivery to the buyer. This has proved a robust design. Within a short period of time, it has allowed Smart Logistics to expand its scale of operations, invest in infrastructure, and increase participation from sorghum growers. The strength of this design is that it is buyer-driven. Sorghum is used as an adjunct with barley to produce malted beer, and to produce un-malted sorghum beer. Since malted beer in Kenya is heavily taxed, un-malted sorghum beer is cheaper than malted beer made from barley. This allows EABL to market sorghum beer for consumers wishing to ‘trade-up’ from traditional home brews. The market for sorghum beer in Kenya is large, and growing. EAML estimated its current demand for sorghum for beer at 36,000 tons. Of this, the greatest demand was in Kenya (25,000 t), followed by Uganda (8,000 t) and Tanzania (3,000 t). Demand is expected to increase in future. By 2015, EAML targets a demand of 45,000 t of sorghum from Kenya only. To date, EABL has not been able to meet its demand for sorghum. In 2011, EAML only acquired 17,000 t of sorghum for EABL, which was 8,000 t short of the target demand of 25,000 t. Of this, only 4,000 t (24 %) came from Kenya and the rest from Tanzania and Uganda. Large, commercial farms in Kenya prefer growing barley or wheat to sorghum, because of the risk of yield losses from birds and the high cost of weed management. Thus, there is a strong business case for EAML to buy locally (avoiding import taxes) and buy from smallholders. The weakness of the design is that contracts are non-enforceable. Smart Logistics contracts with producer groups to buy not a specified quantity of sorghum, but as much sorghum as they can produce and are willing to sell. However, the quantity of sorghum supplied is well below that which Smart Logistics has contracted to supply to EAML. For example, in 2011 Smart Logistics supplied only 2,000 t, or 12 % of the total sorghum purchased by EAML. Non-enforcement of contracts with growers reflects the role of sorghum in the farming system. Although there is some side-selling of sorghum by producer groups to traders (who pay cash up-front), the main reason for low and variable supply is that sorghum is so important for household food security. Like many other farmers, Munyau says it does not make sense to sell her grain when the countryside is expecting drought in the next few months. "I will not go begging for food and alms from humanitarian organisations for my children to eat… That is why I will make sure that I have at least three bags of sorghum in my house at any time." (Esipisu, 2011). The LEAD project Like Smart Logistics, the LEAD project also used a Contract Farming model. However, the LEAD business model proved unworkable. Despite strong market demand for finger millet, the LEAD model never succeeded in delivering finger millet to Unga Mills Ltd. The explanation for this failure lies in the driver of the business model. The LEAD project was intermediary-driven. The original vision for LEAD was buyer-driven, and determined by the need by Unga Millers Ltd to assure its supply of finger millet. The original business plan envisaged production by a nucleus estate that would sub-contract smallholder out-growers. However, Unga Mills was only one partner in the project, which was managed by a

31
consultancy reporting to USAID. Two decisions made by the LEAD management team resulted in a very different business model. First, LEAD decided to use WFP warehouses for storage. Unfortunately, WFP headquarters in Rome would not agree to a legally binding contract for receipt of the finger millet, because of the risk of losses when the millet was sold. This ruled out a partnership with Equity Bank, which required a contract with WFP before it could provide credit to POs. This decision was probably made because (1) WFP had the only licensed storage warehouses in Uganda, and was licensed to issue warehouse receipts and (2) WFP is the single-largest buyer of quality grain in Uganda under its Purchase for Progress (P4P) initiative, which links small farmers to domestic and regional markets (3) the P4P initiative was also financed by USAID, which is the largest single donor to the WFP. The result of this decision was to delay the production of finger millet by one year. Inspired International, a private company, was then contracted to set up a standard forward contract with Equity Bank. Second, LEAD decided to contract Cereals Uganda Ltd as the grantee that would bulk and store finger millet produced by farmer groups. Originally, LEAD was conceived as a competitive award that would be granted to a private company willing to invest in finger millet production. Although several large Ugandan companies expressed interest, the grant was awarded to Cereal Uganda Ltd, a small company based in Kumi, but with close links to WFP. Cereals Uganda was contracted to buy and install drying and processing equipment for licensed warehouses in Torero and Busia, which are close to the Kenya border. However, Cereals Uganda Ltd was unable to complete construction of the warehouses. The result was that no finger millet was stored for delivery to Unga Millers through the LEAD project.
Profitability
Because of differences between, years, crops, and countries, we cannot compare the relative profitability of each business model for growers. However, Figure 6 shows that:
1. The WRS model was profitable for maize growers, compared to the alternatives of selling grain immediately after harvest or storing on-farm for two months. Seasonal price changes for sorghum are lower than for maize, which can double in price in the six months after harvest.
2. The seasonal price rise for sorghum (21 %) is much lower than for maize (100 % plus). Consequently, there is little incentive for sorghum or millet growers to use the WRS. However, on-farm storage for two months would benefit growers.
3. The Smart Logistics model was more profitable for growers than selling to brokers immediately after harvest. Buying prices for Smart Logistics were six-seven times higher than spot market prices.
4. The LEAD model was profitable for growers, but less profitable than storing until demand from local brewers raised prices. However, selling immediately after harvest to Unga Mills is probably more profitable than selling to brokers. Unfortunately, we have no data on the prices paid by brokers at harvest.

32
Figure 6: Profitability of three business models for growers
Figures are in current US $ per 90 kg bag of grain
The three case studies show no clear link between profitability and the performance of the business model. Although the WRS is highly profitable for maize growers, LGHL reported limited demand for this service. Similarly, although selling finger millet to Unga Millers Ltd was profitable for growers, the design of the business model made it unworkable. In the case of Smart Logistics Ltd, the business model is profitable, and this has increased the volume of sorghum produced and offered for sale. However, profitability is only one factor determining the performance of the business model. The design of the Smart Logistics model, which is market-driven, is equally important. Profitability is a necessary but not a sufficient condition for a successful business model.
Inclusion
All three business models are inclusive, in the sense that they involved participation by smallholders rather than commercial growers, and involved participation by women. The participation rate for women in the study of the WRS by Mutai (2011) was 38 %, 65 % of the farmer groups supplying Smart Logistics were all-women groups, and 45 % of the members of the Producer Organisations supplying finger millet were women. However, smallholders are not a homogeneous group, and the quantity of sorghum or millet supplied may vary considerably from farmer to farmer. Unfortunately, we lack information on the average quantity supplied per
4
11
29
2
14
7
30
0
5
10
15
20
25
30
35
Instant sale Own storage Warehousestorage
Broker East AfricaMaltings Ltd
UNGA Ltd LocalBrewers
Warehouse Receipt System (maize)(2009)
Smart Logistics (sorghum)(2011)
UNGA Mills (finger millet)(2009)
USD
/90
kg b
ag

33
grower. This information is essential to establish the extent to which poorer smallholders participate.
Overall, the results suggest that inclusion depends on whether smallholders are members of producer groups. All three business models depend on the existence of farmer groups, either to reach the minimum threshold required for storage (LGHL), for collective production of the crop (Smart Logistics), or for provision of inputs and bulking to reduce transaction costs (Smart Logistics, the LEAD project).

34
References
Barratt, C. B., Bachke, M. F., Michelson, H. C., Narayan, S., and Walker, T. F. (2012).
Smallholder Participation in Contract Farming: comparative evidence from Five
Countries, World Development, 40 (4): 715-730.
Coulter, J., and Onum, G., (2002). The role of warehouse receipt systems in enhanced
commodity marketing and rural livelihoods in Africa. Food Policy, p. 319–337.
Esipisu, I. (2011). Sorghum Proving Popular with Kenyan Farmers. Inter Press Service News Agency. http://www.ipsnews.net/2011/05/sorghum-proving-popular-with-kenyan-farmers/
Haggblade, S., Theriault, V., Staatz, J., Dembele, N., and Diallo, B. (2012). A Conceptual
Framework for Promoting Inclusive Agricultural Value Chains. International Fund for
Agricultural Development (IFAD). Mimeo, 35 pp.
Hall, A., Clark, A., and Frost, F. (2010). Bottom-Up, Bottom-Line: Development-Relevant
Enterprises in East Africa and Their Significance for Agricultural Innovation. Research
Into Use. Discussion Paper 02. July. Mimeo, 41 pp
International Livestock research Centre (ILRI) (2010). Value chains, linking producers to
markets. Livestock Thematic Papers. http://www.fcrn.org.uk/research-
library/meat/livestock/ifad-livestock-thematic-papers
LEAD (2011). Facilitating Smallholder Farmers’ Access to International Markets. PowerPoint
Presentation. 4 October.
Mutai, (2011). Farmers’ Participation and Performance analysis of Grain Warehouse Receipt
System in Nakuru District, Kenya. M.Sc. Thesis (Agricultural and Applied Economics),
Egerton University, Kenya.
Neven, D., Odera M. M., Reardon, T., and Wang, H. (2009). Kenyan supermarkets, Emerging
Middle-Class Horticultural Farmers, and Employment Impacts on the Rural Poor, World
Development, 37(11): 1802-1811.
Osterwalder, A. (2006). Business Model Template.
http://www.slideshare.net/Alex.Osterwalder/business-model-template

35
Rao, E. J. O. and Quaim, M. (2011). Supermarkets, Farm Household Income and Poverty:
Insights from Kenya, World Development, 39 (5): 784-796.
Vorley, B., Lundy, M., and MacGregor, j. (2009). Business Models that are Inclusive of Small Farmers, Agro Industries for Development (CAB International: Wallingford). pp. 186-222.
Perline, R. J. (2009). Final report: Millet Outgrower Scheme. INSPIRED Associates Ltd. June.
Mimeo, 33 pp.
Regional Agricultural Trade Intelligence Network-RATIN (2012). Grain prices (Maize, Sorghum and Millet). http://www.ratin.net/
Seville, D., Buxton, A., and Vorley, B. (2011).Under what conditions are value chains effective
tools for pro-poor development? London: International Institute for Environment and
Development.
USAID (2011). A Comparison of Models Enabling Smallholder Producers of Staple Foods to
Access Commercial Markets in East Africa. COMPETE Project, Nairobi. Mimeo, 27 pp.
World Food Programme (2011). WFP 2008-2013 Purchase for Progress (P4P) Initiative: A
Strategic Evaluation (mid-term).
http://documents.wfp.org/stellent/groups/public/documents/reports/wfp241809.pdf
.

36
Appendix 1: List of persons met or contacted
No. Name Position 1 Dale Wiest Operations Manager Unga Mills Ltd.
2 Leah Tuitoek Procurement Manager, Unga Mills Ltd
3 John Fitzgerald Financial Manager, LEAD
4 Peter Wathum M&E, LEAD
5 Gaudensia Kenyangi Agricultural Development Specialist, USAID, Uganda
6 Steve Humphries Staple Foods Component Leader, USAID/COMPETE, Nairobi
7 David Kinuthia Agribusiness Manager, EABL
8 Peter Wanjohi Sales Assistant, CIMBRIA East Africa Ltd (grain silos) 9 Marcel Wambua Head of Finance, Lesiolo Grain Handlers Ltd 10 Julius Mutai formerly Dept. of Agricultural Economics, Egerton University 11 Rose Mutuku CEO, Smart Logistics Solutions Ltd 12 Sylvester Ndeda Sorghum project manager, EAML 13 Paul Muthangya International Coordinator, EUCORD
14 Gideon Matandi Farmer, Wendo wa maliku Self Help Group
15 Eunice Mutethya Farmer, Walanyo Self Help Group
16 Musangi Mwaniki Farmer, Walanyo Self Help Group
17 Regina Sammy Farmer, Kalimani Self Help Group