income convergence and growth in alabama:...
TRANSCRIPT
Income Convergence and Growth in Alabama: Evidence from Sub-county Level Data
Authors
Buddhi Raj Gyawali, Research Assistant Professor, Department of Agribusiness, P. O. Box 323, Alabama A &M
University, Normal, AL 35762. Email: [email protected]
Rory Fraser, Professor, Forestry, Wildlife, and Ecology program, P.O. Box 1927, Alabama A &M University,
Normal, AL 35762, Email: [email protected]
Ban Banerjee, Assistant Professor, Department of Agribusiness, P.O. Box 323, Alabama A &M University,
Normal, AL 35762, Email: [email protected]
James Bukenya, Associate Professor, Department of Agribusiness, P. O. Box 323, Alabama A &M University,
Normal, AL 35762, Email: [email protected] Selected Paper prepared for presentation at the Southern Agricultural Economics Association
Annual Meeting, Atlanta, Georgia, January 31-February 3, 2009
Copyright 2009 by Buddhi Gyawali, Rory Fraser, Ban Banerjee, & James Bukenya. All rights reserved. Readers may make verbatim copies of this document for non-commercial purposes by
any means, provided this copyright notice appears on all such copies.
2
Income Convergence and Growth in Alabama: Evidence from Sub-county Level Data
ABSTRACT
1980 and 2000 Census Block Group (CBG) data were used to examine income convergence in all Alabama counties vis-à-vis Alabama’s Black Belt and Northwest regions. Though all three models demonstrated conditional income convergence, CBGs with smaller initial populations, smaller changes in African-American or dependent age populations had higher income changes.
KEYWORDS:
African-Americans, Alabama, Black Belt, Census Block Groups, Income Convergence
INTRODUCTION
Income convergence is one of the major indicators of regional economic development
(Solow 1956; Cass 1965; Koopmans 1965). Large differences in income are considered
undesirable for balanced or equitable economic development (Sen 1992). Substantial research
has been conducted to determine whether there is convergence or divergence in regional
economies over time. These studies were designed to track the growth of local economies and
assess their pace and progress in achieving national economic growth levels. Previous research
suggests the existence of income convergence (Barro and Sala-i-Martin 1992) and in some cases,
income divergence across the United States (Mankiw, Romer, and Weil 1992). Some of the
empirical evidences (Barro and Sali-i-Martin 1995; Cole and Neumayer, 2003) contradict
Neoclassical growth theorists’ (Baumol 1986) prediction that poorer economies grow at a faster
rate compared to the richer economies to reach the equilibrium levels. Variations in the results of
these studies may be due to the differences in economic characteristics of regions since it has
3
been difficult to meet that “studied regions” maintain the same steady state, a fundamental
condition for determining the existence of income convergence. Other sources of variations may
have been differences in the spatial characteristics across regions and difficulties in capturing
these interregional variations of the “studied regions”. That is most of the “income convergence
studies” thus far have been conducted at larger geographic scales such as county, region, state, or
national levels. These studies did not address clustering of the communities based on similarities
in physical geography and socio-economic characteristics. The concentration of primary
resources, such as farmland and forests or agglomeration in the manufacturing sector, was
inadequately addressed.
OBJECTIVES
This study explicitly examines income convergence at the Census Block Group (CBG)
level in Alabama. The CBG is the lowest unit for which the U.S. Census Bureau makes its data
available to the public. Three fundamental objectives were to: (1) examine income convergence
in Alabama between 1980 and 2000, (2) identify predictors of income growth over the period
1980-2000, and (3) Compare and contrast income growth and its predictors at the sub-county
level between entire CBGs in Alabama, CBGs in the West-Central Black Belt region (African-
American-dominant counties) and CBGs in Northwest Region of Alabama (white-dominant
counties).
The historical events in Alabama have produced differing impacts and regional variations
across the state. There are significant contrasts between Black Belt region and Northwest region
in demographics such as race, population density, education, and industrial firms and jobs and
growing urban structures. This study is aimed at eliciting the role of these variations in income
4
growth using the data available at the sub-county level, which is the first known effort in the
southern United States.
The rest of the paper is organized into six sections. Section two provides a summary of
the literature in income convergence. Section three provides important details of the study area
and the data used in the study. Section four is an explanation of empirical model of income
convergence. Section five presents the results of a regression model. Lastly, section six provides
the conclusions.
LITERATURE REVIEW
Income convergence is the narrowing of differences in incomes across a region or
country over time (Barro and Sala-i-Martin 1992; Mankiw et al. 1992). Empirical studies have
identified examples of income convergence (Coelen 1978; Barro and Sala-i-Martin 1991; Crown
and Wheat 1995). However, others (Chatterji 1992; Quah 1996; Pritchett 1996) contend that
modern economic growth display significant divergence in per capita incomes between rich and
poor countries, an increasing gap which is incessantly widening. This empirical global evidence
contradicts Neoclassical growth theorists’ (Baumol 1986; Barro and Sali-i-Martin 1995)
predictions of “absolute or beta (β) convergence” (Cole and Neumayer 2003). That is poorer
economies grow at a faster rate as compared to the richer economies if they have the same steady
state per capita income growth path. Absolute convergence is most often not possible because
differences in technology, availability of initial capital, resource potentials, and other human and
cultural factors not allow for the identical and balanced growth paths across regions; a pre-
condition for absolute convergence (Sala-i-Martin 1996). Also, structural characteristics of
regional economies including differences in labor force structure and public policies create
5
different steady states along the growth path of sub-regions. In such cases, conditional
convergence prevails (Cole and Neumayer 2003). Conditional convergence occurs when poor
economies grow faster because differences across the region are controlled (Sala-i-Martin 1996).
Numerous country or regional studies have reported evidence of income convergence in
the U.S. (Evans and Karras 1996; Austin and Schmidt 1998; Tsionas 2000; Latzko 2002; Janikas
and Rey 2005; Higgins, Levy, and Young 2006). Barro and Sala-i-Martin (1991, 1992, and
1995) have conducted many studies to explain convergence of per capita income across US
states and regions and across the world. These studies reported the prevalence of income
convergence in the US during most of 1889 to 1988 period. Two decades, the 1920’s and 1980’s
were the exception. In those decades, income divergence was recorded. Convulsions in
agriculture in 1920s and the collapse of oil prices in the 1980s were the reasons identified for
income divergence. Similarly, in a comparative study between the USA and Japan, Barro and
Sala-i-Martin (1995) estimated convergence rate of 1.9% for the 48 contiguous US states, which
was lower than the 2.79% rate for Japanese prefectures. In another study of 110 countries’
economic growth, Sala-i-Martin (1996) found a 2% annual conditional convergence rate when
secondary school enrollment, saving rate, and political variables were controlled. Kim (2005)
found conditional convergence rate of 8% a year in 13 regions of Korea based on per capita
income changes over the period 1985-2002. This study reported a significant positive effect of
investment rate in physical capitals and a significant negative effect of population growth on the
growth rate of per capita income. The study did not find a significant relationship between
growth in per capita income and the rate of human capital growth. In contrast, Drennan, Tobier
and Lewis (1996) found divergence in the median family income in the 1980s in the 51 largest
US cities for all households versus black households. Their results suggested that cities with
6
larger service sectors had much better growth rates than cities more specialized in
manufacturing.
The results of these studies, particularly Evans and Karras (1996) and Higgins et al.
(2006) have come into question because of model specification problems. These studies, which
were mostly conducted at larger geographical areas such as counties, regions, state or national
level, assumed each observation unit was independent. Researchers such as Rey and Montouri
(1999), Lim (2003), Janikas and Rey (2005), Shelnutt and Yao (2005), and Coughlin et al.
(2006) contend that the unit of observation such as countries, states or regions are politically
defined boundaries rather than economic boundaries. Labor movement, commuting patterns,
trade flows, presence of industries, access to the highways, public policies and resources
allocations can link economies of these areas together despite their political jurisdictions. Under-
representing the potential interactions between such economic units (or units of observations) in
an empirical model may lead to incorrect inferences regarding the magnitude and significance of
predicting variables (Anselin 1988; Haining 1990; Janikas and Rey 2005).
Janikas and Rey (2005) contend that clustering across US states masks important internal
socio-economic dynamics. Therefore, the effects of the clustering needs to be detected to
understand what occur within individual state economies. The use of disaggregated Census
Block Group level data may address such data aggregation issues.
Previous Studies in South
Studies in the southern United States suggest that these states differ from northern
regions in population dynamics, industrial structure, and job growth. The persistence of
unemployment, lower wages, and low mobility of workers in the South may be due to the
7
inability of these regions to absorb specific shocks, be they from the demand or supply side
(McLaughlin and Stokes 2002; Albrecht et al. 2005). The adjustment process in economy may
also take longer period in south due to differences in unemployment, human capital, and income
growth which will slow down the equilibrium process of economy across the region. Such
phenomena can be observed in Alabama if we closely look disparities that are occurring across
different geographic regions.
In general, the characteristics of the U.S states suggest a set of economies in which there
exists nearly complete free trade and mobility of factors, and nearly identical forms of
government. Due to such advantage, many of the conditions for income convergence prevail
strongly. In support to this argument, Barro and Sala-i-Martin (1991, 1992) found support for
conditional convergence across both regions of Western Europe and U.S. States. The studies
found that Northeast, Midwest, Great Lakes, and Far West regions typically have per-capita
incomes above the national average, while the Plains, Southeast, Southwest, and Rocky
Mountains regions typically lie below the national average.
Crown and Wheat (1995) conducted a study on state per capita income convergence
using 1950-1987 data. The study found that South is catching up the income growth of Northern
States. The authors found that income convergence in the South resulted from the South’s
overcoming of its legacy of slavery, agricultural dependence, high Black population percentages,
poor education, and low wage rates. High South-to-North migration contributed to raise incomes
in the south. The study found that growth in manufacturing and transportation caused decline in
the relative income in the Western United States.
Crown and Wheat (1995) reports that in 1950, all ten southern states (West Virginia,
North Carolina, South Carolina, Georgia, Kentucky, Tennessee, Alabama, Mississippi, Arkansas,
8
and Louisiana) were more than 25 percent below the national average income. However, after
1950, the income gap between southern and non-southern states closed rapidly. The south’s
income growth increased by 161%. The authors also found that State income inequality
increased between 1978 and 1988 because of the regional income boom in the Northeast, the
farm crisis of the 1980s, and the decline in energy prices in the post 1980 economic depression.
STUDY AREA
The majority of the studies on US income convergence are based on the States or multi-
state aggregate data, with few examinations in metropolitan areas and counties (Hammond
2005). This study employs data available at the sub-county level. The area chosen for this study
consists of entire sixty-seven counties of the State of Alabama. The study analyzes income
convergence and growth separately for Black Belt and Northwest Region and compares the
results with entire Alabama. Predominant African American counties were selected from the
west-central Region of Alabama (hereafter Black Belt Counties) and predominant white counties
were selected from Northwest Region of Alabama (hereafter Bankhead Region). These regions
were selected because they represent the largest contiguous group of Black-dominant and white-
dominant counties in Alabama and indicate high contrast in demographic, urban structure and
industrial jobs.
State of Alabama
State of Alabama consists of 67 counties bordering to Tennessee, Georgia, and Florida in North,
Northeast to Southeast, Gulf of Mexico in the South and Mississippi in the Southwest to North
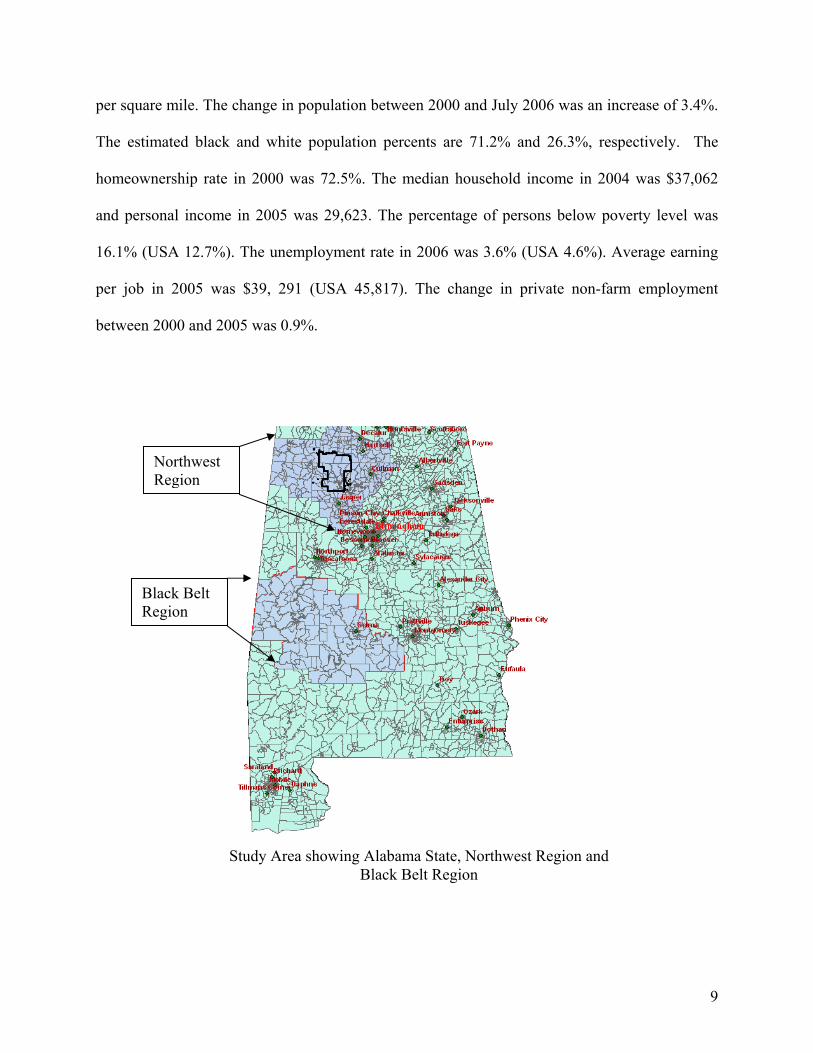
West. The total population (2006 estimates) is 4,599,030 with the population density 88 persons
9
per square mile. The change in population between 2000 and July 2006 was an increase of 3.4%.
The estimated black and white population percents are 71.2% and 26.3%, respectively. The
homeownership rate in 2000 was 72.5%. The median household income in 2004 was $37,062
and personal income in 2005 was 29,623. The percentage of persons below poverty level was
16.1% (USA 12.7%). The unemployment rate in 2006 was 3.6% (USA 4.6%). Average earning
per job in 2005 was $39, 291 (USA 45,817). The change in private non-farm employment
between 2000 and 2005 was 0.9%.
Northwest Region
Black Belt Region
Study Area showing Alabama State, Northwest Region and Black Belt Region
10
Role of Industries in Alabama
Alabama is one of the top five states in the United States for favorable business climate.
Also, Alabama is considered number one in the nation on corporate diversity. In Alabama, paper,
chemicals, rubber and plastics, apparel and textiles, and automobile manufacturing industries are
major sectors for jobs and for the state’s revenue. Birmingham is considered for major
manufacture of coal, iron and steel. The state ranks high in the production of poultry, soybeans,
milk, vegetables, livestock, wheat, cattle, cotton, peanuts, fruits, corn and hog.
Alabama’s industrial boom began in the 1870s with the exploitation of the coal and iron
fields in the north. Birmingham became a leading industrial city in the South, producing iron
more cheaply than its American and English competitors. Development of ports and power
plants along the Tennessee River was the primary stimulus to the expansion of manufacturing
sector.
By the 1970s, the older industries were clearly in decline, but Birmingham received a
boost in 1984 when U.S. steel announced it would spend $1.3 billion to make its Fairfield plant
the newest fully integrated steel mill in the nation. In 1997, Mercedes Benz began manufacturing
its sport utility vehicle at a new facility in Vance. Other automobile plants, Hyundai and KIA
have established their auto plants in Southern Alabama. Two major auto-manufacturing plants
(Mercedes-Benz and Hyundai) now generate 10% of the state’s manufacturing gross-state
product. In 2003, the auto industry in Alabama accounted for 96,200 jobs, of which two-thirds
are in southern Alabama (Auto Alliance 2003).
The principle employers among industry groups are food and textile mill products,
apparel, primary metal industries, industrial machinery and equipment, electric equipment, and
transportation equipment. The electrical machinery and computer and transportation equipment
11
in Alabama are typically exported to Canada, Mexico and Germany. The value of manufacturing
shipments in 1997 equaled $69.7 billion, with a 31.9% growth from 1992. Alabama was found
directly in the middle of states ranked by growth in manufacturing. Mineral industries grew at
rate of 65.4% from 1992 to 1997, to $12.6 billion of business done during 1997.
Earnings of persons employed in Alabama increased from $63.8 billion in 1997 to $66.9
billion in 1998, an increase of 4.9%. The largest industries in 1998 were services, 23.2% of
earnings; state and local government, 12.5%, and durable goods manufacturing, 12.1%. Of the
industries that accounted for at least 5% of earnings in 1998, the slowest growing from 1997 to
1998 was transportation and public utilities (6.6% of earnings in 1998), which increased 7.7%
(Alabama Industry 2008).
Role of Forest-based Industries
Alabama is blessed with the presence of natural forests, rivers and creeks and laborious
people that all have contributed growth of forest industry within the State. As a result, forest
product industry is the number one manufacturing industry in Alabama today. The region is one
of the largest timber producing and exporting state in the U.S. Timber is the dominant crop
harvested in 34 counties with a value at the first delivery point at over $1 billion. In total, Nine
billion dollars worth of forest products are produced in Alabama each year.
Alabama contains the nation’s second largest area (21.6 million acres) of commercial
forest. There are 167 primary forest manufacturing facilities in the State; of these, 98 are
sawmills, 19 are plywood or veneer mills, and 14 are pulp and paper mills (Alabama Forestry
Commission 2007). Much of this forest is located in Alabama’s west-central region which was
12
expected to grow faster due to higher paying industrial jobs, capital accumulations, and human
capital development (Joshi et al. 2000).
Forest industries in Alabama play enormous role in economy. Alabama’s forests and
forest based industries contribute over $5 billion to the State’s annual economy. It generates
employment for 66,800 people. They have an annual payroll of over $1.7 billion. Despite one of
the largest timber producing and automobile industry state in the US, the state is ranked the third
poorest state of the Nation.
Northwest Region of Alabama
The northwest region of Alabama includes seven predominantly white counties (>50% of
white population). The William B. Bankhead National Forest (BNF) is located in this region.
The BNF was once a part of the diverse mixed hardwood forest, very common to the
Cumberland Plateau, which have provided economic opportunities and raw material to the
forest-based industries in the region. The Courtland paper mills in Laurence county employs
approximately 400-500 people. Likewise, other industrial plants such as General Electric
Company and Brownsferry nuclear plant in Morgan County provide jobs for 2000 people. A
trailer factory in Winston county is another employer for local people. Walker, Morgan and
Laurence counties have industrial parks. In Winston county most of the landowners are forest
landowners and logging job has been increased considerably.
Black Belt Region
Southwest Region constitutes of eight contiguous pre-dominant African American
counties in the west central region of Alabama (which are also called Black Belt Counties).
13
These counties are economically and racially segregated differentiated by disparities in income,
population distribution, resource allocation, and human capital development (Schelhas et al.
2003). The Black Belt counties of west-central Alabama are of special interest because of the
majority presence (67%) of minority populations (26% in Alabama) (African-Americans). One
can assume that after the significant civil rights and welfare reforms of the 1960s in this eight
county area, African-Americans wield their highest level of political and administrative influence
in the state and, therefore, individually or collectively have a greater likelihood of achieving
equal or higher levels of economic growth in the region.
EMPIRICAL MODEL
We follow the empirical framework of Mankew et al. (1992), Sala-i-Martin (1996) and
Rey and Montouri (1999) to explore income convergence and income growth factors in
Alabama. The following equation was used to test for the conditional income convergence:
titiitititi Xyyy ,1,1,01,, )(lnlnln εββα +++=− −−− (1)
Where 1,, lnln −− titi yy is a natural logarithm of a CBG i’s per capita income growth for a time
period between t and t-1, 1,ln −tiy is the natural logarithm of region i’s average per capita income
in the initial year. 1, −tiX is a vector of growth in explanatory variables. The conditioning factors
are initial and changed conditions of population, race, education, age structure, and firms and
jobs growth that control per capita income growth and βi is a vector of Xi parameters. ti,ε is an
error term.
14
The existence of the conditional convergence or divergence for per capita income growth
is determined by the sign and magnitude of β0. A negative estimate for β supports the conditional
income convergence suggesting that the growth rates in per capita income over the period are
negatively related with initial per capita income levels. The empirical model of neoclassical
growth model (such as Solow 1956) is that once the determinants of steady-state per-capita
income have been controlled for, economies show convergence. At a point in time there exists a
negative relationship between initial log per-capita income and rates of growth. Given its
dependence upon the factors determining the steady state, Mankiw, Barro and Sala-i-Martin,
refer to this form of convergence as conditional convergence (Loewy and Papell 1996).
Steady state differences on educational attainment, industrial mix, and other structural
factors are common in the southern United States. One of the causes for disparity between rural
and urban growth has been attributed to the industrial composition often found in rural areas. The
specialization of rural areas in farming, mining, and in some cases manufacturing, in contrast to
the urban places has been discussed in previous studies. Generally in south, agriculture and
natural resource sectors have been hit by competitive pressures and unfavorable commodity price
swings since the 1970s. Manufacturing sector has been affected most by competitive pressure
during the period, both from domestic and from international sources. The result has been
declining employment and income levels related to these industries (Hammond 2005)
Unit of Analysis: Census Block Groups
The empirical model is based on the cross-sectional regression analysis. The cases are
3,327 CBGs (for entire 67-states Alabama), 234 CBGs (for Northwest Region) and 161 CBGs
(for Black Belt Region). The dependent variables in all models were the natural logs of the ratios
15
of per capita income in 2000 to real (in 2000 dollar value) per capita income in 1980 for each
CBG. The CBG is the lowest unit for which the U.S. Census Bureau makes its data available to
the public (Geolytics 2004). Typically, CBGs range between 600 and 3,000 people, with an
optimum size of 1,500 people (U.S. Census Bureau 2007). Compared to larger geographical
units, CBGs tend to be relatively homogeneous internally with respect to demographics,
economic status, and living conditions. The geographic boundaries of CBGs may change from
one census to another. Data available for these units are not suitable for comparative analysis
over time unless they are normalized to maintain the same boundaries in each census. Recently,
Geolytics Inc. made available the 1980 census data normalized (weighted) to the 2000
boundaries and these data have been widely used for comparative study (Crandall and Weber
2004)1.
1 For details information on normalization process, please visit http://www.geolytics.com/USCensus,1980_in_2000_Boundaries,Products.asp
16
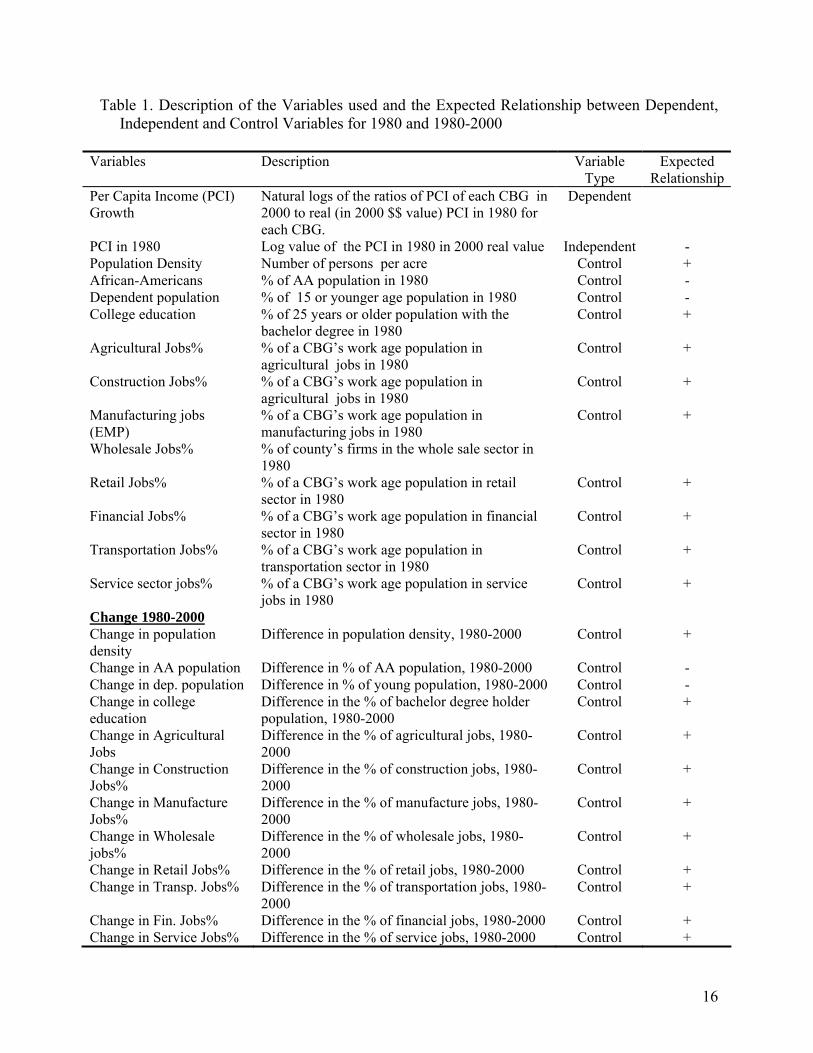
Table 1. Description of the Variables used and the Expected Relationship between Dependent, Independent and Control Variables for 1980 and 1980-2000
Variables Description Variable
Type Expected
RelationshipPer Capita Income (PCI) Growth
Natural logs of the ratios of PCI of each CBG in 2000 to real (in 2000 $$ value) PCI in 1980 for each CBG.
Dependent
PCI in 1980 Log value of the PCI in 1980 in 2000 real value Independent - Population Density Number of persons per acre Control + African-Americans % of AA population in 1980 Control - Dependent population % of 15 or younger age population in 1980 Control - College education % of 25 years or older population with the
bachelor degree in 1980 Control +
Agricultural Jobs% % of a CBG’s work age population in agricultural jobs in 1980
Control +
Construction Jobs% % of a CBG’s work age population in agricultural jobs in 1980
Control +
Manufacturing jobs (EMP)
% of a CBG’s work age population in manufacturing jobs in 1980
Control +
Wholesale Jobs% % of county’s firms in the whole sale sector in 1980
Retail Jobs% % of a CBG’s work age population in retail sector in 1980
Control +
Financial Jobs% % of a CBG’s work age population in financial sector in 1980
Control +
Transportation Jobs% % of a CBG’s work age population in transportation sector in 1980
Control +
Service sector jobs% % of a CBG’s work age population in service jobs in 1980
Control +
Change 1980-2000 Change in population density
Difference in population density, 1980-2000 Control +
Change in AA population Difference in % of AA population, 1980-2000 Control - Change in dep. population Difference in % of young population, 1980-2000 Control - Change in college education
Difference in the % of bachelor degree holder population, 1980-2000
Control +
Change in Agricultural Jobs
Difference in the % of agricultural jobs, 1980-2000
Control +
Change in Construction Jobs%
Difference in the % of construction jobs, 1980-2000
Control +
Change in Manufacture Jobs%
Difference in the % of manufacture jobs, 1980-2000
Control +
Change in Wholesale jobs%
Difference in the % of wholesale jobs, 1980-2000
Control +
Change in Retail Jobs% Difference in the % of retail jobs, 1980-2000 Control + Change in Transp. Jobs% Difference in the % of transportation jobs, 1980-
2000 Control +
Change in Fin. Jobs% Difference in the % of financial jobs, 1980-2000 Control + Change in Service Jobs% Difference in the % of service jobs, 1980-2000 Control +
17
RESULTS
Descriptive Statistics
Table 2 provides the descriptive statistics of the major variables. Comparison of the
descriptive statistics for Alabama and the two regions provide some indications of income
convergence in the state. The average Per Capita Income (PCI) for both the Northwest and Black
Belt CBGs were lower than the average PCI for the state’s CBGs in both 1980 and 2000.
However, the average (positive) change in both regions were higher than the state’s, with the
Black Belt showing the highest (33%) change after starting with the lowest of the three PCIs.
These positive income changes are reflected in the reduction of poverty levels, with the highest
reduction (-14%) occurring in the Black Belt. The higher rate of income growth in the Black Belt
seems to have come in response to the highest increase (91%) in the average percent of high
school educated population and a higher level of college educated population. This change also
occurred, despite a reduction (-8%) in average employment in the Black Belt which had the
lowest employment rate and lowest increases in college educated population. Some of the
increases in PCI in the state and the two regions must have come from the reduction in the
average percentages of dependent age populations in the CBGs.
18
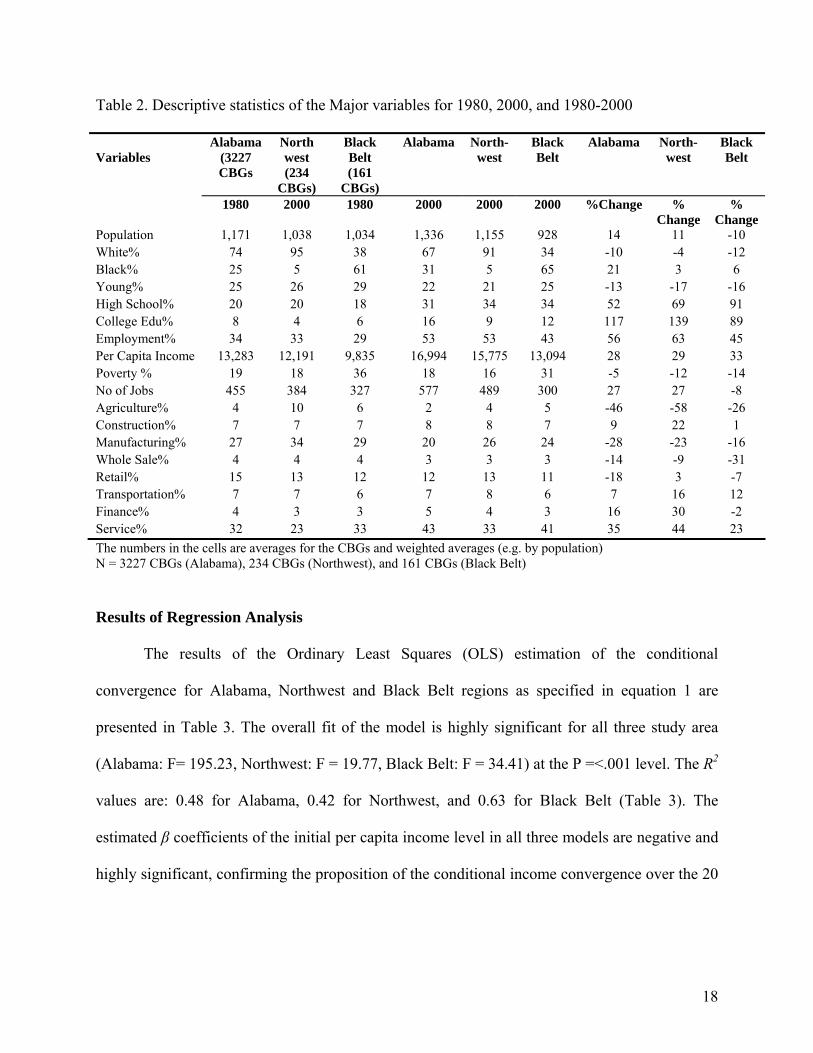
Table 2. Descriptive statistics of the Major variables for 1980, 2000, and 1980-2000
Alabama (3227 CBGs
North west (234
CBGs)
Black Belt (161
CBGs)
Alabama North- west
Black Belt
Alabama North- west
Black Belt
Variables
1980 2000 1980 2000 2000 2000 %Change % Change
% Change
Population 1,171 1,038 1,034 1,336 1,155 928 14 11 -10 White% 74 95 38 67 91 34 -10 -4 -12 Black% 25 5 61 31 5 65 21 3 6 Young% 25 26 29 22 21 25 -13 -17 -16 High School% 20 20 18 31 34 34 52 69 91 College Edu% 8 4 6 16 9 12 117 139 89 Employment% 34 33 29 53 53 43 56 63 45 Per Capita Income 13,283 12,191 9,835 16,994 15,775 13,094 28 29 33 Poverty % 19 18 36 18 16 31 -5 -12 -14 No of Jobs 455 384 327 577 489 300 27 27 -8 Agriculture% 4 10 6 2 4 5 -46 -58 -26 Construction% 7 7 7 8 8 7 9 22 1 Manufacturing% 27 34 29 20 26 24 -28 -23 -16 Whole Sale% 4 4 4 3 3 3 -14 -9 -31 Retail% 15 13 12 12 13 11 -18 3 -7 Transportation% 7 7 6 7 8 6 7 16 12 Finance% 4 3 3 5 4 3 16 30 -2 Service% 32 23 33 43 33 41 35 44 23 The numbers in the cells are averages for the CBGs and weighted averages (e.g. by population) N = 3227 CBGs (Alabama), 234 CBGs (Northwest), and 161 CBGs (Black Belt)
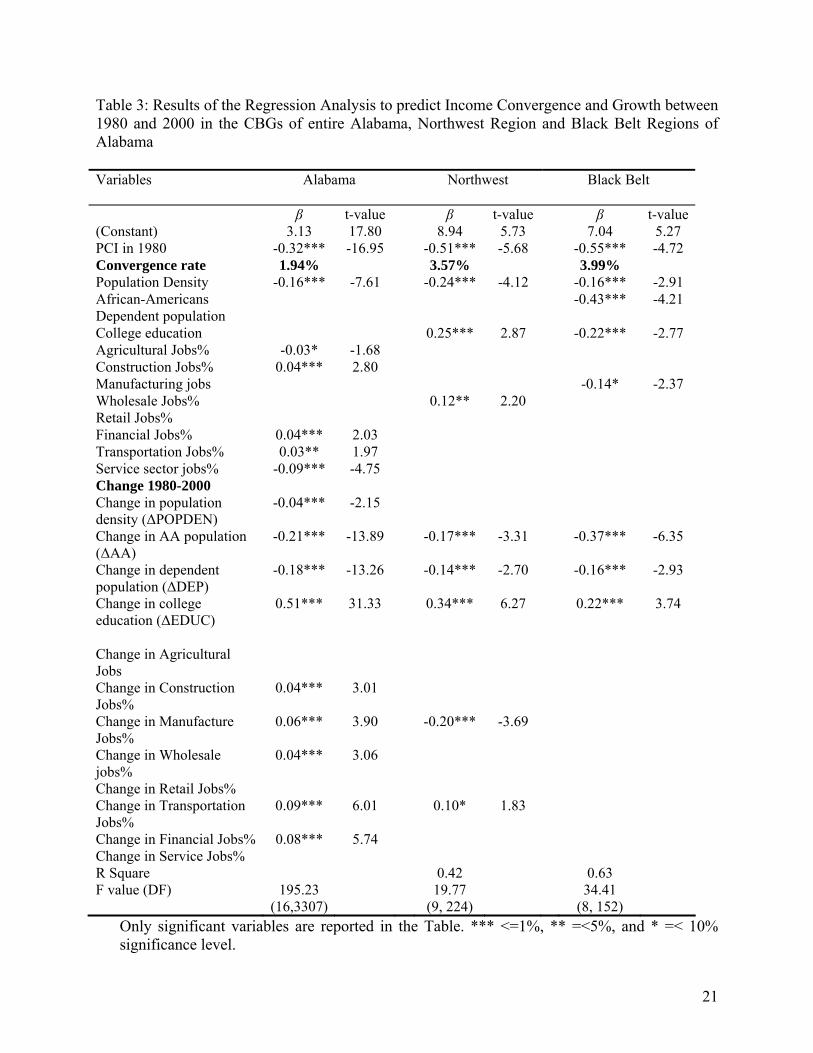
Results of Regression Analysis
The results of the Ordinary Least Squares (OLS) estimation of the conditional
convergence for Alabama, Northwest and Black Belt regions as specified in equation 1 are
presented in Table 3. The overall fit of the model is highly significant for all three study area
(Alabama: F= 195.23, Northwest: F = 19.77, Black Belt: F = 34.41) at the P =<.001 level. The R2
values are: 0.48 for Alabama, 0.42 for Northwest, and 0.63 for Black Belt (Table 3). The
estimated β coefficients of the initial per capita income level in all three models are negative and
highly significant, confirming the proposition of the conditional income convergence over the 20
19
years period as theorized by neoclassical growth model. The annual rate of income convergence
over the 20 years period is 1.94% for Alabama, 3.57% for Northwest, and 3.99% for Black Belt2.
Conditional income convergence is evident in all the three models. Demographic factors
such as population, race, age, and education, as well as employment factors conditioned income
convergence in the three areas. Four factors are consistent across the three regions: the initial
population levels, and the changes in racial composition, age structure, and educational levels.
CBGs with smaller populations in 1980 were more likely to have positive income change, while
CBGs with smaller changes in the African-American and dependent age populations were more
likely to have higher income changes. CBGs with greater increases in college educated
populations were also more likely to grow at incomes at a higher rate.
Other factors were important in each of the models, but not necessarily in the same way.
In both the Black Belt and the Northwest areas for example, the average percentage college
educated populations in 1980 were important. However, in the case of the Northwest
communities with higher education levels in 1980 had higher income growths, whereas, the
opposite was true for the Black Belt. That is, the lower average education levels in a Black Belt
CBG in 1980 the greater were the likelihood it would experience income growth. Smaller
changes in population in Alabama’s CBGs and lower African-American population levels in
Black Belt CBGs were further associated with positive income growth.
Employment was important in explaining income growth in all three areas -Alabama had
10, Northwest had three and the Black Belt had one- employment sectors which contributed in a
significant way to their income growth. In the Black Belt, CBGs with fewer manufacturing jobs
in the 1980 did better. In the Northwest Region, the wholesale trade and transportation were
2 The convergence rate is calculated using ,/)1ln( t+−= βθ where t is the number of years in the time period (Lim 2003).
20
significant. CBGs with higher wholesale jobs in 1980 and larger changes in transportation jobs
did well, whereas with less changes in or declining manufacturing jobs did not do as well. Not
surprisingly, seven of the eight sectors were important in Alabama CBGs. Only the ubiquitous
retail trades sector was not significant.
Construction, finance and transportation were the sectors which explained much of the
positive impact of employment on income growth in the state. CBG with more jobs in these
sectors in 1980 and with the greatest growth in jobs in these sectors were more likely to have
positive income growth. Greater changes in the Wholesale and Manufacturing sectors were also
positively correlated with income growth. On the other hand, CBGs more dependent on
agriculture in 1980 and with higher increases in service sector jobs were less likely to experience
higher income growth.
21
Table 3: Results of the Regression Analysis to predict Income Convergence and Growth between 1980 and 2000 in the CBGs of entire Alabama, Northwest Region and Black Belt Regions of Alabama
Variables Alabama
Northwest
Black Belt
β t-value β t-value β t-value(Constant) 3.13 17.80 8.94 5.73 7.04 5.27 PCI in 1980 -0.32*** -16.95 -0.51*** -5.68 -0.55*** -4.72 Convergence rate 1.94% 3.57% 3.99% Population Density -0.16*** -7.61 -0.24*** -4.12 -0.16*** -2.91 African-Americans -0.43*** -4.21 Dependent population College education 0.25*** 2.87 -0.22*** -2.77 Agricultural Jobs% -0.03* -1.68 Construction Jobs% 0.04*** 2.80 Manufacturing jobs -0.14* -2.37 Wholesale Jobs% 0.12** 2.20 Retail Jobs% Financial Jobs% 0.04*** 2.03 Transportation Jobs% 0.03** 1.97 Service sector jobs% -0.09*** -4.75 Change 1980-2000 Change in population density (ΔPOPDEN)
-0.04*** -2.15
Change in AA population (ΔAA)
-0.21*** -13.89 -0.17*** -3.31 -0.37*** -6.35
Change in dependent population (ΔDEP)
-0.18*** -13.26 -0.14*** -2.70 -0.16*** -2.93
Change in college education (ΔEDUC)
0.51*** 31.33 0.34*** 6.27 0.22*** 3.74
Change in Agricultural Jobs
Change in Construction Jobs%
0.04*** 3.01
Change in Manufacture Jobs%
0.06*** 3.90 -0.20*** -3.69
Change in Wholesale jobs%
0.04*** 3.06
Change in Retail Jobs% Change in Transportation Jobs%
0.09*** 6.01 0.10* 1.83
Change in Financial Jobs% 0.08*** 5.74 Change in Service Jobs% R Square 0.42 0.63 F value (DF) 195.23
(16,3307) 19.77
(9, 224) 34.41
(8, 152)
Only significant variables are reported in the Table. *** <=1%, ** =<5%, and * =< 10% significance level.
22
CONCLUSION
There is a strong evidence of income convergence in Alabama including Northwest and
Black Belt regions between 1980 and 2000. Over this twenty years period, per capita incomes of
poorer communities in these regions increased at higher rates than that of wealthier communities.
Empirical model estimates suggest economies of the poorer CBGs are catching up with the
wealthier CBGs at the annual rate of 1.94% in Alabama, 3.57% in Northwest, and 3.99% in the
Black Belt Region. The Black Belt communities are catching up faster compared to other
regions, which is consistent with the neoclassical growth theory. Good as these rates are, they
are still lower than rates estimated in other studies across the United States (Barro and Sala-i-
Martin 1992; Lim 2003; Higgins et al. 2006). This means income convergence rates have some
way to go if this region’s income were to approach national levels.
The consistency in the correlation between changes in incomes and race and education in
all regions is compelling evidence. The inverse relationship between growth in African
American population and growth in per capita income suggests that incomes are grown at higher
rate in the CBGs where African-Americans were not the majority population in 1980. This
finding is consistent with anecdotal evidence that predominantly white communities benefited
more than other communities from the increased income earning opportunities in the region over
the 20 year period.
Educational attainment made significant contribution to income growth in Alabama over
the 20 years period. Increasing levels of college education in the population have improved the
local labor force and increased their earning potential. On the other hand, employment growth
did not significantly influence income growth evenly across the regions. A finding more
23
consistent with observation that many of the college educated population are either retired, self-
employed, or commute to work.
This paper has shown the importance of using less-aggregated data at a finer geographic
scale when examining regional economic growth. The results also provide evidence that income
convergence over the past twenty years period has provided more benefits to predominantly
white population, who are a minority in the region. It can be argued that inferences based on the
broad income growth models estimated at larger geographic scale may have provided misleading
message in the past. This is very evident in both Alabama’s Black Belt and northwest regions
where population is geographically segregated by race and there is uneven distribution of human
capitals and employment opportunities. This study’s approach of examining economic growth at
a finer geographic scale while considering conditional income convergence can provide more
dependable results and more realistic assessment of income growth. Regional growth models can
be built on aggregation of lower-level, such as the CBG level models. Such studies can better
help policy makers understand the importance of internal and geographic dynamics of rural
communities. An understanding based on underlying regional economic growth patterns can
translate into more effective economic development policies and plans.
24
REFERENCES
Alabama Forestry Commission. 2008. Location of Primary Forest Industry Manufacturers.
http://www.forestry.state.al.us/publication/PDFs/Alabama_Primary_Forest_Industry-
Poster07.pdf
Alabama Industry. 2008. City data. www.city-data.com/states/Alabama-Industry.html, accessed
on June 13, 2008.
Albrecht D. E. and C. M. Albrecht, and E. Murguia, 2005. “Minority Concentration,
Disadvantage, and Inequality in the Nonmetropolitan United States,” The Sociological
Quarterly 46, 503-523.
Anselin, L., 1988. Spatial Econometrics: Methods and Models. Kluwer Academic Publishers:
Boston, MA.
Anselin, L., 2003. Geoda 0.9.5-I5. User’s Guide. Department of Agricultural and Consumer
Economics, University of Illinois: Urbana, IL.
Austin, J. and Schmidt, J. 1998. Convergence amid divergence in a region. Growth and Change
9 (1): 67-89.
Auto Aliance. 2008. Annual Report. http://www.autoalliance.org accessed on June 5, 2008.
Barro, R. and X. X. Sala-i-Martin. 1995. Economic Growth, McGraw-Hill, Cambridge, MA.
Barro, R. J. and X. X. Sala-i-Martin, 1991. “Convergence across States and Regions,” Brookings
Papers on Economic Activity 1, 107-182.
Barro, R. J. and X. X. Sala-i-Martin. 1992. Convergence. Journal of Political Economy 100 (21):
223-251.

25
Baumol, W. J., 1986. “Productivity Growth, Convergence and Welfare: What the Long Run Data
Show,” American Economic Review 76, 1072-85.
Cass, D. 1965. Optimum growth in an aggregative model of capital accumulation. Review of
Economic Studies 32 (91): 233-240.
Chatterji, M. 1992. Convergence clubs and endogenous growth. Oxford Review of Economic
Policy 8: 57-69.
Coelen, S. P. 1978. Regional convergence/divergence again. Journal of Regional Science 18 (3):
447-457.
Cole, M. A. and E. Neumayer. 2003. The pitfalls of convergence analysis: is the income gap
really widening? Applied Economics Letters 10: 355-357.
Coughlin, C. C., T. A. Garrett, and R. H. Murillo. 2006. Spatial dependence in models of state
fiscal policy convergence. Working paper 2006-001B. St. Louis: Federal Reserve Bank of St.
Louis.
Crandall, M. S. and B. A. Weber, 2004. “Local Social and Economic Conditions, Spatial
Concentrations of Poverty and Poverty Dynamics,” Amer. J. Agr. Econ. 86(5), 1276-1281.
Crown, W. H. and L. E. Wheat, 1995. “State Per Capita Income Convergence Since 1950
Sharing Cropping’s Demise and Other Influences,” Journal of Regional Science 35 (4), 527-
552.
Drennan, M. P., E. Tobier, and J. Lewis, 1996. “The Interruption of Income Convergence and
Income Growth in Large Cities in the 1980s,” Urban Studies 33 (1), 63-81.
Evans, P. and G. Karras. 1996. Do economies converge? evidence from a panel of U.S. States.
Review of Economics and Statistics 78 93) : 384-388.
26
Geolytics, 2007. Available at
http://www.geolytics.com/USCensus,1980_in_2000_Boundaries_Products.asp. Accessed
May 2007.
Geolytics, Inc., 2004b. U.S. Census DVD Time Series Normalized Research Package Data.
Geolytics, Inc., East Brunswick, NJ.
Haining, R. P. 1990. Spatial data analysis in the social and environmental sciences. Cambridge,
UK: Cambridge University Press.
Hammond, G. W., 2006. “A Time Series Analysys of U.S. Metropolitan and Non-metropolitan
Income Divergence,”. Ann Reg Sci. 40, 81-94.
Higgins, M. J., D. Levy, and A. Young. 2006. Growth and convergence across the U.S.: evidence
from county-level data. Review of Economics and Statistics 88, forthcoming.
Janikas, M. V. and S. J. Rey, 2005. “Spatial Clustering, Inequality and Income Convergence,”
Region at Development 21, 45-64.
Joshi, M. L., J. Bliss, C. Bailey, L. Teeter, and K. Ward, 2000. “Investing in Industry, Under-
Investing in Human Capital: Forest-Based Rural Development in Alabama,” Society And
Natural Resources 13, 291-319.
Kim, S., 1998. “Economic Integration and Convergence: U.S. Regions, 1840-1987,” The Journal
of Economic History 58 (3), 659-683.
Koopmans, T. C. 1965. On the concept of optimal economic growth. In The econometric
approach to development planning. Amsterdam.
Latzko, D. A., 2002. “Convergence of Income across Pennsylvania Counties,” Eastern Economic
Journal 28 (4), 499-508.
27
Lim, U., 2003. “A Spatial Analysis of Regional Income Convergence,” Planning Forum 9, 66-
80.
Loewy, M. B. and D. H. Papell, 1996. “Are U. S. Regional Incomes Converging? Some Further
Evidence,” Journal of Monetary Economics 38, 587-598.
Mankiw N. Gregory, D. Romer, and D. N. Weil., 1992. A Contribution to the Empirics of
Economic Growth. The Quarterly Journal of Economics. May: 407-437.
McLaughlin, D. K. and C. S. Stokes, 2002. “Income Inequality and Mortality in US Counties:
Does Minority Racial Concentration Matter?,” American Journal of Public Health 92 (1), 99-
104.
Pritchett, L. 1996. Forget Convergence: Divergence Past, Present, and Future. Finance and
Development 33, 50-43.
Quah, D. 1996. Regional convergence clusters across Europe. European Economic Review 40:
951-958.
Rey, S. J. and B. Montouri, 1999. “US Regional Income Convergence: A Spatial Econometric
Perspective,” Regional Studies 33 (2): 143-156.
Sala-i-Martin, X. X., 1996. “Regional Cohesion: Evidence and Theories of Regional Growth and
Convergence,” European Economic Review 40 (6), 1325-1352.
Schelhas, J., R. Zabawa, and J. Molnar, 2003. “New Opportunities for Social Research on Forest
Landowners in the South,” Southern Rural Sociology 19 (2), 60-69.
Sen, A. 1992. Inequality reexamined. New York: Russell Sage Foundation.
Shelnutt, J. P., and V. W. Yao. 2005. A spatial analysis of income inequality in Arkansas at the
county level: Evidence from tax and commuting data. Federal Reserve Bank of St. Louis
Regional economic Development 1 (1): 52-65.
28
Solow, R. M., 1956. “A Contribution to the Theory of Economic Growth,” Quarterly Journal of
Economics 70, 65-94.
Tsionas, E. G. 2000. Regional growth and convergence: evidence from the United States.
Regional Studies 34 (3) : 231-238.
U.S. Census Bureau, 2007. Available at:
http://www.census.gov/geo/www/GARM/Ch11GARM.pdf, June 2007.