income inequality and consumption in china · the survey and research center for china household...
TRANSCRIPT
Income Inequality and Consumption in China
August 2013
Dr. Li GanTexas A&M University, College Station, Texas
USA Southwestern University of Finance and Economics, Chengdu, China

Over the past 20 years, China’s aggregate GDP grew at staggeringly high rates of more than 8 percent annually. The change is visible to anyone who has repeatedly visited China during this time. However, little is known about the impact of this growth at the household level. To address this, the Survey and Research Center for China Household Finance in the Southwestern University of Finance and Economics in China, led by this author, conducted a nationally representative survey, the China Household Finance Survey (CHFS). The survey was conducted in the summer of 2011 with a sample of 8,438 households and 29,450 individuals. Many interesting findings have emerged, including the extent of income inequality and its relationship to the high household savings rate in China.
In particular, the survey indicates that China is home to some of the greatest income inequalities in the world. China’s Gini coefficient, a measure of inequality on a scale from complete equality (zero) to complete inequality (one), reaches 0.61. However, I posit that the high Gini coefficient may actually be a consequence of market efficiency—regions with more advanced market economies have higher Gini coefficients than less advanced market economies.
One of the major ramifications of high income inequality in China is the resulting depressed consumption level. My research found that poor households face a liquidity constraint—although they have strong incentives to consume, they are unable to do so. Increasing their income would thus raise their aggregate savings rate. A policy of income redistribution, therefore, becomes a policy of economic transition. By tackling income inequality, China has an opportunity to transform itself from an export- and infrastructure-oriented economy to a domestic consumption–oriented economy.
Finally, I argue that China has the fiscal capacity to massively increase its social welfare spending.
I. IntroductIon
2 | Income InequalIty and consumptIon In chIna
A. The GInI CoeffICIenT for household InCome In ChInA
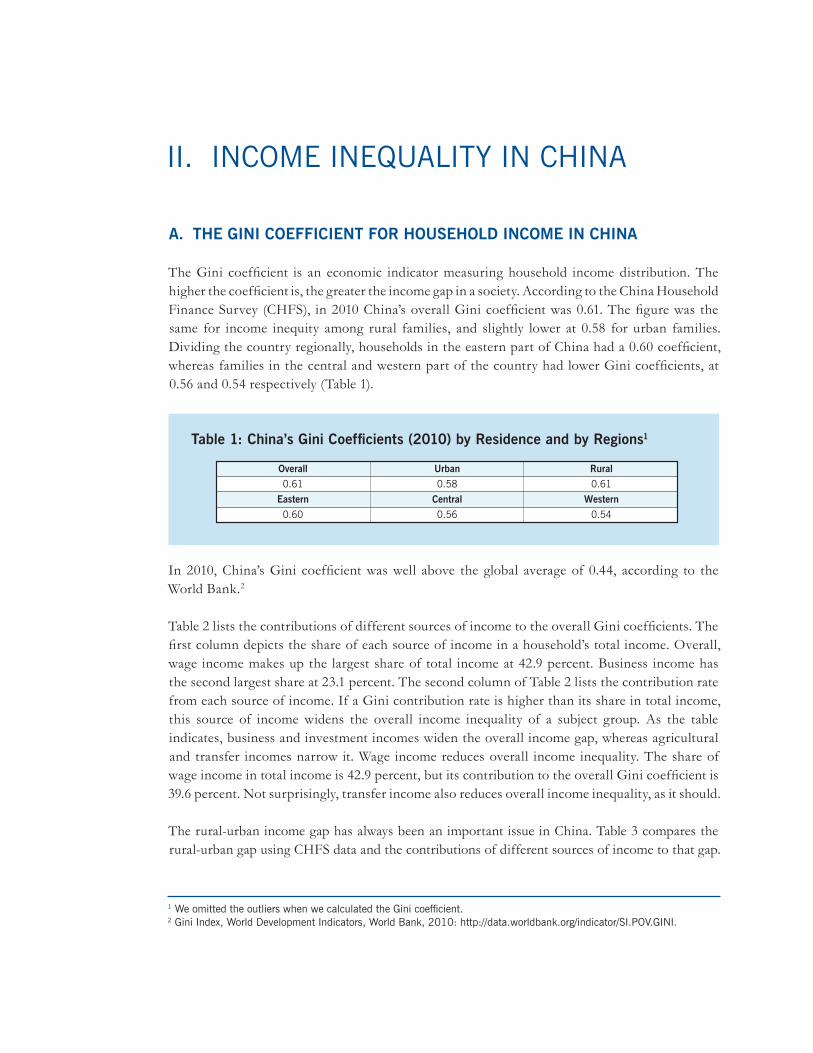
The Gini coefficient is an economic indicator measuring household income distribution. The higher the coefficient is, the greater the income gap in a society. According to the China Household Finance Survey (CHFS), in 2010 China’s overall Gini coefficient was 0.61. The figure was the same for income inequity among rural families, and slightly lower at 0.58 for urban families. Dividing the country regionally, households in the eastern part of China had a 0.60 coefficient, whereas families in the central and western part of the country had lower Gini coefficients, at 0.56 and 0.54 respectively (Table 1).
Table 1: China’s Gini Coefficients (2010) by Residence and by Regions1
In 2010, China’s Gini coefficient was well above the global average of 0.44, according to the World Bank.2
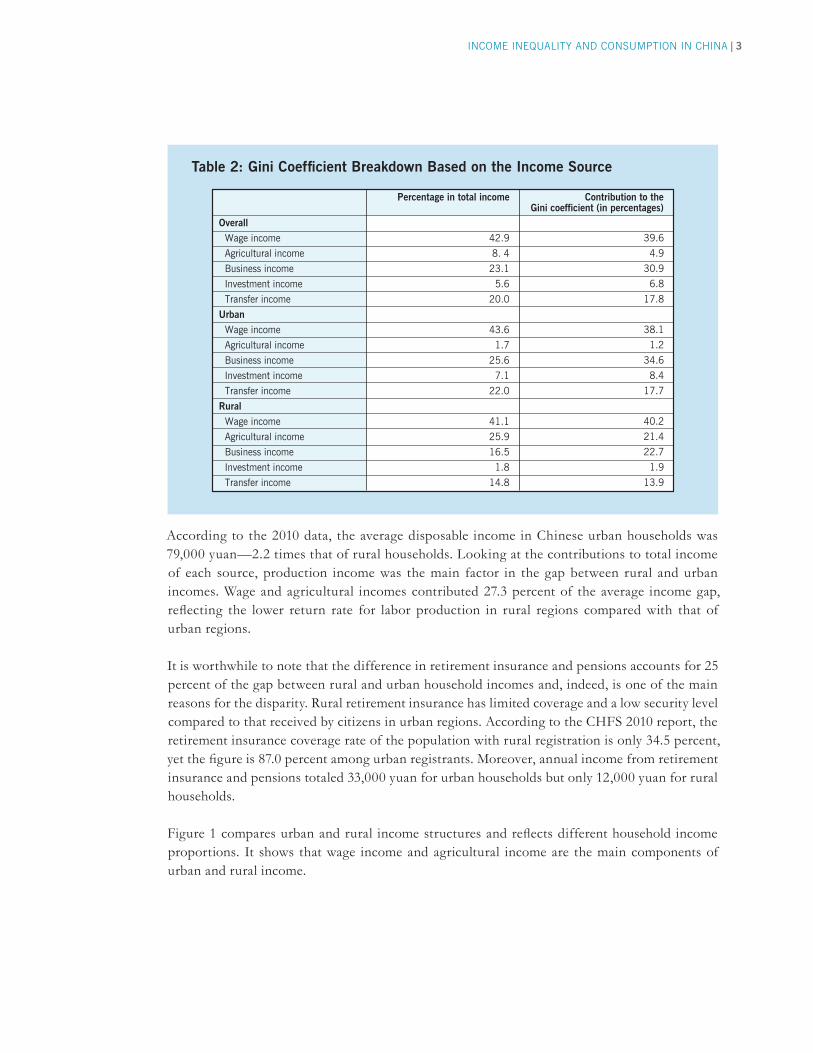
Table 2 lists the contributions of different sources of income to the overall Gini coefficients. The first column depicts the share of each source of income in a household’s total income. Overall, wage income makes up the largest share of total income at 42.9 percent. Business income has the second largest share at 23.1 percent. The second column of Table 2 lists the contribution rate from each source of income. If a Gini contribution rate is higher than its share in total income, this source of income widens the overall income inequality of a subject group. As the table indicates, business and investment incomes widen the overall income gap, whereas agricultural and transfer incomes narrow it. Wage income reduces overall income inequality. The share of wage income in total income is 42.9 percent, but its contribution to the overall Gini coefficient is 39.6 percent. Not surprisingly, transfer income also reduces overall income inequality, as it should.
The rural-urban income gap has always been an important issue in China. Table 3 compares the rural-urban gap using CHFS data and the contributions of different sources of income to that gap.
II. Income InequalIty In chIna
42.9
8. 4
23.1
5.6
20.0
43.6
1.7
25.6
7.1
22.0
41.1
25.9
16.5
1.8
14.8
39.6
4.9
30.9
6.8
17.8
38.1
1.2
34.6
8.4
17.7
40.2
21.4
22.7
1.9
13.9
Percentage in total income Contribution to the Gini coefficient (in percentages)
Overall
0.61
Eastern
0.60
Urban
0.58
Central
0.56
Rural
0.61
Western
0.54
53,103
37,290
30,600
33,869
With Without
54.4
55.5
54.9
31.6
22.8
29.2
Percentage of households that saved Saving rate (in percentages)
21,271
38,692
60,927
230,390
Rural householder’s education Annual income
30,415
53,906
110,619
195,282
Urban householder’s education Annual income
50%
40%
30%
20%
10%
0%
50%
40%
30%
20%
10%
0%
0.60
0.50
0.40
0.30
0.20
0.10
0.00
16
14
12
10
8
6
4
2
0
0.62
0.61
0.60
0.59
0.58
0.57
0.56
0.55
0.54
0.53
0.52
0.60
0.50
0.40
0.30
0.20
0.10
0.00
Number of households
receiving subsidy
Overall
Wage income
Agricultural income
Business income
Investment income
Transfer income
Urban
Wage income
Agricultural income
Business income
Investment income
Transfer income
Rural
Wage income
Agricultural income
Business income
Investment income
Transfer income
Income with/without retirement insurance
Income with/without medical insurance
Urban
Rural
Overall
Primary and below
Middle, high school
Junior vocational, senior vocational
Bachelor and above
Primary and below
Middle, high school
Junior vocational, senior vocational
Bachelor and above
All households
Excluding public servant households
Excluding monopoly industry households
Excluding both
Average income
Wage income
Production income
Agriculture income
Business income
Investment income
Transfer income
Retirement insurance, pensions, housing fund, and poverty subsidy
Social network building, etc.
78,944
34,402
21,583
1,351
20,232
5,585
17,375
13,167
4,208
2.2
2.3
3.5
0.1
3.4
8.8
3.3
5.5
1.5
35,806
14,705
15,185
9,270
5,915
635
5,280
2,386
2,894
Urban Rural Urban/Rural
0.61
0.58
0.57
0.58
0.61
0.58
0.57
0.57
0.58
0.56
0.55
0.55
Total Urban Rural
Malaysia
Mexico
Argentina
1996
2000
2003
7.3%
5.1%
7.9%
0.49
0.51
0.55
YearCountry Gini coefficient GDP growth rate
Top 5%
Top 10%
Top 25%
93.6
88.1
83.2
50.0
66.2
83.5
73.5
66.5
56.4
Percentage of households that saved
Total income Saving rate (in percentages)
Share in total saving (in percentages)
Income 46,636 16,99633,614GoodHealth status Normal Poor
Average income
Wage income
Production income
Agriculture income
Business income
Investment income
Transfer income
Retirement insurance, pensions, housing fund, poverty subsidies
Social network building, etc.
82,128
34,921
25,894
3,662
22,232
5,649
15,664
11,481
4,183
2.6
2.7
2.4
0.4
9.3
8.8
2.1
2.3
1.7
34,134
15,973
10,053
4,796
5,257
687
7,421
4,099
3,323
Eastern Central Eastern/Western31,854
12,820
10,851
8,460
2,391
640
7,542
5,031
2,511
Western
Urban
Rural
Overall
31.6%
22.8%
29.2%
59,367
27,643
41,904
78,944
35,806
59,174
Total income (yuan)
Total expenditure(yuan)
Saving rate
24,974
8,163
17,270
Saving(yuan)
Gini before subsidy Gini after subsidy
Method 1
Method 2
Method 3
Method 4
0.61
0.47
0.43
0.38
0.33
9,500
12,800
15,800
—
400 million
320 million
240 million
240 million
Subsidy amount per household
(yuan)
Rural
0.61
0.51
0.47
0.44
0.42
Overall
0.58
0.50
0.47
0.46
0.45
Urban
Bottom 25%
25%–50%
50%–75%
Top 25%
89
90
85
85
53
53
45
26
19
14
4
1
Bottom 25% 25%–50% Top 25%75
82
74
53
50%–75%
Overall
Urban
Rural
0.51
0.50
0.48
0.61
0.58
0.61
0.61
0.58
0.61
Before tax
Household income Household wage income
After tax After tax0.52
0.51
0.49
Before tax
Gini coefficient
Contribution of education on Gini coeffiencent
Gini coefficient after erasing educational inequality
Raise the education level to average OECD level
Raise the education level to average U.S. level
0.61
6%
0.59
0.36
0.38
0.61
11%
0.56
0.44
0.44
Overall Rural0.58
11%
0.54
0.47
0.45
Urban
Social insurance funds not included in fiscal budget
Social insurance funds included in fiscal budget
36.6
46.7
United States12.3
21.2
China
Elementary and below
Middle school and high school
Technical and vocational school
College and above
0.56
0.56
0.52
0.50
Gini coefficientEducation group
Before adjustment
Stick to minimum wage standard
Minimum wage increase by 50%
Minimum wage increase by 100%
0.58
0.57
0.56
0.55
0.61
0.60
0.59
0.58
Overall Urban0.61
0.61
0.59
0.55
Rural
43.6%
42.5%
46.8%
40.2%
27.1%
6.9%
19.1%21.7%
23.7%
2.0%2.0%
15.4%
7.5%
4.5%
14.1%
26.6%
41.1%
1.7%
25.9% 25.6%
16.5%
7.1%
1.8%
22.0%
14.7%
2,500,000
2,000,000
1,500,000
1,000,000
500,000
0
45%
40%
35%
30%
25%
20%
15%
10%
5%
0%
South Asia India Pakistan Bangladesh Other SAARC Afghanistan
South
Asia
India
Nepal
Pakis
tan
Bangla
desh
Bhutan
Maldive
s
Afgh
anist
an
Sri L
anka
Total Population (2010)
Total Population (2050)
Youth Population % of Total (2010)
Youth Population % of Total (2050)
Wageincome
Agriculturalincome
Businessincome
Investmentincome
Transferincome
Urban
Rural
Wageincome
Agriculturalincome
Businessincome
Investmentincome
Transferincome
Eastern
Central
Western
0.500.47
0.53
0.47 0.47
0.51
0.41
0.46 0.460.44
0.460.44
0.49
German
y
Finlan
dIta
ly
Hunga
ry
Poland
Britain
Norway
Spain
Japa
n
Greece
New Ze
aland
Canad
a
United
State
s
8.5
0.610.61 0.60
10.6
11.7 12 12.1
13 13.4
tran
sfer
/GD
P %
Gin
i
1990
–199
1
1996
–199
7
1998
–199
9
2002
–200
3
2004
–200
5
2006
–200
720
08
0.50
0.47
0.53
0.47 0.47
0.51
0.41
0.46 0.460.44
0.460.44
0.49
German
y
Finlan
dIta
ly
Hunga
ry
Polan
d
Brita
in
Norway
Spain
Japa
n
Greec
e
New Zea
land
Cana
da
United
Stat
es
0.30
0.260.34
0.270.29
0.34
0.25
0.32 0.330.31
0.33 0.32
0.38
Before transfer
After transfer
0.59
0.58
0.57
0.55
1 We omitted the outliers when we calculated the Gini coefficient.2 Gini Index, World development Indicators, World Bank, 2010: http://data.worldbank.org/indicator/SI.PoV.GInI.
Income InequalIty and consumptIon In chIna | 32 | Income InequalIty and consumptIon In chIna
According to the 2010 data, the average disposable income in Chinese urban households was 79,000 yuan—2.2 times that of rural households. Looking at the contributions to total income of each source, production income was the main factor in the gap between rural and urban incomes. Wage and agricultural incomes contributed 27.3 percent of the average income gap, reflecting the lower return rate for labor production in rural regions compared with that of urban regions.
It is worthwhile to note that the difference in retirement insurance and pensions accounts for 25 percent of the gap between rural and urban household incomes and, indeed, is one of the main reasons for the disparity. Rural retirement insurance has limited coverage and a low security level compared to that received by citizens in urban regions. According to the CHFS 2010 report, the retirement insurance coverage rate of the population with rural registration is only 34.5 percent, yet the figure is 87.0 percent among urban registrants. Moreover, annual income from retirement insurance and pensions totaled 33,000 yuan for urban households but only 12,000 yuan for rural households.
Figure 1 compares urban and rural income structures and reflects different household income proportions. It shows that wage income and agricultural income are the main components of urban and rural income.
42.9
8. 4
23.1
5.6
20.0
43.6
1.7
25.6
7.1
22.0
41.1
25.9
16.5
1.8
14.8
39.6
4.9
30.9
6.8
17.8
38.1
1.2
34.6
8.4
17.7
40.2
21.4
22.7
1.9
13.9
Percentage in total income Contribution to the Gini coefficient (in percentages)
Overall
0.61
Eastern
0.60
Urban
0.58
Central
0.56
Rural
0.61
Western
0.54
53,103
37,290
30,600
33,869
With Without
54.4
55.5
54.9
31.6
22.8
29.2
Percentage of households that saved Saving rate (in percentages)
21,271
38,692
60,927
230,390
Rural householder’s education Annual income
30,415
53,906
110,619
195,282
Urban householder’s education Annual income
50%
40%
30%
20%
10%
0%
50%
40%
30%
20%
10%
0%
0.60
0.50
0.40
0.30
0.20
0.10
0.00
16
14
12
10
8
6
4
2
0
0.62
0.61
0.60
0.59
0.58
0.57
0.56
0.55
0.54
0.53
0.52
0.60
0.50
0.40
0.30
0.20
0.10
0.00
Number of households
receiving subsidy
Overall
Wage income
Agricultural income
Business income
Investment income
Transfer income
Urban
Wage income
Agricultural income
Business income
Investment income
Transfer income
Rural
Wage income
Agricultural income
Business income
Investment income
Transfer income
Income with/without retirement insurance
Income with/without medical insurance
Urban
Rural
Overall
Primary and below
Middle, high school
Junior vocational, senior vocational
Bachelor and above
Primary and below
Middle, high school
Junior vocational, senior vocational
Bachelor and above
All households
Excluding public servant households
Excluding monopoly industry households
Excluding both
Average income
Wage income
Production income
Agriculture income
Business income
Investment income
Transfer income
Retirement insurance, pensions, housing fund, and poverty subsidy
Social network building, etc.
78,944
34,402
21,583
1,351
20,232
5,585
17,375
13,167
4,208
2.2
2.3
3.5
0.1
3.4
8.8
3.3
5.5
1.5
35,806
14,705
15,185
9,270
5,915
635
5,280
2,386
2,894
Urban Rural Urban/Rural
0.61
0.58
0.57
0.58
0.61
0.58
0.57
0.57
0.58
0.56
0.55
0.55
Total Urban Rural
Malaysia
Mexico
Argentina
1996
2000
2003
7.3%
5.1%
7.9%
0.49
0.51
0.55
YearCountry Gini coefficient GDP growth rate
Top 5%
Top 10%
Top 25%
93.6
88.1
83.2
50.0
66.2
83.5
73.5
66.5
56.4
Percentage of households that saved
Total income Saving rate (in percentages)
Share in total saving (in percentages)
Income 46,636 16,99633,614GoodHealth status Normal Poor
Average income
Wage income
Production income
Agriculture income
Business income
Investment income
Transfer income
Retirement insurance, pensions, housing fund, poverty subsidies
Social network building, etc.
82,128
34,921
25,894
3,662
22,232
5,649
15,664
11,481
4,183
2.6
2.7
2.4
0.4
9.3
8.8
2.1
2.3
1.7
34,134
15,973
10,053
4,796
5,257
687
7,421
4,099
3,323
Eastern Central Eastern/Western31,854
12,820
10,851
8,460
2,391
640
7,542
5,031
2,511
Western
Urban
Rural
Overall
31.6%
22.8%
29.2%
59,367
27,643
41,904
78,944
35,806
59,174
Total income (yuan)
Total expenditure(yuan)
Saving rate
24,974
8,163
17,270
Saving(yuan)
Gini before subsidy Gini after subsidy
Method 1
Method 2
Method 3
Method 4
0.61
0.47
0.43
0.38
0.33
9,500
12,800
15,800
—
400 million
320 million
240 million
240 million
Subsidy amount per household
(yuan)
Rural
0.61
0.51
0.47
0.44
0.42
Overall
0.58
0.50
0.47
0.46
0.45
Urban
Bottom 25%
25%–50%
50%–75%
Top 25%
89
90
85
85
53
53
45
26
19
14
4
1
Bottom 25% 25%–50% Top 25%75
82
74
53
50%–75%
Overall
Urban
Rural
0.51
0.50
0.48
0.61
0.58
0.61
0.61
0.58
0.61
Before tax
Household income Household wage income
After tax After tax0.52
0.51
0.49
Before tax
Gini coefficient
Contribution of education on Gini coeffiencent
Gini coefficient after erasing educational inequality
Raise the education level to average OECD level
Raise the education level to average U.S. level
0.61
6%
0.59
0.36
0.38
0.61
11%
0.56
0.44
0.44
Overall Rural0.58
11%
0.54
0.47
0.45
Urban
Social insurance funds not included in fiscal budget
Social insurance funds included in fiscal budget
36.6
46.7
United States12.3
21.2
China
Elementary and below
Middle school and high school
Technical and vocational school
College and above
0.56
0.56
0.52
0.50
Gini coefficientEducation group
Before adjustment
Stick to minimum wage standard
Minimum wage increase by 50%
Minimum wage increase by 100%
0.58
0.57
0.56
0.55
0.61
0.60
0.59
0.58
Overall Urban0.61
0.61
0.59
0.55
Rural
43.6%
42.5%
46.8%
40.2%
27.1%
6.9%
19.1%21.7%
23.7%
2.0%2.0%
15.4%
7.5%
4.5%
14.1%
26.6%
41.1%
1.7%
25.9% 25.6%
16.5%
7.1%
1.8%
22.0%
14.7%
2,500,000
2,000,000
1,500,000
1,000,000
500,000
0
45%
40%
35%
30%
25%
20%
15%
10%
5%
0%
South Asia India Pakistan Bangladesh Other SAARC Afghanistan
South
Asia
India
Nepal
Pakis
tan
Bangla
desh
Bhutan
Maldive
s
Afgh
anist
an
Sri L
anka
Total Population (2010)
Total Population (2050)
Youth Population % of Total (2010)
Youth Population % of Total (2050)
Wageincome
Agriculturalincome
Businessincome
Investmentincome
Transferincome
Urban
Rural
Wageincome
Agriculturalincome
Businessincome
Investmentincome
Transferincome
Eastern
Central
Western
0.500.47
0.53
0.47 0.47
0.51
0.41
0.46 0.460.44
0.460.44
0.49
German
y
Finlan
dIta
ly
Hunga
ry
Poland
Britain
Norway
Spain
Japa
n
Greece
New Ze
aland
Canad
a
United
State
s
8.5
0.610.61 0.60
10.6
11.7 12 12.1
13 13.4
tran
sfer
/GD
P %
Gin
i
1990
–199
1
1996
–199
7
1998
–199
9
2002
–200
3
2004
–200
5
2006
–200
720
08
0.50
0.47
0.53
0.47 0.47
0.51
0.41
0.46 0.460.44
0.460.44
0.49
German
y
Finlan
dIta
ly
Hunga
ry
Polan
d
Brita
in
Norway
Spain
Japa
n
Greec
e
New Zea
land
Cana
da
United
Stat
es
0.30
0.260.34
0.270.29
0.34
0.25
0.32 0.330.31
0.33 0.32
0.38
Before transfer
After transfer
0.59
0.58
0.57
0.55
Table 2: Gini Coefficient Breakdown Based on the Income Source

4 | Income InequalIty and consumptIon In chIna
Figure 1: Urban and Rural Household Income Structure
42.9
8. 4
23.1
5.6
20.0
43.6
1.7
25.6
7.1
22.0
41.1
25.9
16.5
1.8
14.8
39.6
4.9
30.9
6.8
17.8
38.1
1.2
34.6
8.4
17.7
40.2
21.4
22.7
1.9
13.9
Percentage in total income Contribution to the Gini coefficient (in percentages)
Overall
0.61
Eastern
0.60
Urban
0.58
Central
0.56
Rural
0.61
Western
0.54
53,103
37,290
30,600
33,869
With Without
54.4
55.5
54.9
31.6
22.8
29.2
Percentage of households that saved Saving rate (in percentages)
21,271
38,692
60,927
230,390
Rural householder’s education Annual income
30,415
53,906
110,619
195,282
Urban householder’s education Annual income
50%
40%
30%
20%
10%
0%
50%
40%
30%
20%
10%
0%
0.60
0.50
0.40
0.30
0.20
0.10
0.00
16
14
12
10
8
6
4
2
0
0.62
0.61
0.60
0.59
0.58
0.57
0.56
0.55
0.54
0.53
0.52
0.60
0.50
0.40
0.30
0.20
0.10
0.00
Number of households
receiving subsidy
Overall
Wage income
Agricultural income
Business income
Investment income
Transfer income
Urban
Wage income
Agricultural income
Business income
Investment income
Transfer income
Rural
Wage income
Agricultural income
Business income
Investment income
Transfer income
Income with/without retirement insurance
Income with/without medical insurance
Urban
Rural
Overall
Primary and below
Middle, high school
Junior vocational, senior vocational
Bachelor and above
Primary and below
Middle, high school
Junior vocational, senior vocational
Bachelor and above
All households
Excluding public servant households
Excluding monopoly industry households
Excluding both
Average income
Wage income
Production income
Agriculture income
Business income
Investment income
Transfer income
Retirement insurance, pensions, housing fund, and poverty subsidy
Social network building, etc.
78,944
34,402
21,583
1,351
20,232
5,585
17,375
13,167
4,208
2.2
2.3
3.5
0.1
3.4
8.8
3.3
5.5
1.5
35,806
14,705
15,185
9,270
5,915
635
5,280
2,386
2,894
Urban Rural Urban/Rural
0.61
0.58
0.57
0.58
0.61
0.58
0.57
0.57
0.58
0.56
0.55
0.55
Total Urban Rural
Malaysia
Mexico
Argentina
1996
2000
2003
7.3%
5.1%
7.9%
0.49
0.51
0.55
YearCountry Gini coefficient GDP growth rate
Top 5%
Top 10%
Top 25%
93.6
88.1
83.2
50.0
66.2
83.5
73.5
66.5
56.4
Percentage of households that saved
Total income Saving rate (in percentages)
Share in total saving (in percentages)
Income 46,636 16,99633,614GoodHealth status Normal Poor
Average income
Wage income
Production income
Agriculture income
Business income
Investment income
Transfer income
Retirement insurance, pensions, housing fund, poverty subsidies
Social network building, etc.
82,128
34,921
25,894
3,662
22,232
5,649
15,664
11,481
4,183
2.6
2.7
2.4
0.4
9.3
8.8
2.1
2.3
1.7
34,134
15,973
10,053
4,796
5,257
687
7,421
4,099
3,323
Eastern Central Eastern/Western31,854
12,820
10,851
8,460
2,391
640
7,542
5,031
2,511
Western
Urban
Rural
Overall
31.6%
22.8%
29.2%
59,367
27,643
41,904
78,944
35,806
59,174
Total income (yuan)
Total expenditure(yuan)
Saving rate
24,974
8,163
17,270
Saving(yuan)
Gini before subsidy Gini after subsidy
Method 1
Method 2
Method 3
Method 4
0.61
0.47
0.43
0.38
0.33
9,500
12,800
15,800
—
400 million
320 million
240 million
240 million
Subsidy amount per household
(yuan)
Rural
0.61
0.51
0.47
0.44
0.42
Overall
0.58
0.50
0.47
0.46
0.45
Urban
Bottom 25%
25%–50%
50%–75%
Top 25%
89
90
85
85
53
53
45
26
19
14
4
1
Bottom 25% 25%–50% Top 25%75
82
74
53
50%–75%
Overall
Urban
Rural
0.51
0.50
0.48
0.61
0.58
0.61
0.61
0.58
0.61
Before tax
Household income Household wage income
After tax After tax0.52
0.51
0.49
Before tax
Gini coefficient
Contribution of education on Gini coeffiencent
Gini coefficient after erasing educational inequality
Raise the education level to average OECD level
Raise the education level to average U.S. level
0.61
6%
0.59
0.36
0.38
0.61
11%
0.56
0.44
0.44
Overall Rural0.58
11%
0.54
0.47
0.45
Urban
Social insurance funds not included in fiscal budget
Social insurance funds included in fiscal budget
36.6
46.7
United States12.3
21.2
China
Elementary and below
Middle school and high school
Technical and vocational school
College and above
0.56
0.56
0.52
0.50
Gini coefficientEducation group
Before adjustment
Stick to minimum wage standard
Minimum wage increase by 50%
Minimum wage increase by 100%
0.58
0.57
0.56
0.55
0.61
0.60
0.59
0.58
Overall Urban0.61
0.61
0.59
0.55
Rural
43.6%
42.5%
46.8%
40.2%
27.1%
6.9%
19.1%21.7%
23.7%
2.0%2.0%
15.4%
7.5%
4.5%
14.1%
26.6%
41.1%
1.7%
25.9% 25.6%
16.5%
7.1%
1.8%
22.0%
14.7%
2,500,000
2,000,000
1,500,000
1,000,000
500,000
0
45%
40%
35%
30%
25%
20%
15%
10%
5%
0%
South Asia India Pakistan Bangladesh Other SAARC Afghanistan
South
Asia
India
Nepal
Pakis
tan
Bangla
desh
Bhutan
Maldive
s
Afgh
anist
an
Sri L
anka
Total Population (2010)
Total Population (2050)
Youth Population % of Total (2010)
Youth Population % of Total (2050)
Wageincome
Agriculturalincome
Businessincome
Investmentincome
Transferincome
Urban
Rural
Wageincome
Agriculturalincome
Businessincome
Investmentincome
Transferincome
Eastern
Central
Western
0.500.47
0.53
0.47 0.47
0.51
0.41
0.46 0.460.44
0.460.44
0.49
German
y
Finlan
dIta
ly
Hunga
ry
Poland
Britain
Norway
Spain
Japa
n
Greece
New Ze
aland
Canad
a
United
State
s
8.5
0.610.61 0.60
10.6
11.7 12 12.1
13 13.4
tran
sfer
/GD
P %
Gin
i
1990
–199
1
1996
–199
7
1998
–199
9
2002
–200
3
2004
–200
5
2006
–200
720
08
0.50
0.47
0.53
0.47 0.47
0.51
0.41
0.46 0.460.44
0.460.44
0.49
German
y
Finlan
dIta
ly
Hunga
ry
Polan
d
Brita
in
Norway
Spain
Japa
n
Greec
e
New Zea
land
Cana
da
United
Stat
es
0.30
0.260.34
0.270.29
0.34
0.25
0.32 0.330.31
0.33 0.32
0.38
Before transfer
After transfer
0.59
0.58
0.57
0.55
Table 3: Comparison between Rural and Urban Household Income*
Regional differences in income are also quite common in China. Households in the eastern part of the country earn 2.6 times more than households in central and western China. Although an income gap also exists between families in central and western China, the difference is rather small. Table 4 shows regional differences by sources of income. Likely due to the more advanced market economy in eastern China, the largest difference between households in eastern China and those in central and western China is disparity in business income. The average household’s business income is 22,000 yuan in eastern China, nine times greater than business income in western China (Table 4).
* In yuan

Income InequalIty and consumptIon In chIna | 54 | Income InequalIty and consumptIon In chIna
The income gap between eastern and western China derives chiefly from differences in wage and business income. Disparities in wage account for 39 percent of the east-west income gap; differences in business income account for 21 percent of the gap. Transfer and agriculture incomes also contribute, though at lower rates.
Table 4: Income Comparison of Chinese Households (by region)*
Figure 2 compares regional differences of household income structure. The proportion of business income is higher for eastern households than for central and western households. However, agricultural income accounts for a relatively high proportion of western households’ incomes.
Figure 2: Income Structure of Eastern, Central, and Western Households
42.9
8. 4
23.1
5.6
20.0
43.6
1.7
25.6
7.1
22.0
41.1
25.9
16.5
1.8
14.8
39.6
4.9
30.9
6.8
17.8
38.1
1.2
34.6
8.4
17.7
40.2
21.4
22.7
1.9
13.9
Percentage in total income Contribution to the Gini coefficient (in percentages)
Overall
0.61
Eastern
0.60
Urban
0.58
Central
0.56
Rural
0.61
Western
0.54
53,103
37,290
30,600
33,869
With Without
54.4
55.5
54.9
31.6
22.8
29.2
Percentage of households that saved Saving rate (in percentages)
21,271
38,692
60,927
230,390
Rural householder’s education Annual income
30,415
53,906
110,619
195,282
Urban householder’s education Annual income
50%
40%
30%
20%
10%
0%
50%
40%
30%
20%
10%
0%
0.60
0.50
0.40
0.30
0.20
0.10
0.00
16
14
12
10
8
6
4
2
0
0.62
0.61
0.60
0.59
0.58
0.57
0.56
0.55
0.54
0.53
0.52
0.60
0.50
0.40
0.30
0.20
0.10
0.00
Number of households
receiving subsidy
Overall
Wage income
Agricultural income
Business income
Investment income
Transfer income
Urban
Wage income
Agricultural income
Business income
Investment income
Transfer income
Rural
Wage income
Agricultural income
Business income
Investment income
Transfer income
Income with/without retirement insurance
Income with/without medical insurance
Urban
Rural
Overall
Primary and below
Middle, high school
Junior vocational, senior vocational
Bachelor and above
Primary and below
Middle, high school
Junior vocational, senior vocational
Bachelor and above
All households
Excluding public servant households
Excluding monopoly industry households
Excluding both
Average income
Wage income
Production income
Agriculture income
Business income
Investment income
Transfer income
Retirement insurance, pensions, housing fund, and poverty subsidy
Social network building, etc.
78,944
34,402
21,583
1,351
20,232
5,585
17,375
13,167
4,208
2.2
2.3
3.5
0.1
3.4
8.8
3.3
5.5
1.5
35,806
14,705
15,185
9,270
5,915
635
5,280
2,386
2,894
Urban Rural Urban/Rural
0.61
0.58
0.57
0.58
0.61
0.58
0.57
0.57
0.58
0.56
0.55
0.55
Total Urban Rural
Malaysia
Mexico
Argentina
1996
2000
2003
7.3%
5.1%
7.9%
0.49
0.51
0.55
YearCountry Gini coefficient GDP growth rate
Top 5%
Top 10%
Top 25%
93.6
88.1
83.2
50.0
66.2
83.5
73.5
66.5
56.4
Percentage of households that saved
Total income Saving rate (in percentages)
Share in total saving (in percentages)
Income 46,636 16,99633,614GoodHealth status Normal Poor
Average income
Wage income
Production income
Agriculture income
Business income
Investment income
Transfer income
Retirement insurance, pensions, housing fund, poverty subsidies
Social network building, etc.
82,128
34,921
25,894
3,662
22,232
5,649
15,664
11,481
4,183
2.6
2.7
2.4
0.4
9.3
8.8
2.1
2.3
1.7
34,134
15,973
10,053
4,796
5,257
687
7,421
4,099
3,323
Eastern Central Eastern/Western31,854
12,820
10,851
8,460
2,391
640
7,542
5,031
2,511
Western
Urban
Rural
Overall
31.6%
22.8%
29.2%
59,367
27,643
41,904
78,944
35,806
59,174
Total income (yuan)
Total expenditure(yuan)
Saving rate
24,974
8,163
17,270
Saving(yuan)
Gini before subsidy Gini after subsidy
Method 1
Method 2
Method 3
Method 4
0.61
0.47
0.43
0.38
0.33
9,500
12,800
15,800
—
400 million
320 million
240 million
240 million
Subsidy amount per household
(yuan)
Rural
0.61
0.51
0.47
0.44
0.42
Overall
0.58
0.50
0.47
0.46
0.45
Urban
Bottom 25%
25%–50%
50%–75%
Top 25%
89
90
85
85
53
53
45
26
19
14
4
1
Bottom 25% 25%–50% Top 25%75
82
74
53
50%–75%
Overall
Urban
Rural
0.51
0.50
0.48
0.61
0.58
0.61
0.61
0.58
0.61
Before tax
Household income Household wage income
After tax After tax0.52
0.51
0.49
Before tax
Gini coefficient
Contribution of education on Gini coeffiencent
Gini coefficient after erasing educational inequality
Raise the education level to average OECD level
Raise the education level to average U.S. level
0.61
6%
0.59
0.36
0.38
0.61
11%
0.56
0.44
0.44
Overall Rural0.58
11%
0.54
0.47
0.45
Urban
Social insurance funds not included in fiscal budget
Social insurance funds included in fiscal budget
36.6
46.7
United States12.3
21.2
China
Elementary and below
Middle school and high school
Technical and vocational school
College and above
0.56
0.56
0.52
0.50
Gini coefficientEducation group
Before adjustment
Stick to minimum wage standard
Minimum wage increase by 50%
Minimum wage increase by 100%
0.58
0.57
0.56
0.55
0.61
0.60
0.59
0.58
Overall Urban0.61
0.61
0.59
0.55
Rural
43.6%
42.5%
46.8%
40.2%
27.1%
6.9%
19.1%21.7%
23.7%
2.0%2.0%
15.4%
7.5%
4.5%
14.1%
26.6%
41.1%
1.7%
25.9% 25.6%
16.5%
7.1%
1.8%
22.0%
14.7%
2,500,000
2,000,000
1,500,000
1,000,000
500,000
0
45%
40%
35%
30%
25%
20%
15%
10%
5%
0%
South Asia India Pakistan Bangladesh Other SAARC Afghanistan
South
Asia
India
Nepal
Pakis
tan
Bangla
desh
Bhutan
Maldive
s
Afgh
anist
an
Sri L
anka
Total Population (2010)
Total Population (2050)
Youth Population % of Total (2010)
Youth Population % of Total (2050)
Wageincome
Agriculturalincome
Businessincome
Investmentincome
Transferincome
Urban
Rural
Wageincome
Agriculturalincome
Businessincome
Investmentincome
Transferincome
Eastern
Central
Western
0.500.47
0.53
0.47 0.47
0.51
0.41
0.46 0.460.44
0.460.44
0.49
German
y
Finlan
dIta
ly
Hunga
ry
Poland
Britain
Norway
Spain
Japa
n
Greece
New Ze
aland
Canad
a
United
State
s
8.5
0.610.61 0.60
10.6
11.7 12 12.1
13 13.4
tran
sfer
/GD
P %
Gin
i
1990
–199
1
1996
–199
7
1998
–199
9
2002
–200
3
2004
–200
5
2006
–200
720
08
0.50
0.47
0.53
0.47 0.47
0.51
0.41
0.46 0.460.44
0.460.44
0.49
German
y
Finlan
dIta
ly
Hunga
ry
Polan
d
Brita
in
Norway
Spain
Japa
n
Greec
e
New Zea
land
Cana
da
United
Stat
es
0.30
0.260.34
0.270.29
0.34
0.25
0.32 0.330.31
0.33 0.32
0.38
Before transfer
After transfer
0.59
0.58
0.57
0.55
* In yuan

6 | Income InequalIty and consumptIon In chIna
Low-income households in rural areas exhibit different characteristics from those in urban areas that contribute to an increasing gap between the two groups. Households in rural China have three clear characteristics. First, poor health: the CHFS data show that households whose heads suffer from poor health have an average annual income of 16,996 yuan, or about one-third that of households whose heads enjoy good health (Table 5).
Table 5: Rural Household Income and the Health of the Household’s Head*
Second, low-income rural households often do not have social insurance. As Table 6 shows, a rural household with retirement insurance has 1.7 times the annual income of those without. For those with medical insurance, the figure is 1.1 times that of those without.
Table 6: Rural Household Annual Income with/without Insurance*
Finally, low-income households often have low levels of education. The education gap among rural households causes obvious income disparity. The higher the householder’s education level is, the higher the household income will be (Table 7).
Table 7: Education Level and Rural Household Income*
However, low-income urban households are often disproportionally impacted by a lack of education. According to CHFS data, urban households whose heads did not finish compulsory education have an annual income of 30,000 yuan, about one-sixth that of households whose heads have a bachelor degree or above (Table 8).
42.9
8. 4
23.1
5.6
20.0
43.6
1.7
25.6
7.1
22.0
41.1
25.9
16.5
1.8
14.8
39.6
4.9
30.9
6.8
17.8
38.1
1.2
34.6
8.4
17.7
40.2
21.4
22.7
1.9
13.9
Percentage in total income Contribution to the Gini coefficient (in percentages)
Overall
0.61
Eastern
0.60
Urban
0.58
Central
0.56
Rural
0.61
Western
0.54
53,103
37,290
30,600
33,869
With Without
54.4
55.5
54.9
31.6
22.8
29.2
Percentage of households that saved Saving rate (in percentages)
21,271
38,692
60,927
230,390
Rural householder’s education Annual income
30,415
53,906
110,619
195,282
Urban householder’s education Annual income
50%
40%
30%
20%
10%
0%
50%
40%
30%
20%
10%
0%
0.60
0.50
0.40
0.30
0.20
0.10
0.00
16
14
12
10
8
6
4
2
0
0.62
0.61
0.60
0.59
0.58
0.57
0.56
0.55
0.54
0.53
0.52
0.60
0.50
0.40
0.30
0.20
0.10
0.00
Number of households
receiving subsidy
Overall
Wage income
Agricultural income
Business income
Investment income
Transfer income
Urban
Wage income
Agricultural income
Business income
Investment income
Transfer income
Rural
Wage income
Agricultural income
Business income
Investment income
Transfer income
Income with/without retirement insurance
Income with/without medical insurance
Urban
Rural
Overall
Primary and below
Middle, high school
Junior vocational, senior vocational
Bachelor and above
Primary and below
Middle, high school
Junior vocational, senior vocational
Bachelor and above
All households
Excluding public servant households
Excluding monopoly industry households
Excluding both
Average income
Wage income
Production income
Agriculture income
Business income
Investment income
Transfer income
Retirement insurance, pensions, housing fund, and poverty subsidy
Social network building, etc.
78,944
34,402
21,583
1,351
20,232
5,585
17,375
13,167
4,208
2.2
2.3
3.5
0.1
3.4
8.8
3.3
5.5
1.5
35,806
14,705
15,185
9,270
5,915
635
5,280
2,386
2,894
Urban Rural Urban/Rural
0.61
0.58
0.57
0.58
0.61
0.58
0.57
0.57
0.58
0.56
0.55
0.55
Total Urban Rural
Malaysia
Mexico
Argentina
1996
2000
2003
7.3%
5.1%
7.9%
0.49
0.51
0.55
YearCountry Gini coefficient GDP growth rate
Top 5%
Top 10%
Top 25%
93.6
88.1
83.2
50.0
66.2
83.5
73.5
66.5
56.4
Percentage of households that saved
Total income Saving rate (in percentages)
Share in total saving (in percentages)
Income 46,636 16,99633,614GoodHealth status Normal Poor
Average income
Wage income
Production income
Agriculture income
Business income
Investment income
Transfer income
Retirement insurance, pensions, housing fund, poverty subsidies
Social network building, etc.
82,128
34,921
25,894
3,662
22,232
5,649
15,664
11,481
4,183
2.6
2.7
2.4
0.4
9.3
8.8
2.1
2.3
1.7
34,134
15,973
10,053
4,796
5,257
687
7,421
4,099
3,323
Eastern Central Eastern/Western31,854
12,820
10,851
8,460
2,391
640
7,542
5,031
2,511
Western
Urban
Rural
Overall
31.6%
22.8%
29.2%
59,367
27,643
41,904
78,944
35,806
59,174
Total income (yuan)
Total expenditure(yuan)
Saving rate
24,974
8,163
17,270
Saving(yuan)
Gini before subsidy Gini after subsidy
Method 1
Method 2
Method 3
Method 4
0.61
0.47
0.43
0.38
0.33
9,500
12,800
15,800
—
400 million
320 million
240 million
240 million
Subsidy amount per household
(yuan)
Rural
0.61
0.51
0.47
0.44
0.42
Overall
0.58
0.50
0.47
0.46
0.45
Urban
Bottom 25%
25%–50%
50%–75%
Top 25%
89
90
85
85
53
53
45
26
19
14
4
1
Bottom 25% 25%–50% Top 25%75
82
74
53
50%–75%
Overall
Urban
Rural
0.51
0.50
0.48
0.61
0.58
0.61
0.61
0.58
0.61
Before tax
Household income Household wage income
After tax After tax0.52
0.51
0.49
Before tax
Gini coefficient
Contribution of education on Gini coeffiencent
Gini coefficient after erasing educational inequality
Raise the education level to average OECD level
Raise the education level to average U.S. level
0.61
6%
0.59
0.36
0.38
0.61
11%
0.56
0.44
0.44
Overall Rural0.58
11%
0.54
0.47
0.45
Urban
Social insurance funds not included in fiscal budget
Social insurance funds included in fiscal budget
36.6
46.7
United States12.3
21.2
China
Elementary and below
Middle school and high school
Technical and vocational school
College and above
0.56
0.56
0.52
0.50
Gini coefficientEducation group
Before adjustment
Stick to minimum wage standard
Minimum wage increase by 50%
Minimum wage increase by 100%
0.58
0.57
0.56
0.55
0.61
0.60
0.59
0.58
Overall Urban0.61
0.61
0.59
0.55
Rural
43.6%
42.5%
46.8%
40.2%
27.1%
6.9%
19.1%21.7%
23.7%
2.0%2.0%
15.4%
7.5%
4.5%
14.1%
26.6%
41.1%
1.7%
25.9% 25.6%
16.5%
7.1%
1.8%
22.0%
14.7%
2,500,000
2,000,000
1,500,000
1,000,000
500,000
0
45%
40%
35%
30%
25%
20%
15%
10%
5%
0%
South Asia India Pakistan Bangladesh Other SAARC Afghanistan
South
Asia
India
Nepal
Pakis
tan
Bangla
desh
Bhutan
Maldive
s
Afgh
anist
an
Sri L
anka
Total Population (2010)
Total Population (2050)
Youth Population % of Total (2010)
Youth Population % of Total (2050)
Wageincome
Agriculturalincome
Businessincome
Investmentincome
Transferincome
Urban
Rural
Wageincome
Agriculturalincome
Businessincome
Investmentincome
Transferincome
Eastern
Central
Western
0.500.47
0.53
0.47 0.47
0.51
0.41
0.46 0.460.44
0.460.44
0.49
German
y
Finlan
dIta
ly
Hunga
ry
Poland
Britain
Norway
Spain
Japa
n
Greece
New Ze
aland
Canad
a
United
State
s
8.5
0.610.61 0.60
10.6
11.7 12 12.1
13 13.4
tran
sfer
/GD
P %
Gin
i
1990
–199
1
1996
–199
7
1998
–199
9
2002
–200
3
2004
–200
5
2006
–200
720
08
0.50
0.47
0.53
0.47 0.47
0.51
0.41
0.46 0.460.44
0.460.44
0.49
German
y
Finlan
dIta
ly
Hunga
ry
Polan
d
Brita
in
Norway
Spain
Japa
n
Greec
e
New Zea
land
Cana
da
United
Stat
es
0.30
0.260.34
0.270.29
0.34
0.25
0.32 0.330.31
0.33 0.32
0.38
Before transfer
After transfer
0.59
0.58
0.57
0.55
* In yuan
* In yuan
* In yuan

Income InequalIty and consumptIon In chIna | 76 | Income InequalIty and consumptIon In chIna
Table 8: Education Level and Urban Household Income*
B. WHAT DoES THE HIGH GInI CoEFFICIEnT In CHInA MEAn?
Although China’s Gini coefficient is quite high compared to the global average, I argue that the number actually reflects an efficient and competitive economy. In an efficient market economy, personal income is determined by its marginal output. Because of vast individual differences in China, the income inequality from market returns is a consequence of effective market resource allocation.
To support this argument, first consider the Gini coefficients including and then excluding households working in industries known to be less competitive, dominated by state-owned enterprises and/or monopolies. The Gini coefficient remains high even when excluding monopoly industries and public servant households. According to CHFS data, excluding households working in nonmarket competitive departments, the total Gini coefficient was 0.58; the figures for urban and rural regions were 0.55 and 0.57 respectively (Table 9). As these figures are not too dissimilar from those for the total sample, income inequality in China is not caused by the high incomes in nonmarket competitive industries, but by the income gap in market competitive industries at the present stage.
Table 9: Gini Coefficient Excluding Monopoly Industry and Public Servant Households
Second, it is widely believed that the eastern part of China has a more developed market economy than central and western China. As shown in Table 1, eastern China has a Gini coefficient of 0.60, higher than those of central China at 0.56 and western China at 0.54. Third, many countries have experienced a period of high Gini coefficients when their economy grew at fast pace.
A typical economic growth story for developing countries, including China, includes a reform of the market economy, trade liberalization, and technological upgrading. These actions may aggravate
42.9
8. 4
23.1
5.6
20.0
43.6
1.7
25.6
7.1
22.0
41.1
25.9
16.5
1.8
14.8
39.6
4.9
30.9
6.8
17.8
38.1
1.2
34.6
8.4
17.7
40.2
21.4
22.7
1.9
13.9
Percentage in total income Contribution to the Gini coefficient (in percentages)
Overall
0.61
Eastern
0.60
Urban
0.58
Central
0.56
Rural
0.61
Western
0.54
53,103
37,290
30,600
33,869
With Without
54.4
55.5
54.9
31.6
22.8
29.2
Percentage of households that saved Saving rate (in percentages)
21,271
38,692
60,927
230,390
Rural householder’s education Annual income
30,415
53,906
110,619
195,282
Urban householder’s education Annual income
50%
40%
30%
20%
10%
0%
50%
40%
30%
20%
10%
0%
0.60
0.50
0.40
0.30
0.20
0.10
0.00
16
14
12
10
8
6
4
2
0
0.62
0.61
0.60
0.59
0.58
0.57
0.56
0.55
0.54
0.53
0.52
0.60
0.50
0.40
0.30
0.20
0.10
0.00
Number of households
receiving subsidy
Overall
Wage income
Agricultural income
Business income
Investment income
Transfer income
Urban
Wage income
Agricultural income
Business income
Investment income
Transfer income
Rural
Wage income
Agricultural income
Business income
Investment income
Transfer income
Income with/without retirement insurance
Income with/without medical insurance
Urban
Rural
Overall
Primary and below
Middle, high school
Junior vocational, senior vocational
Bachelor and above
Primary and below
Middle, high school
Junior vocational, senior vocational
Bachelor and above
All households
Excluding public servant households
Excluding monopoly industry households
Excluding both
Average income
Wage income
Production income
Agriculture income
Business income
Investment income
Transfer income
Retirement insurance, pensions, housing fund, and poverty subsidy
Social network building, etc.
78,944
34,402
21,583
1,351
20,232
5,585
17,375
13,167
4,208
2.2
2.3
3.5
0.1
3.4
8.8
3.3
5.5
1.5
35,806
14,705
15,185
9,270
5,915
635
5,280
2,386
2,894
Urban Rural Urban/Rural
0.61
0.58
0.57
0.58
0.61
0.58
0.57
0.57
0.58
0.56
0.55
0.55
Total Urban Rural
Malaysia
Mexico
Argentina
1996
2000
2003
7.3%
5.1%
7.9%
0.49
0.51
0.55
YearCountry Gini coefficient GDP growth rate
Top 5%
Top 10%
Top 25%
93.6
88.1
83.2
50.0
66.2
83.5
73.5
66.5
56.4
Percentage of households that saved
Total income Saving rate (in percentages)
Share in total saving (in percentages)
Income 46,636 16,99633,614GoodHealth status Normal Poor
Average income
Wage income
Production income
Agriculture income
Business income
Investment income
Transfer income
Retirement insurance, pensions, housing fund, poverty subsidies
Social network building, etc.
82,128
34,921
25,894
3,662
22,232
5,649
15,664
11,481
4,183
2.6
2.7
2.4
0.4
9.3
8.8
2.1
2.3
1.7
34,134
15,973
10,053
4,796
5,257
687
7,421
4,099
3,323
Eastern Central Eastern/Western31,854
12,820
10,851
8,460
2,391
640
7,542
5,031
2,511
Western
Urban
Rural
Overall
31.6%
22.8%
29.2%
59,367
27,643
41,904
78,944
35,806
59,174
Total income (yuan)
Total expenditure(yuan)
Saving rate
24,974
8,163
17,270
Saving(yuan)
Gini before subsidy Gini after subsidy
Method 1
Method 2
Method 3
Method 4
0.61
0.47
0.43
0.38
0.33
9,500
12,800
15,800
—
400 million
320 million
240 million
240 million
Subsidy amount per household
(yuan)
Rural
0.61
0.51
0.47
0.44
0.42
Overall
0.58
0.50
0.47
0.46
0.45
Urban
Bottom 25%
25%–50%
50%–75%
Top 25%
89
90
85
85
53
53
45
26
19
14
4
1
Bottom 25% 25%–50% Top 25%75
82
74
53
50%–75%
Overall
Urban
Rural
0.51
0.50
0.48
0.61
0.58
0.61
0.61
0.58
0.61
Before tax
Household income Household wage income
After tax After tax0.52
0.51
0.49
Before tax
Gini coefficient
Contribution of education on Gini coeffiencent
Gini coefficient after erasing educational inequality
Raise the education level to average OECD level
Raise the education level to average U.S. level
0.61
6%
0.59
0.36
0.38
0.61
11%
0.56
0.44
0.44
Overall Rural0.58
11%
0.54
0.47
0.45
Urban
Social insurance funds not included in fiscal budget
Social insurance funds included in fiscal budget
36.6
46.7
United States12.3
21.2
China
Elementary and below
Middle school and high school
Technical and vocational school
College and above
0.56
0.56
0.52
0.50
Gini coefficientEducation group
Before adjustment
Stick to minimum wage standard
Minimum wage increase by 50%
Minimum wage increase by 100%
0.58
0.57
0.56
0.55
0.61
0.60
0.59
0.58
Overall Urban0.61
0.61
0.59
0.55
Rural
43.6%
42.5%
46.8%
40.2%
27.1%
6.9%
19.1%21.7%
23.7%
2.0%2.0%
15.4%
7.5%
4.5%
14.1%
26.6%
41.1%
1.7%
25.9% 25.6%
16.5%
7.1%
1.8%
22.0%
14.7%
2,500,000
2,000,000
1,500,000
1,000,000
500,000
0
45%
40%
35%
30%
25%
20%
15%
10%
5%
0%
South Asia India Pakistan Bangladesh Other SAARC Afghanistan
South
Asia
India
Nepal
Pakis
tan
Bangla
desh
Bhutan
Maldive
s
Afgh
anist
an
Sri L
anka
Total Population (2010)
Total Population (2050)
Youth Population % of Total (2010)
Youth Population % of Total (2050)
Wageincome
Agriculturalincome
Businessincome
Investmentincome
Transferincome
Urban
Rural
Wageincome
Agriculturalincome
Businessincome
Investmentincome
Transferincome
Eastern
Central
Western
0.500.47
0.53
0.47 0.47
0.51
0.41
0.46 0.460.44
0.460.44
0.49
German
y
Finlan
dIta
ly
Hunga
ry
Poland
Britain
Norway
Spain
Japa
n
Greece
New Ze
aland
Canad
a
United
State
s
8.5
0.610.61 0.60
10.6
11.7 12 12.1
13 13.4
tran
sfer
/GD
P %
Gin
i
1990
–199
1
1996
–199
7
1998
–199
9
2002
–200
3
2004
–200
5
2006
–200
720
08
0.50
0.47
0.53
0.47 0.47
0.51
0.41
0.46 0.460.44
0.460.44
0.49
German
y
Finlan
dIta
ly
Hunga
ry
Polan
d
Brita
in
Norway
Spain
Japa
n
Greec
e
New Zea
land
Cana
da
United
Stat
es
0.30
0.260.34
0.270.29
0.34
0.25
0.32 0.330.31
0.33 0.32
0.38
Before transfer
After transfer
0.59
0.58
0.57
0.55
* In yuan
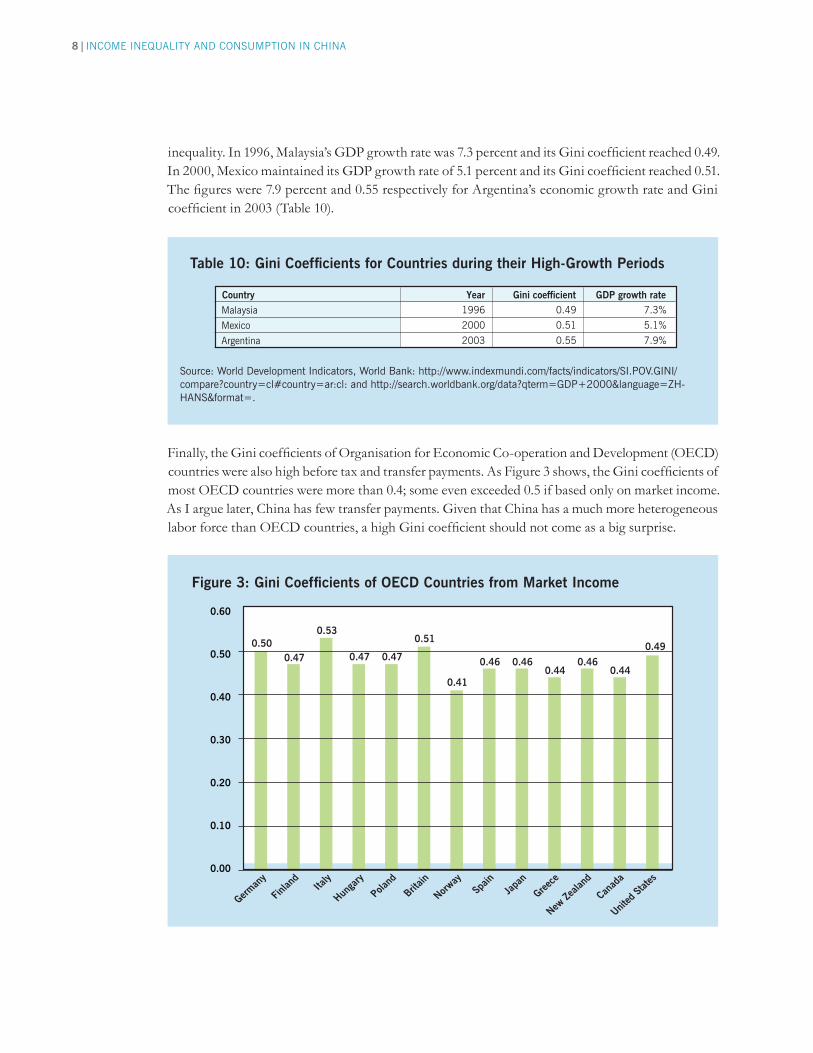
8 | Income InequalIty and consumptIon In chIna
inequality. In 1996, Malaysia’s GDP growth rate was 7.3 percent and its Gini coefficient reached 0.49. In 2000, Mexico maintained its GDP growth rate of 5.1 percent and its Gini coefficient reached 0.51. The figures were 7.9 percent and 0.55 respectively for Argentina’s economic growth rate and Gini coefficient in 2003 (Table 10).
Table 10: Gini Coefficients for Countries during their High-Growth Periods
Source: World development Indicators, World Bank: http://www.indexmundi.com/facts/indicators/SI.PoV.GInI/compare?country=cl#country=ar:cl: and http://search.worldbank.org/data?qterm=GdP+2000&language=Zh-hanS&format=.
Finally, the Gini coefficients of Organisation for Economic Co-operation and Development (OECD) countries were also high before tax and transfer payments. As Figure 3 shows, the Gini coefficients of most OECD countries were more than 0.4; some even exceeded 0.5 if based only on market income. As I argue later, China has few transfer payments. Given that China has a much more heterogeneous labor force than OECD countries, a high Gini coefficient should not come as a big surprise.
Figure 3: Gini Coefficients of oECD Countries from Market Income
42.9
8. 4
23.1
5.6
20.0
43.6
1.7
25.6
7.1
22.0
41.1
25.9
16.5
1.8
14.8
39.6
4.9
30.9
6.8
17.8
38.1
1.2
34.6
8.4
17.7
40.2
21.4
22.7
1.9
13.9
Percentage in total income Contribution to the Gini coefficient (in percentages)
Overall
0.61
Eastern
0.60
Urban
0.58
Central
0.56
Rural
0.61
Western
0.54
53,103
37,290
30,600
33,869
With Without
54.4
55.5
54.9
31.6
22.8
29.2
Percentage of households that saved Saving rate (in percentages)
21,271
38,692
60,927
230,390
Rural householder’s education Annual income
30,415
53,906
110,619
195,282
Urban householder’s education Annual income
50%
40%
30%
20%
10%
0%
50%
40%
30%
20%
10%
0%
0.60
0.50
0.40
0.30
0.20
0.10
0.00
16
14
12
10
8
6
4
2
0
0.62
0.61
0.60
0.59
0.58
0.57
0.56
0.55
0.54
0.53
0.52
0.60
0.50
0.40
0.30
0.20
0.10
0.00
Number of households
receiving subsidy
Overall
Wage income
Agricultural income
Business income
Investment income
Transfer income
Urban
Wage income
Agricultural income
Business income
Investment income
Transfer income
Rural
Wage income
Agricultural income
Business income
Investment income
Transfer income
Income with/without retirement insurance
Income with/without medical insurance
Urban
Rural
Overall
Primary and below
Middle, high school
Junior vocational, senior vocational
Bachelor and above
Primary and below
Middle, high school
Junior vocational, senior vocational
Bachelor and above
All households
Excluding public servant households
Excluding monopoly industry households
Excluding both
Average income
Wage income
Production income
Agriculture income
Business income
Investment income
Transfer income
Retirement insurance, pensions, housing fund, and poverty subsidy
Social network building, etc.
78,944
34,402
21,583
1,351
20,232
5,585
17,375
13,167
4,208
2.2
2.3
3.5
0.1
3.4
8.8
3.3
5.5
1.5
35,806
14,705
15,185
9,270
5,915
635
5,280
2,386
2,894
Urban Rural Urban/Rural
0.61
0.58
0.57
0.58
0.61
0.58
0.57
0.57
0.58
0.56
0.55
0.55
Total Urban Rural
Malaysia
Mexico
Argentina
1996
2000
2003
7.3%
5.1%
7.9%
0.49
0.51
0.55
YearCountry Gini coefficient GDP growth rate
Top 5%
Top 10%
Top 25%
93.6
88.1
83.2
50.0
66.2
83.5
73.5
66.5
56.4
Percentage of households that saved
Total income Saving rate (in percentages)
Share in total saving (in percentages)
Income 46,636 16,99633,614GoodHealth status Normal Poor
Average income
Wage income
Production income
Agriculture income
Business income
Investment income
Transfer income
Retirement insurance, pensions, housing fund, poverty subsidies
Social network building, etc.
82,128
34,921
25,894
3,662
22,232
5,649
15,664
11,481
4,183
2.6
2.7
2.4
0.4
9.3
8.8
2.1
2.3
1.7
34,134
15,973
10,053
4,796
5,257
687
7,421
4,099
3,323
Eastern Central Eastern/Western31,854
12,820
10,851
8,460
2,391
640
7,542
5,031
2,511
Western
Urban
Rural
Overall
31.6%
22.8%
29.2%
59,367
27,643
41,904
78,944
35,806
59,174
Total income (yuan)
Total expenditure(yuan)
Saving rate
24,974
8,163
17,270
Saving(yuan)
Gini before subsidy Gini after subsidy
Method 1
Method 2
Method 3
Method 4
0.61
0.47
0.43
0.38
0.33
9,500
12,800
15,800
—
400 million
320 million
240 million
240 million
Subsidy amount per household
(yuan)
Rural
0.61
0.51
0.47
0.44
0.42
Overall
0.58
0.50
0.47
0.46
0.45
Urban
Bottom 25%
25%–50%
50%–75%
Top 25%
89
90
85
85
53
53
45
26
19
14
4
1
Bottom 25% 25%–50% Top 25%75
82
74
53
50%–75%
Overall
Urban
Rural
0.51
0.50
0.48
0.61
0.58
0.61
0.61
0.58
0.61
Before tax
Household income Household wage income
After tax After tax0.52
0.51
0.49
Before tax
Gini coefficient
Contribution of education on Gini coeffiencent
Gini coefficient after erasing educational inequality
Raise the education level to average OECD level
Raise the education level to average U.S. level
0.61
6%
0.59
0.36
0.38
0.61
11%
0.56
0.44
0.44
Overall Rural0.58
11%
0.54
0.47
0.45
Urban
Social insurance funds not included in fiscal budget
Social insurance funds included in fiscal budget
36.6
46.7
United States12.3
21.2
China
Elementary and below
Middle school and high school
Technical and vocational school
College and above
0.56
0.56
0.52
0.50
Gini coefficientEducation group
Before adjustment
Stick to minimum wage standard
Minimum wage increase by 50%
Minimum wage increase by 100%
0.58
0.57
0.56
0.55
0.61
0.60
0.59
0.58
Overall Urban0.61
0.61
0.59
0.55
Rural
43.6%
42.5%
46.8%
40.2%
27.1%
6.9%
19.1%21.7%
23.7%
2.0%2.0%
15.4%
7.5%
4.5%
14.1%
26.6%
41.1%
1.7%
25.9% 25.6%
16.5%
7.1%
1.8%
22.0%
14.7%
2,500,000
2,000,000
1,500,000
1,000,000
500,000
0
45%
40%
35%
30%
25%
20%
15%
10%
5%
0%
South Asia India Pakistan Bangladesh Other SAARC Afghanistan
South
Asia
India
Nepal
Pakis
tan
Bangla
desh
Bhutan
Maldive
s
Afgh
anist
an
Sri L
anka
Total Population (2010)
Total Population (2050)
Youth Population % of Total (2010)
Youth Population % of Total (2050)
Wageincome
Agriculturalincome
Businessincome
Investmentincome
Transferincome
Urban
Rural
Wageincome
Agriculturalincome
Businessincome
Investmentincome
Transferincome
Eastern
Central
Western
0.500.47
0.53
0.47 0.47
0.51
0.41
0.46 0.460.44
0.460.44
0.49
German
y
Finlan
dIta
ly
Hunga
ry
Poland
Britain
Norway
Spain
Japa
n
Greece
New Ze
aland
Canad
a
United
State
s
8.5
0.610.61 0.60
10.6
11.7 12 12.1
13 13.4
tran
sfer
/GD
P %
Gin
i
1990
–199
1
1996
–199
7
1998
–199
9
2002
–200
3
2004
–200
5
2006
–200
720
08
0.50
0.47
0.53
0.47 0.47
0.51
0.41
0.46 0.460.44
0.460.44
0.49
German
y
Finlan
dIta
ly
Hunga
ry
Polan
d
Brita
in
Norway
Spain
Japa
n
Greec
e
New Zea
land
Cana
da
United
Stat
es
0.30
0.260.34
0.270.29
0.34
0.25
0.32 0.330.31
0.33 0.32
0.38
Before transfer
After transfer
0.59
0.58
0.57
0.55

Income InequalIty and consumptIon In chIna | 98 | Income InequalIty and consumptIon In chIna
C. InCoME InEqUALITy AnD InSUFFICIEnT ConSUMPTIon
Chinese households have been known to be savers. The country’s high saving rate has been considered one of the key factors that contributed to the financial crisis in 2008. According to CHFS data, the aggregate saving rate for Chinese households is 29.2 percent. The saving rate for urban households is 31.6 percent; the rate for rural households is 22.8 percent (Table 11).
Table 11: Household Saving Rates
However, not every household saves. Surprisingly, only 54.9 percent of households saved in 2010 (Table 12).
Table 12: Percentage of Households that Saved in 2010
Saving rates across income levels differ. The top 5 percent income households have an average saving rate of 73.5 percent, and 93.6 percent of households in that category saved in 2010. The share of the total savings for the top 5 percent income households is 50 percent. Households in the top 10 percent income category own 66.2 percent of total saving, whereas households in top 25 percent income category own 83.5 percent of total saving (Table 13).
Table 13: Percentage of Households that Saved in 2010 by Income Level
42.9
8. 4
23.1
5.6
20.0
43.6
1.7
25.6
7.1
22.0
41.1
25.9
16.5
1.8
14.8
39.6
4.9
30.9
6.8
17.8
38.1
1.2
34.6
8.4
17.7
40.2
21.4
22.7
1.9
13.9
Percentage in total income Contribution to the Gini coefficient (in percentages)
Overall
0.61
Eastern
0.60
Urban
0.58
Central
0.56
Rural
0.61
Western
0.54
53,103
37,290
30,600
33,869
With Without
54.4
55.5
54.9
31.6
22.8
29.2
Percentage of households that saved Saving rate (in percentages)
21,271
38,692
60,927
230,390
Rural householder’s education Annual income
30,415
53,906
110,619
195,282
Urban householder’s education Annual income
50%
40%
30%
20%
10%
0%
50%
40%
30%
20%
10%
0%
0.60
0.50
0.40
0.30
0.20
0.10
0.00
16
14
12
10
8
6
4
2
0
0.62
0.61
0.60
0.59
0.58
0.57
0.56
0.55
0.54
0.53
0.52
0.60
0.50
0.40
0.30
0.20
0.10
0.00
Number of households
receiving subsidy
Overall
Wage income
Agricultural income
Business income
Investment income
Transfer income
Urban
Wage income
Agricultural income
Business income
Investment income
Transfer income
Rural
Wage income
Agricultural income
Business income
Investment income
Transfer income
Income with/without retirement insurance
Income with/without medical insurance
Urban
Rural
Overall
Primary and below
Middle, high school
Junior vocational, senior vocational
Bachelor and above
Primary and below
Middle, high school
Junior vocational, senior vocational
Bachelor and above
All households
Excluding public servant households
Excluding monopoly industry households
Excluding both
Average income
Wage income
Production income
Agriculture income
Business income
Investment income
Transfer income
Retirement insurance, pensions, housing fund, and poverty subsidy
Social network building, etc.
78,944
34,402
21,583
1,351
20,232
5,585
17,375
13,167
4,208
2.2
2.3
3.5
0.1
3.4
8.8
3.3
5.5
1.5
35,806
14,705
15,185
9,270
5,915
635
5,280
2,386
2,894
Urban Rural Urban/Rural
0.61
0.58
0.57
0.58
0.61
0.58
0.57
0.57
0.58
0.56
0.55
0.55
Total Urban Rural
Malaysia
Mexico
Argentina
1996
2000
2003
7.3%
5.1%
7.9%
0.49
0.51
0.55
YearCountry Gini coefficient GDP growth rate
Top 5%
Top 10%
Top 25%
93.6
88.1
83.2
50.0
66.2
83.5
73.5
66.5
56.4
Percentage of households that saved
Total income Saving rate (in percentages)
Share in total saving (in percentages)
Income 46,636 16,99633,614GoodHealth status Normal Poor
Average income
Wage income
Production income
Agriculture income
Business income
Investment income
Transfer income
Retirement insurance, pensions, housing fund, poverty subsidies
Social network building, etc.
82,128
34,921
25,894
3,662
22,232
5,649
15,664
11,481
4,183
2.6
2.7
2.4
0.4
9.3
8.8
2.1
2.3
1.7
34,134
15,973
10,053
4,796
5,257
687
7,421
4,099
3,323
Eastern Central Eastern/Western31,854
12,820
10,851
8,460
2,391
640
7,542
5,031
2,511
Western
Urban
Rural
Overall
31.6%
22.8%
29.2%
59,367
27,643
41,904
78,944
35,806
59,174
Total income (yuan)
Total expenditure(yuan)
Saving rate
24,974
8,163
17,270
Saving(yuan)
Gini before subsidy Gini after subsidy
Method 1
Method 2
Method 3
Method 4
0.61
0.47
0.43
0.38
0.33
9,500
12,800
15,800
—
400 million
320 million
240 million
240 million
Subsidy amount per household
(yuan)
Rural
0.61
0.51
0.47
0.44
0.42
Overall
0.58
0.50
0.47
0.46
0.45
Urban
Bottom 25%
25%–50%
50%–75%
Top 25%
89
90
85
85
53
53
45
26
19
14
4
1
Bottom 25% 25%–50% Top 25%75
82
74
53
50%–75%
Overall
Urban
Rural
0.51
0.50
0.48
0.61
0.58
0.61
0.61
0.58
0.61
Before tax
Household income Household wage income
After tax After tax0.52
0.51
0.49
Before tax
Gini coefficient
Contribution of education on Gini coeffiencent
Gini coefficient after erasing educational inequality
Raise the education level to average OECD level
Raise the education level to average U.S. level
0.61
6%
0.59
0.36
0.38
0.61
11%
0.56
0.44
0.44
Overall Rural0.58
11%
0.54
0.47
0.45
Urban
Social insurance funds not included in fiscal budget
Social insurance funds included in fiscal budget
36.6
46.7
United States12.3
21.2
China
Elementary and below
Middle school and high school
Technical and vocational school
College and above
0.56
0.56
0.52
0.50
Gini coefficientEducation group
Before adjustment
Stick to minimum wage standard
Minimum wage increase by 50%
Minimum wage increase by 100%
0.58
0.57
0.56
0.55
0.61
0.60
0.59
0.58
Overall Urban0.61
0.61
0.59
0.55
Rural
43.6%
42.5%
46.8%
40.2%
27.1%
6.9%
19.1%21.7%
23.7%
2.0%2.0%
15.4%
7.5%
4.5%
14.1%
26.6%
41.1%
1.7%
25.9% 25.6%
16.5%
7.1%
1.8%
22.0%
14.7%
2,500,000
2,000,000
1,500,000
1,000,000
500,000
0
45%
40%
35%
30%
25%
20%
15%
10%
5%
0%
South Asia India Pakistan Bangladesh Other SAARC Afghanistan
South
Asia
India
Nepal
Pakis
tan
Bangla
desh
Bhutan
Maldive
s
Afgh
anist
an
Sri L
anka
Total Population (2010)
Total Population (2050)
Youth Population % of Total (2010)
Youth Population % of Total (2050)
Wageincome
Agriculturalincome
Businessincome
Investmentincome
Transferincome
Urban
Rural
Wageincome
Agriculturalincome
Businessincome
Investmentincome
Transferincome
Eastern
Central
Western
0.500.47
0.53
0.47 0.47
0.51
0.41
0.46 0.460.44
0.460.44
0.49
German
y
Finlan
dIta
ly
Hunga
ry
Poland
Britain
Norway
Spain
Japa
n
Greece
New Ze
aland
Canad
a
United
State
s
8.5
0.610.61 0.60
10.6
11.7 12 12.1
13 13.4
tran
sfer
/GD
P %
Gin
i
1990
–199
1
1996
–199
7
1998
–199
9
2002
–200
3
2004
–200
5
2006
–200
720
08
0.50
0.47
0.53
0.47 0.47
0.51
0.41
0.46 0.460.44
0.460.44
0.49
German
y
Finlan
dIta
ly
Hunga
ry
Polan
d
Brita
in
Norway
Spain
Japa
n
Greec
e
New Zea
land
Cana
da
United
Stat
es
0.30
0.260.34
0.270.29
0.34
0.25
0.32 0.330.31
0.33 0.32
0.38
Before transfer
After transfer
0.59
0.58
0.57
0.55

10 | Income InequalIty and consumptIon In chIna
One possible reason for the large variation in saving rates is the great uncertainty in income levels. Given that only one wave of the CHFS is available, I compared the percentage of urban households that saved by both income and asset categories in Table 14. From the table, it is clear that households from low-asset and low-income groups are less likely to save in a given year.
Table 14: Percentage of Households that Saved: by Income and Assets (urban)
To summarize, as expected, Table 11 shows a high aggregate household saving rate in China. However, Table 12 shows that not all households saved. About 45 percent of households did not save in 2010. These households likely face liquidity constraints. They have the incentive to consume but do not have sufficient money to do so. An economic policy that raises consumption among low-income households would lower the aggregate saving rate and thus becomes a policy of economic transition and growth.
D. WAyS To REDUCE THE HIGH GInI CoEFFICIEnT
The Chinese government has recognized the importance of reducing income inequality. One of the main initiatives it employs to address the problem is wage guidance. Other measures include raising minimum wages and issuing higher tax rates for rich households. However, these policies may not work effectively. Wage guidance will distort the labor market price, directly affecting market efficiency. The key factor for the success of the market economy operation is the “invisible hand” of effective price functionality. The same applies to the labor market. Artificial intervention on labor market prices will typically distort the price signals of information passing into the supply and demand sides of the labor market.
A substantial increase of the minimum wage may be harmful to low-income groups, the very people the standard is intended to protect. According to related research, every 10 percent increase of the minimum wage will raise enterprise average wage by 0.4 percent but will reduce the number of employees by 0.6 percent at the same time.
As Table 15 illustrates, increasing the minimum wage will, in fact, not have a significant effect on the income gap; without considering market efficiency, strict implementation of minimum wage regulations would reduce the Gini coefficient by only 0.01. Moreover, among CHFS samples, only 6 percent of workers receive wages lower than the local minimum wage standard.
42.9
8. 4
23.1
5.6
20.0
43.6
1.7
25.6
7.1
22.0
41.1
25.9
16.5
1.8
14.8
39.6
4.9
30.9
6.8
17.8
38.1
1.2
34.6
8.4
17.7
40.2
21.4
22.7
1.9
13.9
Percentage in total income Contribution to the Gini coefficient (in percentages)
Overall
0.61
Eastern
0.60
Urban
0.58
Central
0.56
Rural
0.61
Western
0.54
53,103
37,290
30,600
33,869
With Without
54.4
55.5
54.9
31.6
22.8
29.2
Percentage of households that saved Saving rate (in percentages)
21,271
38,692
60,927
230,390
Rural householder’s education Annual income
30,415
53,906
110,619
195,282
Urban householder’s education Annual income
50%
40%
30%
20%
10%
0%
50%
40%
30%
20%
10%
0%
0.60
0.50
0.40
0.30
0.20
0.10
0.00
16
14
12
10
8
6
4
2
0
0.62
0.61
0.60
0.59
0.58
0.57
0.56
0.55
0.54
0.53
0.52
0.60
0.50
0.40
0.30
0.20
0.10
0.00
Number of households
receiving subsidy
Overall
Wage income
Agricultural income
Business income
Investment income
Transfer income
Urban
Wage income
Agricultural income
Business income
Investment income
Transfer income
Rural
Wage income
Agricultural income
Business income
Investment income
Transfer income
Income with/without retirement insurance
Income with/without medical insurance
Urban
Rural
Overall
Primary and below
Middle, high school
Junior vocational, senior vocational
Bachelor and above
Primary and below
Middle, high school
Junior vocational, senior vocational
Bachelor and above
All households
Excluding public servant households
Excluding monopoly industry households
Excluding both
Average income
Wage income
Production income
Agriculture income
Business income
Investment income
Transfer income
Retirement insurance, pensions, housing fund, and poverty subsidy
Social network building, etc.
78,944
34,402
21,583
1,351
20,232
5,585
17,375
13,167
4,208
2.2
2.3
3.5
0.1
3.4
8.8
3.3
5.5
1.5
35,806
14,705
15,185
9,270
5,915
635
5,280
2,386
2,894
Urban Rural Urban/Rural
0.61
0.58
0.57
0.58
0.61
0.58
0.57
0.57
0.58
0.56
0.55
0.55
Total Urban Rural
Malaysia
Mexico
Argentina
1996
2000
2003
7.3%
5.1%
7.9%
0.49
0.51
0.55
YearCountry Gini coefficient GDP growth rate
Top 5%
Top 10%
Top 25%
93.6
88.1
83.2
50.0
66.2
83.5
73.5
66.5
56.4
Percentage of households that saved
Total income Saving rate (in percentages)
Share in total saving (in percentages)
Income 46,636 16,99633,614GoodHealth status Normal Poor
Average income
Wage income
Production income
Agriculture income
Business income
Investment income
Transfer income
Retirement insurance, pensions, housing fund, poverty subsidies
Social network building, etc.
82,128
34,921
25,894
3,662
22,232
5,649
15,664
11,481
4,183
2.6
2.7
2.4
0.4
9.3
8.8
2.1
2.3
1.7
34,134
15,973
10,053
4,796
5,257
687
7,421
4,099
3,323
Eastern Central Eastern/Western31,854
12,820
10,851
8,460
2,391
640
7,542
5,031
2,511
Western
Urban
Rural
Overall
31.6%
22.8%
29.2%
59,367
27,643
41,904
78,944
35,806
59,174
Total income (yuan)
Total expenditure(yuan)
Saving rate
24,974
8,163
17,270
Saving(yuan)
Gini before subsidy Gini after subsidy
Method 1
Method 2
Method 3
Method 4
0.61
0.47
0.43
0.38
0.33
9,500
12,800
15,800
—
400 million
320 million
240 million
240 million
Subsidy amount per household
(yuan)
Rural
0.61
0.51
0.47
0.44
0.42
Overall
0.58
0.50
0.47
0.46
0.45
Urban
Bottom 25%
25%–50%
50%–75%
Top 25%
89
90
85
85
53
53
45
26
19
14
4
1
Bottom 25% 25%–50% Top 25%75
82
74
53
50%–75%
Overall
Urban
Rural
0.51
0.50
0.48
0.61
0.58
0.61
0.61
0.58
0.61
Before tax
Household income Household wage income
After tax After tax0.52
0.51
0.49
Before tax
Gini coefficient
Contribution of education on Gini coeffiencent
Gini coefficient after erasing educational inequality
Raise the education level to average OECD level
Raise the education level to average U.S. level
0.61
6%
0.59
0.36
0.38
0.61
11%
0.56
0.44
0.44
Overall Rural0.58
11%
0.54
0.47
0.45
Urban
Social insurance funds not included in fiscal budget
Social insurance funds included in fiscal budget
36.6
46.7
United States12.3
21.2
China
Elementary and below
Middle school and high school
Technical and vocational school
College and above
0.56
0.56
0.52
0.50
Gini coefficientEducation group
Before adjustment
Stick to minimum wage standard
Minimum wage increase by 50%
Minimum wage increase by 100%
0.58
0.57
0.56
0.55
0.61
0.60
0.59
0.58
Overall Urban0.61
0.61
0.59
0.55
Rural
43.6%
42.5%
46.8%
40.2%
27.1%
6.9%
19.1%21.7%
23.7%
2.0%2.0%
15.4%
7.5%
4.5%
14.1%
26.6%
41.1%
1.7%
25.9% 25.6%
16.5%
7.1%
1.8%
22.0%
14.7%
2,500,000
2,000,000
1,500,000
1,000,000
500,000
0
45%
40%
35%
30%
25%
20%
15%
10%
5%
0%
South Asia India Pakistan Bangladesh Other SAARC Afghanistan
South
Asia
India
Nepal
Pakis
tan
Bangla
desh
Bhutan
Maldive
s
Afgh
anist
an
Sri L
anka
Total Population (2010)
Total Population (2050)
Youth Population % of Total (2010)
Youth Population % of Total (2050)
Wageincome
Agriculturalincome
Businessincome
Investmentincome
Transferincome
Urban
Rural
Wageincome
Agriculturalincome
Businessincome
Investmentincome
Transferincome
Eastern
Central
Western
0.500.47
0.53
0.47 0.47
0.51
0.41
0.46 0.460.44
0.460.44
0.49
German
y
Finlan
dIta
ly
Hunga
ry
Poland
Britain
Norway
Spain
Japa
n
Greece
New Ze
aland
Canad
a
United
State
s
8.5
0.610.61 0.60
10.6
11.7 12 12.1
13 13.4
tran
sfer
/GD
P %
Gin
i
1990
–199
1
1996
–199
7
1998
–199
9
2002
–200
3
2004
–200
5
2006
–200
720
08
0.50
0.47
0.53
0.47 0.47
0.51
0.41
0.46 0.460.44
0.460.44
0.49
German
y
Finlan
dIta
ly
Hunga
ry
Polan
d
Brita
in
Norway
Spain
Japa
n
Greec
e
New Zea
land
Cana
da
United
Stat
es
0.30
0.260.34
0.270.29
0.34
0.25
0.32 0.330.31
0.33 0.32
0.38
Before transfer
After transfer
0.59
0.58
0.57
0.55

Income InequalIty and consumptIon In chIna | 1110 | Income InequalIty and consumptIon In chIna
Table 15: Gini Coefficient after Minimum Wage Adjustment
In addition, China’s current income tax policies have done little to reduce income inequality. High-income families already carry a comparatively high tax burden: the top 20 percent of high-income households have an average tax rate of 6.4 percent, accounting for 91 percent of the total income tax paid by all households (Table 16).
Table 16: Gini and Current Income Tax Policy
From the experience of OECD countries, transfer payments have played an effective role in eliminating income inequality and reducing poverty. Figure 4 indicates that most OECD countries successfully reduced their Gini coefficients through wealth redistribution using transfer payments. For instance, Germany’s Gini coefficient decreased from 0.5 to 0.3. According to a report released by the American Congressional Budget Office in 2009, through transfer payments, the annual household income of the bottom 20 percent percentile group grew from $7,600 to about $30,000, and the Gini coefficient decreased from 0.49 to 0.38.3
Similar effects can be seen in Latin American countries. Beginning in the early 1990s, Argentina’s income gap increased dramatically; by 2003, the annual average GDP per capita reached US$6,565 and the Gini coefficient approached 0.55.4 The government responded with a large-scale transfer payment policy that covered 20 percent of poor households in 2002. The income gap gradually narrowed.
In 1994, Mexico’s GDP per capita was US$5,242 and the Gini coefficient reached 0.52. The government began to pursue the policy of making transfer payments in the 1990s, including a
42.9
8. 4
23.1
5.6
20.0
43.6
1.7
25.6
7.1
22.0
41.1
25.9
16.5
1.8
14.8
39.6
4.9
30.9
6.8
17.8
38.1
1.2
34.6
8.4
17.7
40.2
21.4
22.7
1.9
13.9
Percentage in total income Contribution to the Gini coefficient (in percentages)
Overall
0.61
Eastern
0.60
Urban
0.58
Central
0.56
Rural
0.61
Western
0.54
53,103
37,290
30,600
33,869
With Without
54.4
55.5
54.9
31.6
22.8
29.2
Percentage of households that saved Saving rate (in percentages)
21,271
38,692
60,927
230,390
Rural householder’s education Annual income
30,415
53,906
110,619
195,282
Urban householder’s education Annual income
50%
40%
30%
20%
10%
0%
50%
40%
30%
20%
10%
0%
0.60
0.50
0.40
0.30
0.20
0.10
0.00
16
14
12
10
8
6
4
2
0
0.62
0.61
0.60
0.59
0.58
0.57
0.56
0.55
0.54
0.53
0.52
0.60
0.50
0.40
0.30
0.20
0.10
0.00
Number of households
receiving subsidy
Overall
Wage income
Agricultural income
Business income
Investment income
Transfer income
Urban
Wage income
Agricultural income
Business income
Investment income
Transfer income
Rural
Wage income
Agricultural income
Business income
Investment income
Transfer income
Income with/without retirement insurance
Income with/without medical insurance
Urban
Rural
Overall
Primary and below
Middle, high school
Junior vocational, senior vocational
Bachelor and above
Primary and below
Middle, high school
Junior vocational, senior vocational
Bachelor and above
All households
Excluding public servant households
Excluding monopoly industry households
Excluding both
Average income
Wage income
Production income
Agriculture income
Business income
Investment income
Transfer income
Retirement insurance, pensions, housing fund, and poverty subsidy
Social network building, etc.
78,944
34,402
21,583
1,351
20,232
5,585
17,375
13,167
4,208
2.2
2.3
3.5
0.1
3.4
8.8
3.3
5.5
1.5
35,806
14,705
15,185
9,270
5,915
635
5,280
2,386
2,894
Urban Rural Urban/Rural
0.61
0.58
0.57
0.58
0.61
0.58
0.57
0.57
0.58
0.56
0.55
0.55
Total Urban Rural
Malaysia
Mexico
Argentina
1996
2000
2003
7.3%
5.1%
7.9%
0.49
0.51
0.55
YearCountry Gini coefficient GDP growth rate
Top 5%
Top 10%
Top 25%
93.6
88.1
83.2
50.0
66.2
83.5
73.5
66.5
56.4
Percentage of households that saved
Total income Saving rate (in percentages)
Share in total saving (in percentages)
Income 46,636 16,99633,614GoodHealth status Normal Poor
Average income
Wage income
Production income
Agriculture income
Business income
Investment income
Transfer income
Retirement insurance, pensions, housing fund, poverty subsidies
Social network building, etc.
82,128
34,921
25,894
3,662
22,232
5,649
15,664
11,481
4,183
2.6
2.7
2.4
0.4
9.3
8.8
2.1
2.3
1.7
34,134
15,973
10,053
4,796
5,257
687
7,421
4,099
3,323
Eastern Central Eastern/Western31,854
12,820
10,851
8,460
2,391
640
7,542
5,031
2,511
Western
Urban
Rural
Overall
31.6%
22.8%
29.2%
59,367
27,643
41,904
78,944
35,806
59,174
Total income (yuan)
Total expenditure(yuan)
Saving rate
24,974
8,163
17,270
Saving(yuan)
Gini before subsidy Gini after subsidy
Method 1
Method 2
Method 3
Method 4
0.61
0.47
0.43
0.38
0.33
9,500
12,800
15,800
—
400 million
320 million
240 million
240 million
Subsidy amount per household
(yuan)
Rural
0.61
0.51
0.47
0.44
0.42
Overall
0.58
0.50
0.47
0.46
0.45
Urban
Bottom 25%
25%–50%
50%–75%
Top 25%
89
90
85
85
53
53
45
26
19
14
4
1
Bottom 25% 25%–50% Top 25%75
82
74
53
50%–75%
Overall
Urban
Rural
0.51
0.50
0.48
0.61
0.58
0.61
0.61
0.58
0.61
Before tax
Household income Household wage income
After tax After tax0.52
0.51
0.49
Before tax
Gini coefficient
Contribution of education on Gini coeffiencent
Gini coefficient after erasing educational inequality
Raise the education level to average OECD level
Raise the education level to average U.S. level
0.61
6%
0.59
0.36
0.38
0.61
11%
0.56
0.44
0.44
Overall Rural0.58
11%
0.54
0.47
0.45
Urban
Social insurance funds not included in fiscal budget
Social insurance funds included in fiscal budget
36.6
46.7
United States12.3
21.2
China
Elementary and below
Middle school and high school
Technical and vocational school
College and above
0.56
0.56
0.52
0.50
Gini coefficientEducation group
Before adjustment
Stick to minimum wage standard
Minimum wage increase by 50%
Minimum wage increase by 100%
0.58
0.57
0.56
0.55
0.61
0.60
0.59
0.58
Overall Urban0.61
0.61
0.59
0.55
Rural
43.6%
42.5%
46.8%
40.2%
27.1%
6.9%
19.1%21.7%
23.7%
2.0%2.0%
15.4%
7.5%
4.5%
14.1%
26.6%
41.1%
1.7%
25.9% 25.6%
16.5%
7.1%
1.8%
22.0%
14.7%
2,500,000
2,000,000
1,500,000
1,000,000
500,000
0
45%
40%
35%
30%
25%
20%
15%
10%
5%
0%
South Asia India Pakistan Bangladesh Other SAARC Afghanistan
South
Asia
India
Nepal
Pakis
tan
Bangla
desh
Bhutan
Maldive
s
Afgh
anist
an
Sri L
anka
Total Population (2010)
Total Population (2050)
Youth Population % of Total (2010)
Youth Population % of Total (2050)
Wageincome
Agriculturalincome
Businessincome
Investmentincome
Transferincome
Urban
Rural
Wageincome
Agriculturalincome
Businessincome
Investmentincome
Transferincome
Eastern
Central
Western
0.500.47
0.53
0.47 0.47
0.51
0.41
0.46 0.460.44
0.460.44
0.49
German
y
Finlan
dIta
ly
Hunga
ry
Poland
Britain
Norway
Spain
Japa
n
Greece
New Ze
aland
Canad
a
United
State
s
8.5
0.610.61 0.60
10.6
11.7 12 12.1
13 13.4
tran
sfer
/GD
P %
Gin
i
1990
–199
1
1996
–199
7
1998
–199
9
2002
–200
3
2004
–200
5
2006
–200
720
08
0.50
0.47
0.53
0.47 0.47
0.51
0.41
0.46 0.460.44
0.460.44
0.49
German
y
Finlan
dIta
ly
Hunga
ry
Polan
d
Brita
in
Norway
Spain
Japa
n
Greec
e
New Zea
land
Cana
da
United
Stat
es
0.30
0.260.34
0.270.29
0.34
0.25
0.32 0.330.31
0.33 0.32
0.38
Before transfer
After transfer
0.59
0.58
0.57
0.55
3 The Distribution of Household Income and Federal Taxes, 2008 and 2009, Congressional Budget Office: http://www.cbo.gov/publication/43373.4 On Argentina’s Gini coefficient: Assessment of Development Results, Evaluation of UNDP Contribution: Argentina, undP, may 2009, p. 21: http://web.undp.org/execbrd/pdf/adr-argentina.pdf.

12 | Income InequalIty and consumptIon In chIna
project named “Progresa,” which covered 500,000 households and aimed to support children’s education among poor families. Since the end of the 1990s, Mexico’s unemployment rate has decreased year by year, from 52 percent in 2000 to 48 percent in 2006.
In 1989, Brazil’s GDP per capita was US$6,565 and its Gini coefficient reached 0.63.5 To narrow the income gap, the Brazilian government implemented transfer payment policies that allowed households to receive funds equaling 29 percent of their total income (Figure 5). Among these programs, the project “Bolsa Familia,” aimed at improving children’s education and adults’ health, covered about 1.1 million households, accounting for 50 percent of the nation’s poor families. Brazil’s Gini coefficient gradually decreased at the start of the twenty-first century.
Relative to OECD countries, China devotes insufficient funds to social welfare programs. In 2011, China’s social welfare expenditure accounted only for 12.3 percent of public fiscal expenditure (excluding social insurance), compared with 36.6 percent in the United States (Table 17).
5 On Brazil’s Gini coefficient: ”The Rise and Fall of Brazilian Inequality, 1981–2004,” Macroeconomic Dynamics, 15 June 2007: http://siteresources.worldbank.org/IntPoVreS/resources/477227-1142543871921/rise_and_fall_Fll_mdy07013%5B001-032%5d.pdf.
42.9
8. 4
23.1
5.6
20.0
43.6
1.7
25.6
7.1
22.0
41.1
25.9
16.5
1.8
14.8
39.6
4.9
30.9
6.8
17.8
38.1
1.2
34.6
8.4
17.7
40.2
21.4
22.7
1.9
13.9
Percentage in total income Contribution to the Gini coefficient (in percentages)
Overall
0.61
Eastern
0.60
Urban
0.58
Central
0.56
Rural
0.61
Western
0.54
53,103
37,290
30,600
33,869
With Without
54.4
55.5
54.9
31.6
22.8
29.2
Percentage of households that saved Saving rate (in percentages)
21,271
38,692
60,927
230,390
Rural householder’s education Annual income
30,415
53,906
110,619
195,282
Urban householder’s education Annual income
50%
40%
30%
20%
10%
0%
50%
40%
30%
20%
10%
0%
0.60
0.50
0.40
0.30
0.20
0.10
0.00
16
14
12
10
8
6
4
2
0
0.62
0.61
0.60
0.59
0.58
0.57
0.56
0.55
0.54
0.53
0.52
0.60
0.50
0.40
0.30
0.20
0.10
0.00
Number of households
receiving subsidy
Overall
Wage income
Agricultural income
Business income
Investment income
Transfer income
Urban
Wage income
Agricultural income
Business income
Investment income
Transfer income
Rural
Wage income
Agricultural income
Business income
Investment income
Transfer income
Income with/without retirement insurance
Income with/without medical insurance
Urban
Rural
Overall
Primary and below
Middle, high school
Junior vocational, senior vocational
Bachelor and above
Primary and below
Middle, high school
Junior vocational, senior vocational
Bachelor and above
All households
Excluding public servant households
Excluding monopoly industry households
Excluding both
Average income
Wage income
Production income
Agriculture income
Business income
Investment income
Transfer income
Retirement insurance, pensions, housing fund, and poverty subsidy
Social network building, etc.
78,944
34,402
21,583
1,351
20,232
5,585
17,375
13,167
4,208
2.2
2.3
3.5
0.1
3.4
8.8
3.3
5.5
1.5
35,806
14,705
15,185
9,270
5,915
635
5,280
2,386
2,894
Urban Rural Urban/Rural
0.61
0.58
0.57
0.58
0.61
0.58
0.57
0.57
0.58
0.56
0.55
0.55
Total Urban Rural
Malaysia
Mexico
Argentina
1996
2000
2003
7.3%
5.1%
7.9%
0.49
0.51
0.55
YearCountry Gini coefficient GDP growth rate
Top 5%
Top 10%
Top 25%
93.6
88.1
83.2
50.0
66.2
83.5
73.5
66.5
56.4
Percentage of households that saved
Total income Saving rate (in percentages)
Share in total saving (in percentages)
Income 46,636 16,99633,614GoodHealth status Normal Poor
Average income
Wage income
Production income
Agriculture income
Business income
Investment income
Transfer income
Retirement insurance, pensions, housing fund, poverty subsidies
Social network building, etc.
82,128
34,921
25,894
3,662
22,232
5,649
15,664
11,481
4,183
2.6
2.7
2.4
0.4
9.3
8.8
2.1
2.3
1.7
34,134
15,973
10,053
4,796
5,257
687
7,421
4,099
3,323
Eastern Central Eastern/Western31,854
12,820
10,851
8,460
2,391
640
7,542
5,031
2,511
Western
Urban
Rural
Overall
31.6%
22.8%
29.2%
59,367
27,643
41,904
78,944
35,806
59,174
Total income (yuan)
Total expenditure(yuan)
Saving rate
24,974
8,163
17,270
Saving(yuan)
Gini before subsidy Gini after subsidy
Method 1
Method 2
Method 3
Method 4
0.61
0.47
0.43
0.38
0.33
9,500
12,800
15,800
—
400 million
320 million
240 million
240 million
Subsidy amount per household
(yuan)
Rural
0.61
0.51
0.47
0.44
0.42
Overall
0.58
0.50
0.47
0.46
0.45
Urban
Bottom 25%
25%–50%
50%–75%
Top 25%
89
90
85
85
53
53
45
26
19
14
4
1
Bottom 25% 25%–50% Top 25%75
82
74
53
50%–75%
Overall
Urban
Rural
0.51
0.50
0.48
0.61
0.58
0.61
0.61
0.58
0.61
Before tax
Household income Household wage income
After tax After tax0.52
0.51
0.49
Before tax
Gini coefficient
Contribution of education on Gini coeffiencent
Gini coefficient after erasing educational inequality
Raise the education level to average OECD level
Raise the education level to average U.S. level
0.61
6%
0.59
0.36
0.38
0.61
11%
0.56
0.44
0.44
Overall Rural0.58
11%
0.54
0.47
0.45
Urban
Social insurance funds not included in fiscal budget
Social insurance funds included in fiscal budget
36.6
46.7
United States12.3
21.2
China
Elementary and below
Middle school and high school
Technical and vocational school
College and above
0.56
0.56
0.52
0.50
Gini coefficientEducation group
Before adjustment
Stick to minimum wage standard
Minimum wage increase by 50%
Minimum wage increase by 100%
0.58
0.57
0.56
0.55
0.61
0.60
0.59
0.58
Overall Urban0.61
0.61
0.59
0.55
Rural
43.6%
42.5%
46.8%
40.2%
27.1%
6.9%
19.1%21.7%
23.7%
2.0%2.0%
15.4%
7.5%
4.5%
14.1%
26.6%
41.1%
1.7%
25.9% 25.6%
16.5%
7.1%
1.8%
22.0%
14.7%
2,500,000
2,000,000
1,500,000
1,000,000
500,000
0
45%
40%
35%
30%
25%
20%
15%
10%
5%
0%
South Asia India Pakistan Bangladesh Other SAARC Afghanistan
South
Asia
India
Nepal
Pakis
tan
Bangla
desh
Bhutan
Maldive
s
Afgh
anist
an
Sri L
anka
Total Population (2010)
Total Population (2050)
Youth Population % of Total (2010)
Youth Population % of Total (2050)
Wageincome
Agriculturalincome
Businessincome
Investmentincome
Transferincome
Urban
Rural
Wageincome
Agriculturalincome
Businessincome
Investmentincome
Transferincome
Eastern
Central
Western
0.500.47
0.53
0.47 0.47
0.51
0.41
0.46 0.460.44
0.460.44
0.49
German
y
Finlan
dIta
ly
Hunga
ry
Poland
Britain
Norway
Spain
Japa
n
Greece
New Ze
aland
Canad
a
United
State
s
8.5
0.610.61 0.60
10.6
11.7 12 12.1
13 13.4
tran
sfer
/GD
P %
Gin
i
1990
–199
1
1996
–199
7
1998
–199
9
2002
–200
3
2004
–200
5
2006
–200
720
08
0.50
0.47
0.53
0.47 0.47
0.51
0.41
0.46 0.460.44
0.460.44
0.49
German
y
Finlan
dIta
ly
Hunga
ry
Polan
d
Brita
in
Norway
Spain
Japa
n
Greec
e
New Zea
land
Cana
da
United
Stat
es
0.30
0.260.34
0.270.29
0.34
0.25
0.32 0.330.31
0.33 0.32
0.38
Before transfer
After transfer
0.59
0.58
0.57
0.55
Figure 4: Comparison of Gini before and after Transfer Payments of oECD Countries

Income InequalIty and consumptIon In chIna | 1312 | Income InequalIty and consumptIon In chIna
Table 17: Social Welfare Expenditure as a Percentage of Government Spending
As a consequence of low government spending, sufficient support is not available to poor families. According to CHFS data, if we define poor households as those whose average daily consumption is below US$1.25, then 70.8 percent of poor households did not receive any government subsidies in 2010.
In addition, the coverage rate for social retirement insurance is too low. CHFS data suggest that 45 percent of households do not receive any retirement insurance or employer-provided retirement income. At the same time, the participation rate in social unemployment insurance is only 30 percent, and the unemployment payment equals just 17 percent of the average salary.
Lastly, although the current health insurance system covers the majority of China’s population, the benefits received differ substantially because of varying premium contribution levels. Low-income
42.9
8. 4
23.1
5.6
20.0
43.6
1.7
25.6
7.1
22.0
41.1
25.9
16.5
1.8
14.8
39.6
4.9
30.9
6.8
17.8
38.1
1.2
34.6
8.4
17.7
40.2
21.4
22.7
1.9
13.9
Percentage in total income Contribution to the Gini coefficient (in percentages)
Overall
0.61
Eastern
0.60
Urban
0.58
Central
0.56
Rural
0.61
Western
0.54
53,103
37,290
30,600
33,869
With Without
54.4
55.5
54.9
31.6
22.8
29.2
Percentage of households that saved Saving rate (in percentages)
21,271
38,692
60,927
230,390
Rural householder’s education Annual income
30,415
53,906
110,619
195,282
Urban householder’s education Annual income
50%
40%
30%
20%
10%
0%
50%
40%
30%
20%
10%
0%
0.60
0.50
0.40
0.30
0.20
0.10
0.00
16
14
12
10
8
6
4
2
0
0.62
0.61
0.60
0.59
0.58
0.57
0.56
0.55
0.54
0.53
0.52
0.60
0.50
0.40
0.30
0.20
0.10
0.00
Number of households
receiving subsidy
Overall
Wage income
Agricultural income
Business income
Investment income
Transfer income
Urban
Wage income
Agricultural income
Business income
Investment income
Transfer income
Rural
Wage income
Agricultural income
Business income
Investment income
Transfer income
Income with/without retirement insurance
Income with/without medical insurance
Urban
Rural
Overall
Primary and below
Middle, high school
Junior vocational, senior vocational
Bachelor and above
Primary and below
Middle, high school
Junior vocational, senior vocational
Bachelor and above
All households
Excluding public servant households
Excluding monopoly industry households
Excluding both
Average income
Wage income
Production income
Agriculture income
Business income
Investment income
Transfer income
Retirement insurance, pensions, housing fund, and poverty subsidy
Social network building, etc.
78,944
34,402
21,583
1,351
20,232
5,585
17,375
13,167
4,208
2.2
2.3
3.5
0.1
3.4
8.8
3.3
5.5
1.5
35,806
14,705
15,185
9,270
5,915
635
5,280
2,386
2,894
Urban Rural Urban/Rural
0.61
0.58
0.57
0.58
0.61
0.58
0.57
0.57
0.58
0.56
0.55
0.55
Total Urban Rural
Malaysia
Mexico
Argentina
1996
2000
2003
7.3%
5.1%
7.9%
0.49
0.51
0.55
YearCountry Gini coefficient GDP growth rate
Top 5%
Top 10%
Top 25%
93.6
88.1
83.2
50.0
66.2
83.5
73.5
66.5
56.4
Percentage of households that saved
Total income Saving rate (in percentages)
Share in total saving (in percentages)
Income 46,636 16,99633,614GoodHealth status Normal Poor
Average income
Wage income
Production income
Agriculture income
Business income
Investment income
Transfer income
Retirement insurance, pensions, housing fund, poverty subsidies
Social network building, etc.
82,128
34,921
25,894
3,662
22,232
5,649
15,664
11,481
4,183
2.6
2.7
2.4
0.4
9.3
8.8
2.1
2.3
1.7
34,134
15,973
10,053
4,796
5,257
687
7,421
4,099
3,323
Eastern Central Eastern/Western31,854
12,820
10,851
8,460
2,391
640
7,542
5,031
2,511
Western
Urban
Rural
Overall
31.6%
22.8%
29.2%
59,367
27,643
41,904
78,944
35,806
59,174
Total income (yuan)
Total expenditure(yuan)
Saving rate
24,974
8,163
17,270
Saving(yuan)
Gini before subsidy Gini after subsidy
Method 1
Method 2
Method 3
Method 4
0.61
0.47
0.43
0.38
0.33
9,500
12,800
15,800
—
400 million
320 million
240 million
240 million
Subsidy amount per household
(yuan)
Rural
0.61
0.51
0.47
0.44
0.42
Overall
0.58
0.50
0.47
0.46
0.45
Urban
Bottom 25%
25%–50%
50%–75%
Top 25%
89
90
85
85
53
53
45
26
19
14
4
1
Bottom 25% 25%–50% Top 25%75
82
74
53
50%–75%
Overall
Urban
Rural
0.51
0.50
0.48
0.61
0.58
0.61
0.61
0.58
0.61
Before tax
Household income Household wage income
After tax After tax0.52
0.51
0.49
Before tax
Gini coefficient
Contribution of education on Gini coeffiencent
Gini coefficient after erasing educational inequality
Raise the education level to average OECD level
Raise the education level to average U.S. level
0.61
6%
0.59
0.36
0.38
0.61
11%
0.56
0.44
0.44
Overall Rural0.58
11%
0.54
0.47
0.45
Urban
Social insurance funds not included in fiscal budget
Social insurance funds included in fiscal budget
36.6
46.7
United States12.3
21.2
China
Elementary and below
Middle school and high school
Technical and vocational school
College and above
0.56
0.56
0.52
0.50
Gini coefficientEducation group
Before adjustment
Stick to minimum wage standard
Minimum wage increase by 50%
Minimum wage increase by 100%
0.58
0.57
0.56
0.55
0.61
0.60
0.59
0.58
Overall Urban0.61
0.61
0.59
0.55
Rural
43.6%
42.5%
46.8%
40.2%
27.1%
6.9%
19.1%21.7%
23.7%
2.0%2.0%
15.4%
7.5%
4.5%
14.1%
26.6%
41.1%
1.7%
25.9% 25.6%
16.5%
7.1%
1.8%
22.0%
14.7%
2,500,000
2,000,000
1,500,000
1,000,000
500,000
0
45%
40%
35%
30%
25%
20%
15%
10%
5%
0%
South Asia India Pakistan Bangladesh Other SAARC Afghanistan
South
Asia
India
Nepal
Pakis
tan
Bangla
desh
Bhutan
Maldive
s
Afgh
anist
an
Sri L
anka
Total Population (2010)
Total Population (2050)
Youth Population % of Total (2010)
Youth Population % of Total (2050)
Wageincome
Agriculturalincome
Businessincome
Investmentincome
Transferincome
Urban
Rural
Wageincome
Agriculturalincome
Businessincome
Investmentincome
Transferincome
Eastern
Central
Western
0.500.47
0.53
0.47 0.47
0.51
0.41
0.46 0.460.44
0.460.44
0.49
German
y
Finlan
dIta
ly
Hunga
ry
Poland
Britain
Norway
Spain
Japa
n
Greece
New Ze
aland
Canad
a
United
State
s
8.5
0.610.61 0.60
10.6
11.7 12 12.1
13 13.4
tran
sfer
/GD
P %
Gin
i
1990
–199
1
1996
–199
7
1998
–199
9
2002
–200
3
2004
–200
5
2006
–200
720
08
0.50
0.47
0.53
0.47 0.47
0.51
0.41
0.46 0.460.44
0.460.44
0.49
German
y
Finlan
dIta
ly
Hunga
ry
Polan
d
Brita
in
Norway
Spain
Japa
n
Greec
e
New Zea
land
Cana
da
United
Stat
es
0.30
0.260.34
0.270.29
0.34
0.25
0.32 0.330.31
0.33 0.32
0.38
Before transfer
After transfer
0.59
0.58
0.57
0.55
42.9
8. 4
23.1
5.6
20.0
43.6
1.7
25.6
7.1
22.0
41.1
25.9
16.5
1.8
14.8
39.6
4.9
30.9
6.8
17.8
38.1
1.2
34.6
8.4
17.7
40.2
21.4
22.7
1.9
13.9
Percentage in total income Contribution to the Gini coefficient (in percentages)
Overall
0.61
Eastern
0.60
Urban
0.58
Central
0.56
Rural
0.61
Western
0.54
53,103
37,290
30,600
33,869
With Without
54.4
55.5
54.9
31.6
22.8
29.2
Percentage of households that saved Saving rate (in percentages)
21,271
38,692
60,927
230,390
Rural householder’s education Annual income
30,415
53,906
110,619
195,282
Urban householder’s education Annual income
50%
40%
30%
20%
10%
0%
50%
40%
30%
20%
10%
0%
0.60
0.50
0.40
0.30
0.20
0.10
0.00
16
14
12
10
8
6
4
2
0
0.62
0.61
0.60
0.59
0.58
0.57
0.56
0.55
0.54
0.53
0.52
0.60
0.50
0.40
0.30
0.20
0.10
0.00
Number of households
receiving subsidy
Overall
Wage income
Agricultural income
Business income
Investment income
Transfer income
Urban
Wage income
Agricultural income
Business income
Investment income
Transfer income
Rural
Wage income
Agricultural income
Business income
Investment income
Transfer income
Income with/without retirement insurance
Income with/without medical insurance
Urban
Rural
Overall
Primary and below
Middle, high school
Junior vocational, senior vocational
Bachelor and above
Primary and below
Middle, high school
Junior vocational, senior vocational
Bachelor and above
All households
Excluding public servant households
Excluding monopoly industry households
Excluding both
Average income
Wage income
Production income
Agriculture income
Business income
Investment income
Transfer income
Retirement insurance, pensions, housing fund, and poverty subsidy
Social network building, etc.
78,944
34,402
21,583
1,351
20,232
5,585
17,375
13,167
4,208
2.2
2.3
3.5
0.1
3.4
8.8
3.3
5.5
1.5
35,806
14,705
15,185
9,270
5,915
635
5,280
2,386
2,894
Urban Rural Urban/Rural
0.61
0.58
0.57
0.58
0.61
0.58
0.57
0.57
0.58
0.56
0.55
0.55
Total Urban Rural
Malaysia
Mexico
Argentina
1996
2000
2003
7.3%
5.1%
7.9%
0.49
0.51
0.55
YearCountry Gini coefficient GDP growth rate
Top 5%
Top 10%
Top 25%
93.6
88.1
83.2
50.0
66.2
83.5
73.5
66.5
56.4
Percentage of households that saved
Total income Saving rate (in percentages)
Share in total saving (in percentages)
Income 46,636 16,99633,614GoodHealth status Normal Poor
Average income
Wage income
Production income
Agriculture income
Business income
Investment income
Transfer income
Retirement insurance, pensions, housing fund, poverty subsidies
Social network building, etc.
82,128
34,921
25,894
3,662
22,232
5,649
15,664
11,481
4,183
2.6
2.7
2.4
0.4
9.3
8.8
2.1
2.3
1.7
34,134
15,973
10,053
4,796
5,257
687
7,421
4,099
3,323
Eastern Central Eastern/Western31,854
12,820
10,851
8,460
2,391
640
7,542
5,031
2,511
Western
Urban
Rural
Overall
31.6%
22.8%
29.2%
59,367
27,643
41,904
78,944
35,806
59,174
Total income (yuan)
Total expenditure(yuan)
Saving rate
24,974
8,163
17,270
Saving(yuan)
Gini before subsidy Gini after subsidy
Method 1
Method 2
Method 3
Method 4
0.61
0.47
0.43
0.38
0.33
9,500
12,800
15,800
—
400 million
320 million
240 million
240 million
Subsidy amount per household
(yuan)
Rural
0.61
0.51
0.47
0.44
0.42
Overall
0.58
0.50
0.47
0.46
0.45
Urban
Bottom 25%
25%–50%
50%–75%
Top 25%
89
90
85
85
53
53
45
26
19
14
4
1
Bottom 25% 25%–50% Top 25%75
82
74
53
50%–75%
Overall
Urban
Rural
0.51
0.50
0.48
0.61
0.58
0.61
0.61
0.58
0.61
Before tax
Household income Household wage income
After tax After tax0.52
0.51
0.49
Before tax
Gini coefficient
Contribution of education on Gini coeffiencent
Gini coefficient after erasing educational inequality
Raise the education level to average OECD level
Raise the education level to average U.S. level
0.61
6%
0.59
0.36
0.38
0.61
11%
0.56
0.44
0.44
Overall Rural0.58
11%
0.54
0.47
0.45
Urban
Social insurance funds not included in fiscal budget
Social insurance funds included in fiscal budget
36.6
46.7
United States12.3
21.2
China
Elementary and below
Middle school and high school
Technical and vocational school
College and above
0.56
0.56
0.52
0.50
Gini coefficientEducation group
Before adjustment
Stick to minimum wage standard
Minimum wage increase by 50%
Minimum wage increase by 100%
0.58
0.57
0.56
0.55
0.61
0.60
0.59
0.58
Overall Urban0.61
0.61
0.59
0.55
Rural
43.6%
42.5%
46.8%
40.2%
27.1%
6.9%
19.1%21.7%
23.7%
2.0%2.0%
15.4%
7.5%
4.5%
14.1%
26.6%
41.1%
1.7%
25.9% 25.6%
16.5%
7.1%
1.8%
22.0%
14.7%
2,500,000
2,000,000
1,500,000
1,000,000
500,000
0
45%
40%
35%
30%
25%
20%
15%
10%
5%
0%
South Asia India Pakistan Bangladesh Other SAARC Afghanistan
South
Asia
India
Nepal
Pakis
tan
Bangla
desh
Bhutan
Maldive
s
Afgh
anist
an
Sri L
anka
Total Population (2010)
Total Population (2050)
Youth Population % of Total (2010)
Youth Population % of Total (2050)
Wageincome
Agriculturalincome
Businessincome
Investmentincome
Transferincome
Urban
Rural
Wageincome
Agriculturalincome
Businessincome
Investmentincome
Transferincome
Eastern
Central
Western
0.500.47
0.53
0.47 0.47
0.51
0.41
0.46 0.460.44
0.460.44
0.49
German
y
Finlan
dIta
ly
Hunga
ry
Poland
Britain
Norway
Spain
Japa
n
Greece
New Ze
aland
Canad
a
United
State
s
8.5
0.610.61 0.60
10.6
11.7 12 12.1
13 13.4tr
ansf
er/G
DP
%G
ini
1990
–199
1
1996
–199
7
1998
–199
9
2002
–200
3
2004
–200
5
2006
–200
720
08
0.50
0.47
0.53
0.47 0.47
0.51
0.41
0.46 0.460.44
0.460.44
0.49
German
y
Finlan
dIta
ly
Hunga
ry
Polan
d
Brita
in
Norway
Spain
Japa
n
Greec
e
New Zea
land
Cana
da
United
Stat
es
0.30
0.260.34
0.270.29
0.34
0.25
0.32 0.330.31
0.33 0.32
0.38
Before transfer
After transfer
0.59
0.58
0.57
0.55
Figure 5: Changing Gini Coefficient in Latin America

14 | Income InequalIty and consumptIon In chIna
families, unable to meet premiums, rarely receive any social welfare benefits. If the government can raise the social welfare standard of rural areas to that of urban areas, poor families would enjoy the same level of social welfare as wealthy families, greatly reducing income disparity.
It is important to point out that the Chinese government has sufficient financial resources to undertake redistribution policies. One important source of additional revenue is profits from state-owned enterprises. According to data released by the Ministry of Finance, state-owned enterprises made 1.94 trillion yuan in 2012, yet only 4.2 percent (823 billion yuan) was turned in to the government. China’s state fiscal revenue reached 11.7 trillion yuan in 2012, a 12.8 percent increase from the previous year. Moreover, the government ran a low level of budget deficit at 1.5 percent of GDP in 2012.
If the Chinese government uses 80 percent of state-owned enterprises’ profits (about 1.55 trillion yuan) and half of the newly added increased revenue at 0.75 trillion yuan, runs another 3 percentage point budget deficit at 1.5 trillion yuan, and uses 3.8 trillion yuan for income redistribution programs, it would have a significant effect on lowering income inequality in China.
We calculate the Gini coefficient based on CHFS data under various funding methods. A subsidy to the bottom 60 percent of households could reduce China’s Gini coefficient from 0.61 to 0.40; the rural Gini coefficient could be reduced even further, from 0.60 to 0.27. If we design a more precise subsidy system, the transfer payment would have a more obvious effect on adjusting income disparity (Table 18).
Table 18: Gini Coefficients after Different Subsidies
note: (1) the total subsidy amount is 3.8 trillion yuan.(2) Subsidy methods 1–3: every household receives an equal subsidy.(3) Subsidy method 4: subsidy amount is 23,500 yuan for the lowest 20% income household; 17,500 yuan for the lower and middle 20% income household; 6,500 yuan for the middle 20% income household.
E. EFFECTIvE InCoME TRAnSFER PoLICIES
One major concern of income transfer policies is the possibility of creating welfare-dependent beneficiaries. However, experiences in both developed and developing countries suggest that it is
42.9
8. 4
23.1
5.6
20.0
43.6
1.7
25.6
7.1
22.0
41.1
25.9
16.5
1.8
14.8
39.6
4.9
30.9
6.8
17.8
38.1
1.2
34.6
8.4
17.7
40.2
21.4
22.7
1.9
13.9
Percentage in total income Contribution to the Gini coefficient (in percentages)
Overall
0.61
Eastern
0.60
Urban
0.58
Central
0.56
Rural
0.61
Western
0.54
53,103
37,290
30,600
33,869
With Without
54.4
55.5
54.9
31.6
22.8
29.2
Percentage of households that saved Saving rate (in percentages)
21,271
38,692
60,927
230,390
Rural householder’s education Annual income
30,415
53,906
110,619
195,282
Urban householder’s education Annual income
50%
40%
30%
20%
10%
0%
50%
40%
30%
20%
10%
0%
0.60
0.50
0.40
0.30
0.20
0.10
0.00
16
14
12
10
8
6
4
2
0
0.62
0.61
0.60
0.59
0.58
0.57
0.56
0.55
0.54
0.53
0.52
0.60
0.50
0.40
0.30
0.20
0.10
0.00
Number of households
receiving subsidy
Overall
Wage income
Agricultural income
Business income
Investment income
Transfer income
Urban
Wage income
Agricultural income
Business income
Investment income
Transfer income
Rural
Wage income
Agricultural income
Business income
Investment income
Transfer income
Income with/without retirement insurance
Income with/without medical insurance
Urban
Rural
Overall
Primary and below
Middle, high school
Junior vocational, senior vocational
Bachelor and above
Primary and below
Middle, high school
Junior vocational, senior vocational
Bachelor and above
All households
Excluding public servant households
Excluding monopoly industry households
Excluding both
Average income
Wage income
Production income
Agriculture income
Business income
Investment income
Transfer income
Retirement insurance, pensions, housing fund, and poverty subsidy
Social network building, etc.
78,944
34,402
21,583
1,351
20,232
5,585
17,375
13,167
4,208
2.2
2.3
3.5
0.1
3.4
8.8
3.3
5.5
1.5
35,806
14,705
15,185
9,270
5,915
635
5,280
2,386
2,894
Urban Rural Urban/Rural
0.61
0.58
0.57
0.58
0.61
0.58
0.57
0.57
0.58
0.56
0.55
0.55
Total Urban Rural
Malaysia
Mexico
Argentina
1996
2000
2003
7.3%
5.1%
7.9%
0.49
0.51
0.55
YearCountry Gini coefficient GDP growth rate
Top 5%
Top 10%
Top 25%
93.6
88.1
83.2
50.0
66.2
83.5
73.5
66.5
56.4
Percentage of households that saved
Total income Saving rate (in percentages)
Share in total saving (in percentages)
Income 46,636 16,99633,614GoodHealth status Normal Poor
Average income
Wage income
Production income
Agriculture income
Business income
Investment income
Transfer income
Retirement insurance, pensions, housing fund, poverty subsidies
Social network building, etc.
82,128
34,921
25,894
3,662
22,232
5,649
15,664
11,481
4,183
2.6
2.7
2.4
0.4
9.3
8.8
2.1
2.3
1.7
34,134
15,973
10,053
4,796
5,257
687
7,421
4,099
3,323
Eastern Central Eastern/Western31,854
12,820
10,851
8,460
2,391
640
7,542
5,031
2,511
Western
Urban
Rural
Overall
31.6%
22.8%
29.2%
59,367
27,643
41,904
78,944
35,806
59,174
Total income (yuan)
Total expenditure(yuan)
Saving rate
24,974
8,163
17,270
Saving(yuan)
Gini before subsidy Gini after subsidy
Method 1
Method 2
Method 3
Method 4
0.61
0.47
0.43
0.38
0.33
9,500
12,800
15,800
—
400 million
320 million
240 million
240 million
Subsidy amount per household
(yuan)
Rural
0.61
0.51
0.47
0.44
0.42
Overall
0.58
0.50
0.47
0.46
0.45
Urban
Bottom 25%
25%–50%
50%–75%
Top 25%
89
90
85
85
53
53
45
26
19
14
4
1
Bottom 25% 25%–50% Top 25%75
82
74
53
50%–75%
Overall
Urban
Rural
0.51
0.50
0.48
0.61
0.58
0.61
0.61
0.58
0.61
Before tax
Household income Household wage income
After tax After tax0.52
0.51
0.49
Before tax
Gini coefficient
Contribution of education on Gini coeffiencent
Gini coefficient after erasing educational inequality
Raise the education level to average OECD level
Raise the education level to average U.S. level
0.61
6%
0.59
0.36
0.38
0.61
11%
0.56
0.44
0.44
Overall Rural0.58
11%
0.54
0.47
0.45
Urban
Social insurance funds not included in fiscal budget
Social insurance funds included in fiscal budget
36.6
46.7
United States12.3
21.2
China
Elementary and below
Middle school and high school
Technical and vocational school
College and above
0.56
0.56
0.52
0.50
Gini coefficientEducation group
Before adjustment
Stick to minimum wage standard
Minimum wage increase by 50%
Minimum wage increase by 100%
0.58
0.57
0.56
0.55
0.61
0.60
0.59
0.58
Overall Urban0.61
0.61
0.59
0.55
Rural
43.6%
42.5%
46.8%
40.2%
27.1%
6.9%
19.1%21.7%
23.7%
2.0%2.0%
15.4%
7.5%
4.5%
14.1%
26.6%
41.1%
1.7%
25.9% 25.6%
16.5%
7.1%
1.8%
22.0%
14.7%
2,500,000
2,000,000
1,500,000
1,000,000
500,000
0
45%
40%
35%
30%
25%
20%
15%
10%
5%
0%
South Asia India Pakistan Bangladesh Other SAARC Afghanistan
South
Asia
India
Nepal
Pakis
tan
Bangla
desh
Bhutan
Maldive
s
Afgh
anist
an
Sri L
anka
Total Population (2010)
Total Population (2050)
Youth Population % of Total (2010)
Youth Population % of Total (2050)
Wageincome
Agriculturalincome
Businessincome
Investmentincome
Transferincome
Urban
Rural
Wageincome
Agriculturalincome
Businessincome
Investmentincome
Transferincome
Eastern
Central
Western
0.500.47
0.53
0.47 0.47
0.51
0.41
0.46 0.460.44
0.460.44
0.49
German
y
Finlan
dIta
ly
Hunga
ry
Poland
Britain
Norway
Spain
Japa
n
Greece
New Ze
aland
Canad
a
United
State
s
8.5
0.610.61 0.60
10.6
11.7 12 12.1
13 13.4
tran
sfer
/GD
P %
Gin
i
1990
–199
1
1996
–199
7
1998
–199
9
2002
–200
3
2004
–200
5
2006
–200
720
08
0.50
0.47
0.53
0.47 0.47
0.51
0.41
0.46 0.460.44
0.460.44
0.49
German
y
Finlan
dIta
ly
Hunga
ry
Polan
d
Brita
in
Norway
Spain
Japa
n
Greec
e
New Zea
land
Cana
da
United
Stat
es
0.30
0.260.34
0.270.29
0.34
0.25
0.32 0.330.31
0.33 0.32
0.38
Before transfer
After transfer
0.59
0.58
0.57
0.55

Income InequalIty and consumptIon In chIna | 1514 | Income InequalIty and consumptIon In chIna
entirely possible to have incentive-compatible programs. Two broad program categories are briefly discussed here: conditional cash transfer (CCT) and earned income tax credits (EITC).
Conditional Cash Transfer (CCT)
Conditional Cash Transfer (CCT) is a social welfare program that provides financial assistance to impoverished households, usually dependent on specific criteria receivers must meet. Such criteria may include enrolling children in school and gaining access to health care and other social services. CCT’s advantage is that it creates incentives for poor households to take actions that have positive social effects while aiding them in the process.
Despite CCTs limited existence in China, CCT programs are popular in many other countries. Almost all Latin American countries have implemented some form of CCT program. CCT has played a significant role in helping poor households escape the poverty trap; improving children’s school enrollment, health, and nutrition; increasing poor households’ level of consumption; and reducing the poverty rate. In Mexico, over the course of two years, children who participated in CCT programs grew one centimeter taller than children not participating. The country’s dropout rates also declined by 24 percent, whereas high school graduation rates increased by 23 percent. Soon after Nicaragua’s “Red de Proteccion Social” (Social Security Network) program began, the rate of immunization increased by 18 percent. Similarly, in Ecuador, in just two years after CCT implementation, the secondary school enrollment rate increased by 10 percent and child labor decreased by 17 percent among beneficiary households. Additionally, CCT programs have been proven to increase the average rate of consumption among poor households, with growth rates ranging from 15 percent in Colombia to 30 percent in Honduras. CCTs also positively affect the reduction of income disparity and poverty. For example, poverty rates dropped by 10 percent and 7 percent in Mexico and Nicaragua, respectively, after the first two years of employing CCT programs.
Comparatively, China has few programs similar to CCTs. One successful initiative is the national nutrition improvement program for rural students. The pilot project, initiated in 2011, includes 680 counties (cities) and 26 million students. The central government provides nutritional meal supplements equivalent to three yuan per student per day for primary and secondary students. As the funds are usually transferred to schools, however, monetary aid may not be spent entirely on students.
In December 2011, UNICEF initiated a CCT pilot in several provinces in China, including Sichuan, Yunnan, Gansu, Hebei, and Guangxi, among others. It is the first nutrition and health CCT in China. The “Maternal and Child Health Integrated Project” and the “Mother and Child Health Promotion Project” will also be implemented at pilot sites. These programs aim to improve the utilization, quality, and efficiency of maternal and child health services in poor areas. Services will include prenatal examinations, nutritional supplements, hospital delivery, breastfeeding counseling and training, postpartum symptoms management, and immunization. The scale of these projects is small and no study of their effects is yet available.
16 | Income InequalIty and consumptIon In chIna
Adopting CCT programs in China is particularly important today. A large number of migrant workers and their families now live in cities. Whereas these workers are paid less relative to their urban counterparts in the hukuo, or household registration system, they actually have a higher cost of living because they have lower homeownership rates and are not part of the urban social safety network. As a result, migrant families spend only half as much as urban families on their children’s education. This disparity in education spending creates a real possibility of an intergenerational transmission of poverty. An effective way to solve this problem is to start a CCT program for migrant workers. The government could pay rural migrant families to send their children to schools and provide them with free meals similar to programs in rural areas. Additionally, the government might allow rural migrant workers in urban areas to be a part of the urban social safety network.
Di Bao and Earned Income Tax Credits (EITC)
In the United States, EITC is a proven incentive-compatible system. The program subsidizes those who work but earn low incomes. Thirty percent of American households have benefited from this program with an average $2,300 in annual benefits. The program has been shown to generate work incentives and enjoys support from both Democrats and Republicans. China can learn from such a program.
Right now, the subsistence welfare system (Di Bao) is China’s leading social welfare program for the poor. The beneficiaries of the system are residents who have local hukou and whose household per capita income is lower than the local minimum standard. In addition to the Di Bao system, some other assistance initiatives include programs for workers laid off by state-owned enterprises; rural resident assistance in the form of food, clothing, medical care, housing, and burial expenses; and homeless relief. The coverage of these programs is relatively narrow, however, and they have a limited impact on income gap reduction. Di Bao is by far the largest program, covering 74.9 million people. Total government spending in 2011 was 66.5 billion yuan for the rural Di Bao program and 67.5 billion yuan for the urban Di Bao. (For comparative purposes, in 2011 the government spent 18.9 billion yuan on workers laid off from state-owned enterprises, 18.5 billion yuan on other rural resident assistance, and only 2 billion yuan on homeless relief.)
Although Di Bao has enjoyed tremendous success as a major social welfare program in China by covering a large number of people who are in extreme poverty, it also has several problems. First, the benefits from Di Bao are insufficient. The program’s objective is to increase income over a certain threshold. If any household per capita income is lower than the threshold, Di Bao will fill in the gap. A typical threshold is set at a level that is far too low, that is, 20 percent to 25 percent of the local average income. In November 2012, the Di Bao monthly per capita expenditure was only 235 yuan in cities and 104 yuan in rural areas.
Second, the Di Bao system is rather restrictive, based on hukou; poor migrant households are excluded from the urban Di Bao system. Meanwhile, as a migrant worker’s income is generally
Income InequalIty and consumptIon In chIna | 1716 | Income InequalIty and consumptIon In chIna
higher than someone still living in a rural area, he or she is not qualified to receive benefits from the rural Di Bao either. For migrant households, higher living costs in the cities crowd out education spending for their children. Without help, an intergenerational transmission of poverty is likely to occur.
Third, the current Di Bao system creates “benefit dependency.” About 61 percent of the people who enjoy Di Bao benefits in urban areas have the ability to work. However, the current system discourages them from doing so. As mentioned earlier, the benefits cover the gap between beneficiaries’ income and the minimum subsistence level in most provinces, and they cover a 100 percent tax for incomes lower than the threshold level. The combined benefits may actually reinforce beneficiaries’ dependence on benefits. Additionally, the beneficiary status of Di Bao is a prerequisite for some other assistance policies. An increased income not only leads to an equal amount of reduction in Di Bao benefits that offsets the increase, but also disqualifies beneficiaries from other assistance programs when income exceeds minimum subsistence. This greatly impairs work incentives for Di Bao beneficiaries.
I propose the creation of an incentive that is compatible with the Di Bao system. An immediate reform of the Di Bao would allow beneficiaries who have successfully found jobs to maintain their Di Bao benefits for a transitional period of at least one year, possibly more. The maximum length of the transitional period should be the subject of further research. I also suggest that a person’s Di Bao status should partially depend on his or her work efforts. For example, 50 percent or less of the Di Bao benefits could depend on the beneficiary’s participation in training, active job search, or the setting up of his or her own business. These types of requirements would also include Di Bao in the previously discussed CCT category. F. LonG-RUn SoLUTIon: EDUCATIon
In the long run, education is an important way of increasing human resource capital, and increasing the government’s investment in education is regarded as an effective means of providing more equal access to opportunities. Taking a long-term perspective, reducing educational inequality can reduce income inequality.
By comparing the household income gap among different education levels, we can find that the income gap is smaller within the higher education group. The largest income disparity exists among the group whose household heads have only an elementary or below education level, showing a Gini coefficient of 0.56. The income gap is smaller within the group whose household heads have a college or above education level. This indicates that a difference in education level has a clear relation to income disparity (Table 19).

18 | Income InequalIty and consumptIon In chIna
Table 19: Gini Coefficients for Different Education Levels
Table 20 indicates that educational inequality contributes about 11 percent to income inequality as indicated by the Gini coefficient. At a rough estimate, if educational marginal returns remain unchanged and the educational level rises to the average American or OECD level, China’s Gini coefficient will fall to 0.44.
Table 20: Effect of Education Level on Gini Coefficient
note: (1) average education level of oecd countries: primary, 26%; secondary, 44%; higher, 30%.(2) average education level of united States: middle school and above, 11%; high school, 47%; technological, 10%; college and above.
42.9
8. 4
23.1
5.6
20.0
43.6
1.7
25.6
7.1
22.0
41.1
25.9
16.5
1.8
14.8
39.6
4.9
30.9
6.8
17.8
38.1
1.2
34.6
8.4
17.7
40.2
21.4
22.7
1.9
13.9
Percentage in total income Contribution to the Gini coefficient (in percentages)
Overall
0.61
Eastern
0.60
Urban
0.58
Central
0.56
Rural
0.61
Western
0.54
53,103
37,290
30,600
33,869
With Without
54.4
55.5
54.9
31.6
22.8
29.2
Percentage of households that saved Saving rate (in percentages)
21,271
38,692
60,927
230,390
Rural householder’s education Annual income
30,415
53,906
110,619
195,282
Urban householder’s education Annual income
50%
40%
30%
20%
10%
0%
50%
40%
30%
20%
10%
0%
0.60
0.50
0.40
0.30
0.20
0.10
0.00
16
14
12
10
8
6
4
2
0
0.62
0.61
0.60
0.59
0.58
0.57
0.56
0.55
0.54
0.53
0.52
0.60
0.50
0.40
0.30
0.20
0.10
0.00
Number of households
receiving subsidy
Overall
Wage income
Agricultural income
Business income
Investment income
Transfer income
Urban
Wage income
Agricultural income
Business income
Investment income
Transfer income
Rural
Wage income
Agricultural income
Business income
Investment income
Transfer income
Income with/without retirement insurance
Income with/without medical insurance
Urban
Rural
Overall
Primary and below
Middle, high school
Junior vocational, senior vocational
Bachelor and above
Primary and below
Middle, high school
Junior vocational, senior vocational
Bachelor and above
All households
Excluding public servant households
Excluding monopoly industry households
Excluding both
Average income
Wage income
Production income
Agriculture income
Business income
Investment income
Transfer income
Retirement insurance, pensions, housing fund, and poverty subsidy
Social network building, etc.
78,944
34,402
21,583
1,351
20,232
5,585
17,375
13,167
4,208
2.2
2.3
3.5
0.1
3.4
8.8
3.3
5.5
1.5
35,806
14,705
15,185
9,270
5,915
635
5,280
2,386
2,894
Urban Rural Urban/Rural
0.61
0.58
0.57
0.58
0.61
0.58
0.57
0.57
0.58
0.56
0.55
0.55
Total Urban Rural
Malaysia
Mexico
Argentina
1996
2000
2003
7.3%
5.1%
7.9%
0.49
0.51
0.55
YearCountry Gini coefficient GDP growth rate
Top 5%
Top 10%
Top 25%
93.6
88.1
83.2
50.0
66.2
83.5
73.5
66.5
56.4
Percentage of households that saved
Total income Saving rate (in percentages)
Share in total saving (in percentages)
Income 46,636 16,99633,614GoodHealth status Normal Poor
Average income
Wage income
Production income
Agriculture income
Business income
Investment income
Transfer income
Retirement insurance, pensions, housing fund, poverty subsidies
Social network building, etc.
82,128
34,921
25,894
3,662
22,232
5,649
15,664
11,481
4,183
2.6
2.7
2.4
0.4
9.3
8.8
2.1
2.3
1.7
34,134
15,973
10,053
4,796
5,257
687
7,421
4,099
3,323
Eastern Central Eastern/Western31,854
12,820
10,851
8,460
2,391
640
7,542
5,031
2,511
Western
Urban
Rural
Overall
31.6%
22.8%
29.2%
59,367
27,643
41,904
78,944
35,806
59,174
Total income (yuan)
Total expenditure(yuan)
Saving rate
24,974
8,163
17,270
Saving(yuan)
Gini before subsidy Gini after subsidy
Method 1
Method 2
Method 3
Method 4
0.61
0.47
0.43
0.38
0.33
9,500
12,800
15,800
—
400 million
320 million
240 million
240 million
Subsidy amount per household
(yuan)
Rural
0.61
0.51
0.47
0.44
0.42
Overall
0.58
0.50
0.47
0.46
0.45
Urban
Bottom 25%
25%–50%
50%–75%
Top 25%
89
90
85
85
53
53
45
26
19
14
4
1
Bottom 25% 25%–50% Top 25%75
82
74
53
50%–75%
Overall
Urban
Rural
0.51
0.50
0.48
0.61
0.58
0.61
0.61
0.58
0.61
Before tax
Household income Household wage income
After tax After tax0.52
0.51
0.49
Before tax
Gini coefficient
Contribution of education on Gini coeffiencent
Gini coefficient after erasing educational inequality
Raise the education level to average OECD level
Raise the education level to average U.S. level
0.61
6%
0.59
0.36
0.38
0.61
11%
0.56
0.44
0.44
Overall Rural0.58
11%
0.54
0.47
0.45
Urban
Social insurance funds not included in fiscal budget
Social insurance funds included in fiscal budget
36.6
46.7
United States12.3
21.2
China
Elementary and below
Middle school and high school
Technical and vocational school
College and above
0.56
0.56
0.52
0.50
Gini coefficientEducation group
Before adjustment
Stick to minimum wage standard
Minimum wage increase by 50%
Minimum wage increase by 100%
0.58
0.57
0.56
0.55
0.61
0.60
0.59
0.58
Overall Urban0.61
0.61
0.59
0.55
Rural
43.6%
42.5%
46.8%
40.2%
27.1%
6.9%
19.1%21.7%
23.7%
2.0%2.0%
15.4%
7.5%
4.5%
14.1%
26.6%
41.1%
1.7%
25.9% 25.6%
16.5%
7.1%
1.8%
22.0%
14.7%
2,500,000
2,000,000
1,500,000
1,000,000
500,000
0
45%
40%
35%
30%
25%
20%
15%
10%
5%
0%
South Asia India Pakistan Bangladesh Other SAARC Afghanistan
South
Asia
India
Nepal
Pakis
tan
Bangla
desh
Bhutan
Maldive
s
Afgh
anist
an
Sri L
anka
Total Population (2010)
Total Population (2050)
Youth Population % of Total (2010)
Youth Population % of Total (2050)
Wageincome
Agriculturalincome
Businessincome
Investmentincome
Transferincome
Urban
Rural
Wageincome
Agriculturalincome
Businessincome
Investmentincome
Transferincome
Eastern
Central
Western
0.500.47
0.53
0.47 0.47
0.51
0.41
0.46 0.460.44
0.460.44
0.49
German
y
Finlan
dIta
ly
Hunga
ry
Poland
Britain
Norway
Spain
Japa
n
Greece
New Ze
aland
Canad
a
United
State
s
8.5
0.610.61 0.60
10.6
11.7 12 12.1
13 13.4
tran
sfer
/GD
P %
Gin
i
1990
–199
1
1996
–199
7
1998
–199
9
2002
–200
3
2004
–200
5
2006
–200
720
08
0.50
0.47
0.53
0.47 0.47
0.51
0.41
0.46 0.460.44
0.460.44
0.49
German
y
Finlan
dIta
ly
Hunga
ry
Polan
d
Brita
in
Norway
Spain
Japa
n
Greec
e
New Zea
land
Cana
da
United
Stat
es
0.30
0.260.34
0.270.29
0.34
0.25
0.32 0.330.31
0.33 0.32
0.38
Before transfer
After transfer
0.59
0.58
0.57
0.55
Income InequalIty and consumptIon In chIna | 1918 | Income InequalIty and consumptIon In chIna
After a long period of market economy development and rapid economic growth, income inequality in China is among the highest in the world. The country’s household income Gini coefficient has reached a staggering 0.61. However, inequality in China is partly due to market competition. Employees are paid based on their output, and China’s population differs tremendously in both human capital and command of resources. Regional and urban/rural differences also contribute to the creation of inequality. Moreover, compared to OECD and other countries, China’s sparse government income transfers play a large role in its high inequality rate.
China’s income inequality creates the problem of insufficient consumption. Although China’s overall household saving rate is rather high, most of the saving is carried out by the rich. Poor households have incentives to consume but face liquidity constraints. Therefore, a policy of solving income inequality becomes a policy of economic transition. It will help China move from an export- and investment-driven economy to a domestic consumption–driven economy.
In the short run, policies of reducing inequality must include an increase in income transfer programs; I believe that the Chinese government has the financial capabilities to do this. Furthermore, international experiences suggest the use of successful income transfer programs that are incentive compatible. These programs include both Condition Cash Transfer programs and Earned Income Tax Credits. China’s current leading social welfare program, Di Bao, can particularly benefit from reform by becoming incentive compatible.
In the long run, the Chinese government should invest heavily in education. It is probably the only long-term solution to inequality of China.
III. concluSIonS