income inequality and the labour market in britain and the us
TRANSCRIPT

Income inequality and the labour market in Britain and the US
IFS Working Paper W17/25 Richard BlundellRobert JoyceAgnes Norris KeillerJames P. Ziliak

Income Inequality and the Labour Market in Britain and the US1
Richard Blundell2, Robert Joyce3, Agnes Norris Keiller4, and James P. Ziliak5
October 2017
Abstract
We study household income inequality in both Great Britain and the United States and the interplay between labour market earnings and the tax system. While both Britain and the US have witnessed secular increases in 90/10 male earnings inequality over the last three decades, this measure of inequality in net family has declined in Britain while it has risen in the US. We examine the interaction between labour market earnings in the family, assortative mating, the tax and benefit system and household income inequality. We find that both countries have witnessed sizeable changes in employment which have primarily occurred on the extensive margin in the US and on the intensive margin in Britain. Increases in the generosity of the welfare system in Britain played a key role in equalizing net income growth across the wage distribution whereas the relatively weak safety net available to non-workers in the US mean this growing group has seen particularly adverse developments in their net incomes.
1 Acknowledgments: Prepared for the Special Issue of the Journal of Pubic Economics to honour the contributions of Tony Atkinson. Data from the Households Below Average Income dataset and Family Resources Survey were made available by the Department for Work and Pensions. These data are available from the UK Data Archive. The Labour Force Survey is produced by the Office for National Statistics, and these data are available from the UK data archive. Support from the UK Economic and Social Research Council through the Centre for the Microeconomic Analysis of Public Policy (CPP) at IFS, grant reference ES/M010147/1, is gratefully acknowledged. Ziliak acknowledges support from the U.S. Department of Health and Human Services, Office of the Assistant Secretary for Planning and Evaluation, grant number AE00103. Any errors and all views expressed are those of the authors. 2 University College London and Institute for Fiscal Studies: [email protected] 3 Institute for Fiscal Studies. 4 Institute for Fiscal Studies and University College London. 5 University of Kentucky and Institute for Fiscal Studies.

1
1. Introduction
Over recent decades, substantial changes in the distribution of incomes in both
Great Britain (GB) and the United States (US) have placed increased pressure on
government budgets.6 Declining employment and stagnant wages – each of
which have affected both countries, to different extents and at different times -
translate into reduced tax collections, while increased eligibility for and
generosity of social insurance, means-tested transfer payments and work-based
credits result in greater expenditures. The latter trend has been reinforced by
the interplay between the labour market and the family, with increased
inequality in family earnings and in assortative mating.
The aim of this paper is to describe the relationship between inequality in
labour earnings and the evolution of family income inequality. Tony Atkinson
was the world leader in driving forward the study of economic inequality and its
development over time, see Atkinson (1993, 1997, 2005). Many aspects of the
work we present here take the lead from Tony’s inspirational research in this
field - in particular, the role of the tax and benefit system in mitigating earnings
inequality and the interaction between the labour market and household income
inequality, for example Atkinson (1992, 2000) and Atkinson and Brandolini
(2006).
Changes in wage inequality have been at the centre of much empirical
research in labour economics. This includes large bodies of work aiming to
identify causal channels (e.g. Bound and Johnson (1992); Katz and Murphy
(1992); Card and DiNardo (2002); Bowlus and Robin (2004); Lemieux (2006);
Autor, Katz, and Kearney (2008); Blundell, Pistaferri, Saporta-Eksten (2016))
and to describe in some detail the key dimensions of change (e.g. Katz and Autor
(1999); Gosling, Machin and Meghir (2000); Pikety and Saez (2003); Machin
(2011); Burkhauser et al. (2012); Guvenen et al. (2017)). However, there has
been little systematic cross-country comparative work, and much less attention
to the tax and transfer system and family earnings in the evolution of household
inequality.
6 We refer to Great Britain (Britain) throughout, instead of the more colloquial United Kingdom, because our data does not contain information on Northern Ireland.

2
Family income inequality differs from wage inequality for a number of
reasons. Family labour income depends also on hours of work and on how hours
and wages covary between spouses, meaning the interplay between the
intensive margin and jointness of the labour supply decisions, which may be
heavily influenced by assortative mating in the marriage market (Blundell et al.
2016). In addition, the tax and transfer system can be a very important bridge
between family labour income and living standards, through taxes, work-
contingent credits and social security transfers. Tax and transfer systems are
typically quite nonlinear, especially at low-incomes, and this can lead to very
different inferences about levels of household income inequality; and major
reforms to these systems can and do have large effects on the income
distribution.
We examine the labour market and tax and transfer system in its
relationship with household income inequality in Britain and the US spanning
the 36 years from 1979-2015. The approach we take is descriptive, but informed
by structural changes in potentially-selective labour force participation, hours of
work, assortative mating and income insurance provided by the tax and transfer
system across the wage distribution. We develop an approach to study how the
intensive margin of labour supply, family structure and the tax and transfer
system have interacted over time to affect the link between wages and net family
incomes right across the male and female wage distributions.
To set the scene we begin by documenting and contrasting trends in male
earnings and net (after-tax and transfer) income in each country. We then
systematically trace out the path from individual labour market outcomes
through to net family incomes, unpacking the underlying components of income
inequality in the following sequence: Employment Wages Earnings
Family Structure Family Market Income Welfare Gross Income Taxes
and Work-Based Tax Credits Net Income. We explicitly consider the link
between employment and wages with a median selection approach to bound
wages in an effort to address selection into, and out of, the labour force, which
has likely changed very differentially between the two countries over time
(Johnson et al. 2000; Chandra 2003; Blundell et al. 2007).

3
In terms of the labour market, taking a relatively long-term view and
considering trends since 1979, the basic background facts are that real wages
have grown far less in the US than in Britain – and in fact have not grown at all at
the median except for college graduates – while employment trends have looked
relatively similar. However, over the past two decades, and especially since the
Great Recession, employment has been more robust in Britain while wages have
been more robust in the US.
Britain has seen a large increase in male earnings inequality, not just
during the much-documented 1980s inequality boom, but also since then. The
increase over the past two decades was driven by a broadly secular decline in
the hours of work of men at lower wage percentiles: inequality in male hourly
wages between the 5th and 95th percentile changed little. The hours of work story
has been the opposite among British women, among whom increases at the
bottom of the wage distribution have reduced earnings inequality. This has not
been enough, however, to stop family earnings inequality from rising. In the US,
secular trends in hours worked (among workers) have been much less
pronounced, albeit with considerable cyclical variation around that, but male
hourly wage inequality has increased. Meanwhile, employment among less-
skilled men in the US fell over the sample period, and since 2000 has even fallen
among higher-educated, and remarkably for women of all skill levels after a
secular increase in the prior three decades. Using a bounding approach to
account for the potential effect of selective entrances and exits from the labour
market, we show that – especially since the Great Recession – wage trends
among lower-educated groups may be more similar between the two countries
than the raw data focused only on workers imply. Nevertheless, the basic
qualitative comparisons between the countries prove robust to this bounding
exercise.
Even though there were sharp declines in hours of work among men in
Britain, and some increase in assortative mating, the British welfare state has
stabilized the economic inequality of tax units across the most of the net income
distribution over the past two decades. For example, we show that 90/10 net
income inequality fell slightly in Britain from 1994-2015 even though male

4
earnings inequality increased. In comparison, we show that in the US 90/10 net
income inequality rose sharply, suggesting that the US tax and welfare system is
less successful at counteracting changes in the labour and marriage markets. The
greater stabilization in Britain did come at a considerable fiscal cost, in particular
due to large increases in the generosity of tax credits in the late 1990s and early
2000s which led to these credits trebling as a share of GDP from 0.5% in 1997 to
1.5% in 2004.7
The paper proceeds as follows. Section 2 gives a brief overview of the key
policy context in both Britain and the US. Section 3 discusses the data we use in
the paper, including how we harmonise the measurement of key variables across
countries to the extent possible. Section 4 sets out the context of overall changes
in net family income inequality in both countries, and how this relates to male
earnings inequality. We then unpack the links between these. Section 5 begins
with the labour market, including how it interacts with the marriage market.
Section 6 turns to the tax and transfer systems. Section 7 brings this together by
systematically tracing the links from wages right through to net family incomes.
Section 8 concludes.
2. The Policy Context
During the period considered in this paper there have been a number of key
policy changes in both countries that are relevant for our analysis. In Britain
there were significant cuts to income tax during the 1980s, especially for higher
earners. The top marginal income tax rate fell from 60% to 40% in 1988, and the
basic rate of income tax fell in stages through the decade from 30% to 25%. Since
1994, which – for data reasons – we focus on for much of the analysis, the basic
rate of income tax has fallen further in a number of incremental steps to 20%,
and since 2011 the zero-rate band has been expanded rapidly. However, fiscal
drag and some discretionary policy change has pulled many more individuals
into the higher tax bracket: the number paying the marginal rate of at least 40%
7 See Department for Work and Pensions benefit expenditure tables: https://www.gov.uk/government/collections/benefit-expenditure-tables.

5
has more than doubled since 1994.8 The net result is that the income tax system
has become more progressive in recent years (with the opposite having
happened in the 1980s).
Since the late 1990s much of the key policy change in Britain has been on
the transfer side. The Labour governments of 1997 to 2010 presided over large
increases in the generosity of social security and tax credits, in large part as a
means of pursuing ambitious quantitative child poverty targets for 2010 and
2020 (Joyce and Sibieta, 2013). The term ‘tax credits’ in Britain is in fact used to
describe two very different forms of support: a genuinely work-contingent
transfer9, currently named Working Tax Credit (WTC), and an additional means-
tested element specifically for families with children (Child Tax Credit, CTC)
which is available – since 2003 – to low-income families irrespective of work
status. Spending on these tax credits and their forebears trebled as a share of
GDP in 7 years, from 0.5% in 1997 to 1.5% in 2004. The out-of-work safety net
was also made significantly more generous for families with children under
Labour. Since 2011, however, a broad-based set of cuts to means-tested
working-age transfers have been implemented as part of post-recession fiscal
consolidation measures. These are clearly evident in the analysis we present
later up to 2015, but they continued after that and are set to continue for a few
more years.
Another important policy change in GB was the introduction of the
National Minimum Wage in 1999. It was subsequently increased in several
stages, and by 2015 (the end of our period of analysis) it covered around 4% of
employees. It is, however, now being extended much further and is set to cover
around 12% of employees by 2020 (Cribb et al, 2017).
Like Britain, the economic landscape of the United States over the past
several decades has been characterized by massive changes to tax and welfare
8 See Table 2.1 of HMRC Statistics (https://www.gov.uk/government/statistics/number-of-individual-income-taxpayers-by-marginal-rate-gender-and-age). 9 Eligibility for work-contingent transfers in GB operates via “hours rules”: minimum numbers of hours that must be worked by the family in order to qualify (minima which vary by family type). Transfer entitlement is then tapered away once family income exceeds a certain level.

6
policy. The Economic Recovery Tax Act of 1981 and the Tax Reform Act of 1986
jointly broadened the tax base and reduced the number of federal income tax
brackets from 16 to four, with the marginal tax rate on the highest income
earners dropping from 70% to 28% by 1989 (Auerbach and Slemrod 1997;
Burman et al. 1998; Kniesner and Ziliak 2002). The subsequent tax changes over
the ensuing two decades eventually led to a return to seven marginal tax
brackets and a top rate of 39.6% by 2009. Although the tax reforms expanded
the standard deduction and personal exemption amounts, and thereby removed
several million low-income households from the federal tax rolls, there were
strong incentives for these families to file in order to claim refundable tax credits
for workers; namely, the Earned Income Tax Credit (EITC) and the Additional
Child Tax Credit (ACTC).
The EITC was created in 1975 and targeted to low-wage workers (Nichols
and Rothstein 2016). The generosity was expanded several times in the 1980s
and 1990s, and by 2014 the maximum credit was $5,460 for a family with two
qualifying children and annual earnings under $17,580. Over 28 million
taxpayers claimed the credit that year at a current-year cost of over $68 billion,
or 0.4% of GDP. The non-refundable Child Tax Credit and refundable portion
ACTC were established in 1997 and (currently) provide a credit against tax
liability of $1,000 for each child under the age of 17. Initially eligibility was
restricted to workers with annual earnings in excess of $10,000 in 2001 (and
indexed to inflation thereafter), and most benefits went to the middle and upper-
middle class. As part of the 2009 response to the Great Recession, the eligibility
limit was lowered to $3,000, thus better targeted the ACTC to part-time and part-
year low-income workers. By the 2014 tax year, expenditure on the ACTC
program exceeded $30 billion, or 0.2% of GDP.
Concomitant with falling marginal income tax rates and expanding credits
were substantial expansions in the payroll tax, which is used to finance Social
Security retirement benefits, disability benefits, and Medicare health insurance
for the elderly and disabled. While the rates have not changed since 1991 (15.3
percent combined employer/employee rate), the base applicable to Medicare tax
(2.9 percentage points of the 15.3) was uncapped that year, and the retirement

7
and disability benefit base subject to taxation was indexed to inflation and by
2014 was $117,000.
Alongside the major changes to tax legislation were wholesale changes to
means-tested transfers during the 1990s. The reforms altered significantly the
economic rewards to work and to participation in transfer programs, and
affected all segments of the low-income population. Some programs retrenched,
while others witnessed dramatic growth (Ziliak 2015). The 1996 Personal
Responsibility and Work Opportunity Reconciliation Act abolished the cash
welfare program Aid to Families with Dependent Children, which was an
entitlement program for low-income and low-asset (single-mother) families with
children under age 18, and replaced it with the time-limited, block-grant
program Temporary Assistance to Needy Families (TANF). TANF limited
eligibility to no more than five years, and less at state discretion, and imposed
work requirements and numerous other restrictions on eligibility (Ziliak 2016).
While this program change effectively eliminated out-of-work cash welfare in the
US, since 2000 there was huge growth in food assistance spending from the
Supplemental Nutrition Assistance Program (aka food stamps), in health
insurance coverage for children—first with state-directed Medicaid expansions,
then federal creation of the Supplemental Children’s Health Insurance Program,
and finally the 2014 rollout of the Affordable Care Act—and steady growth of
disability benefits both related to work (Disability Insurance) and childhood
(Supplemental Security Income). Taken together, inflation-adjusted spending on
the major US social insurance and means-tested transfers grew 60 percent to
over $2 trillion by 2010, or over 13% of GDP (Ziliak 2015).
3. Data
We begin by providing a brief overview of our data sources, followed by a
detailed description of how the various labour market and income sources were
measured. We endeavoured to the extent possible to harmonize the datasets
across countries over the past three and a half decades to provide a consistent
and comprehensive portrait of the economic status of individuals and the
households in which they live in Britain and the United States.

8
3.1 Great Britain
For the research on Britain, we draw on two distinct sources of data: the 1979-
1993 survey years of the Family Expenditure Survey (FES), and the 1994-2015
survey years of the Family Resources Survey (FRS).10 Both datasets are annual
household surveys and are commonly combined in this manner, including in the
calculation of official statistics on poverty and inequality. The FES and FRS
collect data on various sources of income received and taxes paid close to the
time of interview, and all income and tax amounts are based on the self-reported
values. A very small fraction of income components (typically less than 1%)
suffer from non-response and any missing values are imputed. However, as
neither survey identifies the observations and income components that have
undergone imputation, we are unable restrict our sample to those without any
imputed information. We restrict our sample to men and women aged 25-55 to
focus on the prime working-age population, and thereby abstract from the part
of the lifecycle where most human capital investments occur and that part
associated with retirement.
3.2 United States
For the US analysis, we use the Current Population Survey Annual Social and
Economic Supplement (ASEC) for the 1980-2016 survey years. The ASEC is a
stratified random sample of 60,000-90,000 household addresses from the
noninstitutionalized population in the US. It serves as the official source of
income and poverty statistics and has been the workhorse dataset for research
on wage and income inequality. As with the British data, we restrict our focus on
men and women aged 25-55. However, there are some important distinctions in
the ASEC. First, all information refers to prior calendar year rather than the time
immediately prior to the interview, as in the British data. Second, taxes and tax
credits are self-reported in the British data, whereas the ASEC does not collect
tax information. Instead we run the ASEC data through NBER’s TAXSIM
simulation program, which assumes 100 percent take-up among those eligible
10 Prior to 1993 the FES was collected on a calendar-year basis, while from 1993 onwards it was collected on an April-March financial year basis. The FRS began in 1994 with an annual sample of around 20,000 households, roughly double that of the FES, and was also collected on an April-March financial year basis.

9
for tax credits. Third, nonresponse to earnings questions, and to the entire ASEC
altogether, has been on the rise (Bollinger et al. 2017), and the US Census Bureau
imputes values to nonrespondents. We drop those with imputed earnings and
hours and reweight the ASEC data as described below.
3.3 Measuring Labour-Market Outcomes and Incomes
The primary economic outcomes in our analysis are employment, hours, real
earnings and wages, and real before-tax gross income, and real after-tax and
transfer (net) income.
Employment Rate. In the British data, we measure the employment rate as the
fraction of the population aged 25-55 employed during the survey week
(sometimes referred as employment per capita). The measure is the same in the
US, except employment is for any time in the prior year.
Hours of Work. In both countries, hours of work refers to usual hours worked per
week, where the reference period in Britain is “typical” hours in the current
financial year, while in the US it is typical hours in the prior year. The data from
Britain distinguishes between paid ‘basic’ and both paid and unpaid overtime
hours. The hours measure we use is defined using paid basic and paid overtime
hours only in order to more accurately reflect trends in formal labour market
arrangements. No such distinction is made in the US. Overtime hours in the US
primarily only apply to workers paid by the hour, and workers are eligible to be
paid 1.5 times the normal hourly wage.
Real Earnings and Wages. In the British data, information on earnings is obtained
by asking respondents the amount they were paid on the pay date closest to
interview. Raw responses are converted into nominal weekly amounts and we
additionally convert these nominal values to real terms using a modified
Consumer Price Index that includes an adjustment for mortgage interest. In the
US, earnings are measured for the past year, and deflated by the Personal
Consumption Expenditure Deflator. In both cases we use a 2010 base year. Real
hourly wages are constructed as the ratio of weekly real earnings and usual
hours per week in Britain, and the ratio of real annual earnings to annual hours
of work (hours per week times number of weeks worked). We leave each
country’s earnings and wages in their respective currencies.

10
For the analysis that relies on wage information, we exclude those with
extreme gender-specific real average hourly wages (below 1st percentile; above
99.9th percentile) and adjust the survey weights using inverse probability
weighting. Specifically, for each gender and year, we estimate a saturated probit
model of the probability of not having an extreme wage using levels and
interactions of age, race, education, marital status, and other demographics. We
then divide the survey weight by the fitted probability of not having an extreme
wage. For the US, we modify the procedure to also account for non-imputed
employment and earnings. The reweighting approach results in consistent
estimates under the assumption that the excluded observations are missing
mean conditional at random. As we describe in the results section, this
assumption is relaxed when we bound the wage series with worst-case bounds
to account for possible nonrandom selection into employment.
Gross and Net Income. As we are ultimately interested in changes in family-level
outcomes, in addition to individual-level employment and earnings we also
construct gross and net income at the tax unit level. Tax units in the Britain are
defined as an adult, their partner (married or unmarried), and any dependent
children in their care. In the US data they are inferred from household
relationship pointers and ages of occupants, where unlike Britain, cohabiting
partners in the US do not file jointly.11
Our measure of gross income includes the earnings of the primary and
secondary earner (if present), nontransfer nonlabour income such as rent,
interest, and dividend income, and transfer income. In the British data, transfers
include all cash transfers and work-based tax credits, including the Child and
Working Tax Credits, Child Benefit, Housing Benefit, Income Support and
unemployment and disability benefits. For the US data, transfers include Social
Security, Disability Insurance, Unemployment Insurance, Workers Compensation,
Supplement Security Income, Temporary Assistance for Needy Families,
Supplemental Nutrition Assistance Program (food stamps), Earned Income Tax
Credit, and the Additional Child Tax Credit. Some of the benefits are recorded in
11 The Stata program for constructing the tax unit will be made available at https://sites.google.com/site/jamesziliak/Home

11
the surveys at the individual level, and others at the family level. For the former
we sum them up across all individuals in the tax unit.
Net income is constructed as gross income less tax payments, which in the
British data includes income tax, employee National Insurance Contributions,
and Council Tax.12 As noted previously, tax payments and credits are not
reported in the US data and must be simulated. The NBER TAXSIM program
receives as inputs the tax unit marital status, ages of members, number of (child)
dependents for (refundable) tax credits, earnings, taxable and nontaxable
transfers, and other items. It then returns a simulated estimate of federal, state,
and payroll tax liability, inclusive of tax credits. For the payroll tax, we just assign
the employee share.
Finally, because household size and composition has changed
substantially in both countries in recent decades, we equivalise gross and net
income using a modified OECD scale.13
Education. For many of our outcomes we split the sample into education groups,
which is a standard proxy for skill and/or permanent income. Variables related
to educational attainment in the British surveys have changed over time. In
order to create a continuous time series we therefore focus on school-leaving age,
which is consistently recorded over the entire 1979-2015 period, and use this
indicator of education to define four groups: less than or equal to 16 years of age;
17 and 18 year olds; 19 and 20 year olds; and those ages 21 and older. These age
categories roughly approximate the four US education groups of less than high
school, high school graduate (or General Equivalency Degree), some college
(includes community college and associates degrees), and four-year college or
more. Importantly, however, those leaving school at age 16 in Britain receive
credentials, whereas they do not in the US, and thus the low-educated group in
Britain likely has more qualifications than the typical US “dropout.”
12 An important institution distinction between the US and Britain is that Britain offers national health insurance, whereas in the US much health insurance is paid for out of net income, which will have the effect of making levels across the countries more comparable. 13 Equivalised amounts are obtained by multiplying the unequivalised amount by a factor, , where is an indicator function that equals one if a spouse is present in the tax unit and and gives the number of dependent children in the tax unit aged 0-13 and 14 and above respectively.

12
Appendix Figure 1 demonstrates that there has been substantial
education upgrading in both countries since 1979, with a reduction in half of the
lowest education group. In Britain, 80 percent of men and women left school by
age 16, and this plummeted to 40 percent by 2015. The comparable percentages
in the US were 20 and 10 percent, respectively. Notably, the most marked growth
in both countries is the highest education level, especially among women when
35 (40) percent of British (US) 25-55 year olds attained the equivalent of college
or more in 2015, double the rate in 1979.
Marital Status. The remaining key demographic outcome that factors
prominently in our analysis is marital status. In the British data, those couples
who are married are comingled with those cohabiting, while in the US data,
married only refers to those couples in a legally recognized union, while
cohabiting couples are treated as unrelated individuals in the ASEC. Appendix
Figure 2 presents trends in the fraction of men and women married (or
cohabiting in Britain) by the four education groups. The substantial retreat from
marriage is most evident among the least skilled, especially men in the US. In
1979, the fraction of married US men with high school or less was just under 80
percent, and greater than the fraction married among those with a college degree.
By 2015, the fraction of high school graduates or dropouts who were married
was nearly 20 percentage points lower than that of college educated men.
Similar patterns hold among US women, and both British men and women,
though much more attenuated in Britain.
4. Household Income Inequality
Net income among ‘working age families’ in Britain (denoted as G.B. in all
figures) and the US is presented in Figure 1. It shows strong growth from 1979-
2015 in household income across the distribution in Britain, and for the top half
of the distribution in the US, though relatively flat net incomes in the bottom half,
except for the brief window in the late 1990s. The experience in the two
countries during the Great Recession, however, was markedly different. Real net
incomes fell sharply in Britain, especially in the upper percentiles, while they
continued to keep pace with inflation in the US.
[Figure 1 here]

13
Since the mid-1990s, although the top of the income distribution
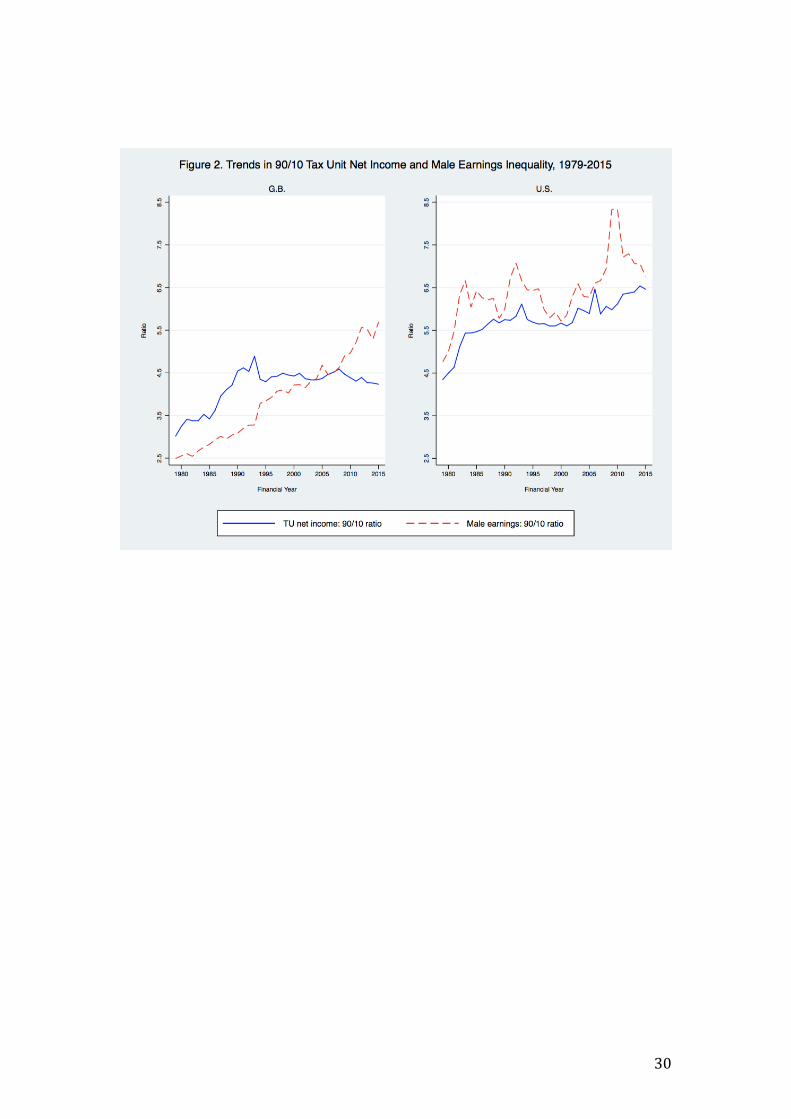
continued to increase dramatically in both countries, Figure 2 shows that, since
the mid 1990s, the 90/10 ratio of net income inequality has been stable in
Britain, while continuing to grow strongly in the US since 2000, largely due to a
rise in the 90/50 (not shown). The British experience of stable 90/10 net income
inequality stands in stark contrast to the sharp rise in male (individual) earnings
inequality. This suggests potential important roles for family structure and the
tax and benefit system that may differ substantively from the US given the
increase in both earnings and net income inequality. Moreover, male earnings
inequality is much more volatile in the US than in Britain, which as will be seen
below, reflects much greater cyclical sensitivity in hours of work, especially
among low-income workers.
[Figure 2 here] 5. The changing labour market and the changing wage distribution
The dramatic differences in Britain and the US in terms of overall after-tax and
transfer income inequality, in contradistinction to the rising male earnings
inequality in both countries, forms the basis for the ensuing analysis, where we
first examine differences in employment and wages in each country.
5.1 Employment, Hours and Wage Inequality by Gender, Education and
Race
Figure 3 sets out employment rates over time in both countries, by gender and
education level. Comparing levels of employment, perhaps the most striking
difference is how much larger the gap between the highest- and lowest- educated
is in the US than in Britain – especially for women. Part of this difference is
explained by the fact discussed in Section 3.3 that the lowest education group in
the US are less likely to have obtained formal educational qualifications than the
equivalent group in Britain.
[Figure 3 here]
Looking at trends over time, male employment rates in both countries are
lower than they were in 1979, especially for the lowest educated. However, in
the US this is driven by a broadly secular decline since around 1990. In Britain,
by contrast, male employment has been on an upward trend since the early
1990s (punctuated temporarily by the Great Recession) after falling sharply

14
through much of the 1980s and during the early 1990s recession. The result has
been a marked convergence of male employment rates in the two countries over
the past 25 years, from a starting point at which male employment in the US had
been considerably higher for all but the lowest educated.
Among women, employment was stable or gently rising in both countries
during the 1980s, but again it has since been in secular decline in the US –
especially for the lowest-educated – while remaining stable or increasing slightly
in Britain. Over approximately the past 25 years, trends in employment have
been much more robust in Britain than in the US and this has been especially
evident since the Great Recession.
[Figure 4 here]
Figure 4 looks at the same groups and plots median real hourly wages
among those in paid work. Because of the significant contrasts in employment
trends between the two countries, we are careful to deal with differential trends
in the selectivity of the workforce. To do this, we implement a modified version
of the median selection model (see, e.g. Johnson et al. 2000; Chandra 2003;
Blundell et al. 2007) which bounds wage trends by assuming that all changes in
employment rates are the result of entrances and exits at the bottom of the
within-group wage distribution. The reference year that we assess all changes
relative to is 1994, as this aligns with the period that we later focus on. In years
where the employment rate is greater than the 1994 rate, workers are re-
classified as non-workers, starting with the lowest-wage worker first, until the
employment rates align. In years where the employment rate is below the rate in
1994, randomly selected non-workers are re-classified as workers and assumed
to earn less than the 1st percentile of the gender-year wage distribution until the
employment rates align (for the purposes of Figure 4, and following the median
selection rule, the only assumption required is that they earn less than the
median). In either case, median wages among the workers are then re-computed.
This has the effect of increasing the measured median wage when within-group
employment is higher than in 1994, and vice versa. The bounded series are
indicated by dashed lines.

15
The US has seen a remarkably long period of real wage stagnation,
stretching back over most of the period since 1979, with the only clear exception
being a short period during the boom of the late 1990s. In fact, for men it is only
college graduates among whom median real wages are currently any higher than
in 1979. The bounded series confirm that accounting for trends in selectivity
would only make this conclusion stronger, due to large employment declines
among lower-educated men over this period. In Britain, wage growth was
considerably more robust until the early 2000s.
The more recent comparison is different. Since the mid 2000s, and
especially the Great Recession, Britain has seen marked declines in median
hourly wages across most groups (but less so among the lowest educated). These
wage trends tend to be worse than seen among similar groups in the US over the
same period. It does, however, turn out to be quite important to assess
employment and wage trends, and the link between them via selection, in a
coherent framework. The potential for wage trends among less educated US men
to have been flattened by selection (due to falling employment) in recent years is
significant, and the bounded series show falls in wages more in line with their
British counterparts.
Nevertheless, overall Figures 3 and 4 do show a stark difference in the
nature of the impact of the Great Recession on the US and British labour markets.
Employment rates have proven more robust in Britain, particularly through the
pace with which they recovered after the initial shock; while much more of the
adjustment has instead come through lower real wages, especially for the high
educated. This fed into the post-recession decline in top net incomes in Britain as
shown in Figure 1, though reinforced pre-existing trends toward higher
inequality in the US.
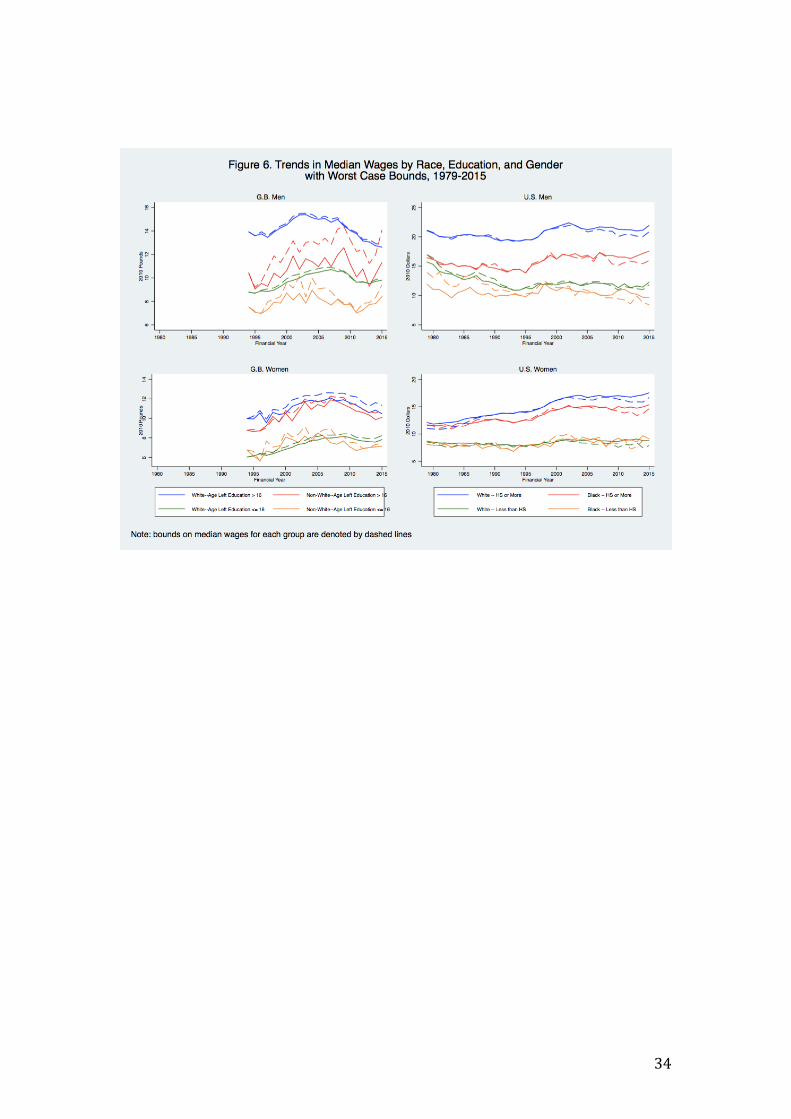
Figures 5 and 6 examine further heterogeneity in employment and wage
trends in Britain and the US by disaggregating by racial groups. Specifically, we
focus on white/non-white comparisons in Britain and white/black comparisons
in the US. In Britain the racial categories are not consistently defined until 1994
in the FRS, and the small sample sizes of non-black minority workers led us to
pool them in with black workers. In addition, in order to maintain adequate cell

16
sizes, we collapsed education in Britain to be age of school leaving less than 17
and greater than or equal to 17, and for the US to less than high school and high
school or more.
[Figure 5 and 6 here]
Figure 5 shows that employment rates of less-skilled non-white men in
both countries is substantially lower, especially black men in US. Moreover,
higher-educated black men have employment rates comparable to high school
dropout white men in the US, and the gap between both of those groups with
higher-educated white men expanded in the last decade. Remarkably, there is no
race gap in employment for US women, only a gap based on education
attainment. Figure 6 reveals that the wage gap of less skilled white and black
men in US closed greatly by the mid 1990s, though bounds suggest this is
affected by differential labour-force withdrawal, and after accounting for
employment selection, the bounded median wages of less skilled black men in
the US fell nearly 50 percent from 1979-2015.
It is not just the extensive margin of employment that has been important
in driving changes in incomes nor, in the case of Britain, changes in inequality.
Figure 7 documents mean hours of work among workers in the two countries
over time, split by gender and education. The figure shows a large difference
between the US and Britain in the patterns of male employment at the intensive
margin across skill groups with higher-educated men working far more hours
than the low-educated in the US and vice versa in Britain. However, this contrast
may be due in part to differences in the treatment of unpaid overtime in the
hours measure used in each country, as discussed in Section 3.3. Specifically,
accounting for unpaid hours worked in Britain leads to the same ranking of
education groups observed in the US, as unpaid work increases the average
hours worked by the highest education group while leaving average hours of
lower-educated workers largely unchanged. For women the relativities across
skill groups are the same in both countries, with higher educated women
working more hours; but US women work considerably more hours than their
British counterparts, on average.
[Figure 7 here]

17
Among women, average hours of work have been quite stable in both
countries in recent decades, after rising during the 1980s. The one exception is
the lowest-educated women in the US, whose hours of work have fallen since the
mid 2000s. For men the key pattern has been a large convergence in hours of
work across education groups in Britain. This has been driven by particularly
large falls in hours among the lower-educated. Appendix Figure 3 provides some
detail behind this, focusing on the period since 1994, showing percentage point
changes in rates of ‘mini-jobs’ (less than 16 hours per week), part-time work
(less than or equal to 30 hours per week) and especially long hours of work
(greater than 45 per week) across the hourly wage distribution. This highlights
three further important points. First, reductions in hours of work among British
men are in fact particularly concentrated in the bottom quintile of the hourly
wage distribution. This is an even narrower group than the lowest education
group shown in previous figures (which currently accounts for around 40% of
British male workers). Second, the reduction in hours at the bottom of the wage
distribution has not just been the result of fewer low educated men working
particularly long hours than in the past. There has also been a marked increase
in rates of part-time work at the bottom of the male wage distribution. Third,
there has been a sharp fall in the prevalence of ‘mini-jobs’ among women in the
bottom quintile of the wage distribution in Britain. This is likely related to the
introduction of the Working Families Tax Credit (WFTC) in 1999, which made
eligibility contingent on working at least 16 hours a week thereby creating
strong financial incentives for single parents working low numbers of hours to
increase their labour supply above this threshold (Blundell and Shephard 2012).
By contrast, the hours changes among men and women in the US have been far
more uniform across the wage distribution.
[Figure 8 here]
Figure 8 brings the wage and hours changes together. It shows
percentage changes since 1994 in hourly wages and weekly earnings at each
percentile of their respective distributions, by gender. Changes across the hourly
wage distribution have been notably uniform for both men and women in both
Britain and the US. But moving to weekly earnings highlights just how

18
consequential the differential trends in hours of work have been in Britain,
leading to a sharp increase in earnings inequality among men and a sharp
decrease among women.
In summary, something has happened in Britain in recent decades which
goes against the conventional wisdom that male employment at the intensive
margin is relatively fixed. The breakdown of this rule has had first order effects
on earnings inequality in Britain. In a comparative context it tempers the
conclusion that one would reach when focusing on the extensive margin alone,
which is that male employment has been on a worse trajectory in the US with a
particular problem among the lowest skilled. The British story becomes more
reminiscent of the US story once the intensive margin is incorporated. Belfield et
al (2017) have shown that the increase in part-time work among low-wage
British men has occurred among single men and those in couples, and those with
and without children. Explaining the origins of this change, and in particular
whether it represents a demand-side or supply-side shift, is a key challenge for
future research given its implications for welfare and potential possible policy
responses. A satisfying explanation would need to account for why we have not
seen similar concurrent changes at the extensive margin, and why the
adjustments in this respect have been the opposite of those in the US.
5.2 Marriage and Assortative Mating
We now make the important move from individual labour market outcomes to
family-level outcomes. A key part of this link is the pattern of assortative mating,
which is examined in Figures 9 and 10. For each country and gender we rank by
percentile of individual hourly wages and plot changes in spousal characteristics
within each percentile, comparing 1994 with 2015. In Britain, but not the US, we
are able to observe non-married cohabiting partners - though for parsimony we
use the term “spouse” to cover any cohabitation between partners. Although this
introduces an inconsistency in measurement between countries, long-term non-
marital cohabitation is comparatively less common in the US.
[Figures 9 and 10 here]

19
Appendix Figure 2 discussed previously shows that living as part of a
couple has generally become less common across education groups in both
countries, while Figure 9 shows that these changes are pervasive across the
wage distribution. It also shows that this change has tended to be more
pronounced for people in the bottom half of the gender-specific hourly wage
distribution, and even more pronounced among non-working men (as indicated
by the red dots). Changes in the probability of having a working spouse exhibit a
similar gradient across the wage distribution. The gradient here is especially
strong for women. In Britain the probability of having a working spouse has
tended to decline in the bottom half of the female wage distribution and to
increase in the top half. In the US, it has declined throughout essentially the
entire distribution, but by more towards the bottom.
Figure 10 examines how the within-family correlation between wages has
changed since 1994, plotting the average wage percentile rank of spouses by
own-wage percentile (for those in each percentile who have a working spouse).
For both countries and both genders, there is a clear positive correlation: people
further up the individual wage distribution tend to have spouses who, if in work,
are also further up the wage distribution. In the US, but not Britain, there is also
clear evidence of an increase in this form of assortativeness as the gradient has
become steeper over the past two decades. If one also accounted for extensive
margin changes, it is likely that both countries would display greater increases in
assortative mating than implied by Figure 10 as the figure is plotted for the
sample of individuals who have a working spouse, and Figure 9 shows that the
probability of having a working spouse has declined most for low-waged
workers and non-workers.
In summary, taking Figures 9 and 10 together reveals that in both countries
changing patterns of assortative mating have tended to reinforce increases in
labour market inequalities at the family level.
6. The tax and welfare system
Another key bridge between individual labour market outcomes and family
incomes is the government transfer and tax credit system. It makes sense to
analyse this when moving to the family level: eligibility for such transfers is

20
typically assessed at that level and so, at least where resources are pooled within
families, transfer program participation measured at the individual level is not as
meaningful.
[Figures 11 and 12 here]
Figures 11 and 12 document trends in transfer receipts by gender and
education in both countries. We begin in Figure 11 by focusing on the value on
transfers and work-based tax credits (i.e. credits that are contingent upon
satisfying work requirements). As is evident from the figure, the average
generosity of the welfare system has been expanded greatly over the past 20
years in both countries, particularly among the lower educated. The figure shows
a sharp increase in average transfer amounts in 2003 in Britain, which reflects
the introduction of Working Tax Credit (WTC) and Child Tax Credit (CTC). These
two ‘tax credits’ replaced an earlier work-contingent benefit and extended
entitlement to in-work credits to adults without dependent children.14 The figure
also shows that increases in average welfare receipts in Britain that occurred in
the years immediately following the financial crises have since been offset owing
to the post-recession fiscal consolidation, which began in 2011 and included cuts
to many transfer programs. The dramatic increase in average transfer amounts
in the US emerged in response to the Great Recession—increasing 50% among
the least skilled, but also more than doubling among those with some college—
and unlike Britain, have remained elevated through the six years following the
official end of the recession.
Figure 12 shows an alternate measure of welfare generosity: the average
share of family gross income that comes from the transfers and in-work tax
credits plotted in Figure 11. The figure makes evident the greater generosity of
the British welfare system across the education distribution in comparison to the
US system, with transfers and in-work tax credits accounting for a higher share
of gross income among men and women of all education levels in Britain. This is
in spite of the fact that, as discussed above, the lowest education group in the US
is likely to be far less skilled than the lowest education group in Britain.
14 As explained in Section 2, the WTC and CTC are transfer payments rather than a refundable tax credit, such as the EITC.

21
Viewing Figures 11 and 12 together also reveals how changes in average
transfer payments and in-work credits compare to changes in other sources of
income. Trends in the series for men in both countries and for women in the US
are very similar across Figures 11 and 12, which implies that changes in family
gross incomes has primarily been driven by the changes in transfer and in-work
credit income shown in Figure 11. For women in Britain, however, increases in
average welfare-gross income ratios across education groups are far more
muted than increases in average welfare receipts. This likely reflects changes in
female labour supply that, as shown in Figure 8, have led to particularly strong
earnings growth among women at the bottom of the British wage distribution.
7. From Wages to Household Income Inequality
Bringing together the individual labour market outcomes, assortative mating and
trends in welfare income, and adding in taxation, we can trace the links from
individual wages right through to net family incomes. To illuminate this, in
Figure 13 we rank people according to their position in the gender-specific
hourly wage distribution and, keeping that ranking fixed, examine changes in
different measures of income over the 1994-2015 period. The figure also shows
growth in the different measures of income for non-workers which, as
documented above, now account for a greater share of the working-age US
population than in 1994. We start with family labour income, cumulatively add
in work-based credits and then all other transfers (to make “gross income”),
before subtracting direct taxes (to make “net income”). Family incomes are
equivalised throughout this exercise in order to account for changes in family
size and structure.
[Figure 13 here]
The broad pattern in family labour incomes is one of increased inequality
between higher- and lower- wage individuals, with the exception of the bottom
male wage quintile in the US. These patterns are in line with the trends already
documented in male earnings inequality (male earnings remain the dominant
source of family labour income, on average) and the supporting role played by
increases in assortative mating. However, important differences emerge
between Britain and the US when looking beyond labour income. Transfers and

22
taxes have had significant effects on trends in inequality between high- and low-
wage people in Britain, but virtually no discernible impacts on those trends in
the US. Work-contingent transfers actually have little to do with this, as they
remain only a relatively small part of the overall transfer system in Britain (even
for people in work). But increases in the generosity of the transfer system more
generally, most importantly through CTC (most of which goes to families in
work), have pushed the rate of growth in family gross income at the lower end of
the wage distribution above the rate of growth in labour income alone. Direct tax
cuts have had a further, similar impact towards the bottom, as the zero-rate
income tax band has been increased sharply since 2010.
Another striking point of contrast between Britain and the US is the
experience of non-workers (represented by the dots). In Britain their net family
incomes have grown robustly over the past 20 years, and more quickly than for
the majority of the wage distribution. Unsurprisingly this is again due to
increases in the generosity of the transfer system, particularly for families with
children, both through CTC and through increases in the rates of out-of-work
transfers. In the US, by contrast, non-workers have fallen further behind those in
work over the past 20 years and in fact have seen barely any income growth at
all, although the figure does suggest that growth in welfare income has mitigated
to some extent the reductions in labour income among non-working US women.
[Figures 14a and 14b here]
We now examine how these trends vary between different types of
families. First, Figures 14a and b focus on marital status plotting the same
information as shown in Figure 13 but distinguishing single and married men
and women (as before, we class cohabiting partners as married in the British
context). The figure shows that differential growth across the wage distribution
has increased labour income inequality among single men in Britain, but this has
been largely offset by the tax system, which has acted to equalise growth in net
income. It also reveals that growth in family labour income of singles was more
even across the wage distribution than that observed in the population as a
whole for men and women in the US and for women in Britain, which is to be
expected given the pattern of earnings growth shown in Figure 8. Figure 14b

23
shows the same information this time for men and women that are married or, in
the British case, either married or cohabiting. The contrast between the single
and married figures is perhaps most striking for US women. Family labour
income growth is markedly more unequal among married than single US women,
which re-emphasises the importance of increases in the assortativeness of
marriage as a driver of income inequality in the US.
Figures 15a and b examine differences in trends between families with
and without dependent children and highlight that it is families with dependent
children on whom the increases in transfers have been focused in both countries.
In Britain, the context for this was that the Labour governments of 1997-2010
were pursuing extremely ambitious child poverty targets, and large increases in
the generosity of state transfers were by far the main way in which they
managed to move towards (but not meet) them (Joyce and Sibieta, 2013).
Likewise, the tax reforms in the US in the 1990s, notably the expansion of the
EITC and the creation of the CTC and ACTC, were clearly targeted to low-wage
families with dependent children, and it is this group alone where evidence is
found that the US welfare state has some bite in improving income growth akin
to that in Britain, though notably at much lower levels.
[Figures 15a and 15b here]
8. Conclusions
Both Britain and the US have witnessed secular increases in 90/10 male earnings
inequality over the last three decades. Up until the 1990s this was accompanied
by similar increases in 90/10 inequality in net household incomes in both
countries but since then trends have diverged with inequality in net family
income declining in Britain while continuing to rise in the US. This paper has
sought to shed light on the reasons for this divergence, taking inspiration from
Tony Atkinson’s extensive work on inequality, which emphasized the importance
of accounting for the interplay between the labour market, the tax and benefit
system and income inequality.
Since 1979, there have been sizeable changes in male and female
employment in both countries. These employment changes have primarily

24
occurred on the extensive margin in the US, with employment declining across
gender and education groups from around 1990. In Britain, by contrast, the
biggest changes have occurred on the intensive margin, with male workers
experiencing declines in average hours of work that have been steepest for the
lower-educated and most pronounced in the bottom quintile of the wage
distribution.
The impact of these trends in employment and hours on family-level
income inequality has been mediated through several channels. First, changes in
individual-level earnings inequality will also be influenced by changes in wage
inequality. We find that wage growth has been relatively equal across the main
part of the gender-specific wage distributions of both countries, although a novel
worst-case bounding approach suggests that reductions in employment in the US
may have flattered growth at lower percentiles of the US wage distribution. As a
result, the intensive margin changes observed in Britain led to a sharp reduction
in female earnings inequality but a sharp increase in male earnings inequality.
Second, the link between individual-level earnings and family-level labour
income depend on changes in family composition and marital sorting. Focussing
on the period since 1994, we find that both in Britain and the US, reductions in
marriage have been greatest among low-wage workers and non-workers. In
addition, the US has experienced an increase in assortative mating in terms of
the correlation between wage percentiles of both members of a couple. The
result of these trends has been an increase in inequality in family labour income
among men and women in both countries.
The most important final link from family labour income and net income
is the tax and benefit system. Indeed, we find that the divergent trends in net
income inequality in Britain and the US are largely due to the different policy
regimes. Specifically, increases in the generosity of transfer payments in Britain
under successive Labour governments between 1997 and 2010 boosted net
income growth among low-wage workers and non-workers thereby equalizing
growth rates in net income across the main part of the wage distribution. Policy
changes on this scale have not occurred in the US with the result that the pattern

25
of net income growth of US workers overall largely matches the pattern of family
labour income growth.
Differences in welfare policy are also key to understanding the
differential fortunes of non-workers between countries. In Britain, many transfer
payments are not contingent on work and therefore non-workers have
witnessed relatively strong net income growth in comparison to workers. In the
US, by contrast, a major part of the country’s ‘safety net’ is the EITC and welfare
that is targeted at non-working families has undergone successive reductions in
generosity. As a result, non-workers in the US have seen the largest average falls
in their net income, which is particularly worrying given this group now
accounts for a greater share of the working-age population than in previous
decades.
In summary, changes in labour market outcomes in Britain and the US
have undoubtedly influenced changes in net income inequality in both countries
over recent decades. However, the impact of labour market trends has differed
between countries both owing to differences in the nature of the trends
themselves and the way they have been mediated by the tax and benefit systems
of each country. A key difference between Britain and the US we have highlighted
is the margin of employment that has been the source of greatest adjustment. In
particular, the intensive margin of British male labour supply has become
increasingly flexible over the past 20 years with low-wage male workers in
particular experiencing large reductions in hours of work. This is in contrast to
the US where the greatest change has been the reductions in extensive margin
employment, which is somewhat puzzling given the very low level of transfer
income available to non-workers in the US. Explaining the reasons for this
difference is a key challenge for future research given its implications for welfare
and potential possible policy responses.

26
References
Atkinson, A. “What is Happening to the Distribution of Income in the UK?”, Proceedings of the British Academy, 1993, vol 82: 317-353.
- “Bringing Income Distribution in From the Cold,” Economic Journal, 1997, vol 107: 297-321.
- “The Welfare State, Budgetary Pressure and Labour Market Shifts”, Scandinavian Journal of Economics, 2000, vol 102: 445-462.
- “Towards a European Social Safety Net”, Fiscal Studies, 1992, vol 13: 51-53. - “From earnings dispersion to income inequality” (with A Brandolini)
in Inequality and Economic Integration (eds. F Farina and E Savaglio), Routledge, 2006, 35-62.
- “On the Measurement of Inequality”, Journal of Economic Theory, September 1970, vol 2: 244-263.
- “The Comparison of Multi-Dimensioned Distributions of Economic Status” (with F Bourguignon), Review of Economic Studies, 1982, vol 49: 183-201.
- “On the Measurement of Poverty”, Econometrica, l987, vol 55: 749-764 - “Top incomes in the UK over the 20th century”, Journal of the Royal Statistical
Society, 2005, series A, vol 168: 325-343. Auerbach, Alan and Joel Slemrod. (1997). “The Economic Effects of the Tax
Reform Act of 1986,” Journal of Economic Literature 35, 589–632. Autor, David H., Lawrence F. Katz, and Melissa S. Kearney. 2008. “Trends in
U.S. Wage Inequality: Revising the Revisionists,” Review of Economics and Statistics, 90(2): 300-323.
Avram, S., Brewer, M. and Salvatori, A. (2013), Lone Parent Obligations: an Impact Assessment, Department for Work and Pensions Research Report 845 (https://www.gov.uk/government/uploads/system/uploads/attachment_data/file/211688/rrep845.pdf)
Belfield, C., Blundell, R., Cribb, J., Hood, A., Joyce, R. and Norris Keiller, A. (2017), Two Decades of Income Inequality in Britain: the role of Wages, Household Earnings and Redistribution, IFS Report 123 (https://www.ifs.org.uk/uploads/publications/wps/WP201701%20-%20Exec%20summary.pdf).
Blundell, Richard, Amanda Gosling, Hidehiko Ichimura, and Costas Meghir. 2007. “Changes in the Distribution of Male and Female Wages Accounting for Employment Composition Using Bounds,” Econometrica 75(2): 323-363.
Blundell, Richard, Luigi Pistaferri, and Itay Saporta-Ecksten. 2016. “Consumption Inequality and Family Labor Supply,” American Economic Review 106(2): 387-435.
Blundell, Richard, and Andrew Shephard. 2012. “Employment, Hours of Work and the Optimal Taxation of Low-Income Families,” The Review of Economic Studies 79(2): 481-510.
Blundell, Richard, Moncia Costa-Dias, Costas Meghir, and Jonathan Shaw. 2016. “Female Labour Supply, Human Capital, and Welfare Reform,” Econometrica 84(5): 1705-1753.
Bollinger, Christopher R. and Barry T. Hirsch. 2006. “Match Bias from Earnings Imputation in the Current Population Survey: The Case of Imperfect Matching,” Journal of Labor Economics, 24(3): 483-519.

27
Bollinger, Christopher R., Barry T. Hirsch, Charles Hokayem, and James P. Ziliak. 2017. “Trouble in the Tails: What We Know about Wages 30 Years After Lillard, Smith, and Welch,” mimeo.
Bound, John, and George Johnson. 1992. “Changes in the Structure of Wages in the 1980s: An Evaluation of Alternative Explanations,” American Economic Review, 82(3): 371-392.
Bowlus, Audra, and Jean-Marc Robin. 2004. “Twenty Years of Rising Inequality in U.S. Lifetime Labour Income Values,” Review of Economic Studies 71(3): 709-742.
Burkhauser, Richard V., Shuaizhang Feng, Stephen Jenkins and Jeff Larrimore. 2012. “Recent Trends in Top Income Shares in the USA: Reconciling Estimates from March CPS and IRS Tax Return Data,” Review of Economics and Statistics, 94(2): 371-388.
Burman, Leonard, William Gale, and David Weiner. (1998). “Six Tax Laws Later: How Individuals’ Marginal Tax Rates Changed Between 1980 and 1995,” National Tax Journal 51, 637–652.
Card, David, and John E. DiNardo. 2002.” Skill-Biased Technological Change and Rising Wage Inequality: Some Problems and Puzzles,” Journal of Labor Economics, 20(4): 733-783.
Chandra, Amitabh. 2003. “Is the Convergence in the Racial Wage Gap Illusory?” NBER Working Paper 9476.
Cribb, J., Joyce, R. and Norris Keiller, A. (2017), Minimum Wages in the next Parliament, IFS Election Briefing Note 205 (https://www.ifs.org.uk/publications/9205).
Gosling, A., S. Machin, and C. Meghir, “The Changing Distribution of Male Wages in the U.K.” Review of Economic Studies, Volume 67, Issue 4, 1 October 2000, Pages 635–666.
Guvenen, Fatih, Greg Kaplan, Jae Song, and Justin Weidner. 2017. “Lifetime Incomes in the United States over Six Decades,” NBER Working Paper 23371.
Johnson, William, Yuichi Kitamura, and Derek Neal. 2000. “Evaluating a Simple Method for Estimating Black-White Wage Gaps in Median Wages,” American Economic Review 90(2): 339-343.
Joyce, R. and Sibieta, L. (2013), An Assessment of Labour’s record on poverty and inequality, Oxford Review of Economic Policy, Vol. 29 Issue 1 (https://academic.oup.com/oxrep/article-abstract/29/1/178/402517/An-assessment-of-Labour-s-record-on-income).
Juhn C, Murphy KM, Pierce B (1993) Wage inequality and the rise in returns to skill. Journal of Political Economy 101(3):410–442.
Katz, Lawrence F. and Kevin M. Murphy. 1992. “Changes in Relative Wages, 1963-87: Supply and Demand Factors.” Quarterly Journal of Economics 107(1): 35–78.
Katz, Lawrence F., and David H. Autor. 1999. “Changes in the Wage Structure and Earnings Inequality,” in O. Ashenfelter and D. Card (Eds.), Handbook of Labor Economics, vol. 3 (Amsterdam: North- Holland).
Kniesner, Thomas J., and James P. Ziliak. 2002. “Tax Reform and Automatic Stabilization,” The American Economic Review 92(3): 590–612.
Lemieux, Thomas. 2006. “Increasing Residual Wage Inequality: Composition

28
Effects, Noisy Data, or Rising Demand for Skill,” American Economic Review, 96(3): 461-498.
Machin, Stephen, 2015, “Real wage trends,” https://www.ifs.org.uk/uploads/Presentations/Understanding%20the%20recession_230915/SMachin.pdf
Nichols, Austin, and Jesse Rothstein. 2016. “Earned Income Tax Credit,” In Economics of Means-Tested Transfer Programs in the United States, Volume 1, Robert A. Moffitt (ed.), National Bureau of Economic Research and University of Chicago Press.
Piketty, Thomas and Emmanuel Saez. 2003. “Income Inequality in the United States, 1913-1998,” Quarterly Journal of Economics, 118 (1), 1-39.
Rothstein, Jesse, 2010, “Is the EITC as good as an NIT” AEJ: Economic Policy, 2(1) 177-208;
Ziliak, James P. 2015. “Recent Developments in Antipoverty Policies in the United States.” In Social Policies in an Age of Austerity, J.K. Scholz, H. Moon, and S. Lee (editors), Cheltenham, UK: Edward Elgar Publishing, 235-262.
Ziliak, James P. 2016. “Temporary Assistance for Needy Families,” In Economics of Means-Tested Transfer Programs in the United States, Volume 1, Robert A. Moffitt (ed.), National Bureau of Economic Research and University of Chicago Press, 303-393.

29
30

31

32

33
34

35

36

37

38

39

40

41

42

43

44
APPENDIX FOR ONLINE PUBLICATION

45

46

47

48
Appendix Table 1. Selected Summary Statistics in Great Britain and the United States
GB US Variable Mean Std. Dev Mean Std. Dev Age 39.77 8.80 39.44 8.84 Female 0.51 0.50 0.55 0.50 Low Educated 0.51 0.50 0.15 0.36 Mid-Low Educated 0.22 0.41 0.34 0.47 Mid-High Educated 0.06 0.24 0.25 0.43 High Educated 0.22 0.41 0.26 0.44 White 0.90 0.30 0.81 0.39 Black 0.03 0.16 0.13 0.33 Married/Cohabiting (GB) Married (US) 0.74 0.44 0.65 0.48 Has Dependent Children 0.47 0.50
0.54
0.50
Labour Force Participant 0.83 0.37
0.83
0.37
Employed 0.78 0.42 0.85 0.36 Real Wage 12.91 27.30 16.96 18.36 Weekly hours 36.05 14.82 34.19 17.47 Real Earnings (‘000s) 20.12 50.49 33.91 41.91
Note: for the US (GB) statistics, low educated refers to high school dropouts (left educated aged <=16); mid-low educated refers to high school only (left educated aged 17-18); mid-high educated refers to some college (left educated aged 19-20); high educated refers to college or more (left educated aged 21+).