income inequality in costa rica according to the national
TRANSCRIPT

Income inequality in Costa Rica according to the national household income and expenditure surveys of 2004 and 2013
Andrés Fernández Aráuz
ABSTRACT Labour income inequality declined in most of the Latin American countries in the early years of the twenty-first century. Costa Rica, however, is one of the few countries in which this measure has not fallen, but has indeed continued to rise. By comparing 2004 and 2013, dispersion by hours worked and wage differences between public and private sector workers are identified as the main causes of this rise in inequality.
KEYWORDS Economic conditions, income, employment, income distribution, measurement, household surveys, Costa Rica
JEL CLASSIFICATION C12, D31, J18, J31
AUTHOR Andrés Fernández Aráuz is a researcher in social economics and economics of education and holds an Economics Degree from the University of Costa Rica. [email protected]

140 C E P A L R E V I E W 1 1 9 • A U G U S T 2 0 1 6
INCOME INEQUALITY IN COSTA RICA ACCORDING TO THE NATIONAL HOUSEHOLD INCOME AND EXPENDITURE SURVEYS OF 2004 AND 2013 • ANDRÉS FERNÁNDEZ ARÁUZ
Labour income inequality declined considerably in the Latin American region in the period following the year 2000. However, this has not been the trend observed in Costa Rica.1
Azevedo and others (2013) found that over a period of 15 years (from 1995 to 2010) the region has seen a significant fall in labour income inequality, as measured by the Gini and Theil coefficients. Not all the countries have registered the same downtrend, however: the Gini coefficient rose in Costa Rica, Honduras and Uruguay; the Theil index, meanwhile, rose in these same three countries and in El Salvador and Peru, as well.
eclac (2012) finds that the tendency towards growing inequality began to go into reverse in Latin America early in the 2000 decade and Gini coefficients began to fall. eclac (2014) also finds that: “[…] This marks a major shift in the inequality trend in the region, with the turning point coming between 2002 and 2003. The change has created a promising scenario, particularly after distribution indicators failed to improve in the 1990s. Even though Latin America and the Caribbean has kept its position as the world’s most unequal region, 15 of 17 countries in the region show distributive improvements in the 2002-2011 period. Of the 17 countries studied,
The author is grateful to Ronulfo Jiménez Rodríguez, a retired professor of the School of Economics of the University of Costa Rica, for his assistance in the discussion of the results.1 Document prepared for the symposium of the national household income and expenditure survey (enigh) of 2013, held in Costa Rica by the National Institute of Statistics and Censuses (inec), in March 2015.
the (relative) Gini index rose between 2002 and 2011 in just two.” These two countries are Costa Rica and the Dominican Republic.
The finding of a rise in labour income inequality in Costa Rica over the past decade was also observed by Fernández and Del Valle (2011). However, labour earnings are not the only type of income that can be used to examine inequality.
For example, the National Institute of Statistics and Censuses of Costa Rica (inec, 2014), using data from the national household income and expenditure survey (enigh), found no substantial variation between 2004 and 2013 in per capita income inequality in Costa Rica, measured by the Gini coefficient.
This work aims to determine whether income inequality in Costa Rica, estimated for three different types of income, varied between 2004 and 2013, and to establish whether the change in inequality occurred in the same direction for all three types of income. It also aims to establish the effect of wage formation variables on the change in labour income inequality.
The article is organized as follows: section II explains the type of inequality to be analysed with the data available and how this relates to inequality of opportunities. It also introduces the concept of the measures of inequality used to compare the years 2004 and 2013, and describes human capital theory as a determinant of labour income.
Section III describes the data sources and the three types of income analysed, as well as the methodology used to obtain the estimates. Section IV analyses the results, and section V concludes.
IIntroduction1
141C E P A L R E V I E W 1 1 9 • A U G U S T 2 0 1 6
INCOME INEQUALITY IN COSTA RICA ACCORDING TO THE NATIONAL HOUSEHOLD INCOME AND EXPENDITURE SURVEYS OF 2004 AND 2013 • ANDRÉS FERNÁNDEZ ARÁUZ
Economic inequalities may be understood as inequalities in the distribution of assets that have an economic impact on individuals or that are economic in origin, such that economic inequalities are either the outcome or a determinant of resource allocation.
Income distribution is undoubtedly the key variable for studying economic inequality, and has been the focus of much of the economic research conducted on the subject. However, the flow of income is only part of the complex sphere of economic inequalities.
In order to understand the importance of income inequality, it is crucial to realize that inequality per se is not the main concern, but rather the inequality of opportunities that income inequity can cause.
From the point of view of well-being, income is assumed to be a proxy for the measurement of individual well-being, although this may be better measured by consumption. It must likewise be borne in mind that the income measurement leaves out the benefits derived from the enjoyment of public goods and assets, such as public parks, libraries, public safety, social benefits, and so forth.
However, income has two characteristics that give it an advantage over others as a variable: the data are quantifiable and relatively easy to obtain, and income comparisons can be made between individuals and periods of time.
For these two reasons, this research concentrates on inequality of outcomes, measured by family and personal income, but it should be recalled that a comprehensive analysis of inequality should take into account inequalities of opportunities and their close relationship with income inequality.
1. Determinants of inequality in labour income
Because labour income is a category of personal income, inequality in its distribution can be analysed jointly with other personal variables, something that is not possible with family income.
In economic theory and the empirical evidence, the analysis of labour income inequality is based on human capital theory, whereby spending on education and training to raise an individual’s productivity and future earnings in the labour market can be viewed as a human capital
investment decision. Thus, the investment is not limited to years of formal education, but also includes all types of specific training or learning of additional languages that can enhance a worker’s productivity.
Another component often used to analyse the explanatory factors of wage formation is the experience that individuals build up over the course of their working lives.
The type of working day or the variability of hours worked can also have an effect on inequality and it is important to analyse the impact of these hours on wages for the study of income distribution. The length of the working day is conditioned by several factors, such as the time individuals need to care for children, the shortage of jobs available with the length of working day preferred, or other needs that limit the time people have available to devote to paid work.
This basic human capital theory of disparities in earnings may not fully explain the determinants of income distribution. McConnell, Brue and Macpherson (2003) take an approach to distribution of earnings based on multiple factors apart from education and training, such as discrimination (be it on the basis of ethnicity, gender, political or religious ideology, or other reasons), labour mobility and compensatory wage differentials.
Economic discrimination exists where women with the same abilities, level of education, training and experience as men face worse conditions in hiring, access to employment, promotions, wages or working conditions.
Meanwhile, immigration or labour mobility can affect income distribution: a flow of working-age immigrants who are less educated than the average worker in the destination country expands the supply of unskilled labour, which can widen the income gap and worsen income distribution indicators.
Lastly, the theory of compensatory differentials holds that non-wage aspects of jobs vary enormously and can give rise to compensatory wage differentials, consisting of extra payment an employer must provide to compensate a worker for a particular characteristic not present in other jobs. Such wage differentials are measured by including in the model variables such as the branch of economic activity, the institutional sector (public or private), firm size or area of residence.
IIInequality

142 C E P A L R E V I E W 1 1 9 • A U G U S T 2 0 1 6
INCOME INEQUALITY IN COSTA RICA ACCORDING TO THE NATIONAL HOUSEHOLD INCOME AND EXPENDITURE SURVEYS OF 2004 AND 2013 • ANDRÉS FERNÁNDEZ ARÁUZ
1. Measurement of income
The literature on economic inequality does not yield a clear consensus on whether total household income or per capita income is the most appropriate variable for evaluating income concentration.
According to Medina (2001), it is valid to affirm that either variable may be appropriate, depending on the aims of the research in hand. Accordingly, the purpose of the measurement must be specified before proceeding to choose the corresponding variable.
The use of total household income can sometimes be justified on the basis that the family is the unit of consumption that drives its members’ income perceptions and decisions on resource allocation.
In recent years, however, a number of studies have shifted the discussion towards individual well-being and, thus, the analysis focuses on the individual, especially in terms of the design and delivery of social policy.
The number of household members thus becomes an important factor in the measurement of inequality and poverty, owing to the empirical observation that lower-income households have a larger numbers of members than those at the upper end of the income distribution.2 This is related to their greater needs, but also to economies of scale generated in the use of public goods within households.3
2. Data
The data used in this research come from Costa Rica’s national household income and expenditure survey (enigh), which is conducted by the National Institute of Statistics and Censuses (inec).
The last three surveys were conducted in 1988, 2004 and 2013, but this study uses only those of 2004
2 In the case of Costa Rica, according to the enigh conducted in 2013, households in the lowest income quintile had an average of 4.2 members, whereas those in the highest income quintile had an average of 2.6.3 However, per capita income would not be the most appropriate variable for studying individual well-being either, because its calculation does not take into account the fact that minors and adults have different needs (Medina, 2001).
and 2013, owing to issues of comparability between the 1988 and 2013 surveys.
The surveys provide updated information on the composition of the budget of national and resident households, by enquiring into income and its use in the acquisition of goods and services.
All the information obtained in this type of survey is essential for establishing the structure of household income and expenditure, and for guiding development policies and programmes to maximize society’s well-being. enigh also allows updating of the weightings of spending on the goods and services that make up the consumer price index (cpi) and the basic food basket, which is used in poverty measurement. It also provides information for the compilation and sequencing of household sector accounts for the System of National Accounts (sna) and for updating the spending structures implicit in the base year of the accounts.
In 2013, the enigh survey was carried out for the sixth time in Costa Rica. It began on 1 October 2012 and concluded on 19 October and was carried out by inec.
enigh used a two-stage, stratified area probability sampling design, which was replicated for the following domains: national, urban area, rural area and planning region. The selection unit was the individual households within the national territory and the units of analysis were dwellings, households and individuals residing permanently in those dwellings. A total of 7,020 households were selected, of which final information is available for 5,705. Data collection was conducted by means of household visits and personal interviews, as well as through survey questionnaires for respondents to complete with their personal and household expenditure.
Three types of income will be used for inequality analysis: total gross current household income, per capita gross current household income, and gross income of income-earners.
The gross income of income-earners (or labour income) is based on the measurement of gross income from work, which consists of gross monetary and non-monetary income (gross wage, additional wages, payment in kind from the main and secondary occupation, and by the employer or own-account worker, plus self-supply by the employer or own-account worker). This income
IIIData and methodology
143C E P A L R E V I E W 1 1 9 • A U G U S T 2 0 1 6
INCOME INEQUALITY IN COSTA RICA ACCORDING TO THE NATIONAL HOUSEHOLD INCOME AND EXPENDITURE SURVEYS OF 2004 AND 2013 • ANDRÉS FERNÁNDEZ ARÁUZ
represented 63% of the total gross current income of Costa Rican households in 2013.
The total gross current household income includes this labour income plus the income received by all the household members in the form of:4
• Autonomous income: income from profits and self-supply from independent work (owners or own account) not formally constituted into a company, whether agricultural or non-agricultural.
• Net rental income: all type of income from rentals; as well as income such as interest, dividends and benefits from cooperatives.
• Transfers received in cash.• Self-supply.• Other labour income: other income from previous
employment or income of those aged under 15 who are working.
3. Methodology
As described thus far, this work analyses changes in income inequality using three different types of income and three different measures of inequality (Gini and Theil coefficients and the variance of log income), as well as an initial analysis of the Lorenz curve.
An important consideration often overlooked in studies on inequality is the fact that the calculation of inequality indicators is obtained from data that were generated from a survey and that are thus derived from a prior survey design.
The omission lies in the fact that any estimate derived from a survey based on probability sampling is simply one possibility for the true value in the population overall, and it is therefore necessary to calculate standard errors in order to establish intervals in which the true value for the overall population can be established with a certain degree of confidence.
However, some inequality indicators, such as the Gini coefficient, do not come from a known probability distribution, hence other techniques must be used to obtain that confidence interval.
4 According to inec recommendations, in the databases for 2013, gifts in kind, barter goods and social contributions and taxes were deducted from the income of formal sector independent workers, because they had not been included under this Item in 2004. In addition, for the base year 2004, net household profits and payments made by formal sector independent workers’ firms were deducted from income from property rentals, and added to income from independent work and to wages in kind, respectively, since they are treated as labour income in the conceptual framework used in 2013 (inec, 2014).
This study uses the bootstrap technique, a method that employs resampling procedures to generate a large number of samples as a basis to study the behaviour of certain statistics.5 For this work, 5,000 samples were generated based on the data.
Once the 5,000 iterations had been performed for each year (for the same income indicator), and two vectors had been obtained for the distribution of the indicator, a test was applied to analyse the differences between the distributions.
The Mann-Whitney-Wilcoxon test is a non-parametric rank-sum test for independent samples. Given that the vectors of the inequality coefficients cannot be assumed to be normally distributed, this is an appropriate test, because the null hypothesis is that both distributions (in this case, that of 2004 and that of 2013) come from identical populations (this is also known as a median equality test).
It should be noted that the Jarque-Bera test for normality of errors yielded very high values in all cases; consequently, a means difference test such as a t test cannot be performed, since the errors are not distributed normally. This bears out the suitability of the Mann-Whitney-Wilcoxon test, which is in fact the non-parametric version of the usual t test.
4. Fields decomposition technique
To break down the contribution of each explanatory variable to total inequality in labour income, we use the technique developed by Gary S. Fields.6
This decomposition technique is based on the Mincer wage equation, which may be rewritten as follows:
ln Y a X a Zit it itj itj
nit itjj
n
1 1)) f= + =
= =_ i / /
where: ln(Yit) is the natural logarithm of monthly income, Xitj are the variables j associated with person i in year t,
5 Procedures based on the bootstrap technique imply disregarding statisticians’ suppositions regarding the theoretical distribution. Instead, the distribution of the statistic is determined by simulating a high number of random samples built directly on the basis of the observed data (eliminating one element each time). That is, the original sample is used to generate new samples that serve as a basis for inductive estimation of statistical sample distribution, rather than starting with a theoretical distribution assumed a priori (Flores, 2005).6 This method and the Yun decomposition technique are developed as described in Fields (2003).

144 C E P A L R E V I E W 1 1 9 • A U G U S T 2 0 1 6
INCOME INEQUALITY IN COSTA RICA ACCORDING TO THE NATIONAL HOUSEHOLD INCOME AND EXPENDITURE SURVEYS OF 2004 AND 2013 • ANDRÉS FERNÁNDEZ ARÁUZ
ait are the coefficients that accompany each variable, and eit is the part of income variation between workers that cannot be explained by the variation in the variables included in the equation.
Taking the variance in both sides of the equation of income change, on the left side we obtain one of the measures of inequality used in this work: the variance of the natural logarithm of income, while the variance on the right side can be manipulated to obtain the following:7
,
ln
ln
Var Y
Cov a z YS1
j jj
jj,=
7 A//
where each Sj is termed “factor relative weight in inequality,” and is given by:
,
ln
ln
Y
Cov a Ys
Var
zj j
j = _ i7 A
The above equation may be interpreted as the measure in the proportion of the variance of log income that is explained by each regressor variable j.
Shorrocks (1982) shows that it is not necessary to decompose each measure of inequality separately, because the same percentage weight is obtained for each explanatory variable using log income. These measures include the Gini coefficient, the Atkinson index and the Theil coefficient.8
However, the percentage contributions to changes in inequality —whether it increases or decreases— depend on the measure of inequality being used.
7 The decomposition is obtained as follows: given that ln Y a zj jj
j
1
2=
=
+_ i / ,
then , ,ln lnCov a z Y Cov a z Yj jj
j
j jj
j
1
2
1
2=
=
+
=
+; 7E A/ / ; since the left
side of this equation is the covariance between the income logarithm and itself, it is simply the variance of lnY. Thus:
,ln lnVar Y Cov a z Yj jj
j
1
2=
=
+ 7 A/ dividing both sides by the log
variance gives: ,
ln
ln
Var Y
Cov a z YS1
j jj
j
jj
j1
2
1
2,=
=
+
=
+7 A/
/ .
8 The decomposition works only if the variables are strictly linear. This is why we exclude the possibility of using interaction between regressor variables.
For any given measure of inequality I(t), the change in inequality can be written in terms of the weights and measures of inequality for each period:
I I S I S I2 1 2 1j jj
2 1) )− = −_ _ _ _i i i i9 C/
This equation may be used to calculate the contribution to change in income inequality made by each regressor variable for any inequality index.
5. Yun decomposition technique
Another possible type of decomposition using the variance of log income as the measure of inequality is the technique developed by Yun (2002), following the procedure developed by Juhn, Murphy and Pierce (1993).
Juhn, Murphy and Pierce (1993) define the price effect of a variable on the size of the change in an “income distribution 1” and “income distribution 2” as the difference between the inequality of distribution 2 and the inequality of an auxiliary distribution that uses the prices of distribution 1 and the quantities and residuals of distribution 2:
ln Y a X a Z Iaux j i j jj j i jj aux1 2 2 1 2) )f= + = =/ /
The variance of the logarithm of the auxiliary income regression may be decomposed as:
,ln ln lnY a Z Cor Z Y Yaux j j j aux auxj
21 2 2v v v=_ _ _ _i i i i/
Using the auxiliary distribution, the difference obtained in inequality between periods 1 and 2 may be expressed as:
I I I I I Iaux aux2 1 2 1− = − + −_ _i i
which, for the variance of the logarithm, is decomposed as:

145C E P A L R E V I E W 1 1 9 • A U G U S T 2 0 1 6
INCOME INEQUALITY IN COSTA RICA ACCORDING TO THE NATIONAL HOUSEHOLD INCOME AND EXPENDITURE SURVEYS OF 2004 AND 2013 • ANDRÉS FERNÁNDEZ ARÁUZ
where the variables of the previous equation are interpreted as follows: each term in the first summation is the price effect of the j-th variable, while each term in the second summation is the quantity effect of the j-th variable, i.e. of each regressor.
, ,
, ,
ln ln ln ln
ln ln ln ln
ln ln
a Z Cor Z Y Y a Z Cor Z Y Y
a Z Cor Z Y Y a Z Cor Z Y Y
Var Y Var Y
j j j j j jj
j j j aux j j jj
aux aux
aux
2 2 2 2 2 1 2 2
1 2 2 1 1 1 1 1
2 1
v v v v
v v v v
= −
+ −
−_ __ _ _ _ _ _
_ _ _ _ _ _
i ii i i i i i
i i i i i i
9
9
C
C
//
Lastly, to ascertain what fraction of the weight of each regressor’s inequality is attributable to the price effect of that regressor, and what fraction to the quantity effect, the terms of the j-th variable are divided by the change in the weight of that factor’s inequality:
, ,
, ,
ln ln ln ln
ln ln ln ln
S S
a Z Cor Z Y Y a Z Cor Z Y Y
S S
a Z Cor Z Y Y a Z Cor Z Y Y
1j j
j j j j j j aux aux
j j
j j j aux aux j j j
2 1
2 2 2 2 2 1 2 2
2 1
1 2 2 1 1 1 1 1
v v v v
v v v v
= −
−
+ −
−
_ _ _ _ _ _
_ _ _ _ _ _
i i i i i i
i i i i i i
9
9
C
C
where the first term is the percentage contribution of the price effect and the second is the percentage contribution of the quantity effect.
IVResults
The analysis of the results from examination of the behaviour of income inequality in Costa Rica for 2004 and 2013 is presented by type of income, including, in each case, the different measures of inequality set forth in the first part.
1. Inequality in total gross current household income
In this case, the unit of analysis is the household. In 2004, enigh estimated 1,152,588 households in Costa Rica, and in 2013, a total of 1,396,747 households.
Figure 1 shows the Lorenz curve for this type of income.
It may be seen clearly that the area of the Lorenz curve for 2013 (thin black line) is completely contained within the Lorenz curve for 2004. In this case, it may be concluded from the graph that inequality of total gross current household income dropped between 2004 and 2013.
The situation in which the two Lorenz curves do not intersect (except at the extreme) is not very common, but when it does occur it supports a direct analysis of inequality.
However, it is important to clarify that although income inequality declined as measured by total gross current household income, the distribution remains highly unequal: the richest 20% of households in Costa Rica account for over 55% of total current income.
The Gini coefficient confirms the observations thus far. This coefficient represents the area between the equidistribution and the Lorenz curve. The Gini coefficient estimated fell from 0.5189 in 2004 to 0.5041 in 2013.
When the Mann-Whitney-Wilcoxon test is applied, it may be concluded at a 5% significance level that the data for the Gini coefficient do not come from identical populations for 2004 and 2013 (see annex A1 with the estimates).

146 C E P A L R E V I E W 1 1 9 • A U G U S T 2 0 1 6
INCOME INEQUALITY IN COSTA RICA ACCORDING TO THE NATIONAL HOUSEHOLD INCOME AND EXPENDITURE SURVEYS OF 2004 AND 2013 • ANDRÉS FERNÁNDEZ ARÁUZ
The Theil index estimated for this income distribution also shows a significant decline in the measure of inequality, from 0.517 to 0.477 in the two years studied; the same occurs with the other measure of inequality used, variance of log income, which drops from 0.99 to 0.87 (see annex A1).
2. Inequality in per capita gross current household income
In this case, the unit of analysis is each individual in Costa Rica, since each household’s income is divided proportionally between its members. In 2004, enigh estimated a population of 4,267,262 inhabitants in Costa Rica, while in 2013 the estimate was 4,697,002.
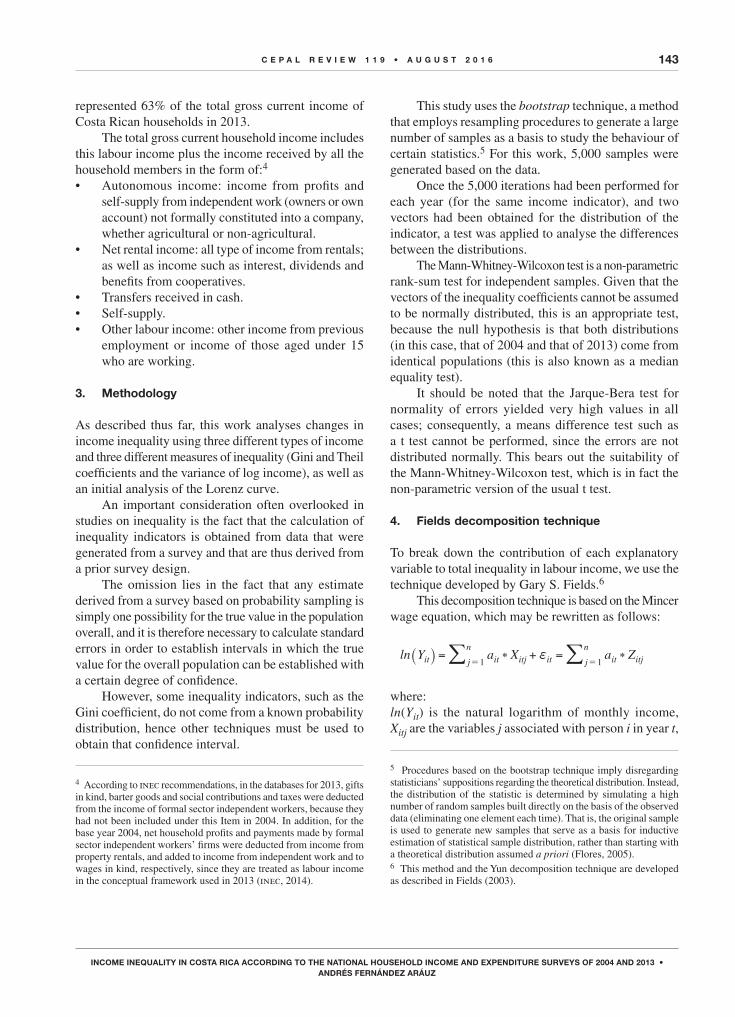
Figure 2 shows the Lorenz curve for this type of income.
At first sight, the situation with per capita gross current household income is less clear-cut. Accordingly, conclusions about inequality cannot be drawn on the basis of the Lorenz curves alone.
The Gini coefficient for per capita gross current household income is 0.5348 in 2004 and 0.5338 in 2013. This means that the area underneath the Lorenz curve remained practically unchanged between the two years, although with a slight decline in 2013.
The Mann-Whitney-Wilcoxon test shows no difference in the results (for the one-tailed test), so the null hypothesis that both sets of data come from the same distribution may be rejected.
FIGURE 1
Costa Rica: Lorenz curve of total gross current household income, 2004 and 2013
0
20
40
60
80
100
0 10 20 30 40 50 60 70 80 90 100
2013 2004 Equidistribution
Percentage of the population
Perc
enta
ge o
f in
com
e
Source: Prepared by the author.
The Gini coefficient is an area, and can thus be expressed in terms of percentages. Thus, the Gini coefficient for per capita gross current household income edged down from 53.4% to 53.3%, which in practical terms does not represent a large drop in inequality, as was borne out by the Mann-Whitney-Wilcoxon test.
Using the Theil entropy coefficient to analyse inequality yields a statistically significant reduction in the index, from 0.574 to 0.547.
Calculation of the variance of log income, by contrast, gives a slight rise in the estimated value, from 0.957 to 0.965; however, as with the Gini coefficient for this type of income, the variation is not statistically significant (see annex A1).
In sum, the results from using per capita gross current household income to analyse the variation in income inequality between 2004 and 2013 do not support any firm conclusion, although it can be observed that by this measure of income distribution, inequality did not rise or remained at levels that for practical purposes showed no variation.
3. Inequality in the labour income of earners
In this case, the unit of analysis is the individual, but only earners of labour income aged between 15 and 65. In 2004, these were estimated to number 1,397,128, and in 2013, there were an estimated 1,542,150 workers in the Costa Rican labour market.
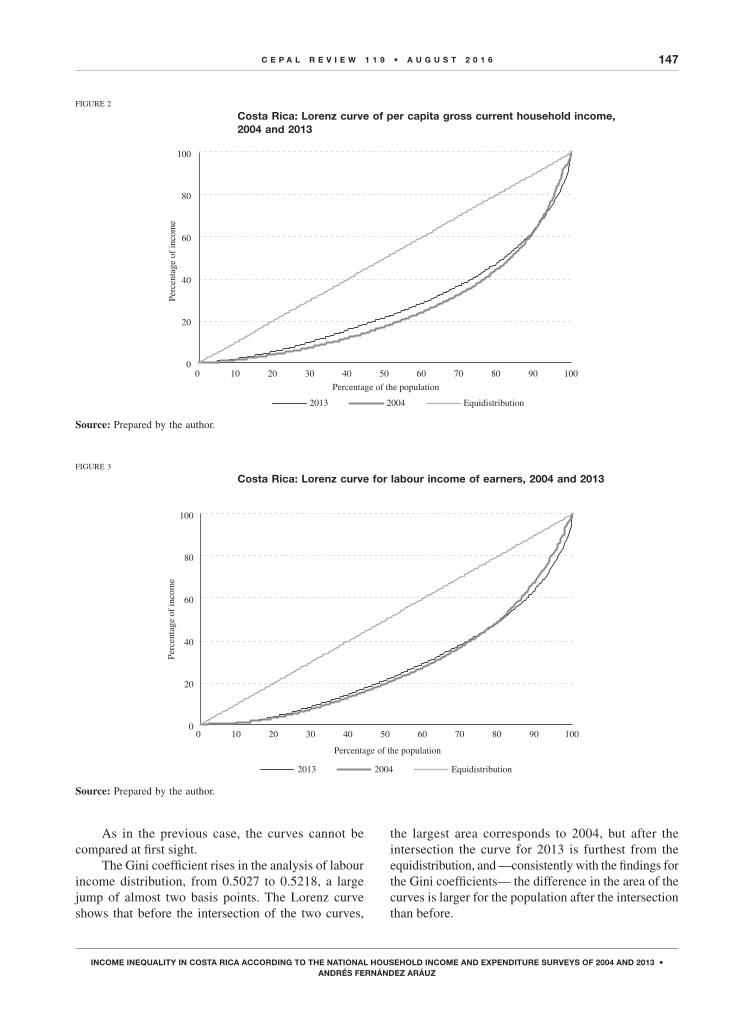
Figure 3 shows the Lorenz curve for this type of income.
147C E P A L R E V I E W 1 1 9 • A U G U S T 2 0 1 6
INCOME INEQUALITY IN COSTA RICA ACCORDING TO THE NATIONAL HOUSEHOLD INCOME AND EXPENDITURE SURVEYS OF 2004 AND 2013 • ANDRÉS FERNÁNDEZ ARÁUZ
FIGURE 2
Costa Rica: Lorenz curve of per capita gross current household income, 2004 and 2013
0
20
40
60
80
100
0 10 20 30 40 50 60 70 80 90 100
2013 2004 Equidistribution
Percentage of the population
Perc
enta
ge o
f in
com
e
Source: Prepared by the author.
FIGURE 3
Costa Rica: Lorenz curve for labour income of earners, 2004 and 2013
0
20
40
60
80
100
0 10 20 30 40 50 60 70 80 90 100
2013 2004 Equidistribution
Percentage of the population
Perc
enta
ge o
f in
com
e
Source: Prepared by the author.
As in the previous case, the curves cannot be compared at first sight.
The Gini coefficient rises in the analysis of labour income distribution, from 0.5027 to 0.5218, a large jump of almost two basis points. The Lorenz curve shows that before the intersection of the two curves,
the largest area corresponds to 2004, but after the intersection the curve for 2013 is furthest from the equidistribution, and —consistently with the findings for the Gini coefficients— the difference in the area of the curves is larger for the population after the intersection than before.

148 C E P A L R E V I E W 1 1 9 • A U G U S T 2 0 1 6
INCOME INEQUALITY IN COSTA RICA ACCORDING TO THE NATIONAL HOUSEHOLD INCOME AND EXPENDITURE SURVEYS OF 2004 AND 2013 • ANDRÉS FERNÁNDEZ ARÁUZ
The difference is statistically significant, according to the Mann-Whitney-Wilcoxon test.
The Theil index and the labour income logarithm variance confirm the tendency towards a rise in inequality between 2004 and 2013 (see annex A1).
4. Why does labour income inequality rise between 2004 and 2013?
As discussed in section II, unlike household income, individuals’ labour income may be related to a series of variables associated with income level.
The model presented below includes the following variables: education, monthly hours worked, firm size, years of experience, sector (public/private), sex, area of residence (urban/rural) and immigration status.
Table 1 shows the results of applying the Fields decomposition technique for this model.9
TABLE 1
Costa Rica: contribution of each variable to explaining the variability in labour income inequality, 2004 and 2013(Percentages)
Variable 2004 2013
Education level 17.6 16.9Hours worked 16.4 18.0Firm size 7.3 8.0Years of experience 5.4 5.8Public/private sector 4.3 5.6Sex 3.0 2.9Area of residence 1.8 1.3Immigrant status 0.0 0.0Total explained 55.8 58.6Total unexplained 44.2 41.4Total 100.0 100.0
Source: Prepared by the author, on the basis of the 2004 and 2013 editions of the national household income and expenditure survey (enigh) of Costa Rica.
As in previous studies for Costa Rica (see Gindling and Trejos, 2003 and 2006; Fernández and Del Valle, 2011), education level and type of working day are the two main variables explaining variability in labour income (without taking into account the error term), since the
9 According to the Akaike information criterion (aic) and the Bayesian information criterion, of the exponential family of generalized linear models, the data used fit a Gaussian model with an identity link function better than the Gamma distribution.
two combined account for a third of the variability in this type of income.
A second group of variables contribute quite a sizeable portion of labour income inequality: differences in firm size (small firms with between 1 and 19 employees, medium-sized firms with between 10 and 29 employees, and large firms with over 30 employees), an individual’s years of work experience (with age used as a proxy for this) and sector of employment (civil servants earn higher wages on average than private sector workers).
The variability in labour income by sex is small after controlling for other factors (3%), as are differences in urban or rural residence, while the variable capturing immigration status was included in the model solely to show that is it not significant in explaining labour income in Costa Rica (see annex A2 with the results of the regression model estimation).
As has been shown, labour income inequality among earners (wage-earners, employers and own-account workers) rose between 2004 and 2013 for the three indicators used: the Gini coefficient rose from 0.503 to 0.522; the Theil coefficient from 0.479 to 0.515, and the variance of the natural logarithm of labour income, from 1.256 to 1.499.
Yun’s decomposition technique may be used to estimate the relative weight of each of the factors shown in table 1 in the increase in labour income inequality for each of the indicators. Figure 4 shows the results of this procedure.
Leaving out the factor of immigrant status (which was not statistically significant), four factors made a positive percentage contribution to the rise in inequality for all three indicators: dispersion by hours worked, sector of work (public/private), firm size and work experience.
Conversely, only one factor made a negative percentage contribution to the rise in inequality for the three indicators: area of residence, i.e. the area in which individual members of the working-age population lived contributed to reducing inequality (though this was logically offset by the other factors, since the net effect was a rise in labour income inequality).
Unlike the five factors mentioned above, two had an ambiguous effect, that is, they either increased or reduced inequality depending on the indicator used. These two are education and sex (the residual, or unidentified, factors had a similar effect).
Figure 4 shows that each factor can have a different effect on the variation in inequality depending on the indicator used; for this reason, each must be analysed separately. To this end, table 2 shows the percentage contribution of each variable to the rise in inequality.

149C E P A L R E V I E W 1 1 9 • A U G U S T 2 0 1 6
INCOME INEQUALITY IN COSTA RICA ACCORDING TO THE NATIONAL HOUSEHOLD INCOME AND EXPENDITURE SURVEYS OF 2004 AND 2013 • ANDRÉS FERNÁNDEZ ARÁUZ
TABLE 2
Costa Rica: percentage contribution of each factor to the rise in labour income inequality between 2004 and 2013, by indicator(Percentages)
Variable Var(log(Y)) Gini Theil
Hours worked 25.8 60.2 39.5Sector 11.9 39.5 22.9Firm size 11.6 26.9 17.7Experience 8.1 17.8 11.9Area -0.9 -10.5 -4.7Education 13.5 -1.2 7.7Sex 2.1 -1.5 0.6Other unidentified 27.8 -31.6 4.1Immigration 0.1 0.4 0.2Total 100.0 100.0 100.0
Source: Prepared by the author, on the basis of the 2004 and 2013 editions of the national household income and expenditure survey (enigh) of Costa Rica.
With respect to the variance of the natural logarithm of income, practically all the variables had a positive effect on inequality, that is, all contributed to increasing inequality as measured by this indicator. The variables included in the model explain 72% of the rise in inequality, with hours worked and education having the strongest effects.
In the case of the Gini coefficient, however, not all the variables had a positive effect on inequality. Four
FIGURE 4
Costa Rica: percentage contribution of each factor to the rise in labour income inequality between 2004 and 2013, by indicator
-40
-30
-20
-10
0
10
20
30
40
50
60
70
Imm
igra
tion
Hou
rs w
orke
d
Sect
or
Firm
siz
e
Exp
erie
nce
Are
a
Edu
catio
n
Sex
Oth
er u
nide
nti�
ed
Var(log(Y)) Gini Theil
Perc
enta
ge
Source: Prepared by the author.
contributed to its rise: dispersion in hours worked, sector of work, firm size and work experience; while area of residence and, to a lesser extent, sex had the opposite effect, i.e. helped to reduce inequality as measured by the Gini coefficient.
In the case of the Theil index, practically all the variables increased inequality, especially dispersion in hours worked, sector of work and firm size.
This analysis yields a number of considerations which should be borne in mind when studying the behaviour of income inequality in Costa Rica.
Whatever the indicator used, dispersion in hours worked is the factor carrying most weight in the increase in labour income inequality. This was not the result of wage rises differentiated by type of working day, but rather the shift in the distribution of workers, because the proportion of those working full days and overtime increased.
Unlike in previous research (Gindling and Trejos, 2003 and 2006; Fernández and Del Valle, 2011), the variability in income from the labour sector had a notable effect on pushing up inequality in Costa Rica, especially as measured by the Gini coefficient. In this case, the influence was the result not of a change in the distribution of the variable (the proportion of public sector workers rose from 15% to 18% of the Costa Rican labour market during this period), but of the price effect or “public sector premium”

150 C E P A L R E V I E W 1 1 9 • A U G U S T 2 0 1 6
INCOME INEQUALITY IN COSTA RICA ACCORDING TO THE NATIONAL HOUSEHOLD INCOME AND EXPENDITURE SURVEYS OF 2004 AND 2013 • ANDRÉS FERNÁNDEZ ARÁUZ
which is nothing more or less than wage differences between sectors.
According to enigh, real wages grew in both the public and private sectors, but much faster in the former case (27% compared to 15%, see annex A4). This occurred both because of half-yearly wage rises and incentives available to virtually all public servants in the Costa Rica,10 and because of a policy of wage adjustments implemented between 2007 and 2010, which was intended to raise the wages of public servants at the lower end of the wage scale to bring them into line with other workers with similar functions in institutions with higher wage scales.11
10 For example, the anualidad is an incentive that increases public servants’ wages simply for having worked a full year in the public institution and is not linked to any sort of productivity criterion or rigorous performance assessment. Exclusive dedication or prohibition of outside work are incentives that increase the base salary by 20%, 55% or 65%, with the aim of having workers devote themselves exclusively to the particular public institution, and refrain from employment for other work or in other firms. However, this benefit has been extended to practically all professional staff in the public sector without analysis of the real need for such an incentive. 11 The “percentile 50” policy, which was adopted in 2007 and ended in 2010, consisted of raising central government wages in line with
Although education level is one of the factors that best explains income inequality in any given year (see table 2), it was one of the main drivers of inequality growth between 2004 and 2013 only when measured by the variance of log income, and in the case of the Gini coefficient its contribution to the variation in inequality was virtually nil.
Most of the inequality relating to educational qualifications is generated at the tertiary level, since the price effect or premium of a university degree exceeds the effects of the other levels of education (see annex A2).
However, the true effect of education level can be biased, owing to its high correlation with the public sector employment; in fact, while only 20% of workers in the private sector have tertiary education, 66% of workers in the public sector have at least one year of university studies, and they registered real wage rises of 25%, much more than the 5% average real wage gain of workers with university degrees in the private sector (see annex A5).
percentile 50 of the non-financial autonomous public sector (see Loría and Umaña, 2014).
VConclusions
The comparison of data for 2004 and 2013 does not support the affirmation of a generalized increase or decrease in inequality; on the contrary, thought needs to be given to which type of income distribution is to be analysed to obtain conclusions regarding the change in inequality.
The results of this research show that the variation in income inequality differs depending on the type of income analysed.
If social policymaking is to be directed towards improving the situation of Costa Rican households, taking the household as the unit of measure and policy target (regardless of the number of members in each household), it may be affirmed that income distribution between the poorest and wealthiest households improved, comparing exclusively the years 2004 and 2013, which translates into a reduction in inequality.
If the focus, conversely, is placed on the labour market and income-earners, then there is solid evidence
that labour income inequality worsened between 2004 and 2013.
In the case of per capita income, certain considerations must be borne in mind when using it as a measure of inequality. First, it is a proxy income, in the sense that no household member actually receives it; rather it represents an equitable division of the household’s total income among its members, assigning this fictitious amount both to members of the household in the labour force, and to those who are not part of the economically active population, such as infants, children and older persons.
Second, and as a result of the first consideration, per capita income does not take into account the fact that the needs of minors may differ from those of adults. The use of the per capita variable implies the supposition that income generates the same utility for everyone, i.e. that the cost of achieving a given level of well-being is the same for anyone in the household, regardless of aspects such as the number of its members, their sex or their age.
151C E P A L R E V I E W 1 1 9 • A U G U S T 2 0 1 6
INCOME INEQUALITY IN COSTA RICA ACCORDING TO THE NATIONAL HOUSEHOLD INCOME AND EXPENDITURE SURVEYS OF 2004 AND 2013 • ANDRÉS FERNÁNDEZ ARÁUZ
However, studies that have attempted to correct this problem of economies of scale by using equivalence scales still base their estimates on a series of suppositions that do not allow the per capita component to be completely removed either, because equivalence scales tend to be highly sensitive to model specifications (see Alonzo and Mancero, 2011; Trejos and Oviedo, 2006 and 2012).
In addition to the theoretical issues involved in using per capita income, the results of the variation in income distribution for Costa Rica for 2004 and 2013 show no clear movement either up or down. The only affirmation that these very small variations support is that inequality did not rise as measured by this type of income.
The decomposition techniques used show that the type of working day (dispersion by hours worked) and
education level continue to be the main factors explaining labour income inequality in any given year.
Even more revealing is the fact that the rise in inequality measured by labour income is strongly driven by wage differences in the public and private sectors, and is reinforced by real wage rises in the public sector far exceeding those in the private sector, especially among workers with university level education.
It is normal and even healthy in an economy for the labour market to reward the effort of a higher level of education and training with a higher wage —providing that at least a threshold of wage conditions is maintained for workers who do not have tertiary education, and that labour guarantees are respected— but the existence of an additional, artificially created premium generates distortions that have an impact on inequality.
Bibliography
Alonzo, H. and X. Mancero (2011), “Escalas de equivalencia en los países de América Latina”, Estudios Estadísticos y Prospectivos series, No. 73 (LC/L.3325-P), Santiago, Economic Commission for Latin America and the Caribbean (eclac).
Altimir, O. and S. Piñera (1977), “Análisis de descomposición: una generalización del método de Theil”, Santiago, Economic Commission for Latin America and the Caribbean (eclac)/World Bank, preliminary version.
Azevedo, J. and others (2013), “Fifteen years of inequality in Latin America: how have labor markets helped?”, Policy Research Working Paper, No. WPS6384, Washington, D.C., World Bank.
eclac (Economic Commission for Latin America and the Caribbean) (2014), Compacts for Equality: Towards a Sustainable Future (LC/G.2586(SES.35/3)), Santiago.
(2012), Social Panorama of Latin America 2011 (LC/G.2514-P), Santiago.
Fernández, A. and R. del Valle (2011), “Estimación de los determinantes de la desigualdad en los ingresos laborales de Costa Rica para el periodo 2001-2009”, Revista de Ciencias Económicas, vol. 29, No. 2, San José, University of Costa Rica.
Fields, G. (2003), “Accounting for income inequality and its change: a new method, with application to the distribution of earnings in the United States”, Research in Labor Economics, vol. 22.
(1998), “Do inequality measures measure inequality?”, Cambridge, Cambridge University Press [online] http://digitalcommons.ilr.cornell.edu/cgi/viewcontent.cgi?article=1464&context=articles.
Flores, J. (2005), “Aplicación del método bootstrap al contraste de hipótesis en la investigación educativa”, Revista de Educación, No. 336, Madrid, Ministry of Education, Culture and Sport.
Gindling, T. and J. Trejos (2006), “¿Por qué aumenta la desigualdad en la distribución del ingreso laboral entre los años 1988 y 2004?”, exhibition prepared for the Symposium “Costa Rica a la luz de la Encuesta Nacional de Ingresos y Gastos de los Hogares 2004”, San José.
(2003), “Accounting for changing earnings inequality in Costa Rica in the final quarter of the 20th Century”, Baltimore, University of Maryland/University of Costa Rica.
inec (National Institute of Statistics and Census) (2014), Encuesta Nacional de Ingresos y Gastos de los Hogares 2013. Principales resultados, San José.
Juhn, C., K.M. Murphy and B. Pierce (1993), “Wage inequality and the rise in returns to skill”, Journal of Political Economy, vol. 101, No. 3, Chicago, University of Chicago Press.
Kliksberg, B. and A. Sen (2007), Primero la gente: una mirada desde la ética del desarrollo a los principales problemas del mundo globalizado, Barcelona, Editorial Deusto.
Loría, M. and C. Umaña (2014), Costa Rica: empleo y política salarial del sector público, San José, Academia de Centroamérica.
Mancero, X. (2000), “Revisión de algunos indicadores para medir desigualdad”, Sexto Taller Regional Indicadores sobre el Desarrollo Social (LC/R.2046), Economic Commission for Latin America and the Caribbean (eclac).
McConnell, C., S. Brue and D. Macpherson (2003), Economía Laboral, Madrid, Editorial McGraw-Hill/Interamericana de España.
Medina, F. (2001), “Consideraciones sobre el índice de Gini para medir la concentración del ingreso”, Estudios Estadísticos y Prospectivos series, No. 9 (LC/L.1493-P), Santiago, Economic Commission for Latin America and the Caribbean (eclac).
Sauma, P. and J. Trejos (2014), Reducir la pobreza en Costa Rica es posible: propuestas para la acción, San José, United Nations Development Programme.
Shorrocks, A. (1982), “Inequality decomposition by factor components”, Econometrica, vol. 50, No. 1, New York, Econometric Society.
Theil, H. (1967), Economics and Information Theory, Chicago, Rand McNally and Company.
Trejos, J. (1999), “Reformas económicas y distribución del ingreso en Costa Rica”, Reformas Económicas series, No. 37 (LC/L.1228), Santiago, Economic Commission for Latin America and the Caribbean (eclac).
Trejos, J. and L. Oviedo (2012), “Cambios en la distribución del ingreso familiar en Costa Rica durante la primera década del Siglo xxi”, Revista de Ciencias Económicas, vol. 30, No. 2.
(2006), “Enfoque de la dominancia para el análisis de la evolución de la pobreza entre 1988 y 2004”, paper prepared for the Symposium “Costa Rica a la luz de la Encuesta Nacional de Ingresos y Gastos de los Hogares 2004”, San José.
World Bank (2005), World Development Report 2006: Equity and Development, Washington, D.C.
Yun, M. (2002), “Earnings inequality in the usa, 1961-1999: comparing inequality using earnings equations”, Tulane University, unpublished.

152 C E P A L R E V I E W 1 1 9 • A U G U S T 2 0 1 6
INCOME INEQUALITY IN COSTA RICA ACCORDING TO THE NATIONAL HOUSEHOLD INCOME AND EXPENDITURE SURVEYS OF 2004 AND 2013 • ANDRÉS FERNÁNDEZ ARÁUZ
ANNEXES
ANNEX A1
Costa Rica: estimate of income inequality measured by type of income, 2004 and 2013
Year
Per capita gross current income without lease value
Total gross current income without lease value
Gross wage income
L.low Estimate L.up L.low Estimate L.up L.low Estimate L.up
Gini coefficien * Gini coefficient Gini coefficient
2004 0.525 0.535 0.544 0.504 0.519 0.534 0.489 0.503 0.5162013 0.524 0.534 0.544 0.487 0.504 0.521 0.506 0.522 0.538Variation 0.00 0.00 0.00 -0.02 -0.01 -0.01 0.02 0.02 0.02
Year Theil entropy index Theil entropy index Theil entropy index
2004 0.542 0.574 0.606 0.465 0.517 0.569 0.440 0.479 0.5182013 0.525 0.547 0.569 0.441 0.477 0.514 0.485 0.515 0.544Variation -0.02 -0.03 -0.04 -0.02 -0.04 -0.06 0.04 0.04 0.03
Year Variance of log income* Variance of log income Variance of log income
2004 0.931 0.957 0.983 0.942 0.993 1.044 1.185 1.256 1.3262013 0.944 0.965 0.986 0.837 0.870 0.903 1.423 1.499 1.575Variation 0.01 0.01 0.00 -0.10 -0.12 -0.14 0.24 0.24 0.25
Source: Prepared by the author, on the basis of the 2004 and 2013 editions of the national household income and expenditure survey (enigh) of Costa Rica.
Note: Lease value is another source of non-monetary income and consists of the imputed rental value of an owned dwelling, which is not an income received in cash, but provides a benefit to the household through the service of accommodation provided to its owners. L.low and L.up are the lower and upper limits of the 95% confidence interval calculated using the bootstrap technique. * The variation in the indicator between 2004 and 2013 is not statistically significant.
ANNEX A2
Coefficients of estimated linear regressions
Variable2004
2013
Coefficient s.e. Coefficient s.e.
Constant 6.5134 (0.1391) 6.4270 (0.1384)Women -0.3669 (0.0242) -0.4060 (0.0232)Age 0.0804 (0.0056) 0.1185 (0.0058)Age squared -0.0009 (0.00007) -0.0013 (0.00007)Urban 0.1762 (0.0241) 0.1794 (0.0236)Incomplete primary 0.3094 (0.0757) 0.2156 (0.0747)Complete primary 0.4073 (0.0732) 0.2792 (0.0717)Incomplete secondary 0.5603 (0.0755) 0.4757 (0.0730)Complete secondary 0.7738 (0.0782) 0.6822 (0.0748)Tertiary 1.3889 (0.0762) 1.3716 (0.0746)Hours (logarithm) 0.6849 (0.0199) 0.7060 (0.0178)Public 0.3700 (0.0344) 0.4471 (0.0316)10 to 29 employees 0.3347 (0.0326) 0.3425 (0.0305)30 or more employees 0.4293 (0.0257) 0.4840 (0.0254)Immigrant* -0.0471 (0.0354) -0.0019 (0.0327)R2: proportion of total variability explained by covariance 0.5577 0.5855Mean square error 0.57 0.65No. observations 4 990 5 955
Source: Prepared by the author, on the basis of the 2004 and 2013 editions of the national household income and expenditure survey (enigh) of Costa Rica.
Note: s.e.: Standard error of coefficient; * variable not significant at 1% for both years.

153C E P A L R E V I E W 1 1 9 • A U G U S T 2 0 1 6
INCOME INEQUALITY IN COSTA RICA ACCORDING TO THE NATIONAL HOUSEHOLD INCOME AND EXPENDITURE SURVEYS OF 2004 AND 2013 • ANDRÉS FERNÁNDEZ ARÁUZ
ANNEX A3
Results of the inequality change decomposition, using the Yun decomposition technique
Variable Price effect Quantity effect Total effect
Residual -0.00002 0.07318 0.07316Woman -0.00708 0.01249 0.00540Age 0.11294 -0.03984 0.07310Age squared -0.06262 0.01071 -0.05190Urban 0.00947 -0.01184 -0.00237Incomplete primary -0.00071 0.00887 0.00816Complete primary -0.03006 0.04595 0.01589Incomplete secondary -0.05766 0.04852 -0.00914Complete secondary -0.00019 -0.01380 -0.01399Tertiary 0.36127 -0.32655 0.03472Hours (logarithm) 0.10418 -0.03619 0.06800Public 0.05215 -0.02075 0.0314110 to 29 employees 0.00905 -0.00830 0.0007530 or more employees 0.02933 0.00037 0.02969Immigrant 0.00738 -0.00720 0.00019Total 0.52744 -0.26437 0.26307
Source: Prepared by the author, on the basis of the 2004 and 2013 editions of the national household income and expenditure survey (enigh) of Costa Rica.
ANNEX A4
Costa Rica: distribution of workers in the labour market and average real wage, 2004 and 2013
Category
Proportion of workers Average real wage
2004 2013Variation
(percentages) 2004 2013
Variation (percentages)
By sex
Men 64.3 59.0 -5.3 426 370 505 979 18.7Women 35.7 41.0 5.3 301 653 414 330 37.4Total 100.0 100.0 0.0
By sector
Private 84.6 81.6 -3.1 319 985 366 614 14.6Public 15.4 18.4 3.1 722 252 918 402 27.2Total 100.0 100.0 0.0
By education level
No education 2.2 1.9 -0.3 153 333 174 702 13.9Incomplete primary 12.9 8.6 -4.3 180 547 197 284 9.3Complete primary 30.2 25.2 -5.0 219 422 238 256 8.6Incomplete secondary 18.8 20.3 1.5 270 566 271 190 0.2Complete secondary 13.2 15.5 2.2 366 089 374 609 2.3Tertiary 22.6 28.6 5.9 837 238 963 502 15.1Total 100.0 100.0 0.0
By firm size
Fewer than 10 employees 47.0 39.7 -7.3 250 746 256 113 2.110 to 29 employees 14.6 17.8 3.2 421 438 469 786 11.530 or more employees 38.4 42.5 4.0 527 106 666 382 26.4Total 100.0 100.0 0.0
Source: Prepared by the author, on the basis of the 2004 and 2013 editions of the national household income and expenditure survey (enigh) of Costa Rica.
Note: Real wages refer to Costa Rican colones at April 2013.

154 C E P A L R E V I E W 1 1 9 • A U G U S T 2 0 1 6
INCOME INEQUALITY IN COSTA RICA ACCORDING TO THE NATIONAL HOUSEHOLD INCOME AND EXPENDITURE SURVEYS OF 2004 AND 2013 • ANDRÉS FERNÁNDEZ ARÁUZ
ANNEX A5
Costa Rica: distribution of workers and average real wage by sector of work and by level of education, 2004 and 2013
Level of education
Proportion of workers(percentages)
Average real wage
2004 2013 2004 2013
Private Public Private Public Private Public Private Public
No education 2.6 0.2 2.3 0.0 151 058 290 044 174 446 245 055Incomplete primary 15.1 0.9 10.3 1.2 177 751 429 939 188 726 525 825Complete primary 33.7 10.9 29.0 8.0 206 912 431 878 228 986 386 151Incomplete secondary 20.4 10.1 22.8 9.4 255 844 434 643 249 309 505 665Complete secondary 12.1 19.7 15.6 14.8 317 376 529 937 335 361 558 198Tertiary 16.2 58.1 20.0 66.6 797 368 898 361 839 152 1 128 372Total 100.0 100.0 100.0 100.0
Source: Prepared by the author, on the basis of the 2004 and 2013 editions of the national household income and expenditure survey (enigh) of Costa Rica.
Note: Real wages refer to Costa Rican colones at April 2013.