income inequality’s impact on community development · income inequality’s impact on community...
TRANSCRIPT
FALL 2011VOLUME 23NUMBER 2
Federal Reserve Bank of San Francisco
Income Inequalityrsquos Impact on Community DevelopmentPlus
CDFI Bond FundAdult LiteracyDr CRA
CI Notebookby Laura Choi
Last year Proctor amp Gamble introduced a new discounted dish soap line as part of its growing offering of lower-priced consumer products At the same time the company launched its most expensive skin care regimen ever designed to rival pricey department store
brands According to a recent Wall Street Journal article PampG is strategically targeting its products to the higher-end and lower-end markets while ignoring the middle and theyrsquore not alone A number of American companies are recognizing that the consumer market is polarizing with growth at both ends and erosion in the middle This ldquoconsumer hourglassrdquo is reflective of a broader trend of increasing income inequality in the United States As a larger share of total income becomes concentrated among the countryrsquos top earners low- and moderate-income (LMI) households are forced to make do with less This is particularly concerning as their balance sheets were already stretched thin further financial constraints threaten to destabilize these households and the neighborhoods in which they reside
This issue of Community Investments explores the issue of income inequality from a community development perspective examining the broad trends that have contributed to its rise as well as the impact of inequality at the individual and community level The articles consider different facets of income inequality such as the geographic segregation of income groups at the neighborhood and regional level and the increasing polarization of the labor market A ldquoCommunity Perspectivesrdquo thought piece examines the causes and consequences of the broad changes in income distribution In addition we address the impact of poverty stressors on LMI households Our ldquoEye on Community Developmentrdquo section highlights important advancements in the community development field including the CDFI Bond Program and new approaches to addressing adult literacy
We hope this issue of CI sheds light on the complex topic of income inequality in the United States and more importantly on the community development fieldrsquos role in addressing it We believe the field can leverage various programmatic and policy responses to help build the incomes of LMI households and place more individuals on the path to upward socioeconomic mobility As always we welcome your comments and suggestions and hope that you will join in the discussion
Laura Choi
Community Development DepartmentFederal Reserve Bank of San Francisco
101 Market Street Mail Stop 215San Francisco CA 94105
wwwfrbsforg(415) 974-2765 fax (415) 393-1920
Joy HoffmannGroup Vice President Public Information and Community Development joykhoffmannsffrborg
Scott TurnerVice President Community Development and Economic Education scottturnersffrborg
Laurel GourdConference and Administrative Coordinatorlaurelgourdsffrborg
RESEARCH STAFFDavid EricksonManager Center for Community Development Investments davidericksonsffrborg
Ian GallowaySenior Investment Associate iangallowaysffrborg
Naomi CytronSenior Research Associatenaomicytronsffrborg
Laura ChoiSenior Research Associatelaurachoisffrborg
Matthew SoursourianResearch Associatematthewsoursouriansffrborg
FIELD STAFFJohn OlsonDistrict Manager johnolsonsffrborg
Jan BontragerRegional ManagerArizona Nevada Utahjanbontragersffrborg
Melody Winter NavaRegional ManagerSouthern Californiamelodynavasffrborg
Craig NolteRegional ManagerAlaska Hawaii Idaho Oregon Washingtoncraignoltesffrborg
Lena RobinsonRegional ManagerNorthern California lenarobinsonsffrborg
Darryl RutherfordRegional ManagerSan Joaquin Valley darrylrutherfordsffrborg
This publication is produced by the Community Development Department of the Federal Reserve Bank of San Francisco The magazine serves as a forum to discuss issues relevant to community development in the Federal Reserversquos 12th District and to highlight innovative programs and ideas that have the potential to improve the communities in which we work
In this IssueSpecial Focus Income Inequality
Addressing Widening Income Inequality through Community Development 2By Laura Choi Federal Reserve Bank of San FranciscoAn overview of the history causes and current implications for the community development field of widening income inequality in America
Ties that Bind Income Inequality and Income Segregation 8By Naomi Cytron Federal Reserve Bank of San Francisco Widening inequality is experienced not at the national level but rather on a community by community basis Learn about income inequality and its relationship to income segregation
The Polarization of Job Opportunities in the US Labor Market 11By David Autor Massachusetts Institute of Technology An in-depth analysis of the state of the US labor market over the past three decades reveals that the US labor market is polarizing into low- and high-skill jobs with fewer opportunities in the middle
Community Perspectives Widening Inequality Hurts Us All 17By Robert Reich University of California Berkeley A thought piece by the former Secretary of Labor on the causes and consequences of our nationrsquos rising inequality
Stressing Out the Poor Chronic Physiological Stress and the Income-Achievement Gap 22By Gary W Evans Cornell University Jeanne Brooks-Gunn and Pamela Kato Klebanov Columbia University This article explores the link between childhood poverty and the negative effects of prolonged exposure to stressful environments Eye on Community Development
CDFI Bond ndash Opportunity of a Decade 28By Cathy Dolan Opportunity Finance NetworkLearn about the CDFI Bond Guarantee Program which offers affordable long term government guaranteed debt financing to promote community and economic development
Building Literacy Skills and Transforming Lives 31By Cathay Reta ProLiteracy and Mari Riddle Centro Latino for LiteracyOver 30 million adults in the US canrsquot read or write well enough to perform daily tasks Read about successful approaches to building adult literacy skills
Quarterly Features
Data Snapshot Income Inequality 35
Research Briefs 36
Dr CRA 38
Federal Reserve Bank of San Francisco
Addressing Widening Income Inequality through Community DevelopmentBy Laura Choi
2 Community Investments Fall 2011 ndash Volume 23 Issue 2
Addressing Widening Income Inequality through Community DevelopmentBy Laura Choi
The median annual household income in the US is slightly over $500001 In contrast the highest paid CEO in the US earned $845 million last year a factor of roughly 1700 times the median (and that was for only nine months of work)2 To
compare these two figures and decry income inequality in America is an oversimplification of a highly complex issue But this comparison hints at a growing divide in our country where a relatively small group of people controls a relatively large share of the incomemdashthe top one percent of Americans control nearly a quarter of all the countryrsquos income the highest share controlled by the top one percent since 19283 The ex-istence of income inequality is accepted as a byproduct of capitalism where the market rewards individuals for their varying levels of produc-tivity but how much is too much And should we be concerned with the apparent rise in income inequality
Community development practitioners are all too familiar with the effects of poverty but less effort has been given to understanding the bigger picture of income inequality Inequality exacts high social costs across all income groups Emerging research suggests that crime teen pregnancy poor educational performance drug use obesity mental illness and lower life expectancy are positively correlated with income inequality (regardless of the overall level of income in an area)4 As Richard Wilkin-son and Kate Pickett write in their book The Spirit Level ldquoThe problems in rich countries are not caused by the society not being rich enough (or even by being too rich) but by the scale of material differences between peoplehellipWhat matters is where we stand in relation to others in our own societyrdquo5 In addition rising inequality has been linked to declining social capital and civic engagement In his book Bowling Alone Robert Putnam explains ldquoCommunity and equality are mutually reinforcinghellip In terms of the distribution of wealth and income America in the 1950s and 1960s was more egalitarian than it had been in more than a centuryhellip [T]hose same decades were also the high point of social connectedness and civic engagementhellip Conversely the last third of the twentieth century was a time of growing inequality and eroding social capitalrdquo6
Undoubtedly a highly inequitable distribution of income is most troublesome for those with the least understanding and addressing in-equality is thus an important component of improving the lives of low- and moderate-income (LMI) individuals The topic of income inequality is notoriously thorny as it mixes elements of history politics economics and philosophy but this article aims to untangle some of these issues and consider them through a community development lens
The Great Divergence
Figure 1 shows the income share of the top decile of earners over the past century based on income tax data analyzed by economists Thomas Piketty and Emmanuel Saez7 From the mid-1920rsquos until the early 1940rsquos income was highly concentrated among top earners with the top decile earning roughly 45 percent of total income However a drastic shift occurred during World War II Economists Claudia Goldin and Robert Margo dubbed this period the ldquoGreat Compressionrdquo in reference to the drastic flattening of the wage structure8 According to Goldin and Margo this period saw a rapid increase in the demand for unskilled labor at the same time that the supply of educated labor was expanding bring-ing wages across the labor market closer together The income share of
Special Focus Income Inequality
3 Community Investments Fall 2011 ndash Volume 23 Issue 2
the top decile stabilized around 33 percent following the Great Compression and with less income concentrated at the top a strong middle class flourished throughout the 1940rsquos and into the late 1970rsquos However the shared prosperity of the midcentury period gave way to a rapid rise in income inequality beginning in the 1980rsquos a period economist Paul Krugman refers to as the ldquoGreat Divergencerdquo9
Alternative measures of income inequality support the notion of a Great Divergence Figure 2 shows the trajec-tory of real hourly wages for various earners since 1973 demonstrating that those at the top of the earning scale saw their wages rise much more rapidly than those at the bottom Real hourly wages of those in the 90th percen-tile where most people have college or advanced degrees rose by 30 percent or more while wages at the 50th per-
centile and below where many people have at most a high school diploma rose by only 5 to 10 percent10 Another commonly used tool to examine income inequal-ity is the Gini index which is a statistical measure of the inequality of a distribution The Gini index ranges from a value of 0 to 1 when applied to income distributions the lower the Gini index the more equal the income distri-bution as the index rises so too does income inequality (a value of 1 would mean that a single person earns all of the income)11 Figure 3 shows the Gini index for US households over the past forty years and demonstrates that income inequality has been increasing fairly consis-tently over time To provide some global context consider that the most equitable societies (Sweden Hungary and Norway) presently rank in the low 02s the US at close to 047 is on par with the Ivory Coast Cameroon and Jamaica in terms of equitable income distribution12
What Caused the Divide
But how exactly did this rise in income inequality come about The causes of the Great Divergence are wide ranging and interwoven as a result there is no singular answer to this question13 However one of the most influ-ential determinants of labor market outcomes and wages is education Figure 4 shows the differences in the growth of real wages over time by educational attainment Since 1973 real wages have risen about 20 percent for those with college or advanced degrees while they have remained flat for high school graduates and fallen about 15 percent for those with less than a high school education The US population has increased their overall schooling over the past 30 years with a greater share of the total popula-tion graduating from high school and college however much of the increase in schooling since the 1970s is due to the dying out of older generations with comparatively
Source US Census Bureau Current Population Survey Annual Social and Economic Supplements
Figure 3 Gini Index for US Households 1967ndash2009
Source Economic Policy Institute
Figure 2 Change in Real Hourly Wages for Select Percentiles 1973ndash2007
(all workers normalized 1973=100)
4 Community Investments Fall 2011 ndash Volume 23 Issue 2
110
115
120
125
130
135
140
Figure 2 ‐ Real Hourly Wages for Select Percentiles 1973 ‐ 2007(all workers normalized 1973=100)
95th
90th
80th
90
95
100
105
110
1973 1978 1983 1988 1993 1998 2003
50th
20th
10th
Source Economic Policy Institute2007
049Figure 3 ‐ Gini Index for US Households 1967 to 2009
047
045
0 41
043
039
041
037
039
1967
1969
1971
1973
1975
1977
1979
1981
1983
1985
1987
1989
1991
1993
1995
1997
1999
2001
2003
2005
2007
2009
Source US Census Bureau Current Population Survey Annual Social and Economic Supplements
25
30
35
40
45
50
1917
1922
1927
1932
1937
1942
1947
1952
1957
1962
1967
1972
1977
1982
1987
1992
1997
2002
2007Sh
are
of to
tal i
ncom
e go
ing
to to
p 10
Fig 1 Top Decile Income Share in the US 1917-2008
Source Piketty and Saez (2010) Income defined as market income including capital gains In 2008 top decile includes all familieswith annual income above $109062
Source Piketty and Saez (2010)Income defined as market income including capital gains In 2008 top decile includes all families with annual income above $109062
Figure 1 Top Decile Income Share in the US 1917ndash2008
little education rather than steadily growing educational attainment among younger generations14 This slowdown of educational progress across successive generations coupled with shifting demographics (the aging of the baby boomers and the labor market entry of the smaller baby bust cohorts) has resulted in a relatively smaller supply of skilled labor relative to previous decades15 At the same time the rise in the use of technology across almost all sectors of the economy has resulted in increased demand for skilled labor16 Economists Lawrence Katz and Claudia Goldin argue that the educational system has failed to produce an adequate supply of skilled labor to keep up with the pace of technological change over the past 30 years17 In contrast remember that the Great Compres-sion that took place in the early 1940rsquos was essentially a reversal of this situation where skilled labor was plentiful at a time when unskilled labor was in demand flatten-ing wages across the labor market Today employers are competing to hire highly skilled workers from a limited pool creating a wage premium for those with better train-ing and education the result is the widening income gap across education groups In addition consider the impact of educational attainment on employability in Septem-ber 2011 the unemployment rate for those without a high school degree was 13 percent but for those with a bach-elorrsquos degree the unemployment rate was 42 percent18
In addition to the decline in educational attainment researchers have explored other potential causes for the rise in income inequality One hotly debated topic is tax policy and the redistribution of income Higher-income households pay more taxes but also have greater access to special tax breaks more than 90 percent of the tax savings from preferential tax rates on long-term capital gains and qualified dividends go to taxpayers in the top quintile of the income distribution as do three-fourths of
the savings from itemized deductions19 In addition tax rates for the top earners have fallen since 1980 from the 1940rsquos through the end of the 1970rsquos marginal rates of 70 ndash 90 percent were imposed on the highest income bracket but this figure has since decreased to about 40 percent20 However most of the value of tax credits goes to house-holds in the bottom four quintiles nearly 80 percent of nonrefundable credits and more than 95 percent of refund-able credits benefit those households21 Richard Burkhaus-er of Cornell University argues that the inclusion of trans-fer income such as Social Security and TANF paints a more complete picture of the financial resources available to a household than wages and taxable income alone Burkhauser finds that after factoring in taxes and transfers the financial resources available to the bottom quintile of the population increased almost 15 percent from 1979 (the top quintile saw growth of almost 50 percent)22 The debate around tax policy is highly complex and there is no clear answer about the extent to which it has caused income in-equality but itrsquos clear that public policy plays an important role in addressing income inequality
Taking a more international perspective immigration and globalization are also thought to have an impact on labor markets and wages and thus inequality Letrsquos first consider immigration Despite the popular notion that immigrants reduce wages and opportunities for native workers research suggests that immigrants expand the economyrsquos productive capacity by stimulating invest-ment and promoting specialization23 Economist David Card argues that the impact of immigration on the relative wages of US natives is small suggesting instead that im-migration has affected overall wage inequality because of the concentration of immigrants in the tails of the skill dis-tribution24 Card estimates that immigration accounts for just a small sharemdashabout 5 percentmdashof the rise in overall US wage inequality between 1980 and 200025 Global-ization through an increase in international trade and out-sourcing of employment across various industries has also been widely blamed for job losses and depressed wages The US tends to export goods that rely on skilled labor and to import goods that rely more heavily on unskilled labor fueling the demand for skilled labor and reducing the demand for less-skilled workers (thereby driving wages
Today employers are competing to hire highly skilled workers from a limited pool creating a wage premium for those with better training and education the result is the widening income gap across education groups
Source Economic Policy Institute
Figure 4 Change in Real Hourly Wages by Education 1973ndash2007
(all workers normalized 1973=100)
5 Community Investments Fall 2011 ndash Volume 23 Issue 2
130
Figure 4 ‐ Change in Real Hourly Wages by Education 1973 ‐ 2007(all workers normalized 1973=100)
120
130Advanced Degree
110College
100
Some College
90High School
80Less than High School
70
1973 1976 1979 1982 1985 1988 1991 1994 1997 2000 2003 2006Source Economic Policy Institute
Special Focus Income Inequality
even further apart)26 Imports of manufactured goods from developing countries more than doubled as a percentage of US gross domestic product from slightly over two percent in 1990 to close to 45 percent in 200627 This rapid growth of trade has likely had significant distributional effects but there is insufficient data to quantify the effect28 A recent paper by IMF researchers Jaumotte Lall and Papageor-giou supports the notion that trade globalization increases income inequality but interestingly the authors conclude that globalization and technological changes increase the returns on human capital underscoring the importance of education and training in both developed and developing countries in addressing rising inequality29
This is by no means a complete discussion of the causes of income inequality Other considerations include the decline of organized labor the fall of the real value of the minimum wage and the rapid growth of incomes at the very top of the distribution (the so-called super-stars such as athletes CEOs and highly compensated finance professionals)30 But addressing widening income inequality requires us to take the next step beyond identi-fying causesmdashwe need to think critically about near- and long-term solutions for building financial resources and opportunities for LMI communities
The Role of the Community Development Field
Federal Reserve Governor Sarah Bloom Raskin recent-ly pointed out that ldquoInequality is destabilizing and under-mines the ability of the economy to grow sustainably and efficientlyrdquo31 She went on to say
[Inequality] is associated with increases in crime profound strains on households lower savings rates poorer health outcomes and diminished levels of trust in people and institutions All of these forces drag down maximum economic growth and are anathema to the social progress that is part and parcel of such growth These forces also bring people closer to being ldquoscammedrdquo or becoming vulnerable to financial schemes that promise quick and easy fixes Finding ways to help more Americans safely grow their incomes and net worth in real terms arguably diminishes the destructive influence of income inequality by giving everyone a more secure footing in the economy and the same kind of flexibility and choice available to the more affluent32
When framed in this way the role of the communi-ty development field in addressing income inequality is clearmdashto help LMI communities safely grow their incomes and access greater economic security and opportunity This requires a two-fold approach The first is to tend to the
immediate needs of low-resource households by providing supports that help them earn and keep as much income as possible in the near-term This includes traditional com-munity development initiatives such as the provision of affordable housing access to affordable financial services workforce development and efforts to build savings
The second approach is to address the broader set of factors that influence the long-term earning potential and productivity of LMI individuals with a particular focus on the next generation of workers Nobel Laureate James Heckman argues that the best way to create greater pro-ductivity and prosperity is to achieve better outcomes for children33 This begins with major investments in educa-tion and human capital development As previously dis-cussed the decline in educational attainment and the undersupply of highly skilled workers is responsible for a fair share of the growth in income inequality Janet Yellen former President of the Federal Reserve Bank of San Fran-cisco and current Vice Chair of the Board of Governors of the Federal Reserve System pointed to the importance of education for addressing inequality saying ldquoImprove-ments in education are an imperative for reducing in-equality and an easily justifiable investment given its high social returnrdquo34 Thus increasing the scale and effective-ness of educational interventions is more important than ever Such efforts include early childhood education in-creasing high school graduation rates or asset building programs to increase college affordability The importance of fostering achievement among low-income children cannot be overstated A recent report on the wellbeing of American children by the Annie E Casey Foundation concluded ldquoChildren who grow up in low-income fami-lies are less likely to successfully navigate lifersquos challenges and achieve future success The younger they are and the longer they are exposed to economic hardship the higher the risk of failurerdquo35
The community development field can also tackle issues that indirectly impact individual achievement For example poor health can significantly impair school and job performance thereby impacting earnings and op-portunities for advancement36 The emerging connection between health and community development provides an opportunity for the field to promote better health out-comes among LMI populations thereby maximizing the earning potential of education and work related activities (to learn more about the Federal Reserve Bank of San Fran-ciscorsquos Healthy Communities initiative see httpwwwfrbsforgcdinvestmentsconferenceshealthy-communi-ties) Another example is the impact that ldquoplacerdquo can have on an individualrsquos achievement and earning potential So-cioeconomic conditions in very poor neighborhoods are associated with more limited opportunities for residents including lack of access to high-quality schools fewer
6 Community Investments Fall 2011 ndash Volume 23 Issue 2
Data methodology
Changes in inequality over time are often reported based on the use of income data from the Census Bureau which ranks households from highest to lowest income then divides society into five groups and determines the share of total income received by each quintile1 The Census quintiles contain unequal number of persons2 Comparison of these quintiles over time shows that wealthier households have experienced greater income gains relative to poorer households However critics argue that this approach leads to an overstatement of the problem because the census statistics provide only a snapshot of income distribution at a single point in time and do not reflect that households may move into different income quintiles over time3 Thus a comparison of quintiles over time means compar-ing incomes of different people at different stages in their earnings profile However others argue that the Census data is appropriate for observing trends in income distribution and whether the overall societal distribution of income has changed over time4
Debate also exists about the appropriate definition for household income The Census Bureaursquos official definition of income does not include non-cash resources such as subsidies for housing food and medical care for low-income households Some argue that the exclusion of such noncash resources thus overstates the problem of income inequal-ity5 However other studies have found persistent growth in income inequality even after adjusting for alternative income sources such as transfers and noncash resources6
Efficiency and economic growth
In 1975 Yale economist Arthur Okun introduced the idea of the ldquoleaky bucketrdquo referring to the efficiency loss that occurs when money is transferred through taxation7 The problem of the leaky bucket creates an inverse relationship between equality and effi-ciency which Okun referred to as ldquothe Big Tradeoffrdquo In addition to the problem of efficiency loss another traditional argument is that inequality is a byproduct of a well functioning capitalist economy and that un-constrained opportunity encourages innovation and entrepreneurship and therefore economic growth8 However research over the past 20 years has chal-lenged this assumption suggesting that inequality and economic growth are inversely related and that inequality may actually ldquoharmrdquo growth9
Consumption and quality of life for the poor
Some argue that consumption is a better indica-tor of economic well being than income and that todayrsquos lower-income households are able to achieve greater consumption than ever before suggesting that the gap between rich and poor is not as severe as imagined10 For example the cost of consumer goods such as televisions and microwaves has fallen dramatically over time allowing more low-income households to purchase them and ldquokeep uprdquo with higher income households However critics of this consumption approach argue that while the cost of nonessential consumer goods has fallen over time the costs of essential items such as housing trans-portation and healthcare have increased over time making the relative hardship greater11
7 Community Investments Fall 2011 ndash Volume 23 Issue 2
jobs and social and economic isolation where residents are physically cut-off from the larger economy and com-munity3738 Community development efforts to address concentrated poverty at the neighborhood level can thus help LMI individuals access important skill building re-sources and earning opportunities
While these community development efforts are aimed at those with the least they have important impli-cations across all levels of the income distribution Federal Reserve Chairman Ben Bernanke summed it up this way ldquoThe challenge for policy is not to eliminate inequality per
se but rather to spread economic opportunity as widely as possible Policies that focus on education job training and skills and that facilitate job search and job mobility seem to me to be a promising means for moving toward that goal By increasing opportunity and capability we help individuals and families while strengthening the na-tionrsquos economy as wellrdquo39 From a community develop-ment perspective addressing widening income inequal-ity is about helping LMI communities reach their full potential thereby improving their capacity to participate in and contribute to the broader economy
Special Focus Income Inequality
Understanding Both Sides of the Inequality DebateWhile almost everyone can agree that poverty is undesirable the issues surrounding income inequality are much less clear-cut The debate involves complex issues but developing an understanding of both sides is an important first step in analyzing the available research and developing potential policy responses The following is a brief summary of some of the main points of contention in the debate around rising income inequality
Introduction
Income inequality in the United States has risen con-siderably over the past several decades However it is not just widening inequality that matters Recent research shows that as income inequality rises the
wealthy and poor increasingly sort into different neigh-borhoods concentrating in communities that differ con-siderably from one another This particular geographic expression of income inequality is of concern because there are negative outcomes for those at the bottom end of the income range that are substantial and intertwined Numerous studies show that communities of concentrated poverty contend with substandard schools and limited job opportunities as well as higher rates of disease crime and violence than their more affluent counterparts1 These types of neighborhood effects mean that both quality of life and life chances are markedly diminished for those
Ties that Bind Income Inequality and Income Segregation By Naomi Cytron
living and growing up in communities composed primar-ily of low-income households
This article summarizes some recent research on pat-terns of residential segregation by income and then ex-plores implications for neighborhoods regions and the community development field
Research on Income Segregation
The term ldquosegregationrdquo most commonly evokes issues of race However recent research examining US residen-tial patterns makes the argument that the basis of segre-gation has shifted over time from race to income2 In his research Douglas Massey of Princeton University notes that during the first two thirds of the century residential racial segregation at state and county levels fell while in-creasing at the census tract (which commonly serves as a proxy for neighborhood) level But starting in the 1970s
8 Community Investments Fall 2011 ndash Volume 23 Issue 2
this pattern began to change with black-white segrega-tion at the census tract level diminishing markedly during the last three decades of the 20th century These decades also saw significant increases in both Asian and Hispanic populations and while Hispanic isolation began to ap-proach that of African Americans both Asian and His-panic populations remained relatively evenly distributed across US metropolitan areas3 Massey attributes these patterns to the relative openness of housing markets fol-lowing social and legislative changes brought about by the Civil Rights era
During the same period though Masseyrsquos research shows that residential income segregation rose significant-ly with the wealthy and poor increasingly sorting into dif-ferent neighborhoods He finds that in 1970 the average poor family lived in a census tract that was 14 percent poor by 1990 this percentage doubled to 28 percent Affluence also grew more concentrated with the average wealthy family living in a neighborhood that was 31 percent afflu-ent in 1970 and 36 percent affluent in 19904
Examining census data from this same period Tara Watson of Williams College and the National Bureau of Economic Research finds that economic segregation rose most steeply during the 1980s During this decade ldquomet-ropolitan residents systematically changed the income rank groups with whom they shared a neighborhood Perhaps not coincidentally the decade was also one of sharply growing inequalityrdquo5 Indeed her research shows that a one standard deviation rise in income inequality is associated with a 04-09 standard deviation rise in income segregation6 In other words there is very strong relationship between rising income inequality and in-creasing spatial segregation by income
By the same token research shows that the economic boom of the 1990s buffered trends of growing income segregation to some extent there was a dramatic drop in concentrated poverty during this decade with the number of people living in neighborhoods with a poverty rate above 40 percent declining by 24 percent7 Addition-ally while the per capita income gap between central cities and suburbs had widened from 1970 to 1990 it held steady during the 1990s8 This shift though fell short of a dramatic comebackmdashclass segregation was still higher in 2000 than it was in 1970 with over 85 percent of the metropolitan population living in areas that were more segregated by income in 2000 than they had been 30 years earlier9
The first decade of this century has been marked by economic fluctuation and distress and preliminary analy-sis of the recent American Communities Survey data indi-cates that spatial disparities in income are once again on the rise One study found that the number of high poverty placesmdashwhether defined as places with poverty rates
exceeding 20 30 or 40 percentmdashincreased markedly from 2000-201010 Notably the number of places with poverty rates above 40 percent returned to the number observed at the end of the 1980s The research also shows that poornon-poor segregation rose in both metropolitan and non-metropolitan areas The authors call this trend a ldquonew economic balkanization of residence patternsrdquo11
Implications for Neighborhoods and Regions
As noted above increasing spatial separation of income groups is of concern because there are long term and multiplicative negative consequences for residents of low-income neighborhoods Areas of concentrated disadvantage often struggle with public and private dis-investment resulting in blight few opportunities for em-ployment high levels of crime and elevated exposure to health risks Where income inequality is expressed not just on a neighborhood-by-neighborhood basis but at a larger geographic scale the effects can reinforce dys-functional neighborhood-level outcomes For instance suburban areas that accommodate primarily high-income residents benefit from a larger tax base that can better support public services like safety infrastructure and schools At the same time the outmigration of wealthy residents from central cities to suburban areasmdashwhich triggers the exodus of jobs and retail outlets as wellmdashresults in a shrinking tax base and often a low level of political clout which undercuts poorer areas in the urban core in a number of ways Perhaps most critically in terms of economic opportunity over the long run public school systems in central cities end up not having the resources to attract and retain skilled teachers or adequately meet the needs of students who may enter school underpre-pared resulting in low academic achievement and high drop-out rates
These conditions have long-term consequences not only for individual economic opportunity but for regional productivity as well As noted by Todd Swanstrom and his coauthors in their analysis of economic segregation at the metropolitan level ldquospatial inequalities can set in motion a snowball effect that harms regional competitiveness by fueling the abandonments of older parts of the region accelerating sprawl and its many costs and making it more difficult for the region to form the broad coalitions necessary to address these problemsrdquo12 On the flip side income equality can be a key ingredient for economic growth In a paper published by the Federal Reserve Bank of Cleveland researchers analyzed economic growth in 118 regions in the 1994ndash2004 period and found that income equalitymdashidentified as one of eight factors relat-ing to regional growthmdashwas positively correlated with both employment and output13
9 Community Investments Fall 2011 ndash Volume 23 Issue 2
Special Focus Income Inequality
Implications for the Community Development Field
Given the strong relationship between income and place the community development response must be sen-sitive to both neighborhood and regional context as well as structural factors that drive income segregation These include a metropolitan arearsquos own demographic social political and industrial histories as well as federal and local policies that influence the accessibility of housing of different size and cost The intersections between race and class also cannot be ignored as the legacies of explic-itly racial housing policies as well as other discriminatory practices that limit mobility continue to affect income segregation Additionally job decentralization has con-tributed to the geography of inequality most employment is now located more than five miles from central cities making it difficult for central city residents to find and maintain employment Even in metropolitan areas where low-income households have moved to the suburbs the poor generally live in communities that have below average numbers of jobs The race-class intersection is evident here 70 percent of poor white suburbanites reside in jobs-rich areas while only 59 percent of poor blacks and 55 percent of poor Latinos do14
Community development interventions then must be inclusive enough to tackle the multifold and reinforcing links between poverty and place what Robert Sampson of Harvard University refers to as a durable tangle15 In large part responding to this tangle requires the coordination of a variety of interventions at various geographic scales and across diverse sectors These include public and private decisions that guide allocations of resources for educa-tion health and skill building Additionally local and regional policies that influence public transit provision which matters for access to work and other non-neighbor-hood based activities and amenities and density which impacts housing affordability (see ldquoWhat does zoning have to do with itrdquo below) affect outcomes for low-in-come households
10 Community Investments Fall 2011 ndash Volume 23 Issue 2
Encouragingly geographically targeted cross-sector strategies are receiving increased attention and funding from both the public and private sector The Obama Ad-ministration has explicitly endorsed ldquoplace-basedrdquo cross-sector policy seen through programs like the Promise and Choice Neighborhoods Initiatives which aim to bundle localized investments in arenas including housing edu-cation transportation and workforce development Addi-tionally a number of community development intermedi-aries and private foundations have shifted their community development strategies from ldquoscattershotrdquo approaches to more focused place-based initiatives For example Living Cities a collaborative of 22 foundations and financial in-stitutions recently launched their ldquoIntegration Initiativerdquo which focuses on bringing together decision-makers across sectors and jurisdictions in a region or metro area to align their work toward transforming local and regional systems including transportation health housing and jobs
Conclusion
In her keynote at last yearrsquos Healthy Communities Con-ferencemdashan event co-hosted in Washington DC by the Federal Reserve Board of Governors Federal Reserve Bank of San Francisco and the Robert Wood Johnson Founda-tion to explore how the health and community develop-ment sectors can collaborate to promote better health outcomes for low-income people and communitiesmdashMelody Barnes Director of the Domestic Policy Council offered the White Housersquos rationale for multidisciplinary approaches for addressing inequities ldquoPeople donrsquot wake up in the morning and say lsquoIrsquom going to have an education day today and tomorrow Irsquom going to have a transportation dayrsquo For families all of these pieces are integrated so we have to start thinking about our policies and our approach in that same integrated fashion So for us what wersquore trying to insure is that the days of thinking and working and talking in silos is in fact overrdquo16 Indeed we should all work toward breaking down the silos that hamper our ability to untie the pernicious knots that continue to limit opportunity for low-income communities
What does zoning have to do with it
Recent research aims to tease out some of the underlying causes of economic segregation Jonathan Rothwell and Douglas Massey hypothesize that certain types of zoning promote income segregation by limiting the ability of developers to produce affordable multifamily housing in certain locations They find that the setting of maximum allowable densities of residential construction has significant effects in determining the level of class segregation and change in segregation over time ldquosystematically channeling low-income households to different locations than their affluent counterpartsrdquo17 They go on to note that ldquoalthough markets allocate people to housing based on income and price political decisions allocate housing of different prices to different neighborhoods and thereby turn the market into a mechanism of both class and racial segregationrdquo18 Their research indicates that land-use policies which are not typically thought of as having socio-economic effects might indeed be mechanisms that generate and reinforce patterns of income segregation Altering zoning policy then might serve to mitigate in-equalities by enabling development of affordable housing in higher-income neighborhoods where the amenities might better support economic opportunity
Between December 2007 when the US housing and financial crises became the subject of daily news headlines and July 2011 the civilian un-employment rate nearly doubled to 91 percent
from 50 percent while the employment-to-population ratio dropped to 581 percent from 627 percentmdashthe lowest level seen in more than 25 years
Job losses of this magnitude cause enormous harm to workers families and communities1 For instance a classic study by economists Lou Jacobson Robert LaLonde and Daniel Sullivan found that workers involuntary displaced by plant downsizings in Pennsylvania during the severe recession of the early 1980s suffered annual earnings
The Polarization of Job Opportunities in the US Labor Market Implications for Employment and Earnings By David Autor
losses averaging 25 percent even six years following dis-placement2 Studying the same group of workers with the benefit of 15 more years of data labor economists Daniel Sullivan and co-author Till Von Wachter3 show that the nonmonetary consequences of job losses are also severe involuntarily job displacement approximately doubled the short-term mortality rates of those displaced and reduced their life expectancy on average by one to one and a half years These studies suggest that the costs of the Great Re-cession will be multifaceted and persistent
Moreover the key challenges facing the US labor marketmdashalmost all of which were evident prior to the Great Recessionmdashwill surely endure These challenges
11 Community Investments Fall 2011 ndash Volume 23 Issue 2
Special Focus Income Inequality
are two-fold The first is that for decades now the US labor market has experienced increased demand for skilled workers During times like the 1950s and 1960s a rising level of educational attainment kept up with this rising demand for skill But since the late 1970s and early 1980s the rise in US education levels has not kept up with the rising demand for skilled workers and the slow-down in educational attainment has been particularly severe for males The result has been a sharp rise in the inequality of wages
A second equally significant challenge is that the struc-ture of job opportunities in the United States has sharply polarized over the past two decades with expanding job opportunities in both high-skill high-wage occupations and low-skill low-wage occupations coupled with con-tracting opportunities in middle-wage middle-skill white-collar and blue-collar jobs Concretely employment and earnings are rising in both high-education professional technical and managerial occupations and since the late 1980s in low-education food service personal care and protective service occupations Conversely job op-portunities are declining in both middle-skill white-col-lar clerical administrative and sales occupations and in middle-skill blue-collar production craft and operative occupations The decline in middle-skill jobs has been detrimental to the earnings and labor force participation rates of workers without a four-year college education and differentially so for males who are increasingly con-centrated in low-paying service occupations
This article is a summary of an in-depth analysis of the state of the US labor market over the past three decades commissioned by the Hamilton Project at the Brookings Institution and the Center for American Progress4 This analysis revealed key forces shaping the trajectory of the polarization of the US job market including the slowing rate of four-year college degree attainment among young adults particularly males shifts in the gender and racial composition of the workforce changes in technology in-ternational trade and the international offshoring of jobs which affect job opportunities and skill demands and changes in US labor market institutions affecting wage setting including labor unions and minimum wage leg-islation The causes and consequences of these trends are discussed below and have important implications for the US labor market and income inequality more broadly as the nation works towards economic recovery
Employment growth is ldquopolarizingrdquo into relatively high-skill high-wage jobs and low-skill low-wage jobs
Long-term shifts in labor demand have led to a pro-nounced rdquopolarizationrdquo of job opportunities across occu-pations with employment growth concentrated in rela-
tively high-skill high-wage and in low-skill low-wage jobsmdashat the expense of ldquomiddle-skillrdquo jobs This polariza-tion is depicted in Figure 1 which plots the change in the share of US employment in each of the last three decades for 326 detailed occupations encompassing all of US employment4
Figure 1 Smoothed Changes in Employment by Occupational Skill Percentile 1979ndash2007
Figure 1 Smoothed Changes in Employment by Occupational Skill Percentile 1979ndash2007
ⴀ
ⴀ㔀
㔀
㔀
㔀
㐀 㘀 㠀
䌀栀愀渀
最攀 椀渀
䔀洀
瀀氀漀礀
洀攀渀
琀 匀栀
愀爀攀
匀欀椀氀氀 倀攀爀挀攀渀琀椀氀攀 爀愀渀欀攀搀 戀礀 漀挀挀甀瀀愀琀椀漀渀愀氀 洀攀愀渀 眀愀最攀⤀
䘀椀最甀爀攀 ⴀ 匀洀漀漀琀栀攀搀 䌀栀愀渀最攀猀 椀渀 䔀洀瀀氀漀礀洀攀渀琀 戀礀 伀挀挀甀瀀愀琀椀漀渀愀氀 匀欀椀氀氀 倀攀爀挀攀渀琀椀氀攀Ⰰ 㤀㜀㤀ⴀ 㜀
㤀㜀㤀ⴀ㤀㠀㤀
㤀㠀㤀ⴀ㤀㤀㤀
㤀㤀㤀ⴀ 㜀
Source Census IPUMS 5 percent samples for years 1980 1990 and 2000 and US Census American Community Survey 2008
These occupations are ranked on the x-axis by skill level from lowest to highest where an occupationrsquos skill level (or more accurately its skill rank) is approximated by the average wage of workers in the occupation in 19805 The y-axis of the figure corresponds to the change in em-ployment at each occupational percentile as a share of total US employment during the decade Since the sum of shares must equal one in each decade the change in these shares across decades must total zero Consequent-ly the figure measures the growth in each occupationrsquos employment relative to the whole
This figure reveals a ldquotwistingrdquo of the distribution of employment across occupations over three decades which becomes more pronounced in each period During the 1980s (1979 to 1989) employment growth by oc-cupation was almost uniformly rising in occupational skill occupations below the median skill level declined as a share of employment while occupations above the median increased In the subsequent decade this uni-formly rising pattern gave way to a distinct pattern of po-larization Relative employment growth was most rapid at high percentiles but it was also modestly positive at low percentiles (10th percentile and down) and modestly negative at intermediate percentiles
12 Community Investments Fall 2011 ndash Volume 23 Issue 2
ⴀ
ⴀ㔀
㔀
㔀
㔀
㐀 㘀 㠀
䌀栀愀渀
最攀 椀渀
䔀洀
瀀氀漀礀
洀攀渀
琀 匀栀
愀爀攀
匀欀椀氀氀 倀攀爀挀攀渀琀椀氀攀 爀愀渀欀攀搀 戀礀 漀挀挀甀瀀愀琀椀漀渀愀氀 洀攀愀渀 眀愀最攀⤀
䘀椀最甀爀攀 ⴀ 匀洀漀漀琀栀攀搀 䌀栀愀渀最攀猀 椀渀 䔀洀瀀氀漀礀洀攀渀琀 戀礀 伀挀挀甀瀀愀琀椀漀渀愀氀 匀欀椀氀氀 倀攀爀挀攀渀琀椀氀攀Ⰰ 㤀㜀㤀ⴀ 㜀
㤀㜀㤀ⴀ㤀㠀㤀
㤀㠀㤀ⴀ㤀㤀㤀
㤀㤀㤀ⴀ 㜀
Fast forward to the period 1999 to 2007 In this in-terval the growth of low-skill jobs comes to dominate the figure Employment growth in this period was heavily concentrated among the lowest three deciles of occupa-tions In deciles four through nine growth in employment shares was negative In the highest decile of occupations employment shares were flat Thus the disproportionate growth of low-education low-wage occupations becomes evident in the 1990s and accelerates thereafter
Notably this pattern of employment polarization has a counterpart in wage growth This may be seen in Figure 2 which plots changes in real hourly wages relative to the median by wage percentile for all US workers over two time periods 1974 to 1988 and 1988 to 20066 In the 1974 through 1988 period wage growth was consistently increasing in wage percentile wages at percentiles above the median rose relative to the median while wages below the median fell From 1988 forward however the pattern was U-shaped Wages both above and below the median rose relative to the median
Figure 2 Percent Changes in Male and Female Hourly Wages Relative to the Median
ⴀ㔀
ⴀ
ⴀ㔀
㔀
㔀
㔀 㔀 㔀 㘀㔀 㠀 㤀㔀
倀攀爀挀
攀渀琀 䌀
栀愀渀最
攀 刀攀
氀愀琀椀瘀
攀 琀漀
琀栀攀
䴀攀搀
椀愀渀
䠀漀甀爀氀礀 䔀愀爀渀椀渀最猀 倀攀爀挀攀渀琀椀氀攀
䘀椀最甀爀攀 ⴀ 倀攀爀挀攀渀琀 䌀栀愀渀最攀猀 椀渀 䴀愀氀攀 愀渀搀 䘀攀洀愀氀攀 䠀漀甀爀氀礀 圀愀最攀猀 刀攀愀氀琀椀瘀攀 琀漀 琀栀攀 䴀攀搀椀愀渀
㤀㜀㐀ⴀ㤀㠀㠀
㤀㠀㠀ⴀ 㘀
Source MayORG CPS data for earnings years 1973-2009
In short wage gains in the middle of the distribution were smaller than wage gains at either the upper or lower reaches of the wage distribution This simultaneous po-larization of US employment and wage growth suggests an important theme explored in detail belowmdashlabor demand appears to be rising for both high-skill high-wage jobs and for traditionally low-skill low-wage jobs
The Great Recession has quantitatively but not quali-tatively changed the direction of the US labor market
The four major US labor market developments ref-erenced above and documented belowmdashthe polariza-tion of job growth across high- and low-skill occupations
rising wages for highly educated workers falling wages for less-educated workers and lagging labor market gains for malesmdashall predate the Great Recession But the available data suggest that the Great Recession has reinforced these trends rather than reversing or redirecting them In par-ticular job and earnings losses during the recession have been greater for low-education males than low-education females and these losses have been most concentrated in middle-skill jobs Indeed there was essentially no net change in total employment in both high-skill profession-al managerial and technical occupations and in low-skill service occupations between 2007 and 2009 Conversely employment fell by eight percent in white-collar sales office and administrative jobs and by 16 percent in blue-collar production craft repair and operative jobs
Key contributors to job polarization are the automation of routine work and the international integration of labor markets
Measuring employment polarization is easier than determining its root causes but researchers are making progress in understanding the operative forces behind the data A leading explanation focuses on the consequences of ongoing automation and offshoring of middle-skilled ldquoroutinerdquo tasks that were formerly performed primarily by workers with moderate education (a high school diploma but less than a four-year college degree) Routine tasks as described by economists David Autor Frank Levy and Richard Murnane are job activities that are sufficiently well defined that they can be carried out successfully by either a computer executing a program or alternatively by a comparatively less-educated worker in a developing country who carries out the task with minimal discretion8
Routine tasks are characteristic of many middle-skilled cognitive and production activities such as bookkeeping clerical work and repetitive production tasks The core job tasks of these occupations in many cases follow precise well-understood procedures Consequently as computer and communication technologies improve in quality and decline in price these routine tasks are increasingly codi-fied in computer software and performed by machines or alternatively sent electronically to foreign worksites to be performed by comparatively low-wage workers
13 Community Investments Fall 2011 ndash Volume 23 Issue 2
ⴀ㔀
ⴀ
ⴀ㔀
㔀
㔀
㔀 㔀 㔀 㘀㔀 㠀 㤀㔀
倀攀爀挀
攀渀琀 䌀
栀愀渀最
攀 刀攀
氀愀琀椀瘀
攀 琀漀
琀栀攀
䴀攀搀
椀愀渀
䠀漀甀爀氀礀 䔀愀爀渀椀渀最猀 倀攀爀挀攀渀琀椀氀攀
䘀椀最甀爀攀 ⴀ 倀攀爀挀攀渀琀 䌀栀愀渀最攀猀 椀渀 䴀愀氀攀 愀渀搀 䘀攀洀愀氀攀 䠀漀甀爀氀礀 圀愀最攀猀 刀攀愀氀琀椀瘀攀 琀漀 琀栀攀 䴀攀搀椀愀渀
㤀㜀㐀ⴀ㤀㠀㠀
㤀㠀㠀ⴀ 㘀
This simultaneous polarization of US employment and wage growth suggests an important thememdashlabor demand appears to be rising for both high-skill high-wage jobs and for traditionally low-skill low-wage jobs
Special Focus Income Inequality
This process raises relative demand for nonroutine tasks in which workers hold a comparative advantage As detailed below these nonroutine tasks can be roughly subdivided into two major categories abstract tasks and manual tasks These tasks lie at opposite ends of the occu-pational-skill distribution
Abstract tasks require problem solving intuition and persuasion Workers who are most adept in these tasks typically have high levels of education and analytical capability Manual tasks by contrast require situational adaptability visual and language recognition and in-per-son interactions Examples of workers engaged in these tasks include janitors and cleaners home health aides construction laborers security personnel and motor vehicle operators Manual tasks demand workers who are physically adept and in some cases able to communicate fluently in spoken language Yet they appear to require little in the way of formal education at least relative to a setting where most workers have completed high school
In brief the displacement of jobsmdashand more broadly occupationsmdashthat are intensive in routine tasks contrib-utes to the polarization of employment into relatively high-skill high-wage and low-skill low-wage jobs with a concomitant decline in middle-skill jobs
Technology trade and offshoring are not by any means the only potential explanation for employment polariza-tionmdashnor is it necessarily the case that any one explana-tion accounts for the entirety of the phenomenon Another frequently discussed explanation for the changing struc-ture of employment and earnings in the US focuses on shifts in labor market institutions in particular declining labor union penetration and a falling real minimum wage There is little doubt that labor unions and the minimum wage contribute to changing employment and wage pat-terns but it appears unlikely their role is paramount
In the case of labor unions their impact is largely con-fined to manufacturing and public sector employment neither of which comprises a sufficiently large share of the aggregate economy to explain the overall polarization phenomenon Moreover polarization of employment into high-skill high-wage and low-skill low-wage jobs occurs across all sectors of the US economy and is not confined
to union-intensive manufacturing industries This makes it unlikely that de-unionization or the decline of manufac-turing employment is primarily responsible for employ-ment polarization
Nevertheless the loss of middle-skill blue-collar jobs in manufacturingmdashmany at unionized firms paying rela-tively high wagesmdashhas likely been particularly harmful to the employment and earnings of less-educated males The job opportunities available to males displaced from manu-facturing jobs particularly those displaced at midcareer are likely to be primarily found in lower-paying service occupations While these job losses may be primarily at-tributable to automation of routine production work and growing international competition in manufactured goods rather than to de-unionization per se the magnitude of the income losses for males is surely magnified by the fact that the job losses are in union-intensive industries
An often-discussed explanation for changes in the structure of US wages and employment is the federal minimum wage The minimum wage can affect wage in-equality by boosting (or failing to boost) wages in low-paying jobs But changes in the federal minimum wage over the last several decades appear an unlikely candi-date for explaining the polarization of employmentmdashthat is the growth of both low-and high-skill jobsmdashparticu-larly because the timing of this explanation does not fit the main polarization facts The federal minimum wage declined sharply in real terms (after adjusting for infla-tion) during the 1980s which might in theory have led to a rise in low-skill low-wage employment Yet as shown in Figure 1 the opposite occurred From the late 1980s forward the real federal minimum wage stabilized and then subsequently rose We might therefore have expect-ed low-skill employment to stagnate or decline Instead it grew rapidly9
The earnings of college-educated workers relative to high school-educated workers have risen steadily for almost three decades
After three decades of sustained increases the return to skills as typically measured by the earnings ratio of college graduates relative to high school graduates is at a historic high In 1963 the hourly wage of the typical college graduate was approximately 15 times the hourly wage of the typical high school graduate By 2009 this ratio stood at 195 The entirety of this 45 percentage point rise occurred after 1980 In fact the college-to-high- school earnings ratio declined by 10 percentage points in the 1970s
Moreover this simple comparison of the wage gap between college and high school graduates probably un-derstates significantly the real growth in compensation
14 Community Investments Fall 2011 ndash Volume 23 Issue 2
After three decades of sustained increases the return to skills as typically measured by the earnings ratio of college graduates relative to high school graduates is at a historic high
for college graduates relative to high school graduates in recent decades College graduates work more hours per week and more weeks per year than high school gradu-ates spend less time unemployed and receive a dispro-portionate share of nonwage fringe benefits including sick and vacation pay employer-paid health insurance pension contributions and safe and pleasant working conditions And these gaps in nonwage benefits between high- and low-education workers have each grown over the past several decades10
One important proximate cause for the rising relative earnings of college graduates is the slowdown in the rate of entry of new college graduates into the US labor market starting in the early 1980s Although this slowdown is by no means the only cause of changes in US employment and earnings patternsmdashand moreover a cause whose genesis is not entirely understoodmdashit is nevertheless a critical and often overlooked factor
Rising relative earnings of college graduates are due both to rising real earnings for college workers and falling real earnings for noncollege workersmdashparticularly noncollege males
The high and rising wage premium that accompanies a college education conveys the positive economic news that educational investments offer a high wage return But this trend also masks a discouraging truth the rising rela-tive earnings of college graduates are due not just to rising real earnings for college workers but also to falling real earnings for noncollege workers Real hourly earnings of college-educated workers rose anywhere from 10 to 37 percent between 1979 and 2007 with the greatest gains among workers with a postbaccalaureate degree
Simultaneously real earnings of workers with high school or lower educational levels either stagnated or de-clined significantly These declines were especially steep among males 12 percent for high school graduates and 16 percent for high school dropouts The picture is gen-erally brighter for females but there was essentially no real earnings growth among females without at least some college education over this three-decade interval
Though it is sometimes asserted that the ldquorealrdquo earnings declines of less-educated workers are overstated because they do not account for the rising value of employer-pro-vided in-kind benefits such as healthcare careful analysis of representative wage and fringe benefits data conduct-ed by US Bureau of Labor Statistics economist Brooks Pierce refutes this notion Net of fringe benefits real compensation for low-skilled workers fell in the 1980s Further accounting for fringe benefits total compensa-tion for high-skilled workers rose by more than did wages both in absolute terms and relative to compensation for low-skilled workers11
15 Community Investments Fall 2011 ndash Volume 23 Issue 2
Special Focus Income Inequality
Gains in educational attainment have not generally kept pace with rising educational returns particularly for males
Given the steep rise in wages for college graduates rel-ative to noncollege graduates over the past three decades one might have anticipated a substantial rise in college attainment among young adults Yet the actual increase in four-year college attainment was fairly muted particularly for males Between 1970 and 2008 four-year college at-tainment among white male young adults ages 25 through 34 rose only modestly from 20 percent in 1970 to 26 percent in 200812 Remarkably among white females of the same age range college attainment nearly tripled to 34 percentage points from 12 percentage points Thus in three decades the white male-female gap in college at-tainment went from positive eight to negative eight per-centage points
Among young African-American adults this picture is also mixed The proportional gains in four-year college completion between 1970 and 2008 were substantially greater for blacks than for whites Indeed college com-pletions rose more than two-fold among black males and more than three-fold among black females Despite these gains the levels of college completion for blacks remain substantially below that of whites The black-white gap in college completion closed by only two percentage points among males in this period and expanded by six percent-age points among females
The only ethnic category for which gains in education-al attainment have been truly spectacular was ldquoother non-whitesrdquo a category that includes many Asian Americans13 In 2008 more than half of male and female young adults in this category had completed a four-year college degree This is an increase since 1970 of 22 percentage points among males and 32 percentage points among females
Conclusion
Although the US labor market will almost surely rebound from the Great Recession this article presents a somewhat disheartening picture of its longer-term evolu-tion Rising demand for highly educated workers combined with lagging supply is contributing to higher levels of earn-ings inequality Demand for middle-skill jobs is declining and consequently workers that do not obtain postsecond-ary education face a contracting set of job opportunities
Perhaps most alarmingly males as a group have adapted comparatively poorly to the changing labor market Male educational attainment has slowed and male labor force
16 Community Investments Fall 2011 ndash Volume 23 Issue 2
participation has declined For males without a four-year college degree wages have stagnated or fallen over three decades And as these males have moved out of middle-skill blue-collar jobs they have generally moved down-ward in the occupational skill and earnings distribution
The obvious question as Scrooge asks the Ghost of Christmas Yet to Come is ldquo[A]nswer me one question Are these the shadows of the things that Will be or are they shadows of things that May be onlyrdquo Is the labor market history of the last three decades inevitably our destinymdashor is it just that it could end up being our destiny if we do not implement forward-looking policy responses
While this article is intended as a spur to policy dis-cussion rather than a source of policy recommendations I will note a few policy responses that seem especially worthy of discussion
First encouraging more young adults to obtain higher education would have multiple benefits Many jobs are being created that demand college-educated workers so this will boost incomes Additionally an increased supply of college graduates should eventually help to drive down the college wage premium and limit the rise in inequality
Second the United States should foster improvements in K-12 education so that more people will be prepared to go on to higher education Indeed one potential expla-nation for the lagging college attainment of males is that K-12 education is not adequately preparing enough men to see that as a realistic option
Third educators and policymakers should consider training programs to boost skill levels and earnings oppor-tunities in historically low-skilled service jobsmdashand more broadly to offer programs for supporting continual learn-ing retraining and mobility for all workers
Finally another potential policy response is to con-sider RampD and infrastructure investments that will have broadly distributed benefits across the economy Exam-ples might include expanding job opportunities in energy the environment and health care The return of the classic manufacturing job as a path to a middle-class life is un-likely But it may be that various service jobs grow into attractive job opportunities with the appropriate comple-mentary investments in training technology and physical capital Perhaps these could be the shadows of what is yet to come
David Autor is a professor of economics at the Mas-sachusetts Institute of Technology and faculty research associate of the National Bureau of Economic Research
How did America go from the Great Depres-sion of the 1930s to thirty years of what might be termed the Great Prosperity between 1947 and 1977 And from there to thirty years of
stagnant incomes and widening inequality culminating in a Great Recession and one of the most anemic recoveries on record It was no accident
The Great Prosperity
During three decades from 1947 to 1977 America implemented the basic bargain ndash providing its workers enough money to buy what they produced Produc-tivity grew in tandem with wages Labor productivity ndash average output per hour worked ndash doubled So did median incomes Expressed in 2007 dollars the typical familyrsquos income rose from about $25000 to $55000 The bargain was cinched
Community Perspective Widening Inequality Hurts us AllBy Robert B Reich
But herersquos the really interesting thing We became more equal The wages of workers in the bottom fifth grew 116 percent ndash faster than the pay of those in the top fifth (which rose 99 percent) and in the top five percent (86 percent) By the late 1940s the nation was ldquomore than halfway to perfect equalityrdquo as the National Bureau of Economic Re-search wryly observed But as the economy grew almost everyone came out ahead including those at the top
The Great Prosperity also marked the culmination of a reorganization of work that had begun during the Depres-sion Perhaps most significantly government increased the bargaining leverage of ordinary workers They were guar-anteed the right to join labor unions with which employ-ers had to bargain in good faith By the mid 1950s more than a third of all workers were unionized UAW presi-dent Walter Reuther among others explicitly invoked the basic bargain ldquoUnless we get a more realistic distribu-
17 Community Investments Fall 2011 ndash Volume 23 Issue 2
Special Focus Income Inequality
tion of Americarsquos wealthrdquo he threatened ldquowe wonrsquot get enough to keep this machinery goingrdquo Employers relent-ed and the higher wages kept the machinery going better than ever by giving average workers more money to buy what they produced (Non-unionized companies fearing their workers would otherwise want a union offered similar deals) And because health and pension benefits were not taxed big employers added ever more generous provisions
Americans also enjoyed economic security against the risks of economic life ndash not only unemployment benefits but also through Social Security insurance against dis-ability loss of a major breadwinner workplace injury and inability to save enough for retirement In 1965 came health insurance for the elderly and the poor (Medicare and Medicaid) Economic security proved the handmaid-en of prosperity In requiring Americans to share the costs of adversity it enabled them to share the benefits of peace of mind And by offering peace of mind it freed them to consume the fruits of their labors
Government also widened access to higher education The GI Bill paid college costs for those who returned from war The expansion of public universities ndash whose tuitions averaged about four percent of median family incomes during the Great Prosperity in contrast to the 20 percent then demanded by private universities ndash made higher education affordable to the American middle class Con-sequently college enrollments surged By 1970 seventy percent of the nationrsquos four-year post-secondary students were in public universities and colleges The federal gov-ernment especially the Defense Department also under-wrote a growing portion of university research especially in the sciences
Notwithstanding all this the nation also found the time and money in these years to rebuild Western Europe and Japan ndash spending billions of dollars to restore foreign factories roads railways and schools The effort proved an astounding success The years 1945 to 1970 witnessed the most dramatic and widely shared economic growth in the history of the world which contributed to Americarsquos Great Prosperity In helping restore the worldrsquos leading economies and thus keep communism at bay the new global system of trade and assistance created vast new op-portunities for American corporations ndash far richer larger and more technologically advanced than any other ndash to expand and prosper
Government paid for all of this with tax revenues from an expanding middle class whose incomes were rising Revenues were also boosted by those at the top of the income ladder whose marginal taxes were far higher than todayrsquos The top marginal income tax rate during World War II was over 68 percent In the 1950s under Dwight Eisenhower whom few would call a radical it rose to 91 percent In the 1960s the highest marginal rate was around 70 percent Even after exploiting all possible de-ductions and credits the typical high-income taxpayer paid a marginal federal tax of over 50 percent But con-trary to what conservative commentators had predicted the high tax rates did not hobble economic growth To the contrary they enabled the nation to expand middle-class prosperity and fuel growth
America of that era still harbored vast inequalities of course The very poor remained almost invisible Blacks were still relegated to second-class citizenship Few women dared aspire to professions other than teaching or nursing But such barriers would eventually weaken or disappear And although the era also engendered a blandness unifor-mity and materialism that many found abhorrent the Great Prosperity offered more Americans more opportunities to make whatever life they wanted more than ever before It significantly expanded the portion of total income going to the middle class And it proved that widely-shared income gains were not incompatible with widespread economic growth they were in fact essential to it
The Great Regression 1980 to 2008
During the Great Prosperity of 1947-1977 the vast middle class received an increasing share of the benefits of economic growth But after that point the two lines began to diverge output per hour ndash a measure of produc-tivity ndash continued to rise But real hourly compensation was left in the dust
Contrary to popular belief trade and technology have not reduced the overall number of American jobs Their more profound effect has been on pay Rather than be out of work most Americans have quietly settled for lower real wages or wages that have risen more slowly than the overall growth of the economy per person Although unemployment following the Great Recession remains unusually high jobs are slowly returning ndash but in order to get them many workers have to accept lower pay than before Trade and technology have driven a wedge between the earnings of people at the top and everyone else The pay of well-connected graduates of prestigious colleges and MBA programs ndash the so-called ldquotalentrdquo who reached the pinnacles of power in executive suites and on Wall Street ndash has soared But the pay and benefits of most other workers has either flattened or dropped And the ensuing division has also made most middle-class Ameri-can families less economically secure
widely-shared income gains were not incompatible with widespread economic growth they were in fact essential to it
18 Community Investments Fall 2011 ndash Volume 23 Issue 2
The real puzzle is why so little was done in response to these forces that were conferring an increasing share of economic growth on a small group at the top and leaving most other Americans behind With the gains from that growth the nation could for example have expanded our educational system to encompass early-childhood education and better equipped our public schools It could have supported affordable public universities created more job retraining and better and more exten-sive public transportation
In these and many other ways government could have reinforced the basic bargain But it did the opposite Starting in the late 1970s and with increasing fervor over the next three decades it deregulated and privatized It slashed public goods and investments ndash whacking school budgets increasing the cost of public higher education reducing job training cutting public transportation and allowing bridges ports and highways to corrode It shred-ded safety nets ndash reducing aid to jobless families with children and cutting unemployment insurance so much that by 2007 only 40 percent of the unemployed were covered It halved the top income tax rate from the range of 70 to 90 percent that prevailed during the Great Pros-perity to 28 to 35 percent allowed many of the nationrsquos rich to treat their income as capital gains subject to no more than 15 percent tax and shrunk inheritance taxes that affected only the top-most 15 percent of earners Yet at the same time America boosted sales and payroll taxes both of which took a bigger chunk out of the pay of the middle class and the poor than of the well off
We allowed companies to break the basic bargain with impunity ndash slashing jobs and wages cutting benefits and shifting risks to employees (from you-can-count-on-it pen-sions to do-it-yourself 401(k)s from good health coverage to soaring premiums and deductibles) Companies were allowed to bust unions and threaten employees who tried to organize (by 2010 fewer than eight percent of private-sector workers were unionized) And nothing impeded CEO salaries from skyrocketing to 300 times that of the average worker (from 30 times during the Great Prosper-ity) while the pay of financial executives and traders rose into the stratosphere We stood by as big American com-panies became global companies with no more loyalty or connection to the United States than a GPS satellite
Most telling of all Washington deregulated Wall Street while insuring it against major losses In so doing it allowed finance ndash which until then had been the servant of American industry ndash to become its master demanding short-term profits over long-term growth and raking in an ever-larger portion of the nationrsquos profits Between 1997 and 2007 finance became the fastest-growing part of the US economy Two-thirds of the growth in the Gross Na-tional Product was attributable to the gains of financial
executives traders and specialists By 2007 financial companies accounted for over forty percent of American corporate profits and almost as great a percentage of pay up from ten percent during the Great Prosperity
The Cause of Our Unraveling
Some argue America did so little because Americans lost confidence in government They have cause and effect backwards The tax revolts that thundered across America starting in the late 1970s were not so much ideological revolts against government ndash Americans still wanted all the government services they had before and then some ndash as backlash against paying more taxes on incomes that had stagnated Inevitably government services deterio-rated and government deficits exploded confirming the publicrsquos growing cynicism about governmentrsquos capacity to do anything right Furthermore the inflation of the 1970s wasnrsquot due to government spending It was the result of an eightfold hike in world oil prices engineered by the oil cartel and a drop in the value of the dollar When inflation began to accelerate federal spending was only one per-centage point higher as a proportion of GDP than it had been in the first half of 1960s
The real reason for the reversal of the pendulum was political As income and wealth became more concen-trated in fewer hands politics reverted to what former Federal Reserve Chair Marriner Eccles described in the 1920s as when people ldquowith great economic power had an undue influence in making the rules of the economic gamerdquo With hefty campaign contributions and platoons of lobbyists and PR flacks the rich pushed legal changes that enabled them to accumulate even more income and wealth ndash including tacit permission to bust unions slash corporate payrolls and reduce benefits lower taxes for themselves and deregulation of Wall Street Since so much of their wealth depends on the performance of the stock market they particularly wanted to free up the Street to put greater pressure on companies to perform The plan worked The Dow Jones Industrial Average took off ndash rising tenfold between 1980 and 2000
Americans accepted the backward swing of the pen-dulum because they mitigated its effects Starting in the late 1970s the American middle class honed three coping mechanisms allowing it to behave as though it was still
19 Community Investments Fall 2011 ndash Volume 23 Issue 2
Between 1997 and 2007 finance became the fastest-growing part of the US economy
Special Focus Income Inequality
taking home the same share of total income as it had during the Great Prosperity and to spend as if nothing substantially had changed Not until these coping mecha-nisms became exhausted in the Great Recession would the underlying reality be exposed
Coping mechanism 1 Women move into paid work Starting in the late 1970s and escalating in the 1980s and 1990s women went into paid work in greater and greater numbers For the relatively small sliver of women with four-year college degrees this was the natural conse-quence of wider educational opportunities and new laws against gender discrimination that opened professions to well-educated women But the vast majority of women who migrated into paid work did so in order to prop up family incomes as households were hit by the stagnant or declining wages of male workers
This transition of women into paid work has been one of the most important social and economic changes to occur over the last four decades It has reshaped American families and challenged traditional patterns of child-rear-ing and child care Its magnitude has been extraordinary In 1966 twenty percent of mothers with young children worked outside the home By the late 1990s the propor-tion had risen to sixty percent For married women with children under the age of six the transformation has been even more dramatic ndash from twelve percent in the 1960s to fifty-five percent by the late 1990s
Families seem to have reached the limit however ndash a point of diminishing returns where the costs of hiring others to see to the running of a household or to take care of the children or both exceeds the apparent benefits of the additional income
Coping mechanism 2 Everyone works longer hours By the mid 2000s it was not uncommon for men to work more than sixty hours a week and women to work more than fifty Professionals put in more ldquobillablerdquo hours Hourly workers relied on overtime A growing number of people took on two or three jobs each demanding twenty or more hours All told by the 2000s the typical Ameri-can worker worked more than 2200 hours a year ndash 350 hours more than the average European worked more hours even than the typically industrious Japanese put in It was many more hours than the typical American mid-dle-class family had worked in 1979 ndash five hundred hours longer a full twelve weeks more Americans seemed to have reached a limit Even if they can find the work they canrsquot find any more time
Coping mechanism 3 Draw down savings and borrow to the hilt After exhausting the first two coping mechanisms the only way Americans could keep con-suming as before was to save less and go deeper into debt During the Great Prosperity the American middle class
saved about nine percent of their after-tax incomes each year By the late 1980s and early 1990s that portion had been whittled down to about seven percent The savings rate then dropped to six percent in 1994 and on down to three percent in 1999 By 2008 Americans saved nothing Meanwhile household debt exploded During the Great Prosperity debt had averaged around 50 to 55 percent of after-tax income That included what people owed on their mortgages But starting in 1980 debt took off In 2001 Americans owed as much as their entire after-tax income that year By 2007 the typical American owed 138 percent of their after-tax income
Americans borrowed from everywhere Credit card solicitations flooded mail boxes many American wallets bulged with dozens of such cards all amassing larger and larger debt loads Auto loans were easy to come by Stu-dents and their families went deep into debt to pay the costs of college But far and away the largest borrowing was to buy homes Mortgage debt exploded As housing values continued to rise homes doubled as ATMs Con-sumers refinanced their homes with even larger mortgages and used their homes as collateral for additional loans As long as housing prices continued to rise it seemed a painless way to get additional money (in 1980 the average home sold for $62000 by 2006 it went for $245000) Between 2002 and 2007 American households extracted $23 trillion from their houses putting themselves ever more deeply into the hole
Eventually of course the debt bubble burst With it the last coping mechanism ended Each of these mechanisms reached its inevitable limit And when the debt bubble burst most Americans woke up to a startling reality They could no longer afford to live as they had been living nor as they thought they should be living given the growth in the economy nor as they expected to be living given how their pay used to grow when the economy grew nor as they assumed they could be living given the lavish life-styles of people at the top of the income ladder
The Future
The economic challenge ahead is to lift the means of middle-class Americans and reconstitute the basic bargain linking wages to overall gains ndash providing the vast Ameri-can middle class with a share of economic gains sufficient to allow them to purchase more of what the economy can produce One step toward reestablishing shared prosper-ity would be expanding the Earned Income Tax Credit The EITC has not only helped reduce poverty but has in-creased the incomes of families most likely to spend that additional money and thereby create more jobs In 2011 the EITC was the nationrsquos largest anti-poverty program Over 24 million households received wage supplements Given whatrsquos happened to middle-class incomes the EITC
20 Community Investments Fall 2011 ndash Volume 23 Issue 2
should be expanded and extended upward Under my plan full-time workers earning $20000 or below (this and all subsequent figures are in 2010 dollars) would get a wage supplement of $15000 This supplement would decline incrementally to $10000 for full-time workers earning $30000 to $5000 for full-time workers earning $40000 and then to zero for full-time workers earning $50000 Along with expanding the EITC Irsquod recommend that marginal tax rates be lowered for the middle class The income tax rates of full-time workers earning between $50000 and $90000 should be cut to ten percent of earnings and of workers earning between $90000 and $140000 to 20 percent of their earnings
The yearly cost to the federal government of expanding the EITC and reducing middle-class taxes would be ap-proximately $634 billion a year (in 2010 dollars) This lost revenue could be replaced by a tax on fossil fuels (coal oil and gas) based on how many tons of carbon dioxide such fuels contain The tax would be collected at the mine or port of entry for each fossil fuel and would gradually rise over time in order to push energy companies and users to spew less carbon into the atmosphere If initially set at $35 per metric ton of carbon-dioxide or its equiva-lent such a tax would raise over $210 billion in its first year alone By the time it reached $115 per ton it would yield about $600 billion per year The public wouldnrsquot di-rectly pay this tax but would indirectly pay it to the extent the prices of goods rise in proportion to how much carbon is used in their production For example a tax of $115 per ton would add about $1 to the price of a gallon of gasoline and 6 cents per kilowatt-hour to the price of electricity But if the revenues from the carbon tax went into an expanded EITC and lower taxes on the middle class most Americans would still come out far ahead A carbon tax has two ad-ditional advantages It would push energy companies and businesses to invest in new ways to reduce greenhouse gases and in lower-carbon fuels and products This would prevent overall emissions from increasing beyond current levels The tax will also boost aggregate demand
The Great Recession has accelerated the structural change in the economy that began in the late 1970s Large numbers of Americans will not be rehired unless they are willing to settle for lower wages and benefits Eventually jobs will return but if the trend continues more people will be working for pay they consider inadequate more
working families will be at or near poverty and inequality will have widened
Nor will households be able to borrow as before Lending standards have tightened and bank regulators and new regulations will require prudence Meanwhile a large number of Americans are paying off paying down or walking away from trillions of dollars of outstanding loans ndash in a vast ldquodeleveragingrdquo of household finances that is likely to continue for years At the same time tens of millions of boomers are approaching retirement with nest eggs that have shrunk to the size of peanuts and must save in earnest
All this means less consumption as a proportion of the overall economy than before the Great Recession Al-though consumers have to replace cars appliances and other things that run out or wear out or finally break down and businesses have to replace inventories that become so depleted they have nothing left to sell or ship a lasting recovery cannot be based on replacements
Where will demand come from without a buoyant American middle class Absent their spending private investors have little incentive to buy new equipment or software new commercial buildings or factories entre-preneurs have little incentive to embark on new research and develop new products and services Government can fill the gap for a time but government cannot continue in-definitely to stimulate the economy with deficit spending or by printing money Nor can we rely on exports to fill the gap Exports will remain a relatively small proportion of our economy Other economies ndash even the Chinese ndash are relying on net exports to maintain their employment It is impossible for every large economy including the United States to become a net exporter
Hence our underlying dilemma As we should have learned during the Great Prosperity ndash the thirty years after World War II when America grew because most Ameri-cans shared in the nationrsquos prosperity ndash we cannot have a growing and vibrant economy without a growing and vibrant middle class
Robert B Reich is Chancellorrsquos Professor of Public Policy at the University of California at Berkeley He has served in three national administrations most recently as Bill Clintonrsquos secretary of labor He is also the author of thirteen books the most recent of which is Aftershock The Next Economy and Americarsquos Future
21 Community Investments Fall 2011 ndash Volume 23 Issue 2
Special Focus Income Inequality
It is well known that economic deprivation early in life sets children on a trajectory toward diminished educational and occupational attainment But why is early childhood poverty so harmful If we canrsquot
answer that question well our reform efforts are reduced to shots in the dark
In this article we offer a new perspective on this question We suggest that childhood poverty is harmful in part because it exposes children to stressful environ-ments Low-income children face a bewildering array of psychosocial and physical demands that place much pres-sure on their adaptive capacities and appear to be toxic to the developing brain Although poor children are disad-vantaged in other ways we focus our analysis here on the new underappreciated pathway depicted in Figure 1 As
shown in this figure children growing up in poverty dem-onstrate lower academic achievement because of their exposure to a wide variety of risks These risks in turn build upon one another to elevate levels of chronic (and toxic) stress within the body And this toxic stress directly hinders poor childrenrsquos academic performance by com-promising their ability to develop the kinds of skills neces-sary to perform well in school We will unpack this new RiskndashStress Model in the balance of our article However before doing so itrsquos useful to first go over the evidence regarding the relation between poverty and achievement and then to present some of the well-known pathways through which this relationship is generated With that background in place we can then describe the RiskndashStress Model as represented in Figure 1
Stressing Out the PoorChronic Physiological Stress and the Income-Achievement GapBy Gary W Evans Jeanne Brooks-Gunn and Pamela Kato Klebanov
22 Community Investments Fall 2011 ndash Volume 23 Issue 2
Poverty and Achievement
It is well known that children born into low-income families lag behind their middle- and upper-income coun-terparts on virtually all indices of achievement To provide one example a national study of elementary school chil-dren shows that children in the poorest quarter of American households begin kindergarten nearly 10 percent behind their middle-income and affluent classmates in math (Figure 2) Six years later as they are about to enter middle school the poorest quarter of American children have fallen even further behind with the gap between themselves and their most affluent schoolmates nearly doubling
Figure 2 Average percentile rank on Peabody Individual Achievement MathFigure 2 ‐ Average percentile rank on Peabody Individual
Achievement Math
60
65
e
Highest income quartile
50
55
Percen
tile
Third income quartile
40
45
Score
Second income quartile
35
6 8 10 12
Lowest income quartile
Age of Child
Source James J Heckman (2006) ldquoSkill Formation and the Economics of Investing in DisadvantagedChildrenrdquo Science 312(5782) 1900‐1902Children Science 312(5782) 1900 1902Source James J Heckman (2006) ldquoSkill Formation and the Econom-
ics of Investing in Disadvantaged Childrenrdquo Science 312(5782) 1900-1902
The splaying pattern revealed here a general one that holds across various outcomes may be attributed to the tendency for advantage and disadvantage to accumulate over time This accumulation occurs in various ways for example children who score poorly at age six may be tracked into low-achievement school groups which in turn exposes them to lower expectations to less rigorous curricula and to less capable peers all of which further disadvantage them and generate ever more substantial between-group gaps The RiskndashStress Model to which we turn later suggests that such splaying may also be attribut-ed to the cognitive deficits and poorer health that chronic stress generates Both cognitive deficits and ill health then repeatedly disadvantage poverty-stricken children in one educational setting after another
Pathway 1 Parenting Practices
What types of forces have social scientists convention-ally understood as explaining the achievement gaps illus-trated in Figure 2 One reason poor children lag behind their more affluent peers is that their parents interact with them in ways that arenrsquot conducive to achievement For example psychologist Kathryn Grant and her col-leagues have documented a strong and consistent relation between socioeconomic disadvantage and harsh unre-sponsive parenting In one national dataset 85 percent of American parents above the poverty line were shown to be responsive supportive and encouraging to their chil-dren during infancy and toddlerhood whereas only 75 percent of low-income parents had the same achievement-inducing parenting style While most low-income parents (ie 75 percent) do provide adequate levels of support and encouragement these data reveal then a nontrivial difference across income levels in the chances that chil-dren will experience a problematic parenting style There is considerable evidence that at least a portion of the cog-nitive developmental consequences of early childhood poverty is due to this difference
Pathway 2 Cognitive Stimulation
Itrsquos also well known that children from low-income households tend to receive less cognitive stimula-tion and enrichment For example a child from a low-income family who enters first grade has been exposed on average to just 25 hours of one-on-one picture book reading whereas an entering middle-income child has been exposed on average to more than 1000 hours of such reading Likewise during the first three years of life a child with professional parents will be exposed to three times as many words as a child with parents on welfare
And itrsquos not just simple parental effects that account for the achievement deficit If a child is born into a high-in-come family he or she may also benefit from high-quality stimulation and enrichment from extended family from siblings and friends and from more formal care providers All of this redounds to the benefit of higher-income chil-dren while further handicapping low-income children
So much for the well-known pathways by which dis-advantage is transmitted We turn now to another and less-appreciated aspect of low-income environments that
倀漀瘀攀爀琀礀 䌀甀洀甀氀愀琀椀瘀攀 刀椀猀欀 䔀砀瀀漀猀甀爀攀
䌀栀爀漀渀椀挀 匀琀爀攀猀猀 䰀漀眀 䄀挀栀椀攀瘀攀洀攀渀琀
䘀椀最甀爀攀 ⴀ 䄀 渀攀眀 瀀愀琀栀眀愀礀 琀漀 愀挀挀漀甀渀琀 昀漀爀 琀栀攀 椀渀挀漀洀攀ⴀ愀挀栀椀攀瘀攀洀攀渀琀 最愀瀀Figure 1 The Risk-Stress ModelmdashA new pathway to account for the income-achievement gap
Special Focus Income Inequality
23 Community Investments Fall 2011 ndash Volume 23 Issue 2
may also harm cognitive development The key concern here children from impoverished households face a wide array of physical and psychosocial stressors Their homes schools and neighborhoods are much more chaotic than the settings in which middle- and upper-income children grow up Such conditions can in turn produce toxic stress capable of damaging areas of the brain known to underlie cognitive processesmdashsuch as attention memory and languagemdashthat all combine to undergird academic success In the pages that remain we document each of the steps in the RiskndashStress Model
Poverty and Cumulative Risk Exposure
The stressors that poor children face take both a physi-cal and psychosocial form The physical form is well doc-umented poor children are exposed to substandard envi-ronmental conditions including toxins hazardous waste ambient air and water pollution noise crowding poor housing poorly maintained school buildings residential turnover traffic congestion poor neighborhood sanitation and maintenance and crime The psychosocial form is also well documented poor children experience signifi-cantly higher levels of family turmoil family separation violence and significantly lower levels of structure and routine in their daily lives
An important aspect of early disadvantaged settings may be exposure to more than one risk factor at a time A powerful way to capture exposure to such multiple sources of stress and strain is the construct of cumulative risk Al-though there are various ways to quantify cumulative risk one common approach is to simply count the number of physical or psychosocial risks to which a child has been exposed In one UK study the authors counted how often children were exposed to such stresses as (a) living with a single parent (b) experiencing family discord (c) expe-riencing foster or some other form of institutional care (d) living in a crowded home and (e) attending a school with high turnover of both classmates and teachers It was found in this study that inner-city children experienced far more of these stresses than did the better-off working-class children The same result holds in the United States (see Figure 3) In rural New England only 12 percent of middle-income nine-year-olds experienced three or more physical and psychosocial risk factors whereas nearly 50 percent of low-income children crossed this same thresh-old (of three risk factors)
In a national US sample of premature and low birth weight infants Brooks-Gunn and colleagues similarly found that infants born into low-income families expe-rienced nearly three times more risk factors than their middle-income counterparts by the time they were tod-dlers These same low-income toddlers were seven times more likely than their affluent counterparts to experience
a very high number of risk factors (gt 6) The pattern is overwhelmingly clear being born into early poverty often means exposure to many more physical and psychosocial risk factors
Figure 3 Cumulative Risk Exposure in Relation to PovertyNot Poverty
㐀
㔀
㘀
㐀 㔀 㘀
倀攀爀挀
攀渀琀愀
最攀 匀挀
栀漀漀氀
䌀栀椀
氀搀爀攀
渀 䔀砀
瀀漀猀攀
搀
一甀洀戀攀爀 䌀甀洀甀氀愀琀椀瘀攀 刀椀猀欀猀
䘀椀最甀爀攀 ⴀ 䌀甀洀甀氀愀琀椀瘀攀 刀椀猀欀 䔀砀瀀漀猀甀爀攀 椀渀 刀攀氀愀琀椀漀渀 琀漀 倀漀瘀攀爀琀礀 一漀琀 倀漀瘀攀爀琀礀
倀漀瘀攀爀琀礀
䴀椀搀搀氀攀ⴀ椀渀挀漀洀攀
一漀琀攀㨀 䌀甀洀甀氀愀琀椀瘀攀 爀椀猀欀猀 椀渀挀氀甀搀攀 昀愀洀椀氀礀 琀甀爀洀漀椀氀Ⰰ 瘀椀漀氀攀渀挀攀Ⰰ 挀栀椀氀搀 猀攀瀀愀爀愀琀椀漀渀 昀爀漀洀 昀愀洀椀氀礀Ⰰ 渀漀椀猀攀Ⰰ 挀爀漀眀搀椀渀最Ⰰ愀渀搀 栀漀甀猀椀渀最 焀甀愀氀椀琀礀匀漀甀爀挀攀㨀 䜀愀爀礀 圀 䔀瘀愀渀猀 愀渀搀 䬀椀洀戀攀爀氀礀 䔀渀最氀椀猀栀 ᰠ吀栀攀 䔀渀瘀椀爀漀渀洀攀渀琀 漀昀 倀漀瘀攀爀琀礀㨀 䴀甀氀琀椀瀀氀攀 匀琀爀攀猀猀漀爀䔀砀瀀漀猀甀爀攀Ⰰ 倀猀礀挀栀漀瀀栀礀猀椀漀氀漀最椀挀愀氀 匀琀爀攀猀猀Ⰰ 愀渀搀 匀漀挀椀漀攀洀漀琀椀漀渀愀氀 䄀搀樀甀猀琀洀攀渀琀ᴠ 䌀栀椀氀搀 䐀攀瘀攀氀漀瀀洀攀渀琀Ⰰ 㜀㐀⤀㨀㠀ⴀ㐀㠀
Note Cumulative risks include family turmoil violence child separa-tion from family noise crowding and housing qualitySource Gary W Evans and Kimberly English 2002 ldquoThe Environment of Poverty Multiple StressorExposure Psychophysiological Stress and Socioemotional Adjustmentrdquo Child Development 73(4)1238-48
Cumulative Risk Exposure and Chronic Stress
But does such differential exposure indeed result in higher stress levels among poor children The simple answer is that it does In cross-sectional analyses of 9- and 13-year-old children Evans and colleagues found that the risk exposure described in Figure 3 elevated baseline resting blood pressure as well as overnight indices of such stress hormones as cortisol At age 13 when challenged by mental arithmetic problems children with higher levels of cumulative risk exposure did not show a typical healthy response instead exhibiting a muted rise in blood pressure These same children also didnrsquot recover as suc-cessfully from the mental challenge posed by these arith-metic problems (as indexed by the longer time it took their blood pressure to return to pre-stressor baseline levels) The evidence thus suggests that children exposed to high levels of cumulative risk are less efficient both in mobiliz-ing and then shutting off physiological activity
The RiskndashStress Model as represented in Figure 1 implies that the effect of family poverty on stress is medi-ated by risk exposure Although one would ideally like to test that mediation itrsquos also important to simply document the association between poverty and stress (thereby ignor-ing the mediating factor) Many investigators have indeed documented that disadvantaged children have higher chronic physiological stress levels as indicated by ele-
24 Community Investments Fall 2011 ndash Volume 23 Issue 2
vated resting blood pressure A smaller number of studies have also uncovered higher levels of chronic stress hor-mones such as cortisol among disadvantaged children To provide just a few examples Figures 4 and 5 show el-evated resting blood pressure as well as higher overnight urinary stress hormones in a sample of nine-year-old rural children
The foregoing data which pertain to nine-year-olds donrsquot tell us when such stress symptoms emerge Do pov-erty-stricken children show evidence of elevated stress early on in their lives
Or do such symptoms only emerge later With support from the Stanford Center for the Study of Poverty and Inequality we sought to answer this question by reana-lyzing a national data set of very young at-risk children The Infant Health and Development Program (IHDP) is a representative sample of low birth weight (lt 2500 grams) and premature (lt 37 weeks gestational age) babies born in 1985 at eight medical centers throughout the country This sample of nearly 1000 babies is racially and eco-nomically diverse (52 percent Black 37 percent White 11 percent Hispanic)
Figure 4 Resting blood pressure in nine-year-old White rural children
Source Gary W Evans and Kimberly English 2002 ldquoThe Environment of Poverty Multiple Stressor Exposure Psychophysiological Stress and Socioemotional Adjustmentrdquo Child Development 73(4)1238-48
Figure 5 Overnight stress hormones in nine-year-old White rural children
Source Gary W Evans and Kimberly English 2002 ldquoThe Environment of Poverty Multiple Stressor Exposure Psychophysiological Stress and Socioemotional Adjustmentrdquo Child Development 73(4)1238-48
Diastolic
605
61Diastolic
59 5
60
59
595
mmH
g
58
585
m
57
575
57
Poverty Middle‐income
Systolic
102
1025
1015
1005
101
mmH
g
100
99
995
99
Poverty Middle‐income
0035Cortisol
0025
003
002
0 01
0015
0005
001
0
Poverty Middle‐income
6Epinephrine
5
3
4
2
3
1
0
Poverty Middle‐income
Cortisol Epinephrine Norephinephrine
Poverty Middle-income Poverty Middle-income Poverty Middle-income
Special Focus Income Inequality
33Norepinephrine
32
325
315
30 5
31
30
305
295
Poverty Middle‐income
25 Community Investments Fall 2011 ndash Volume 23 Issue 2
We assessed resting blood pressure and childrsquos height and weight at 24 30 36 48 60 and 78 months of age The collection of physical health data at such young ages and over time provided us with an unprecedented opportunity to examine the early trajectories of chronic stress among a high-risk sample of babies Both baseline blood pressure levels and Body Mass Index (BMI) reflect wear and tear on the body and are precursors of lifelong health problems The former is indicative of cardiovascular health and the latter of metabolic equilibrium BMI which reflects fat de-position is measured as height divided by weight (kgm2)
We sought to assess whether these two measures of stress are elevated in poverty-stricken neighborhoods Low-in-come neighborhoods as defined in our study have median household incomes below $30000 (in 1980 dollars) while middle income neighborhoods have median income levels exceeding $30000 per household As is evident in Figures 6 and 7 babies growing up in low-income neigh-borhoods have health trajectories indicative of elevated chronic stress Additional statistical controls for infant birth weight health and demographic characteristics did not alter these trajectories These figures also reveal even more importantly that elevated stress emerges very early for chil-dren growing up in low-income neighborhoods BMI for example proves to be unusually low among poor children under five years old but it then takes off as these children grow older The blood pressure measure by contrast regis-ters high among low-income children from almost the very beginning of our measurements (ie 24 months) This re-search confirms then that low-income children are more likely than others to develop dangerous stress trajectories very early on in their childhood As we discuss below this has profound consequences for their likelihood of success in school and beyond
Chronic Stress and the Achievement Gap
The next and final step in our chain model pertains to the effects of chronic stress on achievement Here we turn to an important longitudinal program on poverty and the brain at the University of Pennsylvania con-ducted by Martha Farah and her colleagues In a series of studies with multiple samples drawn from lower- and middle-class Black families in Philadelphia Farah and colleagues show that several areas of the brain appear vulnerable to early childhood deprivation Using batter-ies of neurocognitive tests of brain function and brain imaging studies Farah and other neuroscientists can map the areas of the brain that are recruited by neuro-cognitive tasks As shown in Figure 8 among the areas of the brain most sensitive to childhood socioeconomic status (SES) are language long-term memory working memory and executive control What the graph depicts is the separation in standard deviation units between a low- and middle-SES sample of 11-year-old Black chil-dren from Philadelphia For this sample one standard deviation represents about one-fifth of the total distribu-tion of scores Samples differing by 35 or more stan-dard deviations are virtually non-overlapping Given that the samples differ by about 35 standard deviations for all four areas of brain functioning this means that there is virtually no overlap between poor and middle-class Black children when it comes to language long-term memory working memory or executive control Eleven-year-old Black children from lower SES families reveal dramatic deficits in multiple basic cognitive functions critical to learning and eventual success in society These results reveal the starkly cognitive foundation to the poor performance of low-income children
5055
6065
70D
BP
24 36 48 60 72Age in Months
Middle Income Neighborhoods Low Income Neighborhoods
1516
17B
MI
24 36 48 60 72Age in Months
Middle Income Neighborhoods Low Income Neighborhoods
B MI from 24 to 78 Months by Neighborhood P overty
Figures 6 and 7 Developmental trajectories in chronic stress in relation to neighborhood poverty
Diastolic Blood Pressure from 24 to 78 Months by Neighborhood Poverty
BMI from 24 to 78 Months by Neighborhood Poverty
26 Community Investments Fall 2011 ndash Volume 23 Issue 2
Figure 8 Effect sizes measured in standard deviations of separation between low-and middle-SES 10ndash12-year-old
African American children
2
25
3
35
4
Low
vs M
iddle SES
0
05
1
15
Language LTM WM Executive Control
SD Sep
aration
Source Martha J Farah David M Shera Jessica H Savage Laura Betancourt Joan M Giannetta Nancy L Brodsky Elsa K Malmud and Hallam Hurt 2006 ldquoChildhood Poverty Specific Associations with Neurocognitive Developmentrdquo Brain Research 1110(1) 166-74
But is this achievement gap attributable to cumula-tive risk and chronic stress With a recent follow-up of the sample depicted in Figures 4 and 5 Evans and col-leagues have now provided the first test of the final link in the RiskndashStress Model The baseline finding from their research is that working memory in early adulthood (ie age 17) deteriorated in direct relation to the number of years the children lived in poverty (from birth through age 13) If in other words a child lived in poverty con-tinuously his or her working memory was greatly com-promised The main result of interest however was that such deterioration occurred only among poverty-stricken children with chronically elevated physiological stress (as measured between ages 9 and 13) That is chronic early childhood poverty did not lead to working memory defi-cits among children who somehow avoided experiencing the stress that usually accompanies poverty
Conclusion
Childhood socioeconomic disadvantage leads to deficits in academic achievement and occupational at-tainment Itrsquos long been argued that such deficits arise because poor children are exposed to inadequate cogni-tive stimulation and to parenting styles that donrsquot encour-age achievement We donrsquot dispute the important role of these two variables But we have outlined here evidence for a new complementary pathway that links early child-hood poverty to high levels of exposure to multiple risks which in turn elevates chronic toxic stress This cascade can begin very early in life Even young babies growing up in low-income neighborhoods already evidence elevated chronic stress This stress then accounts for a significant portion of the association between poverty and working memory a critical cognitive skill involved in language and reading acquisition
The RiskndashStress Model suggests that the povertyndashachievement link can be broken by addressing (a) the ten-dency of poverty to be associated with physical or psycho-social risks (eg environmental toxins family turmoil) (b) the effects of such risks on stress and (c) the effects of stress on achievement If this model bears up under further testing it would be useful to explore which of these path-ways is most amenable to intervention
Gary W Evans is the Elizabeth Lee Vincent Professor of Human Ecology at Cornell University Jeanne Brooks-Gunn is the Virginia amp Leonard Marx Professor of Child Development amp Education and Co-Director of the Nation-al Center for Children and Families at Teachers College Columbia University Pamela Kato Klebanov is a Senior Research Scientist at the National Center for Children and Families at Teachers College Columbia University and a Visiting Research Collaborator at the Center for Research on Child Wellbeing at Princeton University
Special Focus Income Inequality
27 Community Investments Fall 2011 ndash Volume 23 Issue 2
Transformational Potential
There is a new game-changing program available for community development financial institutions (CDFIs) The CDFI Bond Guarantee Program offers CDFIs up to $1 billion of affordable long term
government guaranteed debt financing per year through 2014 to promote community and economic development in our nationrsquos low-income low-wealth and other disad-vantaged communities It significantly improves CDFIsrsquo access to capital offering financing terms that make sense for CDFIs and the communities they serve and helping CDFIs meet substantial unmet capital demand in target communities At the same time it has the potential to transform the way CDFIs capitalize themselves improving sustainability and financial stability
Quite frankly the CDFI Bond Guarantee Program could forever alter the landscape and future of the indus-try For that reason alone we need to make sure it works well for CDFIs and the communities they serve
CDFI Bond Opportunity of a DecadeBy Cathy Dolan
What is the CDFI Bond Guarantee Program
The purpose of the CDFI Bond Guarantee Program is to create a new CDFI investment vehicle for communi-ty and economic development purposes Passed as part of the Small Business Jobs Act of 2010 it is intended to support CDFIsrsquo role as economic engines of growth in the nationrsquos disadvantaged markets
Select features of the CDFI Bond Guarantee Program include
bull $3 billion in bond guarantee authority through 2014 with minimum bond size of $100 million
bull CDFIs will be able to issue taxable bonds with terms up to 30 years
bull The Federal Government Guarantee ensures repay-ment of verifiable losses of principal interest and call premium if any on bonds and notes
28 Community Investments Fall 2011 ndash Volume 23 Issue 2
Eye on Com
munity D
evelopment
bull The Program is being administered by the CDFI Fund at the US Department of the Treasury
bull The Federal Financing Bank will buy 100 percent of bonds and notes issued to simplify execution and min-imize cost and pricing
bull Participating CDFIs will be required to establish a risk share pool of three percent of the bond or note amount
bull Proceeds can be used by CDFIs to finance or refinance activity that meets the community and economic de-velopment definition of the Riegle Act (the enabling legislation for the CDFI Fund)
The CDFI Fund states that the program rules will be issued in the fall of 2011 and bonds are poised to be issued by the spring of 2012 The Program provides up to $3 billion of total financing before it sunsets in September 2014 unless reauthorized
Why is the CDFI Bond Guarantee Program so important now
The timing for this new program couldnrsquot be more op-portune With unemployment rates above nine percent and slowing GDP growth economic recovery has been disappointingly weak Low growth prospects lead to cor-porate hesitation to invest in new ventures and hire new workers However with interest rates at historic lows itrsquos an ideal time to borrow and invest for the future In fact recent monetary policy decisions have pushed long term rates even lower as of September 25 2011 30-year trea-suries are below three percent This may be a ldquoonce in a lifetimerdquo opportunity to lock in 30 year debt at rates this low Once economic activity ignites capital will become more expensive and more difficult to raise There is no better time than now to give CDFIs access to $1 billion per year of up to 30 year debt at rates similar to government securities
Why CDFIs
CDFIs have a long history of financing and meeting the needs of entities and individuals that lack access to the mainstream financial system But as the boundaries of the mainstream financial system contract the need for CDFIs to fill the gap increases Indeed while there are reports that corporate cash levels are at record highs the capital tills of small businesses and entrepreneurs are empty Large com-panies are reticent to invest in new initiatives and banksrsquo tightened credit standards have constrained small business and consumer lending While policy makers and regula-tors work hard to make capital more freely available in order to spark job creation and economic growth the only thing growing is cash accounts Lending and investment particularly in underserved markets remain low
CDFIs which are positioned to address these issues report increasing demand for credit in their markets partly in response to declining bank lending According to The Opportunity Finance Network (OFN) 2011 2nd Quarter CDFI Market Conditions Report (a publication based on quarterly surveys of CDFIs) 54 percent of respondents reported an increase in the number of financing applica-tions received year-over-year and 55 percent reported an increase in loan originations1 Among survey respondents 25 percent reported that they are capital-constrained and could have made more loans in the second quarter of 2011 if financing capital had been available To meet estimated demand in the next 12 months the respondents reported they would need an additional $880 million in capital
The respondents made these estimates assuming they were limited to the type of debt financing currently avail-able to CDFIs which is generally less than 10 years in term and priced based on market spreads over treasury securities or LIBOR In March 2011 OFN expanded the scope of this survey to gauge broader market demand for CDFI Bond-type financingmdashup to 30 years in term and priced at a small spread over treasury securities The re-sponses indicated an overwhelming confidence in CDFIsrsquo ability to absorb $1 billion per year to meet the needs of community businesses and individuals in low-income low-wealth and otherwise disadvantaged markets
What is the critical path to success
What will make the CDFI Bond Guarantee Program a success And how do we ensure CDFIs derive maximum advantage from the Program and dramatically impact communities in need There are many important princi-ples that will lead to a successful bond program including performance and outcome based evaluation and efficient and affordable participation among CDFIs but most criti-cal are the following objectives
1 The need for flexibility to accommodate the variety of financial structures that CDFIs use to serve low-income low-wealth communities
One of the CDFI industryrsquos strengths is its diversity of products and practices In order to adequately meet the needs of their underserved communities CDFIs need to be flexible and responsive to the unique factors that affect those businesses outside the mainstream financial system That means the program canrsquot be cookie cutter or one-size-fits-all in nature
To that end eligible uses need to include all financing sectors including housing small businesses community facilities retail and commercial real estate development in distressed markets and personal financial credit prod-ucts targeted at disadvantaged populations
29 Community Investments Fall 2011 ndash Volume 23 Issue 2
Moreover the terms of the bond need to accommodate the way CDFIs provide capital to their targeted markets CDFIs offer term financing lines of credit construction loans secondary capital investments and revolving lines of credit and the program should accommodate all these types of financing products
2 Financing via the CDFI Bond Guarantee Program is used and controlled by CDFIs with a proven track record of mission based financing
The prospect of a new government-guaranteed debt program could attract the attention of entities that fashion themselves as community development lenders but who lack the mission-based orientation and track record of re-sponsible financing that the CDFI industry has long stood for and upheld This program should be reserved only for those entities that have a proven record of responsible fi-nancing with a strong mission of creating access to re-sponsible and affordable financial services for disadvan-taged and underserved communities This program should not be available to CDFIs in name only
3 Underwriting based on CDFIrsquos assessment of riskProgram risk criteria and issuer selection should be
based on the CDFI industryrsquos performance track record not on that of the mainstream financial services industry There will be a temptation to look to mainstream finan-cial service providers and programs to assess the overall program risk and individual bond applications because this is a new program to a largely unregulated sector and Treasury (CDFI Fund) has few precedents to guide it However the CDFI industry has thrived for the past thirty years precisely because non-CDFI regulated institutions and for-profit finance companies operate so differently
The markets served by CDFIs are unique and by defi-nition outside the mainstream CDFIs understand how to underwrite and manage the risk of businesses individuals and community projects in underserved markets because they are close and responsive to their borrowers willing and able to provide technical assistance when necessary and flexible enough to work with borrowers when diffi-culties arise This high-quality track record is evidenced by OFNrsquos Inside the Membership Report which shows a weighted average cumulative net charge-off rate of 14 percent and weighted average delinquency of more than 30 days of 92 percent as of year-end 20091 As of the second quarter of 2011 problem loans seem to be in decline as OFNrsquos Market Conditions Report shows that membersrsquo rate of delinquency of more than 30 days had improved to 65 percent
This performance track-record is indicative of CDFIsrsquo unique ability to underwrite and manage risk When as-sessing the risk of the CDFI Bond Guarantee Program and designing underwriting criteria for use in the selection of bond applicants it will be critical for the CDFI Fund to use CDFIsrsquo track record and not that of the mainstream financial services sector
Conclusion
The CDFI Bond Guarantee Program is meant to en-courage the creation of a new type of security that would provide access to responsible financing for disadvantaged communities at meaningful volumes affordable cost and long terms If successful this program could dramatically improve access to capital recapitalize CDFI balance sheets (improving profitability and financial stability) and help banks and other mainstream financial institutions increase their financing in partnership with CDFIs for the benefit of low-income and low-wealth communities This could lead to important increases in the number of jobs created and retained the supply of quality affordable housing and access to vital community facilities and services In short the CDFI Bond Guarantee Program would give CDFIs access to a reliable supply of capital with a term and cost structure that has never before been available
As our economy struggles to regain footing CDFIs have a vital role to play as engines of growth and the CDFI Bond can help make it happen As Federal Reserve Chair-man Bernanke recently said ldquoProviding responsible credit for individuals and small business through community de-velopment financial institutions can stimulate economic activity that generates local tax revenuesrdquo2
The imperative is clear The CDFI Bond Guarantee Program needs to become a reality as soon as possible so CDFIs can increase financing to under-served markets and contribute to job creation and economic growth OFN encourages all those interested in the program to join the CDFI Bond Alliance which will actively shape the discussion on the design and implementation of the CDFI Bond on behalf of CDFIs for the full lifecycle of the programmdashfrom initial rule promulgation through bond issuance and ultimately to encourage reauthorization For more information visit httpopportunityfinancenetfinancing
Cathy Dolan is Chief Operating Officer of Opportunity Finance Network (OFN) the leading network of private financial institutions that creates growth that is good for communities investors individuals and the economy
30 Community Investments Fall 2011 ndash Volume 23 Issue 2
ou wonrsquot believe what my mother did yester-dayrdquo said Linda ldquoShe bought a new refrig-erator on credit Do you know how much itrsquos going to cost by the time she finishes paying
for itrdquo she exclaimed pointing out that her mother would be paying 21 percent interest Linda had read the terms of agreement for her motherrsquos new department store credit card marking a significant personal achievement Just five years ago Linda couldnrsquot read at more than a 3rd grade level much less understand the financial complexities of a credit agreement
Linda used to be one of the 30 million adults in the United States who canrsquot read or write well enough to perform important daily tasks such as reading food labels or filling out a job application They may be individuals
Building Literacy Skills and Transforming LivesBy Cathay Reta and Mari Riddle
who dropped out of school early or immigrants who had little formal education in their home countries The con-straints of limited educational attainment are worsened by a lack of literacy skills creating significant economic and personal hardship for these adults and their families Adult low literacy can be connected to almost every so-cio-economic issue in the United States more than 60 percent of all state and federal corrections inmates can barely read and write low health literacy costs $73 billion each year in the US and low literacyrsquos effects cost the US $225 billion or more each year in non-productivity in the workforce crime and loss of tax revenue due to unemployment1 Low literacy is more prevalent among low-income and minority populations with Blacks and Hispanics more than three times more likely than whites
Eye on Com
munity D
evelopment
31 Community Investments Fall 2011 ndash Volume 23 Issue 2
to be below basic literacy proficiency (see Figure 1)2 Ad-ditionally 41 to 44 percent of US adults in the lowest level on the literacy scale are living in poverty3
Figure 1 Percentage of Adults Below Basic Literacy Proficiency by Race
㜀
㐀
㐀㜀㐀㐀
㔀
㐀
㔀
㘀
倀爀漀猀攀 儀甀愀渀琀椀琀愀琀椀瘀攀
䘀椀最甀爀攀 ⴀ 倀攀爀挀攀渀琀愀最攀 漀昀 䄀搀甀氀琀猀 䈀攀氀漀眀 䈀愀猀椀挀 䰀椀琀攀爀愀挀礀 倀爀漀昀椀挀椀攀渀挀礀Ⰰ 戀礀 刀愀挀攀
圀栀椀琀攀
䈀氀愀挀欀
䠀椀猀瀀愀渀椀挀
Source National Center for Education Statistics 2003 National Assessment of Adult LiteracyNote Prose literacy relates to the skills required to search com-prehend and use continuous texts Quantitative literacy allows for the identification and performance of computations using numbers embedded in printed materials
The statistics are staggering but there are stories of hope and success like Lindarsquos Adult learners are varied and unique but their motivations are universal They want to support their childrenrsquos education They want better jobs They want to be more involved in their communi-ties The ability to read and write is a core foundational skill for each of those motivators
ldquoBeing able to read write do basic math and use a computer are critical building blocks that the 30 million Americans who function at below basic literacy levels are in need of in order to find and keep sustainable em-ploymentrdquo says David C Harvey president and CEO of ProLiteracy the oldest and largest nonprofit organization dedicated to advancing the cause of adult literacy and basic education ldquoHaving access to literacy resources and literacy instruction contributes to these adults being able to find jobs earn a living wage and improve their healthmdashall of which have far-reaching effects on our countryrsquos ability to compete globallyrdquo says Harvey
The need for adult literacy education has never been greater ldquoRight now millions of Americans are struggling to find work and policymakers are emphasizing the need to create jobs and retrain our workforce As part of that retraining we must invest in adults who struggle with the simplest reading writing and math tasks They are most in need of such investment to help them find and keep jobsrdquo says Harvey Even for those employed American
businesses spend more than $60 billion each year on em-ployee training much of that for remedial reading writing and mathematics4
This article demonstrates how advancements in adult literacy education can significantly improve the lives of individuals with low literacy skills their families and their communities It also provides specific examples of inte-grated initiatives that aim to weave literacy instruction into broader skill building efforts such as financial and health education
Transforming Families ndash Breaking the Cycle of Illiteracy
At Centro Latino for Literacy a Los Angeles-based non-profit organization and member of ProLiteracy most of the students are in their 20s and 30s with young children and they are motivated to break the intergenerational cycle of illiteracy Consider the story of student Julia RodrIacuteguez ldquoIrsquom from Guerrero Mexico and Irsquom 34 years old I was the oldest and I had to help my parents take care of my younger siblings We were very poor and there was no money for school Over time my siblings went to school but I stayed working Now Irsquom a mother of three and Irsquom very motivated to learn so that I can help my children succeed They are my inspiration to learnrdquo
Rodriguez is on the right track According to an October 2010 report from the National Institute for Health improving mothersrsquo literacy skills may be the best way to boost childrenrsquos achievement5 A motherrsquos reading skill is the greatest determinant of her childrenrsquos future academic success even outweighing other factors such as neigh-borhood and family income Adults who improve their literacy skills gain the ability to read with their children and support their schoolwork They also become more effective role models Jasmin the 11 year old daughter of another Centro Latino student said ldquoMy mom really gives her all to learn to read We help her so that she doesnrsquot get discouraged I tell her lsquoYou can do it Momrsquo I am so proud of her and she inspires me because shersquos always pushing forwardrdquo Young people like Jasmin show the transformative power of adult learning where invest-ments in education reach not only the adults but their children as well
Health Literacy
ldquoI tried to donate blood for my daughter who was ill with cancer When they handed me medical history forms to complete I ran out of the room because I couldnrsquot fill out the forms It was embarrassingrdquo recounts an adult student in a San Diego County literacy program Shersquos not alone Enrique Ramirez another student shares ldquoThe nurses told me to take the elevator and go to where it says lsquox-raysrsquo I took the elevator and I just went home because
32 Community Investments Fall 2011 ndash Volume 23 Issue 2
I couldnrsquot read the signs Itrsquos a scary thing when you donrsquot know the wordsrdquo
The Community Health Improvement Partners (CHIP) a coalition of San Diego health care systems is working to address the impact of low literacy skills on individualsrsquo health and the cost to the health care system Research shows that low health literacy skills among 90 million adults in the United States results in $73 billion of po-tentially avoidable health care expenditures annually6 Many patients are unable to read basic health materials comprehend directions for taking medications or under-stand information on an appointment slip In one Cali-fornia study 65 percent of adults with low reading skills reported they avoid going to the doctor because of dif-ficulties associated with completing the paperwork7 And 75 percent of medical professionals answered they were aware of medical errors that were the product of low lit-eracy levels8
In 2007 CHIP and the San Diego Council on Literacy (SDCOL) formed a partnership to address health literacy challenges in San Diego County Together the organiza-tions developed a plan which is now being implemented under the name of Health Literacy San Diego9 First the agencies and their partners are training front and back office medical staff on how to identify and support low literate patients especially those who are English speakers who read below the eighth grade level but do not disclose their difficulty with the paperwork Focus groups revealed that medical staff members were aware of the needs but they were frustrated by a lack of training in how to handle them Jose Cruz CEO of SDCOL reports ldquoOne technique that we teach trainees is to use the lsquoteach backrsquo method with their patients Patients in turn teach back to the staff what they heard from their doctor during their appoint-mentrdquo This helps to make sure patients understand their condition and what they need to do Second Health Lit-eracy San Diego has developed curriculum to integrate health literacy topics and vocabulary into literacy lessons taught by its affiliated programs throughout the county ldquoWe are addressing the cultural language and literacy barriers that impact health outcomes for adults with low literacy skillsrdquo says Cruz
Financial Literacy
As evidenced by the recent financial crisis the US financial system is highly complex and consumers often struggle to make sense of new products and regulationsmdashlow literacy adults are likely to struggle even more Efforts that aim to improve functional literacy in conjunction with financial literacy can play a significant role in helping in-dividuals achieve financial stability Project Read an adult literacy program of the South San Francisco Public Library began a Financial Well-Being Project three years ago that
targets low-income individuals with low literacy skills The program offers financial education and coaching which helps clients create spending plans build emergency savings funds and plan strategies to build wealth ldquoClasses are fun positive and as basic as possiblerdquo says Fernando Cordoba Literacy Services Coordinator and instructor The program has also helped to connect participants with Opportunity Fund a non-profit social enterprise organiza-tion that provides microloans to low-income individuals looking to start or expand a small business
Cordoba shares that it is difficult to bring about behav-ioral change Students can easily gain financial knowledge in the classes but they are reaching beyond that ldquoThey [the adult students] already handle money and itrsquos hard to change patternsrdquo he says Project Read uses incentives such as gift cards for completing assignments and raising credit scores These are good motivators but what really makes a difference is the personal individual attention stu-dents receive and the trust they have with Project Read According to Cordoba successes have come with students who have an ongoing relationship with the program ldquoThey are looking for structure and we provide thatrdquo he says Along with that structure students gain confidence and trust ldquoA lot of students tell us they are leery of financial in-stitutions that seem to be more interested in lsquoselling themrsquo something rather than helping them They understand that our services are truly student-centeredrdquo says Cordoba
Addressing Native Language Literacy
The challenges connected to low English literacy skills are compounded for immigrant adults illiterate in their own native languages Itrsquos common for non-literate Spanish speakers to enroll in English as a Second Language programs only to find them too difficult After struggling to keep up these students may drop out There is a pressing need for native language literacy as evidenced by a 2006 report The Integration of Immigrants in the Workplace which estimates that 32 percent of adults enrolled in ESL classes lack basic literacy skills in their native language making them ldquoslower in learning a second language than their literate counterpartsrdquo10
Centro Latino helps non-literate Spanish speakers to learn English and other vital skills by teaching them first to read and write in Spanish This approach builds the foun-dational skills and confidence needed to learn English and pursue other goals Centro Latino is located in the WestlakePico Union neighborhood immediately west of downtown Los Angeles and serves over 1000 Spanish speakers each year in a county where almost 216000 adult Spanish speakers cannot read or write in any lan-guage The organizationrsquos clients have endured severe poverty and isolation in their youth and generally have had fewer than three years of formal education
Eye on Com
munity D
evelopment
33 Community Investments Fall 2011 ndash Volume 23 Issue 2
At Centro Latino adults learn basic reading and writing skills in Spanish through LeamosTM a web-based literacy curriculum Leamos is a self-paced application that allows students to progress through lessons at their own rate As a result most participants learn to read and write in ap-proximately 100 - 150 hours (two to five months) at the computer Leamos teaches Spanish-speaking youth and adults to read and write as a crucial first step in enabling them to learn English overcome their fear of technology improve job readiness and access information and ser-vices The web-based platform allows non-literate Spanish speaking adults to access the materials any place with in-ternet access such as the public library
Conclusion
As the United Nations Educational Scientific and Cul-tural Organization (UNESCO) states in its literacy strategy literacy is about empowerment - not what literacy can do for people but rather what people can do with literacy11 This is certainly true in the United States Just ask Centro Latino student Ana Martiacutenez who says ldquoBefore I could not read the names of the streets and my husband would have to direct me on how to get around Since studying [at Centro Latino] I am able to read street names and get along on my own I can now read story books to my granddaughterI am now able to list and measure the clothes I make at the garment factory I work in I learned how to create and monitor a budget This has helped me to manage my income including monthly expenses In the past I would try to save but was not successful because I didnrsquot have a systemrdquo And Ana is not alone For every adult who becomes literate there is a story of newfound independence The transformative power of literacy im-proves the economic social and physical health of in-dividuals and their families for generations to come
Cathay Reta is a consultant who coordinates the Pro-Literacy California Initiative part of ProLiteracy the worldrsquos largest organization of adult literacy and basic education programs today Mari Riddle is President and Chief Execu-tive Officer of Centro Latino for Literacy a Los Angeles-based nonprofit dedicated to teaching literacy and provid-ing educational opportunities to Latino adult and youth who have not had the benefit of an education
34 Community Investments Fall 2011 ndash Volume 23 Issue 2
30
Real Family Income Growth by Quintile 1947‐1979 and 1979‐2009
25
2224 24
2225
1315
20
0 4
0710
01
04
00
05
‐03‐05
Lowest Second Third Fourth Highest Fifth Fifth Fifth Fifrth Fifth
1947‐1979 1979‐2009Source Economic Policy Institute analysis of US Census Bureau data
DATA SNAPSHOTReal Family Income Growth by Quintile
1947ndash1979 and 1979ndash2009Average Household Income (Post-Tax)
1979ndash2007
Source Congressional Budget OfficeSource Economic Policy Institute analysis of US Census Bureau data
Source CIA World Factbook
Gini IndexThe Gini index measures the degree of inequality in the distribution of family income in a country The lower a countryrsquos Gini index the more equal its income distribution the higher the index the greater the level of income inequality
$600
$800
$1000
$1200
$1400
ome ($00
0s in 20
07 dollars)
Average Household Income (Post‐Tax) 1979‐2007
Top 1 Top 5 Fourth 20 Bottom 20
$0
$200
$400
1979
1981
1983
1985
1987
1989
1991
1993
1995
1997
1999
2001
2003
2005
2007Av
erage Hou
seho
ld In
c o
Source Congressional Budget Office
Quarterly Features
35 Community Investments Fall 2011 ndash Volume 23 Issue 2
Economic Downturns and Inequality
More than two years into the US recovery re-searchers have started to look at how the recent recession may have impacted income inequal-
ity How does an economic crisis impact earnings and income inequality if at all What can we learn from pre-vious recessions What factors influence whether or not a financial crisis will increase inequality
Carlo V Fiorio and Catherine Saget survey the existing literature on global financial crises and find no relation-ship between crises and changes in earnings inequality (ie wage distribution) but point out that in most cases income inequality (which takes into account income from capital and social transfers) decreases after a financial crisis Their findings suggest that each countryrsquos institu-tional structure impacts how inequality changes after a financial crisis In Finland for example inequality levels remained basically unchanged despite a striking increase in unemployment from 1990-1993 which the authors attribute to a strong public benefit system that supplied generous unemployment benefits including training pro-grams In contrast the East Asian financial crisis of 1997-1998 correlated to an increase in inequality potentially due to policies enacted after the crisis that promoted eco-nomic recovery by benefitting the corporate and financial sectors while increasing poverty through cuts in social services
Using Current Population Survey data Fiorio and Saget find a minor increase in US earnings inequality but when they account for the unemployed (counting their wages as zero) the increase becomes much larger They attribute this increase in inequality to low wage workers being more likely to lose their jobs during the recession and because social transfers and the wages from replace-ment jobs are both lower than earnings received by these workers prior to the crisis
Fiorio Carlo V and Saget Catherine (2010) ldquoReducing or aggravating inequality Preliminary findings from the 2008 financial crisisrdquo International Labour Office Policy Integration Department Geneva
The Low Income Housing Tax Credit and Racial Segregation
The Low Income Housing Tax Credit (LIHTC) is an indirect Federal subsidy used to finance the devel-opment of affordable rental housing for low-income
households The program is administered by the Internal Revenue Service (IRS) and has a provision that awards de-velopers with higher tax credit allocations for siting proj-ects in Qualified Census Tracts (QCTs) which are high-poverty neighborhoods that are often populated with a high concentration of minorities Despite the success of LIHTC in increasing the supply of affordable rental units one oft-cited concern is that the program is contributing to racial segregation but is this actually the case
Keren Horn and Katherine OrsquoRegan use data from HUD and the census along with data collected on the racial composition of LIHTC tenants in three states to address this question They examine three channels through which the LIHTC could potentially affect racial segregation the siting of LIHTC units relative to other non-LIHTC units that serve low-income populations the racial composition of residents in LIHTC projects and changes in neighborhood composition in areas in which tax credit projects are built They find that LIHTC units are only slightly more likely to be located in high-minority tracts than other units occupied by near-poor and poor renters and that neighborhoods of high minority concentration experience declines in minority representation over time rather than an increase Additionally Horn and OrsquoRegan find that increases in the use of tax credits between 1980 and 2000 in metropolitan areas are associated with de-clines in racial segregation
Despite the finding that the LIHTC program on average is not associated with an increase in racial segre-gation the authors recognize that persistent racial segre-gation remains a challenge in this country They conclude that targeting criticism of the LIHTC on concerns of racial segregation may take efforts away from identifying other important areas of improvement for the program
Horn Keren and OrsquoRegan Katherine (2011) The Low Income Housing Tax Credit and Racial Segregation Furman Center for Real Estate and Urban Policy New York University Working Paper httpfurmancenterorgresearchpublicationstagsubsidized+housing
RESEARCH BRIEFS
36 Community Investments Fall 2011 ndash Volume 23 Issue 2
Quarterly FeaturesDefaults and Saving among Low-Income
Tax Filers
Previous research has demonstrated the power-ful effect that default setting can have on financial decision-making particularly in the area of 401(k)
savings behavior By simply switching the default to auto-matic enrollment requiring users to opt-out if they do not wish to save participation rates in defined contribution plans tend to increase dramatically But do the effects of this type of nudge extend to other savings programs and populations
The results of a recent study suggest that default setting does not impact savings behavior among low-income tax filers In 2009 a new initiative designed to increase retire-ment savings allowed tax filers to purchase US Savings Bonds with their federal income tax refunds and advocates supported the policyrsquos ldquosaveable momentrdquo approach Erin Todd Bronchetti Thomas Dee David Huffman and Ellen Magenheim conducted a field study at eight Volunteer Income Tax Assistance sites during the 2010 tax season to test whether default setting would affect the take up rate among low-income tax filers to receive some or all of their refunds in US Savings Bonds They find that regard-less of whether the default requires an opt-in or opt-out of the savings bond option the participation rate in the savings program is roughly nine percent The authors point out that the success of increasing saving among higher-in-come 401(k) participants through default switching should
not be automatically generalized for other policy settings particularly among lower-income populations One pos-sible explanation for why the nudge was ineffective was that 75 percent of filers indicated they already had plans for how to spend the refund Nearly 70 percent of low-income filers stated that they had trouble paying bills and only 17 percent stated they had plans to save some of their refund demonstrating the resource constraints facing this population
The authors emphasize that ldquo401(k) defaults may be powerful because they coincide with the pre-existing in-tentions to save of relatively affluent individuals To the extent that low-income filers do not have strong intentions to save at tax time defaults may have little effectrdquo One implication of these findings is that prior to implement-ing default switching interventions to impact the savings behavior of low-income individuals more needs to be done to shift their savings expectations For example matched savings programs have demonstrated that the poor can effectively alter their savings expectations and develop assets Further research is necessary to measure the impact of defaults for different populations under dif-ference scenarios
Bronchetti E Dee T Huffman D and Magenheim E (2011) When a Nudge Isnrsquot Enough Defaults and Saving among Low-Income Tax Filers NBER Working Paper 16887 httpwwwnberorgpapersw16887pdf
37 Community Investments Fall 2011 ndash Volume 23 Issue 2
DOCTOR CRA by John Olson
Dear Anxious
We know itrsquos tough not knowing what to expect from the CRA reform process but that doesnrsquot mean you canrsquot start thinking about how yoursquoll respond to the changes when they do come Itrsquos a good time to review your CRA program to make sure you are prepared to implement any changes Some things to think about
Plan to comment on any proposed changes When I hear a concern about a new rule my first question is always ldquodid you submit a commentrdquo Far too often the answer is ldquonordquo The agencies really do read all comments and want to hear about the impact of the proposed rule on your financial institution Itrsquos important for everyone with an opinion to submit a written comment Detailed instructions for submitting comments will be provided in the proposal itself
Dear Dr CRA ndash
Wersquore all waiting anxiously for word from Washington on the changes to the CRA While wersquore waiting is there anything I can do to be getting ready
Sincerely Anxiously Awaiting New Rules
Create a strategy for interpreting and implementing the changes Do you have up-to-date policies and pro-cedures for your CRA compliance program How will you amend and distribute the new procedures How will you communicate the changes to senior man-agement How will you communicate the changes to lenders branch managers and other key staff Think-ing through these questions beforehand and developing your plan can make the implementation phase more efficient and successful
Receiving new rules can be a challenge but I encour-age you to also see it as an opportunity It could be your chance to raise awareness of your CRA program in your institution to implement a strategy yoursquove been wanting to try and to re-engage your CRA stakeholders through-out the bank Use the new rules as your chance to re-evaluate your program and take it in a new direction
38 Community Investments Fall 2011 ndash Volume 23 Issue 2
EndnotesAddressing Widening Income Inequality through Community Development
1 USCensusBureau(2010)SmallAreaIncomeampPovertyEstimatesforstatesandcountieshttpquickfactscensusgovqfdstates00000html
2 CostelloD(2011April9)TheDroughtIsOver(atLeastforCEOrsquos)TheNew York TimesppBU1Onlineathttpwwwnytimescom20110410business10comphtmlpagewanted=all
3 StanfordCenterfortheStudyofIncomeandInequalityldquoWelcometoInequalitycomrdquoretrievedfromhttpwwwstanfordedugroupscspi
4 WilkinsonRampPickettK(2009) The Sprit Level Why Greater Equality Makes Societies Stronger NewYorkBloomsburyPress
5 Ibid
6 PutnamRD(2000)Bowling Alone The collapse and revival of American community NewYorkSimonandSchuster
7 SaezEampPikettyT(2003)IncomeInequalityintheUnitedState1913-1998QuarterlyJournalofEconomics118(1)1-39Updateddataavailableonlineathttpelsaberkeleyedu~saez
8 GoldinCampMargoRA(1991)ldquoTheGreatCompressionTheWageStructureintheUnitedStatesatMid-CenturyrdquoNBERWorkingPapers3817NationalBureauofEconomicResearchInc
9 KrugmanP(2007)The Conscience of a Liberal NewYorkWWNortonampCompanyInc
10 FromldquoEconomicInequalityintheUnitedStatesrdquoaspeechgivenattheCenterfortheStudyofDemocracyonNovember62006byformerFRBSFPresidentJanetYellenAvailableonlineathttpwwwfrbsforgnewsspeeches20061106html
11 FormoreontheGiniindexseetheCIAWorldFactbookathttpswwwciagovlibrarypublicationsthe-world-factbookrankorder2172rankhtml
12 Ibid
13 ForamoredetailedanalysisofthecausesoftheGreatDivergenceseeNoahT(2010September10)TheUnitedStateofInequalityRetrievedfromhttpwwwslatecomid2266025entry2266026
14 KodrzyckiY(2002)EducationalAttainmentasaConstraintonEconomicGrowthandSocialProgressEducationinthe21stCenturyMeetingtheChallengesofaChangingWorldConferenceSeries47June2002FederalReserveBankofBoston
15 KatzL(2002)DiscussionEducationalAttainmentasaConstraintonEconomicGrowthandSocialProgressEducationinthe21stCenturyMeetingtheChallengesofaChangingWorldConferenceSeries47June2002FederalReserveBankofBoston
16 BermanEliJohnBoundampZviGriliches1994ldquoChangesintheDemandForSkilledLaborwithinUSManufacturingIndustriesEvidencefromtheAnnualSurveyofManufacturingrdquoQuarterly Journal of Economics 109367-397SeealsoBresnahanFBrynjolfssonEampandHittLM(2002)InformationTechnologyWorkplaceOrganizationandtheDemandforSkilledLaborFirm-LevelEvidenceQuarterlyJournalofEconomics1171339-376
17 GoldinCampKatzL(2008)The Race between Education and Technology CambridgeMAHarvardUniversityPress
18 SourceBureauofLaborStatisticsnotseasonallyadjusted
19 WilliamsR(2011)WhoBenefitsfromTaxExpendituresTaxNotesMay22011TaxPolicyCenterhttpwwwurbanorguploadedpdf1001537-Who-Benefits-From-Expenditurespdf
20 WilsonRPersonalExemptionsandIndividualIncomeTaxRates1913-2002DataReleaseInternalRevenueServicehttpwwwirsgovpubirs-soi02inpetrpdf
21 Ibid
22 BurkhauserR(2011)PresidentialaddressEvaluatingthequestionsthatalternativepolicysuccessmeasuresanswerJournal of Policy Analysis and Management30(2)205ndash215
23 PeriG(2010)TheEffectofImmigrantsonUSEmploymentandProductiv-ityFederalReserveBankofSanFranciscoEconomicLetter2010-26httpwwwfrbsforgpublicationseconomicsletter2010el2010-26html
24 CardD(2009)ImmigrationandInequalityNBERWorkingPaperNo14683httpwwwnberorgpapersw14683
25 Ibid
26 Yellen(2006)Seenote10
27 KrugmanP(2008)TradeandWagesReconsideredBrookingsPapersonEconomicActivitySpring2008WashingtonDCBrookingsInstitutionPress
28 Ibid
29 JaumotteFLallSampPapageC(2008)RisingIncomeInequalityTech-nologyorTradeandFinancialGlobalizationIMFWorkingPaper08185httpwwwimforgexternalpubsftwp2008wp08185pdf
30 Yellen(2006)Seenote10
31 FromldquoEconomicandFinancialInclusionin2011WhatitMeansforAmeri-cansandourEconomicRecoveryrdquoaspeechgivenattheNewAmericaFoundationForumWashingtonDCJune292011byGovernorSarahBloomRaskinAvailableonlineathttpfederalreservegovnewseventsspeechraskin20110629ahtm
32 Ibid
33 HeckmanJ(September12010)LettertotheNationalCommitteeonFiscalResponsibilityandBudgetReformwwwheckmanequationorgsystemfilesFederal-Commision_9-1-2010FINAL20_3_pdf
34 Yellen(2006)Seenote10
35 AnnieECaseyFoundation(2011)PromotingOpportunityfortheNextGenerationKidsCountDataBookhttpwwwaecforg~mediaPubsInitiativesKIDS20COUNT1232011KIDSCOUNTDataBook2011KCDB_FINAL_essaypdf
36 NationalCenterforChronicDiseasePreventionandHealthPromotionStudentHealthandAcademicAchievementRetrievedfromhttpwwwcdcgovHealthyYouthhealth_and_academics
37 CommunityAffairsOfficesoftheFederalReserveSystemandTheMetropolitanPolicyProgramattheBrookingsInstitution(2006)The Enduring Challenge of Concentrated Poverty in Americahttpwwwfrbsforgcpreport
38 Formoreonplace-basedcommunitydevelopmentseetheSpring2010issueofCommunity Investmentsavailableonlineathttpwwwfrbsforgpublicationscommunityinvestments1005indexhtml
39 SpeechbyChairmanBenBernankeFebruary62007TheLevelandDistributionofEconomicWell-BeingPresentedattheGreaterOmahaChamberofCommerceOmahaNebraskahttpwwwfederalreservegovnewseventsspeechbernanke20070206ahtm
39 Community Investments Fall 2011 ndash Volume 23 Issue 2
EndnotesUnderstanding Both Sides of the Inequality Debate
1 USBureauoftheCensusIncomeintheUnitedStates2002CurrentPopulationReportsSeriesP60-221September2003p25
2 HedermanJrRampRectorR(2004)TwoAmericasOneRichOnePoorUnderstandingIncomeInequalityintheUnitedStatesBackgrounder1791August242004TheHeritageFoundation
3 GarrettT(2010)USIncomeInequalityItrsquosNotSoBadInsidetheVaultVolume14Issue1Spring2010FederalReserveBankofStLouis
4 BernsteinJMishelLBrochtC(2000)AnyWayYouCutItIncomeinequalityontheriseregardlessofhowitrsquosmeasuredEconomicPolicyInstitutehttpepi3cdnnet2a07e6f50730c16d1a_6wm6b9fcypdf
5 GarrettT(2010)Seenote3
6 BernsteinJMishelLBrochtC(2000)Seenote4
7 OkunA(1975)EqualityandEfficiencytheBigTradeoffWashingtonDCBrookingsInstitution
8 GarrettT(2010)Seenote3
9 BergAampOstryD(2011)EqualityandEfficiencyFinanceampDevelopment48(3)InternationalMonetaryFundQuintinEampSavingJ(2008)Inequal-ityandGrowthChallengestotheOldOrthodoxyEconomicLetterFederalReserveBankofDallasVol3No1January2008PerssonTampTabelliniG(1994)IsInequalityHarmfulforGrowthTheAmericanEconomicReview84(3)600-621
10 CoxMampAlmR(2008)ldquoYouAreWhatYouSpendrdquoNewYorkTimesFebru-ary102008
11 BernsteinJMishelLBrochtC(2000)Seenote4
Ties that Bind Income Inequality and Income Segregation
1 ForareviewofthisliteraturepleaseseeldquoTheEnduringChallengeofConcen-tratedPovertyinAmericaCaseStudiesfromCommunitiesAcrosstheUSrdquoTheFederalReserveSystemandtheBrookingsInstitution2008
2 ThisisnottosaythatquestionsofracialsegregationarebehindusInmanyrespectsitisdifficulttoteaseoutthedifferencesbetweenracialandeconomicsegregationgiventhestrongintersectionofraceandclassintheUnitedStatesmdashpovertyratesamongAfricanAmericansandHispanicsaretwiceashighastherateamongnon-HispanicwhitesResearchersmaintainthatthereisadistinctbutoverlappingpatternofracialandclasssegregation
3 DouglasMasseyJonathanRothwellandThurstonDomina(2009)ldquoTheChangingBasesofSegregationintheUnitedStatesrdquoTheAnnalsoftheAmericanAcademyofPoliticalandSocialScienceNovember200962674
4 Ibid
5 TaraWatson(2009)ldquoInequalityandtheMeasurementofResidentialSegre-gationbyIncomeinAmericanNeighborhoodsrdquoTheReviewofIncomeandWealthSeptember2009553
6 Ibid
7 PaulJargowsky(2003)ldquoStunningProgressHiddenProblemsTheDramaticDeclineofConcentratedPovertyinthe1990srdquoTheBrookingsInstitutionMay2003
8 ToddSwanstromColleenCaseyRobertFlackandPeterDrier(2004)ldquoPullingApartEconomicSegregationamongSuburbsandCentralCitiesinMajorMetropolitanAreasrdquoTheBrookingsInstitutionOctober2004
9 Masseyetal(2009)Watson(2009)
10 DanielLichterDomenicoParisiandMichaelTaquino(2011)ldquoTheGeog-raphyofExclusionRaceSegregationandConcentratedPovertyrdquoNationalPovertyCenterWorkingPaperSeriesMay20111116
11 Ibid
12 Swanstrometal(2004)
13 RandallEbertsGeorgeErickcekandJackKleinhenz(2006)ldquoDashboardIndicatorsfortheNortheastOhioEconomyPreparedfortheFundforOurEconomicFuturerdquoTheFederalReserveBankofClevelandWorkingPaperSeriesavailableathttpwwwclevelandfedorgresearchworkpaper2006wp06-05pdf
14 StevenRaphaelandMichaelAStoll(2010)ldquoJobSprawlandtheSuburban-izationofPovertyrdquoTheBrookingsInstitutionMarch2010
15 RobertSampson(2009)ldquoRacialStratificationandtheDurableTangleofNeighborhoodInequalityrdquoTheANNALSoftheAmericanAcademyofPoliticalandSocialScienceJanuary2009621260
16 Transcriptavailableathttpwwwfrbsforgcdinvestmentsconferenceshealthy-communities2010-washington-dc
17 JonathanRothwellandDouglasMassey(2010)ldquoDensityZoningandClassSegregationinUSMetropolitanAreasrdquoSocialScienceQuarterlyDecember2010915
18 Ibid
The Polarization of Job Opportunities in the US Labor Market Implications for Employment and Earnings
1 StatisticsrefertotheUScivilianlaborforceages16andaboveandareseasonallyadjustedSourceUSBureauofLaborStatistics(wwwblsgovaccessedon4112010)
2 ArecentstudybyCouchandPlaczekconfirmstheseresultsbutputsthelonger-termearningslossesat12to15percentCouchKampPlaczekD(2010)EarningLossesofDisplacedWorkersRevisitedAmerican Economic Review 100(1)572-589
3 SullivanDampvonWachterT(2009)JobDisplacementandMortalityAnAnalysisusingAdministrativeDataQuarterly Journal of Economics 124(3)1265-1306
4 AutorD(2010)ThePolarizationofJobOpportunitiesintheUSLaborMarketImplicationsforEmploymentandEarningsTheHamiltonProjectandtheCenterforAmericanProgressAvailableonlineathttpwwwbrook-ingsedupapers201004_jobs_autoraspx
5 AcemogluDampAutorD(2010)TechnologySkillsandWagesInOrleyAshenfelterandDavidCardeds Handbook of Labor EconomicsVol4(NorthHollandElsevier2010)(Forthcoming)
40 Community Investments Fall 2011 ndash Volume 23 Issue 2
6 AlthougheconomistswouldtypicallyviewthewagespaidtoajobasthebestsummarymeasureofthejobrsquosskillrequirementslayreadersmaytakesomeassurancethatwagesasaskillmeasurearehighlycorrelatedwithlogicalalternativessuchaseducationandexperienceMoreovertherankingofoccupationalskillsbasedoneitherwageoreducationallevelsisquitestableovertimeThustheconclusionsherearenotsensitivetotheskillmeasure(wageseducation-experience)northechoiceofbaseyearforskillranking(here1980)
7 ThereasonforusingadifferentdatasourceandtimeperiodforthisfigurefromthepriorfigureisthattheCensusdatahavelargeenoughsamplesizestobeusefulfortheoccupationlevelexercisebuttheyarelessthanidealformeasuringhourlywagesIusetheMayORGdataforhourlywageswhichareasuperiorsource
8 GoosMManningAampSalomonsA(2009)JobPolarizationinEuropeAmerican Economic Review99(2)58-63Thechoiceoftimeperiodreflectstheavailabilityofconsistentdata(unavailablepriorto1993)Therankingofoccupationsbyskilllevelisinvariantacrosscountriesasneces-sitatedbydatalimitationsTheauthorsreporthoweverthattherankingofoccupationsbywagelevelishighlycorrelatedacrossEUcountries
9 AutorDLevyFampMurnaneR(2003)TheSkillContentofRecentTechno-logicalChangeAnEmpiricalExplorationThe Quarterly Economic Journal118(4)1279-1333
10 AdjustingforinflationusingthePersonalConsumptionExpendituredefla-tortherealminimumwageinconstant2008dollarswas$750in1979$529in1989$641in1999and$547in2006and$653in2009Thustherealfederalminimumwagedeclineddramaticallybetween1979and1989Itfluctuatedmodestlyinrealtermsuntil2006whenitrosesharplyoverthreeyears
11 HamermeshD(2001)ChangingInequalityforWorkplaceAmenitiesQuar-terly Journal of Economics114(4)1085-1123PierceB(2001)Compensa-tionInequality Quarterly Journal of Economics 116(3)1493-1525PierceV(2008)ldquoRecentTrendsinCompensationInequalityrdquoWorkingPaper(BureauofLaborStatistics)
12 PierceldquoCompensationInequalityrdquoPierceldquoRecentTrendsinCompensationInequalityrdquo
13 Notablythecollegecompletionrateforthisgroupwashigherin1990(29percent)thanin2008or2008(24percentand27percent)
EndnotesCDFI Bond Opportunity of a Decade
1 OpportunityFinanceNetworkMarketConditionsReportsavailableonlineathttpwwwopportunityfinancenetstorecategoriesaspcID=29
2 SpeechbyChairmanBenBernankeonApril292011attheFederalRe-serveCommunityAffairsResearchConferenceinArlingtonVirginiahttpwwwfederalreservegovnewseventsspeechbernanke20110429ahtm
Building Literacy Skills and Transforming Lives
1 ProLiteracyTheImpactofLiteracyBasicFactsaboutLiteracyhttpwwwproliteracyorgpageaspxpid=345
2 NationalCenterforEducationStatistics(2003)NationalAssessmentofAdultLiteracyAFirstLookattheLiteracyofAmericarsquosAdultsinthe21stCenturyhttpncesedgovnaalpdf2006470pdf
3 KirschIJungeblutAJenkinsLampKolstadAl(2002)ldquoAdultLiteracyinAmericaAFirstLookattheFindingsoftheNationalAdultLiteracySurveyrdquoNationalCenterforEducationStatisticshttpncesedgovpubs9393275pdf
4 ProLiteracySeenote1
5 NationalInstitutesofHealth(October252010)ImprovingMothersrsquoLiteracySkillsMayBeBestWaytoBoostChildrenrsquosAchievementhttpwwwnichdnihgovnewsreleases102510-reading-family-incomecfm
6 CenteronanAgingSocietyLowHealthLiteracySkillsIncreaseAnnualHealthCareExpendituresby$73BillionGeorgetownUniversityhttpihcrpgeorgetowneduagingsocietypubhtmlhealthlithtml
7 CaliforniaHealthLiteracyInitiativeLowLiteracyHighRiskTheHiddenChallengeFacingHealthCareinCaliforniahttpcahealthliteracyorgpdffilesallfourpageshealthlitreportpdf
8 Ibid
9 CommunityHealthImprovementPartnersWhenWordsGetintheWayACollaborativePlantoAddressHealthLiteracyinSanDiegoCountyhttpwwwliteracysandiegoorgpdfHealthLiteracyReport_FINALpdf
10 CreticosPSchultzJBeelerABallE(2006)TheIntegrationofIm-migrantsintheWorkplaceTheInstituteforWorkandtheEconomy
11 UNESCOLiteracyStrategyhttpwwwunescoorgneweneducationthemeseducation-building-blocksliteracystrategy
41 Community Investments Fall 2011 ndash Volume 23 Issue 2
Free sub
scriptio
ns an
d ad
ditio
nal co
pies are
available u
po
n req
uest fro
m th
e Co
mm
un
ity D
evelopment D
epartment Federal R
eserve Bank
of San Francisco 101 Market Street San Francisco
California 94105 or call (415) 974-2765
Change-of-address and subscription cancellations
should be sent directly to the Com
munity D
evelop-m
ent Departm
ent Please include the current mail-
ing label as well as any new
information
The views expressed are not necessarily those
of the Federal Reserve B
ank of San Francisco or the Federal R
eserve System M
aterial herein may
be reprinted or abstracted as long as Com
munity
Investments is credited Please provide Laura C
hoi in the C
omm
unity Developm
ent Departm
ent with
a copy of any publication in which such m
aterial is reprinted
Fed
eral reserve B
ank o
F san F
rancisco
101 MARKET STREET
SAN FRAN
CISCO CA 94105
ADD
RESS SERVICE REQU
ESTED
AU 10252

Addressing Widening Income Inequality through Community DevelopmentBy Laura Choi
The median annual household income in the US is slightly over $500001 In contrast the highest paid CEO in the US earned $845 million last year a factor of roughly 1700 times the median (and that was for only nine months of work)2 To
compare these two figures and decry income inequality in America is an oversimplification of a highly complex issue But this comparison hints at a growing divide in our country where a relatively small group of people controls a relatively large share of the incomemdashthe top one percent of Americans control nearly a quarter of all the countryrsquos income the highest share controlled by the top one percent since 19283 The ex-istence of income inequality is accepted as a byproduct of capitalism where the market rewards individuals for their varying levels of produc-tivity but how much is too much And should we be concerned with the apparent rise in income inequality
Community development practitioners are all too familiar with the effects of poverty but less effort has been given to understanding the bigger picture of income inequality Inequality exacts high social costs across all income groups Emerging research suggests that crime teen pregnancy poor educational performance drug use obesity mental illness and lower life expectancy are positively correlated with income inequality (regardless of the overall level of income in an area)4 As Richard Wilkin-son and Kate Pickett write in their book The Spirit Level ldquoThe problems in rich countries are not caused by the society not being rich enough (or even by being too rich) but by the scale of material differences between peoplehellipWhat matters is where we stand in relation to others in our own societyrdquo5 In addition rising inequality has been linked to declining social capital and civic engagement In his book Bowling Alone Robert Putnam explains ldquoCommunity and equality are mutually reinforcinghellip In terms of the distribution of wealth and income America in the 1950s and 1960s was more egalitarian than it had been in more than a centuryhellip [T]hose same decades were also the high point of social connectedness and civic engagementhellip Conversely the last third of the twentieth century was a time of growing inequality and eroding social capitalrdquo6
Undoubtedly a highly inequitable distribution of income is most troublesome for those with the least understanding and addressing in-equality is thus an important component of improving the lives of low- and moderate-income (LMI) individuals The topic of income inequality is notoriously thorny as it mixes elements of history politics economics and philosophy but this article aims to untangle some of these issues and consider them through a community development lens
The Great Divergence
Figure 1 shows the income share of the top decile of earners over the past century based on income tax data analyzed by economists Thomas Piketty and Emmanuel Saez7 From the mid-1920rsquos until the early 1940rsquos income was highly concentrated among top earners with the top decile earning roughly 45 percent of total income However a drastic shift occurred during World War II Economists Claudia Goldin and Robert Margo dubbed this period the ldquoGreat Compressionrdquo in reference to the drastic flattening of the wage structure8 According to Goldin and Margo this period saw a rapid increase in the demand for unskilled labor at the same time that the supply of educated labor was expanding bring-ing wages across the labor market closer together The income share of
Special Focus Income Inequality
3 Community Investments Fall 2011 ndash Volume 23 Issue 2
the top decile stabilized around 33 percent following the Great Compression and with less income concentrated at the top a strong middle class flourished throughout the 1940rsquos and into the late 1970rsquos However the shared prosperity of the midcentury period gave way to a rapid rise in income inequality beginning in the 1980rsquos a period economist Paul Krugman refers to as the ldquoGreat Divergencerdquo9
Alternative measures of income inequality support the notion of a Great Divergence Figure 2 shows the trajec-tory of real hourly wages for various earners since 1973 demonstrating that those at the top of the earning scale saw their wages rise much more rapidly than those at the bottom Real hourly wages of those in the 90th percen-tile where most people have college or advanced degrees rose by 30 percent or more while wages at the 50th per-
centile and below where many people have at most a high school diploma rose by only 5 to 10 percent10 Another commonly used tool to examine income inequal-ity is the Gini index which is a statistical measure of the inequality of a distribution The Gini index ranges from a value of 0 to 1 when applied to income distributions the lower the Gini index the more equal the income distri-bution as the index rises so too does income inequality (a value of 1 would mean that a single person earns all of the income)11 Figure 3 shows the Gini index for US households over the past forty years and demonstrates that income inequality has been increasing fairly consis-tently over time To provide some global context consider that the most equitable societies (Sweden Hungary and Norway) presently rank in the low 02s the US at close to 047 is on par with the Ivory Coast Cameroon and Jamaica in terms of equitable income distribution12
What Caused the Divide
But how exactly did this rise in income inequality come about The causes of the Great Divergence are wide ranging and interwoven as a result there is no singular answer to this question13 However one of the most influ-ential determinants of labor market outcomes and wages is education Figure 4 shows the differences in the growth of real wages over time by educational attainment Since 1973 real wages have risen about 20 percent for those with college or advanced degrees while they have remained flat for high school graduates and fallen about 15 percent for those with less than a high school education The US population has increased their overall schooling over the past 30 years with a greater share of the total popula-tion graduating from high school and college however much of the increase in schooling since the 1970s is due to the dying out of older generations with comparatively
Source US Census Bureau Current Population Survey Annual Social and Economic Supplements
Figure 3 Gini Index for US Households 1967ndash2009
Source Economic Policy Institute
Figure 2 Change in Real Hourly Wages for Select Percentiles 1973ndash2007
(all workers normalized 1973=100)
4 Community Investments Fall 2011 ndash Volume 23 Issue 2
110
115
120
125
130
135
140
Figure 2 ‐ Real Hourly Wages for Select Percentiles 1973 ‐ 2007(all workers normalized 1973=100)
95th
90th
80th
90
95
100
105
110
1973 1978 1983 1988 1993 1998 2003
50th
20th
10th
Source Economic Policy Institute2007
049Figure 3 ‐ Gini Index for US Households 1967 to 2009
047
045
0 41
043
039
041
037
039
1967
1969
1971
1973
1975
1977
1979
1981
1983
1985
1987
1989
1991
1993
1995
1997
1999
2001
2003
2005
2007
2009
Source US Census Bureau Current Population Survey Annual Social and Economic Supplements
25
30
35
40
45
50
1917
1922
1927
1932
1937
1942
1947
1952
1957
1962
1967
1972
1977
1982
1987
1992
1997
2002
2007Sh
are
of to
tal i
ncom
e go
ing
to to
p 10
Fig 1 Top Decile Income Share in the US 1917-2008
Source Piketty and Saez (2010) Income defined as market income including capital gains In 2008 top decile includes all familieswith annual income above $109062
Source Piketty and Saez (2010)Income defined as market income including capital gains In 2008 top decile includes all families with annual income above $109062
Figure 1 Top Decile Income Share in the US 1917ndash2008
little education rather than steadily growing educational attainment among younger generations14 This slowdown of educational progress across successive generations coupled with shifting demographics (the aging of the baby boomers and the labor market entry of the smaller baby bust cohorts) has resulted in a relatively smaller supply of skilled labor relative to previous decades15 At the same time the rise in the use of technology across almost all sectors of the economy has resulted in increased demand for skilled labor16 Economists Lawrence Katz and Claudia Goldin argue that the educational system has failed to produce an adequate supply of skilled labor to keep up with the pace of technological change over the past 30 years17 In contrast remember that the Great Compres-sion that took place in the early 1940rsquos was essentially a reversal of this situation where skilled labor was plentiful at a time when unskilled labor was in demand flatten-ing wages across the labor market Today employers are competing to hire highly skilled workers from a limited pool creating a wage premium for those with better train-ing and education the result is the widening income gap across education groups In addition consider the impact of educational attainment on employability in Septem-ber 2011 the unemployment rate for those without a high school degree was 13 percent but for those with a bach-elorrsquos degree the unemployment rate was 42 percent18
In addition to the decline in educational attainment researchers have explored other potential causes for the rise in income inequality One hotly debated topic is tax policy and the redistribution of income Higher-income households pay more taxes but also have greater access to special tax breaks more than 90 percent of the tax savings from preferential tax rates on long-term capital gains and qualified dividends go to taxpayers in the top quintile of the income distribution as do three-fourths of
the savings from itemized deductions19 In addition tax rates for the top earners have fallen since 1980 from the 1940rsquos through the end of the 1970rsquos marginal rates of 70 ndash 90 percent were imposed on the highest income bracket but this figure has since decreased to about 40 percent20 However most of the value of tax credits goes to house-holds in the bottom four quintiles nearly 80 percent of nonrefundable credits and more than 95 percent of refund-able credits benefit those households21 Richard Burkhaus-er of Cornell University argues that the inclusion of trans-fer income such as Social Security and TANF paints a more complete picture of the financial resources available to a household than wages and taxable income alone Burkhauser finds that after factoring in taxes and transfers the financial resources available to the bottom quintile of the population increased almost 15 percent from 1979 (the top quintile saw growth of almost 50 percent)22 The debate around tax policy is highly complex and there is no clear answer about the extent to which it has caused income in-equality but itrsquos clear that public policy plays an important role in addressing income inequality
Taking a more international perspective immigration and globalization are also thought to have an impact on labor markets and wages and thus inequality Letrsquos first consider immigration Despite the popular notion that immigrants reduce wages and opportunities for native workers research suggests that immigrants expand the economyrsquos productive capacity by stimulating invest-ment and promoting specialization23 Economist David Card argues that the impact of immigration on the relative wages of US natives is small suggesting instead that im-migration has affected overall wage inequality because of the concentration of immigrants in the tails of the skill dis-tribution24 Card estimates that immigration accounts for just a small sharemdashabout 5 percentmdashof the rise in overall US wage inequality between 1980 and 200025 Global-ization through an increase in international trade and out-sourcing of employment across various industries has also been widely blamed for job losses and depressed wages The US tends to export goods that rely on skilled labor and to import goods that rely more heavily on unskilled labor fueling the demand for skilled labor and reducing the demand for less-skilled workers (thereby driving wages
Today employers are competing to hire highly skilled workers from a limited pool creating a wage premium for those with better training and education the result is the widening income gap across education groups
Source Economic Policy Institute
Figure 4 Change in Real Hourly Wages by Education 1973ndash2007
(all workers normalized 1973=100)
5 Community Investments Fall 2011 ndash Volume 23 Issue 2
130
Figure 4 ‐ Change in Real Hourly Wages by Education 1973 ‐ 2007(all workers normalized 1973=100)
120
130Advanced Degree
110College
100
Some College
90High School
80Less than High School
70
1973 1976 1979 1982 1985 1988 1991 1994 1997 2000 2003 2006Source Economic Policy Institute
Special Focus Income Inequality
even further apart)26 Imports of manufactured goods from developing countries more than doubled as a percentage of US gross domestic product from slightly over two percent in 1990 to close to 45 percent in 200627 This rapid growth of trade has likely had significant distributional effects but there is insufficient data to quantify the effect28 A recent paper by IMF researchers Jaumotte Lall and Papageor-giou supports the notion that trade globalization increases income inequality but interestingly the authors conclude that globalization and technological changes increase the returns on human capital underscoring the importance of education and training in both developed and developing countries in addressing rising inequality29
This is by no means a complete discussion of the causes of income inequality Other considerations include the decline of organized labor the fall of the real value of the minimum wage and the rapid growth of incomes at the very top of the distribution (the so-called super-stars such as athletes CEOs and highly compensated finance professionals)30 But addressing widening income inequality requires us to take the next step beyond identi-fying causesmdashwe need to think critically about near- and long-term solutions for building financial resources and opportunities for LMI communities
The Role of the Community Development Field
Federal Reserve Governor Sarah Bloom Raskin recent-ly pointed out that ldquoInequality is destabilizing and under-mines the ability of the economy to grow sustainably and efficientlyrdquo31 She went on to say
[Inequality] is associated with increases in crime profound strains on households lower savings rates poorer health outcomes and diminished levels of trust in people and institutions All of these forces drag down maximum economic growth and are anathema to the social progress that is part and parcel of such growth These forces also bring people closer to being ldquoscammedrdquo or becoming vulnerable to financial schemes that promise quick and easy fixes Finding ways to help more Americans safely grow their incomes and net worth in real terms arguably diminishes the destructive influence of income inequality by giving everyone a more secure footing in the economy and the same kind of flexibility and choice available to the more affluent32
When framed in this way the role of the communi-ty development field in addressing income inequality is clearmdashto help LMI communities safely grow their incomes and access greater economic security and opportunity This requires a two-fold approach The first is to tend to the
immediate needs of low-resource households by providing supports that help them earn and keep as much income as possible in the near-term This includes traditional com-munity development initiatives such as the provision of affordable housing access to affordable financial services workforce development and efforts to build savings
The second approach is to address the broader set of factors that influence the long-term earning potential and productivity of LMI individuals with a particular focus on the next generation of workers Nobel Laureate James Heckman argues that the best way to create greater pro-ductivity and prosperity is to achieve better outcomes for children33 This begins with major investments in educa-tion and human capital development As previously dis-cussed the decline in educational attainment and the undersupply of highly skilled workers is responsible for a fair share of the growth in income inequality Janet Yellen former President of the Federal Reserve Bank of San Fran-cisco and current Vice Chair of the Board of Governors of the Federal Reserve System pointed to the importance of education for addressing inequality saying ldquoImprove-ments in education are an imperative for reducing in-equality and an easily justifiable investment given its high social returnrdquo34 Thus increasing the scale and effective-ness of educational interventions is more important than ever Such efforts include early childhood education in-creasing high school graduation rates or asset building programs to increase college affordability The importance of fostering achievement among low-income children cannot be overstated A recent report on the wellbeing of American children by the Annie E Casey Foundation concluded ldquoChildren who grow up in low-income fami-lies are less likely to successfully navigate lifersquos challenges and achieve future success The younger they are and the longer they are exposed to economic hardship the higher the risk of failurerdquo35
The community development field can also tackle issues that indirectly impact individual achievement For example poor health can significantly impair school and job performance thereby impacting earnings and op-portunities for advancement36 The emerging connection between health and community development provides an opportunity for the field to promote better health out-comes among LMI populations thereby maximizing the earning potential of education and work related activities (to learn more about the Federal Reserve Bank of San Fran-ciscorsquos Healthy Communities initiative see httpwwwfrbsforgcdinvestmentsconferenceshealthy-communi-ties) Another example is the impact that ldquoplacerdquo can have on an individualrsquos achievement and earning potential So-cioeconomic conditions in very poor neighborhoods are associated with more limited opportunities for residents including lack of access to high-quality schools fewer
6 Community Investments Fall 2011 ndash Volume 23 Issue 2
Data methodology
Changes in inequality over time are often reported based on the use of income data from the Census Bureau which ranks households from highest to lowest income then divides society into five groups and determines the share of total income received by each quintile1 The Census quintiles contain unequal number of persons2 Comparison of these quintiles over time shows that wealthier households have experienced greater income gains relative to poorer households However critics argue that this approach leads to an overstatement of the problem because the census statistics provide only a snapshot of income distribution at a single point in time and do not reflect that households may move into different income quintiles over time3 Thus a comparison of quintiles over time means compar-ing incomes of different people at different stages in their earnings profile However others argue that the Census data is appropriate for observing trends in income distribution and whether the overall societal distribution of income has changed over time4
Debate also exists about the appropriate definition for household income The Census Bureaursquos official definition of income does not include non-cash resources such as subsidies for housing food and medical care for low-income households Some argue that the exclusion of such noncash resources thus overstates the problem of income inequal-ity5 However other studies have found persistent growth in income inequality even after adjusting for alternative income sources such as transfers and noncash resources6
Efficiency and economic growth
In 1975 Yale economist Arthur Okun introduced the idea of the ldquoleaky bucketrdquo referring to the efficiency loss that occurs when money is transferred through taxation7 The problem of the leaky bucket creates an inverse relationship between equality and effi-ciency which Okun referred to as ldquothe Big Tradeoffrdquo In addition to the problem of efficiency loss another traditional argument is that inequality is a byproduct of a well functioning capitalist economy and that un-constrained opportunity encourages innovation and entrepreneurship and therefore economic growth8 However research over the past 20 years has chal-lenged this assumption suggesting that inequality and economic growth are inversely related and that inequality may actually ldquoharmrdquo growth9
Consumption and quality of life for the poor
Some argue that consumption is a better indica-tor of economic well being than income and that todayrsquos lower-income households are able to achieve greater consumption than ever before suggesting that the gap between rich and poor is not as severe as imagined10 For example the cost of consumer goods such as televisions and microwaves has fallen dramatically over time allowing more low-income households to purchase them and ldquokeep uprdquo with higher income households However critics of this consumption approach argue that while the cost of nonessential consumer goods has fallen over time the costs of essential items such as housing trans-portation and healthcare have increased over time making the relative hardship greater11
7 Community Investments Fall 2011 ndash Volume 23 Issue 2
jobs and social and economic isolation where residents are physically cut-off from the larger economy and com-munity3738 Community development efforts to address concentrated poverty at the neighborhood level can thus help LMI individuals access important skill building re-sources and earning opportunities
While these community development efforts are aimed at those with the least they have important impli-cations across all levels of the income distribution Federal Reserve Chairman Ben Bernanke summed it up this way ldquoThe challenge for policy is not to eliminate inequality per
se but rather to spread economic opportunity as widely as possible Policies that focus on education job training and skills and that facilitate job search and job mobility seem to me to be a promising means for moving toward that goal By increasing opportunity and capability we help individuals and families while strengthening the na-tionrsquos economy as wellrdquo39 From a community develop-ment perspective addressing widening income inequal-ity is about helping LMI communities reach their full potential thereby improving their capacity to participate in and contribute to the broader economy
Special Focus Income Inequality
Understanding Both Sides of the Inequality DebateWhile almost everyone can agree that poverty is undesirable the issues surrounding income inequality are much less clear-cut The debate involves complex issues but developing an understanding of both sides is an important first step in analyzing the available research and developing potential policy responses The following is a brief summary of some of the main points of contention in the debate around rising income inequality
Introduction
Income inequality in the United States has risen con-siderably over the past several decades However it is not just widening inequality that matters Recent research shows that as income inequality rises the
wealthy and poor increasingly sort into different neigh-borhoods concentrating in communities that differ con-siderably from one another This particular geographic expression of income inequality is of concern because there are negative outcomes for those at the bottom end of the income range that are substantial and intertwined Numerous studies show that communities of concentrated poverty contend with substandard schools and limited job opportunities as well as higher rates of disease crime and violence than their more affluent counterparts1 These types of neighborhood effects mean that both quality of life and life chances are markedly diminished for those
Ties that Bind Income Inequality and Income Segregation By Naomi Cytron
living and growing up in communities composed primar-ily of low-income households
This article summarizes some recent research on pat-terns of residential segregation by income and then ex-plores implications for neighborhoods regions and the community development field
Research on Income Segregation
The term ldquosegregationrdquo most commonly evokes issues of race However recent research examining US residen-tial patterns makes the argument that the basis of segre-gation has shifted over time from race to income2 In his research Douglas Massey of Princeton University notes that during the first two thirds of the century residential racial segregation at state and county levels fell while in-creasing at the census tract (which commonly serves as a proxy for neighborhood) level But starting in the 1970s
8 Community Investments Fall 2011 ndash Volume 23 Issue 2
this pattern began to change with black-white segrega-tion at the census tract level diminishing markedly during the last three decades of the 20th century These decades also saw significant increases in both Asian and Hispanic populations and while Hispanic isolation began to ap-proach that of African Americans both Asian and His-panic populations remained relatively evenly distributed across US metropolitan areas3 Massey attributes these patterns to the relative openness of housing markets fol-lowing social and legislative changes brought about by the Civil Rights era
During the same period though Masseyrsquos research shows that residential income segregation rose significant-ly with the wealthy and poor increasingly sorting into dif-ferent neighborhoods He finds that in 1970 the average poor family lived in a census tract that was 14 percent poor by 1990 this percentage doubled to 28 percent Affluence also grew more concentrated with the average wealthy family living in a neighborhood that was 31 percent afflu-ent in 1970 and 36 percent affluent in 19904
Examining census data from this same period Tara Watson of Williams College and the National Bureau of Economic Research finds that economic segregation rose most steeply during the 1980s During this decade ldquomet-ropolitan residents systematically changed the income rank groups with whom they shared a neighborhood Perhaps not coincidentally the decade was also one of sharply growing inequalityrdquo5 Indeed her research shows that a one standard deviation rise in income inequality is associated with a 04-09 standard deviation rise in income segregation6 In other words there is very strong relationship between rising income inequality and in-creasing spatial segregation by income
By the same token research shows that the economic boom of the 1990s buffered trends of growing income segregation to some extent there was a dramatic drop in concentrated poverty during this decade with the number of people living in neighborhoods with a poverty rate above 40 percent declining by 24 percent7 Addition-ally while the per capita income gap between central cities and suburbs had widened from 1970 to 1990 it held steady during the 1990s8 This shift though fell short of a dramatic comebackmdashclass segregation was still higher in 2000 than it was in 1970 with over 85 percent of the metropolitan population living in areas that were more segregated by income in 2000 than they had been 30 years earlier9
The first decade of this century has been marked by economic fluctuation and distress and preliminary analy-sis of the recent American Communities Survey data indi-cates that spatial disparities in income are once again on the rise One study found that the number of high poverty placesmdashwhether defined as places with poverty rates
exceeding 20 30 or 40 percentmdashincreased markedly from 2000-201010 Notably the number of places with poverty rates above 40 percent returned to the number observed at the end of the 1980s The research also shows that poornon-poor segregation rose in both metropolitan and non-metropolitan areas The authors call this trend a ldquonew economic balkanization of residence patternsrdquo11
Implications for Neighborhoods and Regions
As noted above increasing spatial separation of income groups is of concern because there are long term and multiplicative negative consequences for residents of low-income neighborhoods Areas of concentrated disadvantage often struggle with public and private dis-investment resulting in blight few opportunities for em-ployment high levels of crime and elevated exposure to health risks Where income inequality is expressed not just on a neighborhood-by-neighborhood basis but at a larger geographic scale the effects can reinforce dys-functional neighborhood-level outcomes For instance suburban areas that accommodate primarily high-income residents benefit from a larger tax base that can better support public services like safety infrastructure and schools At the same time the outmigration of wealthy residents from central cities to suburban areasmdashwhich triggers the exodus of jobs and retail outlets as wellmdashresults in a shrinking tax base and often a low level of political clout which undercuts poorer areas in the urban core in a number of ways Perhaps most critically in terms of economic opportunity over the long run public school systems in central cities end up not having the resources to attract and retain skilled teachers or adequately meet the needs of students who may enter school underpre-pared resulting in low academic achievement and high drop-out rates
These conditions have long-term consequences not only for individual economic opportunity but for regional productivity as well As noted by Todd Swanstrom and his coauthors in their analysis of economic segregation at the metropolitan level ldquospatial inequalities can set in motion a snowball effect that harms regional competitiveness by fueling the abandonments of older parts of the region accelerating sprawl and its many costs and making it more difficult for the region to form the broad coalitions necessary to address these problemsrdquo12 On the flip side income equality can be a key ingredient for economic growth In a paper published by the Federal Reserve Bank of Cleveland researchers analyzed economic growth in 118 regions in the 1994ndash2004 period and found that income equalitymdashidentified as one of eight factors relat-ing to regional growthmdashwas positively correlated with both employment and output13
9 Community Investments Fall 2011 ndash Volume 23 Issue 2
Special Focus Income Inequality
Implications for the Community Development Field
Given the strong relationship between income and place the community development response must be sen-sitive to both neighborhood and regional context as well as structural factors that drive income segregation These include a metropolitan arearsquos own demographic social political and industrial histories as well as federal and local policies that influence the accessibility of housing of different size and cost The intersections between race and class also cannot be ignored as the legacies of explic-itly racial housing policies as well as other discriminatory practices that limit mobility continue to affect income segregation Additionally job decentralization has con-tributed to the geography of inequality most employment is now located more than five miles from central cities making it difficult for central city residents to find and maintain employment Even in metropolitan areas where low-income households have moved to the suburbs the poor generally live in communities that have below average numbers of jobs The race-class intersection is evident here 70 percent of poor white suburbanites reside in jobs-rich areas while only 59 percent of poor blacks and 55 percent of poor Latinos do14
Community development interventions then must be inclusive enough to tackle the multifold and reinforcing links between poverty and place what Robert Sampson of Harvard University refers to as a durable tangle15 In large part responding to this tangle requires the coordination of a variety of interventions at various geographic scales and across diverse sectors These include public and private decisions that guide allocations of resources for educa-tion health and skill building Additionally local and regional policies that influence public transit provision which matters for access to work and other non-neighbor-hood based activities and amenities and density which impacts housing affordability (see ldquoWhat does zoning have to do with itrdquo below) affect outcomes for low-in-come households
10 Community Investments Fall 2011 ndash Volume 23 Issue 2
Encouragingly geographically targeted cross-sector strategies are receiving increased attention and funding from both the public and private sector The Obama Ad-ministration has explicitly endorsed ldquoplace-basedrdquo cross-sector policy seen through programs like the Promise and Choice Neighborhoods Initiatives which aim to bundle localized investments in arenas including housing edu-cation transportation and workforce development Addi-tionally a number of community development intermedi-aries and private foundations have shifted their community development strategies from ldquoscattershotrdquo approaches to more focused place-based initiatives For example Living Cities a collaborative of 22 foundations and financial in-stitutions recently launched their ldquoIntegration Initiativerdquo which focuses on bringing together decision-makers across sectors and jurisdictions in a region or metro area to align their work toward transforming local and regional systems including transportation health housing and jobs
Conclusion
In her keynote at last yearrsquos Healthy Communities Con-ferencemdashan event co-hosted in Washington DC by the Federal Reserve Board of Governors Federal Reserve Bank of San Francisco and the Robert Wood Johnson Founda-tion to explore how the health and community develop-ment sectors can collaborate to promote better health outcomes for low-income people and communitiesmdashMelody Barnes Director of the Domestic Policy Council offered the White Housersquos rationale for multidisciplinary approaches for addressing inequities ldquoPeople donrsquot wake up in the morning and say lsquoIrsquom going to have an education day today and tomorrow Irsquom going to have a transportation dayrsquo For families all of these pieces are integrated so we have to start thinking about our policies and our approach in that same integrated fashion So for us what wersquore trying to insure is that the days of thinking and working and talking in silos is in fact overrdquo16 Indeed we should all work toward breaking down the silos that hamper our ability to untie the pernicious knots that continue to limit opportunity for low-income communities
What does zoning have to do with it
Recent research aims to tease out some of the underlying causes of economic segregation Jonathan Rothwell and Douglas Massey hypothesize that certain types of zoning promote income segregation by limiting the ability of developers to produce affordable multifamily housing in certain locations They find that the setting of maximum allowable densities of residential construction has significant effects in determining the level of class segregation and change in segregation over time ldquosystematically channeling low-income households to different locations than their affluent counterpartsrdquo17 They go on to note that ldquoalthough markets allocate people to housing based on income and price political decisions allocate housing of different prices to different neighborhoods and thereby turn the market into a mechanism of both class and racial segregationrdquo18 Their research indicates that land-use policies which are not typically thought of as having socio-economic effects might indeed be mechanisms that generate and reinforce patterns of income segregation Altering zoning policy then might serve to mitigate in-equalities by enabling development of affordable housing in higher-income neighborhoods where the amenities might better support economic opportunity
Between December 2007 when the US housing and financial crises became the subject of daily news headlines and July 2011 the civilian un-employment rate nearly doubled to 91 percent
from 50 percent while the employment-to-population ratio dropped to 581 percent from 627 percentmdashthe lowest level seen in more than 25 years
Job losses of this magnitude cause enormous harm to workers families and communities1 For instance a classic study by economists Lou Jacobson Robert LaLonde and Daniel Sullivan found that workers involuntary displaced by plant downsizings in Pennsylvania during the severe recession of the early 1980s suffered annual earnings
The Polarization of Job Opportunities in the US Labor Market Implications for Employment and Earnings By David Autor
losses averaging 25 percent even six years following dis-placement2 Studying the same group of workers with the benefit of 15 more years of data labor economists Daniel Sullivan and co-author Till Von Wachter3 show that the nonmonetary consequences of job losses are also severe involuntarily job displacement approximately doubled the short-term mortality rates of those displaced and reduced their life expectancy on average by one to one and a half years These studies suggest that the costs of the Great Re-cession will be multifaceted and persistent
Moreover the key challenges facing the US labor marketmdashalmost all of which were evident prior to the Great Recessionmdashwill surely endure These challenges
11 Community Investments Fall 2011 ndash Volume 23 Issue 2
Special Focus Income Inequality
are two-fold The first is that for decades now the US labor market has experienced increased demand for skilled workers During times like the 1950s and 1960s a rising level of educational attainment kept up with this rising demand for skill But since the late 1970s and early 1980s the rise in US education levels has not kept up with the rising demand for skilled workers and the slow-down in educational attainment has been particularly severe for males The result has been a sharp rise in the inequality of wages
A second equally significant challenge is that the struc-ture of job opportunities in the United States has sharply polarized over the past two decades with expanding job opportunities in both high-skill high-wage occupations and low-skill low-wage occupations coupled with con-tracting opportunities in middle-wage middle-skill white-collar and blue-collar jobs Concretely employment and earnings are rising in both high-education professional technical and managerial occupations and since the late 1980s in low-education food service personal care and protective service occupations Conversely job op-portunities are declining in both middle-skill white-col-lar clerical administrative and sales occupations and in middle-skill blue-collar production craft and operative occupations The decline in middle-skill jobs has been detrimental to the earnings and labor force participation rates of workers without a four-year college education and differentially so for males who are increasingly con-centrated in low-paying service occupations
This article is a summary of an in-depth analysis of the state of the US labor market over the past three decades commissioned by the Hamilton Project at the Brookings Institution and the Center for American Progress4 This analysis revealed key forces shaping the trajectory of the polarization of the US job market including the slowing rate of four-year college degree attainment among young adults particularly males shifts in the gender and racial composition of the workforce changes in technology in-ternational trade and the international offshoring of jobs which affect job opportunities and skill demands and changes in US labor market institutions affecting wage setting including labor unions and minimum wage leg-islation The causes and consequences of these trends are discussed below and have important implications for the US labor market and income inequality more broadly as the nation works towards economic recovery
Employment growth is ldquopolarizingrdquo into relatively high-skill high-wage jobs and low-skill low-wage jobs
Long-term shifts in labor demand have led to a pro-nounced rdquopolarizationrdquo of job opportunities across occu-pations with employment growth concentrated in rela-
tively high-skill high-wage and in low-skill low-wage jobsmdashat the expense of ldquomiddle-skillrdquo jobs This polariza-tion is depicted in Figure 1 which plots the change in the share of US employment in each of the last three decades for 326 detailed occupations encompassing all of US employment4
Figure 1 Smoothed Changes in Employment by Occupational Skill Percentile 1979ndash2007
Figure 1 Smoothed Changes in Employment by Occupational Skill Percentile 1979ndash2007
ⴀ
ⴀ㔀
㔀
㔀
㔀
㐀 㘀 㠀
䌀栀愀渀
最攀 椀渀
䔀洀
瀀氀漀礀
洀攀渀
琀 匀栀
愀爀攀
匀欀椀氀氀 倀攀爀挀攀渀琀椀氀攀 爀愀渀欀攀搀 戀礀 漀挀挀甀瀀愀琀椀漀渀愀氀 洀攀愀渀 眀愀最攀⤀
䘀椀最甀爀攀 ⴀ 匀洀漀漀琀栀攀搀 䌀栀愀渀最攀猀 椀渀 䔀洀瀀氀漀礀洀攀渀琀 戀礀 伀挀挀甀瀀愀琀椀漀渀愀氀 匀欀椀氀氀 倀攀爀挀攀渀琀椀氀攀Ⰰ 㤀㜀㤀ⴀ 㜀
㤀㜀㤀ⴀ㤀㠀㤀
㤀㠀㤀ⴀ㤀㤀㤀
㤀㤀㤀ⴀ 㜀
Source Census IPUMS 5 percent samples for years 1980 1990 and 2000 and US Census American Community Survey 2008
These occupations are ranked on the x-axis by skill level from lowest to highest where an occupationrsquos skill level (or more accurately its skill rank) is approximated by the average wage of workers in the occupation in 19805 The y-axis of the figure corresponds to the change in em-ployment at each occupational percentile as a share of total US employment during the decade Since the sum of shares must equal one in each decade the change in these shares across decades must total zero Consequent-ly the figure measures the growth in each occupationrsquos employment relative to the whole
This figure reveals a ldquotwistingrdquo of the distribution of employment across occupations over three decades which becomes more pronounced in each period During the 1980s (1979 to 1989) employment growth by oc-cupation was almost uniformly rising in occupational skill occupations below the median skill level declined as a share of employment while occupations above the median increased In the subsequent decade this uni-formly rising pattern gave way to a distinct pattern of po-larization Relative employment growth was most rapid at high percentiles but it was also modestly positive at low percentiles (10th percentile and down) and modestly negative at intermediate percentiles
12 Community Investments Fall 2011 ndash Volume 23 Issue 2
ⴀ
ⴀ㔀
㔀
㔀
㔀
㐀 㘀 㠀
䌀栀愀渀
最攀 椀渀
䔀洀
瀀氀漀礀
洀攀渀
琀 匀栀
愀爀攀
匀欀椀氀氀 倀攀爀挀攀渀琀椀氀攀 爀愀渀欀攀搀 戀礀 漀挀挀甀瀀愀琀椀漀渀愀氀 洀攀愀渀 眀愀最攀⤀
䘀椀最甀爀攀 ⴀ 匀洀漀漀琀栀攀搀 䌀栀愀渀最攀猀 椀渀 䔀洀瀀氀漀礀洀攀渀琀 戀礀 伀挀挀甀瀀愀琀椀漀渀愀氀 匀欀椀氀氀 倀攀爀挀攀渀琀椀氀攀Ⰰ 㤀㜀㤀ⴀ 㜀
㤀㜀㤀ⴀ㤀㠀㤀
㤀㠀㤀ⴀ㤀㤀㤀
㤀㤀㤀ⴀ 㜀
Fast forward to the period 1999 to 2007 In this in-terval the growth of low-skill jobs comes to dominate the figure Employment growth in this period was heavily concentrated among the lowest three deciles of occupa-tions In deciles four through nine growth in employment shares was negative In the highest decile of occupations employment shares were flat Thus the disproportionate growth of low-education low-wage occupations becomes evident in the 1990s and accelerates thereafter
Notably this pattern of employment polarization has a counterpart in wage growth This may be seen in Figure 2 which plots changes in real hourly wages relative to the median by wage percentile for all US workers over two time periods 1974 to 1988 and 1988 to 20066 In the 1974 through 1988 period wage growth was consistently increasing in wage percentile wages at percentiles above the median rose relative to the median while wages below the median fell From 1988 forward however the pattern was U-shaped Wages both above and below the median rose relative to the median
Figure 2 Percent Changes in Male and Female Hourly Wages Relative to the Median
ⴀ㔀
ⴀ
ⴀ㔀
㔀
㔀
㔀 㔀 㔀 㘀㔀 㠀 㤀㔀
倀攀爀挀
攀渀琀 䌀
栀愀渀最
攀 刀攀
氀愀琀椀瘀
攀 琀漀
琀栀攀
䴀攀搀
椀愀渀
䠀漀甀爀氀礀 䔀愀爀渀椀渀最猀 倀攀爀挀攀渀琀椀氀攀
䘀椀最甀爀攀 ⴀ 倀攀爀挀攀渀琀 䌀栀愀渀最攀猀 椀渀 䴀愀氀攀 愀渀搀 䘀攀洀愀氀攀 䠀漀甀爀氀礀 圀愀最攀猀 刀攀愀氀琀椀瘀攀 琀漀 琀栀攀 䴀攀搀椀愀渀
㤀㜀㐀ⴀ㤀㠀㠀
㤀㠀㠀ⴀ 㘀
Source MayORG CPS data for earnings years 1973-2009
In short wage gains in the middle of the distribution were smaller than wage gains at either the upper or lower reaches of the wage distribution This simultaneous po-larization of US employment and wage growth suggests an important theme explored in detail belowmdashlabor demand appears to be rising for both high-skill high-wage jobs and for traditionally low-skill low-wage jobs
The Great Recession has quantitatively but not quali-tatively changed the direction of the US labor market
The four major US labor market developments ref-erenced above and documented belowmdashthe polariza-tion of job growth across high- and low-skill occupations
rising wages for highly educated workers falling wages for less-educated workers and lagging labor market gains for malesmdashall predate the Great Recession But the available data suggest that the Great Recession has reinforced these trends rather than reversing or redirecting them In par-ticular job and earnings losses during the recession have been greater for low-education males than low-education females and these losses have been most concentrated in middle-skill jobs Indeed there was essentially no net change in total employment in both high-skill profession-al managerial and technical occupations and in low-skill service occupations between 2007 and 2009 Conversely employment fell by eight percent in white-collar sales office and administrative jobs and by 16 percent in blue-collar production craft repair and operative jobs
Key contributors to job polarization are the automation of routine work and the international integration of labor markets
Measuring employment polarization is easier than determining its root causes but researchers are making progress in understanding the operative forces behind the data A leading explanation focuses on the consequences of ongoing automation and offshoring of middle-skilled ldquoroutinerdquo tasks that were formerly performed primarily by workers with moderate education (a high school diploma but less than a four-year college degree) Routine tasks as described by economists David Autor Frank Levy and Richard Murnane are job activities that are sufficiently well defined that they can be carried out successfully by either a computer executing a program or alternatively by a comparatively less-educated worker in a developing country who carries out the task with minimal discretion8
Routine tasks are characteristic of many middle-skilled cognitive and production activities such as bookkeeping clerical work and repetitive production tasks The core job tasks of these occupations in many cases follow precise well-understood procedures Consequently as computer and communication technologies improve in quality and decline in price these routine tasks are increasingly codi-fied in computer software and performed by machines or alternatively sent electronically to foreign worksites to be performed by comparatively low-wage workers
13 Community Investments Fall 2011 ndash Volume 23 Issue 2
ⴀ㔀
ⴀ
ⴀ㔀
㔀
㔀
㔀 㔀 㔀 㘀㔀 㠀 㤀㔀
倀攀爀挀
攀渀琀 䌀
栀愀渀最
攀 刀攀
氀愀琀椀瘀
攀 琀漀
琀栀攀
䴀攀搀
椀愀渀
䠀漀甀爀氀礀 䔀愀爀渀椀渀最猀 倀攀爀挀攀渀琀椀氀攀
䘀椀最甀爀攀 ⴀ 倀攀爀挀攀渀琀 䌀栀愀渀最攀猀 椀渀 䴀愀氀攀 愀渀搀 䘀攀洀愀氀攀 䠀漀甀爀氀礀 圀愀最攀猀 刀攀愀氀琀椀瘀攀 琀漀 琀栀攀 䴀攀搀椀愀渀
㤀㜀㐀ⴀ㤀㠀㠀
㤀㠀㠀ⴀ 㘀
This simultaneous polarization of US employment and wage growth suggests an important thememdashlabor demand appears to be rising for both high-skill high-wage jobs and for traditionally low-skill low-wage jobs
Special Focus Income Inequality
This process raises relative demand for nonroutine tasks in which workers hold a comparative advantage As detailed below these nonroutine tasks can be roughly subdivided into two major categories abstract tasks and manual tasks These tasks lie at opposite ends of the occu-pational-skill distribution
Abstract tasks require problem solving intuition and persuasion Workers who are most adept in these tasks typically have high levels of education and analytical capability Manual tasks by contrast require situational adaptability visual and language recognition and in-per-son interactions Examples of workers engaged in these tasks include janitors and cleaners home health aides construction laborers security personnel and motor vehicle operators Manual tasks demand workers who are physically adept and in some cases able to communicate fluently in spoken language Yet they appear to require little in the way of formal education at least relative to a setting where most workers have completed high school
In brief the displacement of jobsmdashand more broadly occupationsmdashthat are intensive in routine tasks contrib-utes to the polarization of employment into relatively high-skill high-wage and low-skill low-wage jobs with a concomitant decline in middle-skill jobs
Technology trade and offshoring are not by any means the only potential explanation for employment polariza-tionmdashnor is it necessarily the case that any one explana-tion accounts for the entirety of the phenomenon Another frequently discussed explanation for the changing struc-ture of employment and earnings in the US focuses on shifts in labor market institutions in particular declining labor union penetration and a falling real minimum wage There is little doubt that labor unions and the minimum wage contribute to changing employment and wage pat-terns but it appears unlikely their role is paramount
In the case of labor unions their impact is largely con-fined to manufacturing and public sector employment neither of which comprises a sufficiently large share of the aggregate economy to explain the overall polarization phenomenon Moreover polarization of employment into high-skill high-wage and low-skill low-wage jobs occurs across all sectors of the US economy and is not confined
to union-intensive manufacturing industries This makes it unlikely that de-unionization or the decline of manufac-turing employment is primarily responsible for employ-ment polarization
Nevertheless the loss of middle-skill blue-collar jobs in manufacturingmdashmany at unionized firms paying rela-tively high wagesmdashhas likely been particularly harmful to the employment and earnings of less-educated males The job opportunities available to males displaced from manu-facturing jobs particularly those displaced at midcareer are likely to be primarily found in lower-paying service occupations While these job losses may be primarily at-tributable to automation of routine production work and growing international competition in manufactured goods rather than to de-unionization per se the magnitude of the income losses for males is surely magnified by the fact that the job losses are in union-intensive industries
An often-discussed explanation for changes in the structure of US wages and employment is the federal minimum wage The minimum wage can affect wage in-equality by boosting (or failing to boost) wages in low-paying jobs But changes in the federal minimum wage over the last several decades appear an unlikely candi-date for explaining the polarization of employmentmdashthat is the growth of both low-and high-skill jobsmdashparticu-larly because the timing of this explanation does not fit the main polarization facts The federal minimum wage declined sharply in real terms (after adjusting for infla-tion) during the 1980s which might in theory have led to a rise in low-skill low-wage employment Yet as shown in Figure 1 the opposite occurred From the late 1980s forward the real federal minimum wage stabilized and then subsequently rose We might therefore have expect-ed low-skill employment to stagnate or decline Instead it grew rapidly9
The earnings of college-educated workers relative to high school-educated workers have risen steadily for almost three decades
After three decades of sustained increases the return to skills as typically measured by the earnings ratio of college graduates relative to high school graduates is at a historic high In 1963 the hourly wage of the typical college graduate was approximately 15 times the hourly wage of the typical high school graduate By 2009 this ratio stood at 195 The entirety of this 45 percentage point rise occurred after 1980 In fact the college-to-high- school earnings ratio declined by 10 percentage points in the 1970s
Moreover this simple comparison of the wage gap between college and high school graduates probably un-derstates significantly the real growth in compensation
14 Community Investments Fall 2011 ndash Volume 23 Issue 2
After three decades of sustained increases the return to skills as typically measured by the earnings ratio of college graduates relative to high school graduates is at a historic high
for college graduates relative to high school graduates in recent decades College graduates work more hours per week and more weeks per year than high school gradu-ates spend less time unemployed and receive a dispro-portionate share of nonwage fringe benefits including sick and vacation pay employer-paid health insurance pension contributions and safe and pleasant working conditions And these gaps in nonwage benefits between high- and low-education workers have each grown over the past several decades10
One important proximate cause for the rising relative earnings of college graduates is the slowdown in the rate of entry of new college graduates into the US labor market starting in the early 1980s Although this slowdown is by no means the only cause of changes in US employment and earnings patternsmdashand moreover a cause whose genesis is not entirely understoodmdashit is nevertheless a critical and often overlooked factor
Rising relative earnings of college graduates are due both to rising real earnings for college workers and falling real earnings for noncollege workersmdashparticularly noncollege males
The high and rising wage premium that accompanies a college education conveys the positive economic news that educational investments offer a high wage return But this trend also masks a discouraging truth the rising rela-tive earnings of college graduates are due not just to rising real earnings for college workers but also to falling real earnings for noncollege workers Real hourly earnings of college-educated workers rose anywhere from 10 to 37 percent between 1979 and 2007 with the greatest gains among workers with a postbaccalaureate degree
Simultaneously real earnings of workers with high school or lower educational levels either stagnated or de-clined significantly These declines were especially steep among males 12 percent for high school graduates and 16 percent for high school dropouts The picture is gen-erally brighter for females but there was essentially no real earnings growth among females without at least some college education over this three-decade interval
Though it is sometimes asserted that the ldquorealrdquo earnings declines of less-educated workers are overstated because they do not account for the rising value of employer-pro-vided in-kind benefits such as healthcare careful analysis of representative wage and fringe benefits data conduct-ed by US Bureau of Labor Statistics economist Brooks Pierce refutes this notion Net of fringe benefits real compensation for low-skilled workers fell in the 1980s Further accounting for fringe benefits total compensa-tion for high-skilled workers rose by more than did wages both in absolute terms and relative to compensation for low-skilled workers11
15 Community Investments Fall 2011 ndash Volume 23 Issue 2
Special Focus Income Inequality
Gains in educational attainment have not generally kept pace with rising educational returns particularly for males
Given the steep rise in wages for college graduates rel-ative to noncollege graduates over the past three decades one might have anticipated a substantial rise in college attainment among young adults Yet the actual increase in four-year college attainment was fairly muted particularly for males Between 1970 and 2008 four-year college at-tainment among white male young adults ages 25 through 34 rose only modestly from 20 percent in 1970 to 26 percent in 200812 Remarkably among white females of the same age range college attainment nearly tripled to 34 percentage points from 12 percentage points Thus in three decades the white male-female gap in college at-tainment went from positive eight to negative eight per-centage points
Among young African-American adults this picture is also mixed The proportional gains in four-year college completion between 1970 and 2008 were substantially greater for blacks than for whites Indeed college com-pletions rose more than two-fold among black males and more than three-fold among black females Despite these gains the levels of college completion for blacks remain substantially below that of whites The black-white gap in college completion closed by only two percentage points among males in this period and expanded by six percent-age points among females
The only ethnic category for which gains in education-al attainment have been truly spectacular was ldquoother non-whitesrdquo a category that includes many Asian Americans13 In 2008 more than half of male and female young adults in this category had completed a four-year college degree This is an increase since 1970 of 22 percentage points among males and 32 percentage points among females
Conclusion
Although the US labor market will almost surely rebound from the Great Recession this article presents a somewhat disheartening picture of its longer-term evolu-tion Rising demand for highly educated workers combined with lagging supply is contributing to higher levels of earn-ings inequality Demand for middle-skill jobs is declining and consequently workers that do not obtain postsecond-ary education face a contracting set of job opportunities
Perhaps most alarmingly males as a group have adapted comparatively poorly to the changing labor market Male educational attainment has slowed and male labor force
16 Community Investments Fall 2011 ndash Volume 23 Issue 2
participation has declined For males without a four-year college degree wages have stagnated or fallen over three decades And as these males have moved out of middle-skill blue-collar jobs they have generally moved down-ward in the occupational skill and earnings distribution
The obvious question as Scrooge asks the Ghost of Christmas Yet to Come is ldquo[A]nswer me one question Are these the shadows of the things that Will be or are they shadows of things that May be onlyrdquo Is the labor market history of the last three decades inevitably our destinymdashor is it just that it could end up being our destiny if we do not implement forward-looking policy responses
While this article is intended as a spur to policy dis-cussion rather than a source of policy recommendations I will note a few policy responses that seem especially worthy of discussion
First encouraging more young adults to obtain higher education would have multiple benefits Many jobs are being created that demand college-educated workers so this will boost incomes Additionally an increased supply of college graduates should eventually help to drive down the college wage premium and limit the rise in inequality
Second the United States should foster improvements in K-12 education so that more people will be prepared to go on to higher education Indeed one potential expla-nation for the lagging college attainment of males is that K-12 education is not adequately preparing enough men to see that as a realistic option
Third educators and policymakers should consider training programs to boost skill levels and earnings oppor-tunities in historically low-skilled service jobsmdashand more broadly to offer programs for supporting continual learn-ing retraining and mobility for all workers
Finally another potential policy response is to con-sider RampD and infrastructure investments that will have broadly distributed benefits across the economy Exam-ples might include expanding job opportunities in energy the environment and health care The return of the classic manufacturing job as a path to a middle-class life is un-likely But it may be that various service jobs grow into attractive job opportunities with the appropriate comple-mentary investments in training technology and physical capital Perhaps these could be the shadows of what is yet to come
David Autor is a professor of economics at the Mas-sachusetts Institute of Technology and faculty research associate of the National Bureau of Economic Research
How did America go from the Great Depres-sion of the 1930s to thirty years of what might be termed the Great Prosperity between 1947 and 1977 And from there to thirty years of
stagnant incomes and widening inequality culminating in a Great Recession and one of the most anemic recoveries on record It was no accident
The Great Prosperity
During three decades from 1947 to 1977 America implemented the basic bargain ndash providing its workers enough money to buy what they produced Produc-tivity grew in tandem with wages Labor productivity ndash average output per hour worked ndash doubled So did median incomes Expressed in 2007 dollars the typical familyrsquos income rose from about $25000 to $55000 The bargain was cinched
Community Perspective Widening Inequality Hurts us AllBy Robert B Reich
But herersquos the really interesting thing We became more equal The wages of workers in the bottom fifth grew 116 percent ndash faster than the pay of those in the top fifth (which rose 99 percent) and in the top five percent (86 percent) By the late 1940s the nation was ldquomore than halfway to perfect equalityrdquo as the National Bureau of Economic Re-search wryly observed But as the economy grew almost everyone came out ahead including those at the top
The Great Prosperity also marked the culmination of a reorganization of work that had begun during the Depres-sion Perhaps most significantly government increased the bargaining leverage of ordinary workers They were guar-anteed the right to join labor unions with which employ-ers had to bargain in good faith By the mid 1950s more than a third of all workers were unionized UAW presi-dent Walter Reuther among others explicitly invoked the basic bargain ldquoUnless we get a more realistic distribu-
17 Community Investments Fall 2011 ndash Volume 23 Issue 2
Special Focus Income Inequality
tion of Americarsquos wealthrdquo he threatened ldquowe wonrsquot get enough to keep this machinery goingrdquo Employers relent-ed and the higher wages kept the machinery going better than ever by giving average workers more money to buy what they produced (Non-unionized companies fearing their workers would otherwise want a union offered similar deals) And because health and pension benefits were not taxed big employers added ever more generous provisions
Americans also enjoyed economic security against the risks of economic life ndash not only unemployment benefits but also through Social Security insurance against dis-ability loss of a major breadwinner workplace injury and inability to save enough for retirement In 1965 came health insurance for the elderly and the poor (Medicare and Medicaid) Economic security proved the handmaid-en of prosperity In requiring Americans to share the costs of adversity it enabled them to share the benefits of peace of mind And by offering peace of mind it freed them to consume the fruits of their labors
Government also widened access to higher education The GI Bill paid college costs for those who returned from war The expansion of public universities ndash whose tuitions averaged about four percent of median family incomes during the Great Prosperity in contrast to the 20 percent then demanded by private universities ndash made higher education affordable to the American middle class Con-sequently college enrollments surged By 1970 seventy percent of the nationrsquos four-year post-secondary students were in public universities and colleges The federal gov-ernment especially the Defense Department also under-wrote a growing portion of university research especially in the sciences
Notwithstanding all this the nation also found the time and money in these years to rebuild Western Europe and Japan ndash spending billions of dollars to restore foreign factories roads railways and schools The effort proved an astounding success The years 1945 to 1970 witnessed the most dramatic and widely shared economic growth in the history of the world which contributed to Americarsquos Great Prosperity In helping restore the worldrsquos leading economies and thus keep communism at bay the new global system of trade and assistance created vast new op-portunities for American corporations ndash far richer larger and more technologically advanced than any other ndash to expand and prosper
Government paid for all of this with tax revenues from an expanding middle class whose incomes were rising Revenues were also boosted by those at the top of the income ladder whose marginal taxes were far higher than todayrsquos The top marginal income tax rate during World War II was over 68 percent In the 1950s under Dwight Eisenhower whom few would call a radical it rose to 91 percent In the 1960s the highest marginal rate was around 70 percent Even after exploiting all possible de-ductions and credits the typical high-income taxpayer paid a marginal federal tax of over 50 percent But con-trary to what conservative commentators had predicted the high tax rates did not hobble economic growth To the contrary they enabled the nation to expand middle-class prosperity and fuel growth
America of that era still harbored vast inequalities of course The very poor remained almost invisible Blacks were still relegated to second-class citizenship Few women dared aspire to professions other than teaching or nursing But such barriers would eventually weaken or disappear And although the era also engendered a blandness unifor-mity and materialism that many found abhorrent the Great Prosperity offered more Americans more opportunities to make whatever life they wanted more than ever before It significantly expanded the portion of total income going to the middle class And it proved that widely-shared income gains were not incompatible with widespread economic growth they were in fact essential to it
The Great Regression 1980 to 2008
During the Great Prosperity of 1947-1977 the vast middle class received an increasing share of the benefits of economic growth But after that point the two lines began to diverge output per hour ndash a measure of produc-tivity ndash continued to rise But real hourly compensation was left in the dust
Contrary to popular belief trade and technology have not reduced the overall number of American jobs Their more profound effect has been on pay Rather than be out of work most Americans have quietly settled for lower real wages or wages that have risen more slowly than the overall growth of the economy per person Although unemployment following the Great Recession remains unusually high jobs are slowly returning ndash but in order to get them many workers have to accept lower pay than before Trade and technology have driven a wedge between the earnings of people at the top and everyone else The pay of well-connected graduates of prestigious colleges and MBA programs ndash the so-called ldquotalentrdquo who reached the pinnacles of power in executive suites and on Wall Street ndash has soared But the pay and benefits of most other workers has either flattened or dropped And the ensuing division has also made most middle-class Ameri-can families less economically secure
widely-shared income gains were not incompatible with widespread economic growth they were in fact essential to it
18 Community Investments Fall 2011 ndash Volume 23 Issue 2
The real puzzle is why so little was done in response to these forces that were conferring an increasing share of economic growth on a small group at the top and leaving most other Americans behind With the gains from that growth the nation could for example have expanded our educational system to encompass early-childhood education and better equipped our public schools It could have supported affordable public universities created more job retraining and better and more exten-sive public transportation
In these and many other ways government could have reinforced the basic bargain But it did the opposite Starting in the late 1970s and with increasing fervor over the next three decades it deregulated and privatized It slashed public goods and investments ndash whacking school budgets increasing the cost of public higher education reducing job training cutting public transportation and allowing bridges ports and highways to corrode It shred-ded safety nets ndash reducing aid to jobless families with children and cutting unemployment insurance so much that by 2007 only 40 percent of the unemployed were covered It halved the top income tax rate from the range of 70 to 90 percent that prevailed during the Great Pros-perity to 28 to 35 percent allowed many of the nationrsquos rich to treat their income as capital gains subject to no more than 15 percent tax and shrunk inheritance taxes that affected only the top-most 15 percent of earners Yet at the same time America boosted sales and payroll taxes both of which took a bigger chunk out of the pay of the middle class and the poor than of the well off
We allowed companies to break the basic bargain with impunity ndash slashing jobs and wages cutting benefits and shifting risks to employees (from you-can-count-on-it pen-sions to do-it-yourself 401(k)s from good health coverage to soaring premiums and deductibles) Companies were allowed to bust unions and threaten employees who tried to organize (by 2010 fewer than eight percent of private-sector workers were unionized) And nothing impeded CEO salaries from skyrocketing to 300 times that of the average worker (from 30 times during the Great Prosper-ity) while the pay of financial executives and traders rose into the stratosphere We stood by as big American com-panies became global companies with no more loyalty or connection to the United States than a GPS satellite
Most telling of all Washington deregulated Wall Street while insuring it against major losses In so doing it allowed finance ndash which until then had been the servant of American industry ndash to become its master demanding short-term profits over long-term growth and raking in an ever-larger portion of the nationrsquos profits Between 1997 and 2007 finance became the fastest-growing part of the US economy Two-thirds of the growth in the Gross Na-tional Product was attributable to the gains of financial
executives traders and specialists By 2007 financial companies accounted for over forty percent of American corporate profits and almost as great a percentage of pay up from ten percent during the Great Prosperity
The Cause of Our Unraveling
Some argue America did so little because Americans lost confidence in government They have cause and effect backwards The tax revolts that thundered across America starting in the late 1970s were not so much ideological revolts against government ndash Americans still wanted all the government services they had before and then some ndash as backlash against paying more taxes on incomes that had stagnated Inevitably government services deterio-rated and government deficits exploded confirming the publicrsquos growing cynicism about governmentrsquos capacity to do anything right Furthermore the inflation of the 1970s wasnrsquot due to government spending It was the result of an eightfold hike in world oil prices engineered by the oil cartel and a drop in the value of the dollar When inflation began to accelerate federal spending was only one per-centage point higher as a proportion of GDP than it had been in the first half of 1960s
The real reason for the reversal of the pendulum was political As income and wealth became more concen-trated in fewer hands politics reverted to what former Federal Reserve Chair Marriner Eccles described in the 1920s as when people ldquowith great economic power had an undue influence in making the rules of the economic gamerdquo With hefty campaign contributions and platoons of lobbyists and PR flacks the rich pushed legal changes that enabled them to accumulate even more income and wealth ndash including tacit permission to bust unions slash corporate payrolls and reduce benefits lower taxes for themselves and deregulation of Wall Street Since so much of their wealth depends on the performance of the stock market they particularly wanted to free up the Street to put greater pressure on companies to perform The plan worked The Dow Jones Industrial Average took off ndash rising tenfold between 1980 and 2000
Americans accepted the backward swing of the pen-dulum because they mitigated its effects Starting in the late 1970s the American middle class honed three coping mechanisms allowing it to behave as though it was still
19 Community Investments Fall 2011 ndash Volume 23 Issue 2
Between 1997 and 2007 finance became the fastest-growing part of the US economy
Special Focus Income Inequality
taking home the same share of total income as it had during the Great Prosperity and to spend as if nothing substantially had changed Not until these coping mecha-nisms became exhausted in the Great Recession would the underlying reality be exposed
Coping mechanism 1 Women move into paid work Starting in the late 1970s and escalating in the 1980s and 1990s women went into paid work in greater and greater numbers For the relatively small sliver of women with four-year college degrees this was the natural conse-quence of wider educational opportunities and new laws against gender discrimination that opened professions to well-educated women But the vast majority of women who migrated into paid work did so in order to prop up family incomes as households were hit by the stagnant or declining wages of male workers
This transition of women into paid work has been one of the most important social and economic changes to occur over the last four decades It has reshaped American families and challenged traditional patterns of child-rear-ing and child care Its magnitude has been extraordinary In 1966 twenty percent of mothers with young children worked outside the home By the late 1990s the propor-tion had risen to sixty percent For married women with children under the age of six the transformation has been even more dramatic ndash from twelve percent in the 1960s to fifty-five percent by the late 1990s
Families seem to have reached the limit however ndash a point of diminishing returns where the costs of hiring others to see to the running of a household or to take care of the children or both exceeds the apparent benefits of the additional income
Coping mechanism 2 Everyone works longer hours By the mid 2000s it was not uncommon for men to work more than sixty hours a week and women to work more than fifty Professionals put in more ldquobillablerdquo hours Hourly workers relied on overtime A growing number of people took on two or three jobs each demanding twenty or more hours All told by the 2000s the typical Ameri-can worker worked more than 2200 hours a year ndash 350 hours more than the average European worked more hours even than the typically industrious Japanese put in It was many more hours than the typical American mid-dle-class family had worked in 1979 ndash five hundred hours longer a full twelve weeks more Americans seemed to have reached a limit Even if they can find the work they canrsquot find any more time
Coping mechanism 3 Draw down savings and borrow to the hilt After exhausting the first two coping mechanisms the only way Americans could keep con-suming as before was to save less and go deeper into debt During the Great Prosperity the American middle class
saved about nine percent of their after-tax incomes each year By the late 1980s and early 1990s that portion had been whittled down to about seven percent The savings rate then dropped to six percent in 1994 and on down to three percent in 1999 By 2008 Americans saved nothing Meanwhile household debt exploded During the Great Prosperity debt had averaged around 50 to 55 percent of after-tax income That included what people owed on their mortgages But starting in 1980 debt took off In 2001 Americans owed as much as their entire after-tax income that year By 2007 the typical American owed 138 percent of their after-tax income
Americans borrowed from everywhere Credit card solicitations flooded mail boxes many American wallets bulged with dozens of such cards all amassing larger and larger debt loads Auto loans were easy to come by Stu-dents and their families went deep into debt to pay the costs of college But far and away the largest borrowing was to buy homes Mortgage debt exploded As housing values continued to rise homes doubled as ATMs Con-sumers refinanced their homes with even larger mortgages and used their homes as collateral for additional loans As long as housing prices continued to rise it seemed a painless way to get additional money (in 1980 the average home sold for $62000 by 2006 it went for $245000) Between 2002 and 2007 American households extracted $23 trillion from their houses putting themselves ever more deeply into the hole
Eventually of course the debt bubble burst With it the last coping mechanism ended Each of these mechanisms reached its inevitable limit And when the debt bubble burst most Americans woke up to a startling reality They could no longer afford to live as they had been living nor as they thought they should be living given the growth in the economy nor as they expected to be living given how their pay used to grow when the economy grew nor as they assumed they could be living given the lavish life-styles of people at the top of the income ladder
The Future
The economic challenge ahead is to lift the means of middle-class Americans and reconstitute the basic bargain linking wages to overall gains ndash providing the vast Ameri-can middle class with a share of economic gains sufficient to allow them to purchase more of what the economy can produce One step toward reestablishing shared prosper-ity would be expanding the Earned Income Tax Credit The EITC has not only helped reduce poverty but has in-creased the incomes of families most likely to spend that additional money and thereby create more jobs In 2011 the EITC was the nationrsquos largest anti-poverty program Over 24 million households received wage supplements Given whatrsquos happened to middle-class incomes the EITC
20 Community Investments Fall 2011 ndash Volume 23 Issue 2
should be expanded and extended upward Under my plan full-time workers earning $20000 or below (this and all subsequent figures are in 2010 dollars) would get a wage supplement of $15000 This supplement would decline incrementally to $10000 for full-time workers earning $30000 to $5000 for full-time workers earning $40000 and then to zero for full-time workers earning $50000 Along with expanding the EITC Irsquod recommend that marginal tax rates be lowered for the middle class The income tax rates of full-time workers earning between $50000 and $90000 should be cut to ten percent of earnings and of workers earning between $90000 and $140000 to 20 percent of their earnings
The yearly cost to the federal government of expanding the EITC and reducing middle-class taxes would be ap-proximately $634 billion a year (in 2010 dollars) This lost revenue could be replaced by a tax on fossil fuels (coal oil and gas) based on how many tons of carbon dioxide such fuels contain The tax would be collected at the mine or port of entry for each fossil fuel and would gradually rise over time in order to push energy companies and users to spew less carbon into the atmosphere If initially set at $35 per metric ton of carbon-dioxide or its equiva-lent such a tax would raise over $210 billion in its first year alone By the time it reached $115 per ton it would yield about $600 billion per year The public wouldnrsquot di-rectly pay this tax but would indirectly pay it to the extent the prices of goods rise in proportion to how much carbon is used in their production For example a tax of $115 per ton would add about $1 to the price of a gallon of gasoline and 6 cents per kilowatt-hour to the price of electricity But if the revenues from the carbon tax went into an expanded EITC and lower taxes on the middle class most Americans would still come out far ahead A carbon tax has two ad-ditional advantages It would push energy companies and businesses to invest in new ways to reduce greenhouse gases and in lower-carbon fuels and products This would prevent overall emissions from increasing beyond current levels The tax will also boost aggregate demand
The Great Recession has accelerated the structural change in the economy that began in the late 1970s Large numbers of Americans will not be rehired unless they are willing to settle for lower wages and benefits Eventually jobs will return but if the trend continues more people will be working for pay they consider inadequate more
working families will be at or near poverty and inequality will have widened
Nor will households be able to borrow as before Lending standards have tightened and bank regulators and new regulations will require prudence Meanwhile a large number of Americans are paying off paying down or walking away from trillions of dollars of outstanding loans ndash in a vast ldquodeleveragingrdquo of household finances that is likely to continue for years At the same time tens of millions of boomers are approaching retirement with nest eggs that have shrunk to the size of peanuts and must save in earnest
All this means less consumption as a proportion of the overall economy than before the Great Recession Al-though consumers have to replace cars appliances and other things that run out or wear out or finally break down and businesses have to replace inventories that become so depleted they have nothing left to sell or ship a lasting recovery cannot be based on replacements
Where will demand come from without a buoyant American middle class Absent their spending private investors have little incentive to buy new equipment or software new commercial buildings or factories entre-preneurs have little incentive to embark on new research and develop new products and services Government can fill the gap for a time but government cannot continue in-definitely to stimulate the economy with deficit spending or by printing money Nor can we rely on exports to fill the gap Exports will remain a relatively small proportion of our economy Other economies ndash even the Chinese ndash are relying on net exports to maintain their employment It is impossible for every large economy including the United States to become a net exporter
Hence our underlying dilemma As we should have learned during the Great Prosperity ndash the thirty years after World War II when America grew because most Ameri-cans shared in the nationrsquos prosperity ndash we cannot have a growing and vibrant economy without a growing and vibrant middle class
Robert B Reich is Chancellorrsquos Professor of Public Policy at the University of California at Berkeley He has served in three national administrations most recently as Bill Clintonrsquos secretary of labor He is also the author of thirteen books the most recent of which is Aftershock The Next Economy and Americarsquos Future
21 Community Investments Fall 2011 ndash Volume 23 Issue 2
Special Focus Income Inequality
It is well known that economic deprivation early in life sets children on a trajectory toward diminished educational and occupational attainment But why is early childhood poverty so harmful If we canrsquot
answer that question well our reform efforts are reduced to shots in the dark
In this article we offer a new perspective on this question We suggest that childhood poverty is harmful in part because it exposes children to stressful environ-ments Low-income children face a bewildering array of psychosocial and physical demands that place much pres-sure on their adaptive capacities and appear to be toxic to the developing brain Although poor children are disad-vantaged in other ways we focus our analysis here on the new underappreciated pathway depicted in Figure 1 As
shown in this figure children growing up in poverty dem-onstrate lower academic achievement because of their exposure to a wide variety of risks These risks in turn build upon one another to elevate levels of chronic (and toxic) stress within the body And this toxic stress directly hinders poor childrenrsquos academic performance by com-promising their ability to develop the kinds of skills neces-sary to perform well in school We will unpack this new RiskndashStress Model in the balance of our article However before doing so itrsquos useful to first go over the evidence regarding the relation between poverty and achievement and then to present some of the well-known pathways through which this relationship is generated With that background in place we can then describe the RiskndashStress Model as represented in Figure 1
Stressing Out the PoorChronic Physiological Stress and the Income-Achievement GapBy Gary W Evans Jeanne Brooks-Gunn and Pamela Kato Klebanov
22 Community Investments Fall 2011 ndash Volume 23 Issue 2
Poverty and Achievement
It is well known that children born into low-income families lag behind their middle- and upper-income coun-terparts on virtually all indices of achievement To provide one example a national study of elementary school chil-dren shows that children in the poorest quarter of American households begin kindergarten nearly 10 percent behind their middle-income and affluent classmates in math (Figure 2) Six years later as they are about to enter middle school the poorest quarter of American children have fallen even further behind with the gap between themselves and their most affluent schoolmates nearly doubling
Figure 2 Average percentile rank on Peabody Individual Achievement MathFigure 2 ‐ Average percentile rank on Peabody Individual
Achievement Math
60
65
e
Highest income quartile
50
55
Percen
tile
Third income quartile
40
45
Score
Second income quartile
35
6 8 10 12
Lowest income quartile
Age of Child
Source James J Heckman (2006) ldquoSkill Formation and the Economics of Investing in DisadvantagedChildrenrdquo Science 312(5782) 1900‐1902Children Science 312(5782) 1900 1902Source James J Heckman (2006) ldquoSkill Formation and the Econom-
ics of Investing in Disadvantaged Childrenrdquo Science 312(5782) 1900-1902
The splaying pattern revealed here a general one that holds across various outcomes may be attributed to the tendency for advantage and disadvantage to accumulate over time This accumulation occurs in various ways for example children who score poorly at age six may be tracked into low-achievement school groups which in turn exposes them to lower expectations to less rigorous curricula and to less capable peers all of which further disadvantage them and generate ever more substantial between-group gaps The RiskndashStress Model to which we turn later suggests that such splaying may also be attribut-ed to the cognitive deficits and poorer health that chronic stress generates Both cognitive deficits and ill health then repeatedly disadvantage poverty-stricken children in one educational setting after another
Pathway 1 Parenting Practices
What types of forces have social scientists convention-ally understood as explaining the achievement gaps illus-trated in Figure 2 One reason poor children lag behind their more affluent peers is that their parents interact with them in ways that arenrsquot conducive to achievement For example psychologist Kathryn Grant and her col-leagues have documented a strong and consistent relation between socioeconomic disadvantage and harsh unre-sponsive parenting In one national dataset 85 percent of American parents above the poverty line were shown to be responsive supportive and encouraging to their chil-dren during infancy and toddlerhood whereas only 75 percent of low-income parents had the same achievement-inducing parenting style While most low-income parents (ie 75 percent) do provide adequate levels of support and encouragement these data reveal then a nontrivial difference across income levels in the chances that chil-dren will experience a problematic parenting style There is considerable evidence that at least a portion of the cog-nitive developmental consequences of early childhood poverty is due to this difference
Pathway 2 Cognitive Stimulation
Itrsquos also well known that children from low-income households tend to receive less cognitive stimula-tion and enrichment For example a child from a low-income family who enters first grade has been exposed on average to just 25 hours of one-on-one picture book reading whereas an entering middle-income child has been exposed on average to more than 1000 hours of such reading Likewise during the first three years of life a child with professional parents will be exposed to three times as many words as a child with parents on welfare
And itrsquos not just simple parental effects that account for the achievement deficit If a child is born into a high-in-come family he or she may also benefit from high-quality stimulation and enrichment from extended family from siblings and friends and from more formal care providers All of this redounds to the benefit of higher-income chil-dren while further handicapping low-income children
So much for the well-known pathways by which dis-advantage is transmitted We turn now to another and less-appreciated aspect of low-income environments that
倀漀瘀攀爀琀礀 䌀甀洀甀氀愀琀椀瘀攀 刀椀猀欀 䔀砀瀀漀猀甀爀攀
䌀栀爀漀渀椀挀 匀琀爀攀猀猀 䰀漀眀 䄀挀栀椀攀瘀攀洀攀渀琀
䘀椀最甀爀攀 ⴀ 䄀 渀攀眀 瀀愀琀栀眀愀礀 琀漀 愀挀挀漀甀渀琀 昀漀爀 琀栀攀 椀渀挀漀洀攀ⴀ愀挀栀椀攀瘀攀洀攀渀琀 最愀瀀Figure 1 The Risk-Stress ModelmdashA new pathway to account for the income-achievement gap
Special Focus Income Inequality
23 Community Investments Fall 2011 ndash Volume 23 Issue 2
may also harm cognitive development The key concern here children from impoverished households face a wide array of physical and psychosocial stressors Their homes schools and neighborhoods are much more chaotic than the settings in which middle- and upper-income children grow up Such conditions can in turn produce toxic stress capable of damaging areas of the brain known to underlie cognitive processesmdashsuch as attention memory and languagemdashthat all combine to undergird academic success In the pages that remain we document each of the steps in the RiskndashStress Model
Poverty and Cumulative Risk Exposure
The stressors that poor children face take both a physi-cal and psychosocial form The physical form is well doc-umented poor children are exposed to substandard envi-ronmental conditions including toxins hazardous waste ambient air and water pollution noise crowding poor housing poorly maintained school buildings residential turnover traffic congestion poor neighborhood sanitation and maintenance and crime The psychosocial form is also well documented poor children experience signifi-cantly higher levels of family turmoil family separation violence and significantly lower levels of structure and routine in their daily lives
An important aspect of early disadvantaged settings may be exposure to more than one risk factor at a time A powerful way to capture exposure to such multiple sources of stress and strain is the construct of cumulative risk Al-though there are various ways to quantify cumulative risk one common approach is to simply count the number of physical or psychosocial risks to which a child has been exposed In one UK study the authors counted how often children were exposed to such stresses as (a) living with a single parent (b) experiencing family discord (c) expe-riencing foster or some other form of institutional care (d) living in a crowded home and (e) attending a school with high turnover of both classmates and teachers It was found in this study that inner-city children experienced far more of these stresses than did the better-off working-class children The same result holds in the United States (see Figure 3) In rural New England only 12 percent of middle-income nine-year-olds experienced three or more physical and psychosocial risk factors whereas nearly 50 percent of low-income children crossed this same thresh-old (of three risk factors)
In a national US sample of premature and low birth weight infants Brooks-Gunn and colleagues similarly found that infants born into low-income families expe-rienced nearly three times more risk factors than their middle-income counterparts by the time they were tod-dlers These same low-income toddlers were seven times more likely than their affluent counterparts to experience
a very high number of risk factors (gt 6) The pattern is overwhelmingly clear being born into early poverty often means exposure to many more physical and psychosocial risk factors
Figure 3 Cumulative Risk Exposure in Relation to PovertyNot Poverty
㐀
㔀
㘀
㐀 㔀 㘀
倀攀爀挀
攀渀琀愀
最攀 匀挀
栀漀漀氀
䌀栀椀
氀搀爀攀
渀 䔀砀
瀀漀猀攀
搀
一甀洀戀攀爀 䌀甀洀甀氀愀琀椀瘀攀 刀椀猀欀猀
䘀椀最甀爀攀 ⴀ 䌀甀洀甀氀愀琀椀瘀攀 刀椀猀欀 䔀砀瀀漀猀甀爀攀 椀渀 刀攀氀愀琀椀漀渀 琀漀 倀漀瘀攀爀琀礀 一漀琀 倀漀瘀攀爀琀礀
倀漀瘀攀爀琀礀
䴀椀搀搀氀攀ⴀ椀渀挀漀洀攀
一漀琀攀㨀 䌀甀洀甀氀愀琀椀瘀攀 爀椀猀欀猀 椀渀挀氀甀搀攀 昀愀洀椀氀礀 琀甀爀洀漀椀氀Ⰰ 瘀椀漀氀攀渀挀攀Ⰰ 挀栀椀氀搀 猀攀瀀愀爀愀琀椀漀渀 昀爀漀洀 昀愀洀椀氀礀Ⰰ 渀漀椀猀攀Ⰰ 挀爀漀眀搀椀渀最Ⰰ愀渀搀 栀漀甀猀椀渀最 焀甀愀氀椀琀礀匀漀甀爀挀攀㨀 䜀愀爀礀 圀 䔀瘀愀渀猀 愀渀搀 䬀椀洀戀攀爀氀礀 䔀渀最氀椀猀栀 ᰠ吀栀攀 䔀渀瘀椀爀漀渀洀攀渀琀 漀昀 倀漀瘀攀爀琀礀㨀 䴀甀氀琀椀瀀氀攀 匀琀爀攀猀猀漀爀䔀砀瀀漀猀甀爀攀Ⰰ 倀猀礀挀栀漀瀀栀礀猀椀漀氀漀最椀挀愀氀 匀琀爀攀猀猀Ⰰ 愀渀搀 匀漀挀椀漀攀洀漀琀椀漀渀愀氀 䄀搀樀甀猀琀洀攀渀琀ᴠ 䌀栀椀氀搀 䐀攀瘀攀氀漀瀀洀攀渀琀Ⰰ 㜀㐀⤀㨀㠀ⴀ㐀㠀
Note Cumulative risks include family turmoil violence child separa-tion from family noise crowding and housing qualitySource Gary W Evans and Kimberly English 2002 ldquoThe Environment of Poverty Multiple StressorExposure Psychophysiological Stress and Socioemotional Adjustmentrdquo Child Development 73(4)1238-48
Cumulative Risk Exposure and Chronic Stress
But does such differential exposure indeed result in higher stress levels among poor children The simple answer is that it does In cross-sectional analyses of 9- and 13-year-old children Evans and colleagues found that the risk exposure described in Figure 3 elevated baseline resting blood pressure as well as overnight indices of such stress hormones as cortisol At age 13 when challenged by mental arithmetic problems children with higher levels of cumulative risk exposure did not show a typical healthy response instead exhibiting a muted rise in blood pressure These same children also didnrsquot recover as suc-cessfully from the mental challenge posed by these arith-metic problems (as indexed by the longer time it took their blood pressure to return to pre-stressor baseline levels) The evidence thus suggests that children exposed to high levels of cumulative risk are less efficient both in mobiliz-ing and then shutting off physiological activity
The RiskndashStress Model as represented in Figure 1 implies that the effect of family poverty on stress is medi-ated by risk exposure Although one would ideally like to test that mediation itrsquos also important to simply document the association between poverty and stress (thereby ignor-ing the mediating factor) Many investigators have indeed documented that disadvantaged children have higher chronic physiological stress levels as indicated by ele-
24 Community Investments Fall 2011 ndash Volume 23 Issue 2
vated resting blood pressure A smaller number of studies have also uncovered higher levels of chronic stress hor-mones such as cortisol among disadvantaged children To provide just a few examples Figures 4 and 5 show el-evated resting blood pressure as well as higher overnight urinary stress hormones in a sample of nine-year-old rural children
The foregoing data which pertain to nine-year-olds donrsquot tell us when such stress symptoms emerge Do pov-erty-stricken children show evidence of elevated stress early on in their lives
Or do such symptoms only emerge later With support from the Stanford Center for the Study of Poverty and Inequality we sought to answer this question by reana-lyzing a national data set of very young at-risk children The Infant Health and Development Program (IHDP) is a representative sample of low birth weight (lt 2500 grams) and premature (lt 37 weeks gestational age) babies born in 1985 at eight medical centers throughout the country This sample of nearly 1000 babies is racially and eco-nomically diverse (52 percent Black 37 percent White 11 percent Hispanic)
Figure 4 Resting blood pressure in nine-year-old White rural children
Source Gary W Evans and Kimberly English 2002 ldquoThe Environment of Poverty Multiple Stressor Exposure Psychophysiological Stress and Socioemotional Adjustmentrdquo Child Development 73(4)1238-48
Figure 5 Overnight stress hormones in nine-year-old White rural children
Source Gary W Evans and Kimberly English 2002 ldquoThe Environment of Poverty Multiple Stressor Exposure Psychophysiological Stress and Socioemotional Adjustmentrdquo Child Development 73(4)1238-48
Diastolic
605
61Diastolic
59 5
60
59
595
mmH
g
58
585
m
57
575
57
Poverty Middle‐income
Systolic
102
1025
1015
1005
101
mmH
g
100
99
995
99
Poverty Middle‐income
0035Cortisol
0025
003
002
0 01
0015
0005
001
0
Poverty Middle‐income
6Epinephrine
5
3
4
2
3
1
0
Poverty Middle‐income
Cortisol Epinephrine Norephinephrine
Poverty Middle-income Poverty Middle-income Poverty Middle-income
Special Focus Income Inequality
33Norepinephrine
32
325
315
30 5
31
30
305
295
Poverty Middle‐income
25 Community Investments Fall 2011 ndash Volume 23 Issue 2
We assessed resting blood pressure and childrsquos height and weight at 24 30 36 48 60 and 78 months of age The collection of physical health data at such young ages and over time provided us with an unprecedented opportunity to examine the early trajectories of chronic stress among a high-risk sample of babies Both baseline blood pressure levels and Body Mass Index (BMI) reflect wear and tear on the body and are precursors of lifelong health problems The former is indicative of cardiovascular health and the latter of metabolic equilibrium BMI which reflects fat de-position is measured as height divided by weight (kgm2)
We sought to assess whether these two measures of stress are elevated in poverty-stricken neighborhoods Low-in-come neighborhoods as defined in our study have median household incomes below $30000 (in 1980 dollars) while middle income neighborhoods have median income levels exceeding $30000 per household As is evident in Figures 6 and 7 babies growing up in low-income neigh-borhoods have health trajectories indicative of elevated chronic stress Additional statistical controls for infant birth weight health and demographic characteristics did not alter these trajectories These figures also reveal even more importantly that elevated stress emerges very early for chil-dren growing up in low-income neighborhoods BMI for example proves to be unusually low among poor children under five years old but it then takes off as these children grow older The blood pressure measure by contrast regis-ters high among low-income children from almost the very beginning of our measurements (ie 24 months) This re-search confirms then that low-income children are more likely than others to develop dangerous stress trajectories very early on in their childhood As we discuss below this has profound consequences for their likelihood of success in school and beyond
Chronic Stress and the Achievement Gap
The next and final step in our chain model pertains to the effects of chronic stress on achievement Here we turn to an important longitudinal program on poverty and the brain at the University of Pennsylvania con-ducted by Martha Farah and her colleagues In a series of studies with multiple samples drawn from lower- and middle-class Black families in Philadelphia Farah and colleagues show that several areas of the brain appear vulnerable to early childhood deprivation Using batter-ies of neurocognitive tests of brain function and brain imaging studies Farah and other neuroscientists can map the areas of the brain that are recruited by neuro-cognitive tasks As shown in Figure 8 among the areas of the brain most sensitive to childhood socioeconomic status (SES) are language long-term memory working memory and executive control What the graph depicts is the separation in standard deviation units between a low- and middle-SES sample of 11-year-old Black chil-dren from Philadelphia For this sample one standard deviation represents about one-fifth of the total distribu-tion of scores Samples differing by 35 or more stan-dard deviations are virtually non-overlapping Given that the samples differ by about 35 standard deviations for all four areas of brain functioning this means that there is virtually no overlap between poor and middle-class Black children when it comes to language long-term memory working memory or executive control Eleven-year-old Black children from lower SES families reveal dramatic deficits in multiple basic cognitive functions critical to learning and eventual success in society These results reveal the starkly cognitive foundation to the poor performance of low-income children
5055
6065
70D
BP
24 36 48 60 72Age in Months
Middle Income Neighborhoods Low Income Neighborhoods
1516
17B
MI
24 36 48 60 72Age in Months
Middle Income Neighborhoods Low Income Neighborhoods
B MI from 24 to 78 Months by Neighborhood P overty
Figures 6 and 7 Developmental trajectories in chronic stress in relation to neighborhood poverty
Diastolic Blood Pressure from 24 to 78 Months by Neighborhood Poverty
BMI from 24 to 78 Months by Neighborhood Poverty
26 Community Investments Fall 2011 ndash Volume 23 Issue 2
Figure 8 Effect sizes measured in standard deviations of separation between low-and middle-SES 10ndash12-year-old
African American children
2
25
3
35
4
Low
vs M
iddle SES
0
05
1
15
Language LTM WM Executive Control
SD Sep
aration
Source Martha J Farah David M Shera Jessica H Savage Laura Betancourt Joan M Giannetta Nancy L Brodsky Elsa K Malmud and Hallam Hurt 2006 ldquoChildhood Poverty Specific Associations with Neurocognitive Developmentrdquo Brain Research 1110(1) 166-74
But is this achievement gap attributable to cumula-tive risk and chronic stress With a recent follow-up of the sample depicted in Figures 4 and 5 Evans and col-leagues have now provided the first test of the final link in the RiskndashStress Model The baseline finding from their research is that working memory in early adulthood (ie age 17) deteriorated in direct relation to the number of years the children lived in poverty (from birth through age 13) If in other words a child lived in poverty con-tinuously his or her working memory was greatly com-promised The main result of interest however was that such deterioration occurred only among poverty-stricken children with chronically elevated physiological stress (as measured between ages 9 and 13) That is chronic early childhood poverty did not lead to working memory defi-cits among children who somehow avoided experiencing the stress that usually accompanies poverty
Conclusion
Childhood socioeconomic disadvantage leads to deficits in academic achievement and occupational at-tainment Itrsquos long been argued that such deficits arise because poor children are exposed to inadequate cogni-tive stimulation and to parenting styles that donrsquot encour-age achievement We donrsquot dispute the important role of these two variables But we have outlined here evidence for a new complementary pathway that links early child-hood poverty to high levels of exposure to multiple risks which in turn elevates chronic toxic stress This cascade can begin very early in life Even young babies growing up in low-income neighborhoods already evidence elevated chronic stress This stress then accounts for a significant portion of the association between poverty and working memory a critical cognitive skill involved in language and reading acquisition
The RiskndashStress Model suggests that the povertyndashachievement link can be broken by addressing (a) the ten-dency of poverty to be associated with physical or psycho-social risks (eg environmental toxins family turmoil) (b) the effects of such risks on stress and (c) the effects of stress on achievement If this model bears up under further testing it would be useful to explore which of these path-ways is most amenable to intervention
Gary W Evans is the Elizabeth Lee Vincent Professor of Human Ecology at Cornell University Jeanne Brooks-Gunn is the Virginia amp Leonard Marx Professor of Child Development amp Education and Co-Director of the Nation-al Center for Children and Families at Teachers College Columbia University Pamela Kato Klebanov is a Senior Research Scientist at the National Center for Children and Families at Teachers College Columbia University and a Visiting Research Collaborator at the Center for Research on Child Wellbeing at Princeton University
Special Focus Income Inequality
27 Community Investments Fall 2011 ndash Volume 23 Issue 2
Transformational Potential
There is a new game-changing program available for community development financial institutions (CDFIs) The CDFI Bond Guarantee Program offers CDFIs up to $1 billion of affordable long term
government guaranteed debt financing per year through 2014 to promote community and economic development in our nationrsquos low-income low-wealth and other disad-vantaged communities It significantly improves CDFIsrsquo access to capital offering financing terms that make sense for CDFIs and the communities they serve and helping CDFIs meet substantial unmet capital demand in target communities At the same time it has the potential to transform the way CDFIs capitalize themselves improving sustainability and financial stability
Quite frankly the CDFI Bond Guarantee Program could forever alter the landscape and future of the indus-try For that reason alone we need to make sure it works well for CDFIs and the communities they serve
CDFI Bond Opportunity of a DecadeBy Cathy Dolan
What is the CDFI Bond Guarantee Program
The purpose of the CDFI Bond Guarantee Program is to create a new CDFI investment vehicle for communi-ty and economic development purposes Passed as part of the Small Business Jobs Act of 2010 it is intended to support CDFIsrsquo role as economic engines of growth in the nationrsquos disadvantaged markets
Select features of the CDFI Bond Guarantee Program include
bull $3 billion in bond guarantee authority through 2014 with minimum bond size of $100 million
bull CDFIs will be able to issue taxable bonds with terms up to 30 years
bull The Federal Government Guarantee ensures repay-ment of verifiable losses of principal interest and call premium if any on bonds and notes
28 Community Investments Fall 2011 ndash Volume 23 Issue 2
Eye on Com
munity D
evelopment
bull The Program is being administered by the CDFI Fund at the US Department of the Treasury
bull The Federal Financing Bank will buy 100 percent of bonds and notes issued to simplify execution and min-imize cost and pricing
bull Participating CDFIs will be required to establish a risk share pool of three percent of the bond or note amount
bull Proceeds can be used by CDFIs to finance or refinance activity that meets the community and economic de-velopment definition of the Riegle Act (the enabling legislation for the CDFI Fund)
The CDFI Fund states that the program rules will be issued in the fall of 2011 and bonds are poised to be issued by the spring of 2012 The Program provides up to $3 billion of total financing before it sunsets in September 2014 unless reauthorized
Why is the CDFI Bond Guarantee Program so important now
The timing for this new program couldnrsquot be more op-portune With unemployment rates above nine percent and slowing GDP growth economic recovery has been disappointingly weak Low growth prospects lead to cor-porate hesitation to invest in new ventures and hire new workers However with interest rates at historic lows itrsquos an ideal time to borrow and invest for the future In fact recent monetary policy decisions have pushed long term rates even lower as of September 25 2011 30-year trea-suries are below three percent This may be a ldquoonce in a lifetimerdquo opportunity to lock in 30 year debt at rates this low Once economic activity ignites capital will become more expensive and more difficult to raise There is no better time than now to give CDFIs access to $1 billion per year of up to 30 year debt at rates similar to government securities
Why CDFIs
CDFIs have a long history of financing and meeting the needs of entities and individuals that lack access to the mainstream financial system But as the boundaries of the mainstream financial system contract the need for CDFIs to fill the gap increases Indeed while there are reports that corporate cash levels are at record highs the capital tills of small businesses and entrepreneurs are empty Large com-panies are reticent to invest in new initiatives and banksrsquo tightened credit standards have constrained small business and consumer lending While policy makers and regula-tors work hard to make capital more freely available in order to spark job creation and economic growth the only thing growing is cash accounts Lending and investment particularly in underserved markets remain low
CDFIs which are positioned to address these issues report increasing demand for credit in their markets partly in response to declining bank lending According to The Opportunity Finance Network (OFN) 2011 2nd Quarter CDFI Market Conditions Report (a publication based on quarterly surveys of CDFIs) 54 percent of respondents reported an increase in the number of financing applica-tions received year-over-year and 55 percent reported an increase in loan originations1 Among survey respondents 25 percent reported that they are capital-constrained and could have made more loans in the second quarter of 2011 if financing capital had been available To meet estimated demand in the next 12 months the respondents reported they would need an additional $880 million in capital
The respondents made these estimates assuming they were limited to the type of debt financing currently avail-able to CDFIs which is generally less than 10 years in term and priced based on market spreads over treasury securities or LIBOR In March 2011 OFN expanded the scope of this survey to gauge broader market demand for CDFI Bond-type financingmdashup to 30 years in term and priced at a small spread over treasury securities The re-sponses indicated an overwhelming confidence in CDFIsrsquo ability to absorb $1 billion per year to meet the needs of community businesses and individuals in low-income low-wealth and otherwise disadvantaged markets
What is the critical path to success
What will make the CDFI Bond Guarantee Program a success And how do we ensure CDFIs derive maximum advantage from the Program and dramatically impact communities in need There are many important princi-ples that will lead to a successful bond program including performance and outcome based evaluation and efficient and affordable participation among CDFIs but most criti-cal are the following objectives
1 The need for flexibility to accommodate the variety of financial structures that CDFIs use to serve low-income low-wealth communities
One of the CDFI industryrsquos strengths is its diversity of products and practices In order to adequately meet the needs of their underserved communities CDFIs need to be flexible and responsive to the unique factors that affect those businesses outside the mainstream financial system That means the program canrsquot be cookie cutter or one-size-fits-all in nature
To that end eligible uses need to include all financing sectors including housing small businesses community facilities retail and commercial real estate development in distressed markets and personal financial credit prod-ucts targeted at disadvantaged populations
29 Community Investments Fall 2011 ndash Volume 23 Issue 2
Moreover the terms of the bond need to accommodate the way CDFIs provide capital to their targeted markets CDFIs offer term financing lines of credit construction loans secondary capital investments and revolving lines of credit and the program should accommodate all these types of financing products
2 Financing via the CDFI Bond Guarantee Program is used and controlled by CDFIs with a proven track record of mission based financing
The prospect of a new government-guaranteed debt program could attract the attention of entities that fashion themselves as community development lenders but who lack the mission-based orientation and track record of re-sponsible financing that the CDFI industry has long stood for and upheld This program should be reserved only for those entities that have a proven record of responsible fi-nancing with a strong mission of creating access to re-sponsible and affordable financial services for disadvan-taged and underserved communities This program should not be available to CDFIs in name only
3 Underwriting based on CDFIrsquos assessment of riskProgram risk criteria and issuer selection should be
based on the CDFI industryrsquos performance track record not on that of the mainstream financial services industry There will be a temptation to look to mainstream finan-cial service providers and programs to assess the overall program risk and individual bond applications because this is a new program to a largely unregulated sector and Treasury (CDFI Fund) has few precedents to guide it However the CDFI industry has thrived for the past thirty years precisely because non-CDFI regulated institutions and for-profit finance companies operate so differently
The markets served by CDFIs are unique and by defi-nition outside the mainstream CDFIs understand how to underwrite and manage the risk of businesses individuals and community projects in underserved markets because they are close and responsive to their borrowers willing and able to provide technical assistance when necessary and flexible enough to work with borrowers when diffi-culties arise This high-quality track record is evidenced by OFNrsquos Inside the Membership Report which shows a weighted average cumulative net charge-off rate of 14 percent and weighted average delinquency of more than 30 days of 92 percent as of year-end 20091 As of the second quarter of 2011 problem loans seem to be in decline as OFNrsquos Market Conditions Report shows that membersrsquo rate of delinquency of more than 30 days had improved to 65 percent
This performance track-record is indicative of CDFIsrsquo unique ability to underwrite and manage risk When as-sessing the risk of the CDFI Bond Guarantee Program and designing underwriting criteria for use in the selection of bond applicants it will be critical for the CDFI Fund to use CDFIsrsquo track record and not that of the mainstream financial services sector
Conclusion
The CDFI Bond Guarantee Program is meant to en-courage the creation of a new type of security that would provide access to responsible financing for disadvantaged communities at meaningful volumes affordable cost and long terms If successful this program could dramatically improve access to capital recapitalize CDFI balance sheets (improving profitability and financial stability) and help banks and other mainstream financial institutions increase their financing in partnership with CDFIs for the benefit of low-income and low-wealth communities This could lead to important increases in the number of jobs created and retained the supply of quality affordable housing and access to vital community facilities and services In short the CDFI Bond Guarantee Program would give CDFIs access to a reliable supply of capital with a term and cost structure that has never before been available
As our economy struggles to regain footing CDFIs have a vital role to play as engines of growth and the CDFI Bond can help make it happen As Federal Reserve Chair-man Bernanke recently said ldquoProviding responsible credit for individuals and small business through community de-velopment financial institutions can stimulate economic activity that generates local tax revenuesrdquo2
The imperative is clear The CDFI Bond Guarantee Program needs to become a reality as soon as possible so CDFIs can increase financing to under-served markets and contribute to job creation and economic growth OFN encourages all those interested in the program to join the CDFI Bond Alliance which will actively shape the discussion on the design and implementation of the CDFI Bond on behalf of CDFIs for the full lifecycle of the programmdashfrom initial rule promulgation through bond issuance and ultimately to encourage reauthorization For more information visit httpopportunityfinancenetfinancing
Cathy Dolan is Chief Operating Officer of Opportunity Finance Network (OFN) the leading network of private financial institutions that creates growth that is good for communities investors individuals and the economy
30 Community Investments Fall 2011 ndash Volume 23 Issue 2
ou wonrsquot believe what my mother did yester-dayrdquo said Linda ldquoShe bought a new refrig-erator on credit Do you know how much itrsquos going to cost by the time she finishes paying
for itrdquo she exclaimed pointing out that her mother would be paying 21 percent interest Linda had read the terms of agreement for her motherrsquos new department store credit card marking a significant personal achievement Just five years ago Linda couldnrsquot read at more than a 3rd grade level much less understand the financial complexities of a credit agreement
Linda used to be one of the 30 million adults in the United States who canrsquot read or write well enough to perform important daily tasks such as reading food labels or filling out a job application They may be individuals
Building Literacy Skills and Transforming LivesBy Cathay Reta and Mari Riddle
who dropped out of school early or immigrants who had little formal education in their home countries The con-straints of limited educational attainment are worsened by a lack of literacy skills creating significant economic and personal hardship for these adults and their families Adult low literacy can be connected to almost every so-cio-economic issue in the United States more than 60 percent of all state and federal corrections inmates can barely read and write low health literacy costs $73 billion each year in the US and low literacyrsquos effects cost the US $225 billion or more each year in non-productivity in the workforce crime and loss of tax revenue due to unemployment1 Low literacy is more prevalent among low-income and minority populations with Blacks and Hispanics more than three times more likely than whites
Eye on Com
munity D
evelopment
31 Community Investments Fall 2011 ndash Volume 23 Issue 2
to be below basic literacy proficiency (see Figure 1)2 Ad-ditionally 41 to 44 percent of US adults in the lowest level on the literacy scale are living in poverty3
Figure 1 Percentage of Adults Below Basic Literacy Proficiency by Race
㜀
㐀
㐀㜀㐀㐀
㔀
㐀
㔀
㘀
倀爀漀猀攀 儀甀愀渀琀椀琀愀琀椀瘀攀
䘀椀最甀爀攀 ⴀ 倀攀爀挀攀渀琀愀最攀 漀昀 䄀搀甀氀琀猀 䈀攀氀漀眀 䈀愀猀椀挀 䰀椀琀攀爀愀挀礀 倀爀漀昀椀挀椀攀渀挀礀Ⰰ 戀礀 刀愀挀攀
圀栀椀琀攀
䈀氀愀挀欀
䠀椀猀瀀愀渀椀挀
Source National Center for Education Statistics 2003 National Assessment of Adult LiteracyNote Prose literacy relates to the skills required to search com-prehend and use continuous texts Quantitative literacy allows for the identification and performance of computations using numbers embedded in printed materials
The statistics are staggering but there are stories of hope and success like Lindarsquos Adult learners are varied and unique but their motivations are universal They want to support their childrenrsquos education They want better jobs They want to be more involved in their communi-ties The ability to read and write is a core foundational skill for each of those motivators
ldquoBeing able to read write do basic math and use a computer are critical building blocks that the 30 million Americans who function at below basic literacy levels are in need of in order to find and keep sustainable em-ploymentrdquo says David C Harvey president and CEO of ProLiteracy the oldest and largest nonprofit organization dedicated to advancing the cause of adult literacy and basic education ldquoHaving access to literacy resources and literacy instruction contributes to these adults being able to find jobs earn a living wage and improve their healthmdashall of which have far-reaching effects on our countryrsquos ability to compete globallyrdquo says Harvey
The need for adult literacy education has never been greater ldquoRight now millions of Americans are struggling to find work and policymakers are emphasizing the need to create jobs and retrain our workforce As part of that retraining we must invest in adults who struggle with the simplest reading writing and math tasks They are most in need of such investment to help them find and keep jobsrdquo says Harvey Even for those employed American
businesses spend more than $60 billion each year on em-ployee training much of that for remedial reading writing and mathematics4
This article demonstrates how advancements in adult literacy education can significantly improve the lives of individuals with low literacy skills their families and their communities It also provides specific examples of inte-grated initiatives that aim to weave literacy instruction into broader skill building efforts such as financial and health education
Transforming Families ndash Breaking the Cycle of Illiteracy
At Centro Latino for Literacy a Los Angeles-based non-profit organization and member of ProLiteracy most of the students are in their 20s and 30s with young children and they are motivated to break the intergenerational cycle of illiteracy Consider the story of student Julia RodrIacuteguez ldquoIrsquom from Guerrero Mexico and Irsquom 34 years old I was the oldest and I had to help my parents take care of my younger siblings We were very poor and there was no money for school Over time my siblings went to school but I stayed working Now Irsquom a mother of three and Irsquom very motivated to learn so that I can help my children succeed They are my inspiration to learnrdquo
Rodriguez is on the right track According to an October 2010 report from the National Institute for Health improving mothersrsquo literacy skills may be the best way to boost childrenrsquos achievement5 A motherrsquos reading skill is the greatest determinant of her childrenrsquos future academic success even outweighing other factors such as neigh-borhood and family income Adults who improve their literacy skills gain the ability to read with their children and support their schoolwork They also become more effective role models Jasmin the 11 year old daughter of another Centro Latino student said ldquoMy mom really gives her all to learn to read We help her so that she doesnrsquot get discouraged I tell her lsquoYou can do it Momrsquo I am so proud of her and she inspires me because shersquos always pushing forwardrdquo Young people like Jasmin show the transformative power of adult learning where invest-ments in education reach not only the adults but their children as well
Health Literacy
ldquoI tried to donate blood for my daughter who was ill with cancer When they handed me medical history forms to complete I ran out of the room because I couldnrsquot fill out the forms It was embarrassingrdquo recounts an adult student in a San Diego County literacy program Shersquos not alone Enrique Ramirez another student shares ldquoThe nurses told me to take the elevator and go to where it says lsquox-raysrsquo I took the elevator and I just went home because
32 Community Investments Fall 2011 ndash Volume 23 Issue 2
I couldnrsquot read the signs Itrsquos a scary thing when you donrsquot know the wordsrdquo
The Community Health Improvement Partners (CHIP) a coalition of San Diego health care systems is working to address the impact of low literacy skills on individualsrsquo health and the cost to the health care system Research shows that low health literacy skills among 90 million adults in the United States results in $73 billion of po-tentially avoidable health care expenditures annually6 Many patients are unable to read basic health materials comprehend directions for taking medications or under-stand information on an appointment slip In one Cali-fornia study 65 percent of adults with low reading skills reported they avoid going to the doctor because of dif-ficulties associated with completing the paperwork7 And 75 percent of medical professionals answered they were aware of medical errors that were the product of low lit-eracy levels8
In 2007 CHIP and the San Diego Council on Literacy (SDCOL) formed a partnership to address health literacy challenges in San Diego County Together the organiza-tions developed a plan which is now being implemented under the name of Health Literacy San Diego9 First the agencies and their partners are training front and back office medical staff on how to identify and support low literate patients especially those who are English speakers who read below the eighth grade level but do not disclose their difficulty with the paperwork Focus groups revealed that medical staff members were aware of the needs but they were frustrated by a lack of training in how to handle them Jose Cruz CEO of SDCOL reports ldquoOne technique that we teach trainees is to use the lsquoteach backrsquo method with their patients Patients in turn teach back to the staff what they heard from their doctor during their appoint-mentrdquo This helps to make sure patients understand their condition and what they need to do Second Health Lit-eracy San Diego has developed curriculum to integrate health literacy topics and vocabulary into literacy lessons taught by its affiliated programs throughout the county ldquoWe are addressing the cultural language and literacy barriers that impact health outcomes for adults with low literacy skillsrdquo says Cruz
Financial Literacy
As evidenced by the recent financial crisis the US financial system is highly complex and consumers often struggle to make sense of new products and regulationsmdashlow literacy adults are likely to struggle even more Efforts that aim to improve functional literacy in conjunction with financial literacy can play a significant role in helping in-dividuals achieve financial stability Project Read an adult literacy program of the South San Francisco Public Library began a Financial Well-Being Project three years ago that
targets low-income individuals with low literacy skills The program offers financial education and coaching which helps clients create spending plans build emergency savings funds and plan strategies to build wealth ldquoClasses are fun positive and as basic as possiblerdquo says Fernando Cordoba Literacy Services Coordinator and instructor The program has also helped to connect participants with Opportunity Fund a non-profit social enterprise organiza-tion that provides microloans to low-income individuals looking to start or expand a small business
Cordoba shares that it is difficult to bring about behav-ioral change Students can easily gain financial knowledge in the classes but they are reaching beyond that ldquoThey [the adult students] already handle money and itrsquos hard to change patternsrdquo he says Project Read uses incentives such as gift cards for completing assignments and raising credit scores These are good motivators but what really makes a difference is the personal individual attention stu-dents receive and the trust they have with Project Read According to Cordoba successes have come with students who have an ongoing relationship with the program ldquoThey are looking for structure and we provide thatrdquo he says Along with that structure students gain confidence and trust ldquoA lot of students tell us they are leery of financial in-stitutions that seem to be more interested in lsquoselling themrsquo something rather than helping them They understand that our services are truly student-centeredrdquo says Cordoba
Addressing Native Language Literacy
The challenges connected to low English literacy skills are compounded for immigrant adults illiterate in their own native languages Itrsquos common for non-literate Spanish speakers to enroll in English as a Second Language programs only to find them too difficult After struggling to keep up these students may drop out There is a pressing need for native language literacy as evidenced by a 2006 report The Integration of Immigrants in the Workplace which estimates that 32 percent of adults enrolled in ESL classes lack basic literacy skills in their native language making them ldquoslower in learning a second language than their literate counterpartsrdquo10
Centro Latino helps non-literate Spanish speakers to learn English and other vital skills by teaching them first to read and write in Spanish This approach builds the foun-dational skills and confidence needed to learn English and pursue other goals Centro Latino is located in the WestlakePico Union neighborhood immediately west of downtown Los Angeles and serves over 1000 Spanish speakers each year in a county where almost 216000 adult Spanish speakers cannot read or write in any lan-guage The organizationrsquos clients have endured severe poverty and isolation in their youth and generally have had fewer than three years of formal education
Eye on Com
munity D
evelopment
33 Community Investments Fall 2011 ndash Volume 23 Issue 2
At Centro Latino adults learn basic reading and writing skills in Spanish through LeamosTM a web-based literacy curriculum Leamos is a self-paced application that allows students to progress through lessons at their own rate As a result most participants learn to read and write in ap-proximately 100 - 150 hours (two to five months) at the computer Leamos teaches Spanish-speaking youth and adults to read and write as a crucial first step in enabling them to learn English overcome their fear of technology improve job readiness and access information and ser-vices The web-based platform allows non-literate Spanish speaking adults to access the materials any place with in-ternet access such as the public library
Conclusion
As the United Nations Educational Scientific and Cul-tural Organization (UNESCO) states in its literacy strategy literacy is about empowerment - not what literacy can do for people but rather what people can do with literacy11 This is certainly true in the United States Just ask Centro Latino student Ana Martiacutenez who says ldquoBefore I could not read the names of the streets and my husband would have to direct me on how to get around Since studying [at Centro Latino] I am able to read street names and get along on my own I can now read story books to my granddaughterI am now able to list and measure the clothes I make at the garment factory I work in I learned how to create and monitor a budget This has helped me to manage my income including monthly expenses In the past I would try to save but was not successful because I didnrsquot have a systemrdquo And Ana is not alone For every adult who becomes literate there is a story of newfound independence The transformative power of literacy im-proves the economic social and physical health of in-dividuals and their families for generations to come
Cathay Reta is a consultant who coordinates the Pro-Literacy California Initiative part of ProLiteracy the worldrsquos largest organization of adult literacy and basic education programs today Mari Riddle is President and Chief Execu-tive Officer of Centro Latino for Literacy a Los Angeles-based nonprofit dedicated to teaching literacy and provid-ing educational opportunities to Latino adult and youth who have not had the benefit of an education
34 Community Investments Fall 2011 ndash Volume 23 Issue 2
30
Real Family Income Growth by Quintile 1947‐1979 and 1979‐2009
25
2224 24
2225
1315
20
0 4
0710
01
04
00
05
‐03‐05
Lowest Second Third Fourth Highest Fifth Fifth Fifth Fifrth Fifth
1947‐1979 1979‐2009Source Economic Policy Institute analysis of US Census Bureau data
DATA SNAPSHOTReal Family Income Growth by Quintile
1947ndash1979 and 1979ndash2009Average Household Income (Post-Tax)
1979ndash2007
Source Congressional Budget OfficeSource Economic Policy Institute analysis of US Census Bureau data
Source CIA World Factbook
Gini IndexThe Gini index measures the degree of inequality in the distribution of family income in a country The lower a countryrsquos Gini index the more equal its income distribution the higher the index the greater the level of income inequality
$600
$800
$1000
$1200
$1400
ome ($00
0s in 20
07 dollars)
Average Household Income (Post‐Tax) 1979‐2007
Top 1 Top 5 Fourth 20 Bottom 20
$0
$200
$400
1979
1981
1983
1985
1987
1989
1991
1993
1995
1997
1999
2001
2003
2005
2007Av
erage Hou
seho
ld In
c o
Source Congressional Budget Office
Quarterly Features
35 Community Investments Fall 2011 ndash Volume 23 Issue 2
Economic Downturns and Inequality
More than two years into the US recovery re-searchers have started to look at how the recent recession may have impacted income inequal-
ity How does an economic crisis impact earnings and income inequality if at all What can we learn from pre-vious recessions What factors influence whether or not a financial crisis will increase inequality
Carlo V Fiorio and Catherine Saget survey the existing literature on global financial crises and find no relation-ship between crises and changes in earnings inequality (ie wage distribution) but point out that in most cases income inequality (which takes into account income from capital and social transfers) decreases after a financial crisis Their findings suggest that each countryrsquos institu-tional structure impacts how inequality changes after a financial crisis In Finland for example inequality levels remained basically unchanged despite a striking increase in unemployment from 1990-1993 which the authors attribute to a strong public benefit system that supplied generous unemployment benefits including training pro-grams In contrast the East Asian financial crisis of 1997-1998 correlated to an increase in inequality potentially due to policies enacted after the crisis that promoted eco-nomic recovery by benefitting the corporate and financial sectors while increasing poverty through cuts in social services
Using Current Population Survey data Fiorio and Saget find a minor increase in US earnings inequality but when they account for the unemployed (counting their wages as zero) the increase becomes much larger They attribute this increase in inequality to low wage workers being more likely to lose their jobs during the recession and because social transfers and the wages from replace-ment jobs are both lower than earnings received by these workers prior to the crisis
Fiorio Carlo V and Saget Catherine (2010) ldquoReducing or aggravating inequality Preliminary findings from the 2008 financial crisisrdquo International Labour Office Policy Integration Department Geneva
The Low Income Housing Tax Credit and Racial Segregation
The Low Income Housing Tax Credit (LIHTC) is an indirect Federal subsidy used to finance the devel-opment of affordable rental housing for low-income
households The program is administered by the Internal Revenue Service (IRS) and has a provision that awards de-velopers with higher tax credit allocations for siting proj-ects in Qualified Census Tracts (QCTs) which are high-poverty neighborhoods that are often populated with a high concentration of minorities Despite the success of LIHTC in increasing the supply of affordable rental units one oft-cited concern is that the program is contributing to racial segregation but is this actually the case
Keren Horn and Katherine OrsquoRegan use data from HUD and the census along with data collected on the racial composition of LIHTC tenants in three states to address this question They examine three channels through which the LIHTC could potentially affect racial segregation the siting of LIHTC units relative to other non-LIHTC units that serve low-income populations the racial composition of residents in LIHTC projects and changes in neighborhood composition in areas in which tax credit projects are built They find that LIHTC units are only slightly more likely to be located in high-minority tracts than other units occupied by near-poor and poor renters and that neighborhoods of high minority concentration experience declines in minority representation over time rather than an increase Additionally Horn and OrsquoRegan find that increases in the use of tax credits between 1980 and 2000 in metropolitan areas are associated with de-clines in racial segregation
Despite the finding that the LIHTC program on average is not associated with an increase in racial segre-gation the authors recognize that persistent racial segre-gation remains a challenge in this country They conclude that targeting criticism of the LIHTC on concerns of racial segregation may take efforts away from identifying other important areas of improvement for the program
Horn Keren and OrsquoRegan Katherine (2011) The Low Income Housing Tax Credit and Racial Segregation Furman Center for Real Estate and Urban Policy New York University Working Paper httpfurmancenterorgresearchpublicationstagsubsidized+housing
RESEARCH BRIEFS
36 Community Investments Fall 2011 ndash Volume 23 Issue 2
Quarterly FeaturesDefaults and Saving among Low-Income
Tax Filers
Previous research has demonstrated the power-ful effect that default setting can have on financial decision-making particularly in the area of 401(k)
savings behavior By simply switching the default to auto-matic enrollment requiring users to opt-out if they do not wish to save participation rates in defined contribution plans tend to increase dramatically But do the effects of this type of nudge extend to other savings programs and populations
The results of a recent study suggest that default setting does not impact savings behavior among low-income tax filers In 2009 a new initiative designed to increase retire-ment savings allowed tax filers to purchase US Savings Bonds with their federal income tax refunds and advocates supported the policyrsquos ldquosaveable momentrdquo approach Erin Todd Bronchetti Thomas Dee David Huffman and Ellen Magenheim conducted a field study at eight Volunteer Income Tax Assistance sites during the 2010 tax season to test whether default setting would affect the take up rate among low-income tax filers to receive some or all of their refunds in US Savings Bonds They find that regard-less of whether the default requires an opt-in or opt-out of the savings bond option the participation rate in the savings program is roughly nine percent The authors point out that the success of increasing saving among higher-in-come 401(k) participants through default switching should
not be automatically generalized for other policy settings particularly among lower-income populations One pos-sible explanation for why the nudge was ineffective was that 75 percent of filers indicated they already had plans for how to spend the refund Nearly 70 percent of low-income filers stated that they had trouble paying bills and only 17 percent stated they had plans to save some of their refund demonstrating the resource constraints facing this population
The authors emphasize that ldquo401(k) defaults may be powerful because they coincide with the pre-existing in-tentions to save of relatively affluent individuals To the extent that low-income filers do not have strong intentions to save at tax time defaults may have little effectrdquo One implication of these findings is that prior to implement-ing default switching interventions to impact the savings behavior of low-income individuals more needs to be done to shift their savings expectations For example matched savings programs have demonstrated that the poor can effectively alter their savings expectations and develop assets Further research is necessary to measure the impact of defaults for different populations under dif-ference scenarios
Bronchetti E Dee T Huffman D and Magenheim E (2011) When a Nudge Isnrsquot Enough Defaults and Saving among Low-Income Tax Filers NBER Working Paper 16887 httpwwwnberorgpapersw16887pdf
37 Community Investments Fall 2011 ndash Volume 23 Issue 2
DOCTOR CRA by John Olson
Dear Anxious
We know itrsquos tough not knowing what to expect from the CRA reform process but that doesnrsquot mean you canrsquot start thinking about how yoursquoll respond to the changes when they do come Itrsquos a good time to review your CRA program to make sure you are prepared to implement any changes Some things to think about
Plan to comment on any proposed changes When I hear a concern about a new rule my first question is always ldquodid you submit a commentrdquo Far too often the answer is ldquonordquo The agencies really do read all comments and want to hear about the impact of the proposed rule on your financial institution Itrsquos important for everyone with an opinion to submit a written comment Detailed instructions for submitting comments will be provided in the proposal itself
Dear Dr CRA ndash
Wersquore all waiting anxiously for word from Washington on the changes to the CRA While wersquore waiting is there anything I can do to be getting ready
Sincerely Anxiously Awaiting New Rules
Create a strategy for interpreting and implementing the changes Do you have up-to-date policies and pro-cedures for your CRA compliance program How will you amend and distribute the new procedures How will you communicate the changes to senior man-agement How will you communicate the changes to lenders branch managers and other key staff Think-ing through these questions beforehand and developing your plan can make the implementation phase more efficient and successful
Receiving new rules can be a challenge but I encour-age you to also see it as an opportunity It could be your chance to raise awareness of your CRA program in your institution to implement a strategy yoursquove been wanting to try and to re-engage your CRA stakeholders through-out the bank Use the new rules as your chance to re-evaluate your program and take it in a new direction
38 Community Investments Fall 2011 ndash Volume 23 Issue 2
EndnotesAddressing Widening Income Inequality through Community Development
1 USCensusBureau(2010)SmallAreaIncomeampPovertyEstimatesforstatesandcountieshttpquickfactscensusgovqfdstates00000html
2 CostelloD(2011April9)TheDroughtIsOver(atLeastforCEOrsquos)TheNew York TimesppBU1Onlineathttpwwwnytimescom20110410business10comphtmlpagewanted=all
3 StanfordCenterfortheStudyofIncomeandInequalityldquoWelcometoInequalitycomrdquoretrievedfromhttpwwwstanfordedugroupscspi
4 WilkinsonRampPickettK(2009) The Sprit Level Why Greater Equality Makes Societies Stronger NewYorkBloomsburyPress
5 Ibid
6 PutnamRD(2000)Bowling Alone The collapse and revival of American community NewYorkSimonandSchuster
7 SaezEampPikettyT(2003)IncomeInequalityintheUnitedState1913-1998QuarterlyJournalofEconomics118(1)1-39Updateddataavailableonlineathttpelsaberkeleyedu~saez
8 GoldinCampMargoRA(1991)ldquoTheGreatCompressionTheWageStructureintheUnitedStatesatMid-CenturyrdquoNBERWorkingPapers3817NationalBureauofEconomicResearchInc
9 KrugmanP(2007)The Conscience of a Liberal NewYorkWWNortonampCompanyInc
10 FromldquoEconomicInequalityintheUnitedStatesrdquoaspeechgivenattheCenterfortheStudyofDemocracyonNovember62006byformerFRBSFPresidentJanetYellenAvailableonlineathttpwwwfrbsforgnewsspeeches20061106html
11 FormoreontheGiniindexseetheCIAWorldFactbookathttpswwwciagovlibrarypublicationsthe-world-factbookrankorder2172rankhtml
12 Ibid
13 ForamoredetailedanalysisofthecausesoftheGreatDivergenceseeNoahT(2010September10)TheUnitedStateofInequalityRetrievedfromhttpwwwslatecomid2266025entry2266026
14 KodrzyckiY(2002)EducationalAttainmentasaConstraintonEconomicGrowthandSocialProgressEducationinthe21stCenturyMeetingtheChallengesofaChangingWorldConferenceSeries47June2002FederalReserveBankofBoston
15 KatzL(2002)DiscussionEducationalAttainmentasaConstraintonEconomicGrowthandSocialProgressEducationinthe21stCenturyMeetingtheChallengesofaChangingWorldConferenceSeries47June2002FederalReserveBankofBoston
16 BermanEliJohnBoundampZviGriliches1994ldquoChangesintheDemandForSkilledLaborwithinUSManufacturingIndustriesEvidencefromtheAnnualSurveyofManufacturingrdquoQuarterly Journal of Economics 109367-397SeealsoBresnahanFBrynjolfssonEampandHittLM(2002)InformationTechnologyWorkplaceOrganizationandtheDemandforSkilledLaborFirm-LevelEvidenceQuarterlyJournalofEconomics1171339-376
17 GoldinCampKatzL(2008)The Race between Education and Technology CambridgeMAHarvardUniversityPress
18 SourceBureauofLaborStatisticsnotseasonallyadjusted
19 WilliamsR(2011)WhoBenefitsfromTaxExpendituresTaxNotesMay22011TaxPolicyCenterhttpwwwurbanorguploadedpdf1001537-Who-Benefits-From-Expenditurespdf
20 WilsonRPersonalExemptionsandIndividualIncomeTaxRates1913-2002DataReleaseInternalRevenueServicehttpwwwirsgovpubirs-soi02inpetrpdf
21 Ibid
22 BurkhauserR(2011)PresidentialaddressEvaluatingthequestionsthatalternativepolicysuccessmeasuresanswerJournal of Policy Analysis and Management30(2)205ndash215
23 PeriG(2010)TheEffectofImmigrantsonUSEmploymentandProductiv-ityFederalReserveBankofSanFranciscoEconomicLetter2010-26httpwwwfrbsforgpublicationseconomicsletter2010el2010-26html
24 CardD(2009)ImmigrationandInequalityNBERWorkingPaperNo14683httpwwwnberorgpapersw14683
25 Ibid
26 Yellen(2006)Seenote10
27 KrugmanP(2008)TradeandWagesReconsideredBrookingsPapersonEconomicActivitySpring2008WashingtonDCBrookingsInstitutionPress
28 Ibid
29 JaumotteFLallSampPapageC(2008)RisingIncomeInequalityTech-nologyorTradeandFinancialGlobalizationIMFWorkingPaper08185httpwwwimforgexternalpubsftwp2008wp08185pdf
30 Yellen(2006)Seenote10
31 FromldquoEconomicandFinancialInclusionin2011WhatitMeansforAmeri-cansandourEconomicRecoveryrdquoaspeechgivenattheNewAmericaFoundationForumWashingtonDCJune292011byGovernorSarahBloomRaskinAvailableonlineathttpfederalreservegovnewseventsspeechraskin20110629ahtm
32 Ibid
33 HeckmanJ(September12010)LettertotheNationalCommitteeonFiscalResponsibilityandBudgetReformwwwheckmanequationorgsystemfilesFederal-Commision_9-1-2010FINAL20_3_pdf
34 Yellen(2006)Seenote10
35 AnnieECaseyFoundation(2011)PromotingOpportunityfortheNextGenerationKidsCountDataBookhttpwwwaecforg~mediaPubsInitiativesKIDS20COUNT1232011KIDSCOUNTDataBook2011KCDB_FINAL_essaypdf
36 NationalCenterforChronicDiseasePreventionandHealthPromotionStudentHealthandAcademicAchievementRetrievedfromhttpwwwcdcgovHealthyYouthhealth_and_academics
37 CommunityAffairsOfficesoftheFederalReserveSystemandTheMetropolitanPolicyProgramattheBrookingsInstitution(2006)The Enduring Challenge of Concentrated Poverty in Americahttpwwwfrbsforgcpreport
38 Formoreonplace-basedcommunitydevelopmentseetheSpring2010issueofCommunity Investmentsavailableonlineathttpwwwfrbsforgpublicationscommunityinvestments1005indexhtml
39 SpeechbyChairmanBenBernankeFebruary62007TheLevelandDistributionofEconomicWell-BeingPresentedattheGreaterOmahaChamberofCommerceOmahaNebraskahttpwwwfederalreservegovnewseventsspeechbernanke20070206ahtm
39 Community Investments Fall 2011 ndash Volume 23 Issue 2
EndnotesUnderstanding Both Sides of the Inequality Debate
1 USBureauoftheCensusIncomeintheUnitedStates2002CurrentPopulationReportsSeriesP60-221September2003p25
2 HedermanJrRampRectorR(2004)TwoAmericasOneRichOnePoorUnderstandingIncomeInequalityintheUnitedStatesBackgrounder1791August242004TheHeritageFoundation
3 GarrettT(2010)USIncomeInequalityItrsquosNotSoBadInsidetheVaultVolume14Issue1Spring2010FederalReserveBankofStLouis
4 BernsteinJMishelLBrochtC(2000)AnyWayYouCutItIncomeinequalityontheriseregardlessofhowitrsquosmeasuredEconomicPolicyInstitutehttpepi3cdnnet2a07e6f50730c16d1a_6wm6b9fcypdf
5 GarrettT(2010)Seenote3
6 BernsteinJMishelLBrochtC(2000)Seenote4
7 OkunA(1975)EqualityandEfficiencytheBigTradeoffWashingtonDCBrookingsInstitution
8 GarrettT(2010)Seenote3
9 BergAampOstryD(2011)EqualityandEfficiencyFinanceampDevelopment48(3)InternationalMonetaryFundQuintinEampSavingJ(2008)Inequal-ityandGrowthChallengestotheOldOrthodoxyEconomicLetterFederalReserveBankofDallasVol3No1January2008PerssonTampTabelliniG(1994)IsInequalityHarmfulforGrowthTheAmericanEconomicReview84(3)600-621
10 CoxMampAlmR(2008)ldquoYouAreWhatYouSpendrdquoNewYorkTimesFebru-ary102008
11 BernsteinJMishelLBrochtC(2000)Seenote4
Ties that Bind Income Inequality and Income Segregation
1 ForareviewofthisliteraturepleaseseeldquoTheEnduringChallengeofConcen-tratedPovertyinAmericaCaseStudiesfromCommunitiesAcrosstheUSrdquoTheFederalReserveSystemandtheBrookingsInstitution2008
2 ThisisnottosaythatquestionsofracialsegregationarebehindusInmanyrespectsitisdifficulttoteaseoutthedifferencesbetweenracialandeconomicsegregationgiventhestrongintersectionofraceandclassintheUnitedStatesmdashpovertyratesamongAfricanAmericansandHispanicsaretwiceashighastherateamongnon-HispanicwhitesResearchersmaintainthatthereisadistinctbutoverlappingpatternofracialandclasssegregation
3 DouglasMasseyJonathanRothwellandThurstonDomina(2009)ldquoTheChangingBasesofSegregationintheUnitedStatesrdquoTheAnnalsoftheAmericanAcademyofPoliticalandSocialScienceNovember200962674
4 Ibid
5 TaraWatson(2009)ldquoInequalityandtheMeasurementofResidentialSegre-gationbyIncomeinAmericanNeighborhoodsrdquoTheReviewofIncomeandWealthSeptember2009553
6 Ibid
7 PaulJargowsky(2003)ldquoStunningProgressHiddenProblemsTheDramaticDeclineofConcentratedPovertyinthe1990srdquoTheBrookingsInstitutionMay2003
8 ToddSwanstromColleenCaseyRobertFlackandPeterDrier(2004)ldquoPullingApartEconomicSegregationamongSuburbsandCentralCitiesinMajorMetropolitanAreasrdquoTheBrookingsInstitutionOctober2004
9 Masseyetal(2009)Watson(2009)
10 DanielLichterDomenicoParisiandMichaelTaquino(2011)ldquoTheGeog-raphyofExclusionRaceSegregationandConcentratedPovertyrdquoNationalPovertyCenterWorkingPaperSeriesMay20111116
11 Ibid
12 Swanstrometal(2004)
13 RandallEbertsGeorgeErickcekandJackKleinhenz(2006)ldquoDashboardIndicatorsfortheNortheastOhioEconomyPreparedfortheFundforOurEconomicFuturerdquoTheFederalReserveBankofClevelandWorkingPaperSeriesavailableathttpwwwclevelandfedorgresearchworkpaper2006wp06-05pdf
14 StevenRaphaelandMichaelAStoll(2010)ldquoJobSprawlandtheSuburban-izationofPovertyrdquoTheBrookingsInstitutionMarch2010
15 RobertSampson(2009)ldquoRacialStratificationandtheDurableTangleofNeighborhoodInequalityrdquoTheANNALSoftheAmericanAcademyofPoliticalandSocialScienceJanuary2009621260
16 Transcriptavailableathttpwwwfrbsforgcdinvestmentsconferenceshealthy-communities2010-washington-dc
17 JonathanRothwellandDouglasMassey(2010)ldquoDensityZoningandClassSegregationinUSMetropolitanAreasrdquoSocialScienceQuarterlyDecember2010915
18 Ibid
The Polarization of Job Opportunities in the US Labor Market Implications for Employment and Earnings
1 StatisticsrefertotheUScivilianlaborforceages16andaboveandareseasonallyadjustedSourceUSBureauofLaborStatistics(wwwblsgovaccessedon4112010)
2 ArecentstudybyCouchandPlaczekconfirmstheseresultsbutputsthelonger-termearningslossesat12to15percentCouchKampPlaczekD(2010)EarningLossesofDisplacedWorkersRevisitedAmerican Economic Review 100(1)572-589
3 SullivanDampvonWachterT(2009)JobDisplacementandMortalityAnAnalysisusingAdministrativeDataQuarterly Journal of Economics 124(3)1265-1306
4 AutorD(2010)ThePolarizationofJobOpportunitiesintheUSLaborMarketImplicationsforEmploymentandEarningsTheHamiltonProjectandtheCenterforAmericanProgressAvailableonlineathttpwwwbrook-ingsedupapers201004_jobs_autoraspx
5 AcemogluDampAutorD(2010)TechnologySkillsandWagesInOrleyAshenfelterandDavidCardeds Handbook of Labor EconomicsVol4(NorthHollandElsevier2010)(Forthcoming)
40 Community Investments Fall 2011 ndash Volume 23 Issue 2
6 AlthougheconomistswouldtypicallyviewthewagespaidtoajobasthebestsummarymeasureofthejobrsquosskillrequirementslayreadersmaytakesomeassurancethatwagesasaskillmeasurearehighlycorrelatedwithlogicalalternativessuchaseducationandexperienceMoreovertherankingofoccupationalskillsbasedoneitherwageoreducationallevelsisquitestableovertimeThustheconclusionsherearenotsensitivetotheskillmeasure(wageseducation-experience)northechoiceofbaseyearforskillranking(here1980)
7 ThereasonforusingadifferentdatasourceandtimeperiodforthisfigurefromthepriorfigureisthattheCensusdatahavelargeenoughsamplesizestobeusefulfortheoccupationlevelexercisebuttheyarelessthanidealformeasuringhourlywagesIusetheMayORGdataforhourlywageswhichareasuperiorsource
8 GoosMManningAampSalomonsA(2009)JobPolarizationinEuropeAmerican Economic Review99(2)58-63Thechoiceoftimeperiodreflectstheavailabilityofconsistentdata(unavailablepriorto1993)Therankingofoccupationsbyskilllevelisinvariantacrosscountriesasneces-sitatedbydatalimitationsTheauthorsreporthoweverthattherankingofoccupationsbywagelevelishighlycorrelatedacrossEUcountries
9 AutorDLevyFampMurnaneR(2003)TheSkillContentofRecentTechno-logicalChangeAnEmpiricalExplorationThe Quarterly Economic Journal118(4)1279-1333
10 AdjustingforinflationusingthePersonalConsumptionExpendituredefla-tortherealminimumwageinconstant2008dollarswas$750in1979$529in1989$641in1999and$547in2006and$653in2009Thustherealfederalminimumwagedeclineddramaticallybetween1979and1989Itfluctuatedmodestlyinrealtermsuntil2006whenitrosesharplyoverthreeyears
11 HamermeshD(2001)ChangingInequalityforWorkplaceAmenitiesQuar-terly Journal of Economics114(4)1085-1123PierceB(2001)Compensa-tionInequality Quarterly Journal of Economics 116(3)1493-1525PierceV(2008)ldquoRecentTrendsinCompensationInequalityrdquoWorkingPaper(BureauofLaborStatistics)
12 PierceldquoCompensationInequalityrdquoPierceldquoRecentTrendsinCompensationInequalityrdquo
13 Notablythecollegecompletionrateforthisgroupwashigherin1990(29percent)thanin2008or2008(24percentand27percent)
EndnotesCDFI Bond Opportunity of a Decade
1 OpportunityFinanceNetworkMarketConditionsReportsavailableonlineathttpwwwopportunityfinancenetstorecategoriesaspcID=29
2 SpeechbyChairmanBenBernankeonApril292011attheFederalRe-serveCommunityAffairsResearchConferenceinArlingtonVirginiahttpwwwfederalreservegovnewseventsspeechbernanke20110429ahtm
Building Literacy Skills and Transforming Lives
1 ProLiteracyTheImpactofLiteracyBasicFactsaboutLiteracyhttpwwwproliteracyorgpageaspxpid=345
2 NationalCenterforEducationStatistics(2003)NationalAssessmentofAdultLiteracyAFirstLookattheLiteracyofAmericarsquosAdultsinthe21stCenturyhttpncesedgovnaalpdf2006470pdf
3 KirschIJungeblutAJenkinsLampKolstadAl(2002)ldquoAdultLiteracyinAmericaAFirstLookattheFindingsoftheNationalAdultLiteracySurveyrdquoNationalCenterforEducationStatisticshttpncesedgovpubs9393275pdf
4 ProLiteracySeenote1
5 NationalInstitutesofHealth(October252010)ImprovingMothersrsquoLiteracySkillsMayBeBestWaytoBoostChildrenrsquosAchievementhttpwwwnichdnihgovnewsreleases102510-reading-family-incomecfm
6 CenteronanAgingSocietyLowHealthLiteracySkillsIncreaseAnnualHealthCareExpendituresby$73BillionGeorgetownUniversityhttpihcrpgeorgetowneduagingsocietypubhtmlhealthlithtml
7 CaliforniaHealthLiteracyInitiativeLowLiteracyHighRiskTheHiddenChallengeFacingHealthCareinCaliforniahttpcahealthliteracyorgpdffilesallfourpageshealthlitreportpdf
8 Ibid
9 CommunityHealthImprovementPartnersWhenWordsGetintheWayACollaborativePlantoAddressHealthLiteracyinSanDiegoCountyhttpwwwliteracysandiegoorgpdfHealthLiteracyReport_FINALpdf
10 CreticosPSchultzJBeelerABallE(2006)TheIntegrationofIm-migrantsintheWorkplaceTheInstituteforWorkandtheEconomy
11 UNESCOLiteracyStrategyhttpwwwunescoorgneweneducationthemeseducation-building-blocksliteracystrategy
41 Community Investments Fall 2011 ndash Volume 23 Issue 2
Free sub
scriptio
ns an
d ad
ditio
nal co
pies are
available u
po
n req
uest fro
m th
e Co
mm
un
ity D
evelopment D
epartment Federal R
eserve Bank
of San Francisco 101 Market Street San Francisco
California 94105 or call (415) 974-2765
Change-of-address and subscription cancellations
should be sent directly to the Com
munity D
evelop-m
ent Departm
ent Please include the current mail-
ing label as well as any new
information
The views expressed are not necessarily those
of the Federal Reserve B
ank of San Francisco or the Federal R
eserve System M
aterial herein may
be reprinted or abstracted as long as Com
munity
Investments is credited Please provide Laura C
hoi in the C
omm
unity Developm
ent Departm
ent with
a copy of any publication in which such m
aterial is reprinted
Fed
eral reserve B
ank o
F san F
rancisco
101 MARKET STREET
SAN FRAN
CISCO CA 94105
ADD
RESS SERVICE REQU
ESTED
AU 10252
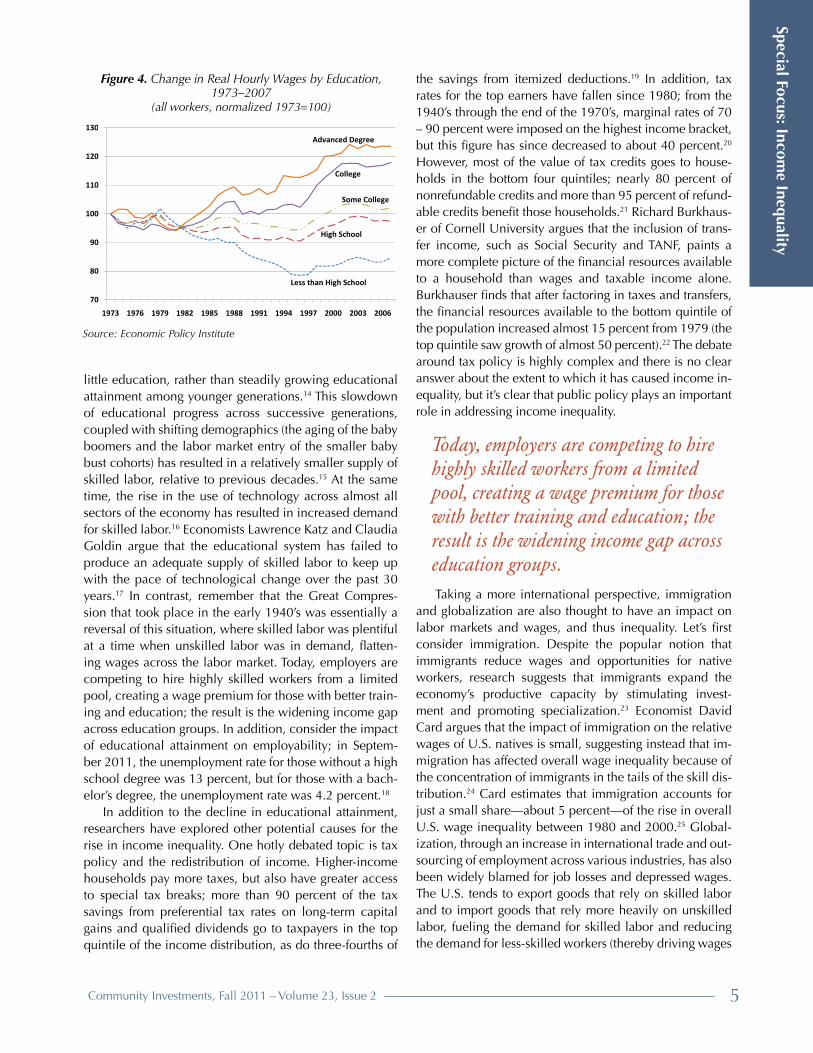
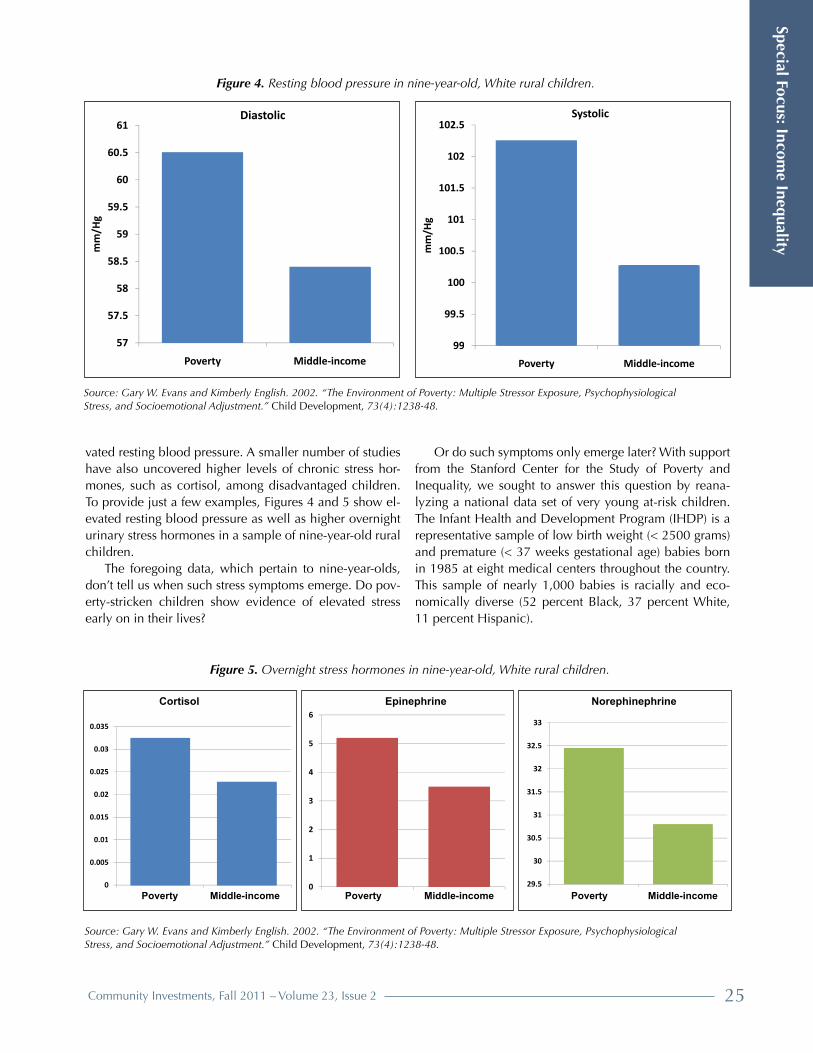

Eye on Com
munity D
evelopment
bull The Program is being administered by the CDFI Fund at the US Department of the Treasury
bull The Federal Financing Bank will buy 100 percent of bonds and notes issued to simplify execution and min-imize cost and pricing
bull Participating CDFIs will be required to establish a risk share pool of three percent of the bond or note amount
bull Proceeds can be used by CDFIs to finance or refinance activity that meets the community and economic de-velopment definition of the Riegle Act (the enabling legislation for the CDFI Fund)
The CDFI Fund states that the program rules will be issued in the fall of 2011 and bonds are poised to be issued by the spring of 2012 The Program provides up to $3 billion of total financing before it sunsets in September 2014 unless reauthorized
Why is the CDFI Bond Guarantee Program so important now
The timing for this new program couldnrsquot be more op-portune With unemployment rates above nine percent and slowing GDP growth economic recovery has been disappointingly weak Low growth prospects lead to cor-porate hesitation to invest in new ventures and hire new workers However with interest rates at historic lows itrsquos an ideal time to borrow and invest for the future In fact recent monetary policy decisions have pushed long term rates even lower as of September 25 2011 30-year trea-suries are below three percent This may be a ldquoonce in a lifetimerdquo opportunity to lock in 30 year debt at rates this low Once economic activity ignites capital will become more expensive and more difficult to raise There is no better time than now to give CDFIs access to $1 billion per year of up to 30 year debt at rates similar to government securities
Why CDFIs
CDFIs have a long history of financing and meeting the needs of entities and individuals that lack access to the mainstream financial system But as the boundaries of the mainstream financial system contract the need for CDFIs to fill the gap increases Indeed while there are reports that corporate cash levels are at record highs the capital tills of small businesses and entrepreneurs are empty Large com-panies are reticent to invest in new initiatives and banksrsquo tightened credit standards have constrained small business and consumer lending While policy makers and regula-tors work hard to make capital more freely available in order to spark job creation and economic growth the only thing growing is cash accounts Lending and investment particularly in underserved markets remain low
CDFIs which are positioned to address these issues report increasing demand for credit in their markets partly in response to declining bank lending According to The Opportunity Finance Network (OFN) 2011 2nd Quarter CDFI Market Conditions Report (a publication based on quarterly surveys of CDFIs) 54 percent of respondents reported an increase in the number of financing applica-tions received year-over-year and 55 percent reported an increase in loan originations1 Among survey respondents 25 percent reported that they are capital-constrained and could have made more loans in the second quarter of 2011 if financing capital had been available To meet estimated demand in the next 12 months the respondents reported they would need an additional $880 million in capital
The respondents made these estimates assuming they were limited to the type of debt financing currently avail-able to CDFIs which is generally less than 10 years in term and priced based on market spreads over treasury securities or LIBOR In March 2011 OFN expanded the scope of this survey to gauge broader market demand for CDFI Bond-type financingmdashup to 30 years in term and priced at a small spread over treasury securities The re-sponses indicated an overwhelming confidence in CDFIsrsquo ability to absorb $1 billion per year to meet the needs of community businesses and individuals in low-income low-wealth and otherwise disadvantaged markets
What is the critical path to success
What will make the CDFI Bond Guarantee Program a success And how do we ensure CDFIs derive maximum advantage from the Program and dramatically impact communities in need There are many important princi-ples that will lead to a successful bond program including performance and outcome based evaluation and efficient and affordable participation among CDFIs but most criti-cal are the following objectives
1 The need for flexibility to accommodate the variety of financial structures that CDFIs use to serve low-income low-wealth communities
One of the CDFI industryrsquos strengths is its diversity of products and practices In order to adequately meet the needs of their underserved communities CDFIs need to be flexible and responsive to the unique factors that affect those businesses outside the mainstream financial system That means the program canrsquot be cookie cutter or one-size-fits-all in nature
To that end eligible uses need to include all financing sectors including housing small businesses community facilities retail and commercial real estate development in distressed markets and personal financial credit prod-ucts targeted at disadvantaged populations
29 Community Investments Fall 2011 ndash Volume 23 Issue 2
Moreover the terms of the bond need to accommodate the way CDFIs provide capital to their targeted markets CDFIs offer term financing lines of credit construction loans secondary capital investments and revolving lines of credit and the program should accommodate all these types of financing products
2 Financing via the CDFI Bond Guarantee Program is used and controlled by CDFIs with a proven track record of mission based financing
The prospect of a new government-guaranteed debt program could attract the attention of entities that fashion themselves as community development lenders but who lack the mission-based orientation and track record of re-sponsible financing that the CDFI industry has long stood for and upheld This program should be reserved only for those entities that have a proven record of responsible fi-nancing with a strong mission of creating access to re-sponsible and affordable financial services for disadvan-taged and underserved communities This program should not be available to CDFIs in name only
3 Underwriting based on CDFIrsquos assessment of riskProgram risk criteria and issuer selection should be
based on the CDFI industryrsquos performance track record not on that of the mainstream financial services industry There will be a temptation to look to mainstream finan-cial service providers and programs to assess the overall program risk and individual bond applications because this is a new program to a largely unregulated sector and Treasury (CDFI Fund) has few precedents to guide it However the CDFI industry has thrived for the past thirty years precisely because non-CDFI regulated institutions and for-profit finance companies operate so differently
The markets served by CDFIs are unique and by defi-nition outside the mainstream CDFIs understand how to underwrite and manage the risk of businesses individuals and community projects in underserved markets because they are close and responsive to their borrowers willing and able to provide technical assistance when necessary and flexible enough to work with borrowers when diffi-culties arise This high-quality track record is evidenced by OFNrsquos Inside the Membership Report which shows a weighted average cumulative net charge-off rate of 14 percent and weighted average delinquency of more than 30 days of 92 percent as of year-end 20091 As of the second quarter of 2011 problem loans seem to be in decline as OFNrsquos Market Conditions Report shows that membersrsquo rate of delinquency of more than 30 days had improved to 65 percent
This performance track-record is indicative of CDFIsrsquo unique ability to underwrite and manage risk When as-sessing the risk of the CDFI Bond Guarantee Program and designing underwriting criteria for use in the selection of bond applicants it will be critical for the CDFI Fund to use CDFIsrsquo track record and not that of the mainstream financial services sector
Conclusion
The CDFI Bond Guarantee Program is meant to en-courage the creation of a new type of security that would provide access to responsible financing for disadvantaged communities at meaningful volumes affordable cost and long terms If successful this program could dramatically improve access to capital recapitalize CDFI balance sheets (improving profitability and financial stability) and help banks and other mainstream financial institutions increase their financing in partnership with CDFIs for the benefit of low-income and low-wealth communities This could lead to important increases in the number of jobs created and retained the supply of quality affordable housing and access to vital community facilities and services In short the CDFI Bond Guarantee Program would give CDFIs access to a reliable supply of capital with a term and cost structure that has never before been available
As our economy struggles to regain footing CDFIs have a vital role to play as engines of growth and the CDFI Bond can help make it happen As Federal Reserve Chair-man Bernanke recently said ldquoProviding responsible credit for individuals and small business through community de-velopment financial institutions can stimulate economic activity that generates local tax revenuesrdquo2
The imperative is clear The CDFI Bond Guarantee Program needs to become a reality as soon as possible so CDFIs can increase financing to under-served markets and contribute to job creation and economic growth OFN encourages all those interested in the program to join the CDFI Bond Alliance which will actively shape the discussion on the design and implementation of the CDFI Bond on behalf of CDFIs for the full lifecycle of the programmdashfrom initial rule promulgation through bond issuance and ultimately to encourage reauthorization For more information visit httpopportunityfinancenetfinancing
Cathy Dolan is Chief Operating Officer of Opportunity Finance Network (OFN) the leading network of private financial institutions that creates growth that is good for communities investors individuals and the economy
30 Community Investments Fall 2011 ndash Volume 23 Issue 2
ou wonrsquot believe what my mother did yester-dayrdquo said Linda ldquoShe bought a new refrig-erator on credit Do you know how much itrsquos going to cost by the time she finishes paying
for itrdquo she exclaimed pointing out that her mother would be paying 21 percent interest Linda had read the terms of agreement for her motherrsquos new department store credit card marking a significant personal achievement Just five years ago Linda couldnrsquot read at more than a 3rd grade level much less understand the financial complexities of a credit agreement
Linda used to be one of the 30 million adults in the United States who canrsquot read or write well enough to perform important daily tasks such as reading food labels or filling out a job application They may be individuals
Building Literacy Skills and Transforming LivesBy Cathay Reta and Mari Riddle
who dropped out of school early or immigrants who had little formal education in their home countries The con-straints of limited educational attainment are worsened by a lack of literacy skills creating significant economic and personal hardship for these adults and their families Adult low literacy can be connected to almost every so-cio-economic issue in the United States more than 60 percent of all state and federal corrections inmates can barely read and write low health literacy costs $73 billion each year in the US and low literacyrsquos effects cost the US $225 billion or more each year in non-productivity in the workforce crime and loss of tax revenue due to unemployment1 Low literacy is more prevalent among low-income and minority populations with Blacks and Hispanics more than three times more likely than whites
Eye on Com
munity D
evelopment
31 Community Investments Fall 2011 ndash Volume 23 Issue 2
to be below basic literacy proficiency (see Figure 1)2 Ad-ditionally 41 to 44 percent of US adults in the lowest level on the literacy scale are living in poverty3
Figure 1 Percentage of Adults Below Basic Literacy Proficiency by Race
㜀
㐀
㐀㜀㐀㐀
㔀
㐀
㔀
㘀
倀爀漀猀攀 儀甀愀渀琀椀琀愀琀椀瘀攀
䘀椀最甀爀攀 ⴀ 倀攀爀挀攀渀琀愀最攀 漀昀 䄀搀甀氀琀猀 䈀攀氀漀眀 䈀愀猀椀挀 䰀椀琀攀爀愀挀礀 倀爀漀昀椀挀椀攀渀挀礀Ⰰ 戀礀 刀愀挀攀
圀栀椀琀攀
䈀氀愀挀欀
䠀椀猀瀀愀渀椀挀
Source National Center for Education Statistics 2003 National Assessment of Adult LiteracyNote Prose literacy relates to the skills required to search com-prehend and use continuous texts Quantitative literacy allows for the identification and performance of computations using numbers embedded in printed materials
The statistics are staggering but there are stories of hope and success like Lindarsquos Adult learners are varied and unique but their motivations are universal They want to support their childrenrsquos education They want better jobs They want to be more involved in their communi-ties The ability to read and write is a core foundational skill for each of those motivators
ldquoBeing able to read write do basic math and use a computer are critical building blocks that the 30 million Americans who function at below basic literacy levels are in need of in order to find and keep sustainable em-ploymentrdquo says David C Harvey president and CEO of ProLiteracy the oldest and largest nonprofit organization dedicated to advancing the cause of adult literacy and basic education ldquoHaving access to literacy resources and literacy instruction contributes to these adults being able to find jobs earn a living wage and improve their healthmdashall of which have far-reaching effects on our countryrsquos ability to compete globallyrdquo says Harvey
The need for adult literacy education has never been greater ldquoRight now millions of Americans are struggling to find work and policymakers are emphasizing the need to create jobs and retrain our workforce As part of that retraining we must invest in adults who struggle with the simplest reading writing and math tasks They are most in need of such investment to help them find and keep jobsrdquo says Harvey Even for those employed American
businesses spend more than $60 billion each year on em-ployee training much of that for remedial reading writing and mathematics4
This article demonstrates how advancements in adult literacy education can significantly improve the lives of individuals with low literacy skills their families and their communities It also provides specific examples of inte-grated initiatives that aim to weave literacy instruction into broader skill building efforts such as financial and health education
Transforming Families ndash Breaking the Cycle of Illiteracy
At Centro Latino for Literacy a Los Angeles-based non-profit organization and member of ProLiteracy most of the students are in their 20s and 30s with young children and they are motivated to break the intergenerational cycle of illiteracy Consider the story of student Julia RodrIacuteguez ldquoIrsquom from Guerrero Mexico and Irsquom 34 years old I was the oldest and I had to help my parents take care of my younger siblings We were very poor and there was no money for school Over time my siblings went to school but I stayed working Now Irsquom a mother of three and Irsquom very motivated to learn so that I can help my children succeed They are my inspiration to learnrdquo
Rodriguez is on the right track According to an October 2010 report from the National Institute for Health improving mothersrsquo literacy skills may be the best way to boost childrenrsquos achievement5 A motherrsquos reading skill is the greatest determinant of her childrenrsquos future academic success even outweighing other factors such as neigh-borhood and family income Adults who improve their literacy skills gain the ability to read with their children and support their schoolwork They also become more effective role models Jasmin the 11 year old daughter of another Centro Latino student said ldquoMy mom really gives her all to learn to read We help her so that she doesnrsquot get discouraged I tell her lsquoYou can do it Momrsquo I am so proud of her and she inspires me because shersquos always pushing forwardrdquo Young people like Jasmin show the transformative power of adult learning where invest-ments in education reach not only the adults but their children as well
Health Literacy
ldquoI tried to donate blood for my daughter who was ill with cancer When they handed me medical history forms to complete I ran out of the room because I couldnrsquot fill out the forms It was embarrassingrdquo recounts an adult student in a San Diego County literacy program Shersquos not alone Enrique Ramirez another student shares ldquoThe nurses told me to take the elevator and go to where it says lsquox-raysrsquo I took the elevator and I just went home because
32 Community Investments Fall 2011 ndash Volume 23 Issue 2
I couldnrsquot read the signs Itrsquos a scary thing when you donrsquot know the wordsrdquo
The Community Health Improvement Partners (CHIP) a coalition of San Diego health care systems is working to address the impact of low literacy skills on individualsrsquo health and the cost to the health care system Research shows that low health literacy skills among 90 million adults in the United States results in $73 billion of po-tentially avoidable health care expenditures annually6 Many patients are unable to read basic health materials comprehend directions for taking medications or under-stand information on an appointment slip In one Cali-fornia study 65 percent of adults with low reading skills reported they avoid going to the doctor because of dif-ficulties associated with completing the paperwork7 And 75 percent of medical professionals answered they were aware of medical errors that were the product of low lit-eracy levels8
In 2007 CHIP and the San Diego Council on Literacy (SDCOL) formed a partnership to address health literacy challenges in San Diego County Together the organiza-tions developed a plan which is now being implemented under the name of Health Literacy San Diego9 First the agencies and their partners are training front and back office medical staff on how to identify and support low literate patients especially those who are English speakers who read below the eighth grade level but do not disclose their difficulty with the paperwork Focus groups revealed that medical staff members were aware of the needs but they were frustrated by a lack of training in how to handle them Jose Cruz CEO of SDCOL reports ldquoOne technique that we teach trainees is to use the lsquoteach backrsquo method with their patients Patients in turn teach back to the staff what they heard from their doctor during their appoint-mentrdquo This helps to make sure patients understand their condition and what they need to do Second Health Lit-eracy San Diego has developed curriculum to integrate health literacy topics and vocabulary into literacy lessons taught by its affiliated programs throughout the county ldquoWe are addressing the cultural language and literacy barriers that impact health outcomes for adults with low literacy skillsrdquo says Cruz
Financial Literacy
As evidenced by the recent financial crisis the US financial system is highly complex and consumers often struggle to make sense of new products and regulationsmdashlow literacy adults are likely to struggle even more Efforts that aim to improve functional literacy in conjunction with financial literacy can play a significant role in helping in-dividuals achieve financial stability Project Read an adult literacy program of the South San Francisco Public Library began a Financial Well-Being Project three years ago that
targets low-income individuals with low literacy skills The program offers financial education and coaching which helps clients create spending plans build emergency savings funds and plan strategies to build wealth ldquoClasses are fun positive and as basic as possiblerdquo says Fernando Cordoba Literacy Services Coordinator and instructor The program has also helped to connect participants with Opportunity Fund a non-profit social enterprise organiza-tion that provides microloans to low-income individuals looking to start or expand a small business
Cordoba shares that it is difficult to bring about behav-ioral change Students can easily gain financial knowledge in the classes but they are reaching beyond that ldquoThey [the adult students] already handle money and itrsquos hard to change patternsrdquo he says Project Read uses incentives such as gift cards for completing assignments and raising credit scores These are good motivators but what really makes a difference is the personal individual attention stu-dents receive and the trust they have with Project Read According to Cordoba successes have come with students who have an ongoing relationship with the program ldquoThey are looking for structure and we provide thatrdquo he says Along with that structure students gain confidence and trust ldquoA lot of students tell us they are leery of financial in-stitutions that seem to be more interested in lsquoselling themrsquo something rather than helping them They understand that our services are truly student-centeredrdquo says Cordoba
Addressing Native Language Literacy
The challenges connected to low English literacy skills are compounded for immigrant adults illiterate in their own native languages Itrsquos common for non-literate Spanish speakers to enroll in English as a Second Language programs only to find them too difficult After struggling to keep up these students may drop out There is a pressing need for native language literacy as evidenced by a 2006 report The Integration of Immigrants in the Workplace which estimates that 32 percent of adults enrolled in ESL classes lack basic literacy skills in their native language making them ldquoslower in learning a second language than their literate counterpartsrdquo10
Centro Latino helps non-literate Spanish speakers to learn English and other vital skills by teaching them first to read and write in Spanish This approach builds the foun-dational skills and confidence needed to learn English and pursue other goals Centro Latino is located in the WestlakePico Union neighborhood immediately west of downtown Los Angeles and serves over 1000 Spanish speakers each year in a county where almost 216000 adult Spanish speakers cannot read or write in any lan-guage The organizationrsquos clients have endured severe poverty and isolation in their youth and generally have had fewer than three years of formal education
Eye on Com
munity D
evelopment
33 Community Investments Fall 2011 ndash Volume 23 Issue 2
At Centro Latino adults learn basic reading and writing skills in Spanish through LeamosTM a web-based literacy curriculum Leamos is a self-paced application that allows students to progress through lessons at their own rate As a result most participants learn to read and write in ap-proximately 100 - 150 hours (two to five months) at the computer Leamos teaches Spanish-speaking youth and adults to read and write as a crucial first step in enabling them to learn English overcome their fear of technology improve job readiness and access information and ser-vices The web-based platform allows non-literate Spanish speaking adults to access the materials any place with in-ternet access such as the public library
Conclusion
As the United Nations Educational Scientific and Cul-tural Organization (UNESCO) states in its literacy strategy literacy is about empowerment - not what literacy can do for people but rather what people can do with literacy11 This is certainly true in the United States Just ask Centro Latino student Ana Martiacutenez who says ldquoBefore I could not read the names of the streets and my husband would have to direct me on how to get around Since studying [at Centro Latino] I am able to read street names and get along on my own I can now read story books to my granddaughterI am now able to list and measure the clothes I make at the garment factory I work in I learned how to create and monitor a budget This has helped me to manage my income including monthly expenses In the past I would try to save but was not successful because I didnrsquot have a systemrdquo And Ana is not alone For every adult who becomes literate there is a story of newfound independence The transformative power of literacy im-proves the economic social and physical health of in-dividuals and their families for generations to come
Cathay Reta is a consultant who coordinates the Pro-Literacy California Initiative part of ProLiteracy the worldrsquos largest organization of adult literacy and basic education programs today Mari Riddle is President and Chief Execu-tive Officer of Centro Latino for Literacy a Los Angeles-based nonprofit dedicated to teaching literacy and provid-ing educational opportunities to Latino adult and youth who have not had the benefit of an education
34 Community Investments Fall 2011 ndash Volume 23 Issue 2
30
Real Family Income Growth by Quintile 1947‐1979 and 1979‐2009
25
2224 24
2225
1315
20
0 4
0710
01
04
00
05
‐03‐05
Lowest Second Third Fourth Highest Fifth Fifth Fifth Fifrth Fifth
1947‐1979 1979‐2009Source Economic Policy Institute analysis of US Census Bureau data
DATA SNAPSHOTReal Family Income Growth by Quintile
1947ndash1979 and 1979ndash2009Average Household Income (Post-Tax)
1979ndash2007
Source Congressional Budget OfficeSource Economic Policy Institute analysis of US Census Bureau data
Source CIA World Factbook
Gini IndexThe Gini index measures the degree of inequality in the distribution of family income in a country The lower a countryrsquos Gini index the more equal its income distribution the higher the index the greater the level of income inequality
$600
$800
$1000
$1200
$1400
ome ($00
0s in 20
07 dollars)
Average Household Income (Post‐Tax) 1979‐2007
Top 1 Top 5 Fourth 20 Bottom 20
$0
$200
$400
1979
1981
1983
1985
1987
1989
1991
1993
1995
1997
1999
2001
2003
2005
2007Av
erage Hou
seho
ld In
c o
Source Congressional Budget Office
Quarterly Features
35 Community Investments Fall 2011 ndash Volume 23 Issue 2
Economic Downturns and Inequality
More than two years into the US recovery re-searchers have started to look at how the recent recession may have impacted income inequal-
ity How does an economic crisis impact earnings and income inequality if at all What can we learn from pre-vious recessions What factors influence whether or not a financial crisis will increase inequality
Carlo V Fiorio and Catherine Saget survey the existing literature on global financial crises and find no relation-ship between crises and changes in earnings inequality (ie wage distribution) but point out that in most cases income inequality (which takes into account income from capital and social transfers) decreases after a financial crisis Their findings suggest that each countryrsquos institu-tional structure impacts how inequality changes after a financial crisis In Finland for example inequality levels remained basically unchanged despite a striking increase in unemployment from 1990-1993 which the authors attribute to a strong public benefit system that supplied generous unemployment benefits including training pro-grams In contrast the East Asian financial crisis of 1997-1998 correlated to an increase in inequality potentially due to policies enacted after the crisis that promoted eco-nomic recovery by benefitting the corporate and financial sectors while increasing poverty through cuts in social services
Using Current Population Survey data Fiorio and Saget find a minor increase in US earnings inequality but when they account for the unemployed (counting their wages as zero) the increase becomes much larger They attribute this increase in inequality to low wage workers being more likely to lose their jobs during the recession and because social transfers and the wages from replace-ment jobs are both lower than earnings received by these workers prior to the crisis
Fiorio Carlo V and Saget Catherine (2010) ldquoReducing or aggravating inequality Preliminary findings from the 2008 financial crisisrdquo International Labour Office Policy Integration Department Geneva
The Low Income Housing Tax Credit and Racial Segregation
The Low Income Housing Tax Credit (LIHTC) is an indirect Federal subsidy used to finance the devel-opment of affordable rental housing for low-income
households The program is administered by the Internal Revenue Service (IRS) and has a provision that awards de-velopers with higher tax credit allocations for siting proj-ects in Qualified Census Tracts (QCTs) which are high-poverty neighborhoods that are often populated with a high concentration of minorities Despite the success of LIHTC in increasing the supply of affordable rental units one oft-cited concern is that the program is contributing to racial segregation but is this actually the case
Keren Horn and Katherine OrsquoRegan use data from HUD and the census along with data collected on the racial composition of LIHTC tenants in three states to address this question They examine three channels through which the LIHTC could potentially affect racial segregation the siting of LIHTC units relative to other non-LIHTC units that serve low-income populations the racial composition of residents in LIHTC projects and changes in neighborhood composition in areas in which tax credit projects are built They find that LIHTC units are only slightly more likely to be located in high-minority tracts than other units occupied by near-poor and poor renters and that neighborhoods of high minority concentration experience declines in minority representation over time rather than an increase Additionally Horn and OrsquoRegan find that increases in the use of tax credits between 1980 and 2000 in metropolitan areas are associated with de-clines in racial segregation
Despite the finding that the LIHTC program on average is not associated with an increase in racial segre-gation the authors recognize that persistent racial segre-gation remains a challenge in this country They conclude that targeting criticism of the LIHTC on concerns of racial segregation may take efforts away from identifying other important areas of improvement for the program
Horn Keren and OrsquoRegan Katherine (2011) The Low Income Housing Tax Credit and Racial Segregation Furman Center for Real Estate and Urban Policy New York University Working Paper httpfurmancenterorgresearchpublicationstagsubsidized+housing
RESEARCH BRIEFS
36 Community Investments Fall 2011 ndash Volume 23 Issue 2
Quarterly FeaturesDefaults and Saving among Low-Income
Tax Filers
Previous research has demonstrated the power-ful effect that default setting can have on financial decision-making particularly in the area of 401(k)
savings behavior By simply switching the default to auto-matic enrollment requiring users to opt-out if they do not wish to save participation rates in defined contribution plans tend to increase dramatically But do the effects of this type of nudge extend to other savings programs and populations
The results of a recent study suggest that default setting does not impact savings behavior among low-income tax filers In 2009 a new initiative designed to increase retire-ment savings allowed tax filers to purchase US Savings Bonds with their federal income tax refunds and advocates supported the policyrsquos ldquosaveable momentrdquo approach Erin Todd Bronchetti Thomas Dee David Huffman and Ellen Magenheim conducted a field study at eight Volunteer Income Tax Assistance sites during the 2010 tax season to test whether default setting would affect the take up rate among low-income tax filers to receive some or all of their refunds in US Savings Bonds They find that regard-less of whether the default requires an opt-in or opt-out of the savings bond option the participation rate in the savings program is roughly nine percent The authors point out that the success of increasing saving among higher-in-come 401(k) participants through default switching should
not be automatically generalized for other policy settings particularly among lower-income populations One pos-sible explanation for why the nudge was ineffective was that 75 percent of filers indicated they already had plans for how to spend the refund Nearly 70 percent of low-income filers stated that they had trouble paying bills and only 17 percent stated they had plans to save some of their refund demonstrating the resource constraints facing this population
The authors emphasize that ldquo401(k) defaults may be powerful because they coincide with the pre-existing in-tentions to save of relatively affluent individuals To the extent that low-income filers do not have strong intentions to save at tax time defaults may have little effectrdquo One implication of these findings is that prior to implement-ing default switching interventions to impact the savings behavior of low-income individuals more needs to be done to shift their savings expectations For example matched savings programs have demonstrated that the poor can effectively alter their savings expectations and develop assets Further research is necessary to measure the impact of defaults for different populations under dif-ference scenarios
Bronchetti E Dee T Huffman D and Magenheim E (2011) When a Nudge Isnrsquot Enough Defaults and Saving among Low-Income Tax Filers NBER Working Paper 16887 httpwwwnberorgpapersw16887pdf
37 Community Investments Fall 2011 ndash Volume 23 Issue 2
DOCTOR CRA by John Olson
Dear Anxious
We know itrsquos tough not knowing what to expect from the CRA reform process but that doesnrsquot mean you canrsquot start thinking about how yoursquoll respond to the changes when they do come Itrsquos a good time to review your CRA program to make sure you are prepared to implement any changes Some things to think about
Plan to comment on any proposed changes When I hear a concern about a new rule my first question is always ldquodid you submit a commentrdquo Far too often the answer is ldquonordquo The agencies really do read all comments and want to hear about the impact of the proposed rule on your financial institution Itrsquos important for everyone with an opinion to submit a written comment Detailed instructions for submitting comments will be provided in the proposal itself
Dear Dr CRA ndash
Wersquore all waiting anxiously for word from Washington on the changes to the CRA While wersquore waiting is there anything I can do to be getting ready
Sincerely Anxiously Awaiting New Rules
Create a strategy for interpreting and implementing the changes Do you have up-to-date policies and pro-cedures for your CRA compliance program How will you amend and distribute the new procedures How will you communicate the changes to senior man-agement How will you communicate the changes to lenders branch managers and other key staff Think-ing through these questions beforehand and developing your plan can make the implementation phase more efficient and successful
Receiving new rules can be a challenge but I encour-age you to also see it as an opportunity It could be your chance to raise awareness of your CRA program in your institution to implement a strategy yoursquove been wanting to try and to re-engage your CRA stakeholders through-out the bank Use the new rules as your chance to re-evaluate your program and take it in a new direction
38 Community Investments Fall 2011 ndash Volume 23 Issue 2
EndnotesAddressing Widening Income Inequality through Community Development
1 USCensusBureau(2010)SmallAreaIncomeampPovertyEstimatesforstatesandcountieshttpquickfactscensusgovqfdstates00000html
2 CostelloD(2011April9)TheDroughtIsOver(atLeastforCEOrsquos)TheNew York TimesppBU1Onlineathttpwwwnytimescom20110410business10comphtmlpagewanted=all
3 StanfordCenterfortheStudyofIncomeandInequalityldquoWelcometoInequalitycomrdquoretrievedfromhttpwwwstanfordedugroupscspi
4 WilkinsonRampPickettK(2009) The Sprit Level Why Greater Equality Makes Societies Stronger NewYorkBloomsburyPress
5 Ibid
6 PutnamRD(2000)Bowling Alone The collapse and revival of American community NewYorkSimonandSchuster
7 SaezEampPikettyT(2003)IncomeInequalityintheUnitedState1913-1998QuarterlyJournalofEconomics118(1)1-39Updateddataavailableonlineathttpelsaberkeleyedu~saez
8 GoldinCampMargoRA(1991)ldquoTheGreatCompressionTheWageStructureintheUnitedStatesatMid-CenturyrdquoNBERWorkingPapers3817NationalBureauofEconomicResearchInc
9 KrugmanP(2007)The Conscience of a Liberal NewYorkWWNortonampCompanyInc
10 FromldquoEconomicInequalityintheUnitedStatesrdquoaspeechgivenattheCenterfortheStudyofDemocracyonNovember62006byformerFRBSFPresidentJanetYellenAvailableonlineathttpwwwfrbsforgnewsspeeches20061106html
11 FormoreontheGiniindexseetheCIAWorldFactbookathttpswwwciagovlibrarypublicationsthe-world-factbookrankorder2172rankhtml
12 Ibid
13 ForamoredetailedanalysisofthecausesoftheGreatDivergenceseeNoahT(2010September10)TheUnitedStateofInequalityRetrievedfromhttpwwwslatecomid2266025entry2266026
14 KodrzyckiY(2002)EducationalAttainmentasaConstraintonEconomicGrowthandSocialProgressEducationinthe21stCenturyMeetingtheChallengesofaChangingWorldConferenceSeries47June2002FederalReserveBankofBoston
15 KatzL(2002)DiscussionEducationalAttainmentasaConstraintonEconomicGrowthandSocialProgressEducationinthe21stCenturyMeetingtheChallengesofaChangingWorldConferenceSeries47June2002FederalReserveBankofBoston
16 BermanEliJohnBoundampZviGriliches1994ldquoChangesintheDemandForSkilledLaborwithinUSManufacturingIndustriesEvidencefromtheAnnualSurveyofManufacturingrdquoQuarterly Journal of Economics 109367-397SeealsoBresnahanFBrynjolfssonEampandHittLM(2002)InformationTechnologyWorkplaceOrganizationandtheDemandforSkilledLaborFirm-LevelEvidenceQuarterlyJournalofEconomics1171339-376
17 GoldinCampKatzL(2008)The Race between Education and Technology CambridgeMAHarvardUniversityPress
18 SourceBureauofLaborStatisticsnotseasonallyadjusted
19 WilliamsR(2011)WhoBenefitsfromTaxExpendituresTaxNotesMay22011TaxPolicyCenterhttpwwwurbanorguploadedpdf1001537-Who-Benefits-From-Expenditurespdf
20 WilsonRPersonalExemptionsandIndividualIncomeTaxRates1913-2002DataReleaseInternalRevenueServicehttpwwwirsgovpubirs-soi02inpetrpdf
21 Ibid
22 BurkhauserR(2011)PresidentialaddressEvaluatingthequestionsthatalternativepolicysuccessmeasuresanswerJournal of Policy Analysis and Management30(2)205ndash215
23 PeriG(2010)TheEffectofImmigrantsonUSEmploymentandProductiv-ityFederalReserveBankofSanFranciscoEconomicLetter2010-26httpwwwfrbsforgpublicationseconomicsletter2010el2010-26html
24 CardD(2009)ImmigrationandInequalityNBERWorkingPaperNo14683httpwwwnberorgpapersw14683
25 Ibid
26 Yellen(2006)Seenote10
27 KrugmanP(2008)TradeandWagesReconsideredBrookingsPapersonEconomicActivitySpring2008WashingtonDCBrookingsInstitutionPress
28 Ibid
29 JaumotteFLallSampPapageC(2008)RisingIncomeInequalityTech-nologyorTradeandFinancialGlobalizationIMFWorkingPaper08185httpwwwimforgexternalpubsftwp2008wp08185pdf
30 Yellen(2006)Seenote10
31 FromldquoEconomicandFinancialInclusionin2011WhatitMeansforAmeri-cansandourEconomicRecoveryrdquoaspeechgivenattheNewAmericaFoundationForumWashingtonDCJune292011byGovernorSarahBloomRaskinAvailableonlineathttpfederalreservegovnewseventsspeechraskin20110629ahtm
32 Ibid
33 HeckmanJ(September12010)LettertotheNationalCommitteeonFiscalResponsibilityandBudgetReformwwwheckmanequationorgsystemfilesFederal-Commision_9-1-2010FINAL20_3_pdf
34 Yellen(2006)Seenote10
35 AnnieECaseyFoundation(2011)PromotingOpportunityfortheNextGenerationKidsCountDataBookhttpwwwaecforg~mediaPubsInitiativesKIDS20COUNT1232011KIDSCOUNTDataBook2011KCDB_FINAL_essaypdf
36 NationalCenterforChronicDiseasePreventionandHealthPromotionStudentHealthandAcademicAchievementRetrievedfromhttpwwwcdcgovHealthyYouthhealth_and_academics
37 CommunityAffairsOfficesoftheFederalReserveSystemandTheMetropolitanPolicyProgramattheBrookingsInstitution(2006)The Enduring Challenge of Concentrated Poverty in Americahttpwwwfrbsforgcpreport
38 Formoreonplace-basedcommunitydevelopmentseetheSpring2010issueofCommunity Investmentsavailableonlineathttpwwwfrbsforgpublicationscommunityinvestments1005indexhtml
39 SpeechbyChairmanBenBernankeFebruary62007TheLevelandDistributionofEconomicWell-BeingPresentedattheGreaterOmahaChamberofCommerceOmahaNebraskahttpwwwfederalreservegovnewseventsspeechbernanke20070206ahtm
39 Community Investments Fall 2011 ndash Volume 23 Issue 2
EndnotesUnderstanding Both Sides of the Inequality Debate
1 USBureauoftheCensusIncomeintheUnitedStates2002CurrentPopulationReportsSeriesP60-221September2003p25
2 HedermanJrRampRectorR(2004)TwoAmericasOneRichOnePoorUnderstandingIncomeInequalityintheUnitedStatesBackgrounder1791August242004TheHeritageFoundation
3 GarrettT(2010)USIncomeInequalityItrsquosNotSoBadInsidetheVaultVolume14Issue1Spring2010FederalReserveBankofStLouis
4 BernsteinJMishelLBrochtC(2000)AnyWayYouCutItIncomeinequalityontheriseregardlessofhowitrsquosmeasuredEconomicPolicyInstitutehttpepi3cdnnet2a07e6f50730c16d1a_6wm6b9fcypdf
5 GarrettT(2010)Seenote3
6 BernsteinJMishelLBrochtC(2000)Seenote4
7 OkunA(1975)EqualityandEfficiencytheBigTradeoffWashingtonDCBrookingsInstitution
8 GarrettT(2010)Seenote3
9 BergAampOstryD(2011)EqualityandEfficiencyFinanceampDevelopment48(3)InternationalMonetaryFundQuintinEampSavingJ(2008)Inequal-ityandGrowthChallengestotheOldOrthodoxyEconomicLetterFederalReserveBankofDallasVol3No1January2008PerssonTampTabelliniG(1994)IsInequalityHarmfulforGrowthTheAmericanEconomicReview84(3)600-621
10 CoxMampAlmR(2008)ldquoYouAreWhatYouSpendrdquoNewYorkTimesFebru-ary102008
11 BernsteinJMishelLBrochtC(2000)Seenote4
Ties that Bind Income Inequality and Income Segregation
1 ForareviewofthisliteraturepleaseseeldquoTheEnduringChallengeofConcen-tratedPovertyinAmericaCaseStudiesfromCommunitiesAcrosstheUSrdquoTheFederalReserveSystemandtheBrookingsInstitution2008
2 ThisisnottosaythatquestionsofracialsegregationarebehindusInmanyrespectsitisdifficulttoteaseoutthedifferencesbetweenracialandeconomicsegregationgiventhestrongintersectionofraceandclassintheUnitedStatesmdashpovertyratesamongAfricanAmericansandHispanicsaretwiceashighastherateamongnon-HispanicwhitesResearchersmaintainthatthereisadistinctbutoverlappingpatternofracialandclasssegregation
3 DouglasMasseyJonathanRothwellandThurstonDomina(2009)ldquoTheChangingBasesofSegregationintheUnitedStatesrdquoTheAnnalsoftheAmericanAcademyofPoliticalandSocialScienceNovember200962674
4 Ibid
5 TaraWatson(2009)ldquoInequalityandtheMeasurementofResidentialSegre-gationbyIncomeinAmericanNeighborhoodsrdquoTheReviewofIncomeandWealthSeptember2009553
6 Ibid
7 PaulJargowsky(2003)ldquoStunningProgressHiddenProblemsTheDramaticDeclineofConcentratedPovertyinthe1990srdquoTheBrookingsInstitutionMay2003
8 ToddSwanstromColleenCaseyRobertFlackandPeterDrier(2004)ldquoPullingApartEconomicSegregationamongSuburbsandCentralCitiesinMajorMetropolitanAreasrdquoTheBrookingsInstitutionOctober2004
9 Masseyetal(2009)Watson(2009)
10 DanielLichterDomenicoParisiandMichaelTaquino(2011)ldquoTheGeog-raphyofExclusionRaceSegregationandConcentratedPovertyrdquoNationalPovertyCenterWorkingPaperSeriesMay20111116
11 Ibid
12 Swanstrometal(2004)
13 RandallEbertsGeorgeErickcekandJackKleinhenz(2006)ldquoDashboardIndicatorsfortheNortheastOhioEconomyPreparedfortheFundforOurEconomicFuturerdquoTheFederalReserveBankofClevelandWorkingPaperSeriesavailableathttpwwwclevelandfedorgresearchworkpaper2006wp06-05pdf
14 StevenRaphaelandMichaelAStoll(2010)ldquoJobSprawlandtheSuburban-izationofPovertyrdquoTheBrookingsInstitutionMarch2010
15 RobertSampson(2009)ldquoRacialStratificationandtheDurableTangleofNeighborhoodInequalityrdquoTheANNALSoftheAmericanAcademyofPoliticalandSocialScienceJanuary2009621260
16 Transcriptavailableathttpwwwfrbsforgcdinvestmentsconferenceshealthy-communities2010-washington-dc
17 JonathanRothwellandDouglasMassey(2010)ldquoDensityZoningandClassSegregationinUSMetropolitanAreasrdquoSocialScienceQuarterlyDecember2010915
18 Ibid
The Polarization of Job Opportunities in the US Labor Market Implications for Employment and Earnings
1 StatisticsrefertotheUScivilianlaborforceages16andaboveandareseasonallyadjustedSourceUSBureauofLaborStatistics(wwwblsgovaccessedon4112010)
2 ArecentstudybyCouchandPlaczekconfirmstheseresultsbutputsthelonger-termearningslossesat12to15percentCouchKampPlaczekD(2010)EarningLossesofDisplacedWorkersRevisitedAmerican Economic Review 100(1)572-589
3 SullivanDampvonWachterT(2009)JobDisplacementandMortalityAnAnalysisusingAdministrativeDataQuarterly Journal of Economics 124(3)1265-1306
4 AutorD(2010)ThePolarizationofJobOpportunitiesintheUSLaborMarketImplicationsforEmploymentandEarningsTheHamiltonProjectandtheCenterforAmericanProgressAvailableonlineathttpwwwbrook-ingsedupapers201004_jobs_autoraspx
5 AcemogluDampAutorD(2010)TechnologySkillsandWagesInOrleyAshenfelterandDavidCardeds Handbook of Labor EconomicsVol4(NorthHollandElsevier2010)(Forthcoming)
40 Community Investments Fall 2011 ndash Volume 23 Issue 2
6 AlthougheconomistswouldtypicallyviewthewagespaidtoajobasthebestsummarymeasureofthejobrsquosskillrequirementslayreadersmaytakesomeassurancethatwagesasaskillmeasurearehighlycorrelatedwithlogicalalternativessuchaseducationandexperienceMoreovertherankingofoccupationalskillsbasedoneitherwageoreducationallevelsisquitestableovertimeThustheconclusionsherearenotsensitivetotheskillmeasure(wageseducation-experience)northechoiceofbaseyearforskillranking(here1980)
7 ThereasonforusingadifferentdatasourceandtimeperiodforthisfigurefromthepriorfigureisthattheCensusdatahavelargeenoughsamplesizestobeusefulfortheoccupationlevelexercisebuttheyarelessthanidealformeasuringhourlywagesIusetheMayORGdataforhourlywageswhichareasuperiorsource
8 GoosMManningAampSalomonsA(2009)JobPolarizationinEuropeAmerican Economic Review99(2)58-63Thechoiceoftimeperiodreflectstheavailabilityofconsistentdata(unavailablepriorto1993)Therankingofoccupationsbyskilllevelisinvariantacrosscountriesasneces-sitatedbydatalimitationsTheauthorsreporthoweverthattherankingofoccupationsbywagelevelishighlycorrelatedacrossEUcountries
9 AutorDLevyFampMurnaneR(2003)TheSkillContentofRecentTechno-logicalChangeAnEmpiricalExplorationThe Quarterly Economic Journal118(4)1279-1333
10 AdjustingforinflationusingthePersonalConsumptionExpendituredefla-tortherealminimumwageinconstant2008dollarswas$750in1979$529in1989$641in1999and$547in2006and$653in2009Thustherealfederalminimumwagedeclineddramaticallybetween1979and1989Itfluctuatedmodestlyinrealtermsuntil2006whenitrosesharplyoverthreeyears
11 HamermeshD(2001)ChangingInequalityforWorkplaceAmenitiesQuar-terly Journal of Economics114(4)1085-1123PierceB(2001)Compensa-tionInequality Quarterly Journal of Economics 116(3)1493-1525PierceV(2008)ldquoRecentTrendsinCompensationInequalityrdquoWorkingPaper(BureauofLaborStatistics)
12 PierceldquoCompensationInequalityrdquoPierceldquoRecentTrendsinCompensationInequalityrdquo
13 Notablythecollegecompletionrateforthisgroupwashigherin1990(29percent)thanin2008or2008(24percentand27percent)
EndnotesCDFI Bond Opportunity of a Decade
1 OpportunityFinanceNetworkMarketConditionsReportsavailableonlineathttpwwwopportunityfinancenetstorecategoriesaspcID=29
2 SpeechbyChairmanBenBernankeonApril292011attheFederalRe-serveCommunityAffairsResearchConferenceinArlingtonVirginiahttpwwwfederalreservegovnewseventsspeechbernanke20110429ahtm
Building Literacy Skills and Transforming Lives
1 ProLiteracyTheImpactofLiteracyBasicFactsaboutLiteracyhttpwwwproliteracyorgpageaspxpid=345
2 NationalCenterforEducationStatistics(2003)NationalAssessmentofAdultLiteracyAFirstLookattheLiteracyofAmericarsquosAdultsinthe21stCenturyhttpncesedgovnaalpdf2006470pdf
3 KirschIJungeblutAJenkinsLampKolstadAl(2002)ldquoAdultLiteracyinAmericaAFirstLookattheFindingsoftheNationalAdultLiteracySurveyrdquoNationalCenterforEducationStatisticshttpncesedgovpubs9393275pdf
4 ProLiteracySeenote1
5 NationalInstitutesofHealth(October252010)ImprovingMothersrsquoLiteracySkillsMayBeBestWaytoBoostChildrenrsquosAchievementhttpwwwnichdnihgovnewsreleases102510-reading-family-incomecfm
6 CenteronanAgingSocietyLowHealthLiteracySkillsIncreaseAnnualHealthCareExpendituresby$73BillionGeorgetownUniversityhttpihcrpgeorgetowneduagingsocietypubhtmlhealthlithtml
7 CaliforniaHealthLiteracyInitiativeLowLiteracyHighRiskTheHiddenChallengeFacingHealthCareinCaliforniahttpcahealthliteracyorgpdffilesallfourpageshealthlitreportpdf
8 Ibid
9 CommunityHealthImprovementPartnersWhenWordsGetintheWayACollaborativePlantoAddressHealthLiteracyinSanDiegoCountyhttpwwwliteracysandiegoorgpdfHealthLiteracyReport_FINALpdf
10 CreticosPSchultzJBeelerABallE(2006)TheIntegrationofIm-migrantsintheWorkplaceTheInstituteforWorkandtheEconomy
11 UNESCOLiteracyStrategyhttpwwwunescoorgneweneducationthemeseducation-building-blocksliteracystrategy
41 Community Investments Fall 2011 ndash Volume 23 Issue 2
Free sub
scriptio
ns an
d ad
ditio
nal co
pies are
available u
po
n req
uest fro
m th
e Co
mm
un
ity D
evelopment D
epartment Federal R
eserve Bank
of San Francisco 101 Market Street San Francisco
California 94105 or call (415) 974-2765
Change-of-address and subscription cancellations
should be sent directly to the Com
munity D
evelop-m
ent Departm
ent Please include the current mail-
ing label as well as any new
information
The views expressed are not necessarily those
of the Federal Reserve B
ank of San Francisco or the Federal R
eserve System M
aterial herein may
be reprinted or abstracted as long as Com
munity
Investments is credited Please provide Laura C
hoi in the C
omm
unity Developm
ent Departm
ent with
a copy of any publication in which such m
aterial is reprinted
Fed
eral reserve B
ank o
F san F
rancisco
101 MARKET STREET
SAN FRAN
CISCO CA 94105
ADD
RESS SERVICE REQU
ESTED
AU 10252
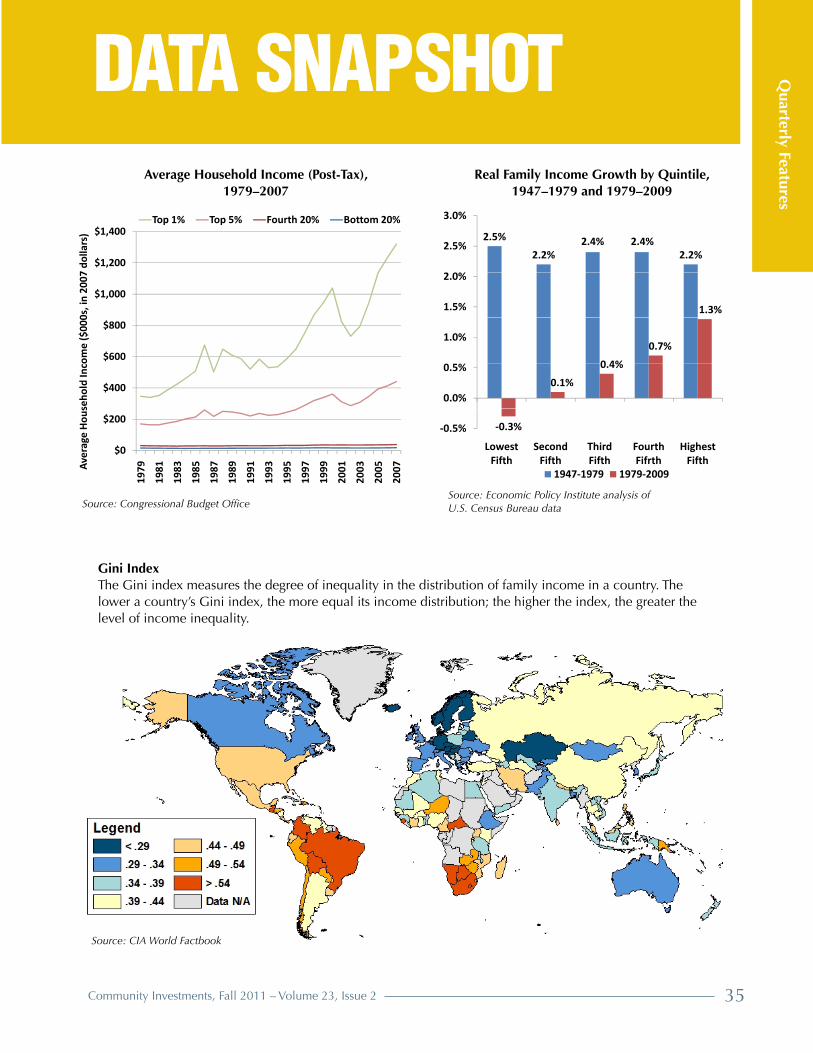