income tax & universal social charge - …€¦ · · 2017-07-31income tax & universal...
TRANSCRIPT

Tax Strategy Group | TSG XX/XX Title
| 1
INCOME TAX & UNIVERSAL SOCIAL CHARGE
Incorporating an ex-ante equality impact assessment of possible changes to the income tax system
Tax Strategy Group – TSG 17/02 25 July 2017
Tax Strategy Group | TSG 17/02 Income Tax and USC
| 2
INCOME TAX AND UNIVERSAL SOCIAL CHARGE
Contents 1. Introduction ................................................................................................................... 3
Summary of Tax Yields 2007 - 2016 .................................................................................. 3
Structure of Income Tax and USC ..................................................................................... 4
2. Distribution and Burden of Income Tax and USC .......................................................... 5
Income Tax 2017 Distribution of Income Earners ............................................................ 5
Universal Social Charge 2017 Distribution of Income Earners ......................................... 6
Estimated Cumulative Burden of Income Tax and USC for 2017 ..................................... 7
3. Recent Developments – Budgets 2015 to 2017 ............................................................ 8
4. Programme for a Partnership Government Commitments .......................................... 9
Equality Proofing ............................................................................................................. 10
Gender Proofing – Individualisation vs Joint Assessment .............................................. 11
5. International Comparisons .......................................................................................... 13
6. Tax Policy Considerations for Reform - USC................................................................ 14
Universal Social Charge ................................................................................................... 14
Potential to Merge USC with PRSI .................................................................................. 14
USC for over 70s and medical card holders .................................................................... 15
7. Tax Policy Considerations for Reform – Income Tax ................................................... 16
Earned Income Credit ..................................................................................................... 16
Tapered withdrawal of tax credits .................................................................................. 16
Mortgage Interest Relief ................................................................................................. 18
8. Further Potential Options for Consideration .............................................................. 20
Appendix A: Ready Reckoner – Potential Costs / Yields .................................................... 21
Appendix B: Distributional and Work Incentive Aspects of the Income Tax System ......... 23
Introduction .................................................................................................................... 23
Context ............................................................................................................................ 23
Approach and Key Concepts ........................................................................................... 24
Distributional Analysis .................................................................................................... 26
Financial Incentives to Work .......................................................................................... 33

Tax Strategy Group | TSG 17/02 Income Tax and USC
| 3
1. Introduction
1. In 2017, it is estimated that personal income taxes of c. €20.2 billion will be raised
for the Exchequer, representing about 40% of the total tax take. Of this, income tax
is expected to comprise c.€16.5 billion and USC is expected to comprise c.€3.7
billion. Income tax and USC therefore now comprise the single largest source of tax
revenue to the Exchequer, having surpassed the proportion contributed by VAT in
2009.
Summary of Tax Yields 2007 - 2016
Data source: Department of Finance
2. The total income tax yield for the last ten years is set out in table 1 below. Figures
for the years 2007 to 2016 represent actual yield and figures for the year 2017 are
projections.
Table 1: Income Tax (including USC) Yield
2007 2008 2009 2010 2011 2012 2013 2014 2015 2016 2017
€bn 13.6 13.2 11.8 11.3 13.8 15.2 15.8 17.2 18.4 19.2 20.2
% Tax 28.7 32.3 35.8 35.5 40.5 41.4 41.7 41.6 40.3 40.1 40.0
28.7%40%
30.7%
25.9%
13.5%
15.4%12.4%
11.9%14.7%
6.7%
0
5,000,000
10,000,000
15,000,000
20,000,000
25,000,000
30,000,000
35,000,000
40,000,000
45,000,000
50,000,000
2007 2008 2009 2010 2011 2012 2013 2014 2015 2016
€ million Summary of Tax Yields 2007 - 2016
Income Tax VAT Corporation Tax Excise Duty Other Taxes

Tax Strategy Group | TSG 17/02 Income Tax and USC
| 4
Structure of Income Tax and USC
3. The 2017 rates and bands of income tax are as follows:
20% rate on income within standard rate band
40% on income in excess of standard rate band
Taxpayer Standard Rate Band
Single €33,800
Single Parent €37,800
Married – one earner €42,800
Married – two earners (max)* €67,600
*Where each spouse earns a minimum of €24,800 – the maximum rate-band transferability between jointly-assessed spouses is €9,000.
4. Spouses and civil partners may elect for joint assessment under the income tax
system, whereby the combined income of the couple is assessed in the name of the
higher earner, net of their combined reliefs and credits. This can allow for a
reduction in the couple’s overall tax liability as compared to separate assessment
due to the transferability of the married tax credit and a portion of the standard rate
band.
5. The Universal Social Charge is an individualised tax, meaning that a person’s liability
to the tax is determined on the basis of his/her own individual income and personal
circumstances. The USC was introduced in 2011 and replaced two existing levies –
the Income Levy and the Health Levy. The current rates and bands of USC are as
follows:
Incomes of €13,000 or less are exempt. Otherwise:
€0 to €12,012 @ 0.5%
€12,012 to €18,772 @ 2.5%
€18,772 to €70,044 @ 5%
€70,044 to €100,000 @8%
PAYE income > €100,000 @ 8%
Self-employed income > €100,000 @11%
Maximum rate of USC of 2.5% for individuals over 70, and for full medical
cardholders (under 70), whose aggregate income does not exceed €60,000.

Tax Strategy Group | TSG 17/02 Income Tax and USC
| 5
2. Distribution and Burden of Income Tax and USC
6. The years leading up to 2009 saw a progressive narrowing of the income tax base as
government policy with regard to income tax was to increase tax credits and bands
to the point where 40% of income earners were exempt from income tax and only
20% of earners were liable to the higher rate of tax. The subsequent falls in income
and rising unemployment resulted in over 45% of earners being exempt from income
tax in 2010 and just over 13% being liable to the higher rate of tax. A range of
measures have been taken since 2009 to correct this narrowing of the income tax
base, including reductions in tax credits and bands, the restriction or abolition of
many reliefs, and the introduction of the broad-based USC.
Income Tax 2017 Distribution of Income Earners
Data source: Revenue Commissioners
Table 2: Income Tax 2010 Distribution of earners
Income Tax Earners % of Earners
Higher Rate 277,086 13%
Standard Rate 864,726 42%
Exempt 946,631 45%
Total 2,088,443
Table 3: Income Tax 2017 Distribution of earners
Income Tax Earners % of Earners
Higher Rate 517,300 20.5%
Standard Rate 1,080,300 43%
Exempt 919,700 36.5%
Total 2,517,300
Higher Rate 13%
Standard Rate42%
Exempt 45%
Income Tax 2010 Distribution of Earners
Higher Rate
20.5%
Standard Rate 43%
Exempt 36.5%
Income Tax 2017Distribution of Earners
Tax Strategy Group | TSG 17/02 Income Tax and USC
| 6
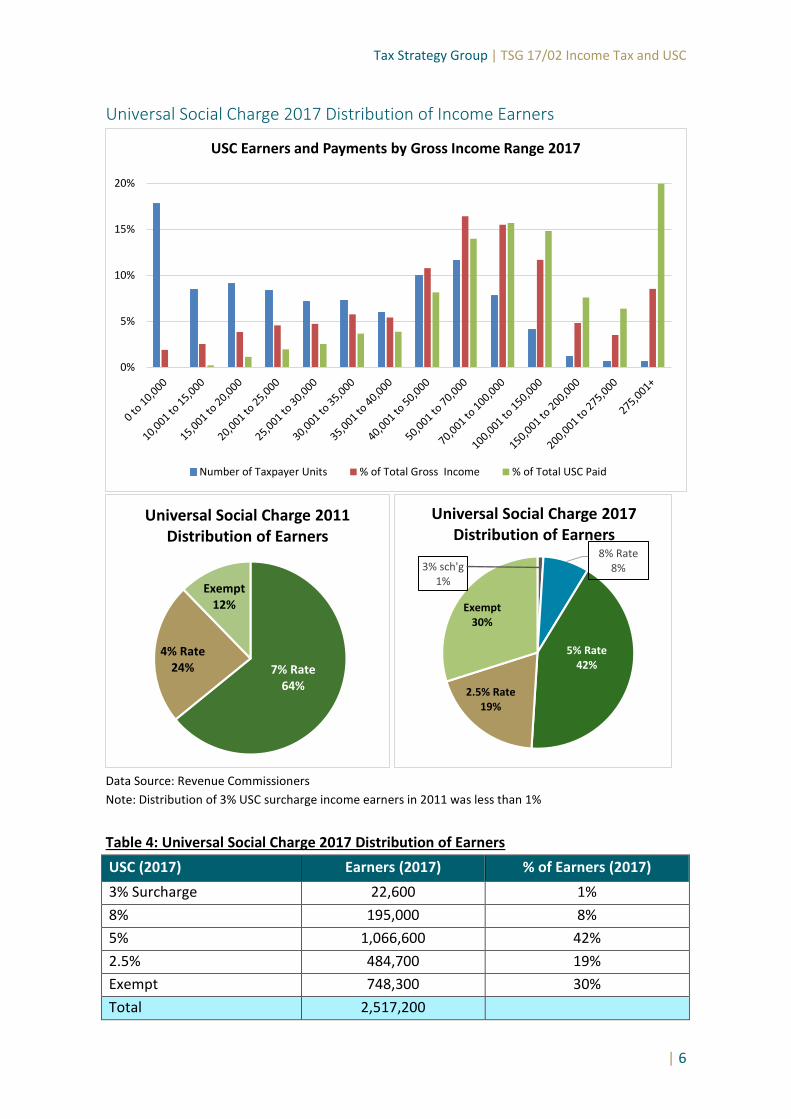
Universal Social Charge 2017 Distribution of Income Earners
Data Source: Revenue Commissioners
Note: Distribution of 3% USC surcharge income earners in 2011 was less than 1%
Table 4: Universal Social Charge 2017 Distribution of Earners
USC (2017) Earners (2017) % of Earners (2017)
3% Surcharge 22,600 1%
8% 195,000 8%
5% 1,066,600 42%
2.5% 484,700 19%
Exempt 748,300 30%
Total 2,517,200
0%
5%
10%
15%
20%
USC Earners and Payments by Gross Income Range 2017
Number of Taxpayer Units % of Total Gross Income % of Total USC Paid
7% Rate64%
4% Rate24%
Exempt12%
Universal Social Charge 2011Distribution of Earners
3% sch'g1%
8% Rate8%
5% Rate42%
2.5% Rate19%
Exempt30%
Universal Social Charge 2017Distribution of Earners

Tax Strategy Group | TSG 17/02 Income Tax and USC
| 7
Estimated Cumulative Burden of Income Tax and USC for 2017
7. It is estimated that:
The top 1% of income earners (>€200,000) will pay 24% of total IT and USC
The top 6% of income earners (>€100,000) will pay 49% of total IT and USC
The top 26% of income earners (>€50,000) will pay 83% of total IT and USC
The remaining 74% of income earners will pay 17% of total IT and USC
Notes for tables 3, & 4:
1. Distributions for 2017 are estimates from the Revenue tax-forecasting model
using actual data for the year 2014, adjusted as necessary for income and
employment trends in the interim.
2. Figures are provisional and likely to be revised.
3. A jointly assessed married couple/civil partnership is treated as one tax unit.
4. Percentages are rounded to the nearest percentage point.

Tax Strategy Group | TSG 17/02 Income Tax and USC
| 8
3. Recent Developments – Budgets 2015 to 2017
8. The stabilisation of the economy has allowed for reductions in the personal tax
burden to be introduced in three successive Budgets, with Budgets 2016 and 2017
focussing primarily on reductions to the lower rates of Universal Social Charge. The
main cumulative effects of these three Budgets are as follows:
The three lower rates of USC have been reduced from 1.5%, 3.5% and 7% to 0.5%,
2.5% and 5% respectively.
The ceiling of the second USC rate band has increased by €1,196 to €18,772, in
conjunction with increases in the National Minimum Wage.
In Budget 2015 the income tax standard-rate band was increased by €1,000 from
€32,800 to €33,800 for single individuals and from €41,800 to €42,800 for
married one earner couples, and the higher rate of income tax was reduced from
41% to 40%.
A new 8% USC rate was introduced in Budget 2015 in conjunction with the
reduction of the higher rate of income tax. This USC rate-band has allowed the
benefits of the Budget 2015 to 2017 personal tax packages to apply on income up
to €70,044 only, thereby limiting benefits for higher earners.
A new Earned Income Credit for self-employed individuals who do not have
access to the PAYE tax credit was introduced in Budget 2016 at the rate of €550
per year, and was increased to €950 in Budget 2017.
The Home Carer Credit, which is available to families where one spouse or civil
partner works primarily in the home to care for children or dependents, was
increased over the last two budgets from €810 to €1,100. The limit on the
income which the home carer is allowed to earn and still qualify for the credit was
also increased from €5,800 to €7,200.
It was announced in Budget 2017 that, as part of an ongoing process to support
entrepreneurship and start-up companies generating employment, a new, SME-
focussed, share-based incentive scheme would be introduced in Budget 2018.
Work is ongoing on the design of the incentive and engagement with the
European Commission with a view to securing State Aid approval in advance of
Budget 2018 has commenced.

Tax Strategy Group | TSG 17/02 Income Tax and USC
| 9
4. Programme for a Partnership Government Commitments
9. The Programme for a Partnership Government (PPG) expresses a number of
commitments with regard to public finances and taxation. It recognises the need to
keep the tax and revenue base broad, while reducing the rate of tax on work and
some other activities in order to achieve specific social and economic objectives.
The PPG commits to meeting the required domestic and EU fiscal rules, and sets out
a planned 2:1 split of available resources between public spending and tax
reductions. Budget 2017 was announced with a split of over 3:1 in favour of public
spending.
10. The PPG also contains a number of specific undertakings with regard to personal
taxation, including the following:
To ask the Oireachtas to continue to phase out the USC as part of a medium-term
income tax reform plan.
To increase the Earned Income Credit from €550 to €1,650 to match the PAYE
credit by 2018, and to provide a supportive tax regime for entrepreneurs and the
self-employed.
To retain mortgage interest relief on a tapered basis beyond the current end date
of December 2017.
To support stay-at-home parents through an increase in the Home Carers’ Credit.
To explore mechanisms through which SMEs can reward key employees through
share-based remuneration.
Potential Offsetting Measures
11. The PPG states that the reductions in personal tax rates, such as the continued
phasing out of the USC, will be funded largely through:
Extra revenues from not indexing personal tax credits and bands.
The removal of the PAYE tax credit for high earners and other measures to ensure
the tax system remains fair and progressive.
Higher excise duties on cigarettes.
Increased enforcement and sanctions on fuel laundering and the illegal
importation and sale of cigarettes.
A new tax on sugar sweetened drinks.
Improvements in tax compliance.

Tax Strategy Group | TSG 17/02 Income Tax and USC
| 10
Equality Proofing
12. The PPG contains a commitment to task the Budget and Finance Committee with
looking at gender and equality proofing Budget submissions and proposals. In the
context of equality, it is important to note that it is the impact of the Budget as a
whole which should be assessed, and not the impact of the taxation or expenditure
measures in isolation.
13. Redistribution of income takes place through the taxation and social welfare
systems. Using OECD data, the extent to which each element contributes to the
redistribution of income, measured by the reduction in the initial market Gini
coefficient can be seen. The Gini coefficient is a measure of the distribution of
income where 0 represents a situation where all households have an equal income
and 1 indicates that one household has all national income. A reduction in the Gini
coefficient means that the distribution of income has become more equal.
14. The latest data from the OECD (for 2012), shows that Ireland had the largest
reduction in the Gini coefficient between market and disposable income for the
OECD countries for which data are available. The data show that, compared to other
countries, the Irish tax system is strongly progressive and that the tax and welfare
systems combined contribute substantially to the redistribution of income and to the
reduction of income inequality.
15. When looked at over a slightly longer time period and taking a more limited sample
of countries for which data are available, it is evident that Ireland’s tax system has
consistently reduced the Gini coefficient (i.e. increased the equality of income
distribution) to greater extent than is the case with tax systems in other OECD
countries. Of interest is the finding that – both for Ireland and the OECD as a whole -
the contribution of the tax system to reducing market income inequality has been
increasing since 2004.
16. The tax system does contain a number of provisions which discriminate in favour of
certain individuals, in view of additional challenges which they face. These include,
for example: the Age Credit and income tax exemption limits for individuals aged 66
and over; reduced USC liability for those aged 70 and over and medical card holders
whose income does not exceed €60,000; additional tax credit and standard rate
band for single parents; additional tax credits for parents of disabled children, for the
blind, for widows/widowers, and for carers of a dependant relative. While these
measures are deviations from the principle of horizontal equity, under which each
person with the same income should have the same tax liability, they have been
introduced into the tax code as a result of social policy decisions to provide
additional supports to individuals in these specific circumstances.

Tax Strategy Group | TSG 17/02 Income Tax and USC
| 11
Gender Proofing – Individualisation vs Joint Assessment
17. USC and PRSI are calculated and payable on an individualised basis, meaning that a
person’s liability to the tax / social insurance charge is determined on the basis of
their own individual income and personal circumstances. By contrast, income tax
allows for a system of joint assessment, whereby one spouse is assessed to the joint
income of both individuals and tax credits and bands may be (partially) transferred
between spouses.
18. With regard to each of the three charges on income, the system of tax rates, bands
and credits applies equally to both genders. Liability to tax and entitlement to
credits and reliefs is determined by factors such as the type and source of income
earned and the nature of deductible expenses incurred and is not influenced by the
gender of the individual taxpayer. For a married couple under joint assessment, the
assessable spouse is determined not by gender but by reference to the higher earner
of the couple.
19. Notwithstanding this non-gendered approach, earnings and workforce participation
data indicate that males are more likely to be the higher earners in households and
therefore the assessable spouse. Therefore policy measures targeted at the
secondary earner of a jointly assessed couple could be expected to have a more
significant impact on females.
20. Prior to 2000 income tax allowed for full joint assessment of married couples,
meaning that the earner in a single-income couple could use the combined tax
credits and standard rate band available to the couple – i.e. double the personal tax
credit and rate band available to a single earner. As a result, where the primary
earner of a couple had sufficient income to use the available reliefs in full, the
second earner faced the marginal rate of tax from the first pound of income earned,
and this could act as a disincentive to workforce participation for second earners.
21. A process of moving towards an individualised system of income taxation began in
the tax year 2000/2001 with the stated economic objectives of increasing labour
force participation and reducing the numbers of workers paying the higher rates of
income tax. Many European countries have made similar moves towards a partial or
fully individualised income taxation on the grounds that it improves equality and
economic independence for women.

Tax Strategy Group | TSG 17/02 Income Tax and USC
| 12
22. An individualised tax system is less favourable to single-income families whose
income is in excess of the married-one-earner standard rate tax band (currently
€42,800). The move towards individualisation was therefore opposed in particular
by single-income families with caring responsibilities in the home. The Home Carer
Credit (HCC) was introduced in tandem with the move towards individualisation in
order to benefit families where one spouse works primarily in the home to care for
children or other dependants. The HCC of €1,100 in Budget 2017 may be claimed in
full where the home carer’s income is below €7,200 per year, and on a reduced
tapered basis where the home carer earns up to €9,200 per year.
23. Other non-tax factors also have significant impacts on female workforce
participation, including in particular the cost of childcare. Studies of the
‘participation tax rate’ for families where women return to work (i.e. the amount of
the additional gross earned income which is loss through payments of tax, social
insurance, reductions in welfare entitlements), have found a participation rate of
below 20% for Ireland indicating a tax and welfare system that is supportive of the
second earner returning to work. However, in situations where the family has to pay
for childcare, the participation tax rate including childcare costs for women with two
children was 94% - the second highest in the EU (second only to the UK).1
24. The issue of tax individualisation was considered by the Commission on Taxation in
2009 and that body recommended no change should be made to the prevailing
income tax system. It concluded that the partially-individualised income tax system
represents a balance between, on the one hand, acknowledging the choices families
make in caring for children and, on the other, taking account of the need to
encourage labour market participation.
1 http://ec.europa.eu/justice/gender-equality/files/documents/150511_secondary_earners_en.pdf

Tax Strategy Group | TSG 17/02 Income Tax and USC
| 13
5. International Comparisons
25. A progressive income tax system means that those on higher incomes pay
proportionately higher rates of tax than those on lower incomes – this is in
accordance with the concept of vertical equity. Ireland has one of the most
progressive income tax systems in the developed world – the most progressive
within the EU members of the OECD, and the second most progressive within all
OECD countries. The tax revenues are used, among other purposes, to fund social
transfers such as welfare supports to those on lower incomes.
26. However high marginal rates of taxation as a result of progressive taxation can have
a negative impact on incentives to work for income earners, and lead to increased
labour costs for employers who may have to offer a certain level of net income in
order to attract employees in a competitive labour market. Marginal tax rates which
are high by comparison to competitor jurisdictions can therefore have a negative
impact on domestic businesses seeking to attract mobile highly-skilled workers.
They can also be a negative factor in the location choices of foreign direct
investment, a particularly important issue for the Irish economy.
27. The Tax Wedge is defined as the sum of personal income tax plus employee and
employer social security contributions together with any payroll taxes less cash
transfers, expressed as a percentage of labour costs. It is the difference between
what an employer has to pay in terms of gross wages plus taxes to hire an employee
and the net income received by that employee after deduction of all taxes on their
wages. High tax wedges particularly affect low skilled workers, second earners and
older cohorts whose labour force participation is more sensitive to taxation.
Reductions in the tax wedge on these groups can have significant impacts on
participation rates which can increase medium term economic growth rates through
the labour supply channel.
28. Reductions in the tax wedge can also increase the demand for labour from
employers. For these reasons, a competitive tax wedge is considered vital in
encouraging employment growth across all income categories and to incentivise
individuals to remain in or return to the labour market.
29. In terms of international comparisons, according to the OECD “Taxing Wages report
2017”, based on 2016 data, Ireland had the seventh lowest tax wedge (27.1) of the
34 members in the OECD for a single worker on average earnings and the lowest of
the 21 EU members of the OECD.

Tax Strategy Group | TSG 17/02 Income Tax and USC
| 14
6. Tax Policy Considerations for Reform - USC
Universal Social Charge
30. The USC was introduced with effect from 1 January 2011, and replaced two existing
levies, the Income Levy and the Health Levy. It was a measure intended to widen the
tax base, as previous increases in income tax credits and rate bands combined with
falls in incomes and employments in the recession had resulted in c.45% of income
earners being exempt from income tax in 2010.
31. The USC was also a revenue-raising measure intended to reduce the budget deficit.
However the projected net increase in revenue from replacing the two existing levies
with the USC was only €420 million per annum.
32. Further reductions to the three lowest rates of USC were introduced in Budget 2017,
such that the lowest rate of USC now stands at 0.5%. The USC, with its entry
threshold of €13,000, is the lowest point of entry to the income tax system for many
taxpayers. Continued reductions in the USC could, in isolation, result in a further
narrowing of the tax base.
33. The USC is a component factor in the top marginal tax rate, which stands at 52% for
all income over €70,044 and 55% for non-PAYE income over €100,000. High
marginal tax rates can be an impediment to international competitiveness, so
reductions in the highest rate of USC (currently 8% on income in excess of €70,044),
being one of the components of the top marginal rate, could improve Ireland’s
comparative competitive advantage.
Potential to Merge USC with PRSI
34. When the introduction of the USC was first proposed in Budget 2010 it was intended
that it would replace Employee PRSI in addition to the Income and Health Levies but
this has not as yet been accomplished for a number of reasons.
35. PRSI is a social insurance charge payable on employment, self-employment and most
investment income. There are two elements to the charge, a personal element
payable by the income-earner and a separate larger element payable by employers
in respect of the salaries of their employees. The PRSI charge is calculated based on
a series of 11 classes and 24 sub-classes, determined by the individual’s age and the
source and level of the income on which the PRSI charge is being applied.

Tax Strategy Group | TSG 17/02 Income Tax and USC
| 15
36. There are a number of theoretical advantages for simplifying from a three-charge to
a two-charge system by way of an amalgamation of USC with PRSI as opposed to an
amalgamation of USC with income tax, including:
Both USC and PRSI are individualised taxes, whereas income tax allows for joint
assessment of married couples / civil partners.
The tax bases for USC and PRSI are similar, including most forms of earned and
investment income and excluding social welfare income.
The Income Tax system incorporates a wide range of policy-driven tax credits,
reliefs and exemptions, whereas USC and PRSI have few reliefs or exemptions.
37. However notwithstanding the above, there are also challenges which would need to
be overcome in amalgamating USC and PRSI, including:
Individuals aged 66 and over are not liable to PRSI, but they are liable to USC.
PRSI operates on a week-one basis whereas the USC is a cumulative annual tax.
Whether the revenues of the new combined charge would accrue to the
Exchequer or the Social Insurance Fund.
Compatibility of the new combined charge with bi-lateral social security
agreements with other countries and with our network of tax treaties.
Whether to preserve the existing Employer PRSI charge in its current form.
USC for over 70s and medical card holders
38. The USC system currently contains a provision which limits the rate of USC payable
by full medical card holders and individuals aged 70 years and over whose aggregate
USC-liable income does not exceed €60,000 per annum. It allows income in excess
of €18,772 to be taxed at the second USC rate (currently 2.5%) in place of the third
rate (currently 5%).
39. The provision for medical card holders is due to expire at end-2017. In the absence
of any policy intervention, individuals aged under 70 who currently benefit from the
relief will see an increase in their USC liabilities from 1 January 2018. In this context
it should be noted that Social Welfare income, such as the State Pension, is not liable
to the USC.
40. Department of Health statistics show that over 1.6 million people had a full medical
card as at the end of April 2017.
41. Options open to the Government include allowing the relief for medical card holders
to expire as planned; a further extension of the current relief; or a modified
extension of the relief into a tapered phase-out period. The estimated cost of the
relief in its current form is in the region of €71 million per annum on a full-year basis.

Tax Strategy Group | TSG 17/02 Income Tax and USC
| 16
7. Tax Policy Considerations for Reform – Income Tax
42. Recent Budgets have focussed primarily on changes to the Universal Social Charge
rather than income tax. The last change to the income tax standard rate bands took
place in Budget 2015, when they were increased by €1,000. In addition to the
Earned Income Credit, set out in more detail below, the Home Carer tax credit (HCC)
was increased in both Budget 2016 and Budget 2017, and now stands at €1,100. The
HCC is available to jointly assessed couples where one partner works primarily in the
home to care for children or other dependant persons.
Earned Income Credit
43. A new Earned Income Credit was introduced in Budget 2016 and is available to self-
employed individuals who do not have access to the PAYE tax credit. It is estimated
that the credit will be available to approximately 147,500 cases in 2017. The PPG
committed to an increase in the value of the Earned Income Credit from €550 to
€1,650, to match the PAYE credit, by 2018, and the credit was increased by €400 to
€950 in Budget 2017.
44. Options for further increases to the credit in fulfilment of the PPG commitment
include:
An increase of €700 in Budget 2018 (Finance Bill 2017) to bring the credit up to
€1,650, at a cost of €58 million in the first year and €103 million in a full year.
This would equate to an additional benefit of over €13 per week for recipients.
A two-stage increase of €350 in each of Budget 2018 and Budget 2019 (Finance
Bill 2018), at a cost each year of €29 million in the first year and €52 million in a
full year. This would equate to an additional benefit of over €6.70 per week for
recipients in each of the two years.
Tapered withdrawal of tax credits
45. The PPG contains a commitment to consider the removal of the PAYE credit for high
earners as part of a medium-term income tax reform plan, and it is assumed that this
would also extend to removal of the Earned Income Credit on the same basis.
46. There are a number of technical issues and policy issues which would need to be
addressed in order to achieve such a withdrawal, particularly for PAYE employees,
and these were set out in some detail in the Income Tax Reform Plan published in
July 2016.2
2 http://www.finance.gov.ie/sites/default/files/Income%20Tax%20Reform%20Plan-FINAL_0.pdf
Tax Strategy Group | TSG 17/02 Income Tax and USC
| 17
47. The UK tax system incorporates a personal tax allowance which is subject to a
tapered withdrawal for individuals whose income is in excess of stg£100,000 per
annum. (In this context it is worth noting that a tax allowance allows relief at a
taxpayer’s marginal rate, whereas the PAYE and Earned Income Credits are standard-
rated tax credits.) The allowance is reduced by £1 for every £2 earned above this
limit, tapering out (in the 2017/2018 tax year) once income reaches £123,000. The
£100,000 threshold was chosen as all individuals with income above that level were
already obliged to file a tax return each year and this facilitated the operation of the
taper. By contrast, there is no similar liability to file a tax return based on income
level in Ireland.
48. Tapering the tax credits could affect the relative position of different categories of
taxpayer. For example, consideration would need to be given to how the taper
would work in the case of jointly-assessed individuals – such as whether the value of
a single personal tax credit or that of a married personal tax credit be subject to the
taper, and what income threshold would apply to a single-income couple.
49. The tapering out of a tax credit would also result in a higher marginal tax rate within
the taper zone than would apply at higher income levels. For example, were the
personal tax credit of €1,650 to be tapered out at a rate of 5% per €1,000 (i.e. a loss
of just over 8 cent per additional euro of income), the marginal rate within the taper
zone would be just over 60%. Once the taper period has expired, at income over
€120,000 in this example, the marginal rate would revert back to 52%.
50. The Income Tax Reform Plan, published in July 2016, contained estimated yields for
tapering the PAYE and Earned Income Credits over the income ranges €80,000 to
€100,000, and €100,000 to €120,000, in the region of €365 million and €212 million
respectively on a first-year basis. However, on review, it has emerged that these
yields were calculated on a “tax unit” basis rather than on an individualised basis.
This means that, in the case of a married-two-earner couple, the yield assumed the
credits were withdrawn where the couple’s joint income exceeded the relevant
threshold. As such it is expected that those estimated yields are significantly higher
than would arise if a taper were to be applied on a per-earner basis. Work is ongoing
to develop revised yield estimates on an individual-earner basis.

Tax Strategy Group | TSG 17/02 Income Tax and USC
| 18
Mortgage Interest Relief
51. The PPG contains a commitment to retain Mortgage Interest Relief (MIR) beyond the
current 2017 end date on a tapered basis. This intention was confirmed in the
Budget 2017 speech, which specified that the details of a tapered extension to 2020
would be set out in Budget 2018.
52. MIR is effectively a demand-side support to the residential housing market as it
facilitates the recipient in affording a higher mortgage repayment, and therefore
capital borrowing, than would otherwise be the case. The policy intention of MIR
was to support individuals in attaining home-ownership, particularly in the early
years of a mortgage when the interest portion of mortgage repayments is at its
highest. However where supply in a market is constrained the effect of a demand-
side tax incentive such as MIR is to drive up market price, effectively transferring the
benefit of MIR to the property vendor or developer, and to property-owners
generally as a result of the increased value of their asset.
53. For this reason the gradual phasing out of MIR has been under way since 2009. No
new mortgages taken out since January 2013 have qualified for MIR, and the relief
has expired for qualifying mortgages taken out prior to 2004. The cohort who
remain in receipt of the relief include those who purchased at the peak of the
property market and those who bought at the subsequent trough in the market.
54. An extension of the relief to current recipients may be unpopular with post-2012
purchasers who have not benefitted from MIR, particularly those who have
purchased more recently as house prices have risen again. Data from the Banking &
Payments Federation Ireland indicate that over 83,000 owner-occupier mortgages
have been drawn down between January 2013 and March 2017, of which over
49,000 were first-time buyer purchases.
55. The remaining recipients receive relief at a rate of between 15% and 30% of
qualifying interest paid – the highest rate of 30% applies to those who purchased
between 2004 and 2008 when house prices were at their peak. A ceiling on
qualifying interest applies of €10,000 per individual (€20,000 per couple) in the first
seven years of the mortgage, and €3,000 per individual (€6,000 per couple) in
subsequent years.
56. MIR for all remaining recipients is due to expire at the end of 2017. Existing MIR
recipients therefore face a ‘cliff’ in 2018 when their monthly mortgage payments
may increase when the tax relief at source is withdrawn (all other factors being
equal). The cost of MIR in 2016 was €187 million with 292,448 mortgage accounts,
equating to an average benefit per account of c.€639 per annum, or €53 per month.

Tax Strategy Group | TSG 17/02 Income Tax and USC
| 19
57. The following options for extending MIR on a tapered basis could be considered:
Extend MIR into a phase-out period by reducing the rate of relief – this would
result in an equal proportionate reduction for all remaining MIR recipients over
the taper period. However this form of taper may be more difficult to implement
for the mortgage lenders who operate the relief at source and may therefore give
rise to confusion or the need to correct claims retrospectively.
Extend MIR into a phase-out period by reducing the ceilings for allowable
interest – a reduction in this manner would be more favourable to those with
lower outstanding borrowings whose annual interest is already below the current
ceilings. As a result it would also be more costly than a tapering of the rate of
relief over an equivalent period. It would however be significantly easier for
mortgage lenders to operate.
Extend MIR into a phase-out period for qualifying 2004-2008 buyers only – a
focused tapered extension of MIR for those individuals who were first-time
buyers during the peak of the property boom between 2004 and 2008 who are
already separately identified for the purposes of the higher 30% rate of MIR,
while allowing the relief to cease as scheduled at end-2017 for other non-first-
time buyers in those years and for borrowers who purchased when prices had
fallen. In 2016 approximately 148,000 mortgages were in receipt of relief at the
30% rate, with an estimated exchequer cost of €110m. (This equates to c.59% of
the total MIR cost for 2016 of €187m.)
58. The potential Exchequer costs of a range of options for the tapered extension of MIR
are as follows:
2018
(€ million) 2019
(€ million) 2020
(€ million)
Taper rate of relief evenly over 3 years 2018-2020
-123 -72 -32
Taper interest ceilings over 3 years 2018-2020
-138 -107 -61
Extend and taper over 3 years for 04-08 buyers only
-67 -39 -17
Tax Strategy Group | TSG 17/02 Income Tax and USC
| 20
8. Further Potential Options for Consideration
59. The Ready Reckoner in Appendix A allows calculation of the cost/yield of
adjustments to the rates, bands and major credits in the income tax system.
60. Taking into account the PPG commitment to focus tax reductions on low and middle
income workers, the information on the distribution of income earners across the
various rates of income tax and USC contained in Section 2 will be of relevance to
the consideration of these options.
61. For example, the following could be extrapolated from the distribution projections in
Section 2:
Approximately 36.5% of income earners are exempt from income tax, and 30%
are exempt from USC. As such, these income earners would not be in a position
to benefit from reductions in income tax or USC rates, or from increases in tax
credits.
19% of income earners are liable to USC at a maximum of the 2.5% rate only, and
these income earners should fall within the exempt or standard rate bands for
income tax. A reduction in the 0.5% and/or 2.5% USC rates would therefore
target the income earners on the lowest taxable incomes. Individuals on higher
incomes would also benefit to the same extent, due to the USC band structure.
A reduction in the headline marginal rates of tax, targeted equally at employees
and the self-employed, could be achieved by reducing the 8% rate of USC
applying on income over €70,044. As illustrated in Section 2, projections indicate
that this would be of benefit to approximately 8% of income earners.
A reduction in the top rate of income tax or an increase in the income tax
standard-rate bands would be of benefit to approximately 20.5% of income
earners.
62. Members of the Tax Strategy Group may wish to consider these issues.

Tax Strategy Group | TSG 17/02 Income Tax and USC
| 21
Appendix A: Ready Reckoner – Potential Costs / Yields
The below table has been updated to reflect the new pre-Budget 2018 Revenue Ready
Reckoner, published on 21 July 2017 subsequent to the circulation of TSG papers to
Group members.
(See notes on next page regarding costing methodology)
No. Options
First Year
Cost/Yield
€m
Full Year
Cost/Yield
€m
Tax Rate
1 Decrease 20% rate to 19% -523 -606
2 Decrease 40% rate to 39% -271 -330
3 Increase 20% rate to 21% +526 +609
4 Increase 40% rate to 41% +269 +328
Standard-Rate Bands
5 Increase standard rate cut off point by €1,000
(single, married one-earners and two earners) -175 -202
Tax Credits
6 Increase Earned Income Credit by €350 -30 -53
7 Increase Earned Income Credit by €700 -59 -106
8 Increase personal tax credits by €100 -201 -234
9 Increase Home Carer Credit by €100 -7 -8
Universal Social Charge
10 Increase USC entry point to €13,500 -2.3 -2.7
11 Increase USC entry point to €14,000 -4.7 -5.6
12 Increase €18,772 ceiling of second USC rate-
band to €19,772 -34 -39
13 Reduce 0.5% rate to 0.0% -111 -129
14 Reduce 2.5% rate to 1.5% -141 -164
15 Reduce 5% to 4% -336 -392
16 Reduce 8% to 7% -136 -177
17
Increase 8% rate to 9% on income over €70,044
(with consequential increase from 11% to 12%
in rate applying to non-PAYE income over
€100,000)
+136 +177

Tax Strategy Group | TSG 17/02 Income Tax and USC
| 22
Points to note regarding costing methodology and assumptions:
Distributions for 2018 are estimates from the Revenue tax-forecasting model using
actual data for the year 2015, adjusted as necessary for income and employment
trends in the interim. The data are published in the new Revenue Ready Reckoner
which is available on the Revenue website.
Individual element cost estimates stand alone i.e. putting 2 elements together may not simply cost the aggregate of the 2 elements as there may be interaction between the elements.
Figures are provisional and likely to be revised.
A jointly assessed married couple/civil partnership is treated as one tax unit.
Percentages are rounded to the nearest percentage point.

Tax Strategy Group | TSG 17/02 Income Tax and USC
| 23
Appendix B: Distributional and Work Incentive Aspects of the Income Tax System
Introduction
B1. This paper provides a short overview of the distributional and work incentive
impacts of a number of possible tax measures. Before presenting the results, the
context for the analysis and the approach and key concepts used are set out below.
Context
B2. The expected distributional impact of budgetary measures continues to be an
important consideration in the formulation of budget policy. A number of
Government departments (Finance, Public Expenditure & Reform, and Social
Protection) carry out distributional analyses in the period leading up to the Budget.
B3. The distributional analysis in this paper forms part of the Government’s undertaking
to facilitate earlier consideration of distributional issues in the budgetary process
and is in line with the Programme for Partnership Government (PPG) commitment to
“develop the process of budget and policy proofing as a means of advancing
equality”.
B4. Given that the details of the budget package are unknown, it is not possible to
directly examine its distributional or work incentive impacts at this stage. Neither is
it feasible to present all the possible individual tax measure permutations which
could be considered. As a result this paper presents the impacts of: (a) a number of
hypothetical individual tax measures; and (b) a hypothetical tax package, which can
be informative as to the general implications were similar measures undertaken.
B5. The differing goals of the budget – which include raising revenue, encouraging
economic efficiency and addressing distributional concerns – mean that trade-offs
are faced in balancing these different objectives. The main focus of this paper is on
distributional issues but consideration of financial incentives to work are also
discussed as they relate to considerations around economic efficiency and growth.
B6. Other issues which should be borne in mind when considering this paper include:
The importance of looking at Budgets and fiscal policy in the round, rather than at
the level of each individual measure;
This paper only addresses tax measures and does not incorporate expenditure
which performs the bulk of the redistributive function of the Irish tax and welfare
system (see Annex B of Budget 2017); and
The very strong progressivity already present in the Irish income tax system.

Tax Strategy Group | TSG 17/02 Income Tax and USC
| 24
Approach and Key Concepts
B7. This paper makes use of the SWITCH (Simulating Welfare and Income Tax CHanges)
micro-simulation tax-benefit model developed and operated by the Economic and
Social Research Institute (ESRI). SWITCH uses household survey data on incomes and
other tax and welfare relevant characteristics to simulate how households are
affected by the rules of the current system and by proposed reforms. SWITCH has
limitations; for instance, it does not account for indirect taxes or expenditure on
public services (such as health care) and it does not incorporate behavioural
changes. The SWITCH model is updated regularly and the next release is due in
September 2017. The simulations in this paper were performed using the Post-
Budget 2017 SWITCH version.
B8. The SWITCH model presents the estimated distributional impact of a budget
measure or package by (i) income group and (ii) family type. The impact on different
income groups can be examined by decile of equivalised disposable income, by fixed
range of equivalised disposable income or by fixed range of gross income. The family
types in the analysis include lone parents and singles without children, both
employed and unemployed; single earner, dual earner and non-earning couples,
with and without children; and retired singles and couples.
B9. While the Government is committed to advancing an equality agenda in the budget
process, there are constraints around the available data to do so in tax policy
analysis. Currently, there are nine aspects covered by Ireland’s equality legislation.
These are gender, age, family status, civil status, sexual orientation, race, disability,
religion or membership of the Traveller Community. Although it is not currently part
of the legal framework around equality, socio-economic status is also an important
concern. Socio-economic status is not directly observable and income is often used
as a proxy for it.
B10. The SWITCH model can currently address two of these equality dimensions: socio-
economic status (via income) and family status. The ESRI have previously used the
underlying micro-data behind SWITCH to examine the distributional impact of
budgets by gender, although this is not a routine part of SWITCH outputs and was a
specially commissioned project for the Equality Authority.3 As SWITCH is based on
household survey data, and more than one person can live in a household, equality
dimensions which are unique to an individual are difficult to incorporate.
3 Keane, C., Callan, T., & Walsh, J. (2014). Gender Impact of Tax and Benefit Changes: A Microsimulation Approach. Economic and Social Research Institute (ESRI) and The Equality Authority.

Tax Strategy Group | TSG 17/02 Income Tax and USC
| 25
B11. The impacts by income group in this paper are presented in terms of their impact
on deciles within the income distribution. Deciles are formed by ranking households
based on their disposable income and then dividing them into ten equally sized
groups.
B12. This ranking by decile is completed after households are ‘equivalised’.
Equivalisation involves adjusting household income on the basis of household size
and composition. The SWITCH model uses a scale of 1 for the first adult, 0.66 for
subsequent adults and 0.33 for children aged 14 or under. This means that the
income of all households is expressed in terms of a single adult household. For
instance, a single adult household with an actual income of 100 (100 ÷ 1 = 100) is
considered to have the same equivalised income as a two adult household with an
income of 166 (166 ÷ {1+0.66} =100).
B13. The distributional impact by family type is conducted on a ‘tax unit’ basis, i.e. an
individual or couple, grouped together with any dependent children. Young adults
(e.g. third-level students) are treated as independent tax units and are not grouped
into households.
B14. There are a number of possible alternative scenarios or counterfactuals against
which the budget or particular measures can be compared. Three alternatives which
can be used in particular when it comes to distributional analysis include a ‘no
change’ comparison as well as scenarios where the taxation system is assumed to
have been indexed to either price inflation or wage growth. The results presented in
the following sections are based on a ‘no change’ policy where all parameters and
policies are kept at Budget 2017 levels except those explicitly mentioned.

Tax Strategy Group | TSG 17/02 Income Tax and USC
| 26
Distributional Analysis
B15. In the interests of transparency and ease of comparison, the SWITCH simulations
conducted here are on the basis of the modelled tax changes occurring in 2017
rather than 2018. This reflects the complication that SWITCH will be updated in
September 2017 and at that stage assumptions about 2018 parameters, which could
be made at present, will have changed. As such, the results do not account for wage
growth in 2018. Nonetheless the simulations can be considered to be highly
representative of the impact of measures were they to be introduced as part of
Budget 2018.
B16. The following table presents the results of simulations of five separate tax
measures each estimated using SWITCH to cost approximately €300 million as
follows:4
An increase in the Pay as You Earn (PAYE) tax credit from €1650 to €1760 and an
increase in the Earned Income Tax Credit (EITC) from €950 to €1760;
A reduction in the 20% rate of income tax to 19.5%;
A reduction in the 40% rate of income tax to 38.8%;
A reduction in the 5% rate of USC to 4.2%; and
A reduction in the 8% rate of USC to 5%.
B17. For the tax measures shown, the impacts can be considered symmetric such that
there would be a corresponding decrease in disposable income if tax rates rose
instead of falling e.g. increasing the standard rate of income tax from 20% to 20.5%
would reduce disposable income of the 1st and 10th deciles by 0.1 and 0.3 percent
respectively.
4 The circa €300 million cost associated with each of the measures is the cost estimate from SWITCH. These SWITCH cost estimates are used to ensure the comparability of the distributional impact. If the measures were costed to amount to €150 million, the percentage change in disposable income for each decile would halve. It should be noted that the Revenue Commissioners’ Ready Reckoner (RCRR) as of November 2016 indicates in some cases quite different cost estimates for the five separate tax measures. The RCRR estimates the full-year costs as follows: IT PAYE €1650-> €1760 and IT EITC €950-> €1760, €287 million; IT 20%-> 19.5%, €288 million; IT 40%-> 38.8%, €336 million; USC 5%-> 4.2%, €294 million; and USC 8%-> 5 %, €441 million. One possible reason for the difference is the different data sources and base years used. SWITCH uses Survey of Income and Living Conditions (SILC) 2013 and 2014 data uprated to 2017, while the RCRR is based on 2017 estimates from the Revenue tax forecasting model using latest actual taxpayer data for the year 2014, adjusted as necessary for income, self-employment and employment trends in the interim.

Tax Strategy Group | TSG 17/02 Income Tax and USC
| 27
Table 1 Distributional Impact of Alternative Income Tax and USC Changes
TC €1650/€950
->
€1760
IT
20% ->
19.5%
IT
40% ->
38.8%
USC
5% ->
4.2%
USC
8% ->
5%
Decile Percentage Change in Disposable Income (%)
1 (<= 242.02) 0.0 0.1 0.0 0.0 0.0
2 (<= 292.61) 0.2 0.1 0.0 0.0 0.0
3 (<= 350.51) 0.2 0.2 0.0 0.1 0.0
4 (<= 409.8) 0.4 0.4 0.1 0.2 0.0
5 (<= 465.92) 0.5 0.4 0.1 0.2 0.0
6 (<= 527.39) 0.4 0.4 0.1 0.3 0.0
7 (<= 591.78) 0.4 0.5 0.2 0.3 0.1
8 (<= 679.33) 0.4 0.5 0.3 0.4 0.1
9 (<= 818.13) 0.4 0.4 0.5 0.5 0.3
10 (> 818.13) 0.3 0.3 1.0 0.5 1.4
All 0.33 0.36 0.36 0.33 0.35
Households
Gaining (%)
61% 79% 41% 58%
11%
Source: Results based on analysis by the Department of Finance using SWITCH, the ESRI tax-benefit model
(www.esri.ie/switch)
B18. The proportion of households benefitting under each measure is given in the
bottom row. This ranges from 11% of households for the reduction in the 8% rate of
USC to 79% of households for reductions in the 20% rate of income tax.
B19. In addition, while the average change in household disposable income (circa
+0.35%) is constant across the different tax measures, the impact on different
income deciles varies considerably. An increase in the EITC and PAYE tax credit or a
reduction in the 20% rate of income tax are relatively more beneficial to low income
deciles compared to the other modelled tax measures. This is because changes in the
40% rate of income tax or the 8% rate of USC do not affect households in these
deciles, as their incomes are below the respective thresholds for those tax rates.
B20. The distributional impact of the tax measures also varies by family status. Across
the range of measures, the family types with above-average income gains are dual
earning couples with and without children, and single earning couples without
children. The smallest gains are for non-earning lone parents and the unemployed.
Overall, families with children tend to benefit more from reductions in the higher
rate of USC than families without children. Families without children tend to benefit
more from reductions in the standard rate of income tax than families with children.

Tax Strategy Group | TSG 17/02 Income Tax and USC
| 28
Table 2 Impact of Alternative Income Tax and USC Changes by Family Status
% of
Families
TC
€1650/€9
50 ->
€1760
IT
20% ->
19.5%
IT
40% ->
38.8%
USC
5% ->
4.2%
USC
8% ->
5%
Percentage Change in Disposable Income (%)
Families with Children 25
Employed Lone Parent 5 0.3 0.2 0.3 0.3 0.3
Non-Earning Lone Parent 2 0.0 0.0 0.0 0.0 0.0
Single Earner Couple 8 0.3 0.2 0.3 0.3 0.5
Dual Earner Couple 9 0.5 0.4 0.5 0.4 0.7
Unemployed Couple 1 0.0 0.0 0.0 0.0 0.0
Families Without Children 65
Single Employed 32 0.4 0.4 0.4 0.4 0.2
Single Unemployed 3 0.0 0.0 0.0 0.0 0.0
Single Earner Couple 6 0.4 0.4 0.4 0.4 0.6
Dual Earner Couple 5 0.6 0.4 0.4 0.5 0.5
Unemployed Couple 0 0.0 0.0 0.0 0.0 0.0
Single Retired Tax Unit 10 0.0 0.3 0.3 0.1 0.1
Retired Couple 8 0.0 0.4 0.2 0.2 0.1
All Other Tax Units 10 0.0 0.3 0.0 0.0 0.0
All 100 0.33 0.36 0.36 0.33 0.35 Source: Results based on analysis by the Department of Finance using SWITCH, the ESRI tax-benefit model
(www.esri.ie/switch)
B21. The PPG contains a commitment to remove the PAYE tax credit for high earners,
and in the following exercise it is assumed that this would also extend to removal of
the EITC on the same basis. There are a number of outstanding technical issues in
relation to implementing this policy. However, due to the developments in the
SWITCH model in the last year, it is now possible to model the impact on households
of the tapered withdrawal of tax credits.
B22. The following table presents the results of simulations of three separate taper
approaches each estimated using SWITCH:
Tapered withdrawal of the PAYE tax credit and EITC at incomes above €70,000;
Tapered withdrawal of the PAYE tax credit and EITC at incomes above €80,000;
Tapered withdrawal of the PAYE tax credit and EITC at incomes above €100,000;
In all cases, withdrawal is modelled as a 50% withdrawal rate i.e. for every one
euro increase in income, 50c of the tax credit is withdrawn.

Tax Strategy Group | TSG 17/02 Income Tax and USC
| 29
Table 3 Impact of tapered withdrawal of EITC and PAYE tax credit
50% withdrawal
for incomes
>€70,000
50% withdrawal
for incomes
>€80,000
50% withdrawal
for incomes
>€100,000
Decile Percentage Change in Disposable Income (%)
1 (<= 242.02) 0.0 0.0 0.0
2 (<= 292.61) 0.0 0.0 0.0
3 (<= 350.51) 0.0 0.0 0.0
4 (<= 409.8) 0.0 0.0 0.0
5 (<= 465.92) -0.1 0.0 0.0
6 (<= 527.39) -0.2 -0.2 0.0
7 (<= 591.78) -0.2 -0.1 0.0
8 (<= 679.33) -0.3 -0.1 -0.1
9 (<= 818.13) -0.4 -0.3 -0.2
10 (> 818.13) -1.0 -0.8 -0.5
All -0.35 -0.25 -0.14
Households Affected (%) 11% 8% 5% Source: Results based on analysis by the Department of Finance using SWITCH, the ESRI tax-benefit model
(www.esri.ie/switch)
B23. Withdrawal of credits for high-earners leaves the vast majority of households
unaffected. With an income threshold of €70,000, losses do not begin until the fifth
income decile, while an income threshold of €100,000 results in losses from the
eighth decile and upward.
B24. The PPG also contains a commitment to retain mortgage interest relief (MIR)
beyond the current 2017 end date on a tapered basis. The Department of Finance
Income Tax Reform Plan, published in July 2016, outlined a number of options for
MIR extension. Again, due to recent developments in the SWITCH model, it is now
possible to model the impact this would have across households.
B25. The following table presents the results of simulations of the options for MIR
extension which were outlined in the Income Tax Reform Plan each estimated using
SWITCH:5
Expiry of MIR at end-2017 as currently scheduled (as a baseline);
Reduce rate of relief to 75% of current level;
Reduce ceiling on allowable interest to 75% of current level;
Reduce rate of relief to 75% of current level for 2004-2008 first-time buyers (FTB)
only.
5 The impacts apply only to the first year of tapering and, as mentioned previously, the SWITCH simulations conducted here are on the basis of the modelled tax changes occurring in 2017 rather than 2018.

Tax Strategy Group | TSG 17/02 Income Tax and USC
| 30
Table 4 Impact of tapered extension of Mortgage Interest Relief
MIR expiry
(baseline
scenario)
75% rate of
relief
75% ceiling 75% rate of
relief for
FTB only
Decile Percentage Change in Disposable Income (%)
1 (<= 242.02) -0.3 -0.1 -0.1 -0.1
2 (<= 292.61) -0.3 -0.1 -0.1 -0.1
3 (<= 350.51) -0.4 -0.1 -0.1 -0.2
4 (<= 409.8) -0.5 -0.1 -0.1 -0.2
5 (<= 465.92) -0.3 -0.1 -0.1 -0.2
6 (<= 527.39) -0.3 -0.1 -0.1 -0.2
7 (<= 591.78) -0.3 -0.1 -0.1 -0.2
8 (<= 679.33) -0.3 -0.1 -0.1 -0.2
9 (<= 818.13) -0.3 -0.1 -0.1 -0.2
10 (> 818.13) -0.2 0.0 0.0 -0.1
All -0.31 -0.08 -0.06 -0.16
Households Affected (%) 17% 16% 11% 17% Source: Results based on analysis by the Department of Finance using SWITCH, the ESRI tax-benefit model
(www.esri.ie/switch)
B26. The three MIR extension options have a marginal negative impact on all income
deciles.6 However, the impact is distribution-neutral in the sense that all households
are impacted in a reasonably similar way. The options to reduce the rate of relief and
to reduce the ceiling on allowable interest result in similar impacts across deciles as
they target the entire existing cohort of MIR claimants (FTB and non-FTB). But the
smaller proportion of households affected under the tapered ceiling option indicates
that this extension would be less financially constraining for many households than a
tapered interest rate option (as certain households may not breach a lowered ceiling
due to a variety of factors including low interest rates or debt amortisation).
B27. The final MIR extension option only relates to FTBs in the 2004-2008 period, who
bought at the peak of the property boom. As a result of partial rather than full
extension of MIR, the average change in disposable income is greater under this
option than the previous two (0.16% reduction compared to 0.06-0.08% reduction).
B28. When MIR expires at end-2017, its recipients face a ‘cliff’ when their monthly
mortgage repayments may increase as the tax relief at source is withdrawn (holding
all else equal). The rationale for extension relates to protecting home ownership for
this specific cohort rather than to developments in the housing market more
6 A caveat exists with the analysis of FTBs in this paper in that it is evident that the SWITCH model over-estimates the number of FTB households who qualify for MIR. This implies that the figures in the first three columns are over-estimates of the losses experienced by households and that the figures in the final column are under-estimates of the losses.
Tax Strategy Group | TSG 17/02 Income Tax and USC
| 31
generally. As such, it is of interest to compare the distributional impact of the MIR
extension options for the recipient population and for the population as a whole.
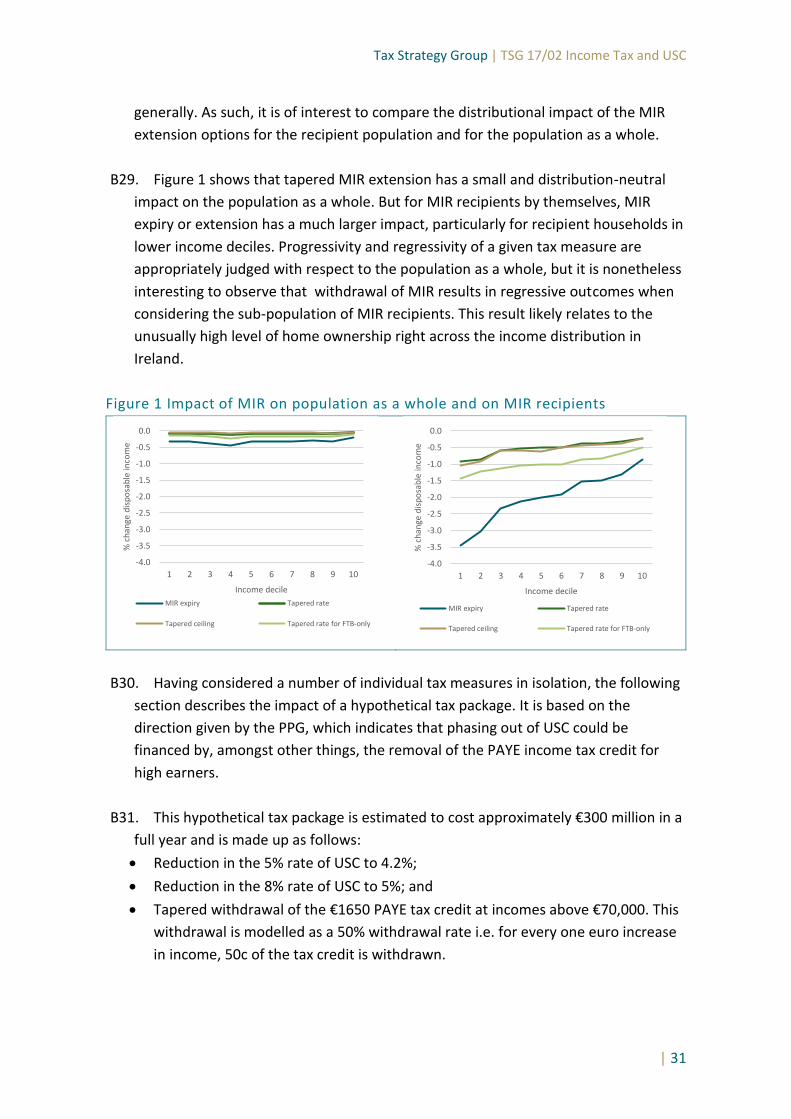
B29. Figure 1 shows that tapered MIR extension has a small and distribution-neutral
impact on the population as a whole. But for MIR recipients by themselves, MIR
expiry or extension has a much larger impact, particularly for recipient households in
lower income deciles. Progressivity and regressivity of a given tax measure are
appropriately judged with respect to the population as a whole, but it is nonetheless
interesting to observe that withdrawal of MIR results in regressive outcomes when
considering the sub-population of MIR recipients. This result likely relates to the
unusually high level of home ownership right across the income distribution in
Ireland.
Figure 1 Impact of MIR on population as a whole and on MIR recipients
B30. Having considered a number of individual tax measures in isolation, the following
section describes the impact of a hypothetical tax package. It is based on the
direction given by the PPG, which indicates that phasing out of USC could be
financed by, amongst other things, the removal of the PAYE income tax credit for
high earners.
B31. This hypothetical tax package is estimated to cost approximately €300 million in a
full year and is made up as follows:
Reduction in the 5% rate of USC to 4.2%;
Reduction in the 8% rate of USC to 5%; and
Tapered withdrawal of the €1650 PAYE tax credit at incomes above €70,000. This
withdrawal is modelled as a 50% withdrawal rate i.e. for every one euro increase
in income, 50c of the tax credit is withdrawn.
-4.0
-3.5
-3.0
-2.5
-2.0
-1.5
-1.0
-0.5
0.0
1 2 3 4 5 6 7 8 9 10
% c
han
ge d
isp
osa
ble
inco
me
Income decile
MIR expiry Tapered rate
Tapered ceiling Tapered rate for FTB-only
-4.0
-3.5
-3.0
-2.5
-2.0
-1.5
-1.0
-0.5
0.0
1 2 3 4 5 6 7 8 9 10
% c
han
ge d
isp
osa
ble
inco
me
Income decile
MIR expiry Tapered rate
Tapered ceiling Tapered rate for FTB-only

Tax Strategy Group | TSG 17/02 Income Tax and USC
| 32
B32. Under this tax package, every household with an income above the USC threshold
of €18,772 would benefit (this is when the actual rate of 5% or the hypothetical rate
of 4.2% would apply). Other things equal, 58% of households would be estimated to
experience a rise in disposable income when we consider the USC changes in
isolation (see Table 1). Roughly four-fifths of these affected households experience
only one USC rate reduction (as their income is less than the €70,044 threshold
where the higher rate of USC applies) while one-fifth experience a double dividend in
the form of two reduced USC rates. However, in the hypothetical tax package, the
double dividend is simultaneously counter-acted by the withdrawal of the PAYE
income tax credit. As a result, 52% of all households are estimated to experience a
rise in disposable income when we consider this particular package as a whole.
B33. Figure 2 illustrates the distributional impact. Households in the highest income
deciles have the largest relative gains, as the majority of low income decile
households currently pay very little USC. However, this regressivity is moderated
somewhat by the withdrawal of the PAYE credit for incomes greater than €70,000.
Figure 2 Impact of a hypothetical tax package
B34. The tapered withdrawal of the PAYE income tax credit (or any other tax credit) is
generally progressive when it occurs above a particular high-income threshold, as
the percentage reduction in disposable income is greater for households above the
threshold than below it. As such, it is a tax measure that is consistent with the
concept of vertical equity i.e. that tax liabilities increase with higher incomes.
However, tapered withdrawal of tax credits also changes the Marginal Effective Tax
Rate (METR) on the last euro of income earned, and this can have important
implications for workers’ incentives to increase work, for example through taking up
over-time or seeking promotion. The next section will discuss this issue.
-1.5
-1.0
-0.5
0.0
0.5
1.0
1.5
2.0
2.5
1 2 3 4 5 6 7 8 9 10 All
% c
han
ge d
isp
osa
ble
inco
me
Income decile
PAYE credit withdrawal USC rate reductions Overall package

Tax Strategy Group | TSG 17/02 Income Tax and USC
| 33
Financial Incentives to Work
B35. The Marginal Effective Tax Rate (METR) is relevant when considering the
incentive for various groups to supply labour. The METR captures the incentive for
someone already in work to increase their earnings (whether by working more hours
or switching to a better-paid job or seeking promotion). It measures what part of any
additional earnings are lost through the combined effect of increasing tax and
decreasing benefits. Low numbers for the METR imply stronger financial incentives
to work, while high numbers imply weaker incentives.
B36. The highest headline rate of marginal tax on the last euro earned is currently 52%
for employees (40% income tax, 4% PRSI and 8% USC) and 55% for the self-employed
((40% income tax, 4% PRSI, 8% USC and 3% USC surcharge for incomes above
€100,000). An METR above these values, therefore, is typically capturing an earnings
increase interacting with a benefit withdrawal, for example due to an earnings cap or
means-testing. As this paper only examines tax policy changes and holds expenditure
policy constant at Budget 2017 levels, the full impact of a Budget package on
financial incentives to work is not being captured here. On the other hand, the paper
is able to capture the METRs for those impacted by the hypothetical tax package
under discussion, and in particular the effect of tax credit withdrawal on the
incentive to increase earnings above particular levels.
B37. A tapered tax credit withdrawal operates in a similar fashion to a tapered benefit
withdrawal in that it can result in substantial changes in the METR for certain
individuals. As currently modelled in the hypothetical tax package, the METR for a
single employee with a gross income between €70,000 and €73,300 would be close
to 100%, which has serious implications for the incentive to increase work (headline
rate of 49% plus credit withdrawal rate of 50% in this income range). For incomes
above €73,300, the METR would revert to 49% (assuming no interaction with the
social welfare system).
B38. Table 5 divides the working population, as modelled by SWITCH, into two sub-
populations: those with a current METR below or equal to 50% and those with an
METR higher than 50%. It then indicates the share of these sub-populations who
experience changes in their incentive to work as a result of the hypothetical tax
package (holding all other factors constant). Many individuals would experience a
reduction in their METR due to the impact of USC rate reductions; almost half of the
population who currently have a METR higher than 50% would experience a notable
reduction in their METR (48.2% experience a fall of between 2 and 5 percentage
points, which corresponds to 177,000 people). This improves their incentive to work
as a result.
Tax Strategy Group | TSG 17/02 Income Tax and USC
| 34
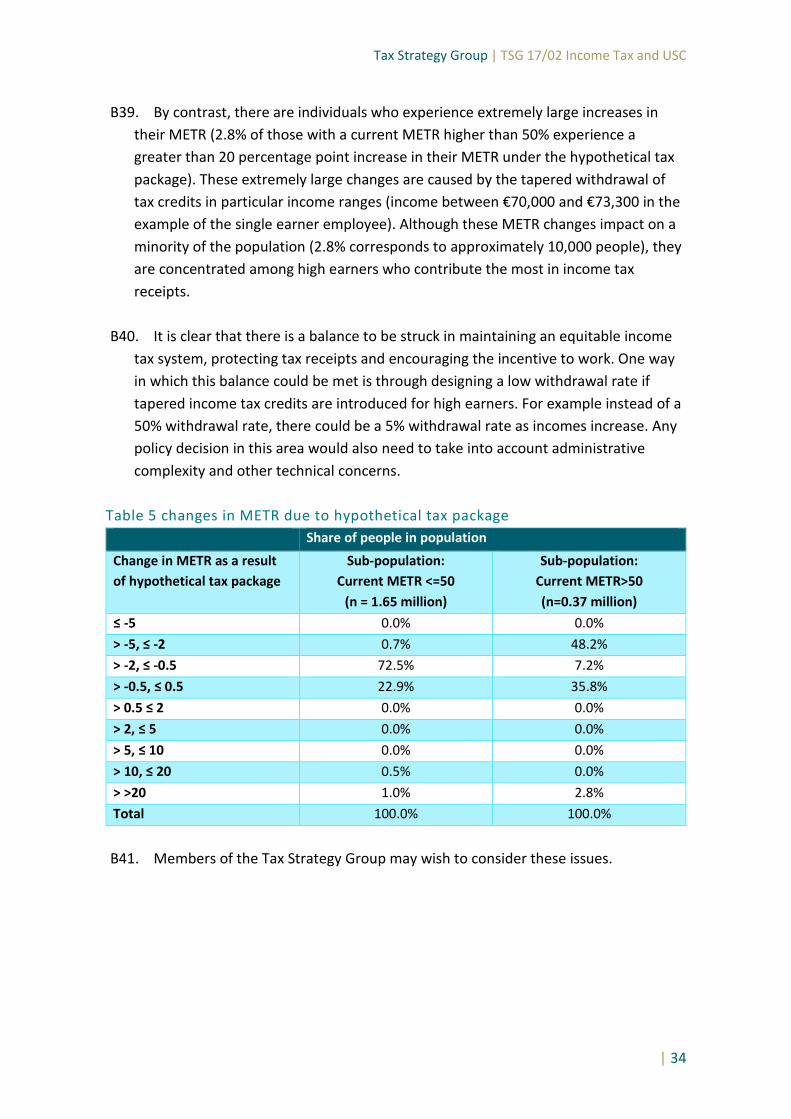
B39. By contrast, there are individuals who experience extremely large increases in
their METR (2.8% of those with a current METR higher than 50% experience a
greater than 20 percentage point increase in their METR under the hypothetical tax
package). These extremely large changes are caused by the tapered withdrawal of
tax credits in particular income ranges (income between €70,000 and €73,300 in the
example of the single earner employee). Although these METR changes impact on a
minority of the population (2.8% corresponds to approximately 10,000 people), they
are concentrated among high earners who contribute the most in income tax
receipts.
B40. It is clear that there is a balance to be struck in maintaining an equitable income
tax system, protecting tax receipts and encouraging the incentive to work. One way
in which this balance could be met is through designing a low withdrawal rate if
tapered income tax credits are introduced for high earners. For example instead of a
50% withdrawal rate, there could be a 5% withdrawal rate as incomes increase. Any
policy decision in this area would also need to take into account administrative
complexity and other technical concerns.
Table 5 changes in METR due to hypothetical tax package
Share of people in population
Change in METR as a result
of hypothetical tax package
Sub-population:
Current METR <=50
(n = 1.65 million)
Sub-population:
Current METR>50
(n=0.37 million)
≤ -5 0.0% 0.0%
> -5, ≤ -2 0.7% 48.2%
> -2, ≤ -0.5 72.5% 7.2%
> -0.5, ≤ 0.5 22.9% 35.8%
> 0.5 ≤ 2 0.0% 0.0%
> 2, ≤ 5 0.0% 0.0%
> 5, ≤ 10 0.0% 0.0%
> 10, ≤ 20 0.5% 0.0%
> >20 1.0% 2.8%
Total 100.0% 100.0%
B41. Members of the Tax Strategy Group may wish to consider these issues.