inconsistencies and findings in manual on gos, wmo-no · web viewwith a view to ensuring the...
TRANSCRIPT

WORLD METEOROLOGICAL ORGANIZATION____________________
COMMISSION FOR BASIC SYSTEMS
OPAG-IOSTASK TEAM ON GOS REGULATORY MATERIAL
Second Session(CBS OPAG-IOS/TT/GRM-2)
GENEVA, SWITZERLAND, 20-22 FEBRUARY 2006
CBS OPAG-IOS/TT-GRM-2/Doc. 7(1)(27.I.2006)
__________
ITEM: 4
Original: ENGLISH
STATUS OF THE DEVELOPMENT OF THE REVISED VERSION OF THE GUIDE ON THE GOS (WMO-No. 488)
(Submitted by Igor Zahumensky, Slovakia)
Summary and Purpose of Document
The document contains the information about the status of the development of the revised version of the Guide on the GOS (WMO-No. 488).
ACTION PROPOSED
The TT/GRM-2 meeting is invited: To consider the status of the development of the update of Guide on the GOS, To review the draft revised version of the Guide and To make appropriate recommendations for further actions
Reference:1. Manual on GOS, WMO-No. 5442. Guide to Meteorological Instruments and methods of Observation, WMO-No. 8 3. CBS, Thirteenth Session, St. Petersburg, 23 February–3 March 2005, Abridged
Final Report with Resolutions and Recommendations, WMO-No. 985
Annex: Draft revised version of the Guide

CBS OPAG-IOS/TT-GRM-2/Doc. 7, p. 2
BackgroundCBS at its thirteenth session, considering the role of GOS-related regulatory material and taking into account changes occurred in the operational practice of NMHSs, felt that activities should be undertaken to review and update the Guide on the Global Observing System (WMO-No. 488). Therefore, it was decided by WMO Secretariat that several steps should be undertaken to fulfil this task as soon as possible. It was decided that:1) The first revision of the Guide should take into account the updated observing regulations and procedures contained in the Manual on the GOS (WMO-No. 544, 2003 edition) and the Guide to Meteorological Instruments and Methods of Observation (WMO-No. 8, Sixth edition) respectively.
The tasks were: To review the content of the Manual of the GOS, the Guide on the GOS (an electronic
version of the Guide was provided) and the Guide on Meteorological Instruments and Methods of Observation with the aim to rectify deficiencies, duplications, inconsistencies and errors.
To compile the results in the form of draft amendments to the Guide on the GOS.The deadline was December 2005.2) In accordance with guidelines given by the EC and CBS, to prepare the updated version of the Guide that should:
incorporate developments in the GOS operations, take into account recent proposals and recommendations related to the Space-based
subsystem of the GOS, and include guidance material related to the WMO Quality Management System.
The possible deadline: CBS-Ext (2006).
Status of the development of the update of Guide on the GOSIn accordance with the tasks mentioned in (1) above, the comparison of the procedures contained in the Guide with relevant parts of the Manual on the GOS and CIMO Guide and the revision of the Guide on the GOS (the rectification of the deficiencies, inconsistencies and errors) were done; the drafts of revised parts of the Guide were prepared, and handed to the Secretariat in December 2005. Refer annex for a draft copy of the revised version of the Guide.
The most frequent deficiencies, inconsistencies and errors were as follows: Invalid reference to the relevant part of the Manual on the GOS or CIMO Guide; Out of date terminology (e.g. Global Data-processing System (GDPS), near-polar-
orbiting); Impropriate use of terminology (observational - observation - observing), Imprecise pieces of information or incomplete information. Fulfilling these tasks, additional documents were downloaded from the Internet with the aim to use them, beside WMO official publications, as further reference documents for the planned update of the Guide on the GOS.

WORLD METEOROLOGICAL ORGANIZATION
GUIDE
ON THE
GLOBAL OBSERVING SYSTEM
WMO - No. 488
Secretariat of the World Meteorological Organization - Geneva - Switzerland1989
© 1989, World Meteorological Organization
ISBN 92-63- 1 0488-3
NOTE
The designations employed and the presentation of material In this publication do not Imply the expression of any opinion whatsoever on the part of the Secretariat of the World Meteorological Organization concerning the legal status of any country, territory, city or area, or of its authorities, or concerning the delimitation of Its frontiers or boundaries.

TABLE FOR NOTING SUPPLEMENTS RECEIVED
SupplementNo. Dated
Inserted
by date
123456789
10111213141516171819202122232425

P R E F A C E
The first edition of the Guide on the Global Observing System (WMO-No. 488) was initiated by the sixth session of the WMO Commission for Basic Systems, held in Belgrade in March/April 1974, and completed in 1977 by a study group under the leadership of Dr T. Mohr (Federal Republic of Germany). At its eighth session in February 1983 the Commission noted that, with the publication of the Manual on the Global Observing System (WMO-No. 544) comprising Annex V to the WMO Technical Regulations and containing all regulatory material pertaining to the Global Observing System, it had become necessary to revise and extend the Guide. It therefore requested its Working Group on the Global Observing System to prepare a draft of a new version of the Guide for submission to the ninth session of the Commission.
The bulk of the drafting was carried out by individual members of a study group set up for the purpose, namely, Mr Y. Shavit, chairman (Israel),Mr O. Bremnes (Norway), Mr O. A. Gorodetski (USSR), Mr J. Ilko (Czechoslovakia), Mr G. Muller (Switzerland), Mr H. Veit (German Democratic Republic), and Mr F. Zbar (USA). Mr J. Hussey (USA), the working group's Rapporteur on Advanced Satellite Remote Sensing, prepared Part IV on the Space-based Subsystem, while a few sections as well as the final compilation and editing were completed by the Secretariat. Although the work was carried out mainly by correspondence, three meetings of the study group were held in November 1983, November 1984 and December 1986. Initial drafts of two chapters were reviewed by the fourth session of the working group in December 1984 and the final draft by correspondence in mid-1987. The resulting new version of the Guide was reviewed, and with a number of amendments approved by the ninth session of the Commission in January/February 1988.
The main purpose of this Guide is to provide users with general information on observationaling practices and procedures supplementing that already contained in the Manual on the Global Observing System, the current Plan and Implementation Programme for the World Weather Watch and other relevant WMO publications. It is not intended to be adetailed information manual for the use of observers but to form a basis for the preparation of instructions by each Meteorological Service to meet its own particular needs.
Finally, I should like to take this opportunity of placing on record, on behalf of the World Meteorological Organization, my gratitude to all those who contributed to the present publication.
(G.O.P. Obasi)Secretary-General

C O N T E N T S
Page
PREFACE........................................................................................................................V
INTRODUCTION............................................................................................................IX
PART I - PURPOSE, SCOPE AND ORGANIZATION OF THE GLOBAL OBSERVING SYSTEM ………………………………………………………………………….. I-1
1.1 Purpose of the Global Observing System I-31.2 Scope of and requirements for the Global Observing System ..........................I-31.3 Organization and implementation of the Global Observing System .................I-3
PART II - REQUIREMENTS FOR OBSERVATIONAL DATA......................................II-1
2.1 General..............................................................................................................II-32.2 Global and regional requirements.....................................................................II-52.2.1 Data requirements of GDPFS...........................................................................II-52.2.2 Other requirements for observational data........................................................II-52.3 National requirements.......................................................................................II-52.4 Achievable performance of the GOS................................................................II-6
Attachment II.1..................................................................................................II-7Attachment II.2................................................................................................II-13
PART III - THE SURFACE-BASED SUBSYSTEM......................................................III-1
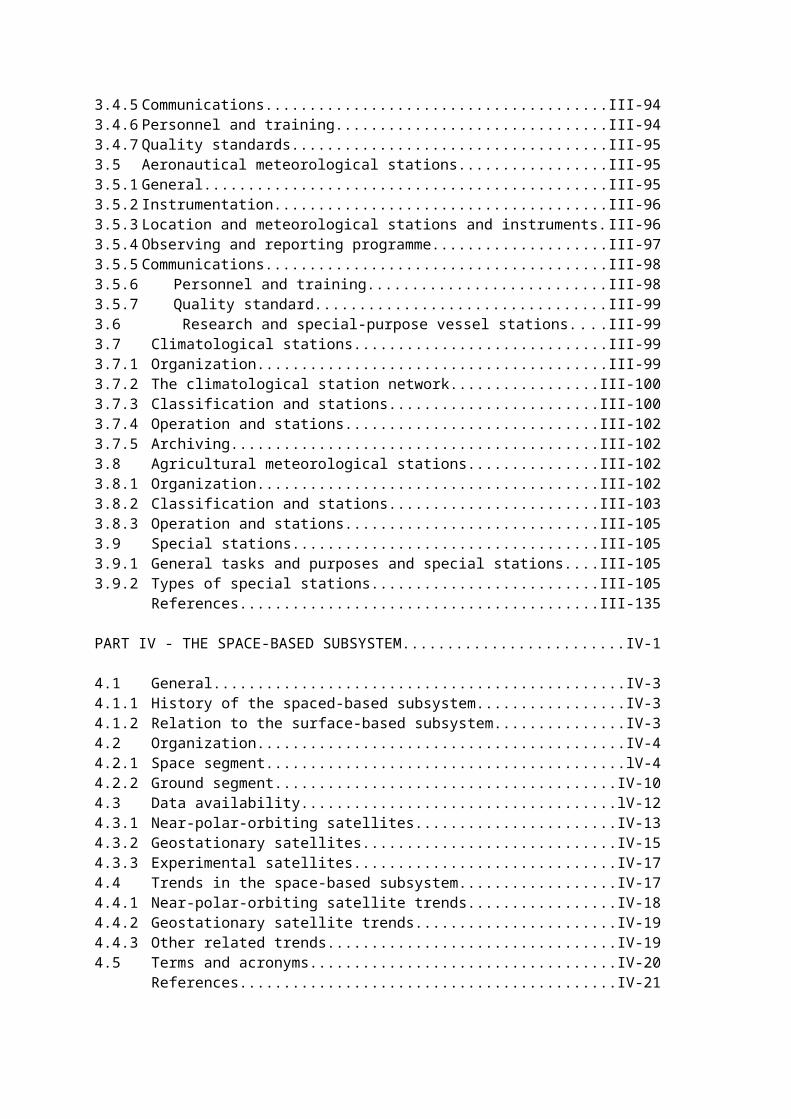
3.1 General.............................................................................................................III-33.1.1 Design of observing networks..........................................................................III-33.1.2 Planning of networks and stations...................................................................III-43.1.3 Management of manned station networks.......................................................III-63.1.4 Management of automatic surface land station networks..............................III-113.2 Surface synoptic stations...............................................................................III-133.2.1 Organizational aspects...................................................................................III-133.2.2 Observations/measurements.........................................................................III-483.3 Upper-air stations...........................................................................................III-673.3.1 Organizational aspects...................................................................................III-673.3.2 Observations/measurements.........................................................................III-783.3.3 Special management considerations.............................................................III-853.4 Aircraft meteorological stations......................................................................III-923.4.1 General..........................................................................................................III-923.4.2 Instrumentation and data processing.............................................................III-923.4.3 Site selection..................................................................................................III-933.4.4 Observing and reporting procedures..............................................................III-933.4.5 Communications............................................................................................III-943.4.6 Personnel and training...................................................................................III-943.4.7 Quality standards...........................................................................................III-953.5 Aeronautical meteorological stations.............................................................III-953.5.1 General..........................................................................................................III-953.5.2 Instrumentation..............................................................................................III-963.5.3 Location and meteorological stations and instruments..................................III-963.5.4 Observing and reporting programme.............................................................III-973.5.5 Communications............................................................................................III-983.5.6 Personnel and training...................................................................................III-98

3.5.7 Quality standard.............................................................................................III-993.6 Research and special-purpose vessel stations.............................................III-993.7 Climatological stations.................................................................................III-993.7.1 Organization.................................................................................................III-993.7.2 The climatological station network.............................................................III-1003.7.3 Classification and stations.........................................................................III-1003.7.4 Operation and stations...............................................................................III-1023.7.5 Archiving....................................................................................................III-1023.8 Agricultural meteorological stations...........................................................III-1023.8.1 Organization...............................................................................................III-1023.8.2 Classification and stations.........................................................................III-1033.8.3 Operation and stations...............................................................................III-1053.9 Special stations..........................................................................................III-1053.9.1 General tasks and purposes and special stations.....................................III-1053.9.2 Types of special stations............................................................................III-105
References.................................................................................................III-135
PART IV - THE SPACE-BASED SUBSYSTEM..........................................................IV-1
4.1 General..........................................................................................................IV-34.1.1 History of the spaced-based subsystem.......................................................IV-34.1.2 Relation to the surface-based subsystem.....................................................IV-34.2 Organization..................................................................................................IV-44.2.1 Space segment..............................................................................................lV-44.2.2 Ground segment..........................................................................................IV-104.3 Data availability............................................................................................lV-124.3.1 Near-polar-orbiting satellites........................................................................IV-134.3.2 Geostationary satellites...............................................................................IV-154.3.3 Experimental satellites.................................................................................IV-174.4 Trends in the space-based subsystem........................................................IV-174.4.1 Near-polar-orbiting satellite trends..............................................................IV-184.4.2 Geostationary satellite trends......................................................................IV-194.4.3 Other related trends.....................................................................................IV-194.5 Terms and acronyms...................................................................................IV-20
References..................................................................................................IV-21
PART V - REDUCTION OF LEVEL I DATA.................................................................V-1
5.1 Reduction of Level I data from the surface-based subsystem.......................V-35.1.1 Introduction.....................................................................................................V-35.1.2 Units for meteorological observations............................................................V-35.1.3 Principal lLand stations...................................................................................V-55.1.4 Automatic stations..........................................................................................V-45.1.5 Sea stations....................................................................................................V-85.1.6 Upper-air synoptic stations.............................................................................V-95.1.7 Special stations............................................................................................V-115.2 Reduction of Level I data from the space-based subsystem........................V-135.2.1 Introduction...................................................................................................V-135.2.2 Orbit and attitude processing.......................................................................V-135.2.3 Pre-processing of radiometer raw data........................................................V-145.2.4 Generation of imagery..................................................................................V-155.2.5 Extraction of quantitative meteorological information...................................V-15
References...................................................................................................V-16

PART VI - QUALITY CONTROL.................................................................................VI-1
6.1 General............................................................................................................VI-36.1.1 Levels of application of quality- control procedures.........................................VI-36.1.2 Observational errors........................................................................................VI-46.2 Procedural aspects of quality control...............................................................VI-46.2.1 Minimum standards.........................................................................................VI-46.2.2 Scope of quality control...................................................................................VI-56.2.3 Implementation................................................................................................VI-66.3 Stages of quality control (real time).................................................................VI-96.3.1 Quality control during and after obtaining Level I data..................................VI-106.3.2 Quality control during the reduction and conversion into Level II data..........VI-106.3.3 Quality control after obtaining Level II data...................................................VI-116.4 Other quality control procedures....................................................................VI-136.4.1 Availability of statistics on variables...............................................................VI-136.4.2 Use of accepted abbreviations......................................................................VI-146.4.3 Pictorial representations and diagrams.........................................................VI-146.4.4 Simplified mathematical checks.....................................................................VI-146.5 Quality control and feedback.........................................................................VI-156.5.1 Stability of feedback system..........................................................................VI-156.5.2 Utilization of general code concepts in support of data quality control..........VI-16
References....................................................................................................VI-16
PART VII - MONITORING THE GLOBAL OBSERVING SYSTEM............................VII-1
7.1 General...........................................................................................................VII-37.2 Implementation of the monitoring of the GOS................................................VII-37.2.1 Monitoring of the availability of observational data.........................................VII-37.2.2 Monitoring of observational data quality.........................................................VII-3
References...................................................................................................VII-10
APPENDIX TO PART VI ………………………………………………………………….. A-1

I N T R O D U C T I O N
General
One of the principal purposes of the World Meteorological Organization, as laid down in the Convention, is to facilitate world-wide co-operation in the establishment of networks of stations for the making of meteorological observations or other geophysical observations related to meteorology, and to promote the establishment and maintenance of meteorological centres charged with the provision of meteorological services. Another purpose of the Organization is to promote standardization of meteorological observations and to ensure the uniform publication of observations and statistics. With a view to ensuring the required standardization of practices and procedures in meteorology, the World Meteorological Congress has adopted, from time to time, the WMO Technical Regulations (WMO-No. 49) which lay down the meteorological practices and procedures to be followed by the Member countries of the Organization. These Technical Regulations include manuals on various aspects of the Organization's activities and are supplemented by a number of Guides which describe in more detail the practices, procedures and specifications which Members are invited to follow in establishing and conducting their arrangements for compliance with the WMO Technical Regulations and in otherwise developing meteorological services in their respective countries. The present Guide deals with the organization and implementation of the Global Observing System which is one of the three essential elements of the World Weather Watch, the basic Programme of WMO.
The World Weather Watch (WWW)
The purpose of the WWW is to provide meteorological and related geophysical and environmental information to all Members of WMO in support of their services to users in real-time and non-real-time operations. WWW primarily provides Members with observational data and processed products for meteorological forecasting and warning and research purposes but also supports other WMO activities and relevant programmes of other international organizations in conformity with WMO policies.
The WWW comprises three essential elements, each of which functions on three levels: global, regional and national:
The Global Observing System (GOS), consisting of facilities and arrangements for making measurements and observations at stations on land, at sea, and from aircraft, meteorological satellites and other platforms;
The Global Data-processing and Forecasting System (GDPFS), consisting of meteorological centres with arrangements for the processing of observational data and preparation of analyses and forecast products (real-time users) and for the storage and retrieval of data and processed products (non-real-time users);
The Global Telecommunication System (GTS), consisting of telecommunication facilities and arrangements necessary for the rapid and reliable collection and distribution of the required observational data and processed products.
Further specifications and details of the functions and organization of the three essential elements (also referred to as components) of the WWW are given in Volume I of the respective Manuals on the GOS, GDP F S and GTS which are annexes to the WMO Technical Regulations.
Purposes of the Guide on the Global Observing System

The main purpose of the Guide is to provide practical information on the development, organization, implementation and operation of the GOS in order to enhance both the participation of individual Members in the System and the benefits they may obtain from it. The Guide explains and describes the observing and reporting practices, procedures and specifications of the GOS and is aimed at assisting the technical and administrative staff of National Meteorological Services responsible for the networks of observing stations to prepare national instructions for observers.
The Guide supplements the regulatory material on observational matters contained in the WMO Technical Regulations (WMO-No. 49) and the Manual on the GOS (WMO-No. 544) and, for ease of reference, follows approximately the same structure as the Manual. The Guide also complements the Guide to Meteorological Instruments and Methods of Observation while the Guide on the Global Data-processing System is used in turn to complement the Guide on the GOS.
A list of publications which are related to and may be used in conjunction with the Guide on the GOS is given below.
The WMO Technical Regulations (WMO-No. 49);
Manual on the Global Observing System (WMO-No. 544);
Manual on the Global Telecommunication System (WMO-No. 386);
Manual on the Global Data-processing System (WMO-No. 485);
Manual on cCodes (WMO-No. 306);
Information on meteorological satellite programmes operated by Members and organizations (WMO-No. 411);
Guide to mMeteorological iInstruments and mMethods of oObservation (WMO-No. 8);
Guide on the Global Data-processing System (WMO-No. 305);
Guide to marine meteorological services (WMO-No. 471);
Guide to hydrological practices (WMO-No. 168);
Guide to climatological practices (WMO-No. 100);
Guide to agricultural meteorological practices (WMO-No. 134);
Guide to aeronautical meteorological practices (in preparation) Guide to Practices for Meteorological Offices Serving Aviation (WMO-No. 732);
International cloud atlas (WMO-No. 407);
Guidelines for the education and. training of personnel in meteorology and operational hydrology (WMO-No. 258);
The World Weather Watch Programme 1988-1997, Second WMO Long-term Plan, Part II, Vol. 1 (WMO-No. 691).
P A R T I
PURPOSE, SCOPE AND ORGANIZATION OF THE GLOBAL OBSERVING SYSTEM
1.1 PURPOSE OF THE GLOBAL OBSERVING SYSTEM
The Global Observing System is a co-ordinated system of methods, techniques and facilities, the main purpose of which is to provide, in a cost-effective way, meteorological and related environmental and geophysical observations from all parts of the globe as are required for the real-time preparation of weather analyses and forecasts, including warnings. The GOS also provides observational data for research purposes and, as agreed by the Organization, in support of other WMO pProgrammes or relevant programmes of other international organizations.
1.2 SCOPE OF AND REQUIREMENTS FOR THE GLOBAL OBSERVING SYSTEM
The requirements to be met by the GOS are defined by Members of the Organization through the regional associations and technical commissions and formulated in the various WMO Programmes. Essentially, the GOS must provide the basic data needed for the services rendered by the national Meteorological Services or other organizations in contributing to public safety, socio-economic well-being and development in their respective countries. These services fall into three main categories: (a) weather forecasts (including reports on current weather, warnings of hazardous weather phenomena and predictions of weather on varying time-scales up to one month and sometimes beyond); (b) climate information and advice in the application of meteorological data and knowledge; and (c) hydrological services including flood warnings.
Within these three main categories there is a variety of specialized services and applications of meteorology which require different types of meteorological observations and measurements on varying scales. These include short-, medium- and long-range weather forecasting; the provision of severe weather warnings for the occurrence of such phenomena as tropical cyclones, polar lows, hail storms, floods and heavy snowfalls; services to aviation, shipping and agriculture and for other diverse areas such as energy production, environmental protection, the construction industry and tourism. In general, the requirements to be met by the GOS for each of these areas are established by the WMO Technical Commissions for Basic Systems, Climatology, Atmospheric Sciences, Hydrology, Aeronautical Meteorology, Agricultural Meteorology and Marine Meteorology.
A number of international programmes also use WWW facilities and those of the GOS in particular, and have their own special requirements. These include: the World Climate Research Programme of WMO and the International Council of Scientific Unions, the World Area Forecast System for support to aviation, the Global Environmental Monitoring System of UNEP, and the joint IOC/WMO Integrated Global Ocean Services System.
1.3 ORGANIZATION AND IMPLEMENTATION OF THE GLOBAL OBSERVING SYSTEM
In order to meet these requirements the GOS is designed as a composite system divided into surface-based and space-based (satellite) subsystems. The former (discussed in detail in Part III of the Guide) comprises the Rregional bBasic sSynoptic nNetworks (RBSN) as well as other networks of land, sea and airborne stations; it also includes agricultural meteorological stations, climatological stations and special stations .The space-based subsystem (see Part IV) is composed of near-polar-orbiting and geostationary meteorological satellites and has a ground segment (for data reception and processing) as well as a space segment.

The composite system provides observational information which falls broadly into two categories:
(a) Quantitative information, derived directly or indirectly from instrument measurements; and
(b) Qualitative (descriptive) information.
Examples of quantitative information, which specify the physical state of the atmosphere, are measurements of atmospheric pressure, humidity, air temperature and wind velocity, while qualitative or descriptive information includes such observations as the amount and type of clouds and types of precipitation.
The specific requirements for the various types of information and data are addressed in Part II.
With respect to the implementation of the GOS, the guiding principle is that all activities and facilities connected with the establishment and operation of the System on the territories of individual countries are the responsibility of the countries themselves and should be met to the extent possible from national resources. Where this is not possible, assistance may be provided by UNDP, through other multilateral or bilateral assistance programmes or by the WMO Voluntary Co-operation Programme.
Implementation of the GOS outside the territories of individual countries (e.g. outer space, the oceans and the Antarctic) is based on the principle of voluntary participation of countries that desire and are able to contribute by providing facilities and services either individually or jointly from their national resources or through collective financing.
The GOS is a flexible and continuously evolving system with a choice and mix of observing elements which may be adjusted to take full advantage of new technology or to meet new requirements. As a, general principle, however, the evolution of the system should be based on proven techniques and should represent the best mix of observing elements which
Satisfies to the maximum extent the agreed-upon data requirements in respect of accuracy, frequency and spatial resolution;
Is operationally and technically feasible;
Meets the cost-efficiency requirements of Members.
Throughout the GOS, standardized quality- control procedures are applied (see Part VI of the Guide) to all observing system elements in order to ensure high quality and compatible data with known error structures.
Certain levels of redundancy are required for quality assurance purposes and to provide some insurance against catastrophic failure in any single component or element; multi-purpose elements or stations are encouraged in order to comply with cost-efficiency requirements.
____________

P A R T II
REQUIREMENTS FOR OBSERVATIONAL DATA
2.1 GENERAL
Weather prediction can best be made on the basis of precise meteorological analyses. Such analyses are made on the basis of highly reliable observational data which are received at analysis centres, in time, from a sufficiently dense network of observations. However, requirements concerning the accuracy of observational data, the frequency of observations and the density of the network of observations are dependent upon the different scales of meteorological phenomena to be analysed. As is well known, various meteorological phenomena in different scales co-exist in the atmosphere. For example, one cell of a thunderstorm is only several kilometres in horizontal scale and has a lifetime of several hours while a tropical cyclone is about 1000 kilometres in horizontal scale and has a lifetime of 10 days or more; many thunderstorms cells appear and disappear during the life cycle of a tropical cyclone. Therefore, the frequency and spacing of observations should be adequate to obtain observational data which describe temporal and spatial changes of the meteorological phenomena with sufficient resolution to meet the requirements of the users. If the spacing of observations is more than 100 km, the meteorological phenomena which have a horizontal scale of less than 100 km are not usually detectable. The classification of horizontal scales of the meteorological phenomena given in the Manual on the GOS (WMO-No. 544), Volume I. is as follows:
(a) Small scale (less than 100 km; e.g. thunderstorms, local winds, tornadoes); (b) Mesoscale (100-1 000 km; e.g. fronts and cloud clusters);
(c) Large scale (1000-5 000 km, e.g. depressions and anticyclones);
(d) Planetary scale (more than 5 000 km; e.g. long upper-tropospheric waves).
The horizontal scales are closely related to the time scales of the phenomena. The bigger horizontal-scale perturbations are likely to survive for a longer time period (Figure II. 1). Therefore, short-range weather forecasts require more frequent observations from a denser network over a limited area in order to detect any small scale phenomena and their development. As the length of the forecast period increases, so does the area over which observations are required. Because of the dynamic interaction between the meteorological phenomena in different scales, it may not be possible to specify definitely the requirements for individual scales.
The requirements are generally divided into three categories:
(a) Global requirements shall refer to observational data needed by Members for a general description of large-scale and planetary-scale meteorological phenomena and processes;Global requirements which derive primarily from the need to define the initial conditions of global weather prediction models. These models deal with atmospheric motions on the large and planetary scales but may be influenced by motions on smaller scales;
(b) Regional requirements shall be related to the observations needed by two or more Members to describe in greater detail the large- and planetary-scale atmospheric phenomena, as well as to describe the smaller ones on the mesoscale and small scale as may be agreed by regional associations;Regional requirements which derive from the need of two or more Members to describe in greater detail the planetary and

large-scale atmospheric phenomena as well as those of meso- and smaller scales;
(c) National requirements shall be determined by each individual Member in the light of its own interests.National requirements which derive from the needs of individual countries for specialized services to end-users and from the particular climate regime.

Horizontal scale (metres)
Figure II.1 - Horizontal and time scales of meteorological phenomena
2.2 GLOBAL AND REGIONAL REQUIREMENTS
2.2.1 Data requirements offor GDPFS
The formulation of data requirements for NWP methods for various forecasting ranges is an ongoing process based on an evolving level of experience with observing systems, on observing system experiments and network studies, and on the introduction of new data assimilation systems and NWP models. Data requirements have been established to meet the current and expected future possibilities of the GDPFS.
The tables given in Attachment II.1 list the observational data which will be needed for advanced NWP systems by the year 2000. They include the needs for data assimilation and for analysis and model validation for global short-and medium-range forecasting (excluding extended-range forecasting). Requirements for regional modelling are mentioned in the explanatory text, where appropriate. The types of observing network and platforms providing data required at data-processing centres are also given in Attachment II.1 The regional observing networks are designed in accordance with data requirements of individual regions.
2.2.2 Other requirements for observational data
One of the main purposes of the GOS is to provide observational data for other WMO Programmes and for other international organizations. In particular, the Global Climate Observing System (GCOS), which is being developed as a dedicated observationing system designed specifically to meet the scientific requirements for monitoring the climate and for detecting and predicting climate change, will be based largely on the GOS. However, the climate monitoring and predicting objectives will necessitate a number of improvements of the observing systems both in observational accuracy, representativeness and coverage. Reliable long-term data sets with optimal vertical resolution and homogeneous horizontal global coverage will be required. In order to meet GCOS requirements, the existing elements of the GOS should be enhanced as follows:
(a) The number of observationaling stations in remote areas should be increased;
(b) Long-term support should be found for a set of well-distributed high-quality upper-air stations composed of existing or new sites to provide a relatively homogeneous baseline global data network;
(c) Networks of drifting buoys making meteorological observations should be maintained and extended over data-sparse ocean areas (e.g. Indian and Southern Oceans);
(d) In order to maintain continuity in climate records, procedures should be introduced to calibrate new observing systems in the operational environment against the systems being replaced; in particular, old and new systems should be operated side-by-side for a period adequate to determine long-term relationships.
2.3 NATIONAL REQUIREMENTS
National observational data are required, in addition to general GDPFS requirements, for now casting, very short-range weather forecasting and severe weather warnings, for interpretation of processed forecast fields into local weather parameters, for verification of the quality of issued forecasts and warnings, and for other (non-real-time) applications. The observational data required for this purpose include surface and upper-air data obtained from

land stations and ships, aircraft and buoys, as well as weather radar data and satellite information (satellite-derived temperature, humidity, winds and high-resolution imagery).
National observing networks are, of course, designed by Members according to their needs individually or in agreement with other Members but in accordance with WMO regulatory and guidance material.
In designing these networks, account should be taken of the special requirements for observational data and forecast products of the end-user groups for whom the services are being provided. Much of the data requirements but individual services may often require additional data, denser networks or greater frequency of observations. An indication of the requirements for measured or observed and forecast variables for a selection of important end-user groups is given in Attachment II.2.
2.4 ACHIEVABLE PERFORMANCE OF THE GOS
The GOS will gradually evolve to address global, regional and national requirements for observational data. Many of the requirements stated here can only be met by satellite-borne observing systems. However, in most cases, a combination of satellite and in situ data will be needed to obtain adequate resolution and to ensure stability of calibration of remote sensing systems. The GOS will, therefore, continue to be composed of the surface-based and space-based subsystems. However, resource constraints require that careful judgements be made on the value of increased quality of GDPFS output products weighed against the costs of additional observations. The definition of requirements and the design of the GOS are largely influenced by cost and by the ability of countries to operate GOS components and facilities. It is, therefore, important to define realistic and achievable goals for Members’ efforts in respect of the composite global observing system. An estimate of the performance to be achieved by various elements of the GOS by the year 2005 related to observational requirements for the GDPFS is given in Attachment II.3. It represents what are considered to be realistic and achievable goals in terms of resolution, accuracy and frequency on a global scale. In some regions, these requirements may be surpassed.
ATTACHMENT II.1
Observational data requirements for GDPS centres for global and regional exchange
Paragraphs 1, 2, and 3 state the observations required to operate all GDPS centres at national, regional and global levels. Paragraph 4 addresses the data requirements for
NWP operations only.
The types of observation networks and platforms providing data required at data processing centres are as follows:
All stations included in the Regional Basic Synoptic Networks;
The network of supplementary stations, including automatic stations;
Automatic marine stations (drifting buoy and moored buoy programmes);
Mobile sea stations;
All other stations making radiowind, radiosonde/radiowind and pilot balloon observations;
Meteorological rocket stations;
Aircraft meteorological observations;
Wind profilers;
Doppler and weather watch radar systems;
Space-based systems producing:
Imagery (including digital imagery);
Radiance data;
Retrieved vertical temperature profiles;
Cloud and water vapour motion winds;
Digital information about clouds;
Satellite surface wind and precipitable water;
Manual data, for example, Australian bogus surface data;
Moisture profiles derived from satellite observations oversea areas;
Precipitation fields from multispectral cloud radiance data;
Other meteorological and environmental products;

Radiological data reporting station in case of nuclear accidents (required for GDPS centres running transport models for environmental emergency response);
Rainfall radar composites;
Lightning detection and location systems network.
The observational data which will be needed to obtain optimum results from NWP systems by the year 2000 are elaborated in paragraph 4 and the related three tables of this
attachment.
The report code types which carry the data provided by the platforms listed in paragraph 1 are given below:
BUFR and GRIB;
TEMP - Parts A, B, C, and D;
PILOT - Parts A, B, C, and D;
TEMP SHIP - Parts A, B, C, and D;
PILOT SHIP - Parts A, B, C, and D;
TEMP MOBIL - Parts A, B, C, and D;
PILOT MOBIL - Parts A, B, C, and D;
COLBA:
TEMP DROP;
ROCOB;
SYNOP;
SHIP;
Reports from automatic stations on land and at sea;
CODAR/AIREP/AMDAR;
Selected satellite data, such as cloud images, SATEM, SAREP, SARAD, SATOB;
BUOY;
CLIMAT, CLIMAT SHIP;
CLIMAT TEMP, CLIMAT TEMP SHIP;
BATHY, TESAC, TRACKOB;
WAVEOB;
RADOB;

RADREP.NOTES:
(1) Items (a) to (v) do not indicate priorities.
(2) BUFR can encode any of the other above data forms and many more. If BUFR is used to represent any of these data forms, in lieu of the specific alphanumeric code form,
then the same data requirements apply.
3. The frequency of observational reports required is as follows:
BUFR and GRIB, as available;
TEMP, PILOT, TEMP SHIP, PILOT SHIP, TEMP MOBIL, PILOT MOBIL, ROCOB, COLBA and TEMP DROP, as available;
SYNOP, SHIP and reports from automatic stations on land and at sea - 0000, 0300, 0600, 0900, 1200, 1500, 1800, 2100 UTC and hourly whenever possible;
CODAR/AIREP/AMDAR reports, as available;
Selected satellite data, such as cloud images, SATEM, SAREP; SARAD and SATOB and digital cloud data, as available;
BUOY, as available;
CLIMAT,CLIMAT SHIP, CLIMAT TEMP and CLIMAT TEMP SHIP - once per month;
BATHY, TESAC, TRACKOB and WAVEOB, as available;
RADOB and RADREP, as available.
4. Data needed for advanced NWP by the year 2000 is as follows:
General considerations
The following tables list the observational data which will be needed for advanced NWP systems by the year 2000. They include the needs for data assimilation and for
analysis and model validation for global short- and medium-range forecasting (excluding long-range forecasting).
Requirements for regional modelling have also been considered. They have been mentioned in the explanatory text, where appropriate, but they have not been listed in the
tables. Mesoscale modelling has not been considered.
It is most likely that data of the given specifications would benefit global NWP, if available; however, it does not mean that NWP could not be carried out without such data, as
NWP models produce useful products even with the observational data set currently available. It does not mean either that data of higher specification would not be useful. On
the contrary, when and where such data are produced they should be made available.
The problem of the feasibility of observing all the variables listed in these tables is not
addressed. Most of the requirements stated here could only be met by satellite-borne observing systems. However, in many cases a combination of satellite and in situ data is
needed to obtain adequate resolution and to ensure stability of calibration of remote sensing systems.
Contents of the tables
The following notes provide some explanation of how the lists were prepared and some provisos on their use:
Variables
Following past convention, the observational requirements for data assimila-tion are stated in terms of geophysical variables. This is thought to be useful since, from a user's perspective, these are the variables on which information is required. However, it is important to note that these variables are not always observed directly (satellite systems
observe none of them directly, with the exception of top-of-the-atmosphere radiation and a Doppler wind lidar). Also, it is no longer true that the users need their data exclusively in the
form of geophysical parameters; recent developments in data assimilation have demonstrated the potential and the benefits of using data at the engineering level (e.g.
radiances, brightness temperatures).
Horizontal resolution
(a) In general (and with some oversimplification), data are useful for assimilation and validation on spatial scales which the models are attempting to represent. One hundred
kilometres are given as the requirement for the variables listed in the tables. However, it is possible to benefit from higher resolution data, considering the current developments
towards global models with a grid length of less than 50 km;
(b) Regional models attempt to represent spatial scales above the mesoscale. Observational data are required at a resolution of 10 km.
Vertical resolution
(a) The same rationale is applied here: global NWP models are expected to have a resolution of less than one kilometre throughout the troposphere and lower stratosphere, with
considerably higher resolution in the planetary boundary layer. In the mid- and upper stratosphere, a resolution of two kilometres is likely to be sufficient. The requirements for
observations should be comparable;
(b) For regional models, observations are required at a resolution of 100 m (50 m in the planetary boundary layer).
Temporal resolution
Just as with spatial resolution, data will be useful for assimilation and validation on temporal scales, which the models are attempting to represent. In the past, this has not been
the case; so-called "four-dimensional" assimilation systems would more appropriately be, described as "intermit t tent three-dimensional" systems, and they have not been able to make proper use of observations more frequently than the period of the data assimilation
cycle (typically six hours). However, continued progress towards truly four-dimensional data assimilation is making it possible to extract useful information from observations at higher

temporal frequency. With such systems, higher temporal resolution can compensate, to some extent, for poor horizontal resolution when the atmosphere is moving. A requirement of
three hours for upper-air data and one hour for surface data has been specified. However, like in the case of spatial resolution, upper-air data of higher specification (up to one hour)
should also be made available (e.g. cloud motion wind data from geostationary satellites, and wind profiles from wind profilers) ;
For regional models, both upper-air and surface data are required at a resolution of one hour.
Accuracy
The values given are intended to represent the RMS of the observation errors. The assessment of accuracy should include not only the true instrumental error but also the
representativeness error (Le. the characteristics of some observing systems, particularly in situ systems, which sample spatial and temporal scales and which are not represented by the models). For NWP applications, such effects appear as though they were observation
errors.
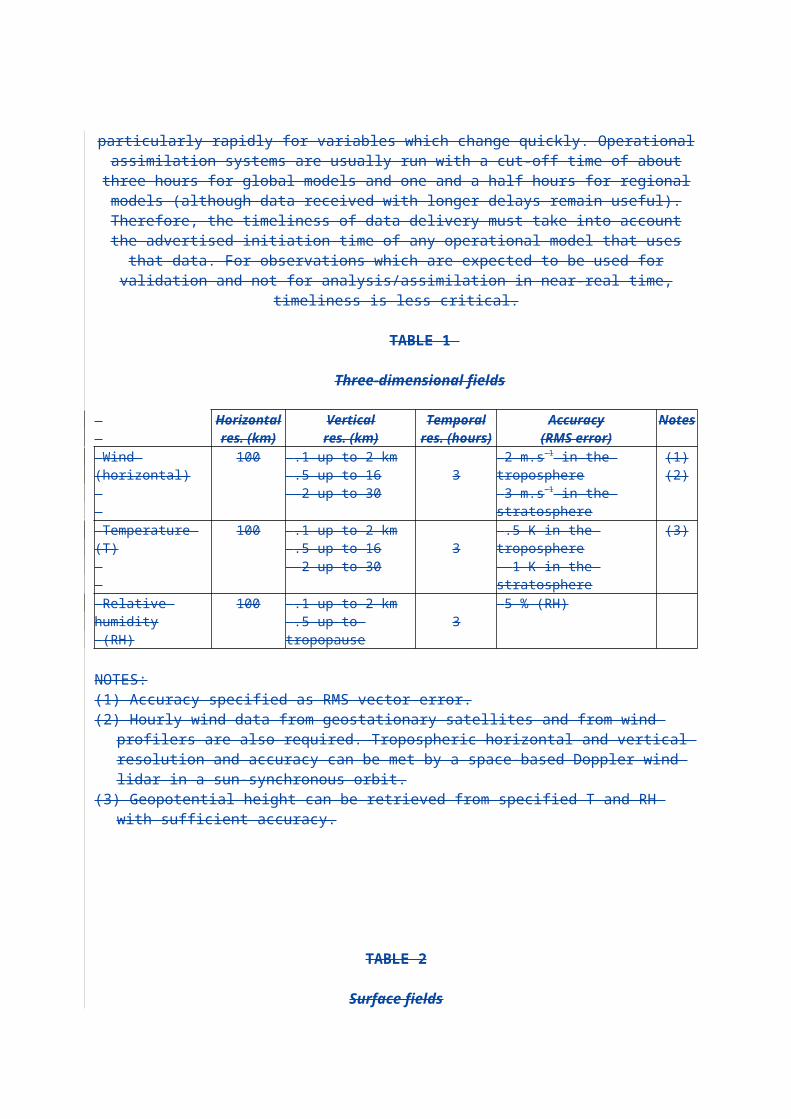
Timeliness
In NWP, the value of data degrades with time, and it does so particularly rapidly for variables which change quickly. Operational assimilation systems are usually run with a cut-off time of about three hours for global models and one and a half hours for regional models (although data received with longer delays remain useful). Therefore, the timeliness of data delivery must take into account the advertised initiation time of any operational model that uses that data. For observations which are expected to be used for validation and not for
analysis/assimilation in near-real time, timeliness is less critical.
TABLE 1
Three-dimensional fields
Horizontalres. (km)
Verticalres. (km)
Temporalres. (hours)
Accuracy(RMS error)
Notes
Wind (horizontal)
100 .1 up to 2 km .5 up to 16 2 up to 30
3 2 m.s-1 in the troposphere 3 m.s-1 in the stratosphere
(1)(2)
Temperature (T)
100 .1 up to 2 km .5 up to 16 2 up to 30
3 .5 K in the troposphere 1 K in the stratosphere
(3)
Relative humidity (RH)
100 .1 up to 2 km .5 up to tropopause 3
5 % (RH)
NOTES:(1) Accuracy specified as RMS vector error.(2) Hourly wind data from geostationary satellites and from wind profilers are also required.
Tropospheric horizontal and vertical resolution and accuracy can be met by a space-based Doppler wind lidar in a sun-synchronous orbit.
(3) Geopotential height can be retrieved from specified T and RH with sufficient accuracy.

TABLE 2
Surface fields
Horizontal res. (km)
Temporal res. Accuracy(RMS error)
Notes
PressureWindTemperatureRelative humidityAccumulated precipitation
100100100100100
1 h1 h1 h1 h3 h
0.5 hPa 2 m.s-1
1 K 5 % 0.1 mm
(1)
(2)Sea surface temperatureSoil temperature
100100
1 day3 h
0.5 K 0.5 K
Sea-ice coverSnow coverSnow equivalent-water depthSoil moisture, 0-10 cmSoil moisture, 10-100 cmPercentage of vegetationSoil temperature, 20 cmDeep soil temperature, 100 cm
100100100100100100100100
1 day1 day1 day1 day
1 week1 week
6 h1 day
10 % 10 % 5 mm 0.02 m3m-3
0.02 m3m-3
10 % (relative) 0.5 K 0.5 K
Albedo, visibleAlbedo, near infraredLong-wave emissivity
100100100
1 day1 day1 day
1 % 1 % 1 %
Ocean wave height 100 1 h 0.5 m
NOTES:(1) Wind at 10 metres over land. Over sea, height in the range of one to
40 metres (to be transmitted with the observation).(2) Required principally for model validation, not time critical.
TABLE 3
Other two-dimensional fields
Horizontalres. (km)
Temporal res.
Accuracy(RMS error)
Notes
Cloud fractional coverCloud top heightCloud base heightTotal liquid water content
100100100100
3 h3 h3 h3 h
10 % 0.5 km 0.5 km 20 %
(1)(1)
TOA net short-wave radiationTOA net long-wave radiation
100100
3 h3 h
5 W.m-2
5 W.m-2(2)(2)
Multi-purpose IR/VIS imagery 5 30 min. - (3)
NOTES:(1) Accuracy higher in planetary boundary layer.(2) Required principally for model validation; not time critical. (3) Required to assist real-time observation monitoring and analysis/forecast validation.

ATTACHMENT II.2
Typical end-user requirements for data
End-user group Observing elements required by Meteorological Services to satisfy end-user requirements
Agriculture and food production
Farming (including pest control, fertilization, frost protection, seeding, harvesting)
Planning of land use, (crop yields, pest and disease control, microclimatic studies, forestry operations)
Temperature(maximum, minimum, extremes), precipitation (amount, duration, type), dew point/humidity, wind speed and direction at surface to 850 hPa, cloud cover, soil temperature, evaporation, solar radiation, special phenomena
Precipitation (average amounts), temperature extremes, prevailing wind direction and speed, cloud cover, special phenomena
Aviation
Commercial or government operated (on national or international basis) and general aviation
Upper winds, temperatures and tropopause from 850 hPa to 70 hPa
Significant weather en route at 400 hPa to 70 hPa
Terminal and approach zone including cloud base and visibility, significant weather, surface wind and low-level wind shear, turbulence, icing
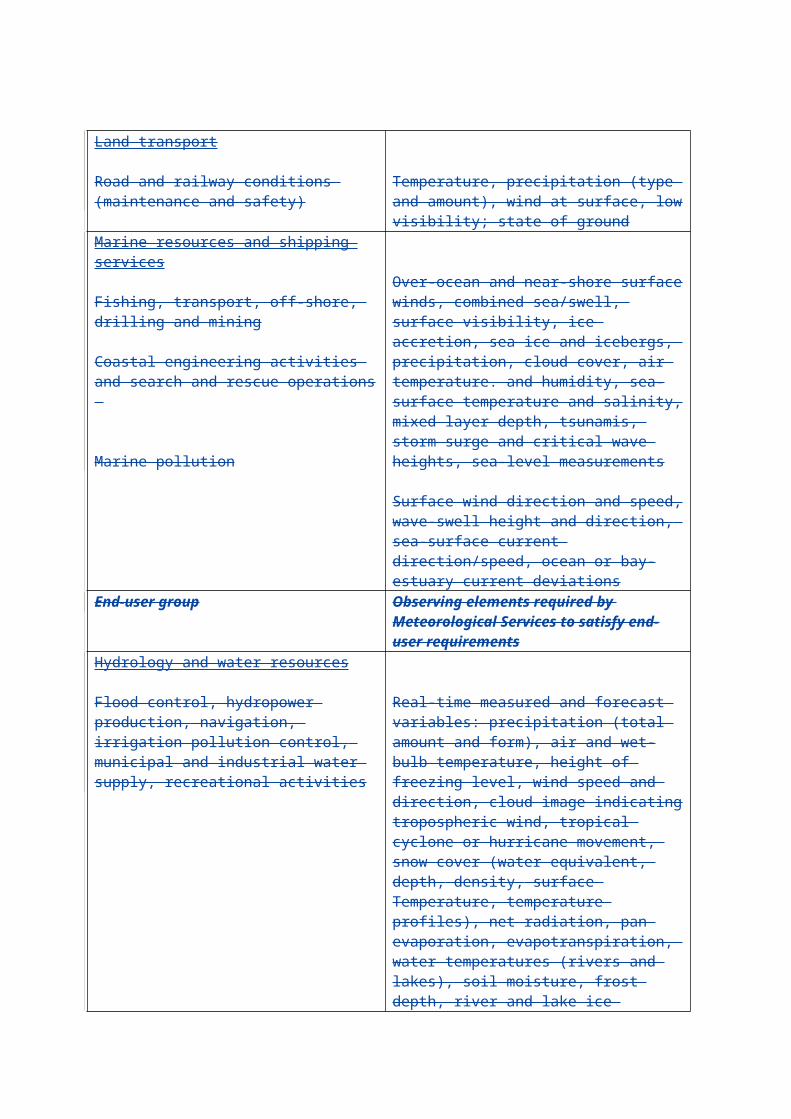
Land transport
Road and railway conditions (maintenance and safety)
Temperature, precipitation (type and amount), wind at surface, low visibility; state of ground
Marine resources and shipping services
Fishing, transport, off-shore, drilling and mining
Coastal engineering activities and search and rescue operations
Marine pollution
Over-ocean and near-shore surface winds, combined sea/swell, surface visibility, ice accretion, sea ice and icebergs, precipitation, cloud cover, air temperature. and humidity, sea-surface temperature and salinity, mixed layer depth, tsunamis, storm surge and critical wave heights, sea-level measurements
Surface wind direction and speed, wave-swell height and direction, sea-surface current direction/speed, ocean or bay-estuary current deviations
End-user group Observing elements required by Meteorological Services to satisfy end-user requirements
Hydrology and water resources
Flood control, hydropower production, navigation, irrigation pollution control, municipal and industrial water supply, recreational activities
Real-time measured and forecast variables: precipitation (total amount and form), air and wet-bulb temperature, height of freezing level, wind speed and direction, cloud image indicating tropospheric wind, tropical cyclone or hurricane movement, snow cover (water equivalent, depth, density, surface Temperature, temperature profiles), net radiation, pan evaporation, evapotranspiration, water temperatures (rivers and lakes), soil moisture, frost depth, river and lake ice (thickness, type, character)
Industry
Construction (office, industrial, residential, highway)
Precipitation, freezing or high temperatures, low visibility, high winds (wind chill), frozen ground depth, drying conditions
Environmental monitoring
Air pollution Temperature, humidity, wind speed and direction (at surface plus profiles in lowest atmospheric levels), precipitation (amount, time of commencement and termination)
Energy
Electric energy generation (load factors, supply of water, exposure of power lines)
Maximum/minimum temperature, cloud amount and general cover, precipitation amount, wind speed and direction, icing and snow, severe weather (lightning), time series of wind speed, vertical profiles of

temperature and wind speedPublic services, health and safety
Extra-tropics
Tropics
Special storm warnings: tropical storm
Severe weather warnings: tornado, heavy thunderstorm, heavy snow, hail/rain, storm winds
Maximum/minimum temperature, cloudiness, wind (comfort index), humidity, precipitation type and intensity
Maximum/minimum temperature, precipitation, thunderstorms
Development, track and intensity over water plus land fall (place and time) and precipitation amount, winds, waves and storm surges and tornadoes over land
Movement of tornadoes and thunderstorms, extent and intensity of heavy snow, hail and rain, storm winds
End-user group Observing elements required by Meteorological Services to satisfy end-user requirements
Public services, health and safety (contd.)
Recreational services (vacation, leisure, sporting events, parades, boating)
Temperature and humidity range, cloud amount, wind direction and speed, precipitation type and occurrence, weather conditions (e.g. thunderstorms, horizontal visibility, precipitation) and wave heights, period and direction
Climatology and climate services
Research, monitoring of outstanding events/climate anomalies, applications in all sectors requiring climatological information either instantaneously (over last day to last 10 days) or over longer periods, description and analysis of climate and its variations
Variables contained in CLlMAT reports for rapid global dissemination and use; all variables observed for applications and case studies at local and regional levels; all variables for climate description
ATTACHMENT II.3
Performance of elements of the GOS achievable by the year 2005(1) Upper air observations
Meteorological variable
Observing
systemHorizontalresolution Estimated coverage Vertical
resolutionEstimated
vertical rangeFrequency
ofobservation
Observational error (RMS)
Horizontal wind vector
Rawinsonde+ Pilot
≥ 250 km Best over land, limited over oceans and sparsely populated areas
0.3-1.2 km *0.1-35 km 1- 4/day 1-3 m.s-1
Aircraft 100 km Limited to regular flight routes
0.1 km Cruise level + ascent/descent
1-24/day 1-3 m.s-1
Wind profilerRadar
≤ 250 km Able to improveresolution over land
0.1-1.2 km *0.1-20 km 1-24/day 1-3 m.s-1
Satellite cloudand moisturemotion winds
100 km Most useful at lowlatitudes, largesterrors for upper cloud
0.5-4 km(depends on cloud type)
At available levels
Whenavailable,maximumpossible24/day
2-8 m.s-1
Temperature
Rawinsonde ≥ 250 km Best over land, limited over oceans and sparselypopulated areas
< 0.1 km *0.1-35 km 1- 4/day 0.3-1°C
Satellite remoteSensing
50 km Global coverage, butlargest errors in cloudy locations
2-8 km 0-50 km Minimum of 4/day
1-2°C
Surface-basedremote sensing
≤ 250 km Used to improveresolution over land
0.2-1 km *0-6 km 1-24/day 0.5-2°C
Aircraft 100 km Limited to regular flightRoutes
< 0.1 km Cruise level + Ascent/descent
1-24/day 0.5-1°C
Relative humidity
Rawinsonde ≥ 250 km Best over land, limited over oceans and sparselypopulated areas
< 0.1 km **0-12 km 1- 4/day **5 %
Satellite remoteSensing
50 km Global coverage 2-4 km 0-12 km Minimum of4/day
10 %
Surface basedremote sensing + aircraft Operational systems under development, but performance characteristics not yet available
* Vertical range depends on equipment used.
** Vertical resolution degraded at heights above 8 km to between 0.5 and 1 km, and observation error at 10 %.
(2) Surface observations
Meteorological variable Observing system Horizontalresolution Estimated coverage Frequency of
observationsObservational
error (RMS) Sea surface temperature (T)
Satellite 10 km Global ≤ 4/day 0.5°C
Ship 250 km Global shipping lanes 0.5°C
Buoy 250 km Global 0.2°C
Surface pressure (P) Conventional land surfacenetwork and land AWS
≤ 250 km Global 1-24/day 0.2-1 hPa (P) Temperature (T, Td) 0.5°C (T, Td)
Wind vector (V) Ship (P, T, Td' V) ≤ 250 km Global ocean (limited coverage of Td by moored buoy)
1-2 m.s-1 (V)
Buoy (P, T, Td' V) ≤ 250 km
Satellite (V) 50 km Global ocean 2/day (ERS-l specs)
Surface-based remoteSensing (V)(HF radar)
10 km Mainly coastal regions
Precipitation amount
Conventional land surfaceNetwork and land AWS
≤ 250 km Overland 4/day 5 %
Weather radar 10 km Overland 1-24/day
Satellite 50 km Global 1/day

ATTACHMENT II.1
Observational data requirements for GDPFS centres for global and regional exchange
The following paragraphs 1, 2 and 3 state the observations required to operate all GDPFS centres at national, regional and global levels. Paragraph 4 addresses the data requirements for NWP operations only.
1. The types of observationing networks and platforms providing data required at data-processing centres are as follows:(a) All stations included in the Regional Basic Synoptic Networks;
(b) The network of supplementary synoptic stations, including automatic stations;
(c) Automatic marine stations (drifting buoy and moored buoys);
(d) Mobile sea stations;
(e) All other stations making radiowind, radiosonde/radiowind and pilot balloon observations;
(f) Meteorological rocket stations;
(g) Aircraft meteorological observations;
(h) Wind profilers;
(i) Doppler and weather watch radar systems and networks;
(j) Space-based systems producing:
(i) Imagery (including both analogue and digital imagery);
(ii) Radiance data;
(iii) Vertical temperature and humidity profiles;
(iv) Cloud and water vapour motion winds;
(v) Cloud height, temperature, type and amount;
(vi) Digital information about clouds (liquid water or ice (total));
(vii) Surface wind, precipitation rate and precipitable water;
(viii) Land temperature;
(ix) Sea-surface temperature;
(x) Ocean surface wind vector;
(xi) Albedo;
(xii) Ocean wave spectra;
(xiii) Sea ice cover;
(xiv) Snow cover, depth and water equivalent;
(xv) Earth radiation fluxes;
(xvi) Aerosols and trace gases;
(xvii) Volcanic ash;
(xviii) Other meteorological and environmental products;

(k) Radiological data reporting stations in case of nuclear accidents (required for GDPFS centres running transport models for environmental emergency response activities);
(l) Selected climatological/agrometeorological/hydrological stations;
(m) Lightning detection and location systems network;
(n) Global Atmosphere Watch (GAW) network.
The observational data which will be needed to obtain optimum results from NWP systems by the year 2000 and meet the needs of all WMO Programmes and WMO supported Programmes are elaborated in paragraph 4 below and its related three tables.
2. The report code types which carry the data provided by the platforms listed in paragraph 1 above are given below:(a) BUFR and GRIB;
(b) TEMP — Parts A, B, C and D;
(c) PILOT — Parts A, B, C and D;
(d) TEMP SHIP — Parts A, B, C and D;
(e) PILOT SHIP — Parts A, B, C and D;
(f) TEMP MOBIL — Parts A, B, C and D;
(g) PILOT MOBIL — Parts A, B, C and D;
(h) COLBA;
(i) TEMP DROP;
(j) ROCOB;
(k) SYNOP;
(l) SHIP;
(m) Reports from automatic stations on land and at sea;
(n) CODAR/AIREP/AMDAR; Selected satellite data, such as cloud images, SATEM, SAREP, SARAD, SATOB;
(o) BUOY;
(p) CLIMAT, CLIMAT SHIP; CLIMAT TEMP, CLIMAT TEMP SHIP;
(q) BATHY, TESAC, TRACKOB;
(r) WAVEOB;
(s) RADOB;
(t) RADREP.
NOTES:(1) Items (a) to (v) do not indicate priorities.(2) BUFR and CREX can encode any of the other above data forms and many more. If BUFR or CREX is used to represent any of these data forms, in lieu of the specific alphanumeric code form, the same data requirements apply.

3. The frequency of observational reports required is as follows:(a) BUFR and GRIB, as available;
(b) TEMP, PILOT, TEMP SHIP, PILOT SHIP, TEMP MOBIL, PILOT MOBIL, ROCOB, COLBA and TEMP DROP, as available;
(c) SYNOP, SHIP and reports from automatic stations on land and at sea — 0000, 0300, 0600, 0900, 1200, 1500, 1800, 2100 UTC and hourly whenever possible;
(d) CODAR/AIREP/AMDAR reports, as available;
(e) Selected satellite data, such as cloud images, SATEM, SAREP, SARAD and SATOB and digital cloud data, as available;
(f) BUOY, as available;
(g) CLIMAT, CLIMAT SHIP, CLIMAT TEMP and CLIMAT TEMP SHIP — once per month;
(h) BATHY, TESAC, TRACKOB and WAVEOB, as available;
(i) RADOB and RADREP, as available.
4. Data needed for advanced NWP by the year 2000 is as follows:GENERAL CONSIDERATIONS
The following tables list the observational data which will be needed for advanced NWP systems by the year 2000. They include the needs for data assimilation and for analysis and model validation for global short- and medium-range forecasting (excluding long-range forecasting).
Requirements for regional modelling have also been considered. They have been mentioned in the explanatory text, where appropriate, but they have not been listed in the tables. Mesoscale modelling has not been considered.
It is most likely that data of the given specifications would benefit global NWP, if available; however, it does not mean that NWP could not be carried out without such data, as NWP models produce useful products even with the observational data set currently available. It does not mean either that data of higher specification would not be useful; on the contrary, when and where such data are produced they should be made available.
The problem of the feasibility of observingation all the variables listed in these tables is not addressed. Most of the requirements stated here could only be met by satellite-borne observing systems. However, in many cases a combination of satellite and in situ data is needed to obtain adequate resolution and to ensure stability of calibration of remote sensing systems.
CONTENTS OF THE TABLES
The following notes provide some explanation of how the lists were prepared and some provisos on their use:
VariablesFollowing past convention, the observational requirements for data assimilation are stated in terms of geophysical variables. This is thought to be useful since, from a user’s perspective,

these are the variables on which information is required. However, it is important to note that these variables are not always observed directly (satellite systems observe none of them directly, with the exception of top-of-the-atmosphere radiation and a Doppler wind lidar). Also, it is no longer true that the users need their data exclusively in the form of geophysical parameters; recent developments in data assimilation have demonstrated the potential and the benefits of using data at the engineering level (e.g. radiances, brightness temperatures).
Horizontal resolution(a) In general (and with some oversimplification), data are useful for assimilation and
validation on spatial scales which the models are attempting to represent. One hundred kilometres are given as the requirement for the variables listed in the tables. However, it is possible to benefit from higher resolution data, considering the current developments towards global models with a grid length of less than 50 km;
(b) Regional models attempt to represent spatial scales above the mesoscale. Observational data are required at a resolution of 10 km.
Vertical resolution(a) The same rationale is applied here: global NWP models are expected to have a
resolution of less than one kilometre throughout the troposphere and lower stratosphere, with considerably higher resolution in the planetary boundary layer. In the mid- and upper stratosphere, a resolution of two kilometres is likely to be sufficient. The requirements for observations should be comparable;
(b) For regional models, observations are required at a resolution of 100 m (50 m in the planetary boundary layer).
Temporal resolution(a) Just as with spatial resolution, data will be useful for assimilation and validation on
temporal scales, which the models are attempting to represent. In the past, this has not been the case; so-called “four-dimensional” assimilation systems would more appropriately be described as “intermittent three-dimensional” systems, and they have not been able to make proper use of observations more frequently than the period of the data assimilation cycle (typically six hours). However, continued progress towards truly four-dimensional data assimilation is making it possible to extract useful information from observations at higher temporal frequency. With such systems, higher temporal resolution can compensate, to some extent, for poor horizontal resolution when the atmosphere is moving. A requirement of three hours for upper-air data and one hour for surface data has been specified. However, like in the case of spatial resolution, upper-air data of higher specification (up to one hour) should also be made available (e.g. cloud motion wind data from geostationary satellites, wind profiles from wind profilers);
(b) For regional models, both upper-air and surface data are required at a resolution of one hour.
AccuracyThe values given are intended to represent the RMS of the observational errors. The assessment of accuracy should include not only the true instrumental error but also the representativeness error (i.e. the characteristics of some observing systems, particularly in situ systems, which sample spatial and temporal scales that are not represented by the models). For NWP applications, such effects appear as though they were observational errors.
TimelinessIn NWP, the value of data degrades with time, and it does so particularly rapidly for variables which change quickly. Operational assimilation systems are usually run with a cut-off time of about three hours for global models and one and a half hours for regional models (although data received with longer delays remain useful). Therefore, the timeliness of data delivery must take into account the advertised initiation time of any operational model that uses that data. For observations which are expected to be used for validation, and not for analysis/assimilation in near-real-time, the timeliness is less critical.
TABLE 1 Three-dimensional fields
Horizontalresolution
(km)
Verticalresolution (km)
Temporalresolution
(hours)
Accuracy(RMS error) Notes
Wind (horizontal)
100 .1 up to 2 km .5 up to 16 2 up to 30
3 2 m.s-1 in the troposphere 3 m.s-1 in the stratosphere
(1)(2)
Temperature (T)
100 .1 up to 2 km .5 up to 16 2 up to 30
3 .5 K in the troposphere 1 K in the stratosphere (3)
Relative humidity (RH) 100 .1 up to 2 km
.5 up to tropopause 3 5% (RH)
Turbulence 100 .3 1 -
Ozone Variable Variable Variable 5%
Greenhouse gases Variable Variable Variable 2 – 10% (1pptv-1ppmv)
Reactive gases Variable Variable Variable 2 – 10% (1pptv-1ppmv)
Aerosols-chemical and physical properties
Variable Variable Variable -
Salinity 250 Variable 6 1%
Sub-sea surface temperature 250 Variable 6 0.5 K
Sub-sea surface current 250 Variable 6 2 cm s-1
Soil moisture 0-10 cm 100 - 1 day 0.02 m3 m-3
Soil moisture 10-100 cm 100 - 1 week 0.02 m3 m-3
NOTES:(1) Accuracy specified as RMS vector error. (2) Hourly wind data from geostationary satellites and from wind profilers are also required.
Tropospheric horizontal and vertical resolution and accuracy can be met by a space-based Doppler wind lidar in a Sun-synchronous orbit.
(3) Geopotential height can be retrieved from specified T and RH with sufficient accuracy.
TABLE 2

Surface fields
Horizontal resolution (km)
Temporal resolution
Accuracy(RMS error) Notes
Pressure Wind Temperature Relative humidity Visibility Accumulated precipitation Precipitation rate
100100100100100100100
1h1h1h1h
1h1h
0.5 hPa2 m.s-1
1 K5%
0.1 mm0.1 mm h-1
(1)
(2)
Sea-surface temperature Soil temperature
100100
1 day3h
0.5 K0.5 K
Sea-ice and lake ice cover Snow cover Snow equivalent-water depth River runoff Lake water level Water quality Sediments Percentage of vegetation Phenomological data Soil temperature, 20 cm Deep soil temperature, 100 cm Surface roughness
100100100250
Variable250250100
Variable10010050
1 day1 day1 day
1 week1 week1 week1 week1 week10 days
6h1 day
1 month
10%10%5 mm
10% (relative)
0.5 K0.5 K
Albedo, visible Albedo, near infrared Long-wave emissivity
100100100
1 day1 day1 day
1%1%1%
Multipurpose imagery Surface net radiation UV incoming
1 or 45050
6h6h1h
–1%
1–5% Waves spectra Salinity Sea level Ocean current
10010050
100
1h6h
12h6h
0.01 m1%
0.01 m2 cm s-1
Greenhouse gas concentrations
Ozone Precipitation chemistry Aerosols-chemical and physical properties Reactive gases Radionuclides Volcanic activity
Variable
VariableVariableVariable
VariableVariableVariable
Variable
VariableVariableVariable
VariableVariableVariable
2–10% (1pptv–1ppmv)
1–5%––
2–10% (1pptv–1ppmv)
(3)
(3)
NOTES:(1) Wind at 10 metres over land;
Over sea, height in the range 1 to 40 metres (to be transmitted with the observation).(2) Required principally for model validation, not time critical.(3) For some programmes, e.g. environmental monitoring, environmental emergency
response and public weather services, much higher resolution data is needed operationally.
TABLE 3

Other two-dimensional fields
Horizontalresolution
(km)
Temporal resolution
Accuracy(RMS error) Notes
Cloud fractional cover Cloud top height Cloud base height Total liquid water content Cloud phase/particle size
10010010010050
3 h3 h3 h3 h6 h
10%0.5 km0.5 km20%
–
(1)(1)
TOA net short-wave radiation TOA net long-wave radiation
100100
3 h3 h
5 W.m-2
5 W.m-2(2)(2)
Multipurpose IR/VIS imagery Radiance 5 30 min - (3)
Column ozone Optical depth/turbidity Column greenhouse and reactive gases
VariableVariableVariable
VariableVariableVariable
1%--
NOTES:(1) Accuracy higher in planetary boundary layer.(2) Required principally for model validation; not time critical. (3) Required to assist real-time observation monitoring and analysis/forecast validation.
ATTACHMENT II.2
Typical end-user requirements for data
End-user group Observing elements required by Meteorological Services to satisfy end-user requirements
Agriculture and food production
Farming (including pest control, fertilization, frost protection, seeding, harvesting)
Planning of land use, (crop yields, pest and disease control, microclimatic studies, forestry operations)
Temperature (maximum, minimum, extremes), precipitation (amount, duration, type), dew point/humidity, wind speed and direction at surface to 850 hPa, cloud cover, soil temperature, evaporation, solar radiation, special phenomena
Precipitation (average amounts), temperature extremes, prevailing wind direction and speed, cloud cover, special phenomena
Aviation
Commercial or government operated (on national or international basis) and general aviation
Upper winds, temperatures and tropopause from 850 hPa to 70 hPa
Significant weather en route at 400 hPa to 70 hPa
Terminal and approach zone including cloud base and visibility, significant weather, surface wind and low-level wind shear, turbulence, icing
Land transport
Road and railway conditions (maintenance and safety)
Temperature, precipitation (type and amount), wind at surface, low visibility; state of ground
Marine resources and shipping services
Fishing, transport, off-shore, drilling and mining
Coastal engineering activities and search and rescue operations
Marine pollution
Over-ocean and near-shore surface winds, combined sea/swell, surface visibility, ice accretion, sea ice and icebergs, precipitation, cloud cover, air temperature. and humidity, sea-surface temperature and salinity, mixed layer depth, tsunamis, storm surge and critical wave heights, sea-level measurements
Surface wind direction and speed, wave-swell height and direction, sea-surface current direction/speed, ocean or bay-estuary current deviations

End-user group Observing elements required by Meteorological Services to satisfy end-user requirements
Hydrology and water resources
Flood control, hydropower production, navigation, irrigation pollution control, municipal and industrial water supply, recreational activities
Real-time measured and forecast variables: precipitation (total amount and form), air and wet-bulb temperature, height of freezing level, wind speed and direction, cloud image indicating tropospheric wind, tropical cyclone or hurricane movement, snow cover (water equivalent, depth, density, surface Temperature, temperature profiles), net radiation, pan evaporation, evapotranspiration, water temperatures (rivers and lakes), soil moisture, frost depth, river and lake ice (thickness, type, character)
Industry
Construction (office, industrial, residential, highway)
Precipitation, freezing or high temperatures, low visibility, high winds (wind chill), frozen ground depth, drying conditions
Environmental monitoring
Air pollution
Emergency response activities, volcanic activity
Temperature, humidity, wind speed and direction (at surface plus profiles in lowest atmospheric levels), precipitation (amount, time of commencement and termination)
(a) Wind, temperature and humidity (upper-air data);(b) Precipitation data (type and amount);(c) Surface air temperature data;(d) Atmospheric pressure data;(e) Wind direction and speed (surface and stack
height) data; (f) Humidity data
Energy
Electric energy generation (load factors, supply of water, exposure of power lines)
Maximum/minimum temperature, cloud amount and general cover, precipitation amount, wind speed and direction, icing and snow, severe weather (lightning), time series of wind speed, vertical profiles of temperature and wind speed

Public services, health and safety
Extra-tropics
Tropics
Special storm warnings: tropical storm
Severe weather warnings: tornado, heavy thunderstorm, heavy snow, hail/rain, storm winds
Maximum/minimum temperature, cloudiness, wind (comfort index), humidity, precipitation type and intensity
Maximum/minimum temperature, precipitation, thunderstorms
Development, track and intensity over water plus land fall (place and time) and precipitation amount, winds, waves and storm surges and tornadoes over land
Movement of tornadoes and thunderstorms, extent and intensity of heavy snow, hail and rain, storm winds
End-user group Observing elements required by Meteorological Services to satisfy end-user requirements
Public services, health and safety (contd.)
Recreational services (vacation, leisure, sporting events, parades, boating)
Temperature and humidity range, cloud amount, wind direction and speed, precipitation type and occurrence, weather conditions (e.g. thunderstorms, horizontal visibility, precipitation) and wave heights, period and direction
Climatology and climate services
Research, monitoring of outstanding events/climate anomalies, applications in all sectors requiring climatological information either instantaneously (over last day to last 10 days) or over longer periods, description and analysis of climate and its variations
Variables contained in CLlMAT reports for rapid global dissemination and use; all variables observed for applications and case studies at local and regional levels; all variables for climate description

ATTACHMENT II.3
Performance of elements of the GOS achievable by the year 2005(1) Upper air observations
Meteorological variable
Observing
systemHorizontalresolution Estimated coverage Vertical
resolutionEstimated
vertical rangeFrequency
ofobservation
Observational error (RMS)
Horizontal wind vector
Rawinsonde+ Pilot
≥ 250 km Best over land, limited over oceans and sparsely populated areas
0.3-1.2 km *0.1-35 km 1- 4/day 1-3 m.s-1
Aircraft 100 km Limited to regular flight routes
0.1 km Cruise level + ascent/descent
1-24/day 1-3 m.s-1
Wind profilerRadar
≤ 250 km Able to improveresolution over land
0.1-1.2 km *0.1-20 km 1-24/day 1-3 m.s-1
Satellite cloudand moisturemotion winds
100 km Most useful at lowlatitudes, largesterrors for upper cloud
0.5-4 km(depends on cloud type)
At available levels
Whenavailable,maximumpossible24/day
2-8 m.s-1
Temperature
Rawinsonde ≥ 250 km Best over land, limited over oceans and sparselypopulated areas
< 0.1 km *0.1-35 km 1- 4/day 0.3-1°C
Satellite remoteSensing
50 km Global coverage, butlargest errors in cloudy locations
2-8 km 0-50 km Minimum of 4/day
1-2°C
Surface-basedremote sensing
≤ 250 km Used to improveresolution over land
0.2-1 km *0-6 km 1-24/day 0.5-2°C
Aircraft 100 km Limited to regular flightRoutes
< 0.1 km Cruise level + Ascent/descent
1-24/day 0.5-1°C
Relative humidity
Rawinsonde ≥ 250 km Best over land, limited over oceans and sparselypopulated areas
< 0.1 km **0-12 km 1- 4/day **5 %
Satellite remoteSensing
50 km Global coverage 2-4 km 0-12 km Minimum of4/day
10 %
Surface basedremote sensing + aircraft Operational systems under development, but performance characteristics not yet available
* Vertical range depends on equipment used.
** Vertical resolution degraded at heights above 8 km to between 0.5 and 1 km, and observation error at 10 %.
(2) Surface observations
Meteorological variable Observing system Horizontalresolution Estimated coverage Frequency of
observationsObservational
error (RMS) Sea-surface temperature (T)
Satellite 10 km Global ≤ 4/day 0.5°C
Ship 250 km Global shipping lanes 0.5°C
Buoy 250 km Global 0.2°C
Surface pressure (P) Conventional land surfacenetwork and land AWS
≤ 250 km Global 1-24/day 0.2-1 hPa (P) Temperature (T, Td) 0.5°C (T, Td)
Wind vector (V) Ship (P, T, Td' V) ≤ 250 km Global ocean (limited coverage of Td by moored buoy)
1-2 m.s-1 (V)
Buoy (P, T, Td' V) ≤ 250 km
Satellite (V) 50 km Global ocean 2/day (ERS-l specs)
Surface-based remoteSensing (V)(HF radar)
10 km Mainly coastal regions
Precipitation amount
Conventional land surfaceNetwork and land AWS
≤ 250 km Overland 4/day 5 %
Weather radar 10 km Overland 1-24/day
Satellite 50 km Global 1/day

P A R T III
THE SURFACE-BASED SUBSYSTEM
3.1 GENERAL
The surface-based subsystem is divided into "the main elements" and "other" elements. The main elements of the subsystem are as follows: a surface synoptic station, an upper-air synoptic station, and an aircraft meteorological station. For a detail composition of the subsystem, see Manual on the GOS (WMO-No. 544), Volume I, section 1., Part III.include the regional basic synoptic networks which produce meteorological observations at the surface (surface stations) and in the upper air (upper-air stations) The WMO regional associations define regional basic networks of surface and upper-air stations adequately to meet the requirements of Members and of the World Weather Watch. A listing and description of all surface and upper-air stations and the corresponding observing programme are published in Weather Reporting (WMO-No. 9), Vol. A – Observing Station. All of the upper-air and a selection of the surface weather reports are used for the global exchange of data.
The detailed list of stations is established to meet the requirements laid down by the regional associations which regularly review and revise the networks taking into account any new international requirements. The regional basic synoptic networks are composed primarily of land stations, manned or automatic, but may also include certain fixed sea stations.
The main elements of the surface-based subsystem also include additional surface and upper-air synoptic stations, including in particular fixed and mobile, manned and automatic sea stations and aircraft meteorological stations, the latter generally operating at non-synoptic hours. Stations on ships and aircraft are, of course, especially important for the provision of information from data-sparse areas.
The other elements of the subsystem comprise a variety of more or less specialized observing stations and include aeronautical meteorological stations, research and special-purpose vessel stations, climatological stations, agricultural meteorological stations, and special stations.
3.1.1 Design of observing networks
In an observing network:
The location of each station should be representative of conditions in space and time;
The station spacing and interval between observations should correspond with the desired spatial and temporal resolution of the meteorological parameters to be measured or observed;
The total number of stations should, for reasons of economy, be as small as possible but as large as necessary to meet the various requirements.
The various properties of the air mass should in principle be sampled at a station covering the smallest possible area, although instruments should be positioned so that they do not affect each other's measurements. In selecting sites for stations, the intention is to
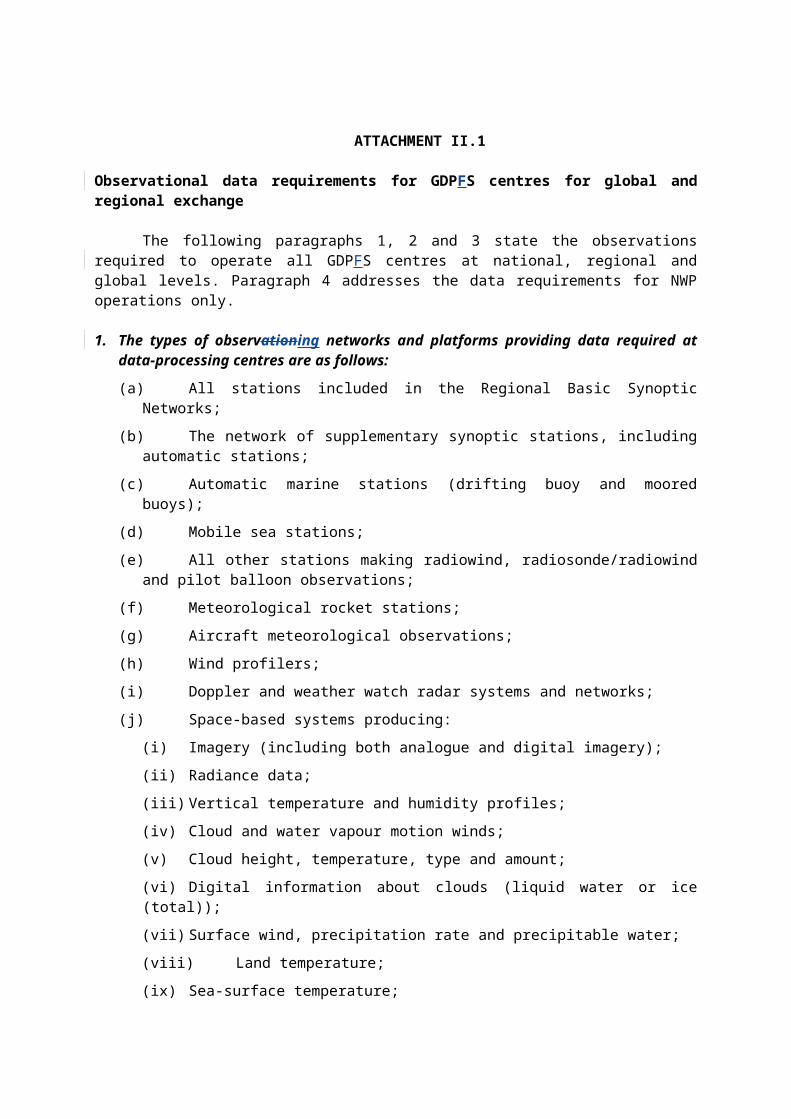
obtain data which are representative of a larger area. Ideally, all measurements and visual observations at all stations would be made at the same moment, i.e. at a predetermined synoptic hour. However, as this is not practical, measurements should be made within the shortest possible time.
For the purpose of achieving uniformity, the following terms are used:
Standard time of observation Scheduled time of observation.
In addition to these times, there will be an "actual time of observation", i.e. the time when an observation is actually carried out at the station. This time must not deviate by more than a few minutes from the "scheduled time of observation". Wherever parameters may change considerably within the period normally required for completing an observation, arrangements should be made to obtain information on critical parameters as close as possible to the scheduled time.
The station spacing should be such as to provide sufficiently accurate values for the meteorological parameters required at any point between two stations by means of visual or numerical interpolation, taking due account of the effects of topography on the variation of parameters elements of interest. The same consideration applies to time series of observations obtained at the same location, which require a relatively short distance between observing sites and an accuracy of measurement higher than that to be obtained by interpolation. On the other hand, a very dense network or high frequency of observations could lead to more data than are necessary and thus to unnecessarily high cost.
Variations in space and time differ for individual meteorological elements and also depend on the topography of the area. If any information is available or can be obtained on spatial or temporal variations, it can be used to decide upon the network configuration which is necessary to provide data of the required accuracy (see The Planning of Meteorological Station Networks (Technical Note No. 111, WMO-No. 265)). For certain parameters such as precipitation, a separation of 10 km between stations may be required in some areas for several purposes (e.g. very-short-period forecasting, climatology, hydrological forecasting) although, in the case of rainfall, data from more widely separated weather radars will also satisfy many requirements. For parameters such as barometric atmospheric pressure and upper winds, a separation of 100 km between stations will suffice. In general, a fairly homogeneous distribution of observing stations is most suited to support numerical analyses and forecasts. However, a relatively higher station density may be necessary to support local or area forecasting (e.g. to reflect the differences between coastal and inland conditions or valley and mountain weather) whilst a lower density is likely to be sufficient in regions of low population and little topographical variation.
It is generally not practicable, within one network, to achieve an optimization of such vastly differing requirements without severely prejudicing either operational and scientific requirements or economic considerations. The solution to this problem is to establish different types of networks within the subsystem, such as the rRegional bBasic sSynoptic nNetwork (RBSN) and its selected stations for global exchange, as well as stations established on a national level and the special networks observing "other elements". For details, refer to sections 3.2 to 3.9 below covering individual types of networks and stations.
3.1.2 Planning of networks and stations

When a nNational Meteorological Service (NMS) has difficulties in solving a problem due to a lack of observations from within its own area of responsibility, it has first to assess which data are required and from which area, location or height. The next step in decision-making is to determine the type of network or station most suitable to provide the required data.
If a station is to be integrated into a network, its site has to be chosen primarily from the point of view of network configuration. This can be done by adding a task to or by shifting an existing station, or by the establishment of a new station.
The basic considerations for spacing of stations within an optimized station network should also be borne in mind when developing a system of station indicators with consecutive numbers or letters. It is never practicable to install all the stations required for a network at once, and some indicators should be kept in reserve to fill the remaining gaps. If no such provision is made, new stations may create increasing chaos in the system.
For the study of small-scale phenomena, arrangements of a non-network type will sometimes also prove to be adequate and at the same time more economical. These may apply to agricultural meteorological observations at a single representative station or to precipitation measurements along a more or less straight line across a mountainous barrier providing typical values for the amounts of precipitation along the windward and leeward slopes.
The process of decision-making must include cost and benefit considerations. The most suitable method of achieving the highest cost-benefit ratio is normally the co-location of stations. This can be achieved by establishing a station of another type close to an existing one, or by gradually augmenting the task of a one-parameter observing station to a multi-parameter one. This may begin with the measurement of precipitation only and end up with a round-the-clock programme of a fully equipped surface and upper-air synoptic station requiring larger facilities and additional personnel.
Before establishing a new station, and if there is a possible choice of site, the following questions will help decision-making:
(a) Is the site representative for the required meteorological data?
(b) Will the site remain representative in view of existing or anticipated construction plans, change of vegetation, etc.?
(c) Can anything be done to improve or to safeguard the representativeness (e.g. cutting down of trees, reserving rights on building and plantation limits in the vicinity)?
(d) Is the site sufficiently accessible to personnel operating the station or carrying out inspection and maintenance?
(e) Does the site provide housing and storage facilities or can they be made available if required?
(f) Are facilities such as electric power, telecommunications, running water, etc. available if required?
(g) To what extent are security measures (against lightning, flooding, theft or other

interferences) required and how can they be taken?
(h) Can difficulties of posting personnel be overcome by part- or full-time automation or by locally available staff? Part-time staff from public services are especially suitable for certain work at weather stations, as the continuity is assured, even by changes in the staff.
Furthermore, it is prudent to choose land that is in public or governmental hands, for there will be less chance of having to move the station later. A long-term contract should be established with the authorities concerned or with the landowner, if necessary with the help of an estate agent. The validity of the contract should be based on the usual international standard period for climatological measurements and have a duration of at least 30 years. It should prohibit changes (e.g. the construction of buildings) near the measuring site and should include provisions for the installation and operation of instruments and other necessary equipment and of transmission and power lines, as well as a regulation governing the right of access.
There is an understandable tendency to select as station sites land which cannot otherwise be utilized and whose cost is consequently relatively low. Only in very rare circumstances will such a site correspond with meteorological requirements, which should primarily determine the suitability of a site. It must be borne in mind that, in this regard, nothing is more costly and frustrating than long records of observations which subsequently prove to be useless or even misleading. One should therefore follow the rule: "The quality standard must be as high as necessary - the cost should be as low as possible".
More specific guidance on the location of the observing site will be found under section 3.2.1.2
3.1.3 Management of manned station networks
3.1.3.1 General
The responsibility for the management of a meteorological station network, the primary task of which is the production of data of the best possible quality, rests with the Member concerned. The Member should establish an appropriate organizational unit or units within the Meteorological Service with the responsibility for the operation, maintenance and supervision of the stations, as well as for logistics, procurement, supply and repair of equipment and other material necessary for uninterrupted operation. It should function as an operational unit within the Service, be responsible for the national standards and should have an appropriate status. It will also be necessary for this unit to maintain liaison and to co-ordinate its activities with the users of the data at the national level, as well as with the supporting services (administration and finance). A continuous survey of new technological developments is required with a view to introducing improved types of instruments, equipment and techniques.
3.1.3.2 Organization of the station Network Management Unit
The organization of the Unit should take into account the size of the network. In the case of a country with very large networks it may be necessary to have a central Unit with sub-centres. The location of such sub-centres will depend on the needs of the Member. Economic considerations as well as problems of a technical and logistic nature such as personnel, communications and transport facilities will need to be taken into account.
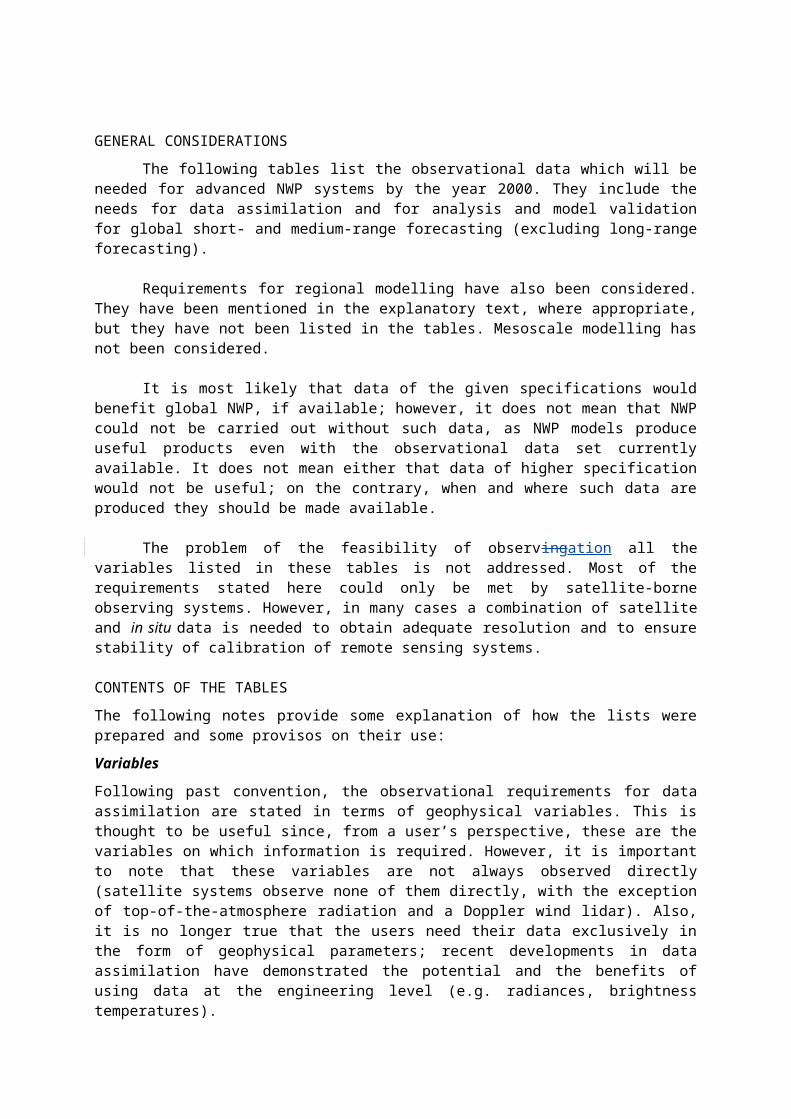
A different approach to station management may be based on the specific functions of the stations forming the network (synoptic, aviation, climatological, agrometeorological agricultural meteorological).
The Unit must have at its disposal transportation to carry out its various activities.
3.1.3.3 Administrative arrangements
The Unit should have a system of files containing all relevant and up-to-date documentation of a scientific, technical, operational and administrative nature. A gazetteer of the stations with information on geographical conditions, staff and programmes of activities should be available.
The instruments at the station play a major role in the system and particular attention should be given to maintaining appropriate records relating to the instruments in use, including an up-to-date inventory of the equipment. The technical particulars of an instrument, its movement and the periodical test certificates should be available and carefully maintained.
Current reports in respect of the functioning of a station, such as breakdowns, faults, requests for repairs, needs of supplies and other matters requiring prompt action, should be stated in brief on an "action card". From the entries on this card action should be taken according to priorities.
A register (or log- book) of repairs should be kept to identify specific problems and to provide information on the movement of instruments from a station to the repair facilities of the Unit. According to the type of instrument (mechanical, electric, electronic or mixed) and the nature of the fault, various types of workshops and laboratories may be involved.
3.1.3.4 Personnel of the Station Network Management Unit
The personnel of the Unit must be qualified and specially trained for their work. In addition to the meteorological aspects, the personnel must be sensitive to the human aspect involved both within the Service and in their contacts with voluntary observers, private institutions or other government agencies outside the Service.
An experienced Class IIII meteorologist, hydrologist or engineer specialized in observing work should be in charge of the Unit. He should also be a good administrator and an able organizer. His main responsibility will be to produce the best observational information for the users, in the most economical way.
The Unit may be divided into smaller sections as necessary, for example, when the management of the network is undertaken on a geographical or on a functional basis (see 3.1.3.2). The chief of each section should also be a meteorologist (or hydrologist or engineer) with the best possible qualifications and experience, and should be capable of direct supervision of the fieldwork.
Depending on the size of the station network, it is indispensable to have one or more inspectors who should be members of the meteorological staff (at least Class III) with experience in the operation of observing stations.
Provision should be made for technical staff comprising station network technicians
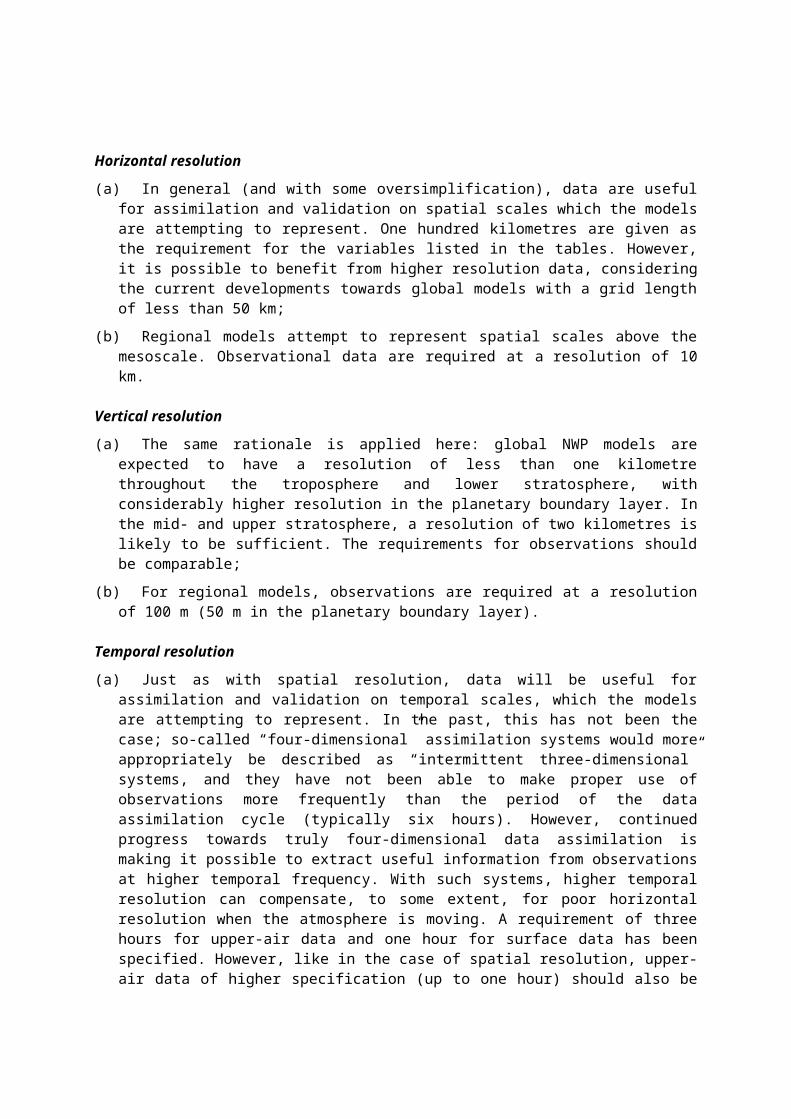
and technical assistants. The former are specially trained to cope with all technical problems and activities connected with station management, involving tasks to be performed both in the field and at the duty station. The latter should be responsible for executing the technical tasks, which involve logistics and links with the stations.
Finally, the necessary clerical staff should be available for administrative work.1
3.1.3.5 Operational tasks of the Station Network Management Unit
The operational tasks are based on the activities and the performance of individual stations. The activities of a station are set forth in the prescribed programme which must be carried out according to a routine day-to-day schedule. The Unit should issue instructions relating to the correct application of standard procedures, the operation of the instrumentation (including the execution of reliability tests) and the use of official communication, and should provide relevant tables, forms and manuals. It should also issue directives regarding relationships with local users of weather data.
The Unit should appoint an inspector responsible for the activities of a group of stations, the quality of their observations and the smooth working of the instruments. A scheme should be worked out with the users so that the incoming observational data and all relevant charts and forms from a station are routinely checked for errors and the inspector responsible for the station notified accordingly. Information about malfunctioning instruments or requests for remedial action must be evaluated by the inspector so as to enable the Unit to rectify discrepancies and to ensure that the stations are operating properly.
Periodic reports of activities from the stations should be sent to the Unit.
The personnel of the stations must be kept informed about the organization of the nNational mMeteorological Service and especially about the station network. This can be done through a circular letter or a printed bulletin, which would also be a medium for the dissemination of communications or messages to and from the stations. Special attention should be given to recognizing such events as anniversaries, distinguished service and retirements
3.1.3.6 Logistics and supplies
Each type of station should have its own standards for activities, equipment, instrumentation and operational procedures; these must be in accordance with the regulations of WMO and of the Member concerned. An up-to-date inventory of instruments, office equipment and other types of material at the station should be available.
An efficient communication system must be worked out within the organization to allow the smooth transmission of messages and information, with more than one type of communication medium if possible.
The meteorological assistant in charge of the station is responsible for its principal activities and for the upkeep of the instrument site. Vegetation around the station and within its perimeter must not interfere with the operation of the instruments. Installation, repair and
1 For a description of the classification of meteorological personnel and their duties, see Guidelines for Education and Training of Personnel in Meteorology and Operational Hydrology (WMO-No. 258).
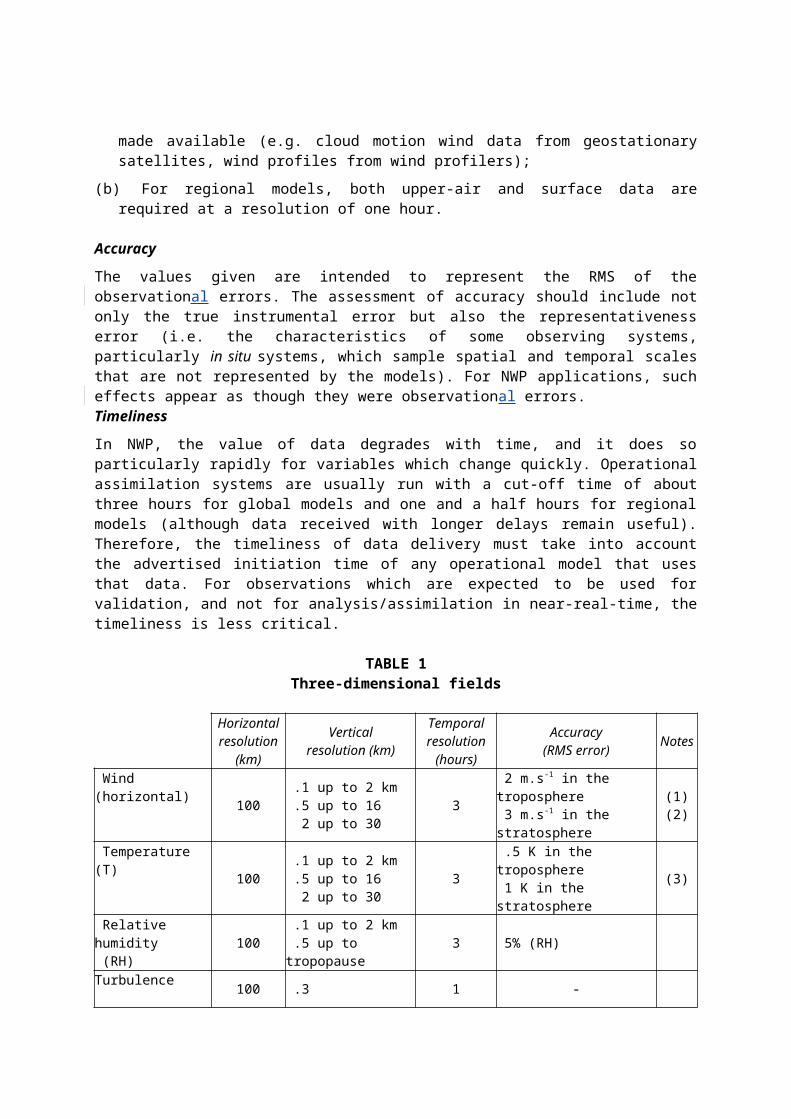
major maintenance work on the equipment will be the responsibility of a maintenance crewstaff from the Station Network Management Unit.
A system for ordering forms, charts and other expendables for the stations, preferably on a half-yearly basis, should be developed and implemented. Necessary supplies should be forwarded on demand to the station by means of a reliable system, bearing in mind that most of the material is fragile; special packing providing adequate protection (boxes, cardboard, cushion, pad) should be used as needed.
3.1.3.7 Establishment of a new station
The first action following the decision to establish a station is to visit the site. All the requirements must be assessed so as to ensure that the instruments to be installed can operate unhampered. It must be ascertained whether appropriate working conditions for the observer, office accommodation, and other required facilities such as running water, electricity and communications are available.
The Unit should prepare well in advance the instruments, equipment, supplies and material required for a new station.
The task of setting up a new station is assigned to a team including an inspector, a technician and assistants. The team should be trained for the specific job to be carried out in the most efficient manner according to a detailed standard plan.
During the installation of the equipment the necessary explanations should be given to the meteorological assistant to be placed in charge of the station to enable him to assume full responsibility for its operation.
A detailed report is to be written on the new station. This should include (preferably in the form of a check-list) a description of the site and its surroundings, accompanied by a drawing and an extract from a detailed map of the area. A visibility chart should be prepared for a surface station. The report should include details about instruments their operation, test results, tables to be used and an inventory. It is recommended that pictures taken from the four main directions be included.
The operation and performance of a newly established station should be closely monitored by the Unit. The material which arrives after the first month of operation must be carefully reviewed. Following the checking of data and evaluation of any deficiency, further visits to the station may become necessary. Thereafter, a regular standard pattern of inspections should be adopted.
3.1.3.8 Regular inspections
Regular inspections, including routine maintenance activities at automatic manned stations, will help to ensure the smooth functioning of a meteorological station. A detailed schedule is to be worked out by the Unit, spacing the inspections according to national practices. The inspection should follow a standardized check-list whereby information accumulated from the previous inspection, relevant station files, notification by other users and, if necessary, from special inquiries made before departure will provide additional guidance to the inspector. Comparisons of instruments at the station should be included among the items requiring the attention of the inspector (see sections 3.1. 3 .10 and 3.1. 3.11). (For more details, see Manual on the GOS (WMO-No. 544), Volume I, Regulations 3.1.6 - 3.1.7, Part III.
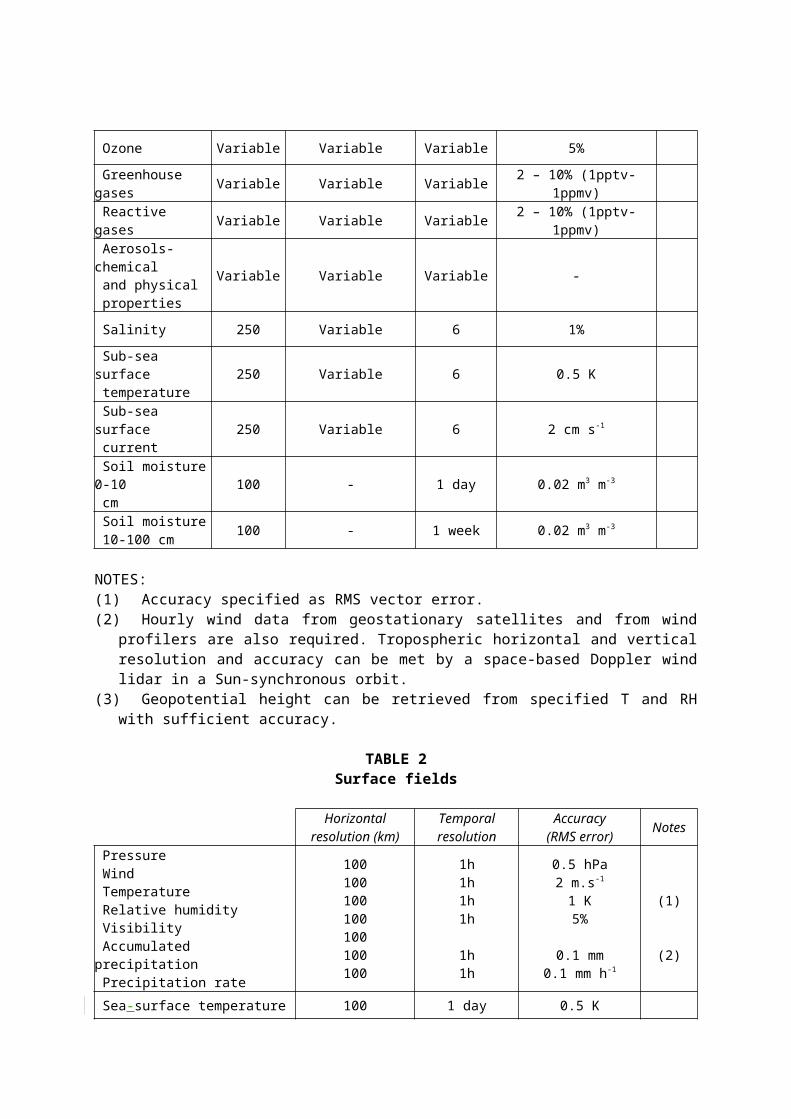
The findings of regular inspections should be documented in an inspection report which can be less elaborate than the report referred to in section 3.1.3.7. Copies of the report should be circulated to the users of the observational data within the organization, the administration and others involved in the activities of the meteorological station.
3.1.3.9 Other activities of the Station Network Management Unit
The Unit, having the technical "know-how", may be of assistance to other bodies outside the nNational Meteorological Service if requested. Such assistance may be provided in writing or by active participation in various projects involving the performance of instruments and the application of meteorology and operational hydrology.
3.1.3.10 Procurement of instruments and equipment
The equipment used in the observing station network of a Member should be in accordance with the general requirements of meteorological instruments as laid down in the Guide to Meteorological Instruments and Methods of Observation (WMO-No. 8), Chapter 1, section 1.4, Part I. These requirements are:
ReliabilityAccuracySimplicity of designConvenience of operation and maintenance Strength of constructionThe most important requirements for meteorological instruments are:
Accuracy (according to the stated requirement for the particular variable); Reliability and stability; Convenience of operation, calibration and maintenance; Simplicity of design (consistent with requirements); Durability; Acceptable cost of instrument, consumables and spare parts.
The instruments should be standardized and suitable for operation under prevailing climatic conditions. The standard instrument should be carefully selected, taking into account both economic and technical considerations, so as to ensure introduction of the best possible type of instrument into the system.
Instruments should be introduced only following a series of comparison tests and other checks. Comparisons of instruments should subsequently be carried out during each regular inspection of the station. Portable standard instruments used by inspectors should be checked against the relevant standards used by the Service before and after each tour of inspection.
Once a decision has been made to procure a certain type of instrument, the necessary administrative steps should be taken. Testing procedures should be instituted following the arrival of the shipment to determine if the instrument deviates in any way from the national standard, particularly in the range of the operational scale. Test certificates will be issued for each individual instrument. An instrument whichthat falls short of the prescribed accuracy should not be introduced into the system. A separate record card will be opened for each new instrument (see section 3.1.3.3).

A minimum stock of instruments to be used must be established; the personnel in charge of procurement must make sure that it is maintained at the required level. An emergency reserve is recommended, especially for items difficult to replace. The system for keeping the spare instruments should be technically well organized.
An ordering and issuing system should be introduced within the Service. It should be applied to all instruments delivered to the organization from an outside supplier and allocated, through the Station Network Management Unit, to individual stations in the network.
Constant efforts must be made to introduce improvements in the quality, performance and price competitiveness of the various supplies. In the case of equipment, the search for improved ideas and means is very important.
For perishable items, it is important to ensure that they are stocked properly and used regularly. In the case of items such as meteorological balloons or batteries, quality tests should be made from time to time.
A computerized information system may be of great advantage in managing the equipment. In organizations where these facilities do not exist, a manual follow-up system must be implemented.
3.1.3.11 Instrument checks and maintenance
A system for checking the instruments at a station regularly should be introduced so that faults can be discovered at an early stage. The system should include regular reliability tests. If faults are discovered or suspected, the Unit should be notified immediately. Depending on the nature of the fault and the type of station, the Unit will decide whether the instrument is to be changed or a field repair carried out.
The inspector responsible for the station is to assist the Unit in keeping the instruments in the best possible working order and in carrying out periodic comparisons with the national standards. (See also sections 3.1.3.8 and 3.1.3.10.)
3.1.3.12 Co-ordination
In addition to the circulation of inspection reports within the divisions or sections concerned and the notification of discrepancies or likely errors in the observational data, close co-ordination between the various users of the observational data in other branches of the organization and the Unit should be arranged. Periodic meetings should be held to discuss and decide on any improvements or changes which maybe desirable. Appropriate working arrangements within the uUnit for repairs of different types (e.g. electrical, mechanical), including familiarization with new equipment, will also be necessary.
3.1.3.13 Planning and budgeting
Planning, which should be short-term (one to two years) as well as medium- and long-term (five years or more), is concerned mainly with changes and improvements in the system, priorities to be set, development and new technology. Because of financial implications, the cost-effectiveness of any new type of equipment will be an important factor to be taken into consideration. Decisions on planning may have important effects on the organizational structure for management of the station network and requirements in terms of personnel and training.

3.1.4 Management of automatic surface land station networks
3.1.4.1 General
Due to the fact that automatic meteorological land stations are normally used to augment a basic manned station network, the management of automatic station networks should, in principle, follow the same general rules and practices as for the management of manned station networks (see section 3.1.3). This is to guarantee the acquisition of an observational data set with comparable quality and accuracy, as can be achieved by a manned station network. According the Manual on the GOS (WMO-No. 544), Volume I, Regulation 3.1.10, Part III, automatic stations should be inspected not less than once every six months.
ComplementaryDetailed information on automatic stations can be found in section 3.2.1.4 as well as in the Guide to Meteorological Instruments and Methods of Observation (WMO-No. 8), Chapter 1, Part II.
For the reasons of compatibility and homogeneity of data generated by automatic stations with similar data from manned stations, the responsibility for the management of an automatic station network should rest with the same organizational unit or units within the meteorological authority responsible for the management of manned station networks. The main aim should be to implement a composite observingational system of consistent quality on a global, regional and national level.
3.1.4.2 Administrative arrangements
The Station Network Management Unit should have access to all technical details of both the configuration and the sensor files for each automatic station installed in an operational network.
Experience in operational system evaluations and scientific networks studies have shown that the preparation of national operating instructions for weather stations equipped with devices for automatic data acquisition is essential for the satisfactory employment of new components such as automatic weather stations.
In view of the special position of an automatic weather station (AWS) within the flow of data from the observing site via collecting and/or coding centres to the national data processing centre, there are many system features that must be taken into account when preparing the necessary guidance material.
Since the technology used in automatic weather stations is evolving rapidly, more emphasis should be placed on new areas of automation, e.g. in the field of data acquisition, processing and local archiving techniques for meteorological measurements. In an automatedic system, a large number of different algorithms are used to define the quality- control routines: to evaluate with appropriate smoothing the physical quantities from the digital measurements; and to translate the resulting list of measured quantities into the WMO code format. Standardization on an international basis remains to be achieved.
3.1.4.3 Operational tasks of the automatic station network supervising unit
The operational tasks of the network supervising unit may vary according to the type of automatic station used.
(a) Supervision of a semi-automatic station network

Analogous to the manned station network, instructions on how to apply standard procedures must be prepared made available and strictly adhered to by the personnel in charge. The instructions should include guidance on the operation of instrumentation, as well as on preventive maintenance measures and, where feasible, may include small repairs of some automatic instrumentation or sensors done at observing sites. The unit should perform regular inspections of these stations in order to check the operation of automatic instruments or sensors.
Where appropriate, a diagnostic check of the operation could be carried out together with the data quality control at the national data collectiong centre. Information on possible malfunctioning should be transmitted as soon as possible to the maintenance experts.
(b) Supervision of a fully automatic station network
Since the technology used in automatic surface observing systems is complicated, the unit may need to consult specialists in order to address various problems in electronics, software, telecommunications and sensor engineering. It is useful for the unit to be involved in the management of the network from the initial stages of its deployment starting from delivery, site preparation, check-out and activation. It should have access to all documenta-tion concerning equipment, system configuration, site specification, software system and engineering services.
To ensure the reliability of sensors, data-acquisition systems and quality of data, the staff should be provided with guidance material on both manned and automatic test requirements. For remote automatic tests, equipment control procedures may include duty-checks performed on a daily schedule. Nevertheless, regular on-site instrument comparisons and inspections are needed to guarantee proper functioning of the automatic station network.
The unit should provide engineering support for the operation of the network and guidance material to the technical staff. Likely modifications, additions and site relocations of the system in the future also demand engineering support and in some cases revised versions of operational software. Operational tasks of the automatic station network supervising unit also include the organization of training courses.
3.1.4.4 Establishment of a new automatic station
(See section 3 .2.1.4.4.)
3.1.4.5 Data acquisition checks, quality control and maintenance
(See section 3.2.1.4.5.)
3.2 SURFACE SYNOPTIC STATIONS
3.2.1 Organizational aspects
3.2.1.1 General
Surface synoptic stations may be on land or at sea, manned or automatic. For the purpose of the present Guide, surface synoptic stations are dealt with under three categories, namely land stations, sea stations and automatic stations.

The establishment of a network of stations, their operation in accordance with the prescribed standards, and their maintenance involve many questions of an organizational nature of varying degrees of complexity, depending on the type of station, its location, functions, instrumental equipment, communication links for the transmission of the, data and requirement for trained personnel of different levels. The broad aspects of such questions, as they apply to each type of station falling under the three categories of surface synoptic station referred to above, are discussed in sections 3.2.1.2, 3.2.1.3 and 3.2.1.4 below.
3.2.1.2 Land stations2
3.2.1.2.1 Siting (locating) of stationsEach station making surface synoptic observations should be located at a site where
the meteorological data obtained are representative of the state of the atmosphere over a large region. The dimensions of this region, or area of representativity, may range from 2 000 km2 to 10 000 km2 (for a plane or homogeneous relief).
The station should have a plot of land specially assigned to it. The optimum area is approximately 1 ha.
The location of the observing posts (meteorological instrument area) should be typical of the physico-geographical conditions of the surrounding area and protected from the influence of industry. It is therefore necessary to locate a meteorological instrument area in an open site far from any constructions or woods. The minimum distances from constructions and groups of trees should be greater than 10 times and 20 times their heights respectively. The site should also be farther than 100 m from bodies of water, except where coastal measurements are required.
3.2.1.2.2 Meteorological observing area
The meteorological observing area is where most of the instruments and devices are situated. The observing area should preferably be no smaller than 25 m x 25 m where there are many installations, but in cases where there are relatively few installations (as in Figure III.1) the area may be considerably smaller. The sides of the observing area should be oriented north-south and east-west. An adequate north-south dimension is very important for measurements which can be strongly influenced by shadow (e.g. radiation, sunshine duration, temperature gradients just below and above the ground).
The instruments and equipment should be set out in a definite order, in several rows or lines. In the northern hemisphere the sensors are arranged as follows: wind-measuring equipment on the north side, along with temperature and humidity equipment, then a row of precipitation gauges with soil temperature measurement taking place in the southern part of the observing area. Figure III.1 provides an example of the layout of an observing station in the northern hemisphere showing minimum distances between installations.
The meteorological observing area should be fenced, but not with solid fencing material; large-mesh wire netting is the most suitable while palings, picket fences, hedges, clay enclosures, etc. are unsuitable. In the Arctic, desert and certain other regions, the observing area may not need to be fenced and may simply be marked out.
2 The requirements for the siting of stations and instrument exposure given in this section apply to an 'ideal' situation, which should be attained where possible. It is understood that these requirements cannot always be fully met for one reason or another.

The surface of the observing area must be left in its natural state (grass should be kept down to 20 cm). The area should not be walked on except along paths or tracks. Paths should not be of asphalt or concrete. In the interest of safety, the electrical voltage supplied to the equipment shall not exceed 24 or 36 volts. Installations should preferably be painted white (any other colour may be used for masts and fencing).
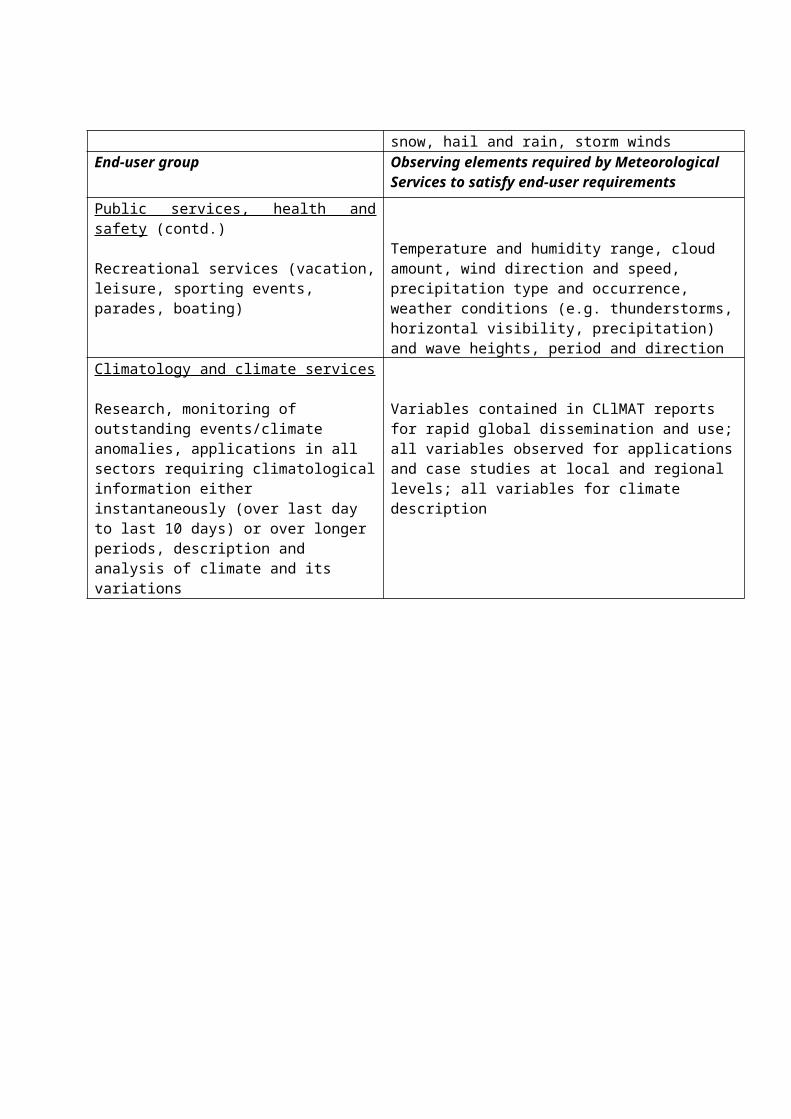
Figure III.1- Layout of an observing station in the northern hemisphere showingminimum distances between installations
(Source: UK Meteorological Office, Observer's Handbook, 4th edition, 1982)

Furthermore, it is desirable to provide special protected zones around the plots (extending about 200 m in all directions from the boundaries of the station area, if this area covers one or several hectares) which shall, where possible, be left unchanged, and whose use shall be agreed with the nNational Meteorological Service.
Particular attention should be given to the following points in selecting the site for the measurement of precipitation:
(a) Any method of measuring precipitation should aim at obtaining a sample representative of the true amount falling over the area which the measurement is intended to represent. The choice of site, as well as the systematic measurement error, is therefore important;
(b) In choosing a site, the systematic wind field deformation above an elevated gauge orifice, as well as the effects of the site itself on the air trajectories, should be considered;
(c) For each site the average vertical angle (a) of obstacles should be estimated, and a site plan made. Sites on a slope or on the roof of a building should be avoided. The surface surrounding the precipitation gauge can be covered with short grass or gravel or shingle, but hard flat surfaces, such as concrete should be avoided to prevent excessive in-splashing;
(d) In areas where there is homogeneous dense vegetation, such vegetation should be clipped regularly to keep it at the same level as the gauge orifice;
(e) Sites selected for measurement of snowfall and/or snow cover should be sheltered from the wind as much as possible. The best sites are often found in clearings within forests or orchards, among trees, in scrub or shrub forests, or where other objects act as an effective windbreak for winds from all directions.
Further information on siting and exposure can be found in the Guide to Meteorological Instruments and Methods of Observation (WMO-No. 8), Chapter 1, sections 1.1.2 and 1.3.3.1, Part I.
3.2.1.2.3 Observatory premises
To ensure normal operations, each station should be provided with premises suitable for the working staff, with optimum floor space, heating and/or cooling system as required, safety and fire-fighting equipment and an emergency electricity supply.
3.2.1.2.4 Personnel of observing station
Every station must be provided with personnel whose number and functions are established in conformity with the Member's regulations and standards, and taking into account the programme of observations and other work carried out by the particular station. The work at principal land stations should preferably not be interrupted between the observation times.
A station working around the clock to collect and transmit emergency information on dangerous weather phenomena, in addition to the standard observations carried out at the eight synoptic times, usually has a staff of five. For a station that only carries out observations at the eight synoptic times and that is not continuously attended, three are sufficient.

The official titles of staff (e.g. senior technician, technician, senior observer and observer) are determined in accordance with the type and importance of the data gathered by the station, the degree of complexity of the measuring equipment used, the duties of the staff and the practice followed by the nNational Meteorological Service.
Observers who are not full-time officials of a National Meteorological Service but are designated to make the meteorological observations at any synoptic station shall be certified by the appropriate Service as having competent knowledge of observing instructions and being capable of observing meteorological elements with the accuracy required. Similarly, National Meteorological Services should certify the competence of any other observers who are responsible for meteorological observations.
3.2.1.2.5 Training of station personnel
Each station should be provided with trained personnel to at least WMO Class IV level. Training of meteorological staff and other specialists for work at the station is arranged by the Member either within the country or by making use of appropriate courses abroad. In addition to the original training in the specialization, staff should undergo periodic refresher course in order to maintain their efficiency. General and specific guidelines on personnel training are contained in relevant WMO publications.
In order to ensure reliable observations and information, it is recommended that the observing personnel be trained to the following levels:
Chiefs of meteorological stations making standard observations (see section 3.2.2 below): intermediate specialized training (completion of a technical college or its equivalent);
Technicians selected amongst the most experienced of the junior technicians or observers: same as above;
Junior technicians (or observers): special training (or courses at special schools) lasting no less than six months.
NOTES: (1) It is possible for stations to have one or two observers trained on the job at the station itself (for no less than one month), preferably with subsequent training by attending courses at special training centres or by correspondence).
(2) For a description of the classification of meteorological personnel and their duties, see Guidelines for the Education and Training of Personnel in Meteorology and Operational Hydrology (WMO-No. 258).
Stations should be provided with all necessary documentation, manuals, guides, other instructions and guidelines to which all staff should have access and which they should study regularly.
3.2.1.2.6 Identification of stations
A surface station included in the rRegional bBasic sSynoptic nNetwork shall be identified by a station index number assigned by the Member concerned in compliance with the scheme prescribed in the Manual on Codes (WMO-No. 306), Volume I.1, Part A. The general list of station index numbers together with their observing programmes and other

relevant information is published by the WMO Secretariat in Weather Reporting (WMO-No. 9), Volume A – Observing Stations.
Each Member operating synoptic stations is required to send to the WMO Secretariat the necessary information for this purpose in compliance with the procedureregulations laid down in the Manual on the GOS (WMO-No. 544) , Vol. IVolume I, section 2.3.2, Part III.
Each Member should shall keep an updated up-to-date list of the synoptic stations (directory) on its territory, giving the following information for each station:
Name, and where appropriate, station index number; and
Geographical coordinates (in degrees and minutes of arc), station index number;
Elevation of the station in whole metres, (elevation of barometer above sea level);
Geopotential of the datum level in whole metres to which the pressure is reduced, or the reference isobaric surface the geopotential of which is reported;
Category of the station and observationing programme;
Times at which synoptic observations are made and reported;
Brief description of surrounding topography;
Exposure of instruments, in particular height above ground of thermometers, rain gauges and anemometers;
Station Hhistory (date of the commencement of regular observations, transfers, interruptions in observations, changes of name and any substantial changes made to the observationing programme);
Name of supervising organization or institution;
Datum level to which atmospheric pressure data are reduced.
Any other information required for completion of the entries in Weather Reporting (WMO-No. 9), Volume A – Observing Stations.
3.2.1.2.7 Telecommunications
All stations shall be provided with means of telecommunication to transmit their data as fast as possible to meet the needs of both forecasting services (global, regional and national requirements) and of local users (on a permanent basis and on request). The equipment used at the stations for transmitting and receiving information may be of various kinds: telephone, telegraph, radio and others. General and specific guidelines for the collection and transmission of information are contained in the Manual on the Global Telecommunication System (WMO-No. 386).
In any case, each synoptic station whose reports are included in the list for international exchange shall be provided with such telecommunication equipment as will guarantee regular and reliable transmission of the necessary reports and other information to

the established addressees of messages.
3.2.1.3 Sea s tations
3.2.1.3.1 General
About 70 per cent of the Earth's surface is covered by the oceans. It is an important task to obtain regular and adequate meteorological (and oceanographic) information from these vast areas because timely and precise weather forecasts as well as services to marine interests depend heavily on observations from the oceans. Although new techniques are being developed, especially for upper-air observations and for automatic surface observations, it is foreseen that the sea stations of today will remain a main element of the GOS in the future.
3.2.1.3.2 Fixed sea stations
3.2.1.3.2.1 Ocean weather stations
(a) General
Ocean weather stations are the most sophisticated of the meteorological sea stations. The number of ocean weather stations (weather ships) has, however, been drastically reduced over the last 25 years due to their high running costs and to the development of new techniques for observations from ships involving highly automated systems and the use of satellites (described under upper-air stations in section 3.3).
Due to the high cost, networks of ocean weather stations are generally organized as a joint project of participating Members, individual Members being responsible for operating the ships from national harbours. An example is the North Atlantic Ocean Stations (NAOS) network, which is operated on this basis under the auspices of WMO.
(b) Station design
An ocean weather station consists of a ship specially built or refurbished for the purpose. To keep a continuous observationing programme at a certain location, more than one ship is needed. The ship must have deck space for launching balloons for upper-air observations and adequate space for the meteorological instruments. There must also be space for supplies and expendables for 30 to 40 days with the safety measures necessitated by the use of hydrogen taken into account. The main storage area should, however, be located in the harbour from which the ship operates. The ship must have sufficient accommodation for the crew and meteorological personnel.
The elements comprising a surface synoptic observation from an ocean weather station are listed in the Manual on the GOS (WMO-No. 544), Volume I, Regulation 2.3.3.11, Part III and many of them are the same as for land stations, given elsewhere in this Guide (section 3.2.2.2). For sea stations, there are different ways of obtaining the meteorological parameters in some cases. Generally, the exposure of meteorological instruments may be more difficult for sea stations because of the limited area and the influence of the superstructure of a ship or other installations. Figure III.2 offers some information on where to expose the different instruments.
Figure III.2 - Exposure of the different instruments on an Ocean Weather Station(Vaisala Oy, Finland)
(c) Site selection
The positions of the stations should be carefully chosen so as to give the best possible benefit to the nNational Meteorological Services and to the Global Observing System (GOS). The harbours from which the ships operate should be chosen in such a way as to minimize the distance to the positions they occupy during operation at sea.
(d) Operations
National Meteorological Services operating the ships should be responsible for the technical and scientific standard and for calibration and maintenance of the instruments on board. A supervisor from the nNational Meteorological Service should ensure that all observational work is done in an efficient way and in accordance with the regulations. He should also ensure that the personnel are properly trained and that all relevant manuals and other documents are available to the personnel.
(e) Identification
The ocean weather stations (ships) shall be identified by an alphanumerical name assigned to the position of the station, not the name of the individual ship (e.g. C7R).
(f) Communications
The types of equipment suitable for timely transmission of the data from ocean weather stations include:

(i) Telex typewriter;
(ii) Two-way radio;
(iii) Satellite;
(iv) Telegraph.
There should be at least one alternative in case of failure or disruption of the primary link.
(g) Personnel and training.
Three types of personnel are needed to operate ocean weather ships:
(i) Ship's crew;
(ii) Meteorological personnel (observers and technicians);
(iii) Telecommunication personnel.
The number of personnel in (ii) and (iii) will depend upon the equipment used and the level of expertise required. It is possible to give the observers responsibility for the application of the procedure for the dissemination of the data over the GTS. The observers may also be responsible for the operation and maintenance of the equipment on board if given adequate training.
Using the ordinary crew as observers/operators under an experienced meteorological supervisor has, at least for one of the North Atlantic Ocean Stations (NAOS), proved to be a very efficient way to reduce operating costs. Some of the crew members must then be properly trained to make the observations. The total number of people necessary to operate an ocean weather ship may be reduced considerably in this way.
3.2.1.3.2.2 Lightship stations, island and coastal stations
(a) General
These stations may be important for the rRegional bBasic sSynoptic nNetwork and for the global network. Members should take this into consideration when planning and maintaining their national network of such stations.
(b) Station design
A lightship station is a meteorological observing station on board a lightship whose primary function is to serve as a lighthouse in coastal waters. The meteorological instruments must be properly exposed, generally in accordance with the rules given in the section dealing with ocean weather stations. Care should be taken to avoid influence of the special superstructure of the lightship.
The island and coastal stations should be equipped in the same way as a principal land station. In addition, the stations should be able to measure sea-surface temperature and to observe the state of the sea and sea-ice conditions. The stations could also be designed to make upper-air observations.

(c) Site selection
The siting of island and coastal stations should be made in accordance with the rules given elsewhere in this Guide for land stations (sections 3.2.1.2.1 and 3.2.1.2.2). In addition, care should be taken to ensure the observation of the state of the sea and the sea-surface temperature. There will generally be no option for siting lightships.
(d) Operations
National Meteorological Services shall operate or be responsible for the technical and scientific standard of the stations, and for calibration and maintenance of the instruments. A supervisor from the nNational Meteorological Service should ensure that the personnel have proper training and that all relevant manuals and other documents are available at the stations.
(e) Identification
Island and coastal stations shall be identified by a station index number as for land stations (see section 3.2.1.2.6). Lightship stations are moored in fixed positions and may also be identified by a station index number.
(f) Communications
The stations shall be provided with telecommunication equipment (telephone, two-way radio or others) that will guarantee a regular and reliable transmission of the coded reports. (See section 3.2.1.2.7 dealing with telecommunications under land stations.)
(g) Personnel and training
The personnel required for surface synoptic observations at island and coastal stations are the same as for land stations for similar observations. If, however, both surface and upper-air observations are made, the staff must be large enough and properly trained for both observations. A supervisor must ensure that the operational personnel have the necessary qualifications for the service including normal technical maintenance at the station and communication procedures (see also sections 3.2.1.2.4 and 3.2.1.2.5).
3.2.1.3.2.3 Fixed platform stations and anchored platform stations
(a) General
The offshore oil industry operates more or less permanently rigs and platforms on the continental shelf all over the globe. Platforms for oil drilling or production may serve as excellent sites for observations of meteorological variables and Members should take advantage of them. Observations are needed by the platform operators to monitor weather conditions on and near the platforms during helicopter and supply ship operations. Operators of offshore platforms are generally required by the regulations laid down by individual countries to make reliable surface observations of at least some meteorological and oceanographic variables. Co-operative arrangements can often easily be made with this industry.
(b) Station design
The exposure of meteorological instruments is very important and the most difficult

part of instrumentation on platforms. This is due to the size and the structure of the platform, whose height may be more than 100 m above sea level.
(c) Operations
Care should be taken that the instrumentation and control of the observations remain the responsibility of the nNational Meteorological Service. It is essential that the standard practices defined by WMO be followed. For manual observations the observers must be trained by the nNational Meteorological Service. In the case of automatic recording instruments, there should be adequate technical expertise available on board. A responsible supervisor must ensure that all observational work is done according to WMO regulations and that relevant documentation is available.
(d) Identification
The fixed and anchored platform stations are identified as ships and included in the International list of selected, supplementary and auxiliary ships (WMO-No. 47), with appropriate explanatory notes.
(e) Communications
The types of equipment appropriate for timely transmission of observational data from platforms and rigs are:
(i) Telex typewriter;
(ii) Two-way radio;
(iii) Satellite.
There should be at least one alternative in case of failure of the primary link.
(f) Personnel and training
The number of personnel required will depend upon the degree of automation. A good general education, such as that for naval officers, is required. The observers should attend a theoretical and practical course administered by the nNational mMeteorological Service. The course should comprise:
(i) A general presentation of the relevant regulations and guidelines of WMO and of the nNational Meteorological Service;
(ii) Instruments for use at sea;
(iii) Visual observationing techniques;
(iv) Lectures on the weather and weather forecasting for the particular area of responsibility.
3.2.1.3.3 Mobile sea stations
3.2.1.3.3.1 Selected, supplementary and auxiliary ships
Mobile sea stations consist of selected ship stations, supplementary ship stations, auxiliary ship stations and ice-floe stations (dealt with in section 3.2.1.3.4 below). Mobile ships are one of the main sources of surface observations over the oceans. The Manual on the GOS (WMO-No. 544) , Vol ume I specifies that Members shall recruit as many mobile ships that traverse data-sparse areas and/or regularly follow routes through areas of particular interest as possible. The international scheme by which ships are recruited for making and transmitting meteorological information is called the WMO Voluntary Observing Ships Scheme. Relevant standards and recommended practices and procedures are contained in the Manual on the GOS, Volume I, Part III, Regulation 2.2.2.2.2 and in the Guide to Marine Meteorological Services (WMO-No. 471).
In accordance with the WMO Technical Regulations (WMO-No. 49), each Member shall arrange for the recruitment of ships which are on the national register of that Member as mobile ship stations. In fulfilling this obligation, each Member contributes to the common objective of obtaining sufficient coverage of meteorological observations over the sea. It would be desirable if uniform coverage could be obtained. This is difficult to achieve, however, in view of the large differences in the density of shipping traffic over the oceans, which is comparatively greater in the northern hemisphere. Consequently, greater attention should be given to the recruitment of voluntary observing ships which operate in the tropics or in the southern hemisphere. To satisfy international meteorological requirements for data density over the oceans, the successive plans under World Weather Watch have shown the need for a continued increase in the number of voluntary observing ships.
The ships engaged in the WMO Voluntary Observing Ships Scheme are classified as:
Selected ship stations Supplementary ship stations Auxiliary ship stations.
A selected ship station is a mobile ship station which is equipped with sufficient certified meteorological instruments for making surface observations and which transmits weather reports in the full SHIP code form. (See Regulation 2.3.3.12, Part III of the Manual on the GOS (WMO-No. 544), Volume I.)
A supplementary ship station is a mobile ship station with a limited number of certified meteorological instruments for making surface observations and which transmits weather reports in an abbreviated SHIP code form. (See Regulation 2.3.3.13, Part III of the Manual on the GOS (WMO-No. 544), Volume I.)
An auxiliary ship station is a mobile ship station, normally without certified meteorological instruments, which may transmit reports in a reduced code former in plain language as a routine or on request, in certain areas or under certain conditions. (See Regulation 2.3.3.14, Part III of the Manual on the GOS (WMO-No. 544), Volume I.)
Meteorological Services in many countries are normally required to provide more detailed information of the weather and sea conditions in coastal areas. Some Services have successfully recruited ships of local companies to make and transmit observations during their voyage from harbour to harbour along the coast. Such ships may be recruited as supplementary or as auxiliary ships. Their observations have everywhere been found to be of great value.
3.2.1.3.3.2 Criteria for recruitment of voluntary observing ships

Several criteria can be used in deciding whether a particular ship should be recruited as a selected, supplementary or auxiliary ship, to satisfy both national and international needs. Questions which should be examined are whether all the necessary instruments can be installed, whether the ship's officers will have the time available for recording and transmitting the observations and whether the necessary regular contact can be established for the receipt of meteorological log- books. Generally, shipowners and masters are very co-operative in these matters; it is, however, advisable that these questions be thoroughly discussed at the recruiting stage. At the same time, the meteorological authorities must also take into account whether the normal duties of navigation and radio officers would leave them sufficient time to take and transmit the observations.
Countries may also recruit ships of foreign registry with a view to obtaining a sufficient number of observations from the oceans. This is sometimes done by arrangement between the Meteorological Services of two countries in cases where the home port of certain ships is situated in other than the recruiting country. Selected or supplementary ships thus recruited should, however, visit the ports of the recruiting country sufficiently often to permit regular contact. In order to avoid the entry of duplicate data into the international archiving system, meteorological log- books from ships of foreign registry should be produced and stored through appropriate arrangements with the Meteorological Service of the country of registry. When a ship of foreign registry is recruited, the Member in whose country the ship is registered should be notified, unless a port in the country of the Member that recruits the ship is considered to be its home port.
No prior arrangements are required with the Meteorological Service of the country of registry for the recruitment of an auxiliary ship.
The recruitment of voluntary observing ships is the responsibility of each Member participating in the scheme and for this purpose Members should establish a suitable organizational unit. Shipping agencies should be contacted to enlist their co-operation. Appropriate measures should also be taken for the provision of instruments, instruction material and other necessary documents to ships, for the collection and examination of ships log- books for visits to ships and for the various financial questions involved. Within this national unit, a special officer should be made responsible for the recruitment of ships.
3.2.1.3.3.3 Information relating to ships participating in the WMO
Voluntary Observing Ships Scheme
(a) International List of Selected, Supplementary and Auxiliary Ships
Selected, Supplementary and auxiliary ships constitute an important source of marine data which are used for various purposes all over the world. In analysing these data, Meteorological Services should be aware of the type of instrumentation on board a given ship, or the particular method of observation when several methods are generally in use. For this purpose WMO issues annually an International List of Selected, Supplementary and Auxiliary Ships on the basis of information supplied by Members in accordance with Regulations 2.3.8.1.5 2.3.3.3 and 2.3.8.1.6 2.3.3.4 inof the Manual on the GOS, (WMO-No. 544)Vol. IVolume I, Part III. This publication contains, for each ship, particulars such as:
Name of ship;
Call sign;

Area or routes which the ship normally plies;
Type of barometer;
Type of thermometer;
Exposure of thermometer;
Type of hygrometer or psychrometer and exposure of it;
Method of obtaining sea-surface temperature;
Type of barograph;
Various other meteorological instruments used aboard the ship;
Types of radio equipment;
Number of radio operators;
Height, in metres, of the observing platform, measured from the mean water-line;
Height, in metres, of the anemometer about the ground.
Regular updating of the International List of Selected, Supplementary and Auxiliary Ships is needed because of the frequent changes in the international merchant shipping fleet and in the recruitment of auxiliary ships in particular. As a rule, Members are required to provide to the WMO Secretariat before 1 March each year a complete list of their selected and, supplementary and auxiliary ships that were in operation at the beginning of that year. This information can also be given in the form of amendments to the list for the preceding year.
(b) Logistics
Some advice on how to handle the recruitment and operation of mobile ship observations through a national unit is given above. In addition, in larger ports, a port meteorological officer should be appointed for direct contact with ships' officers. This is often necessary in order to provide the latter with manuals and other documents, to inspect the instruments on board, to collect the log- books, and to take any corrective action which might be necessary. The role of the port meteorological officer is a very important one and the efficiency of the Voluntary Observing Ships Scheme is heavily dependent on them. Their duties are set out in detail in the Guide to Marine Meteorological Services (WMO-No. 471).
(c) Meteorological log- books
The recording of observations in a meteorological log- book is obligatory for selected and supplementary ships and is recommended for auxiliary ships. The layout of log- books is a national responsibility. An example of a log- book is given in Figure III. 3. Log- books should contain clear instructions for entering observations. It is useful to indicate (by shading, etc.) those columns which are meant for entries to be transmitted as part of the weather report. To facilitate the supply of meteorological log- books to ships which do not regularly visit their home ports, port meteorological officers in various ports keep a stock of log- books of different nNational Meteorological Services. In addition, they may keep stocks of observing

and coding instructions in different languages.

Captain________________________ Principal Observing Office__________________ Radio Officer________________Voyage from___________________________ to_____________________
YEAR 198
MO
NTH
0-
12
Day
of
Mon
th G
.M.T
.
G.M
.T
Win
d In
dica
tor
POSITION OF SHIP
Indi
cato
r for
Pre
cipi
tatio
n gr
oup
Indi
cato
r for
Wea
ther
Gro
up
Hei
ght o
f Low
est C
loud
Vis
ibili
ty
WIND TEMPERATURE PRESSURE PRESSURE CHANGE WEATHER CLOUDS
IF TRANSMITTED BY RADIOADRESS TO WHICH SENT S
hips
Rep
ort I
ndic
ator
Latit
ude
(d
egre
es a
nd te
nths
)
Qua
dran
t
Long
itude
(d
egre
es a
nd te
nths
)
Tota
l Clo
ud A
mou
nt
Dire
ctio
n (T
rue)
(ten
s of
deg
rees
)
Spe
ed
Gro
up In
dica
tor
Sig
n of
Tem
pera
ture
in c
ode
Air
Tem
pera
ture
(deg
rees
and
tent
hs)
Wet
Bul
b (d
egre
es a
nd te
nths
)
Gro
up In
dica
tor
Sig
n of
Tem
pera
ture
in c
ode
Dew
-poi
nt
(deg
rees
and
tent
hs)
Barometeras read andCorrection
Gro
up In
dica
tor
Cor
rect
ed P
ress
ure
Gro
up In
dica
tor
Cha
ract
eris
tic
Am
ount
Gro
up In
dica
tor
Pre
sent
Pas
t
Gro
up In
dica
tor
Am
ount
of L
ow o
r Med
ium
if n
o Lo
w
Type
of L
ow
Type
of M
ediu
m
Typo
e of
Hig
h
GROUP NUMBERS GROUP 1 GROUP 2 GROUP 3 GROUP 4 GROUP 5 GROUP 6 GROUP 7 GROUP 9 GROUP 10 GROUP 12 GROUP 13CODE SYMBOLS YY GG iw 99 LaLaLa Qc LoLoLo iR iX h VV N dd ff 1 sn TTT 2 sn TdTdTd 4 PPPP 5 a ppp 7 ww W1W2 8 Nh CL CM CH
00 99 4 1 2 4 5 7 8
06 99 4 1 2 4 5 7 8
12 99 4 1 2 4 5 7 8
18 99 4 1 2 4 5 7 8
00 99 4 1 2 4 5 7 8
06 99 4 1 2 4 5 7 8
12 99 4 1 2 4 5 7 8
18 99 4 1 2 4 5 7 8
00 99 4 1 2 4 5 7 8
06 99 4 1 2 4 5 7 8
12 99 4 1 2 4 5 7 8
18 99 4 1 2 4 5 7 8
00 99 4 1 2 4 5 7 8
06 99 4 1 2 4 5 7 8
12 99 4 1 2 4 5 7 8
18 99 4 1 2 4 5 7 8
00 99 4 1 2 4 5 7 8
06 99 4 1 2 4 5 7 8
12 99 4 1 2 4 5 7 8
18 99 4 1 2 4 5 7 8
COLUMN No. 1 2 3 4 5 6 7 8 9 10 11 12 13 14 15 16 17 18 19 21 22 23 24 25 26 28 29 30
31
32
33
NOTE: Logbook is printed so that those two pages form full record columns 1-56 from left to right when opened flat.
Figure III.3 - An example of a meteorological log- book for ships
Height of barometer above sea level ______________________ feet/metres
Method of taking sea temperatures – (a) Rubber bucket (b) Condenser intake (c) Hull sensor___________(Note any departure from this method in Remarks Column)
For O
ffice
use
onl
y
Sec
tion
Indi
cato
r
Cou
rse
of S
hip
Spe
ed o
f Shi
p
SEA TEMPERATURE WIND WAVES SWELL WAVES ICE ACCRETION ICE REMARKS
Gro
up In
dica
tor
Sig
n Te
mpe
ratu
re in
cod
e
Sea
Tem
pera
ture
(deg
rees
and
tent
hs)
Gro
up In
dica
tor
Per
iod
in s
econ
ds
Hei
ght
(in h
alf m
etre
s)
Gro
up In
dica
tor
1stSwell
Waves
2nd Swell
Waves
1st
Sw
ell
Wav
es 2n
d S
wel
l W
ave
s
Gro
up In
dica
tor
Type
of I
ce A
ccre
tion
Thic
knes
s of
Ice
(cm
)
Rat
e of
Ice
Acc
retio
n
Gro
up In
dica
tor
Con
cent
ratio
n or
Arr
ange
men
t
Sta
ge o
f Dev
elop
men
t
Ice
of L
and
Orig
in
Bea
ring
of Ic
e E
dge
Ice
Situ
atio
n
Shifts of wind, times of start and finish of rainfall, etc. Special phenomena should be entered briefly. Space for additional remarks is provided at the end of this logbook. The Beaufort notation may be used in this column. (See “Marine Observer’s Handbook”).
Call sign to which
sent, frequency
(kHz) used and time sent G.M.T.
Dire
ctio
n fro
m(te
ns o
f deg
rees
)
Dire
ctio
n fro
m(te
ns o
f deg
rees
)
Gro
up In
dica
tor
Per
iod
in S
econ
ds
Hei
ght (
in h
alf m
etre
s)
Gro
up In
dica
tor
Per
iod
in S
econ
ds
Hei
ght (
in h
alf m
etre
s)
GROUP 15 GROUP 16 GROUP 18 GROUP 19 GROUP 2O GROUP 21 GROUP 22 GROUP 23222 Ds Vs 0 Sn TwTwTw 2 PwPw HwHw 3 dw1dw1 dw2dw2 4 Pw1Pw1 Hw1Hw1 5 Pw2Pw2 Hw2Hw2 6 Is EsEs Rs ICE ci Si bi Di zi
00 222 0 2 3 4 5 6 ICE06 222 0 2 3 4 5 6 ICE12 222 0 2 3 4 5 6 ICE18 222 0 2 3 4 5 6 ICE00 222 0 2 3 4 5 6 ICE06 222 0 2 3 4 5 6 ICE12 222 0 2 3 4 5 6 ICE18 222 0 2 3 4 5 6 ICE00 222 0 2 3 4 5 6 ICE06 222 0 2 3 4 5 6 ICE12 222 0 2 3 4 5 6 ICE18 222 0 2 3 4 5 6 ICE00 222 0 2 3 4 5 6 ICE06 222 0 2 3 4 5 6 ICE12 222 0 2 3 4 5 6 ICE18 222 0 2 3 4 5 6 ICE00 222 0 2 3 4 5 6 ICE06 222 0 2 3 4 5 6 ICE12 222 0 2 3 4 5 6 ICE18 222 0 2 3 4 5 6 ICE
34 35 36 37 38 39 40 41 42 43 44 45 46 47 48 49 50 51 52 53 54
Figure III.3 (contd.)

(d) Communications
Weather reports from mobile ship stations should be transmitted to a coastal radio station as soon as possible after the time of observation; hence the meteorological report, as soon as it is made on board ship, should be handed to the ship's radio officer without delay so that it can be cleared to shore as rapidly as possible. ProceduresRegulations for the transmission of weather reports from mobile ship stations to designated coastal radio stations are given in the WMO Manual on the Global Telecommunication System (WMO-No. 386), Volume I, Part I. For ready reference, the relevant procedures are reproduced below. Weather reports from mobile ship stations should (without special request) be transmitted from the ship to the nearest coastal radio station situated in the zone in which the ship is navigating. If it is difficult, due to radio propagation conditions or other circumstances, to contact promptly the nearest radio station in the zone in which the ship is navigating, the weather messages should be cleared by applying the following procedures in the order given below:
(a) Transmission to any other coastal radio station in the zone in which the ship is
navigating;
(b) Transmission to any coastal radio station in an adjacent zone within the same Region;
(c) Transmission to any coastal radio station in any other zone within the same Region;
(d) Transmission to a coastal radio station in an adjacent zone in a neighbouring Region or, failing that, to any other station in a neighbouring Region;
(e) Transmission to another ship or an ocean weather station with the function of or willing to act as a relay station.
Maritime mobile radio systems used for ship-to-shore communications as above can cause problems, for various reasons of a technical nature, in the collection of ships’ weather reports for subsequent distribution over the GTS. The use of new communication techniques, especially through satellites, which are already operational, offers a promising solution to these problems. Special mention may be made of the system known as INMARSAT, designed for full communication capability for public ship-to-shore communication. The use of this system has, however, important technical and financial implications for nNational Meteorological Services and WMO has been studying them.
(e) Personnel and training
An essential step in recruiting voluntary observers for ships’ observations is to obtain the permission of the owner and the master of the ship. When this has been done and the observer(s) identified, the port meteorological officer provides instructions in the following aspects:
General care of instruments Exposure and reading of hygrometer and psychrometer Obtaining sea-water temperature Cloud observations Use of WMO codes Coding and transmission of observations.

Once a ship has been recruited the port meteorological officer should endeavour to visit it at least every three months to check the accuracy of the instruments and to renew the supply of forms and documents, e.g. codes and regulations. He should take the opportunity to foster an interest in meteorology in the crew members concerned and to explain to them the mutual value to seamen and to meteorologists of accurate weather information.
3.2.1.3.4 Ice-floe stations
(a) General
An ice-floe station is generally a part of a scientific base on a large ice floe drifting in the Polar Regions. Ice-floe stations constitute an important contribution to the network in data-sparse Polar Regions.
Members, individually or jointly, should arrange for meteorological observations from large ice floes whenever possible, either as part of the programme of a scientific base or as an automatic station. In the case of a joint undertaking, one National Meteorological Service should have the responsibility for the scientific and technical standard of the station.
(b) Identification
Identification of ice-floe stations shall be as for ships.
(c) Communications
The ice-floe stations should have two-way radio connection or automatic transmission via satellite. In Polar Regions, only polar-orbiting satellites can be used. The ARGOS system operated with some of the US satellites offers this possibility, and the use of the Doppler effect in the receiver signals makes it possible to locate the station fairly accurately. Using polar-orbiting satellites as a means of communication may give asynoptic reporting times.
(d) Personnel and training
A sufficient number of the staff on the ice-floe base must have adequate training for taking all the required observations in accordance with WMO regulations. At least one trained technician should be available for the functioning and maintenance of the instruments. He must also be responsible for the supply of expendables and back-up equipment. The staff must also include personnel to operate the communications system.
3.2.1.4 Automatic stations
3.2.1.4.1 General
An automatic weather station is defined in the Manual on the Global Observing System as "a station at which instruments make and either transmit or record observations automatically, the conversion to code form, if required, being made either directly or at an editing station" International Meteorological Vocabulary (WMO-No. 182) as “meteorological station at which observations are made and transmitted automatically”. Provision may also be made for the manual insertion of data.
The following information in this section of the Guide deals with the planning and establishment of real-time networks of automatic stations forming part of the rRegional
bBasic sSynoptic nNetworks as well as other networks of synoptic stations where the emphasis is on quick and direct access to the data.
Complementary information can be found in the Guide to Meteorological Instruments and Methods of Observation (WM0-No. 8) and in section 3.2.1.4.6 of the present Guide.
3.2.1.4.2 Purposes of automatic stations
Automatic stations are used for many purposes. These include:
(a) Providing data from sites which are difficult of access or are inhospitable;
(b) Providing observations at manned stations outside the normal working hours of the observing staff, for instance during the night or at weekends;
(c) Increasing the reliability of the data and to standardize the methods and the timing of the observations for all the stations of a network;
(d) Reducing costs by reducing the number of manned stations;
(e) Placing sensors in meteorologically favourable sites independent of the places of residence and work of the observer.
3.2.1.4.3 Types of automatic synoptic networks and stations
3.2.1.4.3.1 Configuration of a network
Automatic synoptic networks need real-time operation for collection, transmission and processing of the data. Stations can be organized within a network in different ways. Data collection is directly controlled by a single data processor at a central data- collectiong point or by several data processors at sub-central data- collection points which periodically collect the data from the stations and distribute them (Figure III.4).
Sub-central data- acquisition processors are suited to large networks, when a regionalization of the control and the processing functions seems to be an advantage. The use of a single processor to service a network makes the entire automatic observing system vulnerable to a failure of this processor.
The data- transmission facilities offered by automatic synoptic networks can also be used, if necessary by manned or partially automated stations, if the observers have adequate terminals for the input of the conventional observations. These terminals may be used for entering synoptic data, coded or in parameter form, or climatological information. The central processor of the network collects the observations directly or, together with the automatic measurements, via the automatic stations (Figure III.5).

Figure III.4 - Network configuration
Source: Branke, W., 1978: System technology for networks. Technical Seminar for Measuring Techniques, Automation and Data Processing for Water Control, May 1978. Bayerisches Landesamt für Wasserwirtschaft.
3.2.1.4.3.2 Data processing
The major part of data processing or coding is accomplished either at the station site or at some sub-central or a single central processor site.
The main advantage of a central data- processing facility is that quality control, real-time computation and data conversion are performed at a single place. Furthermore, changes to the synoptic code can be implemented for all stations at once with only one modification; a single station can be modified and maintained without altering the standard codes. Moreover, this concept offers an important advantage to the data user, who is able to analyse the instrumental problems with the raw sensor data directly from the central site and can plan repair work more efficiently.
There are disadvantages to central data processing. Most changes require significant and time-consuming software modifications. Programmer availability and computer capability limitations usually become major handicaps and add to the delay. A compression of data at the station reduces the amount of information to be transmitted; if the rate of data transmission is high enough, however, this argument becomes secondary. Unfortunately, both the software and the communication costs tend to be greatly underestimated.
Figure III. 5 - Automatic data- collectiong system for conventional stations and partially or fully automatic weather stations.
Source: Hovberg, T. and Udin, I., 1984: Papers presented at the WMO Technical Conference on Instruments and Cost-effective Meteorological Observations (TECEMO), Nordwijkerhout, Sept. 1984. WMO Instruments and Observing Methods, Report No. 15.
3.2.1.4.3.3 Data transmission
Data transmission is a vital function for real-time synoptic stations. Transmission may be achieved by landline (either dedicated or not) or by radio, which may be HF, VHF or UHF, with or without a relay station such as a satellite in the link. For long-range communications reflection of VHS radio signals by ionized meteor trails is also used. In any of these cases, the security of the transmitted data should be assured by the use of such devices as check codes and parity checks. If transmission time or bandwidths allow, the simple multiple transmission of messages can be adopted. These methods are especially important when HF communication is used, because of its inherent tendency toward signal fading.
The satellite link is normally not very useful for short distances. However, satellite transmission contributes to reducing the energy consumption of automatic stations. For this reason satellites can be considered as one of the major positive factors contributing to the extension of synoptic networks in desert or ocean areas. It allows the replacement of the HF link, which is difficult to maintain and consumes considerable power.

In many countries the post office offers many possibilities for data transmission over its networks and takes responsibility for a transmission of irreproachable quality. Such facilities should be preferred to the special designs where the responsibility of the transmission remains with the operator of the network. In choosing the method of transmission, however, it should be considered whether the prices proposed by the post office are competitive.
3.2.1.4.3.4 Multi-purpose stations
Since the costs of automatic synoptic stations are very high, it seems judicious to use the facilities of the stations for other purposes as well, for instance for the needs of climatology, aeronautical meteorology, storm warnings, nuclear power safety, air and water quality surveys and flash flood warnings.
For such multi-purpose stations the data may be stored continuously on local storage units. Thus, one has the possibility to retransmit the data to the central processor of the network after an interruption or to process them at a later date on a separate computer system.
The alternatives for supplying electrical power to automatic weather stations are described in section 22.3.4 of the Guide to Meteorological Instruments and Methods of Observation (WMO-No. 8).
3.2.1.4.3.5 Sensors
The sensors for use with automatic weather stations for the measurement of the different elements and their performance and quality are described in section 22.2.2 1.2.1, Chapter 1, Part II of the Guide to Meteorological Instruments and Methods of Observation (WMO-No. 8).
3.2.1.4.4 Planning guidance
3.2.1.4.4.1 Determination of the requirements
The first step in the planning of an automatic network is to set up a list of requirements of the known and the potential users of the data. At the outset, purely meteorological aspects are to be considered, e.g. which station distribution, which measuring cycle, which observingation programme is necessary to satisfy the requirements of the weather predictions made in the country and to fulfil the international weather information requirements. The answer could be found by using a table similar to that developed for Scandinavia (Table III.1). The interdependency with other data- acquisition systems like radar, upper-air stations or satellites should also be considered.
The results from manned stations are often qualified as "standards" by the opponents of automation, who compare the performance of automatic equipment with the performance of ideal conventional stations. This way of thinking is often unfounded. In some cases it is indispensable that new methods be adopted if meteorological observation is to be successfully automated. The temptation to replace the manual observing methods by automatic means frequently leads to a complex, expensive and unreliable outcome. In view of this problem an automatic system should preferably be designed to work according to a predetermined specification rather than in terms of "measurements" as made by an observer. Sensors whose output is consistent with automatic data handling should be adopted.

Because of the diversity of the meteorological problems the planning of a network should not be the concern only of engineers or manufacturers of automatic measuring systems who often do not know the real problems of the users. During the planning phase the future user must devote his time and bring his experiences to bear in order to avoid the disappointment resulting from an unsuitable system. Countries without experience in that field should seek advice from those that have been running automatic observing networks for a number of years.
It is essential to establish detailed specifications which take account of the local requirements and environment. These specifications should mention not only technical parameters such as measuring range, accuracy uncertainty, resolution, reproducibility, response time, stability, reliability, power consumption, exchangeability, critical dimensions (distance between sensors and transmitters/receiver, space or weight limitations), requirements for spare parts and maintenance, but also long-term compatibility requirements with attached or neighbouring equipment (if the equipment is intended to replace a part, or to be a complementary part, of another system) and possible interferences with other systems (in particular at airports).
3.2.1.4.4.2 Criteria for system selection
(a) Future environment of the station
Automatic weather stations must be able to withstand the most severe meteorological extremes. It is essential, therefore, to analyse the future environment of the station before specifying or designing a system. The major influences are high humidity, low or high temperature, dust, high-frequency fields, lightning and corrosive environments. Nuclear-electromagnetic pulses are also to be taken into account. Protective measures against these influences have to be planned at the outset.
(b) Reliability
The mean time between failures (MTBF) of an automatic synoptic station should be more than 10 000 hours without taking into account individual sensor failures.
One approach to the enhancement of the reliability of automatic weather stations is a partial or full duplication of the station. Partial duplication is defined as the duplication of critical elements by using redundant subsystems such as power supplies, wind and temperature sensors. Full duplication, where the second station is a less expensive type with a lower capability which will only report basic parameters such as atmospheric pressure, wind speed, wind direction or air temperature, would require different power supplies and different communication channels, at least at the station, if all risks are to be avoided. A feature of the duplication philosophy is that both the primary and the secondary systems will be working continuously except, of course, when one of them is out of order.

Table III. 1
Requirements of users of meteorological data in Scandinavia
Time and space scales Observations
0 – 2 h
0 – 100 km
“Nowcasting”
Complete regional radar coverage. Continuous operations. Automatic stations (including buoys). Regional net for wind,
humidity with density approximately 40 km. Wind measurements in narrow channels with density less than 20 km. Wind and temperature along popular mountain tracks. Temperature, wind, humidity and radiation along highway sections prone to icing. All values in real time.
1-2 vertical sounding systems for wind, temperature and humidity. Measurements every hour.
Reports from civilian and military aircraft in the region. Airport observations , hourly synoptic observations and
METAR. In southern Sweden, METEOSTAT digital information every
half hour.
2 – 6 h
20 – 300 km
Complete radar coverage. Complete synoptic observations every third hour. Density 80
km. Automatic stations (including buoys). Pressure measurements
with density approximately 50 km. Wind, temperature and humidity with density approximately 40 km once an hour.
Digital satellite pictures with a period of 3-6 hours. 1-2 vertical sounding systems at least every sixth hour. Scandinavian synoptic observations every third hour. Acoustic sounders, instrumented masts, etc.
6 – 18 h
20 – 300 km
Synoptic observations every third hour. Density approximately 80 km.
Automatic stations with pressure sensor every third hour. Density approximately 50 km.
Digital Satellite pictures with period 3-6 hours. Satellite vertical soundings (e.g. TOVS) every sixth hour or
more frequently. 1-2 vertical sounding systems every sixth hour. Foreign observations (SYNOP, TEMP, PILOT, AIREP) every
third or sixth hour. Ship observations Acoustic sounders, masts, etc.
12 – 26 h150 – 4 000 km
As above
Source: Ag., L., 1981: Papers presented at the second WMO Technical Conference on Instruments and Methods of Observation (TECIMO-II), Mexico City, Oct. 1981. WMO Instruments and Observing Methods Report No. 9.
If one considers a station consisting of, for example, two identical subsystems inactive redundancy and each with the MTBF of T, the resultant station MTBF will be 1.5 x T. The first subsystem failure warns the maintenance authority that corrective action is required without interrupting any essential role of the station. Corrective action can be taken before another

fault appears which could result in station failure. Generally, partial or full duplication of the equipment tends to be expensive and is only worthwhile in the absence of a suitable maintenance organization which guarantees corrective actions within acceptable time limits.
The percentage of synoptic observations which may actually reach the user in time to be of value is a critical quality factor in the assessment of an operational automatic system. The point at which a decline from 100 per cent becomes sufficient to render the system no longer cost effective might depend somewhat upon the circumstances of its use; in general, however, the aim is a data availability of more than 90 per cent for successful operational systems. For rRegional bBasic sSynoptic sStations, a data availability of at least 95 per cent seems to be indispensable for the daily routine work.
The most important losses of reliability are in general connected with interruptions of data transmissions. The safety of data transmission could be improved by overlapping star-type network designs and rerouting of communications along different communication lines. (See Figure III.6).
(c) System architecture
The system should be flexible and modular in order to suit the most varying applications. Special attention should be paid to expanding capability. It should be possible to connect additional stations, new sensors and peripherals to the system at a later stage. The conception of a network should leave the choice of the data routeing and the diverse communication devices open, so that they can be adapted to the latest technological development.
The basic structure of an automatic station and its data handling should also be kept as modular as possible. As much signal conditioning as possible should be done by each sensor interface, preferably at or very close to the sensor.
Synoptic stations designed to be used unattended over along period of time should be kept as simple as possible, whereas for those which can be visited more often or which are used semi-automatically, more elaborate solutions, including sophisticated data processing, can be acceptable.
Figure III.6 - Single star network and overlapping star network with rerouting facilities
Source: Van den Enden, I.F.H.C.C., 1984: Papers presented at the WMO Technical Conference on Instruments and Cost-effective Meteorological Observations (TECEMO), Nordwijkerhout, Sept. 1984. WMO Instruments and Observing Methods Report No. 15.
(d) Life length considerations
Life length is considered by manufacturers to be the time a piece of equipment remains in active production; the user, however, is more likely to think in terms of useful life in the field. It is well known that electronic products tend to have a short production life cycle. For the user, the useful life of a system tends to be much longer, e.g.
Up to 10 years for the hardware and the software of a network central processor;
Up to 10-20 years for stations and their sensors;
Up to 30 years and more for the infrastructure around stations.
In some cases the life length of a system is limited by the rapid progress of technology. Availability of spare parts or human know-how becomes a serious problem. It may happen that, by the time a system is designed, tested and accepted, it has already become obsolete.
It is, therefore, better to choose parts which have already been successfully used in other countries and which are readily available instead of undertaking expensive research and development in one's own country. This is especially true with respect to the acquisition of smaller series. The contract with the manufacturer should contain guarantees concerning maintenance and the availability of spare parts. If the manufacturer of a system is not able to guarantee the required life length under acceptable conditions, a commitment on the part of the operator of the network is indispensable. The latter must participate in the development and maintenance work to acquire the necessary know-how and must also obtain enough materials for an adequate period.

3.2.1.4.4.3 Logistics
(a) Site selection
As automatic stations are expensive, it is necessary to study site facilities carefully before making significant installation investments. The considerations in choosing a site for a surface synoptic station (see section 3.1.2) also hold good for automatic stations.
(b) Resources required
The establishment of an automatic observing network needs considerable material resources. If one disregards the quality and the quantity of the data acquired by automation, establishment of an automatic synoptic network can be financially advantageous only if it replaces many manned stations making round-the-clock observations by totally unmanned stations or by partially manned stations with a reduced presence of observers.
The total cost of an automatic synoptic network is composed of the initial costs and the operating costs. Initial costs include costs for development, acquisition, installation, efficiency tests, documentation and software programmes. Operating costs are staff costs, maintenance, transmission, modification and replacement of parts, consumption of electricity, rental of the land, training, control and processing of the measurements. The costs of the modification and replacement of system parts should be estimated on the basis of the initial costs as these can be distributed over the years in relation to the life length of each system.
The annual operating costs of a well-maintained network are about 10 to 20 per cent of the initial costs. The operating costs are rarely included in a realistic manner in the offers of the manufacturers and therefore often underestimated. For the initial costs, the part earmarked for the staff is rather small; for the operating costs, the corresponding parts for the staff and the material are of similar size. It is generally more important to spend the available resources for the infrastructure needed to maintain a small automatic network than to enlarge the network without such support.
3.2.1.4.4.4 Time needed for the establishment of an automatic observing network
(a) Time for development
When nNational Meteorological Services participate in the development of new sensors or complete automatic stations, they must normally ensure, through the use of prototypes and pilot series, that the technical specifications of the instruments have been fully respected; they must undertake compatibility tests in the field. Since complete field comparison of existing and new instruments should cover all four seasons, the minimum test duration is one year. After completing the evaluation of obtained data sets, the test results may require the redesign of the product. It may take years to successfully develop a product for use in the field. If it takes too long, the rapid progress of technology may overtake developments and the finished equipment may be obsolete by the time routine operations can start.
(b) Test operations
To realize a complex system such as an automatic measuring network, a good working team is indispensable. The time needed for completing test operations depends on the complexity and the scale of the network and also on the means at one's disposal. Depending upon the level of experience, it takes from about six months to one year for the

team to become familiar with the system. (This period becomes much longer if the operators of the network have not participated in the development and construction of the system.) After the completion of an automatic network and before routine operation and dissemination of the synoptic information on the international level, a period of learning and testing should take place. Testing also has to be carried out for any station of the network established subsequently. This is especially important for stations forming part of the rRegional bBasic sSynoptic nNetworks.
(c) Parallel operation with conventional stations
If previous long-standing climatological data series have to be extended in time by data provided by automatic synoptic stations, parallel measurements by conventional and automatic observationing methods are indispensable to assure the continuity of the records. One year of parallel measurements is not enough; three years are a minimum, and five years are preferable.
After full or partial automation of stations, it is often difficult to stimulate observers to make parallel observations or financial pressures may demand a reduction in the number of operating stations. In that case, sufficiently long parallel observations should be made at least at a selected number of automatic stations.
3.2.1.4.5 Operations
3.2.1.4.5.1 Time and frequency of observations
To use the full potential of automatic weather stations, the synoptic observations made at three-hourly intervals should be based at least on an hourly data acquisition cycle. For most meteorological parameters and for their applications, a measuring interval of a few minutes is ideal; if one also utilizes the data for real-time monitoring and warning purposes, this interval of a few minutes is even indispensable. In many countries a measuring interval of 10 minutes has become usual. That makes it possible to follow continuously the evolution of the weather and offers some possibilities for interpolation after a short failure of the system.
At partially automated stations a measuring cycle of 10 minutes permits a small shift of time between the automatic measuring and the complementary input by the observer, without strongly influencing the integrity of the synoptic message.
3.2.1.4.5.2 Elements of surface synoptic meteorological observations
When partially automated stations are used with an observer providing complementary observations of parameters which are not actually measured automatically, it could be preferable to make the human observations at a separate location (e.g. if the observer lives too far away from the station site). In such a case the observer can be equipped with a remote data entry device which allows him to contact the automatic stations at any time by telephone or HF transmission. Thus, the human observations are independent of the ones made automatically. However, the distance between the remote data entry device and the automatic station should not be more than 10 km, especially in mountainous regions in order to safeguard the consistency of the observations.
3.2.1.4.5.3 Safeguards against breakdown
Failures at the central processors of networks can paralyse a whole network or large parts of it. For reasons of safety, it is recommended that a double system of central

processors should be provided. Even for failures of the whole double system, procedures should be planned which will assure the continuation of some minimal functions of the real-time network.
At important surface synoptic stations, at least for those in the rRegional bBasic sSynoptic nNetwork, failures of the automatic data acquisition from the stations have to be compensated by an adequate emergency system. The observer, with the help of some alternative instrumentation, should be able to make measurements himself and to code and transmit the synoptic messages until the fault is repaired.
3.2.1.4.5.4 Monitoring and processing
To increase users' confidence in the reliability of information from an automatic network, it is necessary to institute a continuously operational near-real-time monitoring programme and thereby validate the quality of the data generated by the network.
The quality requirements for the pre-processing and processing control at automatic stations are set out in a general manner and for each variable in the Guide to Meteorological Instruments and Methods of Observation (WMO-No. 8), Chapter 1, Part II and Chapters 1, 2, 3, Part III. Further information about quality control at the observationing site and at data- collectiong centres can be found in Parts V and VI of the present Guide.
Data control and correction should be made as quickly as possible after their collection. This is especially true for automatic stations whose data contribute to long climatological data series. Timely processing of the data is only possible if the site and instrument characteristics of the parameters are still known. This intensive work should already be considered when planning the network.
3.2.1.4.5.5 Maintenance
The desirable considerations in setting up a maintenance organization for automatic stations and the principles to be followed in carrying out a maintenance programme are described in section 22.51.6, Chapter 1, Part II of the Guide to Meteorological Instruments and Methods of Observation (WMO-No. 8) .
Maintenance work should be done primarily by specially trained technical personnel. This staff is not always able to solve problems of the observer with the non-automatic observations or to notice possible deficiencies in the performance of the station. It is, therefore, useful for partially automated synoptic stations to be inspected by specially trained staff, independently of the technical maintenance work.
In a well-established system, modifications should generally be kept to a minimum. To improve the homogeneity and the continuity of an automatic network, inspections and most oft he preventive maintenance work should be done by a small (and always the same) team, as far as possible.
3.2.1.4.5.6 Training
The more complex the equipment, the more technical knowledge is required from people who will maintain and use the system. The rapid progress of technical developments makes regular training courses indispensable. The technical knowledge of the staff needs to be kept up by refresher courses from time to time, especially when the staff has had a change in duties and responsibilities.

Sections 22.7 and 24.21.8, Chapter 1, Part II of the Guide to Meteorological Instruments and Methods of Observation (WMO-No. 8) gives the general requirements for the training of observers.
At many partially automated synoptic stations, the observer will no longer have the same close relationship to his work as he formerly had with conventional measurements. In such cases, it is recommended that the observer be given instructions as to the necessity, importance and purpose of his new work along with practical examples of the value and use of the data his station provides.
3.2.1.4.5.7 Documentation
Detailed documentation is the basis for the international exchange of experiences with automatic weather observationing networks and should therefore be available at the time the network is established. The documentation should be obtained from the responsible authorities or the manufacturer, together with the equipment specifications.
The actions and conditions which influence the measurements at a weather station should be gathered in standardized documentation. Writing down all changes in the measuring conditions constitutes a complementary source of meteorological information and permits the user of the data to interpret the measurements correctly. With automatic measurements made over a long period of time, the events which should be recorded become so numerous that subsequent reconstruction is almost impossible.
Real-time automatic networks which permit dialogue between stations and the central processor of the network can also be used to provide documentation of all kinds. Observers or maintenance staff equipped with fixed or mobile data terminals for interactive communication can, inter alia,:
Obtain guidance for complex maintenance procedures at the station using information called up from the central station;
Record maintenance work which has been done or comments of the inspector. This information can be transmitted to the central processor of the network for storage;
Update automatically system tables containing the basic characteristics of the individual stations or update stock management files after installation, exchange removal or calibration of sensors;
Interrogate the observer handbook. If the handbook is centrally modified it is easier to keep up to date.
3.2.1.4.6 Automatic sea stations
(a) General
Automatic stations for provision of meteorological data from the oceans have in recent years become an important and reliable tool for collecting data, especially from such remote areas as the Polar Regions. The general considerations applicable to automatic land stations (section 3.2.1.4) are also largely valid for automatic sea stations. Problems of reliability of the station are also generally similar.
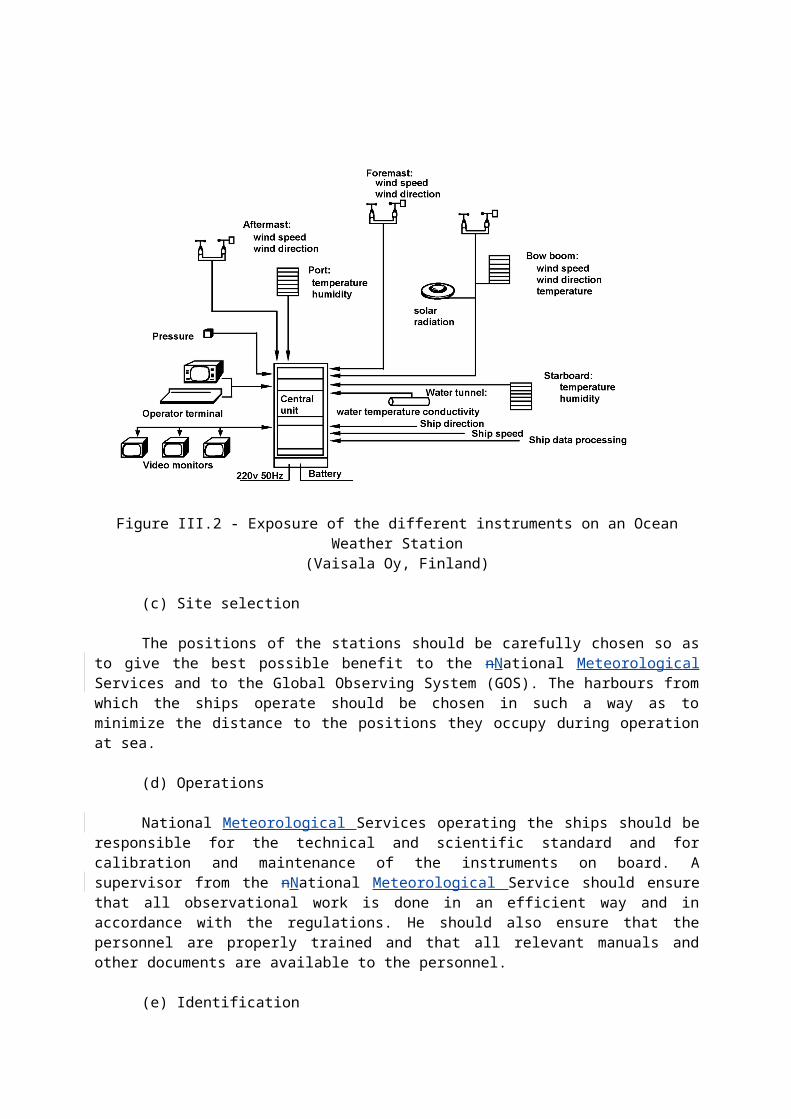
Moored and drifting buoys are used with automatic stations to provide data from sea areas where few or no mobile ships operate. A striking example is the large-scale drifting buoy system operated in the oceans of the southern hemisphere and, to a smaller extent, in other oceanic areas during the Global Weather Experiment (FGGE). A mobile ship observationing programme may also be fully automatedic, but it is advisable to provide for manual insertion of data in the system (see section 3.2.1.3.3.3 (d)). In general, automatic sea stations supervised and supplemented by human observers (when possible) are recommended for several reasons: the overall reliability is improved, sensors and other vital parts can be replaced quickly and efficiently, and costs for manned stations are reduced due to smaller staff.
Stations in some parts of the globe such as the Arctic and Antarctic rRegions, isolated islands and drifting buoys (on ice and sea) are difficult to visit for repair and replacement in case of failure. Reliability is therefore even more essential than for land stations. Full duplication is the best solution, but a rather expensive one. For drifting buoys, duplication means simply deploying two buoys instead of one. By making the buoy very simple, with only a few sensors (e.g. pressure, temperature), the risk of malfunction is kept low.
(b) Site selection
Isolated unpopulated islands and relatively inaccessible coastal regions are natural sites for automatic stations. Members could improve their national network in an efficient and inexpensive way by establishing such stations, which might also make an important contribution to the regional and global network.
Moored buoys infixed positions in ocean or coastal areas may also be sites for meteorological observations. Members should be aware and take advantage of the planning and deployment of such buoys by others (such as oceanographic institutes); reciprocally, when such buoys are operated by a Meteorological Service the latter should offer to carry oceanographic sensors on board. This may also be valid to some extent for drifting buoys.
Fixed platforms may also be selected for fully automatedic stations.
Coastal stations may also be automatic or semi-automatic if personnel are available for manual observations of additional parameters.
Lightship stations could be automated in the same way if they are unmanned or inadequately manned.
Relatively large ice floes provide excellent sites for automatic stations, and the network of ice buoys should be operated in the Polar Regions individually or jointly by Members.
Drifting buoys with automatic stations provide an efficient way of obtaining meteorological information from the high seas. Members should jointly plan deployments to obtain a desirable network.
(c) Station design
An automatic sea station should normally consist of:
(i) A number of sensors for the different parameters to be measured or
observed;
(ii) A microprocessor to handle the sensor output;
(iii) A transmitter for radio or line communication.
For automatic lightship, island and coastal stations, the exposure of the meteorological sensors should be the same as for manned stations, if possible.
The exposure of instruments (sensors) on fixed platform stations has been dealt with in section 3.2.1.3.2.3. The exposure should be taken into account in the planning/construction phase of a platform. It should be negotiated between the platform owner and the nNational Meteorological Service. A drilling or production platform (offshore) is a very sophisticated structure with sophisticated equipment on board, including computers. It would be wise to connect the meteorological sensors to an on-board computer with the necessary software to handle the raw data and convert them to meteorological parameters and to code the information in the relevant WMO codes or transmission to a coastal radio station.
Drifting buoys for the oceans or for deployment on ice floes (ice buoys) can have different designs; for most meteorological purposes a simple version is sufficient. A sketch of a typical simple drifting buoy is given in Fig III.7. Like the FGGE buoys, these have sensors for two parameters only. A drogue is generally used to minimize the drift of the buoy.
More sophisticated buoys may have a number of sensors, for example to make wind measurements. If so, the hull must be much larger (taller) and consequently much more expensive. The ice buoys generally resemble drifting buoys except for the hull, which in the former is designed to rest on an ice surface.
(d) Observingational programme
In accordance with Regulation 2.4.2.1.9 2.3.3.16,contained in Part III, Volume I of the Manual on the GOS (WMO-No. 544) , a surface synoptic observation from a principal fixed automatic sea station shall consist of:
Atmospheric pressure Wind direction and speed Air temperature Sea temperature
In addition, and if possible, observation of sea state (waves) and information on precipitation (only yes or no and especially in tropical areas) should be included.
For a drifting automatic sea station, the relevant regulation provides for a relaxation of the programme and as many as possible of the elements prescribed for fixed automatic stations should be reported.
Observing Pprogrammes for a typical simple drifting buoy consists of observing only two parameters: atmospheric pressure and sea temperature. If the buoy has a microprocessor, the pressure tendency and characteristic of the tendency may be given as well. For oceanographic purposes it is possible to add a thermistor chain for measuring sea temperatures at different depths; it is also possible to add a thermistor chain to the ice buoys if a hole is drilled through the ice. Generally, a surface synoptic observation should by done in accordance with Regulation 2.3.3.17, Part III, the Manual on the GOS (WMO-No. 544),

Volume I.
Figure III.7 - Typical simple drifting buoy
The observingational programmes presented above for automatic sea stations must be regarded as minimum requirements. Large automatic stations, especially those which are supervised daily, should also, if possible, give height of cloud base, visibility and computed pressure tendency and characteristic, and amount of precipitation.
The larger drifting and moored (often combined oceanographic-meteorological) buoys may have a more extensive observing programme including, for instance, wind measurements.
(e) Network organization
In the organization of a network of sea stations it is advantageous to use automatic means; in many cases automatic observing stations are the only solution. In a number of cases it is preferable to have "hybrid" stations where manual observations are used together with automatic sensor output to obtain a complete set of observations (as for some ships). A network will in general consist of both manual and automated stations.
Fixed platforms, lightships and coastal stations may be isolated automated stations in an otherwise conventional network and be an integrated part of national, regional and global networks.
Automated ice-floe stations (ice buoys) and drifting buoys are specialized and totally

automated networks to provide data from remote and otherwise data-empty areas.
By introducing automatic means for new stations or for automating conventional stations, Members could contribute to maintaining and/or improving the total network for national, regional and global purposes.
Members should, through suitable joint organizations or arrangements, try to establish a network of drifting buoys in critical sea areas. When planning such a network, knowledge of the wind systems in the sea areas in question is essential. Outside the tropical areas it is in general sufficient to compute the mean geostrophic wind for each month. The drift paths of free drifting buoys can then be determined with sufficient accuracy for planning deployments. This was done for the FGGE in the southern hemisphere and has also been done for the North Atlantic with success.
(f) Logistics
Electrical power must be available, preferably by power-generating equipment like solar cells. If batteries are used they should last at least one year (two years for drifting buoys and three for ice-buoys);
Telecommunication facilities must be available. For automatic sea stations this generally means an automatic radio transmitter with suitable antenna for communication directly with a land radio station or through satellites;
Service, maintenance and supplies must be taken care of by the operating agency;
Specially trained staff must be available to plan maintain and monitor the operations properly.
To maintain a certain number of buoys (ice buoys and drifting buoys) within a specified area, it is necessary to make successive deployments. The effective operation of a buoy network is, therefore, dependent on available ships (aircraft for the ice buoys). For the drifting buoys, it is possible to use ships of opportunity; it is also possible to deploy drifting buoys from low-level aircraft.
Buoys drifting out of the desired area or no longer functioning properly can be recovered and re-used. One of the advantages of simple buoys, however, is that, because of the relatively low cost, they may be regarded as expendables.
(g) Coding and communications
The data processing and coding can be made at the automatic station itself by a microprocessor, or at a central receiving station and processing centre. The latter method is recommended because the automatic station can then be made very simple. The raw data from the sensors are transmitted directly, reduced and calibrated at the central station and correctly coded for further dissemination over the GTS.
For the simple drifting buoys, the pressure tendency (three hours) and the characteristic of the tendency can be given in addition to the pressure. This requires a microprocessor to do some handling, including storage of the sensor output.
The communications for automatic coastal stations may be achieved by land line, radio (VHF or UHF) or direct satellite link (geostationary or polar orbiting). The data can be
retransmitted via the satellite to local users with a receiving station, or disseminated over the GTS from the large main ground stations for the satellites. The drifting and ice buoys' communication link is mainly through polar-orbiting satellites because this makes it possible to determine the position of the transmitting buoy at the same time. A platform telemetry transmitter (PTT) (see Figure III. 7) is preset for dissemination at fixed intervals (usually every 60 seconds). The satellite must have at least four different contacts with the buoy PTT at each pass to obtain sufficient data for proper location. Because the Doppler shift in the frequency is transmitted together with the sensor data, the stability of the PTT circuits must be ensured. Data obtained in this way are essentially asynoptic.
The ARGOS system for determining the location of drifting buoys and for collectiong the data via satellites provides a very effective means of taking full advantage of drifting buoys. A special tariff is negotiated by WMO with the agency responsible for administering the ARGOS system for the benefit of interested Members, permitting a reduction in the cost of acquisition of data from buoys and other automatic stations.
(h) Personnel
It should be borne in mind that the implementation of an automated network needs a considerable number of well-qualified personnel to keep the systems operating properly. This is sometimes overlooked, with the unfortunate result that expensive equipment becomes useless. This is the most important advice to Members planning a network of automatic sea stations.
3.2.2 Observations/measurements
3.2.2.1 General
3.2.2.1.1 Time and frequency of observations
Regulations 2.4.3.1.1 2.3.1.3 and 2.4.3.1.2 2.3.1.4 contained in Part III, Volume I of the Manual on the GOS (WMO-No. 544) specify that the main standard times for surface synoptic observations shall be 0000, 0600, 1200 and 1800 UTC, while the intermediate standard times for these observations shall be 0300, 0900, 1500 and 2100 UTC. The mandatory and/or recommended times of observation at different types of surface synoptic stations (principal land station, fixed sea station, mobile sea station, principal automatic station, etc.) are given in sections 2.4.3 2.3.2 and 2.3.3, Part III, Volume I of the Manual on the GOS (WMO-No. 544).
3.2.2.1.2 Observingational programme
The various elements comprising surface synoptic observations required to be made at different types of stations (e.g. principal land station, ocean weather station, mobile ship stations automatic stations on land and at sea) are given in Regulations 2.4.2.1 2.3.2.9, 2.3.2.10 and 2.3.3.11 - 2.3.3.16 contained in Part III, Volume I of the Manual on the GOS (WMO-No. 544). Some additional guidance material for the observation/measurement of each of these elements is given below. For convenience, the information is provided separately for land stations and sea stations, although for some elements the rules to be followed are the same in both cases.
3.2.2.2 Observations at land stations

Meteorological elements that shall be observed and recorded at a manned synoptic land station are defined in the Manual on the GOS, (WMO-No. 544), Volume I, Part III, section 2.3.2.9. They are as follows:
3.2.2.2.1 Present and past weather
The specifications used for present and past weather shall be those given in the Manual on Codes (WMO-No. 306), Volume I.1, Part A, code form FM 12-IXI SYNOP). The specifications used for atmospheric phenomena shall be those given in the same publication under the definition of "weather". Additional specifications and descriptions of all types of weather phenomena given in the International Cloud Atlas (WMO-No. 407) should also be adhered to, i.e. hydrometeors (precipitation), lithometeors, electrometeors (electrical phenomena) and photometeors (optical phenomena).
Observations of weather and atmospheric phenomena are mainly made visually.
Principal lLand stations shall make round the clock observations of the weather, including atmospheric phenomena. Other surface stations should do so to the extent possible. The frequency of observations of atmospheric phenomena (in between the standard observation times) should be such as to cover even short duration and non-intensive phenomena.
During observations, the following steps must be taken:
(a) Note the type and intensity of atmospheric phenomena (strong, moderate, weak)(light, moderate, heavy);
(b) Record the time of the beginning, change in intensity and end of the phenomena in hours and minutes;
(c) Observe likewise the station’s closest surroundings.
It is also recommended that the following steps be taken:
(d) Monitor the changing state of the atmosphere as a composite whole (development of cloud, changes in wind, sharp changes in atmospheric pressure, visibility, etc.);
(e) Correlate the type of precipitation and electrometeors with the cloud types, phenomena reducing visibility with the visibility value, the type of snowstorm phenomenon with wind speed and snowfall intensity, etc.
The observations of weather and phenomena are recorded in the appropriate part of the log- book for surface meteorological observations. When the observations are recorded, it is recommended that the conventional symbols given in the WMO Technical Regulations (WMO-No. 49) be used.
3.2.2.2.2 Wind direction and speed
The following should be measured:
(a) Mean wind speed at the time of observation;
(b) Mean wind direction at the time of observation;
(c) Maximum wind speed at the time of observation;
(d) Maximum wind speed in between standard observation times.
The wind instruments to be used, their height, the averaging period for the observation and the method of estimation in the absence of instruments are given in the Manual on the GOS (WMO-No. 544) , Volume I, (Part III, section 2.4.4.7 3.3.5, Part III) and in the Manual on Codes (WMO-No. 306) , Volume I.1, Part A (section 12.2.2.3).
Principal lLand stations shall read the mean wind direction clockwise from the geographical (true) meridian as the direction from which the wind is blowing. For this purpose, the instruments shall be oriented exactly along the geographical meridian. This orientation should be systematically checked, as should the verticality of the equipment's mast and instruments, and corrected where necessary.
During observations, the following shall be strictly adhered to:
(a) Prescribed time for the measurements;
(b) Averaging period for the wind characteristics;
(c) Permissible accuracy Uncertainty for the readings: (- speed: up to 1±0.5 m.s-1 for ≤ 5 m.s-1 and ±10 % for > 5 m.s- 1; - direction: 10° or 22.5° in the case of a wind vane ≤ 5 %).
All wind measurements should be recorded in the log- book for surface meteorological observations.
All wind equipment should be installed on special masts allowing access to the equipment. It must be possible either to lower the upper part of the mast, or the mast must be fitted with metal crossbars or rungs.
A preventive check should be carried out once a year on the wind vane: the vane should be removed from its spindle and cleaned, the weight of the fin checked (permissible error ±1 per cent) and the vane recoated with black lacquer. If the pivot bearing (the upper part of the spindle, screwed into the mast) is worn, it should be unscrewed and remachined.
NOTE: The averaging of wind direction is straightforward in principle, but a difficulty arises in that a 0° - 360° scale has a discontinuity at 0°. As an extreme example, the average of 1° and 359° is 180°. This presents no difficulty to an observer making a continuous recording of wind direction, but automatic computation devices must be provided with some means to resolve the ambiguity.
3.2.2.2.3 Amount of cCloud amount, type of cloud and height of cloud base
Cloud amount should be determined according to the degree of cloud over the visible celestial dome in tenths or octas with an accuracy uncertainty of one unit.
For visual observations of cloud types, the tables of classification, definitions and descriptions of types, species and varieties of clouds as given in the International Cloud Atlas (WMO-No. 407), Volume I - Manual on the Observation of Clouds and Other Meteors (Annex I to the WMO Technical Regulations) shall be used.

Height of cloud base should preferably be determined by measurement. The technical means for measuring can be based on several methods, such as light-pulse location and lasers. Pilot-balloons can also be used, launched from the ground.
The following recommendations are made for cloud observations:
(a) The site for the observations should be as unobstructed as possible in order to be able to see the maximum amount of the celestial concave;
(b) In order to determine the cloud species and types correctly, their evolution should be monitored systematically both at and between the observation times;
(c) Cloud amount should be determined both as a total for all layers (total cloud amount) and individually for only the lowest each significant cloud layer (low cloud amount) in order to meet the requirements of code form FM 12-IXI SYNOP (Manual on Codes, (WMO-No. 306), Volume I.1, Part A ) ;
(d) At night, the determination of cloud species should be correlated to the nature of precipitation and with optical and other phenomena.
Cloud observations should be recorded in the Iog-book for surface observations in sufficient detail to permit the observations to be reported in code form FM 12-IXI SYNOP (Manual on Codes, (WMO-No. 306), Volume I.1, Part A).
3.2.2.2.4 Visibility
Meteorological visibility by day and meteorological visibility at night are defined as the greatest distance at which a black object of suitable dimensions (located on the ground) can be seen and recognized when observed against the horizon sky during daylight or could be seen and recognized during the night if the general illumination were raised to the normal daylight level. The essential meteorological quantity, which is the transparency of the atmosphere, can be measured objectively, and is represented by the meteorological optical range (MOR).
Surface synoptic stations shall measure or determine the meteorological (horizontal) visualoptical range (MVOR). Other visibility characteristics can be measured at aerodromes and from aircraft, e.g. runway visual range, slant visual range etc.
NOTES: 1. MVR is a characteristic of the atmosphere's transparency which is understood to be identical with the concept of meteorological optical range (MOR).
2. Other visibility characteristics may be measured at aerodromes and from aircraft, e.g. slant visibility, visibility of real objects, etc.
The recommended range for measuring visibility is from below 50 m to above 50 km. Measurements in the range from 100 m to 6 km are compulsory.
Meteorological visual range should preferably be determined, using a visibility measuring instrument, both in the daytime and at night. Visibility measuring (recording) instruments are based on several measuring methods: photometers, nephelometers and transmissometers. Each of the instruments shall satisfy the requirements laid down in the Guide to Meteorological Instruments and Methods of Observation (WMO-No. 8).
Visual estimation and instrumental measurement of the meteorological optical range
are describe in detail in the Guide to Meteorological Instruments and Methods of Observation (WMO-No. 8), Chapter 9, Part I.
The meteorological visual range may be determined visually using natural as well as man-made objects (screens and lights). Both kinds of objects shall correspond to the requirements for angular dimensions, colour (brightness) and background against which they are seen, as laid down in the Guide to Meteorological Instruments and Methods of Observation (WMO-No. 8).
The objects for estimation of MOR by day shallshould be spaced at standard distances enabling determination of the visibility value in accordance with the Code table 4377 (Horizontal visibility at surface), given in the Manual on Codes (WMO-No. 306), Volume I.1, Part A. The distances up to the objects (L) shallshould be measured instrumentally.
When determining visibility using lights, the observations must be made according to identical sources of (not coloured) light, taking into account their strength.
The following exceptions are allowed:
(a) Determination of visibility in the daytime according to an incomplete selection. Objects by determining the amount of superimposition of light-air haze on the last visible object as follows:
Visibility table (daytime)
Qualitative characteristics of object, visibility and atmosphere
Degree of haze
MVR value
No visible haze. The object can be clearly seen as a dark grey silhouette against a background of sky
Haze obscures the object so that individual details and natural colouring are almost indistinguishable
Significant degree of haze. The object is clearly darker than the sky – its brightness is less than that of the sky
The object is visible as a silhouette, can be easily found and recognized, but is little different from the sky in colour and brightness
The object is scarcely distinguishable through its covering of haze, is difficult to find and can easily be lost from view
0
1
2
3
4
10 L
5 L
2.5 L
1.5 L
L
(b) Determination of visibility in the nighttime by estimating the intensity of atmospheric phenomena (precipitation, snowstorms, haze, fog, etc.), as follows:
Visibility table (nighttime)(Tenths of kilometres)

IntensityAtmospheric phenomenon Strong Moderate Weak
FogMistSnowstorm (blizzard)Snow showerDust stormSnowstorm with snowfallHazeSnow, snow pellets, snow grainsBlowing snowDrizzleRain
0-00-30-30-30-34454-5
1-241-2-4445556
35-63--55-66667
When making observations the following requirements must be met:
(a) Bring the observer's vision up to normal;
(b) Allow for variations in the brightness characteristics of the object (snow and rime cover, illumination by the sun, state of leaves on trees, etc.);
(c) Observations must always be made from the same place;
(d) The results obtained should have sufficient accuracy to permit transmission of the data in accordance with code table 4377 given in the Manual on Codes (WMO-No. 306).
Observations of visibility (meteorological visual optical range) should be recorded in the log- book for surface meteorological observations. In the case of instrumental measurements, this should be invisibility values (in kilometres and tenths of kilometres up to 5 km, with an accuracy of 1 km as far as the first 30 km and beyond that with an accuracy of up to 5 km). In the case of visual observations, measurements should be in “standard” values or in current figures (see in three different steps in accordance with cCode table 4377 in the Manual on Codes (WMO-No. 306), Volume I.1, Part A.
3.2.2.2.5 Air temperature
The methods and instruments for measurement of air temperature at surface station are described in the Guide to Meteorological Instruments and Methods of Observation (WMO-No. 8), Chapter 2, Part I.
Surface stations shall measure the following characteristics of air temperature:
(a) Temperature at the time of observation;
(b) Maximum temperature (highest temperature over a prescribed period of time, e.g. 12 or 24 hours);
(c) Minimum temperature (lowest temperature over a prescribed period of time, e.g. 12 or 24 hours).
Extreme (maximum and minimum) temperatures, when required by regional

associations, shall be measured at a minimum of two of the standard times (main or intermediate) with a 12-hour interval between each; these roughly corresponding to the morning and evening local time at the observationing site (station).
Thermometer screens should be constructed in a way which allows free influx of air into the screen so as to minimize radiation effects.
Instruments (sensors) for measuring and/or recording air temperature can be based on various methods: liquid, metallic, thermocouples and others. Each of the instruments shall meet the requirements laid down in the Guide to Meteorological Instruments and Methods of Observation (WMO-No. 8).
Air temperatures at surface stations are generally measured using mercury in glass and spirit thermometers (psychrometric, maximum and minimum thermometers).
When making observations:
(a) Readings from psychrometric, maximum and minimum thermometers must be taken with an accuracy of 0.1° C (K);
(b) The readings from other instruments shall be such as to produce results in 0.1° C
(K);
(c) At stations where strong frosts are observed, mercury thermometers must be replaced in good time with low temperature spirit thermometers;
NOTE: Members may establish, in addition, other times for measuring extreme temperatures and may record the temperature continuously.
(d) It is recommended that thermometers be read in such a way that the sighting line is perpendicular to the capillary and passes through the top of the meniscus of a mercury column or the bottom of a spirit meniscus. Before the thermometer is read, it must be checked that there has been no rebound (detachment) of the mercury in maximum thermometers and that the pin of a minimum thermometer is in spirit. A maximum thermometer should be shaken down in one smooth movement finishing with a sharp flick, and should be held so that the top part projects 6 to 8 cm from the hand with the scale in the plane of movement.
The measurement results, together with corrections, shall be recorded in the log -book for surface meteorological observations.
3.2.2.2.6 Humidity
The methods and instruments for measurement of atmospheric humidity at surface station are described in the Guide to Meteorological Instruments and Methods of Observation (WMO-No. 8), Chapter 4, Part I.
Land stations shall measure or calculate:
(a) Water vVapour pressure (partial pressure of water vapour) in moist air;
(b) Relative humidity (of moist air);

(c) Dew-point temperature.
The methods for measuring air humidity fall into five main classes as follows:
(a) Thermodynamic method (psychrometers);
(b) Method using the change in dimensions of hygroscopic substances (hair hygrometers);
(c) Methods using the change of electrical properties due to absorption or adsorption;
(d) Condensation method (dew- or frost-point hygrometers);
(e) Remote-sensing techniques.
Instruments using any of these methods should meet the requirements laid down in the Guide to Meteorological Instruments and Methods of Observation (WMO-No. 8).
Atmospheric humidity at surface stations is generally measured using stationary psychrometers and/or hair hygrometers. At land station, the most commonly used instruments for measurement of humidity are psychrometer and hair hygrometer.
Attention should be given to the following points:
(a) Readings from psychrometric thermometers shall be taken an accuracy of 0.1° C (K);
NOTE: Members may measure and calculate other characteristics of air humidity in accordance with the specifications of water vapour in the atmosphere given in the Manual on the GOS (WMO-No. 544) as well as make a continuous recording of air humidity values.
(b) Readings from a hygrometer scale shall be taken to an accuracy of 1 per cent of relative humidity;
(c) The readings from other instruments shall give dew point to 0.1° C (K), relative humidity to 1 per cent and corresponding values for other characteristics of air humidity;
(d) It shall be ensured that the thermometers of a psychrometer are identical (in shape
and bulb dimension);
(e) Psychrometer maintenance should include regular changing of the gauze around the bulb of the wet thermometer, and topping up the reservoir with water at appropriate times. The gauze should be in close contact with the thermometer bulb and should cover it in one layer (overlap should not exceed one-quarter of the length). The wick underneath the bulb must not be drawn too tight. Correct "wetting" of psychrometric thermometers shall be ensured as follows: distilled or well-filtered pure water obtained by melting snow shall be used, the psychrometer shall receive additional wetting before the observing time in dry weather, and wetting shall be carried out carefully as temperatures fall through 0° C;
(f) In places where the air is very dusty, the wet thermometer bulb and gauze may be

kept in the distilled water reservoir between observation times to prevent the gauze becoming dirty, Ten minutes before readings are taken, the reservoir is placed in its normal position (the top of the reservoir must be 2 cm below the bulb of the wet thermometer);
(g) The hygrometer should be maintained (ensuring the cleanliness of the hair, elimination of frost, etc.);
(h) Special precautions should be taken to ensure that the appropriate psychrometric
table (International Meteorological Tables, WMO-No. 188) is used with whatever type of psychrometer is applied (with or without forced ventilation) and that the instrument conforms with the conditions for which the table is calculated (whether the wet bulb is covered with ice or supercooled water in the case of wet-bulb temperatures below the freezing point).
NOTE: The recommendations for the proper observational procedures and the maintenance of psychrometers can be found in the Guide to Meteorological Instruments and Methods of Observation (WMO-No. 8).
The instrument readings shall be recorded at thea time of observation measurement time in the log- book for surface meteorological observations. The Ccalculated characteristics of relativeatmospheric humidity shall also be recorded there.
3.2.2.2.7 Atmospheric pressure
The methods and instruments for measurement of atmospheric pressure at surface station are described in the Guide to Meteorological Instruments and Methods of Observation (WMO-No. 8), Chapter 3, Part I.
The requirements with regard to the measurement of atmospheric pressure, the procedure to be followed for the reduction of the pressure to mean sea level and, in the case of high-level stations, for reporting the geopotential height of an agreed standard isobaric surface in accordance with the relevant decisionResolution of the rRegional aAssociation, are given in the Manual on the GOS (WMO-No. 544) , Volume I, Regulation 3.3.2, Part III, and in the Manual on Codes (WMO-No. 306), Volume I.1, Part A, Regulation 12.2.3.4.2 and C ode table 0264. It should also be noted that the observation of the atmospheric pressure should be made at exactly the standard time for the surface synoptic observation (defined in paragraph 3.2.2.1 above).
The pressure tendency shall be determined from the values of atmospheric pressure measured from a barometer, and be expressed as the difference between these values during the three hours preceding the time of observation. It is permitted to calculate the pressure tendency from the barograph readings as the difference between the readings taken from the recorded curve (plotted around the clock) at corresponding observing times (every three hours).
The characteristic of pressure tendency shall be determined with the appropriate sign (rise = sign "+" or fall = sign "-") when taken from a barometer and with the type of curve when taken from a barograph. The characteristic of pressure tendency shall be designated according to the table given in the Manual on Codes.

The location of the barometer at the station should be selected with great care. The main requirements of the place of exposure are: uniform temperature, solid and vertical mounting, protection against rough handling, good light. The instrument should preferably be placed in a room with constant temperature shielded from direct sunlight at all times, mounted on a solid wall, with the mercury column vertical. The same requirements apply to aneroid barometers but, in addition, the instrument should always be read in the same position (vertical or horizontal) as it had when being calibrated.
It is recommended that instruments for measuring pressure should be placed in easily accessible sites and should be well lighted at the measuring times. The instruments shall not be subjected to direct sunlight or to sudden changes in temperature at the site.
It is recommended that a wooden case with a glass front should be constructed for the barometer and attached to a main wall so that the working part of the barometer scale for any given station is at eye level. The case should be attached to the wall using thick bars so that an electric bulb can be placed behind it. The back of the case should have an opening covered with frosted glass for similar material through which the barometer is lit when readings are taken. Otherwise, a portable lamp with a reflector may be used to shed light on the barometer, in which case a sheet of white paper is attached to the back wall of the case behind the barometer. It is recommended that a basin be placed in the cupboard underneath the barometer to catch any mercury which may escape from the barometer if it is damaged.
The transportation, installation, removal and checking of the station barometer is carried out by a specially authorized person (for example, an inspector). The station barometer shall be regularly checked. (It is recommended that this should be done during routine inspections of the station.)
When carrying out the measurements, the observer should direct his eyes in such a way that the sighting line to the top of the mercury meniscus in the barometer is strictly horizontal.
All of the readings shall have an accuracy uncertainty of 0.1 (mm Hg, hPa).
Three corrections are made to readings taken from a mercury barometer: an instrumental correction (given by the calibration centre), correction for gravity and correction for temperature. In practice, these corrections are taken from a table.
The direct reading of atmospheric pressure from a barometer should be recorded in the log- book for surface meteorological observations. The corrected station-level atmospheric pressure should also be recorded in the log- book as well as the calculated sea-level pressure (or height of the isobaric surface), the calculated pressure tendency and its characteristic.
Continuous recording of atmospheric pressure using a barograph is done on paper tapes (or other kinds of tape) using special ink (or by some other means).
The pressure tendency shall be determined from the values of atmospheric pressure measured from a barometer, and be expressed as the difference between these values during the three hours preceding the time of observation. It is permitted to calculate the pressure tendency from the barograph readings as the difference between the readings taken from the recorded curve (plotted around the clock) at corresponding observing times (every three hours).
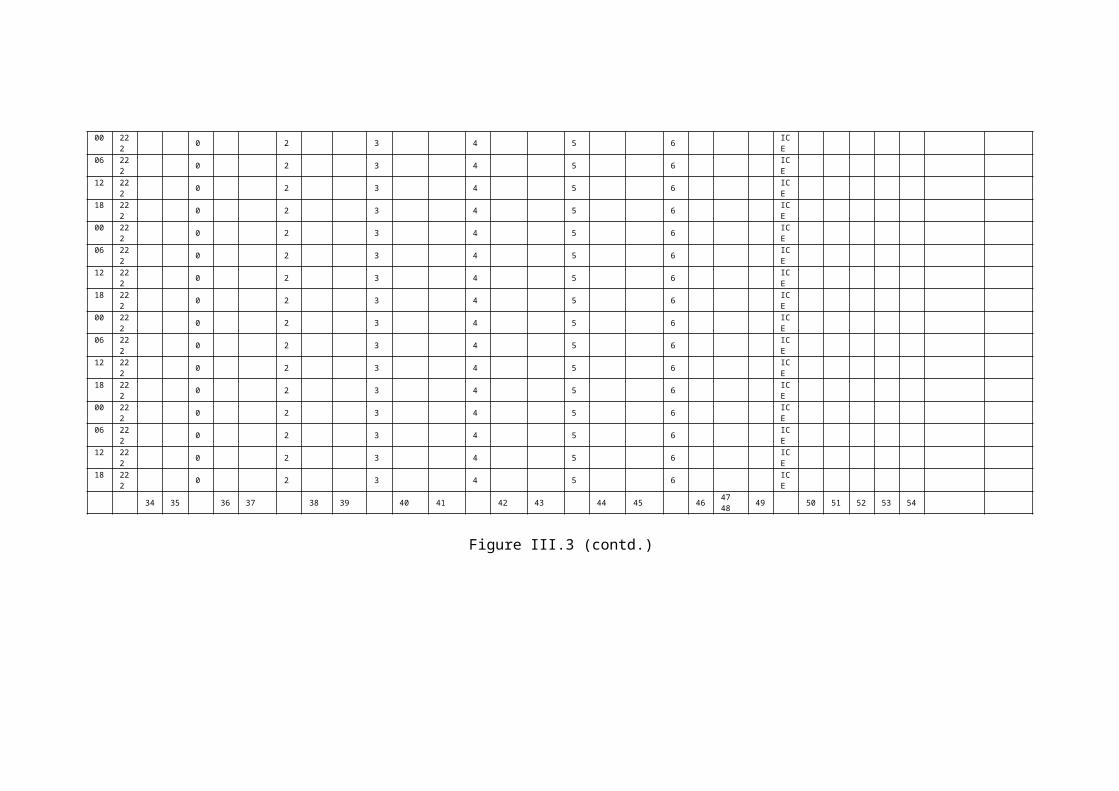
The characteristic of pressure tendency shall be determined with the appropriate sign (rise = sign "+" or fall = sign "-") when taken from a barometer and with the type of curve when taken from a barograph.
The characteristic of pressure tendency shall be designated according to Code table 0200 in the Manual on Codes (WMO-No. 306) , Volume I.1, Part A.
3.2.2.2.8 Amount of precipitation
The methods and instruments for measurement of precipitation at surface station are described in the Guide to Meteorological Instruments and Methods of Observation (WMO-No. 8), Chapter 6, Part I.
Surface stations shall, when required by regional associations, measure amount of precipitation and may also determine other characteristics of precipitation (e.g. duration and intensity). The amount of precipitation shall be measured at a minimum of two standard times (main or intermediate), 12 hours apart and roughly corresponding to the morning and evening local time at the observationing site (station).
NOTE: Members may establish, in addition, other times for precipitation measurements and carry out continuous recording both of liquid and solid precipitation.
Rain gauges are used for measuring the amount of precipitation. The type and exposure of the rain gauges and the material of which they are made should be chosen in such a way as to reduce to a minimum the influence of wind, evaporation, wetting of the glass and splashing.
To provide a continuous record of the rainfall, recording rain gauges (pluviographs) are used.
The recommended height for installing rain gauges (receiving surface) are as follows:
(a) For measuring solid precipitation - between 1.25 and 2 m above the ground or snow cover;
(b) For measuring liquid precipitation - from the ground ("pit" rain gauge) to 2 m.
In making the observations, the following accuracies are permitted:
(a) An amount of precipitation not exceeding 10 mm should, be read to 0.2 mm and larger amounts with an accuracy of up to 2 per cent of the total;
(b) If solid precipitation has not melted before the reporting time, the amount maybe determined using a weighing machine with an accuracy of 1-2 g (snow gauge weighing apparatus may be used). To this end, the weight of the rain gauge vessel should be known. After solid precipitation melts, the amount must be measured using a rain measure and the result noted in the log- book;
(c) Corrections must be introduced for systematic error in the data, i.e. wetting of the rain measure.
The measurements (together with corrections) shall be recorded in the log- book for surface meteorological observations.

3.2.2.2.9 State of ground
Land stations shall, when required by regional associations, determine the following at the morning observation time when the minimum temperature is measured, provided that in winter there is enough light:
(a) State of ground (without snow or measurable ice cover);
(b) State of ground (with snow or measurable ice cover).
The state of the ground without or with snow (or measurable ice cover) isshould be determined visually in accordance with the specifications given in Code tables 0901 and 0975 of the Manual on Codes (WMO-No. 306), Volume I.1, Part A , which are self-explanatory.
The observations should meet the following requirements:
(a) In the absence of snow or measurable ice cover, the state of the ground is determined in the meteorological instrument area, at the spot where the thermometers are installed for measuring the temperature of the surface, where the ground is free of plant cover (bare ground);
(b) The state of the ground and the snow (or ice) cover shall be determined in such a way as to characterize the station's environment (i.e. covering the visible Earth's surfacean open representative area). Consequently, the observations must always be made from the same (preferably raised) place through a visual survey of the area (Earth's surface) surrounding the station (meteorological instrument area).
The observations shall be recorded in the log- book for surface meteorological observations. The recording can be in words, abbreviated conventional signs and in the code figures for code form FM 12-IXI SYNOP (see the Manual on Codes (WMO-No. 306), Volume I.1, Part A).
3.2.2.2.10 Direction of cloud motion movement
Surface stations shall, when required by regional associations or by national decisions, determine the direction of the cloud motion movement. The direction of movement of a cloud may be estimated visually. It may also be determined, together with its angular velocity about a point on the ground directly below it, by a nephoscope.
3.2.2.2.11 Special phenomena
Surface stations should observe special phenomena which are generally called dangerous or extremely dangerous (catastrophic) weather phenomena on an uninterrupted, round-the-clock basis whenever possible.
These special phenomena hamper industrial activity and other daily activities and frequently cause significant losses to industry and the population. In order to prevent or reduce losses, appropriate observations should be made at the stations.
Special phenomena may comprise:

(a) Large values of the usual meteorological variables (e.g. strong wind, considerable rainfall, drop in air temperature during the transitional periods below 0° - frosts);
(b) Unfavourable combinations of variables (e.g. high temperatures and low air humidity leading to droughts);
(c) Exceptionally long-lasting atmospheric phenomena (e.g. fog or snow storms);
(d) Individual rare phenomena (e.g. hail tornadoes and others).
In practice, the lists of special phenomena which are dangerous or extreme in nature are established by the Members, together with the relevant criteria (threshold values).
Principal lLand stations shall ensure measurement or observation of the main phenomena given in the Manual on Codes (WMO-No. 306), Volume I.1, Part A, code form FM 12-IXI SYNOP, section 3 as specified in Code table 3778.
Other special phenomena are determined and established by Members depending on local conditions.
The following recommendations are made for observations of special phenomena:
(a) Measurements should be made using instruments which have a sufficient range (scale) to be able to fix a rarely occurring value;
(b) Observers should be extremely attentive and mobile when there are signs of the approach of a special phenomenon;
(c) Observations may be made both at the station itself and in its vicinity, whilst data on the consequences of a special phenomenon may also be collected through a survey of local inhabitants.
Observations should be recorded in the log- book for surface meteorological observations in expanded form, preferably with a brief descriptive text written in a place specially reserved for this purpose.
Special phenomena of a catastrophic nature should be described in detail and their sequences should, as far as possible, be photographed (mapped, etc.). For this purpose, it is recommended that special instructions for the stations should be prepared by Members.
3.2.2.2.12 Automatedic measurements
As described in the Manual on the GOS (WMO-No. 544), the variables usually measured by automatic land stations for surface synoptic observations are), Volume I, Regulation 2.3.2.10, Part III, a surface synoptic observation at an automatic land station shall consist of observations of the following elements:
Atmospheric pressure; Wind direction and speed; Air Ttemperature; Humidity Precipitation, yes or no (at least in tropical areas);
and sometimes: together with the following elements which should be included if possible:
Amount and intensity of precipitation; Relative humidity or dew point Visibility; Optical extinction profile (Hheight of cloud base)*; Sunshine Solar radiation Special phenomena.
NOTE:*Height of cloud base and cloud extent could be derived directly from the optical extinction profile without further measurement, using one-minute time series.
Suitable sSensors and accuracy uncertainty requirements for automatic weather stations for synoptic meteorology are described in the Guide to Meteorological Instruments and Methods of Observation (WMO-No. 8), Chapter 1, Part II. Information on sampling and reduction methods can be found in Part V of the present Guide as well as in the Guide to Meteorological Instruments and Methods of Observation (WMO-No. 8), Chapters 1 and 2, Part III.
In general, the classical visual observations are difficult to replace by automatedic means, although in some cases new observationaling technology, such as satellites or remote-sounding techniques, can supply better information than those obtained by classical means. It is possible, however, to approach classical visual information by combining some automatically measured elements at land stations. Examples are given below.
(a) Present weather and past weather
Of the possible 99 code variations some of the most significant present weather and past weather types may, with the development of suitable algorithms, be automatically reported by using the combination of outputs of different common automatic sensors like precipitation sensor, thermometer, lightning counter and anemometer, e.g. ww: 17, 18, 21, 22, 29, 51, 61, 63, 71, 73, 75, 91, 92, 95, 97;
Distinction between solid and liquid precipitation with the help of melting power used in precipitation gauges;
(b) Cloud information
Interpretation of the gradient of air temperature near the ground (e.g. difference of temperature between 2 m and 5 cm above ground, for example) to estimate the total amount of clouds amount;
Evaluation of radiation and illumination measurements to derive information about the development of cloud cover.
3.2.2.3 Observations at sea stations

Meteorological elements that shall be observed and recorded at an ocean weather station are defined in Manual on the GOS, (WMO-No. 544), Volume I, Regulation 2.3.3.11, Part III. They are described in the following paragraphs 3.2.2.3.1 -3.2.2.3.11:
3.2.2.3.1 Present and past weather
The rules to be followed at a sea station are the same as for a land station.
3.2.2.3.2 Wind direction and speed
The observations of wind speed and direction may be made either by visual estimates or by means of anemometers or anemographs.
Visual estimates will normally beare based upon the appearance of the surface of the sea. Observers should be aware that the wave height in itself is not always a reliable criterion since it depends also on the fetch and duration of the wind and on the presence of the swell.
The criteria to be used for visual estimation of the wind speed, using the Beaufort scale, are given in Table III.2.
Wind direction is determined by observing the orientation of the crests of the wind-driven sea waves.
Wind measurements made by means of anemometers and anemographs are done in the same way as for land stations, but it may be difficult to avoid local effects, for instance those produced by a ship's superstructure. For this reason sited the instrument should be sited on board of athe mobile ship should be as far forward and as high as possible.
For a moving ship it is necessary to distinguish between the wind relative to the ship and the true wind. For meteorological purposes the true wind should always be reported. The true wind may be obtained from the apparent wind by using the parallelogram of velocities as shown in the figure below (Figure III.8).
Figure III.8 - Parallelogram of velocitiesSource: (Marine Observer's Handbook, Meteorological Office, United Kingdom).
Further details can be found in the Guide to Meteorological Instruments and Methods of Observation (WMO-No. 8), Chapters 4, Part II, section 4.2.5.
The apparent wind speed measured on board a moving ship is to be corrected for the

course and the speed of the ship, in order to obtain the speed of the true wind, which is to be reported. The correction can be made on the basis of the parallelogram of velocities or by means of special tables (see the Manual on Codes (WMO-No. 306), Volume I.1, Part A, Regulation 12.2.2.3.3).

Table III. 2 BEAFORT SCALE OF WIND (For a standard height of 10 meters above open flat ground)
BEAUFORT NUMBER
DESCRIPTIVE TERM
VELOCITY EQUIVALENT AT A STANDARD HEIGHT OF 10 METRES ABOVE OPEN FLAT
GROUNDSPECIFICATIONS Probable
wave height* in metres
Probable wave
height*In feet
Mean velocity in
knotsm.s-1 km.h-1 mph Land Sea Coast
0 Calm <1 0-0.2 <1 <1 Calm; smoke rises vertically Sea like a mirror Calm - -
1 Light air 1-3 0.3-1.6 1-5 1-3 Direction of wind shown by smoke drift but not by wind vanes
Ripples with the appearance of scales are formed, but without foam crests
Fishing smack just has steerage way 0.1 (0.1) ¼ (¼)
2 Light breeze 4-6 1.6-3.3 6-11 4-7 Wind felt on face; leaves rustle; ordinary vanes moved by wind
Small wavelets; still short but more pronounced; crests have a glassy appearance and do not break
Wind fills the sails of smacks which then travel at about 1-2 knots
0.2 (0.3) ½ (1)
3 Gentle breeze 7-10 3.4-5.4 12-19 8-12Leaves and small twigs in constant motion; wind extends light flag
Large wavelets; crests begin to break; foam of glassy appearance; perhaps scattered white horses
Good working breeze, smacks carry all canvas with good list
0.6 (1) 2 (3)
4 Moderate breeze 11-16 5.5-7.9 20-28 13-18 Raises dust and loose paper; small branches are moved Small waves, becoming longer; fairly frequent white horses Smacks shorten sail 1 (1.5) 3½ (5)
5 Fresh breeze 17-21 8.0-10.7 29-38 19-24Small trees in leaf begin to sway; created wavelets form on inland waters
Moderate waves, taking a more pronounced long form; many white horses are formed (chance of some spray) Smacks shorten sails 2 (2.5) 6 (8½)
6 Strong breeze 22-27 10.8-13.8 39-49 25-31Large branches in motion; whistling heard in telegraph wires; umbrellas used with difficulty
Large waves begin to form; the white foam crests are more extensive everywhere (probably some spray)
Smacks have double reef in mainsail; care required when fishing
3 (4) 9½ (13)
7 Near gale 28-33 13.9-17.1 50-61 32-38Whole trees in motion; inconvenience felt when walking against wind
Sea heaps up and white foam from breaking waves begins to be blown in streaks along the direction of the wind
Smacks remain in harbour and those sea lie-to 4 (5.5) 13½ (19)
8 Gale 34-40 17.2-20.7 62-74 39-46 Breaks twigs off trees; generally impedes progress
Moderately high waves of greater length; edges of crests begin to break into the spindrift; the foam is blown in well marked streaks along the direction of the wind
All smacks make for harbour, if near 5.5 (7.5) 18 (25)
9 Strong gale 41-47 20.8-24.4 75-88 47-54Slight structural damage occurs (chimney pots and slates removed)
High waves; dense streaks of foam along the direction of the wind; crests of waves begin to topple, tumble and roll over; spray may affect visibility
- 7 (10) 23 (32)
10 Storm 48-55 24.5-28.4 89-102 55-63Seldom experienced inland; trees uprooted; considerable structural damage occurs
Very high waves with long overhanging crests; the resulting foam, in great patches is blown in dense white streaks along the direction of the wind; on the whole
- 9 (12.5) 29 (41)
11 Violent storm 56-63 28.5-32.6 103-117 64-72Very rarely experienced; accompanied by widespread damage
Exceptionally high waves (small and medium-sized ships might be for a time lost to view behind the waves); the sea is completely covered with white long patches of foam lying along the direction of the wind; everywhere the edges of the wave crests are blown into froth; visibility affected
- 11.5 (16) 37 (52)
12 Hurricane 64 and over 32.7 and over
118 and over
73 and over - The air is filled with foam and spray; sea completely white with
driving spray; visibility very seriously affected - 14 (-) 45 (-)
* This table is only intended as a guide to show roughly what may be expected in the open sea, remote from land. It should never be used in the reverse way; i.e. for logging or reporting the state of the sea. In enclosed waters, or when near land, with an off-shore waves, wave heights will be smaller and the waves steeper. Figures in brackets indicate the probable maximum height of waves.

For fixed platform stations and anchored platform stations, special rules must be applied for determining the wind due to the fact that their heights may be more than 100 m above sea level, while surface wind is defined as the horizontal component of the wind vector measured 10 m above the earth or the sea surface If the wind sensor is exposed at a higher elevation, the readings must be corrected. The following scale should be applied for reporting mean wind speed (over 10 minutes):
Elevation (height in m) 20 30 40 50 60 70 80 90 100Coefficient (r) 1.10 1.15 1.20 1.23 1.26 1.29 1.31 1.33 1.35
Example: Sensor at 75 m, indicated speed 50 ktCoefficient 1.30 (interpolated)Wind reduced to 10 m = 50/1.30 = 38.46 or 38 kt.
3.2.2.3.3 Amount of cCloud amount, type of cloud and height of cloud base
The same rules are generally followed as for land stations, but estimating the cloud base without landmarks (mountains, etc.) may be difficult. Ordinary methods using a searchlight are of limited value because of the short baseline available in a ship. The best solution is probably a pulse-light cloud searchlight which does not require any baseline and which measures electronically the reflection time from the cloud base. This instrument, however, is rather sophisticated and expensive and therefore not widely used. The observers should take every opportunity to check their estimates of cloud heights against known heights (e.g. mountains near the coast).
3.2.2.3.4 Visibility
In the absence of suitable landmarks it is not possible for visibility observations at sea stations to attain the same accuracy uncertainty as those made at land stations. The requirements for accurate visibility observations at sea stations are therefore set low (decade 90-99 of cCode table 4377, Volume I.1, Part A of the Manual on Codes, (WMO-No. 306)).
When the visibility is not uniform in all directions it should be estimated or measured in the direction of least visibility and a suitable entry should be made in the log (excluding reduction of visibility due to the ship’s exhaust).
3.2.2.3.5 Air temperature and humidity
The use of a sling or aspirated psychrometer exposed in the fresh airstream on the windward side (of the bridge) is normally recommended.
Automatic observing stations require a fixed exposure and should be exposed as far away from any artificial source of heat as practicable. This calls for two well-ventilated screens, as indicated in Figure III.1.
The requirements for thermometers for psychrometry at sea are as laid down in the Guide to Meteorological Instruments and Methods of Observation (WMO-No. 8). The thermometers should be exposed on the windward side and adequately shielded from radiation, precipitation and spray. For psychrometers the recommendation in the same Guide (section 5.2.4) should be followed.
The requirements for temperature and humidity observations at sea station are described in the Guide to Meteorological Instruments and Methods of Observation (WMO-No.

8), Chapter 4, section 4.2.9, Part II.
For fixed platform stations and anchored platform stations whose heights may be more than 100 m above sea level, it is not necessary to take into account the variation of temperature and humidity with height when reporting these variables.
3.2.2.3.6 Atmospheric pressure, pressure tendency and characteristic of pressure tendency
Pressure may be measured either by a precision aneroid or by a mercury barometer. The characteristic of the tendency is obtained from a barograph.
The requirements for atmospheric pressure observations at sea station are described in the Guide to Meteorological Instruments and Methods of Observation (WMO-No. 8), Chapter 4, section 4.2.6, Part II.
3.2.2.3.7 Ship's course and speed
For mobile ships the course shall be given as the direction from the position three hours previous to the present position, regardless of the real track between the two positions.
The speed shall be reported as the mean speed between those two points. (See group 10 in the code form SHIP (FM 13-IXI SHIP) code, the Manual on Codes, (WMO-No. 306), Volume I.1, Part A).
3.2.2.3.8 Sea-surface temperature
The measurement of sea-surface temperature is described in the Guide to Meteorological Instruments and Methods of Observation (WMO-No. 8), Chapter 4, section 4.2.11, Part II.
The method used at manned sea stations for measuring sea-surface temperature shall be recorded in the relevant meteorological log book.
The temperature of the sea surface may be observed by:
(a) Taking a sample of sea-surface water with a specially designed sea bucket;
(b) On a ship, reading the temperature of the condenser intake water;
(c) Exposing an electrical thermometer to the sea water either directly or through the hull (of a ship);
(d) Using an infra-red radiometer mounted to look down on the sea surface.
The principal methods used for many years have been (a) and (b). Method (c), however, is more widely used now, especially for large ships where method (a) is impractical and has proved to give the most consistent results. Method (b) should be avoided because great care is needed to obtain reliable results. (For further information, see section 17.8 of the Guide to Meteorological Instruments and Methods of Observation (WMO-No. 8)).

Observation of sea-surface temperature may be difficult from a platform or a rig. The best method of exposing a seawater thermometer is to attach the sensor to a buoy which is kept floating on the water during the reading period. Transmission of signals could then be either by radio or by cable. The buoy could also be equipped with a wave recorder to give sea-state observations as well.
3.2.2.3.9 Direction and movement of Ocean waves and swell
The observation of waves and swell is described in the Guide to Meteorological Instruments and Methods of Observation (WMO-No. 8), Chapter 4, section 4.2.12, Part II.
The following definitions apply:
Sea - System of waves observed at a point which lies within the wind field producing the waves.
Swell - System of waves observed at a point remote from the wind field which produced the waves, or observed when the wind field which generated the waves no longer exists.
Wave length - The horizontal distance between successive crests or troughs (equal to the wave period multiplied by the wave speed).
Wave height - The vertical distance between trough and crest.
Wave period - The time between the passage of two successive wave crests past a fixed point (equal to the wave length divided by the wave speed).
Wave speed - The distance travelled by a wave in a unit of time (equal to the wave length divided by the period).
The characteristics of a simple wave are shown in Figure III. 9: below.
C= wave speed L=wave length H= wave height
Figure III.9 - Characteristics of a simple wave
Observation of waves should include the measurement or estimation of the following characteristics:
(a) Direction from which the waves come on the scale 01-36, as for wind direction;
(b) Period in seconds;
(c) Height in metres or feet.
The direction from which the waves are coming is most easily found by sighting over a compass along the wave crests and then turning 90° to face the advancing waves.
The period can be measured by means of a stopwatch. A small floating object is observed and the time it takes for the object to move from one crest to the next is noted. A distinctive patch of foam from a breaking wave may be used as "floating object".
For estimation of waves shorter than the ship, the observer should take a position as low down as possible, preferably amidships. Height marks (at every .5 m vertically) painted on the ship's side are recommended. For waves longer than the ship, this method fails because the ship moves as a whole with the waves. The observer should move up or down in the ship until the oncoming waves appear just level with the horizon when the ship is vertical; otherwise, one must compensate for the tilt. (See (a) and (b) in Figure III.10.) Some experience is needed to obtain fairly good estimates.
Figure III.10 - Observation of wave height
Wave length can be observed by streaming a buoy for a distance astern such that the crests of two successive waves simultaneously pass the buoy and the observer, taking into account the angle between the wave direction and the line joining the buoy to the ship.
Wave speed can be obtained by noting the time of the passage of a wave from the stern to the buoy, allowance being made for the ship’s speed.
NOTES: 1. Care should be taken to distinguish between separate wave systems, bearing in mind the distinction between sea and swell as defined above.
2. For checking the observations, note that the wave length divided by the period should be equal to the wave speed.
2. Observations of waves made from island and coastal stations are not representative because of the shallow water, the effects of shelter by the shore, etc.
3.2.2.3.9.1 Observations of waves made from coastal stations
These observations cannot be expected to be representative of conditions in the open sea because of the water depth, tides, sheltering effects, etc. If the observations are made despite these difficulties, they should be made in the same way as at sea.
3.2.2.3.9.2 Use of instruments for wave measurements
In recent years suitable sea-wave recorders have been developed for measuring the height and period of waves. Different methods are applied:

(a) Surface-following buoys measuring acceleration;
(b) Ship-borne wave recorders measuring pressure and acceleration;
(c) Wave staffs, based on measurement of electrical resistance or capacity;
(d) Radar measurement instruments mounted on a platform or on land. It is strongly recommended that such recording instruments should be used at ocean weather stations, research ships and fixed platforms.
NOTE: Further detailed information on wave observations is given in the Handbook on Wave Analysis and Forecasting (WMO-No. 446) and the Guide to Meteorological Instruments and Methods of Observation (WMO-No. 8).
3.2.2.3.10 Sea ice and/or icing of ship's superstructure
The observation of ice is described in the Guide to Meteorological Instruments and Methods of Observation (WMO-No. 8), Chapter 4, section 4.2.13, Part II.
3.2.2.3.10.1 Sea ice
Although general knowledge of the extent of sea-ice cover has been revolutionized by satellite imagery, observations from shore stations and ships are still of great importance, especially in establishing the "ground truth" of satellite observations. The observations of floating ice depend almost entirely on visual estimation.
The four important features of sea ice to be observed are:
(a) Thickness of the ice;
(b) Amount:- concentration (estimated according to the eighths of the sea surface covered by ice);
(c) Form of the ice (fast ice, pack ice, etc.);
(d) Movement of the ice.
Sea ice may be reported in plain language or by the use of codes (FM 13-IX SHIP in the Manual on Codes (WMO-No. 306)).
Two basic rules for observation of sea ice from ships and shore stations are:
(a) Increase the field of view of the observation from the highest point above sea surface (e.g. the top of a lighthouse, the bridge or crow's-nest of a ship);
(b) Do not attempt to report sea-ice conditions beyond a radius of more than half the distance between the point of observation and the horizon.
Other forms of floating ice may be encountered at sea: river ice and ice of land origin, i.e. icebergs.
3.2.2.3.10.2 Ice formation on ships and other marine structures

There are two main types of icing at sea: icing from seawater and icing from freshwater. Icing from seawater may be due either to spray and to seawater thrown up by the interaction between the ship or installation and the waves, or else to spray blown from the crests of the waves. Icing from freshwater may be due to freezing rain or drizzle or freezing fog.
Reports on ice accretion at sea may be made either in plain language or in code form (FM 13-IXI SHIP, the Manual on Codes (WMO-No. 306), Volume I.1, Part A).
3.2.2.3.11 Special phenomena
WMO has been requested to give assistance by providing, through its Voluntary Observing Ships Scheme, observations of a special nature. Examples of these are:
(a) Observations of locust Swarms in sea areas around Africa, the Middle East, Pakistan and India:
(b) Observations of freak waves which constitute present a great danger to shipping:
(c) Sea-surface currents, which can be determined from measurements of a ship's set and drift and which are of value to research and climate studies.
Further details on the reporting of these three observations are contained in the Guide to Marine Meteorological Services (WMO-No. 471), Part II, section 1.4.5 and its aAnnexes.
Water spouts should be reported as a special observation. When describing a water spout the direction of rotation should always be given as if seen from above.
3.3 UPPER-AIR STATIONS
3.3.1 Organizational aspects
An upper-air observation is a meteorological observation made in the free atmosphere either directly or indirectly. For direct measurements, pilot-balloon, radiosonde, radiowind, combined radiosonde and radiowind, or rawinsonde are used. Remote sensing of the lower troposphere is developing rapidly, but as yet no system is fully operational. A list of measured and calculated variables can be found in Tables III.3 and III.4 (see section 3.3.2).
3.3.1.1 Site selection
Once the general area for siting a station has been chosen, it is necessary to select a specific site for the facility. It is recommended that the following criteria be considered:
(a) Government-owned land should be considered as the first choice, since there is less chance of having to relocate and future encroachment would be minimized;
(b) The optimum area of the site should be approximately 40 000 m2;
(c) The site must be accessible by an all-weather road for supplies and for proper maintenance of the station;
(d) The site should not be in a flood plain and should have good drainage;

(e) The site should be free from natural or man-made obstructions that would interfere with the launch, path or tracking of the balloon;
(f) Utilities such as electric power, water, sewerage, and communications must be available;
(g) The site must be surveyed to ensure that electronic equipment or telecommunications are free from any interference;
A suggested questionnaire for site survey is given in Figure III.11.
3.3.1.2 Planning of facilities
The basic buildings on the site are the station office (Figure III.12) and the balloon inflation shelter (Figure III. 13). In many cases, the radar or radiotheodolite are located above the main station building.
Design considerations for the Station Office are:
Operational functions Area limitations Severe weather protection Heating and cooling equipment Emergency electric power Fire protection Lightning protection Communications Safety techniques.
Design considerations for the balloon inflation shelter and release area are:
Storage of expendable supplies Orientation Area lighting Ventilation Explosion-proof electrical system Door openings Fire protection Pit, equipped for waste Safety techniques.
Design considerations should also include location for the following equipment:
Observationing equipment Inflation equipment Power-generation equipment Communication equipment Hydrogen-generation equipment or helium supply Balloon-preparation equipment.

UPPER -AIR SITE SURVEY QUESTIONNAIRE
Location_______________________________ Date _____________________________
1. (a) Describe the proposed upper-air site and enter latitude and longitude co-ordinates: ________________________________________________________________________________________________________________________________________________________________________________________________________________________________________________________________________________________________________
(b) Attach an obstruction diagram plotted from data obtained by theodolite measurements showing direction, distance, and angular elevation of all obstructions to tracking equipment above 0 elevation. Attach a copy of photos arranged to form a 360º panoramic view of the horizon. Note: If this report is being prepared for co-location with radar, panoramic photos prepared for the radar can serve for the purpose of this requirement. ______________________________________________________________________________________________________________________________________________________________________________________________________________________________
2. (a) Where will tracking set be located? Describe whether on roof of building, on top of inflation shelter, on tower, on ground; also, location with respect to office and inflation shelter:
(b) Height in feet or metres: ______________________________________________
(c) Elevation in feet or metres above mean sea level: __________________________
3. What will be the length of the cable run between the tracking set and the recorder? ____________________________________________________________________
4. Estimated costs
The estimates prepared in the Meteorological Department show the following:
(a) Land_______________ Buy/Rent _______________Cost_________________(b) Site preparation (roads, walks, utilities)________________________________(c) Building construction or modification__________________________________(d) Communications_________________________________________________(e) Inflation shelter or support__________________________________________(f) Conduits and cables_______________________________________________(g) Other (describe)__________________________________________________
Total cost for this site_____________________________________________
5. Remarks: ________________________________________________________________________________________________________________________________________________________________________________________________________________________________________________________________________________________________________________________________________________________________________________________________________________________________________________________________________________________________________________________________________________________________________________________________________________

Figure III.11 - A suggested questionnaire for upper-air station site survey
The design of the entire station should be in the hands of qualified people (i.e. architects or engineers) familiar with the functional requirements of the programme of activity at the station and in close collaboration with the Meteorological Service.
Several suitable sites should be considered, site surveys should be conducted and the results submitted to the authorities concerned for official approval. Plans with specifications and other contract documents should also be prepared. Procurement of necessary equipment, design of buildings or rental of new or existing property should be undertaken.
Provisions necessary for the day-to-day operation of the station must include the following:
(a) Procurement and storage of expendable supplies:
Inflation gas and supplies Radiosondes, targets and balloons Engine generator fuel Office materials;
(b) Adequate documentation such as the WMO Technical Regulations, Manuals and Guides;
(c) Complement of spare parts;
(d) Maintenance and supplies for buildings and grounds.
(e) Space for electronic technician for on-site or on-call maintenance of equipment.
3.3.1.3 Organization of the upper-air unit
The upper-air unit (UAU) consists of those components required to carry out an upper-air observation. It includes all aspects of facilities, personnel, equipment, maintenance, etc. for any upper-air observation which may be made at the station, i.e. pilot-balloon, radiosonde, radiowind, rawinsonde, combined radiosonde and radiowind observations.
The UAU may or may not be in the same location as other weather services. It may also provide the only type of observation made by a participating Member at a particular station. Co-location of weather services and observations is often a cost-effective approach. Usually, the unit is just one part of another observational office. Observers usually perform other functions in addition to upper-air observations. In some cases, it may, however, be necessary to keep the unit separate from the other weather services. Observers may only staff the UAU or may have duties at both locations. If an upper-air observation is the only service provided at a station, observers need only upper-air training.
No matter where the UAU is located, certain organizational relationships must be developed so that its operation is performed efficiently. When the UAU is co-located with other weather services, the upper-air observation then becomes an integral part of the organization. Personnel skills, work schedules, training, etc. must be expanded or modified to meet the upper-air observational requirements. When the unit is not co-located with the main weather office, it mayor may not be an integral part of the latter. With few exceptions, the UAU should ideally have an organizational relationship with another weather office.

Figure III.12 - Upper-air facility with station office
If applicable, the UAU should have a close working relationship with a central headquarters whose function may consist of setting up policies and regulations, ordering materials and supplies, and providing training.
3.3.1.4 Archiving data and maintenance of records
Archiving upper-air data after completing the observation is very important to the World Weather Watch (WWW) and the World Climate Programme (WCP). A complete set of records containing the pertinent observational data must be kept by the station or by the central headquarters, or at another location. Besides such official records, the data may be stored on some medium such as magnetic tape or disk. Countries that have the capability are advised to make provisions to supply the data upon request.
Further details can be found in the Guide to Meteorological Instruments and Methods of Observation (WMO-No. 8), Chapter 12, Part I, section 12.10.2.
In addition to the data archives mentioned above, the UAU is advised to keep the following records to monitor operations:
(a) Various information connected with the observation, e.g. bursting height, reason for termination, any problems during the flight, and type of radiosonde used; and
(b) A complete list of instruments and other office equipment used to obtain and transmit the data.
Figure III.13 - Upper-air site
3.3.1.5 Communications
The unit responsible for transferring the data from the UAU to national communications circuits and the GTS or the WWW may vary from Member to Member.

Some countries may employ a communicator or communications specialists who will ensure that the data are disseminated over the GTS network in a timely fashion. In other countries the observer, or even personnel not associated with the UAU, may be given this responsibility. Some Members use trained private-sector individuals under contract with nNational Meteorological Services.
For the data to be of any value, they must be entered into the distribution network at the required times. Alternative means to communicate information should be available when the primary communications link has been disrupted.
The types of communications equipment needed to disseminate data are as follows depending, inter alia, on quality of communications circuits, remoteness of the UAU and availability of satellite ground stations:
Direct access Telegraph Telephone Telex typewriter Two-way radio Satellite.
The data may be transmitted to the central headquarters which then communicates them to the GTS network. In some cases, another weather office or agency may be responsible for communicating the data to the GTS network.
3.3.1.6 Personnel
The types and number of personnel of the UAU depend on the equipment used, the level of expertise and the number of observations required. The type and degree of training is a function of the role and responsibilities of the individuals.
Generally speaking, the categories of personnel needed, all WMO Class III, are as follows. Examples of recommended number of personnel are given in the tables contained in Figures III.14 and III.15.
(a) Station supervisor (designated as "S" in Figures III.14 and III. 15)
When there is more than one person in the UAU, a supervisor should be designated. The relationship between the supervisor and the other staff is crucial to a well-run office. The person should be one of the most experienced people in the UAU and it is advisable that his background should include expertise in areas other than taking upper-air observations, such as hydrogen safety and other upper-air instruments and equipment. Good communications and management skills are also important. His major duty is to administer the UAU so that it functions efficiently. He also serves as the spokesman for the UAU when communication with other weather offices or agencies is required. In particular, this responsibility should include:
(i) Seeking guidance from the central headquarters when a higher authority is required;
(ii) Establishing the work schedule of the station personnel;

Observing method Pilot balloon Radiosonde Rawinsonde Radiowind
S SS O C M T** S SS O C M T** S SS O C M T** S SS O C M T**
Automatic - - - - - - 1 - 1 1* 1* 2 1 - 1 1* 1* 2 1 - 1 1* 1* 2Semi-automatic 1 - 1 1* - 2 1 - 1 1* 1* 2 1 - 1 1* 1* 2 1 - 1 1* 1* 2Manual 1 1* 1 1* - 2 1 1 1 1* 1* 3 1 1 2 1* 1* 4 1 2 1 1* 1* 4
* These positions are optional to the observingational programme. (Station supervisors are considered part of the observingational programme.** Minimum total number of personnel to carry out observation (optional personnel not included)
Figure III.14 – Example of recommended observational personnel requirements – number per observation

Obser./day
Observing method
Pilot - balloon Radiosonde Rawinsonde Radiowind
S SS O C M T* S SS O C M T** S SS O C M T** S SS O C M T**
1 Automatic - - - - - - 1 - 2 2* 1* 3 1 - 2 2* 1* 3 1 - 2 3* 1* 3Semi-automatic
1 - 2 2* - 3 1 - 2 2* 1* 3 1 - 2 2* 1* 3 1 - 2 3* 1* 3
Manual 1 2* 4 2* - 5 1 2 2 2* 1* 5 1 2 4 2* 1* 7 1 2 4 3* 1* 72 or Automatic - - - - - - 1 - 3 3* 1* 4 1 - 3 3* 1* 4 1 - 3 3* 1* 43 Semi-
automatic1 - 3 3* - 4 1 - 3 3* 1* 4 1 - 3 3* 1* 4 1 - 3 3* 1* 4
Manual 1 3 6 3* - 7 1 3 3 3* 1* 7 1 3 6 3* 1* 10 1 3 6 3* 1* 104 Automatic - - - - - - 1 - 4 4* 1* 5 1 - 4 4* 1* 5 1 - 4 4* 1* 5
Semi-automatic
1 - 4 4* - 5 1 - 4 4* 1* 5 1 - 4 4* 1* 5 1 - 4 4* 1* 5
Manual 1 4* 8 4* - 9 1 4 4 4* 1* 9 1 4 8 4* 1* 13 1 4 8 4* 1* 13
* These positions are optional to the observingational programme. (Supervisors are considered part of the observingational programme.)** Minimum total number of personnel required to carry out the observingational programme (optional personnel not included).
Figure III.15 - Example of recommended observational personnel requirements - number per week
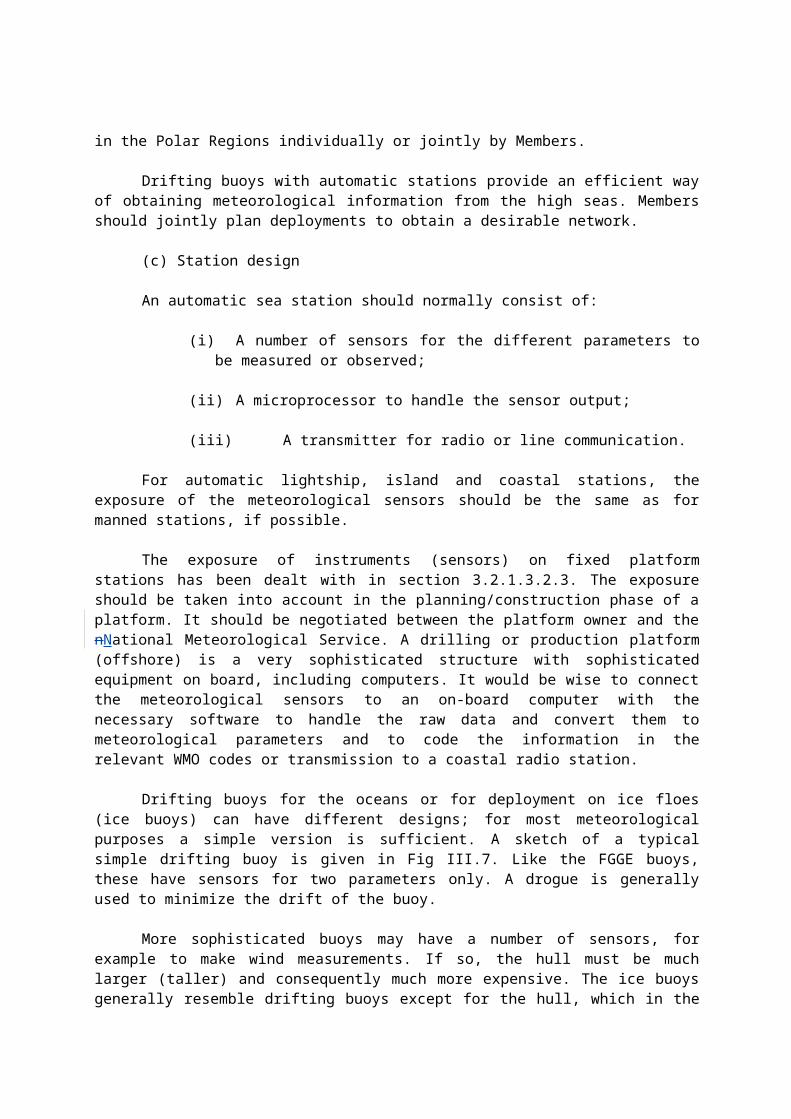
(iii) Keeping inventories of all supplies and expendables as well as ordering them in time;
(iv) Ensuring that all relevant policies and regulations are carried out by the station personnel and that the WMO Technical Regulations, Manuals and Guides and other such documentation are kept up to date and available to the station personnel;
(v) Ensuring that all safety precautions are adhered to with respect to hydrogen gas, upper-air instruments and equipment, power installations and other equipment;
(b) Shift supervisor (S-S)
The designation of shift supervisors is desirable at a station performing manual upper-air observations and is optional for all other methods of making observations. The shift supervisors, who are amongst the most experienced observers assigned to each shift, should have a broad operational background. Additional formal classroom training is not required. The minimum requirements can be fulfilled with on-the-job training.
(c) Observer (0)
The number of observers required to carry out an observation is a function of the methods used (automatic, semi-automatic, manual) and level of experience of the observers. The observers do not need any previous background in the making of upper-air observations, but formal and on-the-job training are necessary;
(d) Maintenance staff/technicians (M)
The maintenance personnel/technicians must have, as a minimum, a high school or technical school diploma. They must also have specialized training in the maintenance and operation of some types of equipment, some knowledge of the station equipment, an interest in mechanical, electrical and electronic systems, a basic understanding of the physical atmosphere and a minimum of two years' recent experience;
(e) Communicator (C)
The role of the communicators will depend on the volume of information transmitted and the diversity of responsibility. Their basic training should include course work and further experience will be gained through on-the-job training. In some cases, a licence for operating the appropriate communications equipment may be required.
NOTES: 1. The tables are intended as a guide to staffing and not for establishing minimum
requirements.
2. For a description of the classification of meteorological personnel and their duties see Guidelines for the Education and Training of Personnel in Meteorology and Operational hydrology (WMO-No. 258).
3.3.1.7 Training

The purpose of a training programme is to ensure that the personnel in the upper-air facility are able to meet all the demands made of them. These include the administration and management of the station and the effective operation of the observingational programme as well as the implementation of new requirements or modifications to operating procedures that may be requested. Training of a recurring nature is therefore important.
Technical training should cover operational and maintenance aspects. Operational training is required for the meteorological technician who selects the pertinent meteorological data from the equipment. The observer is a key member of the team in this category since he is responsible for data acquisition, sounding reduction and preparation of the data for local use and transmission over the telecommunications systems. Training is essential, either on the job or through formal course work.
Maintenance training is required for personnel responsible for preventive and corrective maintenance of the system. In order to understand adequately the operation of electronic and electromechanical devices, and to maintain them, it is necessary to understand the theory on which they are based. The theory provides the foundation for understanding the operation of present-day and proposed operational meteorological equipment. Instructions in theory should, therefore, have priority in the training of a maintenance technician. Appropriate practical training should also be provided to the staff before they attempt to maintain sophisticated and equipment at their facilities.
A variety of training opportunities are often available at local or regional universities, technical schools, or factories producing specialized meteorological equipment. On-the-job training should be arranged at either the local facility or at another which performs the same function. For complex equipment, on-the-job-training is sometimes provided upon the successful conclusion of formal schooling as well as in lieu of classroom study. Non-technical training is as important as technical training for the functioning of the facilities.
Information about the availability of training facilities may be obtained from the WMO Secretariat.
3.3.2 Observations/measurements
3.3.2.1 General
Upper-air soundings are taken with a number of different types of instruments. They are taken both on land and at sea, at permanently established stations as well as on moving platforms, including research vessels. For further information on applicable measurements, see Chapters 12, 13, 14 of the Guide to Meteorological Instruments and Methods of Observation (WMO-No. 8), Chapters 12 and 13, Part I.
3.3.2.2 Pilot-balloon observation
The pilot-balloon observation is one of the oldest and simplest methods of upper-air observation in use today. It involves the visual tracking of a pilot balloon as it rises by means of an optical theodolite. An assumed ascension rate as a function of the balloon weight and the lifting gas provides the height needed to calculate the wind speeds and direction. The observer reads the elevation and azimuth angles for a designated time period for as long as he is able to track the balloon visually. The data may be plotted to derive the necessary wind data or entered
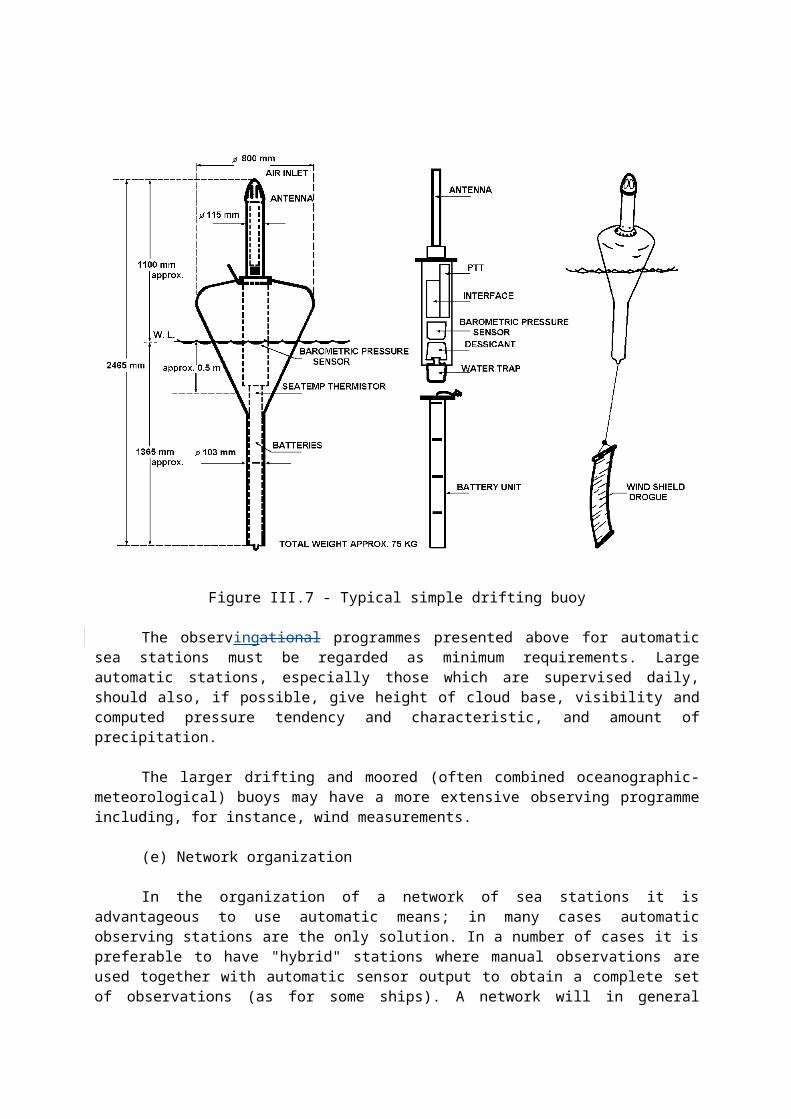
into a calculator or computer for semi-automatic data reduction.
Even though this form of upper-air observation is primitive in comparison to other methods, it is still used by several Members. The pilot-balloon observation can be an inexpensive, simple-to-operate sounding procedure, especially in climates which enjoy many cloud-free days. The major disadvantages of this technique are that the observations are limited even by small amounts of cloud cover and the observer is somewhat exposed to the elements. Moreover, the accuracy uncertainty of the measurements is directly proportional to the validity of the assumed ascension rate.
Further information can be found in the Guide to Meteorological Instruments and Methods of Observation (WMO-No. 8), Chapters 13, 13.3.2, Part I.
3.3.2.3 Radiosonde observation
Of all the upper-air observations which use telemetry signals to collect data, the radiosonde observation continues to be the basic observation. Generally speaking, most radiosondes in use today measure the basic parameters of temperature, pressure and relative humidity (or dew point). These measurements are carried out by sensors mounted in an instrument package which also contains a radio-frequency transmitter. The transmitter communicates these data to the ground receiving equipment which may be converted into a strip chart recording or go directly into a computer for further analysis. Regardless of the method employed, these data must be converted into a form which is easily recognizable and standardized. These forms are called coded messages and their formats have been standardized in accordance with the WMO Technical Regulations (WMO-No. 49). The measured parameters and the parameters calculated from the measured parameters are given below.
The radiosonde design and the exposure of its sensors should be such as to minimize adverse effects of solar and terrestrial radiation, precipitation, evaporation or freezing on a sensor. Suitable radiation corrections should be made if necessary. A control (or check) reading for each sensor should be made a few minutes before the radiosonde is released.
At a synoptic upper-air station, the vertical distances of an ascending radiosonde shall be determined by means of hydrostatic computation or precision radar tracking. Variables measured by a radiosonde and the desirable ranges and accuracies are given in the Guide to Meteorological Instruments and Methods of Observation (WMO-No. 8), Chapters 12, Annex 12.A, Part I. Table III.3
Table III.3
Measured variables
Range AccuracyUncertainty
Atmospheric pressure 1060 to 3 hPa ±0.5 to ±1.0 hPa Air temperature +60°C to -90°C ±0.5°C Relative humidity 0% to 100% ±5%

A properly made radiosonde observation gives a two-dimensional picture of the atmosphere and a three-dimensional picture when used in an upper-air network. For those Members not having the use of wind-finding apparatus, a pilot-balloon observation can be made in conjunction with the radiosonde observations. The heights can be very accurately derived from the radiosonde data which, in turn, will produce accurate wind data.
3.3.2.4 Radiowind observation
Members may wish to use wind-finding apparatus to track the radiosonde balloon flight trail as it rises. The widely used method for radiowind observations uses the wind-finding radar which tracks a reflective surface attached below the balloon. The radar sends an active signal towards the balloon which measures the distance between the two accurately. When combined with the computed heights from the radiosonde observation, accurate wind data can be derived. In practice, most operational windfinding radars have difficulty in measuring height with sufficient accuracy to satisfy user requirements for pressure and height measurements in the troposphere.
The major advantage of this method of observation is that the equipment necessary to make this type of upper-air observation is generally small and can be mounted almost anywhere. This system works best in climates which are not influenced by upper-air jets since the radar range is usually limited to under 100 km. Another disadvantage is that it may be influenced by passing high-altitude aeroplanes causing the radar to lose track of its target.
3.3.2.5 Rawinsonde observation
Probably the most widely used type of upper-air observation made throughout the world today is the rawinsonde observation (which is an abbreviation for radio-sounding wind observation). One difference between this method and that discussed in section 3.3.2.4 lies in the method of observation. The rawinsonde observation keeps track of the radiosonde position and uses that information to calculate the winds. It uses the radiosonde as the active target. An additional difference is that the methods of collecting the positional data may vary. Two types of wind-finding methods make up most of the rawinsonde observations in use today. These methods include the use of radio direction finding (RDF) apparatus and the use of NAVAID signals. Two types of NAVAID-based systems are LORAN-C and OMEGA (see section 3.3.2.8.4.).
These systems vary in complexity from the use of strip chart recorders to highly sophisticated computers which automatically analyse the data. In general, the wind-finding equipment used for RDF is physically large, while that for NAVAID is relatively small. All systems have their advantages and disadvantages and are discussed in section 3.3.2.8.
3.3.2.6 Combined radiosonde and radio - wind observation
This upper-air observation involves the radiosonde which operates together with radar. The radiosonde is equipped with sensors for measuring meteorological parameters. It has a transmitter which communicates meteorological data and at the same time serves as an active target for radar determination of the radiosonde position. This type of upper-air observation provides the highest number of measured parameters elements such as temperature, humidity, pressure, height of ascent and wind speed and direction. The other advantage is the radar measurement of radiosonde co-ordinates, and correspondingly the characteristics of vertical

wind profile, with high accuracyuncertainty. The variables listed in Table III.4 can be measured or derived from the basic measurements described in the previous sections.
Table III.4
Calculated variablesparameters
The following variables can be derived from the basic measurements described in Table III.3:
1. Wind speed and direction2. Constant pressure/height levels3. Tropopause data (analysed)4. Dew point/dew-point depression5. Stability index (optional)6. Mean winds (two levels)7. Wind shear8. Observation clouds (optional)9. Maximum wind10. Freezing level (optional)11. Minimum/maximum temperature and RHrelative humidity for the observation 12. Observation explanations (optional)13. Superadiabats and inversions (climate)14. Other data
3.3.2.7 Aerological soundings (pressure, temperature, humidity, and wind) using automated shipboard or land-based upper-air system
The development and successful trials of a highly automatic system known as the Automated Shipboard Aerological Programme (ASAP) offers additional possibilities for obtaining upper-air observations from ocean areas as well as from isolated land areas. The main elements of the ASAP system are the launcher, automatic upper-air and communication systems and the land-based ground station which receives the data via satellite and inserts them onto the GTS. The release of the balloon is automatic and its position as it ascends is determined by using Omega navigation signals to calculate the winds aloft. All of the data processing is done automatically by computer which converts the sounding data to standard coded message form for relay via a geostationary meteorological satellite using its data -collection system. The high degree of automation allows the ASAP system to be operated by one person.
For installation on a ship, the system is essentially contained within one standard sea-container (2.5 m x 2.5 m x 6 m) of fibreglass/steel construction and weighs about 3 400 kg. Electric power and deck space are required to be provided by the ship's authorities for the container and the launching of balloons. Helium is the inflation gas used as it is not volatile and consequently there is no risk of explosion. The container requires standard tie-down fitting pins welded to the deck and tie-down D-rings and chains. A shipboard crane (or, alternatively, a dockside crane), capable of loading/unloading in no more than one hour, must be available.

Figure III.16 is a block diagram of the system. The example is taken from a ship crossing the Pacific between Japan and Canada. A sketch of the container is given in Figure III.17
3.3.2.8 Upper-air system (UAS)
The upper-air system contains those components necessary to make one or more of the upper-air observations mentioned in sections 3.3.2.2 to 3.3.2.6. The major components include the balloon flight train, the ground equipment and the data reduction apparatus. For further details, see Chapters 12, 13 and 14 of the Guide to Meteorological Instruments and Methods of Observation (WMO-No. 8), Chapters 12 and 13, Part I.
3.3.2.8.1 Optical theodolite
The optical theodolite, a derivative of the surveyor’s instrument, was one of the very first upper-air devices developed. It uses a telescope-type apparatus which the observer uses to track a balloon. For some time interval selected - usually one minute - the elevation and azimuth angles are recorded as a function of height, which has been estimated. Section 123.2.1, Chapter 13, Part I of the Guide to Meteorological Instruments and Methods of Observation (WMO-No. 8) gives a more complete description of this technique.
3.3.2.8.2 Radio direction-finding (RDF)
One of the most widely used methods of deriving wind information is through the use of RDF. The basic design of an RDF system consists of a parabolic disk antenna, a radio receiver and either a strip chart recorder or a direct link to a computer. To obtain wind information, the elevation and azimuth angles and slant ranges of the antenna are sampled with respect to some time increment, usually at one-minute intervals. The range of the antenna to receive the radiosonde signal depends on the power and antenna's gain. A more comprehensive discussion on RDF can be found in section 12.3 of the Guide to Meteorological Instruments and Methods of Observation (WMO-No. 8).
The RDF offers Members the ability to track accurately the radiosondes to an accuracy uncertainty of ± 0.5° for the elevation and azimuth angles and ± 20 m for slant ranges. The wind calculations follow from spherical geometry techniques which make them easily accessible to computer reduction algorithms.
The antennas may measure from 2 to 3m up to 5 to 6 m in diameter. They usually require shelter from the elements and older versions need a fair degree of maintenance due to the myriad moving parts. The ability of the antenna to collect accurate angular/slant range data may be affected by obstacles including buildings and trees in the path between the antenna and the radiosonde.
Figure III.16 - Block diagram of ASAP system
Figure III.17 - Marine module for ASAP (shipboard installation) launching and tracking module

3.3.2.8.3 Wind-finding radar
The derivation of winds is achievable through translation with the use of a tracking station. The wind-finding radar, as its name implies, can derive wind information without the need of a radiosonde to calculate the heights. Although similar to a radio theodolite in many ways, it acquires its data somewhat differently. Instead of homing in on a radio signal as does the radio theodolite, the radar emits pulse which are reflected from a target suspended below the balloon. These reflected pulses measure the distance between station and balloon which, when combined with the elevation and azimuth angles, produce very accurate wind data. Section 12.3.313.2.4, Chapter 13, Part I of the Guide to Meteorological Instruments and Methods of Observation (WMO-No. 8) gives a more complete description of this technique.
3.3.2.8.4 Navigation-aid (NAVAID) systems
The principle of wind finding with the use of NAVAIDs is simple. A balloon or parachute, equipped with a NAVAID receiver, retransmits the NAVAID signals to a base station. They are transmitted from a number of fixed stations through the sonde to the base station. The difference in time of arrival of the signals is used to determine the range difference between pairs of stations. Since the path from sonde to the base station is identical for each transmitter, the measurement of range differences eliminates the common path from sonde to base station. The base station can, therefore, be in motion without introducing error to the wind computation. The technique is ideally suited for measuring winds from a moving ship with a balloon sonde. Section 12.3.613.2.5, Chapter 13, Part I of the Guide to Meteorological Instruments and Methods of Observation (WMO-No. 8) gives a more complete description of this technique.
LORAN-C is a navigation system used to provide accurate ship navigation. A number of chains cover the Pacific, Atlantic and Gulf Coasts, and the Aleutians. Global coverage, however, is not available. Only a few LORAN-C NAVAID systems have been built, but they provide excellent wind accuracy if located in areas of good coverage.
The OMEGA navigation system consists of 8 VLF (very low frequency) transmitters located around the globe. Accuracy is improved, however, by using all stations which provide acceptable signals.(The VLF Omega system has been decommissioned.)
3.3.2.8.5 Other upper-air systems
3.3.2.8.5.1 Safesonde
The safesonde system consists of a base station, a reference transmitter, and three translator stations located 3 to 5 km from the base station. Signals are transmitted from a radiosonde at 403 MHz, and retransmitted at 1 680 MHz from the translator stations to the base station. Phase comparison of the received signals permits the computation of the radiosonde location in three dimensions. Temperature, humidity and pressure data are transmitted to the base station. These data are then used to compute altitude independently as a check on the measured altitude. The computations for all parameters are performed by a small computer with no need for an operator after the balloon has been released.
Within the network, balloon motion is measured to an accuracy uncertainty of a few

centimetres per second. At large distances from the network, errors increase markedly. Network dimensions can be increased to provide precise data at extended ranges. Typical errors for the system are 0.5 m.s-1 for 10 s averages up to 5 km altitude. At higher altitudes, accuracy uncertainty is a function of system baseline dimensions and balloon distance from the network. Accuracy uncertainty better than 1 m.s-1 should be achieved for one-minute averages over all altitudes.
3.3.2.8.5.2 Aircraft dropwindsonde
The dropwindsonde operates in the same fashion as a radiosonde, telemetering data on pressure, temperature and humidity. A parachute is used rather than a balloon and the sonde must be designed to take high shock loadings on release. Current drop windsondes may pose a danger to populated areas because of their rugged design.
Until the development of the navigation-aid sonde, a number of expensive and abortive attempts were made to develop a dropsonde which could measure winds. With the NAVAID sonde, the problem is resolved. Measurements are made of the difference in phase of the signals received by the sonde from the several transmitting stations.
3.3.2.9 Observational requirements
3.3.2.9.1 Time and frequency of observations
Regulation 2.4.3.2.12.4.2 contained in Volume I, Part III, of the Manual on the GOS (WMO-No. 544) , Volume I specifies that the standard times of upper-air synoptic observations shall be 0000, 0600, 1200 and 1800 UTC. The relation between the permissible actual time and the corresponding standard time of observation is given in the Manual on the GOS (WMO-No. 544), Volume I, Regulation 2.4.3.2.42.4.10, Part III. The number and time of observations should be as are specified in Regulations 2.4.3.2 2.4.8, 2.4.9 and 2.4.11, Part III of the Manual on the GOS (WMO-No. 544), Volume I.
3.3.2.9.2 Type of observation
The central headquarters will decide on whether upper-air synoptic observations, low-level observations, or a combination of the two should be made, meeting the requirements of the Manual on the GOS (WMO-No. 544) , Volume I, Regulation 2.4.6, Part III.
3.3.2.9.3 Observer functions
Observers should follow the pre-release, data evaluation and data verification procedures in accordance with the standard operating procedures and other instructions given to the station.
The pre-release procedures include checking of the radiosonde and the ground equipment to ensure that they are working properly, inflation of the balloon and preparations for entering the observational records.
Data evaluation procedures may consist of automatic, semi-automatic or manual computations. Some pilot-balloon calculations are now semi-automatic.

Data verification procedures are very limited in automatic upper-air systems. For semi-automatic systems the data verification procedures are carried out partly by the computer and partly by the observer. For pilot-balloon observations, all data verification must be done by the observers in accordance with the relevant WMO Technical Regulations (see the Manuals on the GOS and GDPS).
Observers may be required to carry out periodic equipment checks separately from the actual observation and to regulate or adjust the equipment in accordance with the standard procedures for the equipment in use. (Certain types of equipment (e.g. radiotheodolites and barometers) require comparison with standards to verify accuracy of the data). When the equipment is inoperative or malfunctioning, observers are advised to make an entry to this effect in an equipment log. The upper-air unit must have back -up procedures or back-up equipment when the primary equipment is inoperative. Manual computation may have to be resorted to when a computer becomes inoperative.
3.3.2.9.4 Output products
The central headquarters will determine the output products for the station. Upper-air coded messages, data for significant and mandatory levels and any additional computer or derived data which maybe needed should be prepared by the observer, who should arrange for the transmission of the coded messages after ensuring that they are correct. He must be fully knowledgeable about coding, formats.
3.3.3 Special management considerations
3.3.3.1 General
The making of an upper-air observation is a complicated and costly activity which is undertaken to obtain data for a three-dimensional analysis of the atmosphere. There is, therefore, a need for rigorous working standards at each station which should be ensured by proper arrangements for the management and operation of the stations.
A Member operating a network of upper-air stations should establish an appropriate organizational unit within the National Meteorological Service with the responsibility for all aspects of the management of the network such as the operation, maintenance and supervision of the stations; logistics; and procurement and supply of equipment and other necessary material to ensure the efficient and uninterrupted functioning of the stations.
The basic principles to be followed in organizing the activities of the management unit for an upper-air station network are the same as those for a similar unit responsible for a surface synoptic network (described in detail in section 3.1.3). In the present section, therefore, only those aspects which are applicable only to upper-air stations are dealt with.
3.3.3.2 Procurement of instruments and equipment
For further information on instruments and equipment, refer to Chapters 12 and 13, Part I and Chapter 10, Part II of the Guide to Meteorological Instruments and Methods of Observation (WMO-No. 8). The WMO Secretariat of the WMO may can also be able to provide additional advice.
3.3.3.2.1 Capital equipment
3.3.3.2.1.1 Pilot-balloon observations
The optical theodolite is the basic instrument used to follow the track of the balloon from launch until it is lost in clouds or bursts. The theodolite is mounted on a sturdy tripod. A cover is necessary to protect the instrument from exposure when it is not in use. The general design requirement of the instrument can be found in the Guide to Meteorological Instruments and Methods of Observation (WMO-No. 8), Chapter 13, 13.3.2, Part I. Detailed information can be found in Chapter 10, Part II of the above mentioned Guide. The table below gives a list of capital equipment needed for a manual or semi-automatic pibal observation.
Capital equipment for pilot-balloon observations
Basic equipment
- Theodolite- Theodolite tripod - Pilot balloon - Timer
Balloon (30q, 100 g)
- Gas inflation and accessories - Plotting boards, winds aloft
Plotting (manual observation)
- Stop watch/clock- Graphing boards (manual observation)- Magnetic compass
NOTE: Spare equipment should be available at the station for critical equipment
Accessories
- Calculator
3.3.3.2.1.2 Radiosonde/rawinsonde observations
(a) Manual data reduction equipment
The observers utilize plotting boards and tables to perform mathematical conversions and calculations. This equipment is in addition to the basic rawinsonde system which may consist of a receiver, a tracking unit and a recorder or NAVAID equipment. Various antenna arrays are used to track radiosondes depending on the equipment used. The table below gives a listing of the capital equipment needed for manual radiosonde/rawinsonde observations.
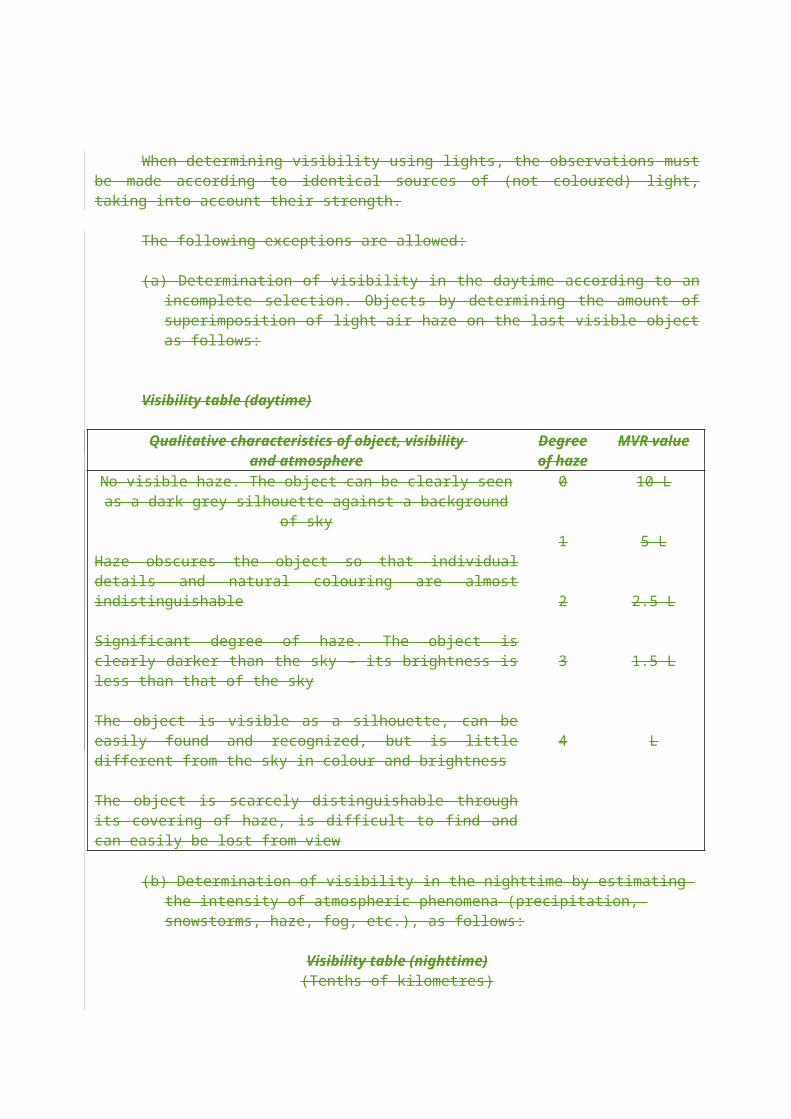
(b) Semi-automatic and automatic data reduction equipment
The equipment consists of the basic rawinsonde system described in the previous section in addition to any number of computers which are used to assist the upper-air observer in performing mathematical conversions in lieu of plotting boards. The table below gives a complete list of items necessary for a semi-automatic or automatic observation.
Capital equipment for radiosonde/rawinsonde observations (manual, semi-automatic and automatic)
Equipment SparesGround equipment (RDF or NAVAID) Supplied by manufacturerBalloonsPlotting boards (manual observation)Train regulatorsRadiosondes with batteriesInflation gas and equipmentParachutesForms and chartsConversion tablesComputers, etc. (semi-automatic and Converters, etc.automatic observations)Radiosonde/battery, tester Inflation bedGrounding hardwareRadiosonde tape
Accessories
Notice of finder label Intercom system
3.3.3.2.1.3 Radio-wind observations
The wind-finding radar equipment, a single unit microprocessor-based system, gives upper-air winds only by tracking a balloon-borne target. The table below gives a complete list of items needed or a radiowind observation. For further information, see section 13.4 of the Guide to Meteorological Instruments and Methods of Observation (WMO-No. 8).
Capital equipment for radiowind observation
Equipment Spares
Wind-finding radar Supplied by manufacturerRadar targetsParachutesBalloonsTrain regulatorsUpper-wind formsRadiosonde tape Ribbons and chart rollsInflation gas
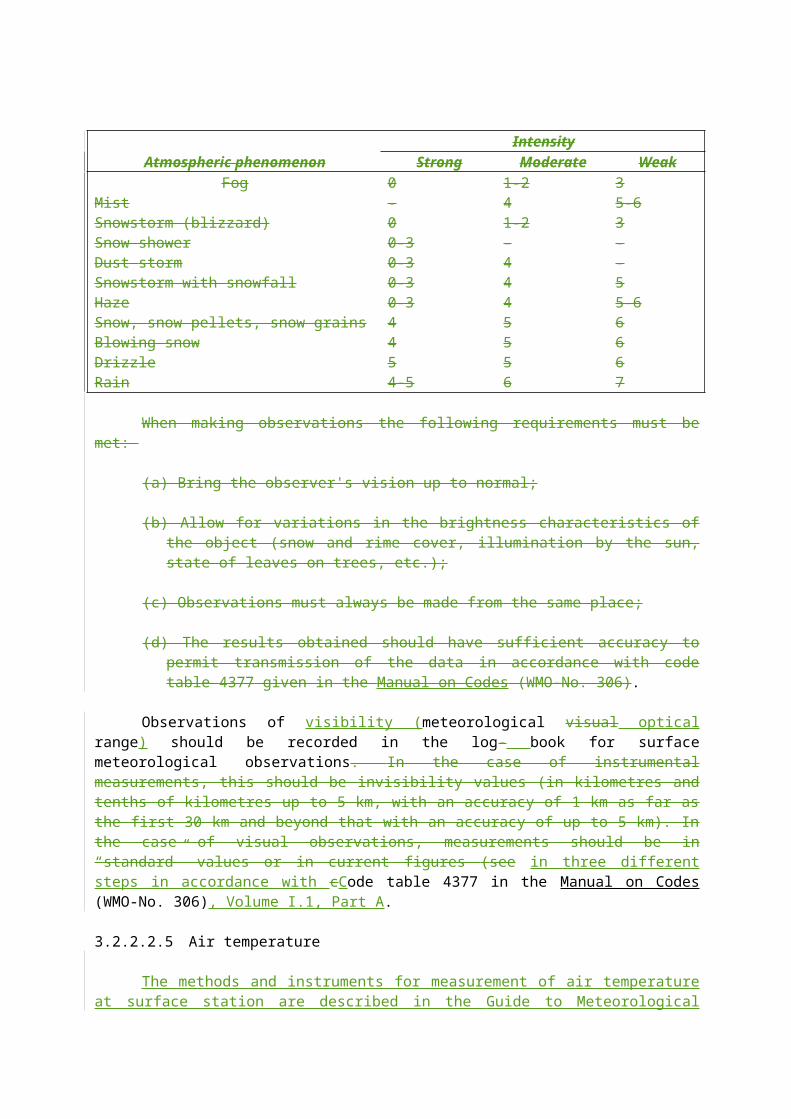
Accessories
Notice to finder label Computer/calculator Intercom system
3.3.3.2.2 Expendables
3.3.3.2.2.1 Pilot-balloon observations
(a) Balloons
The use of balloons is an integral part of the acquisition of upper-air data through surface-based systems. This section discusses the composition, size, colour, storage, types and sources of supply.
Pilot-balloons are used to determine wind speed and direction aloft. The balloons have a free flight, single envelope, and are made of expanding synthetic material.
Different colours are used under various atmospheric conditions and times of day. In general, a white balloon will be used with a clear sky, a black balloon with low to medium overcast sky and a coloured balloon with high overcast or with a white or grey background.
It is advisable to have suitable facilities for adequate balloon storage. The storage area should be dry and its temperature should always be above freezing. Under good storage conditions, balloon life should exceed one year. Balloons should be stored in their original sealed containers in a warm room at temperatures not exceeding 45°C. They must not be placed immediately next to large electric generators or motors. When handling, no part of the balloon except the neck must be touched with bare hands. Members should have adequate supplies on hand.
(b) Inflation gas
There are two types of inflation gas normally used in the meteorological upper-air programme: helium and hydrogen. The gas is available from different sources and requires different logistical procedures for procurement, transportation and storage. Occasionally, natural gas is used when locally available if it fulfils the ascent requirements.
Helium is found mainly in North America and the USSR, is relatively expensive, and is not volatile. It can be easily stored in pressurized bottles and transported with few restrictions. Since it is non-flammable, fewer precautions are necessary regarding its use as an inflation gas.
Hydrogen is relatively inexpensive and provides very good buoyancy. However, hydrogen is extremely flammable and under certain conditions explosive. It can be bought throughout the world; transportation and storage are however, difficult because of its volatility. Safety precautions should therefore be followed. Hydrogen can be produced at the observationing site by either chemical or electrical methods.

(c) Lighting units
The use of lighting units helps in the initial lock-on and tracking of the balloon train during nighttime and other periods when visibility is reduced. The lighting unit consists of either a lantern or a low-current miniature lamp and a battery. Once the battery is activated the device is fastened to the balloon train. The lighting units have an indefinite shelf life when stored in sealed containers.
(d) Other consumables
It is necessary to record the upper-air information so that it can be coded, processed and communicated to the data users. Plotting and graphing charts, ascension rate tables and coding charts vary with the type of upper-air observation and the equipment used.
Forms and tables can be locally designed and printed or can be reproduced from WMO formatted charts. An ample supply of the correct, latest edition of forms and tables is necessary. An emergency supply must always be maintained. The availability of forms and tables is to be accorded the same importance as all other integral supplies and equipment.
3.3.3.2.2.2 Radiosonde/rawinsonde/radar wind (wind-finding radar) observations
(a) Balloons
The use of balloons is an integral part of the acquisition of upper-air data through surface-based systems.
These balloons are spherically shaped films of natural or synthetic material which, when inflated with a lighter-than-air gas (hydrogen, natural gas or helium), are used to transport radiosonde flight equipment into the upper atmosphere. The film of these balloons can be extremely thin (0.006-0.007 cm) when inflated for release, decreasing to 0.004 cm at bursting altitude. The balloon expands in size from an approximate release diameter of 4 m to 6 m to a diameter of 7 to 8 m at bursting altitude. It is obvious that the smallest cut, bruise or scratch sustained during preflight procedures is almost certain to result in a premature burst. The requirement for careful preflight handling of these balloons cannot be overemphasized. Radiosondes are carried aloft by 600 g balloons. Under severe weather conditions a thicker-skinned, 1 000 g balloon may be used. For further information on requirements for balloons and storage, see sections 14.1 and 14.4 of the Guide to Meteorological Instruments and Methods of Observation (WMO-No. 8).
(b) Wind-finding radar targets
Wind-finding radar targets are carried aloft by 300 g balloons. The targets can be either pyramidal, spherical or other shapes made of radar-signal-reflective material such as aluminium foil. These can usually be manufactured in any country. There is an optimum-sized reflector depending upon the frequency used.
(c) Inflation gas
See under "Pilot-balloon observations", section 3.3.3.2.2.1 above.

(d) Lighting units
See under "Pilot-balloon observations" section 3.3.3.2.2.1 above.
(e) Radiosondes
The radiosonde is a balloon-borne, battery-powered instrument used together with ground-receiving equipment to delineate the vertical profile of the atmosphere. There are a number of sizes and shapes available, depending on the manufacturer. Many countries have developed radiosondes to be used with their ground equipment. Three frequencies authorized by ITD are used as part of the sonde and the associated ground equipment. The characteristics of the sondes are discussed below.
Radiosondes operate on a nominal carrier frequency of 28, 1 680 or 4030 MHz (some Members may have had other frequencies allocated). The 1 680 MHz radiosonde transmits an amplitude modulated signal at a nominal frequency of 1 680 MHz. The frequency pulse-modulated 403 MHz radiosonde transmits a signal at a nominal frequency of 403 MHz. The transmitted signals of these radiosondes provide meteorological data and may serve as the direction-finding or tracking signal for the raw in receiver. The pulse-modulated 403 MHz radiosonde transmits a signal at a nominal frequency of 403 MHz. The transmitted signal provides meteorological data. (See Tables 13.1 and 13.2 in the Guide to Meteorological Instruments and Methods of Observation (WMO-No. 8) for further information on radiosondes and wind-finding radars). See the Guide to Meteorological Instruments and Methods of Observation (WMO-No. 8), Chapter 12, section 12.1.4.2, Part I for further information.
Radiosonde operations need to avoid interference with, or from, data collection platforms (DCP) transmitting to meteorological satellites between 401 and 403 MHz, both downlinks from meteorological satellites between 1690 and 1700 MHz and command and data acquisition (CDA) operations for meteorological satellites at a limited number of sites between 1670 and 1690 MHz.
If the radiosondes on hand are over 36 months old, they should not normally be used. However, if all radiosondes are over 36 months old, those that show the least amount of corrosion, ageing, etc. should be used.
(f) Other consumables
A parachute is attached to the equipment to prevent damage in returning to Earth.
3.3.3.3 Maintenance
The purpose of a maintenance programme is to keep the equipment in an operating condition and to obtain the desirable performance from the system. The maintenance programme should include preventive maintenance, inspection and/or calibration of equipment, periodic cleaning/lubrication, performance testing, corrective maintenance and equipment modification, as necessary. Section 12.9, Chapter 12, Part I of the Guide to Meteorological

Instruments and Methods of Observation WMO-No. 8) deals with this topic.
The concept of preventive maintenance is quite important and must be followed extensively on all equipment. It is more efficient and effective to keep equipment operating than to correct a breakdown. The scheduling of preventive maintenance is an absolute necessity for the successful continued operation of an upper-air system. Original equipment manufacturers, usually through testing and evaluation programmes, have determined the preventive maintenance programme to be followed by users. They must be followed carefully during the entire period of use of the equipment to assure correct functioning. Where local guidelines regarding the maintenance programme do not conflict with the manufacturer's standards, they may be followed. Where conflict in guidelines exists, clarification should be sought from the manufacturer.
The purpose of periodic equipment inspections and/or calibration is to ensure the continuous operation of the equipment with a minimum of outage time. The inspection should include a detailed visual examination to detect any physical deterioration taking corrective action as necessary, checking of the mechanical functions of the equipment to ensure their operation within specifications and applicable tolerances, and checking of all electrical functions to ensure that the inputs and outputs meet the manufacturer's specifications.
Mechanical equipment such as radar-tracking devices needs periodic cleaning and lubrication. There are no clean operating environments for meteorological equipment: a programme must therefore be established to prevent disruption of the operation due to dirty and rusting moving parts.
The operation of equipment in high-humidity areas requires special care and attention. Corrosion can be very disruptive to meteorological observing and peripheral equipment. Filters must be cleaned or replaced when dirty or on a regular basis. Lubrication is essential for the proper operation and maintenance of moving parts. The use of prescribed oils and greases is essential, especially in cold and tropical regions.
Periodic performance testing provides information on what can be expected when the equipment is under operating conditions. It is also an effective way to discover and correct malfunctioning equipment prior to use. Regularly scheduled performance testing is advised to maintain the equipment in a satisfactory operating mode. Simulated operations should be performed to check the equipment and to ensure that all facets of the operation are within specifications and provide the required data.
An effective programme of corrective maintenance involves ensuring the availability of adequate supplies, spares, and trained electronic and other maintenance personnel.
Original equipment manufacturers usually prescribe procedures and techniques to be followed in determining and correcting equipment malfunctioning. These techniques and procedures are based on laboratory testing and experience learned from field operations and must be followed first in attempting to correct equipment failures and maintain the quality standards of the operation. There are times when a disruption in the operation of a facility can arise from a local and unusual occurrence which may not have occurred elsewhere. Such malfunctions should be documented for future reference and forwarded to Members having similar equipment.

Trouble shooting procedures are closely integrated with corrective maintenance and can be viewed as a combined technique for correcting any malfunctions.
In the design of equipment there may be one or more components whose mean time between failure (MTBF) is below what is expected. These components must be given special attention in a maintenance programme and if they deteriorate rapidly the original equipment manufacturer must be informed for possible redesign. Care must be exercised in making locally initiated equipment modifications to ensure that the change is within manufacturer's specifications and that no change occurs in the accuracy uncertainty and temporal resolution of the data.
3.3.3.4 Inspection
The importance of regular inspection of upper-air stations cannot be overemphasized. The requirements in respect of inspection and the duties and responsibilities of the inspector are dealt with in section 24.6.2 of the Guide to Meteorological Instruments and Methods of Observation (WMO-No. 8). Some additional information will be found in the preceding section on maintenance in the present Guide.
3.3.3.5 Budgetary requirements
The purpose of determining budgetary needs is to ensure that resources are, available for the efficient and effective operation of the upper-air facility. Standards should be developed to determine the number of people needed at a facility for the type of operation contemplated. (See section 3.3.1.6 and the tables in Figures III.14 and III.15). The budgetary needs should be established on that basis. The budgetary requirements for maintenance, supplies and other support activities should also be prepared in a similar fashion. Resources must be made available for, all personnel involved in the station operations.
3.4 AIRCRAFT METEOROLOGICAL STATIONS
3.4.1 General
An aircraft meteorological station is an aircraft in flight from which meteorological data are obtained by utilizing instruments and equipment installed for navigational purposes. The measured data can be supplemented by the observation of visual, weather phenomena and by subjective or objective assessments of turbulence and icing. When compiled into reports they constitute a vital part of the global data base. The reports are of particular value over areas where other upper-air data are scanty or lacking. They can provide information on atmospheric phenomena such as wind, temperature and turbulence along horizontal and vertical profiles on a much smaller scale than do other routine observing systems. Thus, they also constitute a valuable source of information for the issuing of reports on significant weather phenomena (SIGMET) as well as for special investigations and research. SIGMET reports are generally issued in-flight and transmitted to users' mainly via a combination of aeronautical and meteorological telecommunication facilities. The collection and evaluation of post-flight reports must also be regarded as an invaluable data source. Subject to timely receipt, processing and dissemination, they can be of use for forecasting purposes.
There are two reporting systems in use. One is based on observations made on a co-
operative basis by the aircrews and reported air-to-ground through a manual system in the form of routine or special air-reports (AIREP). The other is related to the Aircraft Integrated Data System (AIDS), which is an automatic system for the acquisition, processing and storage of a large amount of technical and environmental data. The essential components of the AIDS system are the Inertial Navigation System (INS) (for position and wind) installed on wide-body aircraft, and the Flight Data Acquisition System (for altitude and temperature). Selected AIDS data can be collected using the Aeronautical Radio Inc. Communications, Addressing and Reporting System (ACARS), or possibly via geostationary satellites. An evaluation of the many parameters gathered and stored in the system is possible at a later stage subject to an agreement with the airline operator.
The AIREP system, due to the manual handling of data, is subject to errors and delays which may sometimes reduce the value of the reports. However, as the routine introduction of real-time data collection systems is still some way off, it is at present the main air-reporting system in use. Scientific problems with the evaluation of reports from aircraft meteorological stations are mainly to be found in their uneven horizontal and vertical distribution and the generally asynoptic times of observation. In addition, the reference to pressure height relative to the standard atmosphere may introduce inaccuracies when related to the standard pressure levels used in meteorology. This requires the use of appropriate data assimilation models or procedures.
In spite of these shortcomings, experience has shown that the utilization of aircraft meteorological reports leads to better analyses and objective forecasts. Airline operators, air traffic and meteorological services should therefore be encouraged to co-operate in the preparation, forwarding and utilization of the reports to the maximum extent possible.
3.4.2 Instrumentation and data processing
The AIDS and AIREP system use instruments and navigational equipment already available on board the aircraft. In addition, there may be a need to install accelerometers to indicate different degrees of turbulence and a humidity sensor. The type of sensors used and their siting on board the aircraft are determined by the manufacturers and depend on the type of aircraft. For technical details concerning instrumental measurements on board aircraft, reference should be made to Chapter 183, Part II of the Guide to Meteorological Instruments and Methods of Observation (WMO-No. 8).
In the AlREP system, the data are based on instantaneous visual readings. Wind direction and speed are obtained by drift or spot wind measurements.
The automatic system envisaged for the future will apply smoothing algorithms to the raw data to produce reports which are compatible with other upper-air data. This will result in wind and temperature data averaged over approximately 10 km of path in level flight. At cruising level, the maximum wind between normal observations will be calculated and reported when set criteria are met. On ascent and descent, observations will be compiled at the 10 hPa intervals over the 100 hPa layer immediately above the surface, and each 50 hPa above that level to cruise level. The smoothing functions in these cases will give an effective time constant of three seconds. Certain data quality checks will be made to exclude data which fall outside set limits, such as those obtained during rapid manoeuvres on ascent and descent.

3.4.3 Site selection
The selection of observing sites in the AlREP system is prescribed by the reporting procedures promulgated by lCAO and national aviation authorities (Technical Regulations (WMO-No. 49), Volume II, [C.3.1.] 5). These generally lead to an accumulation of data at reporting points fixed at intervals of 10° longitude or latitude along major air routes, with most altitudes being between the upper standard pressure levels (300 hPa and 150 hPa). Although the procedures for lateral and vertical separation of individual flights are leading to somewhat better coverage over the oceans, they can be regarded as forming only part of a composite network in combination with satellite observations.
Observations related to specified weather phenomena should be made wherever these phenomena are encountered. For the reference, see the Manual on the GOS (WMO-No. 544), Volume I, Regulations 2.5.5 - 2.5.7, Part III. Details on the frequency and time of observations are given in Regulations 2.5.9 and 2.5.10 of the Manual.
In the AIDS the reporting points in level flight are determined by a fixed time interval between the individual observations. The current interval of 7.5 minutes or eight reports per hour corresponds to a spatial resolution of approximately 125 km. The exact positions will vary, between individual flights depending on ground speed and the time and position when the observing cycle began. Reports plotted on weather charts can be recognized by the quasi-equidistant alignment of data along the flight path. As with the AIREP system, the data are restricted to the routes and flight levels used by the aircraft participating in the system.
Data obtained automatically during ascent/descent are related to the predetermined pressure increments and will refer to the vicinity of the aerodrome of departure or arrival. However, due to the geographical separation of sectors used for approach and take-off and to the differences in descent and climb rates, systematic differences are to be expected.
3.4.4 Observing and reporting procedures
AIREPs are intended to provide air traffic services units and airline operators with reports necessary for monitoring flight progress. The reporting programme therefore includes technical information not required in meteorological reports. This information is eliminated before the meteorological portion of the reports is disseminated on telecommunication circuits.
The work load which the preparation of AIREPs represents for the aircrew affects the quality of reports and cannot be ignored. The present spacing of reports as well as the regulations governing exemptions is aimed at reducing the work-load and the clustering of reports in dense traffic areas.
Within AIDS, several hundred parameters (more than 2 000 with the newest system) are measured and recorded for safety investigations and diagnostic maintenance. The meteorological data included therein are stored within the system and can be extracted for predetermined time intervals. From the data stored within one hour, eight reports are compiled and transmitted as one bulletin.
The reporting programmes are determined in the AIREP system by the arrival time of the aircraft at fixed positions and in AIDS by certain time increments selected automatically, depending on the stage of the flight. The reports are therefore basically asynoptic.
3.4.5 Communications
For the air-to-ground transmission of AIREPs voice communication channels are used. Further dissemination at the ground involves the manual handling by operators at ATS/local MET/MET collectiong centres and GTS offices. Where appropriate, an airline office may be included in this complicated system. The handling at the ground must therefore be regarded as the main shortcoming of an otherwise very valuable system. The number of steps involved and the speed of handling the reports depend largely on appropriate local arrangements and means of telecommunication. Efforts should therefore be made at the national level to develop the most suitable procedures and techniques.
The use of AIDS leads to the automatic preparation, storage and transmission of reports. The latter is effected either by a relay to the ground via one of the meteorological geostationary satellites or by direct air-to-ground communication systems. Further automatic handling at the ground leads to a considerable reduction of errors and delays as compared with the AIREP system. Transmission times of only 10 minutes between latest observation at the host aircraft and reception by the user have frequently been reached.
3.4.6 Personnel and training
Making meteorological measurements and observations The observation of meteorological phenomena on board the aircraft is a part of pilots' training in which nNational Meteorological Services should co-operate as far as possible.
Personnel at aeronautical meteorological services engaged in the collection of AIREPS should be trained in the:
Application of standard coding procedures in AIREPs received;
Transformation of letter-type designators of reporting points into geographic co-ordinates;
Re-assembling of AIREPs in appropriate bulletins.
The personnel should also be made aware that the value of the reports for forecasting purposes diminishes rapidly with time; unnecessary delays in further processing should therefore be avoided.
3.4.7 Quality standards
For safety reasons very high quality standards are generally applied on the part of the operators to the measurements and reports. The quality of air-reports has been found to be comparable with radiosonde data. For a single level, the reports are much more accurate than satellite wind and temperature data.
Systematic errors noticed during the evaluation of observations received at meteorological offices need to be identified; the malfunctioning unit should be located if possible and the operator notified.

Procedures should be developed by the nNational Meteorological Services together with national airlines for continuously monitoring adherence to established reporting procedures, the quality of the reports, and the adequacy of the methods of dissemination.
3.5 AERONAUTICAL METEOROLOGICAL STATIONS
3.5.1 General
Although the aim of commercial aviation is to be independent of meteorological conditions, and although modern aviation has made considerable progress with respect to all-weather operations, flight safety is still weather related and atmospheric conditions still have a marked influence on the economy and regularity of commercial aviation. Moreover, the introduction of lower aircraft-operating minima and the increasing scale of operations have enhanced the requirement for reliable and complete aerodrome information. It is the task of aeronautical meteorological stations established at aerodromes and other points of significance to air navigation to provide this information. The observations and reports made by aeronautical meteorological stations are disseminated locally and to other aerodromes in accordance with regional air navigation agreements. The procedures for observation and reporting services are developed and promulgated jointly by WMO and ICAO on the basis of operational requirements stated by ICAO. The responsibility for providing the means to satisfy these requirements rests with WMO.3 (See the Guide to Practices for Meteorological Offices Serving Aviation (WMO-No. 732).
The basic document to be followed in making meteorological observations and reports at aeronautical meteorological stations is the material contained in the WMO Technical Regulations (WMO-No. 49), Volume II - Meteorological Services for International Air Navigation, Part [C.3.1] - Standards and Recommended Practices,43 section 4.
The day-to-day activities for the provision of meteorological information for aeronautical purposes call for close co-operation between the meteorological staff on the one hand and the users, such as air traffic services and airport management units, airline flight planning centres and aircrew, on the other. In particular, the type and accuracy of the data provided, the form and speed of their transmission to the users, the methods and duration of their documentation as well as the cost-effectiveness of the system should be regularly reviewed.
The importance of aeronautical meteorological stations for other parts of the GOS is underscored by the aerodromes’ share - approximately 35 per cent - of the total number of synoptic observations which are regularly available on a world-wideworldwide basis.
3.5.2 Instrumentation
3 The WMO Guide to Aeronautical Meteorological Practices is in preparation.
4 3 Except for a few minor editorial differences, Part C.3.1 of the WMO Technical Regulations, Volume II is identical to Annex 3 (International Standards and Recommended Practices - Meteorological Service for International Air Navigation) to the Convention on International Civil Aviation, commonly referred to as "Annex 3" in the context of ICAO documents.

The types of instruments used at an aeronautical meteorological station are, in general, the same as for a synoptic station. Certain instruments such as the ceilometer and transmissometer are, however, normally particular to aeronautical meteorological stations.
The demands for specific information for the approach and take-off areas, for the touch-downtouchdown zone or for portions of the runways will, particularly at aerodromes with all-weather operations, requires the installation of multiple instruments. In these cases, it must be decided which of the measurements is to be used on a routine basis for reports disseminated beyond the aerodrome or in appropriate broadcasts for aviation.
Where one instrument only is used for the measurement of an element essential for take off or landing, such as surface wind, cloud base and barometric atmospheric pressure, a duplicate instrument should be available in case of failure.
Instruments requiring electric power should be connected to an emergency power supply available at the aerodrome. In view of the importance of individual weather elements for the safety of take-off and landing operations and of the technical specifications of the instruments used, it must be determined whether uninterrupted availability of electric power is required or whether switching-over periods are acceptable and how they are to be limited.
At some aerodromes the installation of anemometers at distant sites or of other remote sensing devices suitable for the measurement of vertical wind shear or of gusts at the surface may be of advantage.
3.5.3 Location of meteorological stations and instruments
Special care is necessary in selecting sites for making observations or for the installation of instruments to ensure that the values are representative of the conditions at or near the aerodrome. It is particularly important that, while the siting and exposure of the instruments meet operational requirements, the instruments or their operation do not pose hazards to air navigation, and that the jet-blast or movement of aircraft on the aerodrome (taxiing, take-off runs, landing, parking, etc.) and the various aerodrome installations do not unduly influence the measured values. Instructions in this respect are contained in the Guide to Meteorological Instruments and Methods of Observation (WMO-No. 8), Chapter 2, Part II and in the Manual of Aeronautical Meteorological Practice (ICAO Doc. 8896-AN/893/3), Appendix C.
An important distinction has to be made between observations at aeronautical meteorological stations and synoptic observations. The latter aim at determining at one location a value of a meteorological element representative of a rather large area. Meteorological observations for aeronautical purposes are often made at several locations and need to be representative of more limited areas and times. As conditions vary from aerodrome to aerodrome and as the exact locations for which the data are needed are, due to obstruction limits, not always available for the installation of instruments, universally applicable guidance cannot be given. Detailed information on the representativeness of measurements and observations at aeronautical meteorological station can be found in the Guide to Meteorological Instruments and Methods of Observation (WMO-No. 8), Chapter 2, Part II: section 2.2 (surface wind), 2.3 (visibility), 2.4 (runway visual range), 2.5 (present weather), 2.6 (cloud), 2.7 (air temperature), 2.8 (dew point), 2.9 (atmospheric pressure).The listing below shows for which areas the various meteorological data should be representative for aeronautical purposes.
(a) Surface wind speed and direction Take-off area and touchdown zone of each runway at a height of 6 to 10 m;
(b) Runway visual range (RVR) At both ends and at the mid-point of a runway for which RVR is required;
(c) Height of cloud base Approach area, for precision approach runways the middle marker site:
(d) Temperature and dew-point Area above the runways at the average height of aircraft engines:
(e) Barometric pressure The official aerodrome elevation, for precision approach runways the relevant
threshold.
3.5.4 Observing and reporting programme
Observations are of several types, viz. (a) routine observations, (b) special and other non-routine observations, (c) continuous real-time observations, (d) synoptic observations.
(a) Routine observations
At aerodromes routine observations are normally made at hourly or half-hourly intervals depending on regional air navigation agreements. At other aeronautical meteorological stations observations are made as required by air traffic services units and aircraft operations.
(b) Special and other non-routine observations
At aerodromes, routine observations are supplemented by special observations which are made during the intervals between the routine observations. Special observations refer to specified conditions, involving the deterioration or improvement of one or more meteorological elements.
Other non-routine observations, such as observations for take-off and landing, are made as agreed between the meteorological authority and the appropriate air traffic services authorities.
(c) Continuous real-time observations
Information about certain meteorological parameters is required by air traffic services units and operators almost continuously and in real time. These include information on surface wind for take-off and landing and on cloud base (or vertical visibility) and runway visual range (RVR) for all weather operations.
As these requirements can normally not be met by a human observer it is preferable to use, as far as possible, integrated automatic systems for acquisition, processing and

dissemination/display of data.
(d) Synoptic observations
The regulations for surface synoptic stations (section 3.2) generally apply to aeronautical observations. As aeronautical meteorological observations have high priority, however, they must be completed first in case there are competing interests. In accordance with the Manual on the GOS (WMO-NO. 544), Volume I, Regulation 2.6.6, Part III Ffor the preparation of meteorological reports by aeronautical meteorological stations, the following observations are necessary:
Surface wind direction and speed; Visibility; Runway visual range, when applicable; Present weather; Cloud dataamount, height of cloud base, type of cloud, if necessary; Air temperature; Dew -point temperature; Atmospheric Ppressure values (QNH and/or QFE); Supplementary information concerning other significant meteorological conditions.
For some of the elements different procedures will apply for reports disseminated within and beyond the aerodrome.
Detailed instructions on observing and reporting of surface wind, visibility, runway visual range, present weather, clouds, air temperature, dew- point temperature and atmospheric pressure values as well as on the inclusion of supplementary information are contained in the WMO Technical Regulations (WMO-No. 49) , Volume II, [C.3.1.] 4.5 - to [C.3.1.] 4.12.
The instruments commonly used and the observing methods are discussed in Chapter 162, Part II of the Guide to Meteorological Instruments and Methods of Observation (WMO-No. 8).
3.5.5 Communications
The aim of communications with respect to aeronautical meteorological data and reports should be to achieve the best possible response time of the system observer-forecaster-traffic controller-pilot. Information required during a precision approach or in all-weather flight operations might even require direct means of transmission from the observing end to the cockpit.
Plain language meteorological reports required for take-off and landing should be disseminated by the quickest possible means available to the air traffic controller, the airline operators concerned and the meteorological forecaster if he is not co-located with the observer. The same applies to the dissemination of meteorological reports which are to be included in local ATIS or VOLMET broadcasts. An automatic dissemination/display system should be employed for measured data required on a real-time basis.
For coded meteorological reports standard meteorological or aeronautical
telecommunication systems such as the GTS, MOTNE or AFTN will normally suffice.
3.5.6 Personnel and training
The personnel at an aeronautical meteorological station, in addition to being fully trained in making the various meteorological observations, should be thoroughly familiar with the provisions of the regulatory material having a bearing on their work, in particular the WMO Technical Regulations, Volume II, [C.3.1] 4 and the Manual on Codes (WMO-No. 306), Volume I.1, Part A. Information on the training of Class IV meteorological personnel in the field of aeronautical meteorology is given in WMO Publication No. 258, Guidelines for the Education and Training of Personnel in Meteorology and Operational Hydrology.
In view of the requirements of observations at hourly and even half-hourly intervals, a full understanding of the observingational, coding and reporting procedures is needed if reports are to be prepared promptly. Additional observations may be needed at any time if the weather deteriorates or improves with reference to established criteria for this purpose, or at the request of the air traffic services units. Observers must be alert to such circumstances and prepared to make the observations called for. The importance to being alert to aviation safety should be reflected in appropriate duty rosters and the application of standards governing the maximum acceptable number of uninterrupted working hours for the observers.
3.5.7 Quality standards
As the safety of aviation is involved, quality standards must be set at a very high level and should, for essential elements, be followed on a real- time basis. Data whose acquisition, processing and display are carried out automatically should be monitored by the observer in order to enable him to initiate corrective action at once. For periods to be limited according to local agreements there should be a continuous record of the data provided to the users.
Instrument readings should be frequently checked, instruments recalibrated and, where necessary, duplicated or provided with an emergency power supply. Contacts with pilots after landing should be maintained in order to provide for a non real-time feedback on the representativeness of observations of surface wind, visibility, RVR and clouds.
3.6 RESEARCH AND SPECIAL -PURPOSE VESSEL STATIONS
There are many research and special -purpose vessels which are carrying out a variety of activities during oceanic expeditions but which are not always included in the Voluntary Observing Ships Scheme. Members with such vessels should do their utmost to ensure that all such vessels make surface and upper-air meteorological observations in accordance with the observingational programme for mobile sea stations (see section 3.2.2.3). Observations of upper-air winds in particular are extremely important in the tropics and in data-sparse areas.
Research and special -purpose vessels may also be equipped for the taking of bathythermograph observations during ocean crossings. The use of an expendable bathythermograph (XBT) does not oblige the ship to reduce speed or make course alterations. All arrangements for this type of observation are made within the framework of the joint WMO/IOC Integrated Global Ocean Services System (IGOSS). Procedures for the collection and exchange of BATHY and TESAC observations are specified in the Guide to Operational

Procedures for the Collection and Exchange of Oceanographic Data.5 The preferred times for BATHY and TESAC observations are 0000, 0600, 1200 and 1800 UTC. However, observations taken at any time are useful and should be transmitted.
3.7 CLIMATOLOGICAL STATIONS
3.7.1 Organization
Each Member shall establish a network of climatological stations in the national territory. The network of climatological stations should give a satisfactory representation of the climate characteristics of all types of land in the territory of the Member concerned (e.g. plains, hills and mountainous regions, plateaux, coasts, inland areas, valleys).
Each Member should maintain an up-to-date directory of the climatological stations in its territory as described in detail for synoptic stations.
The Guide to Climatological Practices (WMO-No. 13100) and the relevant parts of the Guide to Meteorological Instruments and Methods of Observation (WMO-No. 8) provide valuable complementary information on the subject. Chapter 32 of the former, covering climatological observations, is particularly relevant.
3.7.2 The climatological station network
Spacing of the climatological stations should not exceed 100 km where feasible (the network of manned stations should be supplemented when necessary and possible by automatic stations), and as near to this density as possible in deserts and other sparsely populated areas. Observations from more widely separated stations are also very valuable but stations of the network should not be further apart than 500 km.
Precipitation stations in the network should be more closely spaced but the density will depend on the geographical features and economic considerations.
3.7.3 Classification of stations
The climatological station network is composed of the following types of stations:
(a) Principal climatological stations (including reference climatological stations);
(b) Ordinary climatological stations;
(c) Precipitation stations; Stations for specific purposes.
(d) Stations for specific purposes.
3.7.3.1 Principal climatological station
5 IOC Manuals and Guides No. 3, 3rd revised edition, 198899, UNESCO or WMO Manual on the GTS (WMO. No. 386), Volume I, Part I.

At a principal climatological station, observations shall be made of all or most of the following elements:
Weather Wind Amount of cCloud amount Type of cloud Height of cloud base Visibility Air Ttemperature (including extreme temperatures) Humidity Atmospheric pressure Amount of Pprecipitation Snow cover Sunshine duration and/or solar radiation Soil temperature.
Each Member should arrange for its principal climatological stations to be inspected at least once a year and preferably twice a year (summer and winter). Special attention should be paid to noting any possible changes in the siting of the station. To this effect, it is recommended that every five years four pictures be taken from the thermometer screen, in the main compass directions (north, east, south, and west).
Each principal station should be located at a place and under an arrangement that will provide for the continued operation of the station for at least 10 years, and for the exposure to remain unchanged over a long period.
3.7.3.2 Reference climatological station
This type of climatological station derives from the principal climatological station.
Each Member should maintain at least one reference climatological station for different climatic regions. A reference climatological station should be sited with an adequate and unchanged exposure where the observations can be made in representative conditions. The surroundings of the station should not be altered over time to such an extent as to affect the homogeneity of the series of observations.
3.7.3.3 Ordinary climatological station
The considerations for establishing an ordinary climatological station are similar to those for a principal climatological station. However, the observingational programme may consist of elements as required by the Member (see Regulation 2.8.10 of the Manual on the GOS (WMO-No. 544), Volume I, Part III).
The operation of this type of station may be restricted to a much shorter period, but not less than three years. Inspection should occasionally be carried out, preferably during the winter season, to ensure a high standard of observation and the correct functioning of instruments.
3.7.3.5 Stations for specific purposes

These stations are established by the Member for a special observing programme which will be limited by the number of elements involved and the appropriate instrumentation. The special-purpose observing programme will determine its own frequency, spacing and timeliness (on an irregular basis).
3.7.3.4 Precipitation station ( a type of the station for specific purposes)
The operation and observing programme of these stations are confined to the precipitation element only. The instrumentation consists of a standard rain gauge (operated by the Member) or, in desert areas, by a totalizing rain gauge (mechanical or automatic). These may be supplemented by recording rain gauges. For the winter season, a snow gauge and measurement of the depth of snow will be required in many areas.
Each Member should arrange for its precipitation stations to be inspected at least every three years, or more frequently if necessary, to ensure the maintenance of a high standard of observation and the correct setting and operation of instruments. It is important that any changes in the surroundings of the site be noted. Proper action must be taken to ensure the correct functioning of the station and that the angle from the centre of the rain gauge to the height of any obstacle in the vicinity of the site does not exceed 45°.
3.7.3.5 Stations for specific purposes
These stations are established by the Member for a special observation programme which will be limited by the number of elements involved and the appropriate instrumentation. The special -purpose programme will determine its own frequency, spacing and timeliness (on an irregular basis).
3.7.4 Operation of stations
The instrumentation for observational requirements of a typical climatological stations isare described in Chapter 1, section 1.3.1, Part I of the Guide to Meteorological Instruments and Methods of Observation (WMO-No. 8).
Each Member should arrange for observations at any climatological station to be made at fixed hours, according to a standard time (UTC or other), which remain unchanged throughout the year (independent of the introduction, at certain periods, of daylight-saving hours by the authorities, i.e. summer time and winter time).
When fourtwo or more observations are made at a climatological station, they should be arranged forat times that reflect the signification diurnal variations of climatic elements.
When changes are made at the station (surrounding observingational site) or in a network (one station replaced by another), simultaneous observations should be carried out to ensure the correct observational values. When the changes are in the time of climatological observations, simultaneous observations should also be carried out at a skeleton network of representative stations for a period covering the major climatic seasons of the area at the previous times of observations as well as at the new ones.

3.7.5 Archiving
Every effort must be made to safeguard and preserve climatological data for future use.
3.8 AGRICULTURAL METEOROLOGICAL STATIONS
3.8.1 Organization
Each Member should establish in its territory a network of agricultural meteorological stations.
The network of agricultural meteorological stations should give a true representation of the existing agricultural areas (which are defined by biological and meteorological factors) to provide the required data. Therefore, the density of the network of each type of station should be adequate to delineate weather parameters on the scale and magnitude required for agrometeorologicalagricultural meteorological planning, operation and research, taking into account the agricultural potential and features of the country.
Each Member should maintain an up-to-date directory of the agrometeorologicalagricultural meteorological networks as described for synoptic stations. In addition, the following information for each station should be given:
Natural biomass, main agrosystem and crops of the area Types of soil, Pphysical constants and of soil profiles.
The Guide to Agricultural Meteorological Practices, 2nd edition (WMO-No. 134) deals in detail with the basic requirements of agricultural meteorology. Chapter 2 dealing with agricultural elements and their observation is particularly relevant.
The relevant parts of the Guide to Meteorological Instruments and Methods of Observation (WMO-No. 8) are also fundamental to the subject. Reference is made mainly to the chapters dealing with measurements of meteorological elements related to agrometeorologicalagricultural meteorological stations: Chapters 2, 4-11, Part I, 21 and 23; Chapter 221, Part II - Automatic meteorological stations; Chapters 241 and 3, Part III Quality control of measuring practices and procedures; as well as Chapter 25 Techniques for sampling surface variables.
3.8.2 Classification of stations
The agrometeorological station network is composed of the following types of stations: In accordance with the Manual on the GOS (WMO-No. 544), Volume I, Appendix, agricultural meteorological stations are classified as follows:
(a) Principal agrometeorological agricultural meteorological station;
(b) Ordinary agrometeorological agricultural meteorological station;
(c) Agricultural mesoclimatological surveys Auxiliary agricultural meteorological station;

(d) Precise physical observations of a non-routine or non-permanent character Agricultural meteorological station for specific purposes.
3.8.2.1 Principal agrometeorological station
At a principal agrometeorological station observations of the physical environment should be made as for climatological observations. In addition, some or all of the following should be included:
(a) Temperature and humidity of the air at different layers of the air adjacent to the ground (from ground level up to about 10 m above the upper limit of prevailing vegetation) including extreme values and duration;
(b) Soil temperature at depths of 5, 10, 20, 50 and 100 cm and at additional depths for special purposes and in forest areas;
(c) Soil water (volumetric water content) at various depths, with at least three replications when the gravimetric method is used;
(d) Turbulence and mixing of air in the lower layer (including wind measurements at different levels);
(e) Hydrometeors and water-balance components (including hail, dew, fog, evaporation from soil and from open water, transpiration from crops or plants, rainfall intensity, runoff and water table);
(f) Sunshine, global and net radiation as well as the radiation balance over natural
vegetation, and crops and soils (over 24 hours);
(g) Observations of weather conditions producing direct damage to crops such as frost, hail, drought, floods, gales and extremely hot dry winds;
(h) Observations of damage caused by sandstorms and dust storms, atmospheric pollution and acid deposition as well as forest, bush and grassland fires.
Observations of a biological nature include:
(a) Phenological observations;
(b) Observations of growth (as required for the establishment of bioclimatic relationships);
(c) Observations of qualitative and quantitative yield of plant and animal products;
(d) Observations of direct weather damage to crops and animals (adverse effects of frost, hail, drought, floods and gales);
(e) Observations of damage caused by diseases and pests;
(f) Observations of damage caused by sandstorms and dust storms and atmospheric

pollution as well as forest and savannah fires.
The principal agrometeorological station should be established as a key station for a specific agricultural area.
An example of the layout of instruments at an agrometeorologicalagricultural meteorological station is given in Figure III.18
Figure III.18 - Layout of instruments at an agrometeorologicalagricultural meteorological station in the northern hemisphere.
3.8.2.2 Ordinary agrometeorological station
At an ordinary agrometeorological station, the observational programme consists of the previously mentioned elements and some additional ones, mainly of a biological nature. The period of operation of this type of station may be restricted to a shorter period in comparison to that of a principal station and should serve as a supplementary station to an existing basic network.
3.8.2.3 Agricultural mesoclimatological surveys
This type of agricultural station is of a temporary nature which may vary, depending on the purpose, from a period of hours, parts of days (night observations) to weeks and months.

The required observations may be achieved by:
(a) Fixed stations equipped for the specific purpose, e.g. a survey (semi-automatic stations, automatic registering or transmitting stations);
(b) Mobile stations operated on or from a specially adapted vehicle or other means of transport (cable cars, etc.);
(c) Complementary observations taken in co-operation with another body to describe special mesoclimatic processes.
3.8.2.4 Precise physical observations of a non-routine or non-permanent character
This type of observation is taken for agricultural research and in micrometeorological conditions. The activities may be conducted in the open air or in a controlled climate (i.e. greenhouses, structures, buildings, etc.).
Observing programme of agricultural meteorological station is described in the Manual on the GOS (WMO-No. 544), Volume I, Regulations 2.11.5 and 2.11.6, Part III.
According the Manual on the GOS (WMO-No. 544), Volume I, Regulation 3.1.8, Part III, agricultural meteorological stations should be inspected not less than once every two years.
3.8.3 Operation of stations
The information given under section 3.7.4 above applies generally to agrometeorological stations.
3.9 SPECIAL STATIONS
3.9.1 General tasks and purposes of special stations
A wide range of special stations is used to measure or record meteorological variables of special interest. These stations provide specialized information which is important to the overall purpose of the WWW, although their main purpose is to meet national requirements as far as small- and mesoscales of meteorological phenomena are concerned.
Some types of special stations (radars, reconnaissance aircraft) can cover large areas in cost-effective ways and may create a certain level of redundancy which is required to verify or reinforce the routinely available data as well as to provide a level of insurance against catastrophic failure in any single system.
3.9.2 Types of special stations
3.9.2.1 Weather radar stations
3.9.2.1.1 General
Weather radar stations are in many cases co-located with surface or upper-air stations of

the basic synoptic network. Such stations should be established and equipped to carry out radar observations in order to secure information about areas of precipitation and associated phenomena and about the vertical structure of cloud systems. The information obtained from radar stations is used for operational purposes in synoptic meteorology (forecasting and warning of dangerous weather phenomena such as tropical cyclones), the generation of numerical analyses and guidance, aeronautical meteorology and hydrology, as well as for research purposes.
WMO Technical Note No. 181, Use of Radar in Meteorology (WMO-No. 625) contains useful guidance on the types of radar available, the uses to which they can be put, their methods of operation and on the practical aspects of siting and maintenance.
3.9.2.1.2 Site selection
Several principles to be considered when selecting a site for a radar station are:
(a) The location should be free of natural or man-made obstructions that would interfere with the radar beam. Local construction plans should be examined to identify future potential interference. Fixed targets should be as few as possible or at least not higher than 0.50 above the level of the radar aerial;
(b) Many national regulations require a survey to ensure that people living in the area surrounding the station site are not influenced by the microwave energy emitted;
(c) A licence for operating the radar at the planned site must be obtained from the radio-telecommunication authorities concerned in order to avoid any interference with any other installation.
For detailed information, see the Guide to Meteorological Instruments and Methods of Observation (WMO-No. 8), section 9.7.1, Chapter 9, Part II.
3.9.2.1.3 Capital equipment
Capital equipment needed for weather radar observations is given below.
Basic equipment Spares
Operational weather radar supplied by manufacturer:- Antenna- Transmitter/receiver- Control rack
Display systems:- Plan position indicator (PPI) - Range height indicator (RHI)Signal processing computer
Accessories

Power supply (between 5 and 10 kVA) with an automatic voltage regulatorRadomes (protective housings for the antennae of radars)Radar computer interfacesComputer used for precipitation measurementRecording devicesVisual display unitsIntercom system
3.9.2.1.4 Observing programme
At radar stations, the observing programme should include regular monitoring and/or recording of:
(a) Regional distribution, spatial characteristics (height, extension) of mean and high convective clouds and thunderstorms;
(b) Regional distribution, type and intensity of precipitation (hail, rain, snow);
(c) Regional distribution and intensity of turbulence (in clouds and in clear air using Doppler radar) and other dangerous phenomena.
Radar observations have been found most useful for:
(a) severe weather detection, tracking and warning;
(b) surveillance of synoptic and mesoscale weather systems;
(c) estimation of precipitation amounts.
Further information can be found in the Guide to Meteorological Instruments and Methods of Observation (WMO-No. 8), section 9.1.3, Chapter 9, Part II.
3.9.2.1.5 Organization
A radar meteorological observation is a manual or automated "evaluation" of the radar echoes received from meteorological targets, coded as a message and transmitted to various meteorological centres and other users at regular intervals.
Within an operational weather radar network, the distance between two stations should be a function of the effective radar range. In the case of a radar network intended primarily for synoptic applications, radars in mid-latitudes should be located at a distance of approximately 150 to 200 km from each another. The distance may be increased in latitudes closer to the Equator, if the radar echoes of interest frequently reach high altitudes. In all cases, narrow-beam radars will yield the best accuracy for precipitation measurements.
In general, that spacing is approximately 500 km. The density of the radar network depends on the radar capacity and the accuracy required for estimating areal precipitation.
Radar networks have a routine observingational schedule. It usually contains reflectivity over the area of measurement, echo movements, tops and remarks about special phenomena.
Each radar station may, however, increase its observation times or take continuous observations according to the current weather situation. List of presentation of measurements and products generated can be found in the Guide to Meteorological Instruments and Methods of Observation (WMO-No. 8), section 9.1.4, Chapter 9, Part II.
There should be at least one “principal” weather radar station or a national weather radar centre which is responsible for receiving radar observational data from local stations and synthesizing this data into a large-scale echo pattern for the entire network. The national weather radar centre should also be responsible for regular inspection and quality control of data of the network.
3.9.2.1.6 Operations
An up-to-date directory of weather radar stations should be maintained by each Member in its territory, giving the following information for each station:
(a) Name, geographical co-ordinates and elevation;
(b) Type of radar and some characteristics of the equipment used (wave length, maximum transmitting power);
(c) Normal observingational schedule.
A minimum radar network should consist of at least two radars together covering most of the service area. Where necessary, individual radar can operate in conjunction with others in neighbouring countries to form a network. These radars should be capable of producing precipitation estimates at up to one minute intervals with a minimum spatial resolution of about 1 km in some cases; resolutions of five minutes and 2 or 5 km are used in some systems as a compromise to meet most requirements within limited costs. Ground-level precipitation estimates from typical radar systems are made for areas of typically 2 km2 , successively for 5–10 minute periods.
In an automated radar network, each radar has its own on-site minicomputer which is
used to accept raw radar data, apply various corrections and transmit the data and products over dedicated telephone lines in a number of formats to a variety of locations, including meteorological offices.
A growing number of meteorological offices, governmental agencies, commercial users and water authorities receive either the composite images or graphics produced at the weather radar centre or single radar-images directly from the radar sites.
3.9.2.1.7 Communications
The regular radar data are coded in code forms (FM 20-VIII RADOB), the Manual on Codes (WMO-No. 306), Volume I.1, Part A or FM 94 BUFR , the Manual on Codes (WMO-No. 306), Volume I.2, Part B and C synthesized and then disseminated in a timely fashion through the national or regional telecommunication network. The type of communications equipment needed to disseminate data depends on the temporal resolution of the data, the level of processing and the quality of communications available (telephone lines, etc.).

3.9.2.1.8 Personnel
The types and numbers of weather radar personnel needed depend on the type of equipment used, the level of automation and the number of observations required.
The maintenance and technical personnel responsible for the weather radar station or the entire network must have specialized training in the maintenance and operation of the types of equipment used and a basic understanding of electronics and radar technique.
A station supervisor is necessary for periodic checking of the calibration and the interpretation methods used in manual or semi-automatic observations.
3.9.2.1.9 Quality standards
The relationship between surface rainfall and radar echo strength is unfortunately not fixed and geographically universal, There are also often significant echoes caused by ground clutter and anomalous propagation that are not due to rainfall. The difficulty of correcting the calculation of surface rainfall estimates objectively in real-time is one factor which should be taken into account when designing an interactive display system.
Besides the quality control of radar observations, a combined digital satellite and radar interactive system may enable its operators to use geostationary satellite data to extend the surface rainfall analyses beyond the area of radar coverage. This involves subjective judgement as well as algorithms that relate surface rainfall to cloud brightness and temperature.
3.9.2.2 Radiation stations
3.9.2.2.1 General
In view of the primary importance of solar radiation as well as the various fluxes of radiation to and from the Earth’s surface in the atmospheric processes and in the heat economy of the Earth, it is recommended that Members should establish at least one principal radiation station in each climatic zone of their territory and maintain a network of stations of sufficient density to permit the study of radiation climatology.
3.9.2.2.2 Site selection
Every effort should be made to site radiation stations so as to allow adequate exposure of the instruments and to permit representational observations to be made. The location should have a free horizon, undisturbed by obstructions. The exposure and the surroundings of the station should not alter over time to such an extent as to affect the homogeneity of the series of observations.
3.9.2.2.3 Capital equipment
Within a network of radiation stations, at least one type of the following meteorological radiation instruments is used:

Basic equipment SparesPyrheliometer Supplied by manufacturerSpectral pyrheliometerSun photometerPyranometerSpectral pyranometerNet pyranometerPyrgeometerPyrradiometerNet pyrradiometer
AccessoriesCalculator Microcomputer
For details concerning radiation instruments and measurements, reference should be made to the Guide to Meteorological Instruments and Methods of Observation (WMO-No. 8), Chapters 97 and 8, Part I.
3.9.2.2.4 Observing programme
The different observing programmes at principal and ordinary radiation stations are set down in the Manual on the G lobal O bserving S ystem (WMO-No. 544)., Volume I, Regulations 2.12.3.5 and 2.12.3.6, Part III.
In a world-wide network of radiation measurements, it is important that the data be homogeneous with respect not only to calibration, but also to times of observation.
The terminology of radiation qualities and measuring instruments and the classification and calibration of pyranometers are given in the Guide to Meteorological Instruments and Methods of Observation (WMO-No. 8), Chapters 7, Part I.
3.9.2.2.5 Organization
The special requirements of all potential users should be considered in planning a radiation station network. Answers are therefore needed to the following questions:
(a) How many stations are necessary to satisfy the requirements with respect to the spatial resolution of the different kinds of meteorological radiation quantities?
(b) Which observationing programme for each of the radiation quantities has to be set up for real-time and non-real-time purposes?
The principal radiation station should be closely connected to or co-located with the National Radiation Centre which is responsible for the calibration and checking of all radiometric instruments used within the whole national network of radiation stations. In order to fulfil this task in accordance with the relevant standard meteorological practice (see Regulation 2.4.2.5.2.5 of Part III of the Manual on the GOS), the National Radiation Centre is responsible for:

Participation in comparisons against standards of reference radiation instruments on a global and regional level at least every five years;
Monitoring the calibration constant of the reference instrument by comparison with secondary standards at the principal station;
Recalibrating regularly all radiation instruments used within the national radiation network;
Securing a high scientific level by further development of the measuring and calibrating methods.
Detailed specifications for a National Radiation Centre are given in Chapter 97, Annex 7.C, Part I of the Guide to Meteorological Instruments and Methods of Observation (WMO-No. 8).
3.9.2.2.6 Operations
The comprehensive fulfilment of the tasks of a National Radiation Centre is a prerequisite of an adequately equipped and well operating national radiation network.
The radiation measurements as specified in Chapter 97, Part I of the Guide to Meteorological Instruments and Methods of Observation (WMO-No. 8) can be organized within the framework of meteorological stations. An up-to-date directory of radiation stations shouldshall be maintained by each Member in its territory, giving the following information for each station, as well as the information requested in Regulation 2.12.3.3 in Part III of the Manual on the GOS (WMO-No. 544), Volume I . :
(a) Name and station index number;
(b) Type of radiation measurement carried out (e.g. direct or indirect solar radiation, global radiation, sky radiation, ultra-violet radiation, balance of solar radiation, duration of sunshine);
(c) Normal schedule for observations or measurements made (standard measuring programme).
The National Radiation Centre should be responsible for preparing and keeping up to date all necessary technical information for the operation and maintenance of the national network of radiation stations.
The results of all radiation measurements made at a radiation station should be collected and/or transmitted to a designated centre according to arrangements which guarantee a timely utilization of the data for operational as well as scientific research purposes. The collection of data may be accomplished either through telecommunication channels or by mail.
3.9.2.2.7 Communications
Some of the regularly measured radiation data, such as diffuse solar radiation or sky
radiation as well as sunshine duration, are coded and then disseminated in a timely fashion to the National Meteorological Centre for further data processing.
Whereas data on the duration of sunshine duration is coded in tenths of hours and included once a day in section 3 of code form FM 12-IXI SYNOP (Manual on Codes (WMO-No. 306), Volume I.1, Part A) for regional exchange of meteorological data, data on global radiation and sky radiation may be coded and distributed nationally in connection with other synoptic observations using the same collecting procedures and telecommunication channels.
3.9.2.2.8 Personnel
The staff of the National Radiation Centre should provide for continuity and should include at least one qualified scientist with experience in radiation. The staff is also responsible for giving instructions to the staff of any other stations in the network and for maintaining close liaison.
The observers at the radiation stations must be trained in order to ensure accurate and reliable radiation data. Special training may be needed in some cases where sophisticated equipment and instruments are to be used by the observers.
3.9.2.2.9 Quality standards
All radiation data intended for permanent storage or non-real-time investigations should be subjected to quality control either manually or automatically. Errors and obscurities should be resolved promptly as soon as possible.
3.9.2.3 Atmospherics detection station
3.9.2.3.1 General
Atmospherics (shortened to or "sferics") may be defined as electromagnetic waves resulting from electric discharges, e.g. from lightning in the atmosphere.
The main purposes of this kind of special station are to deduce the presence of atmospherics from observations and to classify their activities. Technical progress now offers the prospect of locating distant thunderstorms by means of automatedic atmospherics detection systems.
Certain characteristics of atmospherics, when determined by special techniques, can usefully be employed in combination with other observations, especially for mesometeorological purposes, to analyse severe storms in order to determine their characteristics, forecast their severity and improve early warning to the community. In particular, lightning detection networks have proven useful in augmenting radar detection of storms, especially in mountainous terrain where radar interference may occur.
More detailed information on locating the sources of atmospherics, and especially on types of equipment, can be found in Chapter 157, Part II of the Guide to Meteorological Instruments and Methods of Observation (WMO-No. 8).
3.9.2.3.2 Site selection
For reasons of cost-effectiveness the lightning location systems are normally installed either at the site of manned or automatic synoptic stations or at the site of weather radar stations. If a lightning or thunderstorm sensor is to be used for automatic detection and reporting of the presence (or absence), direction, range, intensity and movement of such phenomena within an operational network of atmospherics detection stations, the distance between two stations should be not more than 200150 to 300250 km.
The area covered by a system of at least three atmospherics detection stations can be extended to several tens of kilometres in a local warning system and to 200 to 400 km in a regional warning system.
Before making significant installation investments it is necessary to study site facilities, especially the availability of electrical power, telecommunication facilities and availability of staff. The considerations for the site selection of automatic weather stations largely apply in this case as well.
3.9.2.3.3 Capital equipment
The capital equipment needed for atmospheric direction finders and/or local lightning detectors is listed below. The type of equipment to be used depends on the purpose for which the observations are needed.
Equipment Spares
Two orthogonal loop aerials Supplied by manufacturerNondirectional aerialTwin amplifiersAutomatic direction-finder/Local lightning detection systemPrecision electronic clocks
Accessories
Calculator or microcomputer facilitiesTelecom terminalDigital communication channels
For details concerning locating the sources of atmospherics reference should be made to the Guide to Meteorological Instruments and Methods of Observation (WMO-No. 8), Chapter 157, Part II.
3.9.2.3.4 Observing programme
To derive the full use of lightning location data, real-time collection, transmission and processing are necessary. The observing programme should take into account the requirements of different users and should be employed in conjunction with other observing systems such as radar and satellite information. The current operational applications include:

Electrical power utilities and transmission (permitting the rerouteing of transmissions around high-risk areas);
Forest fire control (permitting the prompt elimination of smouldering fires caused by lightning strikes after hot and dry periods);
Aviation (providing air traffic controllers and pilots with real-time data necessary to veer aircraft around severe storm cells);
Mesometeorology (permitting the timely termination of sensitive activities such as fuelling, arming and blasting operations, all of which are extremely sensitive to lightning discharges: improving early warning of severe storms to the community).
The observing programme depends on the type of equipment used at the observing site, e.g.:
Direction- finders (need an optimum distance of 500 to 1 000 km between the stations;
Techniques for arrival-time differences Time-of-arrival receivers (the number of stations for an effective service is five);
Local lightning detectors (effective lightning counters are useful only within a radius of about 20 to 50 km);
and on the type of measuring system employed, e.g.:
Manual systems (e.g. only for sampling periods H-10 to H; continuous observation is not practicable);
Semi-automatic systems (computational facilities are needed);
Automatedic systems (a sampling process with time provided for communications and data processing).
3.9.2.3.5 Organization
Within an operational network of atmospherics detection stations strong organization principles must be followed and a control station is necessary. Automatic systems are preferred where the prerequisites for a fully automatedic network are given.
3.9.2.3.6 Operations
Lightning location systems are being used not only for operational purposes, often parallel with weather radar observations but also for non-real-time or research activities.
In general, manual or automatic plotting of the events onto charts during periods of one day or one month (according to diverse requirements) has to be carried out. In any case the events should be recorded only cumulatively, e.g. for making decisions on planning of electric

power lines.
3.9.2.3.7 Communications
With a leased telephone system linking the observing stations and the control station, visual as well as automatic selection can be made.
In automatic systems digital communications channels are needed for continuous operation.
3.9.2.3.8 Personnel
For the operation of a network of manned atmospheric detection stations, at least one observer is needed for each station. He must be qualified to carry out this job effectively, including calibration and testing of the equipment as well as careful reading of the different measuring scales. In some countries lightning information may be purchased from companies who maintain their own networks.
In an automatedic system the task of supervising the error-free operation of the lightning location sensor may be carried out by an ordinary observer with special training.
In modern equipment, a built-in microprocessor controls the data collection, derives an estimate of thunderstorm movement and intensity, and formats the processed thunderstorm data for transmission to the automatic weather station and/or to the meteorological office concerned. In this case, an electronics expert should be available for routine maintenance and repair.
3.9.2.3.9 Quality standards
Exact calibration of the equipment used in the determination of the location of atmospherics is not a simple matter and errors can arise. Corrections for the errors of a particular direction-finding site have to be determined when it is brought into use and revised from time to time in the light of continuing experience.
A modern lightning location sensor is able to detect the presence or absence of thunderstorms within a radius of about 100 to 150 km using a specially designed receiver which is sensitive to the radio energy generated by lightning but at the same time is immune to background (non-lightning) noise.
Other circuits in the sensor determine the direction and range of thunderstorms with an accuracy equivalent to that of a human observer.
3.9.2.4 Meteorological reconnaissance aircraft stations
3.9.2.4.1 General
A meteorological reconnaissance aircraft station is defined as a station situated in a meteorological reconnaissance aircraft. Observations by aircraft can provide a valuable addition to the meteorological information acquired by more conventional methods. As a result of the latest developments in the techniques and instruments for automatedic meteorological
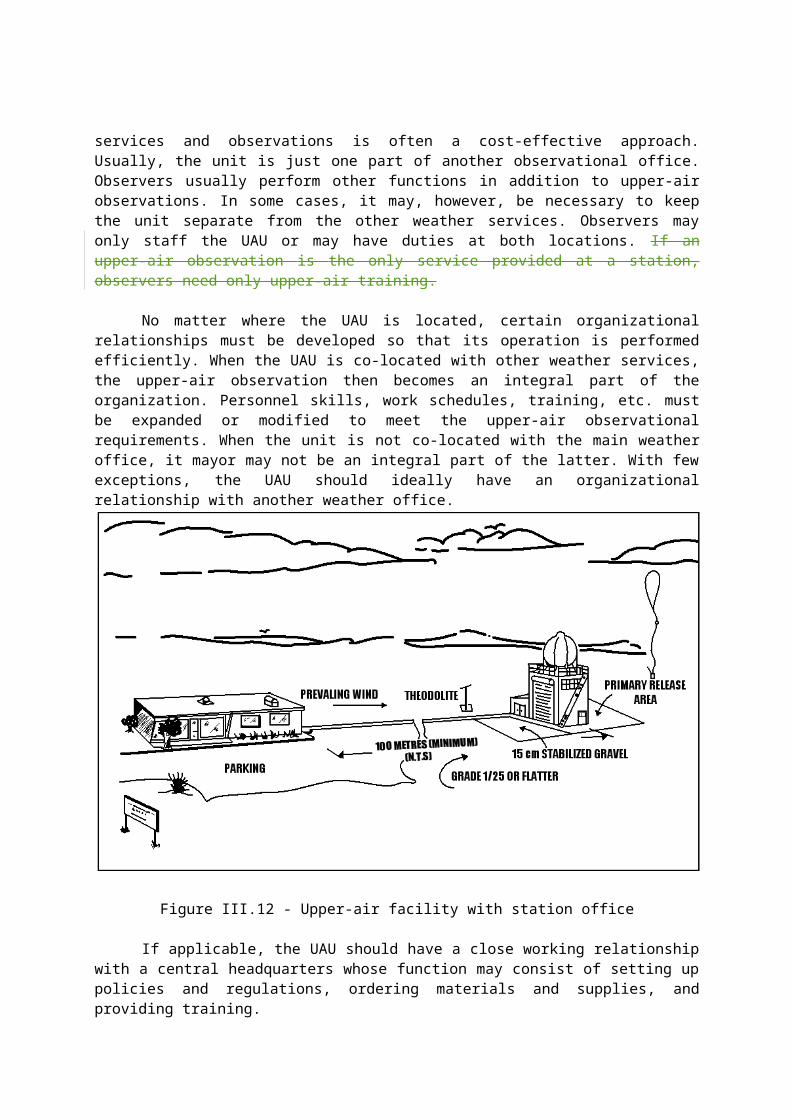
observations and reporting by aircraft using space-based telecommunication facilities, modern equipment installed in wide-bodied commercial aircraft on long-distance routes can provide valuable upper-air temperature, humidity and wind data. The information obtained in this way, particularly from remote and inaccessible areas of the world where routine surface-based observations are sparse or non-existent, is of great value.
Since commercial aircraft are bound to their flight routes and timetables, there is a continuing need to organize routine or special aircraft weather reconnaissance flights, e.g. for hurricanes. Such meteorological reconnaissance aircraft should be devoted exclusively to the task of meteorological observing, and therefore adequately equipped with meteorological instrumentation and performing the required pattern of flight without regard to any other commitment.
The instructions in the section 2.12.6 on meteorological reconnaissance flight observations in Regulation 2.12.6 in of Part III of the Manual on the GOS (WMO-No. 544), Volume I should be followed. Detailed guidance regarding observations from meteorological reconnaissance flights are given in Chapter 18 of the Guide to Meteorological Instruments and Methods of Observation (WMO-No. 8).
3.9.2.4.2 Site selection
The site selection for the air base of meteorological reconnaissance aircraft and the type of reconnaissance flight plan vary according to the purpose of the mission and depend on other conditions as well. In some cases where modern instrumented aircraft with satellite data links to the NMC or the meteorological offices concerned are available, the aircraft range has to be taken into account when planning the flight track as triangles or polygons in order to cover as great a synoptic area as possible.
If, for example, reconnaissance flights are planned for research activities in tropical cyclones in order to find out the position of vortex centre, maximum wind and minimum sea-level pressure (or isobaric height), then a variety of meteorological variables within 150 km of the storm centre are necessary to produce both analysed fields and detailed storm tracks in real time.
3.9.2.4.3 Capital equipment
The aircraft used should be equipped according to the reconnaissance task with remote-sensing technology, a video recording device and, if possible, meteorological instruments providing observations of pressure, temperature and humidity.
A list of the capital equipment needed is given below:
Basic equipment
- Standard navigational equipment- Special meteorological instrumentation appropriate to the aircraft- Weather radar equipment (in combination with navigational radar)- Aircraft-borne sensors - Passive sensors to measure terrestrial gamma radiation (snow-water equivalent and soil

moisture)- Active microwave sensors to measure sea-ice thickness and snow depths
Accessories
- Automatic equipment for recording. (The equipment may include microcomputers for data pre-processing)
For details concerning meteorological observations from reconnaissance aircraft reference should be made to the Guide to Meteorological Instruments and Methods of Observation (WMO-No. 8), Chapter 18.
3.9.2.4.4 Observing programme
The observationing programme may be fixed in advance or varied on a flight-to-flight basis. In general, a fixed programme in which the aircraft makes flights at the same time daily, along identical tracks and with altitude variations at the same geographical points, is most suitable for synoptic or area reconnaissance. The aircraft usually reports location, pressure, temperature, winds and altitude, and some are specially fitted with meteorological radar.
3.9.2.4.5 Organization
The type of aircraft selected for meteorological reconnaissance flights is best determined by the task to be performed. (With regard to the most probable tasks, some guidance is given in Chapter 18 of WMO-No. 8).
3.9.2.4.6 Operations
Operationally, flights of three general types are available to the NMC or the meteorological office, differing according to the purpose for which the information is required and hence the type of observation to be obtained:
(a) Low-level flight, in which the aircraft simulates, as closely as possible, a series of normal synoptic surface observations;
(b) Vertical flight, providing a vertical cross-section of the atmosphere at or near a fixed point;
(c) High-altitude flight, in which a horizontal cross-section of the observable parameters is given at a chosen level.
In practice, a single flight may be devoted to anyone or to any combination of these conditions. The flight plan may consist only of a vertical ascent over base, or of level flights at one or more altitude, with or without measurements taken as vertical soundings during the ascents and descents between levels.
3.9.2.4.7 Communications
Adequate means of communication, related to the range of the meteorological

reconnaissance flight and the amount of data to be transmitted, are required.
If limited computing capacity prevents extensive data processing aboard the aircraft, then the unanalysed observations have to be sampled at short intervals (some minutes) and transmitted at high speed to the NMC or the meteorological office concerned where they can be processed together with other available meteorological data.
3.9.2.4.8 Personnel
The personnel requirements depend on the type of aircraft, the quantity and nature of the special instrumentation and the exact purpose of the meteorological reconnaissance aircraft station.
To derive full value from the flight, at least one member of the crew should be a meteorologist specially trained in making aircraft measurements and observations. Certain circumstances may necessitate accepting a regular crew member for this task.
Ground personnel to support the meteorological reconnaissance flights should be highly qualified for both aircraft and instrument maintenance.
The meteorological group at each base should be headed by a senior meteorologist, who should himself regularly take part in flights and should train and encourage his staff to develop further the standards of air observing.
3.9.2.4.9 Quality standards
Accurate height and airspeed measurements are essential, and the necessary corrections to the instruments should be readily available.
Special meteorological instrumentation is required and should be chosen and installed to provide adequate accuracy for the purpose.
3.9.2.5 Meteorological rocket station
3.9.2.5.1 General
Meteorological rocket sondes are used to obtain information on atmospheric parameters above the altitude reached by radiosondes. For practical and economic reasons no attempt is usually made to obtain data over the whole range. Thus, measurements by sounding rockets are limited to the stratosphere and mesosphere from about 20 km up to about 80 to 100 km above the Earth's surface.
Data obtained by rocket sonde systems are mainly used for the calibration and verification of vertical temperature profiles derived from satellite infra-red radiometers.
At the present time, only a few meteorological rocket stations are in operation.
3.9.2.5.2 Site selection

The main principles to be considered when selecting a site for a meteorological rocket station are:
There must be a survey to ensure a high level of security for the people living in the vicinity of the planned launching site;
A licence for the launching site, which must not be located within air traffic zones, shall be applied for and obtained from the authorities concerned, including those responsible for air traffic control;
The launching schedule must be checked and approved by the authorities concerned.
Problems in connection with safety and high costs tend to limit the number of stations and the frequency of launching.
Two world-wide sounding cross-section networks located approximately along the meridians 60ºE and 70ºW have been formed with close international co-operation. 3.9.2.5.3 Observing programme
The elements observed or computed include temperature, wind direction and speed. By setting down dates and times for launching it has been possible to prepare meridional, cross-sections of the upper atmosphere.
3.9.2.5.4 Organization
A central body, World Data Centre A, undertakes collection of the data and the various exchanges of data between each participating Member. By means of these data, systematic studies are undertaken, e.g. studies of the general circulation, solar high-atmosphere relationships, correlation between geomagnetism and meteorological parameters, composition of standard atmospheres, checking satellite data, stratospheric warming.
3.9.2.5.5 Operations
For altitudes greater than 20 km the meteorological variables such as temperature, wind and air density should be determined for mandatory and significant levels.
The launching programme should be based on international agreements. Many different types of rocket and sensor are in use and various techniques are employed for data reduction.
3.9.2.5.6 Communications
For each launching, a report, known as ROCOB, is compiled and disseminated over the Global Telecommunication System.
3.9.2.5.7 Personnel
The types and number of staff at a meteorological rocket station depend on the
equipment used, the level of automation and expertise, and the number of rocket launchings per week.
The station must have one person responsible for all facets of the station operation; he should be one of the most experienced members in this field. Qualified scientists and engineers are necessary for the preparation, execution and interpretation of the rocket launching.
3.9.2.5.8 Quality standards
In order that the results obtained by the various existing systems may be uniform, international comparisons have been conducted.
Modifications to certain measuring systems and laboratory experiments should be carried out after each comparison in order to make the various systems and the evaluation of corrections more uniform.
3.9.2.6 Globe Atmosphere Watch stations
3.9.2.6.1 General
The WMO Global Atmosphere Watch (GAW) is designed to meet the need for monitoring, on a global and regional basis, the chemical composition and related characteristics of the atmosphere. Such information is required to improve understanding of the behaviour of the atmosphere and its interactions with the oceans and the biosphere and to enable prediction of the future states of the Earth system. The GAW integrates many monitoring and research activities involving the measurement of atmospheric composition and includes both the WMO Background Air Pollution Monitoring Network (BAPMoN) and the Global Ozone Observing System (GO3OS). BAPMoN stations and special ozone stations have been in operation for more than two decades. But there is still concern regarding uniformity of quality, timeliness and completeness of the data record.
Atmospheric chemical observations should be carried out at GAW stations with the same attention as is given to the measurements of other meteorological parameters. National meteorological and/or environmental protection services are encouraged to ensure that the chemical composition observations become an integral part of atmospheric observations in general.
The network of GAW stations comprises the following two main categories of station:
(a) Global stations, formerly called ’baseline’ stations, are established to provide measurements needed to address atmospheric environmental issues of global scale and importance (e.g. climate change, depletion of the ozone layer, etc.).
It is considered that the required number of global stations should be such that a minimum of one per principal climatic and ecological zone is achieved. Towards this goal, Members are being encouraged to establish and/or to co-operate in establishing about 30 stations of this category at selected sites.
(b) Regional stations, formerly 'regional stations' and/or 'regional stations with extended

programmes’, are established to provide measurements primarily to help assess regional aspects of global atmospheric environmental issues as well as atmospheric problems in various regions or countries (e.g. acid rain, ozone near the surface, deterioration of ecosystems and materials, air pollution in rural areas, etc.).
The number of regional stations should allow regional aspects of global environmental issues and environmental problems of interest to the rRegion or country(ies) concerned to be adequately addressed. To this end, Members are being encouraged to establish at least 3400 stations of this category.
For further information, see the WMO Technical Regulations (WMO-No. 49) , Vol. IVolume I, Chapter B.2 - Global Atmosphere Watch (GAW), as well as the Manual on the Global Atmosphere Watch (in preparation) and the Guide on the Global Atmosphere Watch the Global Atmosphere Watch Guide (WMO/TD-No. 553) and Global Atmosphere Watch Measurements Guide (WMO-No. 143). 3.9.2.6.2 Site selection
Global Atmosphere Watch stations must be established only at sites where direct pollution effects can be avoided. For this reason strict siting criteria have been established for each of the two main categories of station which should be taken into consideration when selecting a site for such kind of station:
(a) Global stations
Each global station should preferably be located in a remote area where no significant changes inland-use practices are expected for the coming decades within at least 50 km in all directions from the station. The site should be away from major population centres and major highways, preferably in a principal terrestrial biome or on an island, entirely free of the effects of local population and nearly free of the influence of regional pollution sources at least 60 per cent of the time, evenly distributed over the year. The site should at most infrequently experience direct effects from natural phenomena such as volcanic activity, forest fires and severe dust storms.
Each global station should have a complete set of surface meteorological observations and be located at or near (50-70 km) an upper-air synoptic station.
(b) Regional stations
Stations of this category should preferably be located in rural or any other areas where the effects of local sources of air pollution are minimal. They are expected to have sufficient longevity as to ensure that the trends in the values of the parameters measured are representative of conditions over the rRegion of interest.
Regional stations should also have a complete set of surface meteorological observations and be co-located with, or located near (50-70 km), an upper-air synoptic station.
The siting requirements may also differ depending on the measurement programme,

taking into account the various specialities of elements to be monitored. (For detailed information see the WMO Guide on the Global Atmosphere Watch.)
3.9.2.6.3 Capital equipment
The capital equipment needed for GAW stations depends on the purpose of the station and differs mainly according to scientific objectives and technical feasibility for the monitoring programme concerned.
For details concerning the equipment see the Guide on the Global Atmosphere Watch.
3.9.2.6.4 Observing programme
The observing programmes may differ according to the recommended priority to be given to the measurement of atmospheric constituents at global stations and at regional stations as laid down in the Manual on the G lobal O bserving S ystem (WMO-No. 544), Volume I, Regulations 2.12.8.4, 2.12.8.5 and 2.12.8.6, Part III, as well as in Chapter B.2 of the Technical Regulations, Vol. I (WMO-No. 49), Volume I, Chapter B.2. For further information, see the Guide to Meteorological Instruments and Methods of Observation (WMO-No. 8), Chapter 17, Part I.
According to GAW regulations and practices at each global station, measurements shall be carried out on all or most of the following elements:
(a) Greenhouse gases: carbon dioxide, chlorofluorocarbons, methane, nitrous oxide, tropospheric ozone, water vapour;
(b) Ozone: near the surface, total column, vertical profile, related precursor; gases; 6
(c) Radiation and the optical depth or transparency of the atmosphere; turbidity, solar radiation, UV-B radiation, visibility, total aerosol load (concentration near the surface, in a marine or continental background and, when possible, vertical profile up to the tropopause);
(d) Chemical composition of rain, snow and clouds;
(e) Reactive gas species: sulphur dioxide, reduced sulphur species, oxides of nitrogen, reduced nitrogen species, carbon monoxide, volatile organic compounds (VOCs) peroxyacetyl nitrate (PAN), hydrogen peroxide (H2O2) and others;
(f) Physical and chemical characteristics of atmospheric particles, including mineral aerosols;
(g) Radionuclides: krypton-85, radon, tritium, isotopes of selected substances;
(h) Routine measurements of the classical meteorological elements;
(i) Chemical composition of water in the soil and plants, in collaboration with other interested organizations;
6 Detailed information on ozone observing stations is contained in the section 3.9.2.6.8.
(j) Cloud condensation nuclei and ice nuclei;
(k) Integrated air samples for archiving.
At regional stations, measurements should be made of as many or as few of the elements listed above and others as the needs of the rRegion or country dictate. It is recommended that the core measurement programme should include tropospheric ozone, precipitation chemistry, solar radiation (direct, total, diffuse), ultraviolet radiation, methane, carbon monoxide, aerosol composites, and carbon black in precipitation and in aerosols, in addition to the standard meteorological parameters.
3.9.2.6.5 Organization and operation
The basic responsibilities for monitoring the operation of the GAW shall rest with participating Members.
All the GAW stations are operated by Members in accordance with the Manual on the Global Atmosphere Watch Global Atmosphere Watch Measurements Guide (WMO-No. 143). Collection of the data and preparation for WMO data publication are undertaken by the GAW Data Centres.
3.9.2.6.6 Central collection, publication and availability of data
GAW data are centralized and published as follows:
(a) The agency operating the station(s) in each participating country submits all data from the station(s) on data reporting forms or magnetic tapes/cassettes of agreed formats to:
Centre Data type
(i) World Ozone Data Centre Ozone, UVand Ultraviolet Radiation Data CentreAtmospheric Environment
service (AES)Meteorological Service of Canada4905 Dufferin StreetDOWNSVIEW,Toronto, OntarioCanada M3H 5T4
(ii) National Climatic Data Center Turbidity, precipitation(NCDC) chemistry and suspendedFederal Building particles151 Patton AvenueASHEVILLE, NC 28801-5001USA

(iii) WMO World Data Centre for Greenhouse and otherGreenhouse Gases atmospheric gases,Japan Meteorological Agency (JMA) except ozone1-3-4 Ote-machi, Chiyoda-kuTOKYO 100-8122Japan
(iv) World Radiation Data Centre Total solar radiation,Voeikov Main Geophysical radiation balance,Observatory sunshine duration7 Karbyshev Street1940218 SAINT PETERSBURGRussian Federation
(b) The NCDC extracts, processes and prepares for publication the turbidity data. Data for the years up to 1992 have been published in Global Atmospheric Background Monitoring for Selected Environmental Parameters. BAPMoN Data for (year), Volume I - Atmospheric Aerosol Optical Depth;
(c) The NCDC also forwards the processed turbidity data and the unprocessed data on precipitation chemistry and suspended particles to the following Centre where the turbidity data are archived and the other two data types are processed, prepared for publication and also archived:
WMO Collaborating Centre on Background Air Pollution Data Exposures and Analysis Research Branch, Atmospheric Research and Exposure Assessment Laboratory, Environmental Protection Agency (EPA), Research Triangle Park, NC 27711, USA.
Annual data reports on precipitation chemistry and suspended particles through 1984 have been published in Volume II of the publication mentioned in paragraph (b) above;
(d) Every two months, the Centre at AES in Canada processes all ozone data (surface, total column, vertical distribution) and publishes the Ozone Data for the World (ODW). The Centre also publishes an Index which contains the list of stations, a station catalogue with information on stations (names, organizations operating the stations, types of observation, types of instrument used, observationing programmes) as well as a catalogue of available ozone data (stations, period, data type, ODW volume numbers in which the data are contained);
(e) The Centre at JMA processes and publishes every six months the data for which it is responsible.
Details on GAW data availability on magnetic tapes/diskettes, including conditions and procedures for ordering, can be obtained directly from the Centres indicated in paragraphs (a) (i), (iii), (iv) and (c) above. Copies of published BAPMoN or ozone data volumes, subject to availability in stock, can be obtained upon request, respectively from the WMO Secretariat and from the Centre mentioned in paragraph (a) (i) above.

3.9.2.6.7 Communications
Each Global Atmosphere Watch station should retain its own complete original data record and documentation of the station operations. The operating agencies will make whatever use of these data as suits their needs. However, accessibility to the entire reservoir of data is essential, and this should be accomplished through centralized archiving. All data from GAW stations should be sent every two months to the relevant GAW Data Centre (see list in section 3.9.2.6.6).
3.9.2.6.8 Global Atmosphere Watch - ozone observing stations
3.9.2.6.8.1 General
In view of the radiation properties of ozone as a minor atmospheric constituent, this gas is a significant contributor to the radioactive radiation energy balance of the atmosphere. In addition to its radiation properties, ozone reacts photochemically with many other trace species, some of which are anthropogenic in origin. The meridional and vertical distributions of ozone in the atmosphere are determined by a complex interaction of atmospheric dynamics and photochemistry.
Ozone observing stations are established within the framework of the Global Ozone Observing System (GO3OS) which has been promoted by WMO since the mid-1950s and has now become a part of the Global Atmosphere Watch (GAW). These stations measure regularly the vertical distribution of the ozone in the troposphere and the stratosphere, whereas the surface ozone near the ground has been measured usually at selected GAW (background pollution) stations.
The available observational data have documented the geographic and seasonal average ozone distributions and have indicated the presence of variations on many time and space scales. These variations are, in part, associated with meteorological processes and may also be affected by anthropogenic and solar influences. An improved representation of the global ozone distribution is essential to provide a definitive pattern of the space and time variations of ozone over the globe and for periods up to a decade or longer.
The following twothree characteristics of atmospheric ozone should be routinely measured and reported from ozone observing stations:
(a) Surface ozone;
(ab) Total ozone ; , referring to the total amount of ozone contained in a vertical column in the atmosphere above the ground; and the
(bc) Vertical profile of ozone . , expressing the ozone concentration as a function of height or ambient pressure.
Members establishing ozone observing stations should follow Regulations 2.9.7.2 and 2.9.7. 3 in Part III of the Manual on the GOS (WMO-No. 544). For details on instruments and methods of observation as well as about their exposure, sources of error, comparison, calibration

and maintenance, reference should be made to Chapter 16, Part I (Measurement of ozone) of the Guide to Meteorological Instruments and Methods of Observation (WMO-No. 8) and to the Guide on the Global Atmosphere Watch the Global Atmosphere Watch Measurements Guide (WMO-No. 143).
3.9.2.6.8.2 Network considerations
The site selection for an ozone observing station depends mainly on the types of routine observations of ozone in the atmosphere intended to be made and available facilities. Observing sites should be selected so as to minimize effects of pollution and cloudiness as much as possible. Total ozone is determined from ground-based and satellite-borne instruments, and vertical ozone profiles are derived from ground-based, balloon-sonde, rocket sonde and satellite techniques.
The Global Ozone Observing System integrated in the GAW takes account of concern for the quality control and cross-validation of all component parts of the system. In addition, the observations must be part of a network sufficiently representative in space and time to allow for the documentation of all geophysically significant ozone variations. This requires guarantees of long-term maintenance of the network and stability of the observingational system. The derived data need to be made readily available to the user community in reasonable time and appropriate form; this is achieved through the services offered by the WMO World Ozone Data Centre (WO3DC) - Toronto World Ozone and UV Data Centre (WOUDC) of WMO in Toronto.
The existing network of surface-based observing stations for the total ozone field is very irregular, with a high density of stations in Europe, North America, and parts of Asia, and low density over the tropics, over the oceans, and in the southern hemisphere in general. Results from field examination suggest that we should sample total ozone with the spatial resolution of mid-scale waves, or at intervals of 30° longitude or less, implying the need for about 100 well-distributed total ozone stations globally. Information about the spatial statistical structure of the total ozone field may be derived for the optimal location of new stations by means of iterative procedures based on optimization criteria and internal redundancy of the network. Through the efforts of international and national organizations, substantial progress has been made in improving the consistency of the Dobson ozone network and extending the spatial coverage. However, the need for further progress in these directions is clearly evident.
Balloon-borne ozone soundings play an important role in our still unsatisfactory knowledge of the global vertical ozone distribution. But three quarters of this kind of sounding have been made in the latitude belt between 35° and 55°N.
There is a requirement that:
Additional ozone observing stations representative of ‘unpolluted’ areas (preferably connected with a meteorological observatory) be established, especially in the tropical region and in the southern hemisphere;
The current ground-based ozone network be expanded by the addition of about ten suitably sited Dobson stations;
A sub-set of Dobson stations be designated to assist in the validation of satellite,

measurements and that these stations should have well-calibrated instruments.
Adequate answers to ozone questions can be provided only if there is a continuous flow of reliable total and vertical profile ozone data sufficient to form a coherent data set. This goal can be achieved effectively only through co-ordinating the diverse existing and planned ozone-measuring programmes by Members concerned. They are urged to co-operate closely with the WMO World Ozone Data Centre - Toronto World Ozone and UV Data Centre (WOUDC) of WMO in Toronto (AES/Canada) in this matter by providing the data in a timely manner.
3.9.2.6.8.3 Capital equipment
The capital equipment needed for a surface-based ozone observing station comprises at least one of the following main elements or components of the Global Ozone Observing System:
(a) Total ozone
Total ozone may be measured by one of the following types of equipment:
Dobson ozone spectrophotometer; Brewer ozone spectrophotometer; Filter ozonometer (type M-83, M-124); SAOZ spectrophotometer.
(b) Vertical ozone profile
Vertical ozone profile may be measured by the following techniques and equipment:
The surface-based (Dobson/Brewer) station, where the vertical profile of ozone is measured remotely from the ground by the Umkehr inversion methodtechnique;
The balloon ozone sonde station, using one of the most commonly used types of ozone sondes (e.g. the Brewer-Mast or ECC eElectro-chemical Concentration Cell instruments sondes (ECC));
Lidar (optical radar) system (limited to operation at night when there are no appreciable clouds);
Microwave instruments;
Balloons;
Inflation gas;
RadioOzonesonde and laser-radar equipment.
Accessories SparesCalculator Supplied by manufacturerMicrocomputerRecording devices

Intercom system
3.9.2.6.8.4 Observing programme
The observing programme of an ozone observing station should correspond with the frequency and timing of observations as laid down, as a minimum, in the Manual on the GOS (WMO-No. 544) and in the Manual on the Global Atmosphere Watch.
Total ozone should be observed daily, because the frequency of observations is as important as the spatial density of observation. The data acquisition depends on the local weather conditions encountered. Difficulties arising from cloudy sky and/or haze should be noted in order to reduce their bias in the data acquisition.
Within the Global Ozone Observing System there has been built up a network of balloon-borne ozone measurements with routine soundings carried out according to an agreed launching schedule of at least one per week at some 15 stations using one of five versions of electrochemical-type ozone sondes.
3.9.2.6.8.5 Organization
The results of studies of the WMO Global Ozone Research and Monitoring Project have shown the need for a network of ozone soundings and total ozone stations as an integrated Global Ozone Observing System.
Members are encouraged to start or continue measurements at ozone observing stations. In order to achieve this aim in a cost-effective manner, organization similar to that of the radiation station network has been recommended.
Each Member with more than one station taking part in ozone measurements should select one of them to become the national focal point or the national ozone centre of the country concerned. This special station or observatory should be responsible for regular inspection and quality control as well as for sampling, archiving and distributing the ozone data. Common efforts should be concentrated towards calibration of instruments and data intercomparisons to be carried out within the WMO GO3OS in order to improve the ozone database. The data from calibrations and intercomparisons should be routinely deposited at the WMO WO3DC - Toronto World Ozone and UV Data Centre (WOUDC) of WMO in Toronto.
Regional associations may designate a Regional Ozone Centre that could take an active role in implementing related activities, namely:
To organize intercomparisons of instruments for measuring total ozone and/or the vertical profile of ozone;
To carry out checks on instruments;
To offer training courses for various methods of ozone measurement;
To assist in analysis and evaluation of ozone data in close co-operation with the WMO WO3DCWOUDC as one of the GAW Data Centres.
The WO3DCWOUDC plays an important role in publishing and archiving all available ozone data, relevant calibrations and documentation provided by Members.
3.9.2.6.8.6 Operations
The main principles to be followed within an operational ozone observing station network are:
Thorough calibration of instruments used, documentation of major changes etc.:
Cross-validation of the ozone-measurement system used in order to detect possible sources of errors;
Commitment to long-term continuous operation of ozone stations.
For many applications of ozone measurements, and particularly for the detection of long-term trends, a long record is necessary. Thus, stations and systems with long histories should be given priority in future programmes.
While the implementation of specialized techniques is encouraged, they should be carefully assessed to determine their likely long-term operation in a network setting.
The operational validation of the ozone measurement system used should consist of the following four parts or steps:
Complete calibration and a thorough understanding of the performance characteristics of the measuring instruments, including their errors;
Identification of error sources due to mathematical modelling and external inputs to the evaluation algorithm;
Thorough understanding of the evaluation algorithm and the propagation of the above-mentioned errors by the algorithm;
Intercomparison or cross-validation with independent observations.
Neglect of any of these four steps will lead to an incorrect assessment of the performance of the measuring system and the validity of the derived data products.
For all measuring systems, the problem of long-term stability of the instruments must be taken into account. Ozone-measuring systems also have to take account of changes in atmospheric constituents such as aerosols that may affect the retrieval schemes. Finally, in connection with instruments operating at ultraviolet wavelengths, the stability of the primary source of their radiation, the Sun, is a critical matter of concern. Assessment of solar UV variability as related to ozone measurement should be made utilizing continuous satellite monitoring.
3.9.2.6.8.7 Communications

Ozone-observing stations should retain their own complete original data record and documentation of station operations. In most cases, the data will have to be scrutinized by ozone experts. Special precautions are also necessary before the exchange of ozone data as agreed between Members concerned. Recently, in connection with the Antarctic ozone decline, the need for real-time data transmission has appeared. The satellite data exchange should take place expeditiously. For this reason the relevant ozone soundings should be coded or synthesized and then disseminated in a timely manner via appropriate telecommunication links, mostly as addressed messages to related ozone satellite evaluation centres.
To ensure an adequate inventory of ozone data, it is recommended that summarized information about the availability of ozone data should be included in the World Ozone and UV Data Centre publication and updated about once every two years. This should include information on satellite data as well as on surface based total ozone measurements, ozone sondes, and rockets. Graphs should show the availability, in time, of data from particular stations and satellites.
The exchange of total ozone data and/or validated ozone profiles will normally take place by postal letter on special data form sheets, or using data files on diskettes for microcomputers, or through electronic mail within two months of the end of the month.
3.9.2.6.8.8 Personnel
Of fundamental importance in the implementation of the global ozone research and monitoring project is the availability of specially trained observers and technicians. At least two or three of them should be employed normally at an ozone-observing station. The station supervisor must have a high-level qualification and preference should be given to experts with university-level education. Advanced training in ozone-measuring techniques is indispensable for effective participation in the GO3OS, especially at ozone observatories and laboratories.
3.9.2.6.8.9 Quality standards
The responsibility for observational data quality rests with the agency providing the data. For ozone-observing stations, strong emphasis should be placed on instrument maintenance and calibration, on strict adherence to proper observing techniques, and on careful re-checking of all clerical steps.
Like all measuring instruments, the accuracy of ozone sondes is also limited by sources of error. More detailed information on this matter, in particular on comparison, calibration and maintenance of diverse instruments, can be obtained in the new edition of Guide to Meteorological Instruments and Methods of Observation (WMO-No. 8), Chapter 16, Part I.
3.9.2.6.8.10 Archiving
Ozone soundings must be scrutinized carefully by the responsible agency before results are submitted to the WO3DCWOUDC. Only soundings with correction factors between 0.9 and 1.25 for the Brewer type and 0.85 and 1.15 for the Komhyr-type instruments should be used for any serious analysis. If included in the WO3DCWOUDC publication Ozone Data for the World, they should be properly flagged. Also, soundings which are obviously distorted (by pump failures

or otherwise) should not be archived at the WO3DCWOUDC or especially flagged.
The purpose of archiving is to make the data readily available to users, for research studies or other purposes, in a form that is easy to use, along with information concerning the basic reliability of the data.
For example, in the case of the surface-based total ozone station network, the raw data (dial readings, observation times, etc.) should be recorded on the standard forms, which should be archived at the station with due care as to inclusion of all relevant information, or by the central agency responsible for the station. The preservation of the raw data is necessary if retrospective corrections are to be made. A directory of all archived raw data should be published by the WO3DCWOUDC at regular intervals. In addition, information required for reduction of the raw data (R-to-N calibration tables, standard, lamp corrections, atmospheric corrections, zenith charts, cloud corrections, etc.) should be archived at the national ozone centres.
3.9.2.7 Planetary boundary-layer stations
3.9.2.7.1 General
The planetary boundary -layer (PBL) is that portion of the atmosphere directly affected by the Earth's surface. Within that part of the atmosphere or lower troposphere (typically 1500 m in depth) most human activity takes place. The processes of the boundary layer are of extreme importance both for the large-scale dynamics of the atmosphere and for a large number of applications such as in mesoscale studies, evaporation, urban climatology and air-pollution dispersion. One of the most conspicuous and important properties of the PBL is that its flow is turbulent, not laminar. In a turbulent flow the velocity, temperature, humidity, and other properties are random functions of space and time.
A detailed knowledge of the vertical profiles of temperature, humidity and wind is however required in the study of a number of problems such as the diffusion of atmospheric pollution, the transmission of electromagnetic signals, the relation between free-atmosphere variables, downbursts, cloud physics and convection dynamics, etc.
Although extensive programmes using a variety of methods have been conducted over the past thirty years, observational studies of the PBL are still incomplete and many important gaps in our knowledge exist. In many cases theoretical studies can give the general form of relationships but observational studies and field experiments are needed to evaluate the constants. In general, to expand knowledge of the PBL it is necessary that theoretical developments (i.e. similarity theory), model studies and experimental observations proceed together. Some Members are operating planetary boundary-layer stations on an experimental basis. The following guidance is based on their experience and will be useful if the need for a fully-operational network is established.
3.9.2.7.2 Site selection
Measurements of the PBL may be carried out either on a regular basis at a permanent site (e.g. at special observatories), or on special occasions at particular sites by mobile teams.
Current ground-based systems that can be used for these purposes are described in more detail in Chapter 5, Part II of the Guide to Meteorological Instruments and Methods of Observation, (WMO-No. 8).
Vertical sounding systems using different measuring techniques may be classified as follows:
(a) In-situ sensing
(i) Instrumented sounding platforms - towers and masts;
(ii) Instrumented tethered balloons;
(iii) Free soundings with slowly ascending radiosondes;
(iv) Wind-finding radiotheodolites, radars and radio-location systems;
(v) pilot-balloon observations;
(vi) Instrumented aircraft (including helicopters).
(b) Remote sensing
(i) Acoustic and radio-acoustic sounders (SODAR and RASS);
(ii) Laser radars (LIDAR);
(iii) Infra-red and microwave sounders;
(iv) Wind profilers;
(v) Doppler radars.
In connection with the growing research and monitoring requirements for routine measurements and quality assurance of data from the lower troposphere, the criteria regarding location and observational practices have yet to be established.
For calibration purposes, it is recommended to co-locate at least one of the operational PBL measuring systems at an upper-air station or observatory.
3.9.2.7.3 Capital equipment
As no generally agreed upon design of a planetary boundary-layer station exists as yet, the capital equipment varies depending on the measuring techniques used.
3.9.2.7.4 Operational observing programmes
Over the past few decades there have been a number of boundary-layer observing programmes. In some cases these have been organized specifically for boundary-layer studies
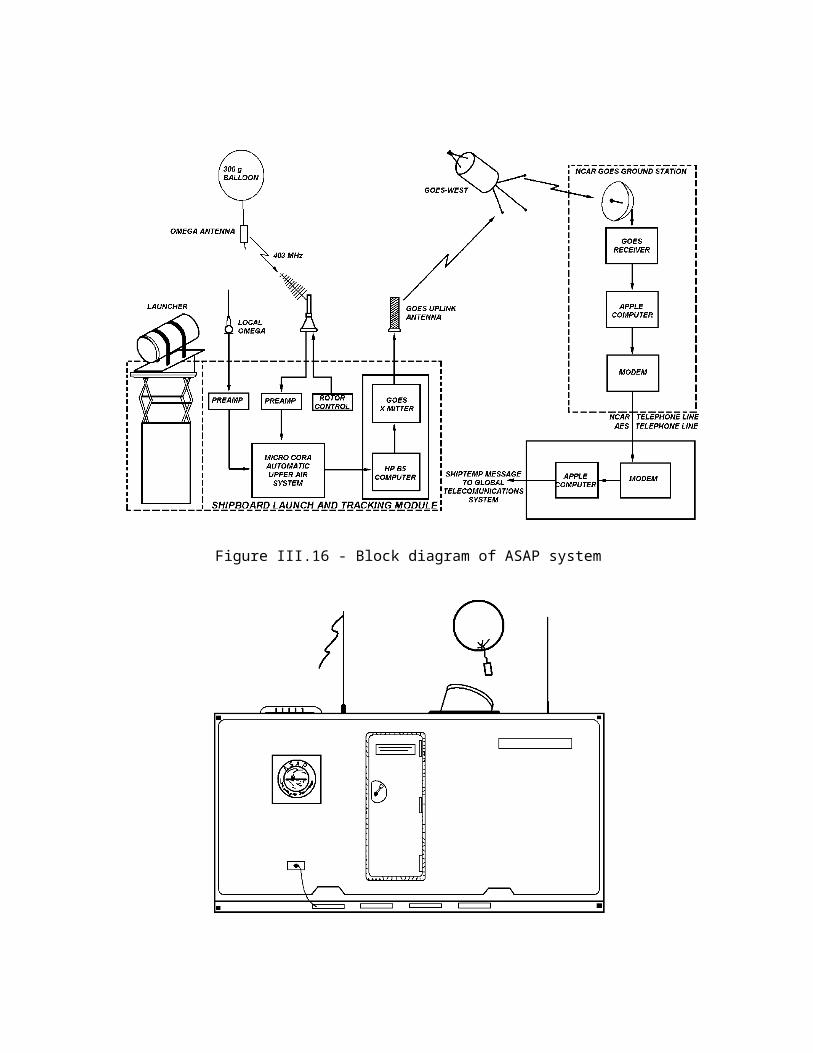
while in other cases the boundary-layer studies have formed a component of larger experiments, e.g. those established within the Global Atmospheric Research Programme (GARP). Each of these observingational programmes has increased the understanding of boundary-layer processes and provided data sets invaluable to research in this field.
Most of the various types of observingational methods and techniques are described in the chapter on lower tropospheric soundings of the Guide to Meteorological Instruments and Methods of Observation (WMO-No. 8), Chapter 5, Part II. For more background information, reference is made to WMO Technical Note No. 165, The planetary boundary layer, published as (WMO-No. 530).
3.9.2.7.5 Personnel
The personnel engaged in supervising PBL stations should have a university or equivalent degree in electronics or mechanical engineering combined with or good knowledge of meteorology.
3.9.2.7.6 Quality standards
Procedures should be developed to meet a minimum standard level for quality control of data derived from the sophisticated instruments or equipment used for special investigations (e.g. SODARs, LIDARs, wind profilers, etc.). Due to the very high resolution in time and space for data acquisition at PBL stations, sometimes the accuracy requirements are more stringent than in most other cases. For this reason quality control becomes a difficult task for variables with very short time constants.
3.9.2.8 Tide-gauge stations
3.9.2.8.1 General
Tide-gauge stations should be established along coasts subject to storm surges. They provide sea-level measurements which have to be filtered to remove high-frequency fluctuations such as wind waves, in order to provide time series data from which tides and tidal predictions can be determined.
Tide-gauge stations provide the basic tidal datums for coastal and marine boundaries and for chart datums as required by the tsunami, seiche, and storm-surge warning services. Global measurements of sea- level are necessary to monitor possible increases due to global warming. Coastal sea-level measurements are vital for hydrographic surveys and give indications of ocean circulation patterns and climate change. The archived data of water heights may likewise be very important for making any decisions on vessel navigation, coastal processes and tectonic studies, and numerous other engineering and scientific purposes and investigations.
An international network of sea-level measuring stations including tide-gauge stations forms the basis of the Global Sea Level Observing System (GLOSS), co-ordinated by the Intergovernmental Oceanographic Commission (IOC) of UNESCO. (For further information reference should be made to the Manual on sea-level measurement and interpretation, IOC Manuals and Guides No. 14, UNESCO, 1985.)
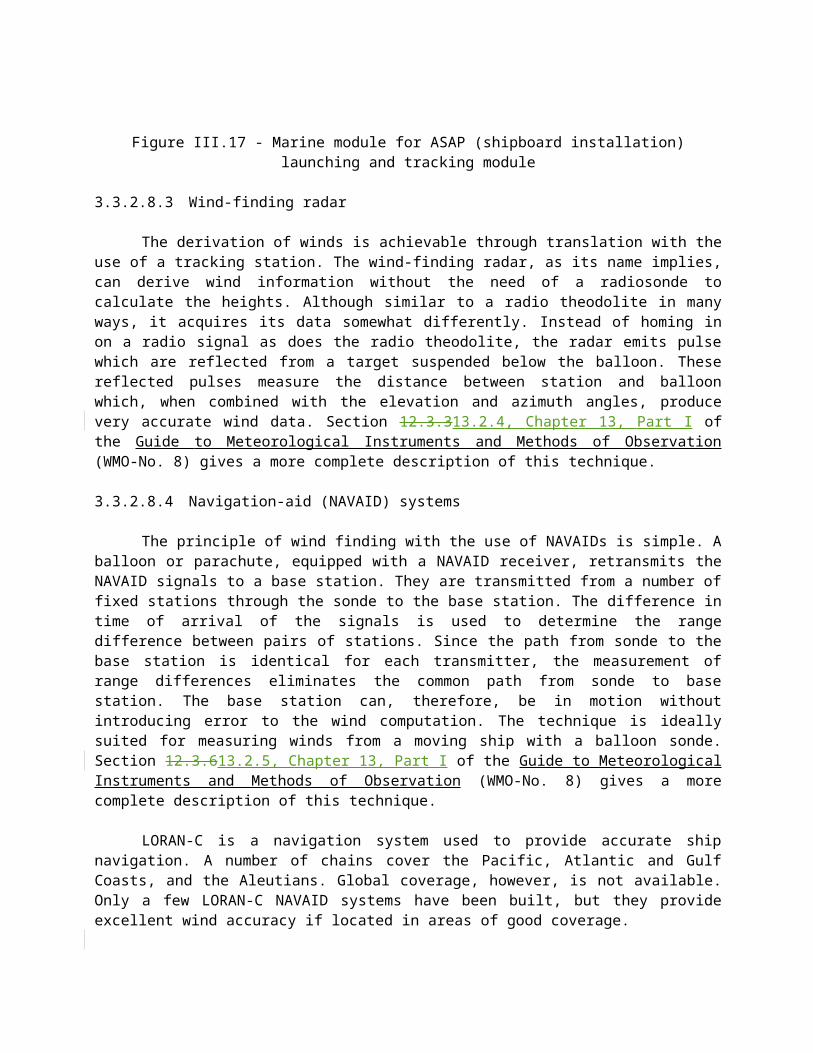
3.9.2.8.2 Site selection
Location of Ttide-gauge stationlocations should be selected for their open ocean charac-teristics, routinely avoiding or accounting for such influences as overflow, salinity, hydraulics, density, stratification, stability, and wave and storm resistance.
Some of the locations may be selected to provide bay, estuary, or river information for marine boundary datum determinations or similar studies. A selected set of tide-gauge bench marks shall be accurately connected to a global geodetic reference system.
The following specific considerations are recommended before selecting and placing a tide-gauge station:
Stable support structure (pier, bulkhead, etc.) for installation of water-level measurement sensor. The support structure must be above the highest expected water level, and water depths must be below the lowest expected water level;
Space for a small shelter (typically 1.5 m x 1.5 m) to house the instrumentation (or 2 m x 2 m clear wall space to mount the equipment in an existing building);
If satellite data transmission of an automatic tide –gauge station is used, the antenna must have a clear line-of-sight to the satellite that serves as data collectiong platform;
Locations near geodetic first- or second-order vertical control networks (if existent) are highly desirable;
Utility services are highly desirable but not absolutely critical. The site should have AC power available nearby but many measuring systems can operate solely on solar panel power if necessary. Telephone lines are desirable at a tide-gauge site to allow direct communication with the instrumentation.
3.9.2.8.3 Capital equipment
Each station consists of a stable structure from which the measurements can be made, the water-level measurement equipment, and a suite of fixed physical objects (bench marks) used to reference the vertical datums.
If continuous data collection is of vital importance, the primary data -collection platform (DCP) (see section 3.9.2.8.7) should have a backup DCP with another water-level measurement sensor. In these cases further auxiliary data, such as wind speed and direction, barometric atmospheric pressure, air temperature, relative humidity, and water conductivity may also be accommodated by the DCPs.
A telephone line should be available to allow access to pre-quality-controlled data by selected real-time users.
3.9.2.8.4 Observing programme
Visual readings by human observers should be made at the following times and are listed in descending order of preference:

(a) Hourly, particularly in coastal storm situations;
(b) At the times of high and low water;
(c) At the main synoptic hours of 0000, 0600, 1200 and 1800 UTC.
Where the installation of an automatedic sea-level measurement equipment combined with the DCP is feasible, the system may be programmed to average a series of measurements. Data should be stored temporarily at the station site in the DCP memory and periodically transmitted via satellite or land line to a central collectiong station for further processing and long-term storage. (For further information, reference should be made to the Manual on sea-level measurement and interpretation, IOC Manuals and Guides No. 14, UNESCO, 1985. Vol. 2 of this publication is in preparation.)
3.9.2.8.5 Organization
Due to the vital impact of the deviation of tidal heights which might be generated by tsunamis or storm surges on coastal community activities, real-time information on water-level deviations is badly needed. Although many tide-gauge stations are still equipped only with simple water-level gauges where visual readings have to be made by human observer, there are already fully automatedic water-level observationing networks in operation. Where feasible and necessary, preference should be given to creating such a network utilizing automatedic data-acquisition and recording equipment to measure water levels along the coastline.
To protect life and property from flood situations resulting from storm surges, the meteorological hydrological warning system should be closely linked with public alert and coastal defence systems. Where the warning time required exceeds the capability of meteorological forecasting, an alert system composed of several phases of increased alert should be introduced, resulting in a higher frequency of observations at manned tide-gauge stations.
The tide-producing forces are distributed in a regular manner over the Earth, varying with latitude. However, the response of the various oceans and seas to these forces differs, depending on the hydrographic features of each basin. As a result, the tides as they actually occur differ markedly along the coast and in bays and estuaries. An attempt should be made to space the stations so that the changes in the tidal characteristics are represented. Of the numerous features of the tide which differ at different places, those relating to the time of tide, range of tide, and type of tide are the principal features reviewed to form the network.
3.9.2.8.6 Operations
An up-to-date directory of tide-gauge stations where water-level measurements are made should be maintained, giving the following information for each station:
(a) Name of the station and its geographical co-ordinates;
(b) List and description of the equipment and measuring techniques;
(c) Description of the support structure;

(d) Description of the bench marks;
(e) Dates of stability and calibration checks of the water-level measurement equipment;
(f) Station (or DCP) access information, such as:
(i) Telephone number;
(ii) Satellite platform ID and channel;
(g) Corrections to reference data to chart datum or description of 'zero' reference.
Member States of IOC agreeing to participate in the Global Sea Level Observing System (GLOSS) are requested to:
Have all operating GLOSS stations reporting monthly mean sea level data values to the ICSU Permanent Service for Mean Sea Level (PSMSL) within one year of acquisition;
Make hourly values of sea-level data available for international exchange; Upgrade existing stations which are below GLOSS standards;
Install new stations in consultation with IOC.
In order to unify the procedures for sea-level measurements, the national instructions should be in accordance with the IOC Manual on sea-level measurement and interpretation , IOC Manuals and Guides No. 14.
3.9.2.8.7 Communications
The tide-gauge station must have access at least to a public telecommunication network with the aim of making data available after timely quality-control checks at a manned station. Data from automated stations accommodated by DCPs could be transmitted via satellite to the main computer of the Service centre concerned for quality control and further analysis and dissemination of water-level information. Even data which have not been subject to quality control should be made available immediately from the downlink through a decode programme on a personal computer for public information services.
Selected users can be authorized to access the water-level data directly from the measurement equipment if the station has a telephone line.
3.9.2.8.8 Personnel
The personnel at a tide-gauge station should be familiar with the national observing instructions and guidance material. The operation and maintenance personnel responsible for these stations, especially when automated water-level measuring systems are used, must have specialized training in structure maintenance, electronic equipment installation and repair, scuba (self-contained underwater breathing apparatus) diving to inspect and clean the underwater

components, and surveying to run differential levels to monitor stability of the equipment and bench marks.
3.9.2.8.9 Quality standards
Due to the various locations of tide-gauges station, there are no preset quantified confidence or accuracy limits that state datum variability (e.g. +/- 0.1 foot) in a generic sense. Such accuracies are site-specific, relating to physical environment, vertical stability, signal-to-noise ratios, gauge operation, length of series, closeness of control stations, etc. Users should be provided with estimated confidence limits for data on a case-by-case basis.
The readings of individual sea- levels should be made with a target resolution of 0.1 cm. Connections between the bench mark and the gauge zero should be made to an accuracy uncertainty of a few millimetres every six months.
Members participating in GLOSS should send their monthly and annual mean values of sea- level to the PSMSL at Bidston Observatory, Merseyside, UK, together with details of gauge location, missing days and a definition of the datum to which the measurements are referred. Received data are checked for consistency. If possible, values are reduced to Revised Local Reference (RLR); this involves the identification of a stable, permanent bench mark close to the tide-gauge station and the reduction of all data to a single datum level which is referred to this bench mark. This ensures continuity with subsequent data.
REFERENCES
The planning of meteorological station networks (TN No. 111, WMO-No. 265) (out of print).
Guide to meteorological instruments and methods of observation (WMO-No. 8).
Manual on Codes (WMO-No. 306).
Manual on the Global Observing System (WMO-No. 544), Volume I.
Weather reporting (WMO-No. 9).
Manual on the Global Telecommunication System (WMO-No. 386).
Guide to marine meteorological services (WMO-No. 471).
International list of selected, supplementary and auxiliary ships (WMO-No. 47).
Marine observer's guide. United Kingdom Meteorological Office.
Meteorological observations at oil fields offshore. Norwegian Meteorological Institute.
Guide to data collection and location services using Service Argos. WMO marine meteorology and related oceanographic activities report No. 10.

Drifting buoys in support of marine meteorological services. WMO marine meteorology and related oceanographic activities report No. 11.
Location and data collection satellite system. ARGOS user's guide.
WMO Technical Regulations, Volume II - Meteorological service for international air navigation (WMO-No. 49).
WMO/IOC Integrated Global Ocean Services System (IGOSS), General Plan and Implementation Programme, 1982-1988.
Guide to climatological practices (WMO-No. 100).
Guide to agricultural meteorological practices (WMO-No. 134).
Use of radar in meteorology (TN No. 181, WMO-No. 625).
Meteorological observations using navaid methods (TN No. 185, WMO-No. 641).
Guide on the Global Atmosphere Watch Guide (WMO/TD-No. 553).
Global Atmosphere Watch Measurements Guide (WMO-No. 143)
WMO Technical Regulations (WMO-No. 49), Volume I, Chapter 3.2 - Global Atmosphere Watch (GAW).
Manual on the Global Atmosphere Watch (in preparation).
The planetary boundary layer (TN No. 165, WMO-No. 530).
Manual on sea-level measurement and interpretation. IOC Manuals and Guides No. 14.
Guide to Practices for Meteorological Offices Serving Aviation (WMO-No. 732)
____________

P A R T IV
THE SPACE-BASED SUBSYSTEM
4.1 GENERAL
4.1.1 History of the spaced-based subsystem
Observations of the atmosphere above the Earth’s surface began – at first sporadically, then more systematically – early in the twentieth century. Progress spurred the scientific development of meteorology, which in turn led to further technological advances and improved weather services. By the second half of the century reliable two- to three-day forecasts could be generated routinely; only within the last decade that reliability has that reliability been extended to four to five days.
Development of upper-air observing systems provided meteorologists with periodic snapshots of atmospheric activity by balloon-borne instruments. The introduction of weather radar in the late 1950s gave meteorologists the capability for the first time to monitor local weather patterns continuously, by observing the radar reflection from water droplets in an area surrounding the observationing site. Science again capitalized on technological innovation and explained the connections between water droplet patterns and rainfall and storm intensities, consequently providing for improved forecasting services.
Introduction of the computer in the late 1950s provided meteorologists with the means for implementing the methodologies for making numerical forecasts, which had existed since before World War I. The computational power at last existed to solve fundamental equations of fluid motion. The science of numerical weather prediction was born, permitting the study and forecast of atmospheric motion both regionally and globally.
A basic concern of the pre-computer age became obvious in the age of numerical prediction: few observations were being made in vast sections of the world, including the oceans. The problems presented by the sparseness of data in these areas became more apparent when meteorologists attempted to extend the range of forecasts beyond one or two days.
The first weather satellite was launched on 1 April 1960, introducing a new era for the environmental sciences. Instead of a collection of observations made at separate points on the ground by individuals, or simple representations of water droplets as shown by individual radar, satellites, from a vantage point in space, provided a comprehensive view of the Earth.
4.1.2 Relation to the surface-based subsystem
The Global Observing System (GOS) currently in place is a composite one, made up of land-, ocean-, and space-based systems that measure a wide variety of environmental parameters. The space-based subsystem complements the surface-based subsystem in providing global observational information reliably to meet the data requirements of the WWW. The space-based subsystem consists of geostationary and near-polar-orbiting satellites and a related ground system. In recent years the emphasis in the mix of systems has shifted from the surface-based subsystem to the space-based subsystem, especially over the oceans and other

remote areas. New satellites, sensors, communications and methods of processing data have become operational, requiring modifications to be made to the Guide on the Global Observing System. Detailed information on improvements and the observational data obtained from environmental observation satellites currently in operation is contained in Information on meteorological and other environmental satellites (WMO-No. 411).
Each of the observing systems attempts to occupy a niche with respect to the vast quantity of measurements needed to define the state of the Earth's atmosphere. The density of conventional surface and upper-air soundings in some portions of the globe, such as North America or Western Europe, far exceed the density of similar information over oceanic and less-developed regions. The current density of observations over North America has permitted better forecasts of smaller-scale events than have been possible in more data-sparse regions. The quality of forecasts and services is directly correlated to the information available on atmospheric conditions, regardless of what scale of motion is examined. Put succinctly: good forecasts require a plentiful supply of accurate data.
Over large oceanic areas, the number and distribution of elements of the surface-based subsystem are drastically reduced. Reports from ships, aircraft, few buoys, and island stations are often the only surface-based observation available, and much of the data are concentrated in limited geographical areas covered by commercial transportation routes. The only other source of environmental data over these vast areas is the near-polar-orbiting and geostationary satellites. Satellite imagery is critical to the generation of warnings and forecasts of hazardous conditions such as storms, tropical cyclones, polar lows, high winds and waves.
The use of sensors on satellite platforms to provide measurements of geophysical quantities has certain advantages and disadvantages over the use of ground-based observing systems. These are summarized in Table 8.1 of the Guide to Meteorological Instruments and Methods of Observation (WMO-No. 8), Chapter 8, Part II.
Forecasts from numerical models are the foundation for routine regional and local weather forecasts. The global temperature-sounding data from polar-orbiting weather satellites, first available in the late 1960s and used operationally since the mid-1970s, have encouraged numerical modelling activities. The model improvements have made it both necessary and possible to develop increasingly sophisticated methods for extracting the temperature and humidity profiles from the satellite radiances.
Other quantitative weather parameters such as cloud- motion winds are derived from geostationary satellite imagery. (See the Guide to Meteorological Instruments and Methods of Observation (WMO-No. 8), Chapter 8, section 8.1, Part II.)
4.2 ORGANIZATION
4.2.1 Space segment
Environmental observation satellites are divided into two groups: those in near-polar orbits and those in geostationary orbits. Those in near-polar orbits at low altitude (less than 1 000 kmthe usual altitude for meteorological satellites is 880 km) provide global coverage (twice a day for each satellite) and are customarily used for precise radiance measurements needed for temperature and water-vapour soundings, sea-surface temperature and radiation fluxes.

Those in geostationary orbit (36 000 km above the Eequator) provide a continuous view of a large portion of the Earth (except the polar areas). They are used primarily for a 'continuous weather watch', to produce wind estimates by measuring the motion movement of clouds viewed over a period of one to two hours, to monitor mesoscale cloud growth and for communication functions.
The different capabilities of the two satellite groups are complementary; both are necessary parts of the space-based subsystem of the GOS. Although the polar satellite data usually have higher resolution and precision, the geostationary satellite data are often used to filter out the effect of ambient clouds which in some areas may obscure surface features, such as the sea surface for temperature determination. By processing a series of images acquired over a period of several hours, moving clouds in partly cloudy regions can be eliminated by digital filtering though a computer. The output is a single, averaged image field of the surface without cloud interference. As well as taking observations directly, both types are capable of accomplishing data-collection and data-dissemination missions.
The operational environmental observation satellites in near-polar orbit include the METEOR series of the Russian Federation and the NOAA series of the USA. The operational geostationary satellites include the Geostationary Meteorological Satellite (GMS) series of Japan at 1400E, the Geostationary Operational Environmental Satellites (GOES) of the USA at 75°W and 1350W, the Indian National Satellite (INSAT) at 74°E, and the METEOSAT series of EUMETSAT (Europe) at 0°. The current operational meteorological and related satellites are listed in the Guide to Meteorological Instruments and Methods of Observation (WMO-No. 8), Chapter 8, section 8.2.4, Part II. Figure IV.1 shows the World Weather Watch global observing satellite system.

4.2.1.1 Near-p P olar-orbiting satellites
4.2.1.1.1 Orbital characteristics
The present polar orbiters occupy orbits at altitudes between 800 and 1000 km. This type of satellite is able to observe the whole globe twice a day. Unfortunately, the data provided by the polar orbiters are asynoptic. Therefore, two satellites which are capable of providing four full sets of data daily and are kept in continuous operation supply these data. Most near-polar-orbiting satellites are placed in polar retrograde Sun-synchronous orbits (orbital inclination near 100°). Orbits are selected which provide for south bound (descending node) Eequator crossings between 0700 to 0900 hours (local Sun-time) and northbound (ascending node) Eequator crossings around 1300 to 1500 hours (local Sun-time). Orbital periods are approximately 101 to 103 minutes for satellites at orbital altitudes of 850 km to 900 km. Satellite orbital dynamics are described in detail in the Guide to Meteorological Instruments and Methods of Observation (WMO-No. 8), Chapter 8, section 8.2.2, Part II.
4.2.1.1.2 Missions
The payload of the near-polar-orbiting satellites varies from system to system and from generation to generation, but in general the following missions are performed:
(a) Imagery mission
Radiometers operating in the visual (0.5-0.9 μm) and the infra-red (10.3-12.5 μm) spectral range deliver imagery data with high resolution (about 1 km at the sub-satellite point in both the visible and infra-red).
(b) Sounding mission
Some polar satellites are equipped with vertical temperature and moisture profile radiometers which operate in the infra-red (C02 and water vapour channels) and the microwave (02 and water-vapour channels) spectral range.
Further information about (a) and (b) can be found in the Guide to Meteorological Instruments and Methods of Observation (WMO-No. 8), Chapter 8, section 8.2.3.1, Part II.
(c) Direct broadcast mission
To support national and local environmental monitoring activities around the globe, some of the near-polar-orbiting satellites provide a direct broadcast service which allows the reception of satellite data in real time by ground stations within radio range of the satellite. The same instruments used to meet the imaging and sounding missions described in the paragraphs above contribute to these direct broadcast services.
Polar satellites continuously transmit low-resolution (approximately 4 km) analogue data on VHF (136-137 MHz), high-resolution (1 km) digital data on S-band frequencies (1690-1710 MHz), and atmospheric sounder data on both VHF (136.77 and 137. 77 MHz) and S-band (1690-1710 MHz) frequencies. The low-resolution data are furnished through the Automatic Picture Transmission (APT) service, the high-resolution data through the High Resolution picture Transmission (HRPT) service, and the sounder data through the Direct Sounder Broadcast (DSB) service.
(d) Data-collection mission
In order to provide near-surface or surface-based information not available from the GOS surface-based subsystem, fixed and moving data-collection platforms (DCPs) provide data from the data-sparse areas. Near-pPolar-orbiting satellites are well suited to collecting data from both types of DCP. Using Doppler frequency-shift techniques, moving DCPs can be located within several hundred metres. Although continuous satellite coverage is not available for the relay of DCP data, except in the Ppolar Rregions, a minimum of two satellite overflights each day is available for every spot on Earth. Data received from DCPs are transmitted in real time at both VHF (136-137 MHz) and S-Band (1 690-1 710 MHz) frequencies and are recorded on board the spacecraft for later playback at appropriate telemetry stations. Real-time receipt of data at Earth stations requires both the DCP and the Earth station to be in the radio footprint of the satellite simultaneously. Uplink frequency for these DCPs is 401.65 MHz. Data rate is 400 bits per second and message length is approximately one second.
(e) Space environment monitoring mission
The NOAA polar obiter includes a space environment monitor (SEM) instrument which measures solar proton flux, electron density and energy spectrum, and total particulate energy distribution at spacecraft altitude. The two detectors included within this instrument are the total energy detector and the medium-energy proton and electron detector. SEM data from NOAA satellites are use to monitor and predict solar events, such as sunspots and flares, and their effects on the magnetic field. Measurements of arriving energetic particles are used to map the boundaries of the polar auroral ovals which affect ionospheric radio communications and electric power distribution systems.
(f) Search and rescue mission
A Satellite-aided Search and Rescue System (SARSAT) uses polar- orbiting and other low-orbiting satellites to pick up distress signals from downed aircraft or ships in distress and relays the signals to rescue forces through ground stations in co-operating countries. The polar and low-orbiting satellites are equipped with transceivers operating at frequencies of 121.5, 243 and 406 MHz.
4.2.1.2 Geostationary satellites
4.2.1.2.1 Orbital characteristics
The orbit altitude of a geostationary satellite is approximately 36 000 km. At this altitude, the orbital period is about 24 hours and thus equal to the rotational speed of the Earth. The orbital plane of the satellite coincides with the equatorial plane; the satellite thus remains fixed over the Eequator. From an altitude of 36 000 km, a geostationary satellite provides nearly continuous information in an area within a range of about 50° from the subsatellite point. Five geostationary satellites are needed to provide full coverage around the globe within the range 50°N to 50°S latitude. Figure IV.1 shows the approximate locations and range of the five planned geostationary satellites.
4.2.1.2.2 Missions
The following missions are performed by geostationary satellites:
(a) Imagery mission
The satellites are presently equipped with spin/-scan radiometers operating in the visible (0.4-0.8 μm), the thermal infra-red (9.7-13.0 μm) and the infra-red water vapour (5.7-7.1 μm) spectrum. With a spin rate of 100 rpm, the satellites scan the Earth disk by pivoting the telescope of the radiometer stepwise from north to south or vice versa from rotation to rotation. By means of this technique, sequential image scans of the Earth disk are obtained within 20 to 30 minutes. The resolution of the imagery data at the sub-satellite point is 0.9 to 2.5 km (depending on the type of spacecraft) in the visual spectrum and about 5 to 8 km in the infra-red spectrum.
(b) Sounding mission
On GOES, the Visible Infra-red Spin-Scan Radiometer (VISSR) Atmospheric Sounder
(VAS) has both imaging and sounding capabilities. The VAS has 12 infra-red channels with central wavelengths between 3.945 and 1514.74 μm whose data are used to derive vertical temperature and moisture profiles (soundings) at 14 km resolution over selected areas. Simultaneous imaging and sounding are not possible with spin-stabilized satellites since soundings require repeated scans of the same surface area to build up signal levels suitable for sounding. Future three-axis-stabilized GOES will have simultaneous imaging and sounding capabilities.
Further information about (a) and (b) can be found in the Guide to Meteorological Instruments and Methods of Observation (WMO-No. 8), Chapter 8, section 8.2.3.2, Part II.
(c) Direct broadcast mission
The same instruments performing the imagery mission and the sounding mission also support the direct broadcast mission. Communications relay systems provide additional broadcast services known as Weather Facsimile (WEFAX), Low Resolution Facsimile (LR-FAX), High Resolution Facsimile (HR-FAX), stretched VISSR or Meteorological Data Distribution (MDD) system.
Digital high-resolution imaging services are provided on a scheduled basis several times a day, on a frequency of 1 687.5 MHz. Some pre-processing of the data is performed on board the spacecraft, but additional processing (registration, rectification, gridding, annotation, sectorizing, etc.) is required on the ground.
GOES analogue WEFAX and GMS LR-FAX services are both provided on 1 691.0 MHz. METEOSTAT provides WEFAX services on both 1 691.0 and 1 694.5 MHz and high-resolution digital image data on 1691.0 MHz. On later METEOSAT satellites high-resolution data will be transmitted on 1694.5 MHz. WEFAX provides reduced-resolution sectorized imagery and other meteorological information, such as analysis and forecast charts. It utilizes the well-established APT format (800 lines and 800 elements per line). This information can be received on relatively simple and low-cost terminals;
(d) Data-collection mission
Geostationary satellites provide the capability of relaying data in a continuous manner from a large number of fixed or moving DCPs. At the present time, geostationary satellites do not have the means to locate moving DCPs and reports from these DCPs must include location information. Both the Automated Shipboard Aerological Programme (ASAP), where atmospheric soundings obtained from moving vessels of opportunity are relayed, and the Aircraft-to-Satellite Data Relay (ASDAR) programmes use geostationary satellites to relay their data with location information contained in these data. Geostationary satellites have proved valuable in relaying alert information pertaining to tsunami, flash floods, radiation, etc., due to their ability to provide continuous coverage of a large sector of the Earth. Unlike the polar-orbiting spacecraft, data relayed through geostationary satellites are not recorded and are transponded from UHF (401.7-402.4MHz) to S-band (1694.3-1694.7 MHz) for relay to properly equipped Earth stations for processing and other distribution. Some geostationary satellite data-collection systems have the ability to interrogate (poll) properly equipped DCPs either to obtain real-time information or to command sensors to obtain information more or less frequently. Data rates are normally 100 bits per second and length of message varies from two or three seconds to several minutes.

(e) Space environment monitoring mission
Some geostationary spacecraft (GOES, GMS) carry a space environment monitor (SEM) which consists of three major components: a magnetometer which measures the magnetic field at spacecraft altitude; a solar x-ray sensor which provides data on solar x-ray activity to monitor and predict solar flares; and the energetic particle sensor and high-energy proton and alpha detector designed to measure energetic particle flux at orbital altitude.
X-ray data, monitored in real time from SEM sensors, can disclose the onset of a solar flare that may seriously affect telephone, teletype and radio communications. High-energy particles may damage solar cells, cause sensor malfunctions, and trigger spurious commands aboard spacecraft.
Figure IV.1 - Members’ plans for geostationary satellite

4.2.2 Ground segment
The ground segment is composed of a variety of stations with different functions. There are large central stations for the acquisition and processing of data and there are much smaller installations provided by various users, e.g. APT and HRPT receiving stations and DCPs.
4.2.2.1 Central stations
A central station, controlled by a Member directly or by several Members through an international organization operating the satellite system, usually contains several activities.
(a) Command, data acquisition and tracking station
This station acquires the radiometer data, the attitude, orbit and housekeeping data, and the messages from DCPs. It transmits the telecommands for the spacecraft or for the DCPs and the processed information to be disseminated. In addition, ranging may be carried out by the station.
(b) Operations control centre
An operations control centre is needed for controlling the performance of the satellite, and the ground operations facilities.
(c) Pre-processing centre
At the pre-processing centre the incoming data are referenced and conditioned. In this task, registration, calibration, rectification, gridding, sectorizing, annotation, projection conversion, information transformations of the raw-radiometric data as well as dissemination and the data handling of the DCP messages are included.
(d) Meteorological processing centre
The task of the meteorological processing centre is the extraction of quantitative meteorological information from the pre-processed radiometer data, such as vertical temperature and humidity profiles, sea-surface temperatures, cloud top height, nephanalysis, wind data, radiation balance data, space environment data, etc.
4.2.2.2 Users' stations
The different types of users' stations may be grouped together using the frequency as a discriminator.
(a) VHF receiving stations
Receiving stations with relatively simple VHF receiver and display equipment can receive data from near-polar-orbiting satellites, namely the APT imagery data, which are obtained by scanning radiometers, in both the visible and infra-red channels. The data are broadcast continuously near 136-137 MHz frequency range. Data from vertical profile radiometers (direct sounder broadcast) can also be received as a phase modulation of the satellite beacon frequency of 136.77 or 137.77 MHz.
(b) S-band receiving stations
Rather complex and expensive receiving stations are required for the reception of the

HRPT images, the data from the vertical profile radiometer in digital format from the near-polar-orbiting satellites, and the analogue and digital information disseminated by the geostationary satellites. Ground stations capable of receiving the analogue WEFAX data at S-band frequencies of 1 691.0 or 1 694.5 MHz are less complex; fixed antennae as small as 1 m can be used. Acquisition of digital HRPT (1 690-1 710 MHz) data from polar-orbiting satellites or digital spin-scan (1687.5 MHz) data from geostationary satellites generally requires larger dish antennae of the order of 3 to 5μm, although smaller dish antennae have been used successfully to copy HRPT signals. The HRPT antenna is usually a steerable system employing auto-track or computer-track devices. High-resolution display systems are needed for optimum reproduction of both HRPT signals and the geostationary spin scan instrument data.
(c) Data-collection platforms
Data-collection platforms (DCPs) are radio sets that interface with environmental sensors and are normally located in remote areas. These DCPs relay the environmental data via satellite to central ground stations or, as in the case of the near-polar-orbiting spacecraft system, recorded on board the spacecraft for later playback to appropriate telemetry Earth stations. From a functional point of view, four main types can be distinguished:
Self-timed DCPs
These are controlled by an internal clock and transmit their messages automatically within pre-set time and frequency allocations. Frequencies are in the 401.7 to 402.4 MHz range.
Interrogated DCPs
These transmit upon receipt of an interrogation (poll message) via satellite from the central ground station. Upon receipt of the interrogation, data are transmitted over separate reply channels (401.7-402.2 MHz) or the configuration of the associated sensors may be changed and the reply transmission used to verify this change.
Real-time or threshold transmitting DCPs
These DCPs transmit their messages when a pre-set threshold is reached. In the case of adaptive random reporting DCPs, when certain thresholds are exceeded the DCP will automatically increase the frequency of reporting until that threshold is no longer exceeded. Transmissions are made initially in real time and repeated one or more times in a random manner to ensure a high probability that at least one transmission is successfully received. Up to three housekeeping messages are allowed per day for each DCP, but the total number of messages is limited to an average of 60 seconds per DCP in the network each day. This limitation ensures a high probability that each DCP in the network will be able to have transmitted messages received at the central ground station.
Polar-orbiting system DCPs
These DCPs use a combination of features from the self-timed and real-
time DCPs. Messages can be stored and transmitted at pre-set times or in real time. All messages are repeated one or more times in a random manner to ensure a high probability of receipts as all DCPs use the same reply channel frequency (401.65 MHz). DCPS requiring location calculations repeat their messages more frequently than those DCPs transmitting data only.
4.2.2.3 Satellite user training
Because of the increasing importance and dependence upon satellite observations, the WMO Education and Training Programme has increased training efforts in satellite technology. A training library is maintained in the WMO Secretariat to assist Members by making available a wide selection of books and audio-visual media on the subject of satellite meteorology.
WMO organizes or co-sponsors training events such as seminars, courses and workshops on satellite-related technology and the analysis and use of satellite data. Training is also sponsored under the United Nations Development Programme (UNDP) and the Voluntary Co-operation Programme (VCP). The most effective training is that which is imparted in an environment similar to the one in which the trainee would be working later. Thus, the concept of the 'roving seminar' is very effective as it brings experts on the combined use of data from space-based and ground-based subsystems to facilities similar to the trainee's workplace.
4.3 DATA AVAILABILITY
The data from the two groups of satellites, near-polar orbiters and geostationary, are used at local user stations, at National Meteorological Centres, and at World Meteorological Centres. The data are available in analogue and/or digital formats which enable various degrees of processing depending on technical sophistication and resources.
The quantitative data derived from the satellite observations and processed at major central facilities are exchanged internationally over the GTS. Included are soundings, upper-air winds and sea-surface temperatures. Some operational satellite products produced at central stations and made available over the GTS are listed in Table IV.1 Some of the cloud images receive limited distribution over the GTS but they are disseminated primarily by direct broadcast from the satellites, e.g. Automatic picture Transmission (APT), High Resolution picture Transmission (HRPT), Weather Facsimile broadcast (WEFAX), and Visible Infra-red Spin-Scan Radiometer (VISSR). Many analyses are derived from the satellite data for specialized uses and are transmitted in a variety of ways depending on the application. Examples are maps of ice and snow coverage and sea-surface temperature gradients; clear land-surface images analysed in terms of vegetative index; cloud analyses; and weekly, monthly, seasonal and annual averages of different parameters. High-resolution image data from near-polar-orbiting environmental observation satellites are increasingly being used routinely in vegetation monitoring and studies of land and ocean processes and of global climate change.
4.3.1 PNear-polar-orbiting satellites
These satellites provide global coverage of day and night cloud cover, surface conditions, atmospheric temperature and humidity profiles, and solar particle flux. These satellites are also equipped to collect and relay sensor data from fixed and moving automatic platforms, provide continuous data broadcasts, and perform the Search and Rescue

Satellite-aided Tracking (SARSAT) mission.
Because the near-polar-orbiting spacecraft is in view of major sophisticated ground stations no more than once per orbit (and sometimes not at all for several orbits), it is necessary to record the globally acquired data on tape for later playback when the spacecraft enters the "acquisition circle" of a specific ground station. At the same time as the data are being recorded, the polar spacecraft is broadcasting these data for the use of local receiving stations within range of the direct broadcast signal.
Table IV.1
Operational satellite products available over the GTS
Product Code form Data designator T1 T2
Location information of satellites ALERT TB
Geodetic sub-point predictions Plain language TB
Spacecraft tracking information Plain language TB
Information of meteorological satellites Plain language TB
Satellite tropical disturbance summary Plain language TC
Cloud radiance data FM 88-VIXI Ext.-SATOB TX
Synoptic interpretation of cloud data obtained by meteorological satellite
FM 85-IX Ext.-SAREP ATTC
Clear radiance data FM 87-VIIIXI Ext.-SARAD TR
Satellite observations of wind, surface temperature, humidity and radiation
FM 88-VIXI Ext.-SATOB TX
Satellite remote upper-air sounding FM 86-VIIIXI Ext.-SATEM TTH
Wind data derived from cloud motionsmovement observed by satellite
FM 88-XIVI Ext.- SATOB TX
Satellite-observed temperature Special code
Satellite imagery data - T1=E
Satellite imagery data FM 94-XIIX Ext.-BUFR IP
Note: For additional information, refer to the WMO publication Weather Reporting (WMO-No. 9), Volume C, and to the Manual on the GTS (WMO-No. 386) Vol.I, Part II, Attachment II-5 (sections 2, 6, 24).
4.3.1.1 Central stations
The data from near-polar orbiters received by the ground station are forwarded to a central processing facility where a large variety of products are generated. Many of these products are subsequently disseminated to the world meteorological community over the GTS. The data acquired by the near-polar orbiters are also entered into one of the archives associated with the world centres of the World Weather Watch.
The Argos Data Collection and Location System (DCLS) flown on board the NOAA TIROS-N series of spacecraft is the only operational near-polar- orbiting data-collection system at this time. DCLS data are available from several sources. Processed data are available approximately three hours subsequent to each spacecraft pass over the ARGOS Processing Centre in Toulouse, France. A processing centre is also available in the USA to expedite the processing of data for North American users. Details as to data formats, costs, etc. can be obtained from:
CLS Service ARGOS18 avenue Edouard Belin
F-31055 Toulouse CedexAntoine Monsaingeon8-10, rue HermèsParc Technologique du Canal31526 Ramonville Saint-Agne cedexFrance
4.3.1. 2 Users’ stations
(a) Receiving stations
All Members should endeavour to install in their territory at least one direct-readout station for reception of cloud-imagery data. It is also desirable for many Members to install a station capable of receiving the S-band frequencies, especially when real-time use of the high-resolution picture transmission or the high-resolution digital data from the vertical temperature profile radiometer is planned.
(b) Data collection platforms
All Members are urged to make use of the data-collection capabilities of environmental observation satellites by establishing fixed or moving DCP systems to cover data-sparse areas of the GOS.
The Argos DCLS broadcasts raw data in real time via the VHF beacon with the HRPT data stream at S-band. Properly equipped direct-readout ground stations receive these data and process them into physical units as well as perform platform-location calculations for moving platforms.
Information on direct broadcast services is available from the following sources:
Chief, NOAA/NESDIS Data Collection and Direct Broadcast Branch, E/SP21World Weather Building, Room 806E/SP21 RM. 806
NOAA/NESDIS - FB #4Washington, DC 20233USA
Russian Federal Service for Hydrometeorology and Environmental Monitoring12 Novovagankovsky Street123242 MoscowRussian Federation
4.3.2 Geostationary satellites
These satellites provide nearly continuous environmental observations of the Earth’s disk in their view that are needed to detect and monitor severe weather and short-lived environmental events. These satellites also provide data on surface and atmospheric conditions, measure solar X-ray and other energies at the spacecraft, collect and relay data from automatic platforms, and broadcast sensor data and processed environmental information. Some of these satellites are equipped to perform SARSAT distress-signal detection and relay functions.
4.3.2.1 Central stations
The data from the geostationary satellites received at the primary command and data-acquisition stations are also forwarded to a central processing facility where a variety of products are generated. Certain environmental parameters are extracted on a regular basis from the basic image data using automated computer based systems. This automatic system is complemented by quality control using a man-machine interface. Some examples of the operational products generated from geostationary satellite data are:
(a) Cloud motion wind vectors
These vectors are derived at the nominal times of 0000, 0600, 1200 and 1800 UTC by measuring the motion movement of clouds over three two consecutive half-hourly images. As many vectors as possible are computed within the field of view of the satellite image, usually within 55° of the sub-point. Heights are assigned to the vectors expressed in terms of temperature and pressure level. For example, the GOES satellites provide about 600 observations per day which are disseminated over the GTS. Other products provide two or three wind vectors on 5° latitude by 5° longitude areas on a six-hourly schedule.
Further information can be found in the Guide to Meteorological Instruments and Methods of Observation (WMO-No. 8), Chapter 8, section 8.3.4, Part II.
(b) Sea-surface temperatures
Sea-surface temperatures are extracted from the 0000 and 1200 UTC images. These data are supplemented by data from earlier images in segments where the sea is obscured by cloud at the nominal observing times. Some operational products include five-day, ten-day and monthly mean sea-surface temperature on 1° latitude by 1° longitude areas based on three-hourly composites.
Further information can be found in the Guide to Meteorological Instruments and Methods of Observation (WMO-No. 8), Chapter 8, section 8.3.6, Part II.
(c) Cloud analysis
The analyses represent percentage cloud cover and cloud-top temperature at various levels in all processed segments. The analyses are provided for the nominal times of 0000, 0600, 1200, and 1800 UTC. Other products include five-day and monthly mean cloud-amount distributions of 1° latitude by 1° longitude areas for high, middle, low and total cloud amounts based on three-hourly images.
Further information can be found in the Guide to Meteorological Instruments and Methods of Observation (WMO-No. 8), Chapter 8, section 8.3.3, Part II.

(d) Upper tropospheric humidity
The values of upper tropospheric humidity, expressed as a percentage of relative humidity, are extracted twice each day at 001100 and 122300 UTC. The data are based on the interpretation of the 6.7 μm water-vapour channel radiances and the results are representative of a layer between approximately 7600 and 300 hPa in the upper troposphere.
Further information can be found in the Guide to Meteorological Instruments and Methods of Observation (WMO-No. 8), Chapter 8, section 8.3.7, Part II.
(e) Cloud-information chart
This product is a three-hourly chart on the distributions, features, time transition and top temperatures of clouds and other associated meteorological information.
Several geostationary environmental observation satellite systems have a data-collection capability. Data processing and distribution vary among the satellite operators. Both EUMETSAT and Japan process their data into physical units. The USA pre-processes the entire GOES data set, but only a portion of the data is processed into physical units and transmitted over various dissemination media, including the GTS. Primary distribution of pre-processed GOES DCS data is by dial-in telephone at various data rates. EUMETSAT and Japan also use the GTS for dissemination of some DCS data, but have other dissemination capabilities. For details about data-collection services, information is available from:
Chief, NOAA/NESDIS Data Collection and Direct Broadcast Branch World weather Building, Room 806E/SP21 RM.806NOAA/NESDIS FB #4Washington, DC 20233USA
The DirectorEUMETSATAm Elfengrund 45D-61 00 Darmstadt-EberstadtGermany
The DirectorMeteorological Satellite Centre3-235 NakakiyotoKiyose-shiTokyo 204-0012Japan
The DirectorIndia Meteorological DepartmentMausam BhavanLodi RoadNew Delhi-110003India
4.3.2.2 Users' stations
In addition to the processed or pre-processed data sources mentioned earlier, raw DCS data from geostationary satellites are available in real time by using a properly equipped, direct-readout ground station that is in the radio footprint of the particular geostationary spacecraft that relays the data-collection platform messages of interest. The data stream is down-linked at S-band. Details are available from the sources listed above.
4.3.3 Experimental satellites
The primary purpose of experimental satellites is the development and testing of new instrumentation and improvement of existing sensors and satellite systems. Experimental satellites may provide environmental information which may be available for operational use, but they have limitations due to the lack of commitment to ensure continuity of service or a reliable satellite replacement policy. These satellites provide such information as:
Improved temperature and humidity vertical profiles; Soil-moisture distribution; Ice type and extent; State of sea; Cloud composition; Cloud liquid-water content; Precipitation distribution; Distribution of particulate matter in the atmosphere; Certain atmospheric constituents, e.g. ozone; Sea-surface temperature; Sea-surface wind speed/stress; Marine pollution.
In contrast to the operational environmental observationing satellite systems which provide real-time data on a continuous basis, there can be no such guarantee with regard to the experimental satellites. However, efforts will be made to co-ordinate with the agencies operating these satellites and to influence them both with respect to the variables to be measured and the real-time reporting of their data.
4.4 TRENDS IN THE SPACE-BASED SUBSYSTEM
The number of users of environmental satellite data has continued to grow continuously since 1963, when satellite-borne direct-broadcast systems were first introduced. There is every reason to expect this trend to continue. New uses for the data are constantly being discovered, in meteorology as well as in land processes and oceanic applications areas. The processing and use of atmospheric sounding systems are becoming better understood. Ground receiving equipment costs, especially for high-resolution receiving systems, are declining rapidly.
Perhaps most important, more government organizations, private companies and educational institutions are becoming aware of the existence and use of satellite direct-readout systems and broadcast services. As knowledge of their existence grows, there is every reason to expect that the numbers and types of stations receiving, processing and redistributing environmental satellite data and derived products will continue to increase.
The current observing systems are expected to change significantly in the future, making available large quantities of high-resolution data from both space-based and ground-

based sources. The ability to use those data effectively will require the development of powerful interactive processing and display systems. The features likely to characterize future observationing systems are:
Availability of new generations of geostationary satellites;
Significant improvements to near-polar-orbiting satellite sensors;
Deployment of new ocean remote -sensing satellites;
Improved resolution of horizontal and vertical features;
Higher data volumes for atmospheric wind and temperature and sea-surface measurements;
Major improvements in data communications;
Implementation of new powerful interactive data -processing and display systems and retrospective data -storage and retrieval systems;
Development of new improved numerical models with increased use of satellite-acquired meteorological information.
4.4.1 PNear-polar-orbiting satellite trends
(a) Improved imaging instruments can be expected on all near polar-orbiting satellites including six-channel instruments, 0.5, to 1.0 km resolution and high-precision data calibration and registration. Some near-polar-orbiting satellites already include a microwave imager for surface observations in rain-free cloudy areas. This is especially useful for ice mapping.
(b) The basic sounding unit will be the microwave sounding unit because it eliminates cloud interference in both temperature and humidity observations and will also provide improved vertical resolution over current systems.
(c) An improved data-collection and platform-location system is expected which will permit faster data handling and processing and an increased capability in the number of platforms which can be serviced.
(d) Direct broadcast services will continue indefinitely. However, the APT broadcast will be converted from analogue to digital data transmission.
(e) New ocean sensors will be flown on the current type of near-polar-orbiting system and/or new dedicated ocean remote -sensing satellites. These sensor systems may include a radar scatterometer to measure the surface wind field, an altimeter to measure currents, a multi-spectral visible scanning radiometer to measure ocean colour to determine chlorophyll and sediment concentrations, and a microwave imager.
4.4.2 Geostationary satellite trends
(a) Geostationary satellites will have five or more spectral imaging channels including visible, infra-red window and water vapour. Resolution will be increased in the

infra-red channels to about 4 km. Image navigation accuracy will also be improved.
(b) Several geostationary satellites will have operational infra-red sounding capability using multiple-channel (15-20) instruments with a resolution of about 8 to 10 km at the satellite sub-point. This operational capability should increase the accuracy of upper-level winds by providing more accurate altitude estimates through better vertical temperature determination of the higher-resolution infra-red images.
(c) Development of experimental microwave sounders for geostationary satellites is expected in the longer term to overcome the lack of measurement of temperature and moisture profiles below clouds and the poor vertical resolution of the profiles. A geosynchronous microwave sounder with high temporal frequency and constant viewing geometry will provide improved observation frequency and more accurate interpretation of the 'absolute' temperature and moisture profiles as well as their spatial and temporal changes.
(d) Data -collection systems on geostationary satellites will not change much in the near future. However, improved data handling and processing in future ground systems will greatly increase the throughput of DCB data. It is expected that the number of DCPs in use in domestic and international co-operative programmes will increase substantially.
(e) Direct readout of geostationary imagery will be available to a much larger number
of users because of lower-cost recovery systems. Relatively low-cost wide-band receiving systems using antennae of 2 to 4 m should become available for local user terminals. WEFAX broadcasts will continue to small user terminals.
4.4.3 Other related trends
(a) Both operational and research satellites will contribute extensively to climate programmes, in particular the GCOS. A greater effort is needed to ensure intercomparison, monitoring and evaluation over decades of those sensors and data systems whose outputs are essential for climate monitoring.
(b) Ocean observations from satellites will increase significantly. Expanding recognition of the economic value of the oceans should provide support for routine operational ocean remote -sensing systems. Greatly increased use of microwave sensors will provide 'all-weather' observations of surface winds, sea state, and ocean currents.
(c) The technical capabilities to meet the telecommunication and very-high-resolution image requirements of WMO programmes will exist. The cost of telecommunication services should decrease, but image data with resolutions better than 100 m are expected to become more expensive. In both cases, the variety and quality of services should increase significantly.
(d) Data -archiving services are important for all climatology, meteorology, oceanography and hydrology programmes. This is particularly critical for satellite data because of the very large volumes involved. Greatly increased attention to this problem is expected over the remainder of the century. New data storage and retrieval systems are being developed (e.g. laser-based optical systems) which will greatly expand archival capabilities of the future.

4.5 TERMS AND ACRONYMS
The following terms and acronyms are often used with respect to the space-based subsystem. Their origin is indicated where appropriate.
AMSU Advanced Microwave Sounding Unit (UK, USA)APT Automatic pPicture Transmission (Russian Federation, METEOR; USA,
NOAA satellites)Argos Name of French DCLS (used on USA NOAA satellites)ASAP Automated Shipboard Aerological ProgrammeASDAR Aircraft-to-sSatellite Data RelayAVHRR Advanced Very High Resolution Radiometer (USA, NOAA satellites)CEOS Committee for Earth Observing SatellitesCGMS Coordination Group for Geostationary Meteorological SatellitesCSA Canadian Space AgencyDCLS Data Collection Location System (France, on USA NOAA satellites)DCP Data Collection PlatformDCS Data Collection SystemDSB Direct Sounding Broadcast (USA, NOAA satellites)ESA European Space AgencyEUMETSAT European Organization for the Exploitation of Meteorological SatellitesGCOS Global Climate Observing SystemGDPFS Global Data-processing and Forecasting SystemGMS Geostationary Meteorological Satellite (Japan)GOES Geostationary Operational Environmental Satellite (USA)GOMS Geostationary Operational Meteorological Satellite (Russian Federation)GOOS Global Ocean Observing SystemGOS Global Observing System (WWW)GTS Global Telecommunication System (WWW)HIRS High-resolution Infra-red Sounder (USA, NOAA satellites)HRFAX High-resolution Facsimile (Japan, GMS)HRPT High-resolution picture Transmission (USA, NOAA satellites)IEOS International Earth Observing SystemINSAT Indian National Satellite (India, geostationary, multi-purpose)IR Infra-redJEOS Japanese Earth Observing SystemLRFAX Low-resolution Facsimile (Japan, GMS)LRPT Low-resolution picture TransmissionMDD Meteorological Data Distribution system (EUMETSAT, METEOSAT)MDUS Medium-scale Data User Stations for HRFAX (Japan, GMS)METEOR Operational meteorological (polar) satellite system (Russian Federation)METEOSAT European geostationary meteorological satellite (EUMETSAT)MSU Microwave Sounding Unit (USA, NOAA satellites)NASA National Aeronautics and Space Administration (USA)NOAA National Oceanic and Atmospheric Administration (USA)POEM Polar Orbit Earth Observation Mission (ESA)POES Polar-orbiting Operational Environmental Satellite (USA)SARSAT Satellite-aided S&R system (USA, Russian Federation, France, Canada)S-band S-band radio frequencySBUV Solar Backscatter Ultra Violet Instrument (USA, NOAA satellites)SEM Space Environment Monitor (Japan, GMS; USA, GOES and NOAA satellites)SST Sea-Surface Temperature

SSU Stratospheric Sounding Unit (UK, on USA NOAA satellites)TOVS TIROS Operational Vertical Sounder (USA, NOAA satellites)UHF Ultra-high-frequency (radio band)VAS VISSR Atmospheric Sounder (USA, GOES satellites)VHF Very-high-frequency (radio band)VIS VisibleVISSR Visible and Infra-red Spin-Scan Radiometer (Japan, GMS; USA, GOES
satellites)WEFAX Weather facsimile broadcast from geostationary meteorological satellitesWMO World Meteorological OrganizationWWW World Weather Watch
REFERENCES
Weather reporting, Volume C - Transmissions (WMO-No. 9).
WMO Technical Regulations (WMO-No. 49).
Manual on the Global Telecommunication System (WMO-No. 386).
Information on meteorological and other environmental satellites (WMO-No. 411).
The role of satellites in WMO programmes in the 1990s (WMO-No. 494).
Quantitative meteorological data from satellites (TN No. 166, WMO-No. 531).
Manual on the Global Observing System (WMO-No. 544).
Satellite capabilities to 1995 for meteorology and operational hydrology (WMO/TD No. 56).
____________

P A R T V
REDUCTION OF LEVEL I DATA
5.1 REDUCTION OF LEVEL I DATA FROM THE SURFACE-BASED SUBSYSTEM
5.1.1 Introduction
Level I data are, in general, are instrument readings or sensor signals expressed in appropriate physical units, and which referred to Earth co-ordinates. They require conversion to the meteorological variables specified in the data requirements given in the WWW Plan. Level I data themselves are in many cases obtained from the processing of electrical signals such as voltages, referred to as raw data. In general, the problem involves only the use of calibration data, but there are some instances which involve more complex procedures.
The general rules to be followed for the reduction of Level I data from the surface-based subsystem are given in the Manual on the Global Observing System (WMO-No 544), Vol.I, Part V.
5.1.2 Units for meteorological observations
For the reference, see the Guide to Meteorological Instruments and Methods of Observation (WMO-No. 8), Chapter 1, section 1.5.3.1, Part I.
The following units shall be used for meteorological observations:
(a) Atmospheric pressure in hectopascals (hPa);
(b) Temperature in degrees Celsius (°C);
(c) Wind speed7, in both surface and upper-air observations, in metres per second (m.s-1);
(d) Wind direction in degrees clockwise from geographical north (°);
(e) Relative humidity as per cent (%);
(f) Precipitation in millimetres (mm); (g) (h) Evaporation in millimetres (mm);(i) (j) Visibility in metres and kilometres (km);(k) (l) Irradiance in watts per m2 and radiant exposure in joules per m2 (W.m-2 and J.m-2);(m) (n) Duration of sunshine in hours (h);(o) (p) Cloud height in metres (m);(q) (r) Cloud amount in octas;(s)
7 The use of units of wind speed is still under consideration with WMO, as the use of knots (Kn) is still widespread.
(t) Geopotential, used in upper-air observations, in standard geopotential metres (m').
(u)5.1.3 Principal lLand stations
GeneralDetailed information on the reduction of data from these stations is available in the Guide to Meteorological Instruments and Methods of Observation (WMO-No. 8), Chapter 2, Part III supplemented, where necessary, by documentation provided with particular items by the manufacturer. There are, however, matters of principle which may be raised. Observations by human observers at principal synoptic stations are increasingly being supplemented by equipment which may be located some distance from the observer. This is particularly true at airfields where space free of the disturbing effects of aircraft, buildings and large paved areas is almost inevitably distant from and inaccessible to the observer. In general, this does not pose serious problems because point measurements made with relatively slow-reacting sensors are sufficiently representative for synoptic purposes. However, measurements such as cloud base height and visibility are representative only of a relatively small volume and involve quantities which can vary markedly in time and space. The difficulty thus arises of how to process raw information in order to provide useful synoptic data. In these circumstances it is desirable that such instruments should be used only as an aid to estimation at principal synoptic stations.
5.1.4 Automatic stations
5.1.4.1 Reduction processes
The conversion of raw data obtained by automatic weather stations to meteorological data of a higher level comprises several reduction processes. With modern microprocessor technology calculation of Level I and Level II data can be made simultaneously by the automatic weather station. It may sometimes be difficult for the user of the data to distinguish between the data of different levels.
Typically, some or all of the following reduction processes are involved:
(a) Averaging of filtering samples
If within an air mass a variable fluctuates with time owing to turbulent motion, an instantaneous spot measurement will generally not be representative of the air mass as a whole. Furthermore, if extreme values are required, a single instantaneous measurement would clearly be unsuitable because the probability that the time of measurement coincides with the time of an extreme is very small. So the variable should be sampled repeatedly over a suitable period of time for the purpose of observing representative mean and extreme values. The way sampling is done depends mainly on the typical rate of change of the variable being measured. The following definitions are used in this connection:
Sampling time or observation period - the length of the time over which one observation is made, during which a number of individual samples are taken- the duration of each observation, including for a number of individual samples;
Sampling function or weighting function is, in its simplest definition - an algorithm for averaging or filtering the individual samples to obtain meteorologically representative values corresponding to the sampling time;
Sampling interval – the time between successive observations

The sampling frequency - the frequency at which samples are taken. The sample spacing is the time between samples.
The use of a long sampling time enables as many small- scale fluctuations as possible to be smoothed out. In some cases simple or sliding continuous averaging is not suitable, since it does not sufficiently reduce the high-frequency spectral components of the parameter observed. For this purpose, filtering of the measured values rather than averaging is necessary.
As indicated in section 3.2.1.4.5.1, in many countries a sampling interval of 10 minutes has become usual for automatic measurements. This is in accordance with the recommendation that data reported in meteorological messages should be based on observations made within the 10 minutes prior to the nominal reporting time. In addition, the following recommendations give some suitable values of the sampling time and sampling function for the different variables and for synoptic purposes:
Pressure
Sampling time: of the order of one minute Sampling function: arithmetic average; if measured continuously, the most
recent average within the sampling interval
Even single spot readings will usually be acceptable instead of averages.
Wind speed and direction
Sampling time: 10 minutes Sampling function: arithmetic average or "exponentially mapped past"
(EMP) average. EMP averages give greatest weight to the most recent events.
For determining gusts the sampling time can be much shorter (e.g. 1 second). The inertia and filtering properties of the measuring instrument should match the selected sampling time.
Temperature and humidity
Sampling time: of the order of 1 minute Sampling function: arithmetic average; if measured continuously, the most recent average within the sampling interval
Precipitation
Sampling time: of the order of 10 minutes; continuous measuring Sampling function: cumulative total
Averages over a sampling time of seconds to minutes are common for estimating the intensity. In some systems the times of start and finish of precipitation may also be stored using only a precipitation detector.
Visibility
Sampling time: of the order of 30 seconds to 1 minute; continuousmeasuring
Sampling function: arithmetic average; the minimum average within the sampling interval
Cloud base
Sampling time: of the order of 1 to 10 minutes; continuous measuring Sampling function: arithmetic average; the minimum average within the
sampling interval
Sunshine and radiation
Sampling time: of the order of 1 to 10 minutes Sampling function: cumulative total
If the automatic weather station has multi-purpose functions for use not only in synoptic meteorology but also climatology, aeronautical or agricultural meteorology, the sampling times and functions indicated above have to be adapted to meet the requirements of all users. The question of which filtering and averaging algorithms to apply to various types of measurement poses problems of standardization and of representativity of the final result which have neither been considered generally nor widely agreed upon.
(b) Linearization and scaling of sensor output
The sensors produce, through a transducer, signals related to the variables sensed. These signals can be characterized as raw data. Deviations from the linear function between sensor input and output are corrected within the computer of the station or directly by the sensor logic, if possible taking into account calibration values stored in the memory.
Linearization is often done through polynomials. Sometimes each individual sensor has its own polynomial coefficients; this is not an ideal solution however. Improvements in sensor production capability should be used to reduce the spread in the measurement characteristics of individual instruments. If the spread between individual sensors is reduced the calibration will be simplified accordingly and the time needed to prepare sensors for use and to support their proper operation is shortened. It is therefore usually much easier to use standardized coefficients for each type of sensor.
(c) Conversion to meteorological units
The choice of output signals is wide and varies from electrical analogue signals in many voltage and current ranges to digital serial or parallel signals. Analogue signals are usually converted to digital form by analogue to digital convertor. Use of digital signals early in the measuring system offers advantages in processing and quality control as well as useful protection against electrical noise from external sources or hardware associated with the system. The information sampled is converted and scaled to meteorological units.
(d) Compensation for secondary influences
Secondary influences (like the temperature dependences for pressure) can be measured and compensated for. However, attention has to be paid to the fact that the probability of missing data increases with the interdependency of measured parameters.

(e) Quality control
At some point before the meteorological information is compiled, a form of quality control should be applied to assure appropriate standards in the quality of data.
A general description of quality- control facilities is given in Part VI. At automatic weather stations quality-control checks may be useful concerning:
Data format (formal checks)Internal consistencyImpossible valuesExtremes (outliers)Time consistency (change from previous value).
Areal quality-control checks and tests for homogeneity are recommended at a later stage of data processing and at central data-collection points rather than at the station itself.
Quality control allows the following actions to be taken at the automatic weather station or by sophisticated sensors: Exclusion from distribution of values lying outside the defined quality limits;
Calculation and insertion of corrected values;
Generation of status output to inform the users of the quality of the meteorological data produced and to indicate any malfunction of the sensors concerned.
Since these actions demand considerable microprocessor and storage facilities, automatic stations or sensors which include quality-control procedures tend to be expensive. Therefore, extensive quality control is not always possible at the station. However, it becomes a vital element of the automatic weather station if:
The information necessary to check the correct functioning of a sensor is only present in the sensor itself at the station and is not available at a later stage of processing;
Local users have to depend on direct access to the meteorological information at the station site.
There is as yet no general agreement on what quality-control routines should be used for automatic measurements of specific variables.
(f) Derivation of related variables
Some related variables may be derived based on the automatic measurement of the common meteorological elements variables (section 3.2.2.2). Examples of related variables are dew point, water vapour, pressure, pressure tendency, pressure reduced to standard levels. Derivation may also include further statistical processing in the climatological sense such as averaging, totalling and computing variations over longer periods.
(g) Coding of meteorological messages
The information has to be encoded for transmission to the point at which the data are
inserted onto the GTS as meteorological messages.
5.1.4.2 Technological aspects
The means by which the functional steps described above are achieved vary in detail with the systems. The reduction functions which must be carried out either by the automatic weather station processor or the sensor interfaces or the sensor microprocessor, or by a combination of them, depend to some extent upon the sophistication of the station. In particular, a distinction may be made between older systems using separate circuits each designed to carry out a particular function ("hardware systems") and those based on small computers ("software systems"). Software systems are more flexible and the processing of the raw data can be considerably more complex than in hardware systems. In hardware systems quality control and even encoding are often missing as, sensors frequently have linear characteristics. Software systems are becoming less limited as a wide range of sensor systems becomes available permitting, for example, ruggedness and long-term stability to be optimized. Automatic weather stations containing sensors which incorporate dedicated processors (integrated sensors) with available software form part of current developments.
The introduction of new technology necessitates more than ever before a standardization of the conversion of raw data into Level I data or Level I data into Level II data. Due to the lack of such approved standards and procedures, many commercial companies elaborate their own algorithms and consider these as "firmware", with no access by the users. Situations where instrument specialists lack necessary information, in particular in case of malfunction of microprocessors or black boxes, should be avoided.
5.1.5 Sea stations
There are a variety of types of automatic sea stations, ranging from sophisticated stations on fixed platforms and ships to the simplest drifting buoy stations of the types used during Global Weather Experiment (FGGE). The observations from mobile ships may be fully or partly automated.
Methods of data reduction may differ, but in general, they are similar to those used for land stations. For platform stations and ship stations where power and computer capacity are available, the reduction may be performed "on the spot" by suitable software programmes. These include some quality control, coding into WMO codes and transmission to snore. Manual input of conventional observations, e.g. state of the sea, must be possible in the system. For mobile ships the wind sensor output must be combined with the ship's speed, heading, and preferably also the pitch and roll to obtain the true wind (see section 3.2.2.3).
For simpler stations like drifting buoys "on-the-spot" reduction of the data should in general comprise only the conversion of sensor outputs (voltage, frequency) to digits for transmission to a central facility where the conversion to physical parameters takes place. A microprocessor maybe used to store the "on-the-spot" Level I data necessary for averaging processes and for producing values, e.g. pressure tendency and characteristic from observations made by drifting buoys. The calibration procedure (and automatic quality control) takes place after transmission to the central facility. Errors are more frequently introduced during transmission than by the automatic handling of the sensor output.
The degree of data reduction (and eventually quality control) to be performed "on the spot" before transmission may vary for different station types. It should, however, be kept in mind that remote stations left unattended over long periods should be as simple as possible.

5.1.6 Upper-air synoptic stations
In the present context no distinction is made between stations on land and those over the sea.
5.1.6.1 Radiosonde observations
Though there are many types of radiosondes in service, all are similar in that they provide, by radio telemetry, a stream of measurements of atmospheric pressure (P), temperature (T) and humidity (U). Depending on the system employed these data may be recovered directly from the telemetry signal by a human operator or they may be displayed graphically after preliminary processing in the receiving equipment. Whatever method is used, the raw data are converted to the appropriate variables using the calibration data supplied with the radiosonde and encoded as prescribed in the Manual on Codes (WMO-No. 306). For a variety of reasons it has been increasingly desirable to introduce semi-automatic systems in which the human operator's data reduction function is replaced by a minicomputer and, as a result, great care is needed in the specification of processing routines. It is useful to consider how the task has been organized in one system.
Radiosonde data reduction can be considered to be divided into the following categories, listed in the sequence in which they have to be carried out:
(a) Quality control of received signals to obtain a valid received data set which is the fullest possible statement of the meteorological results;
(b) Derivation of a fine-structure data set intended to be representative of the meteorological features of the sounding in sufficient detail for all purposes;
(c) Derivation of a message data set, representative of the meteorological features of the sounding in sufficient detail for operational exchange via TEMP and PILOT messages.
The received data set is, of course, the underlying source for both the fine-structure data set and the message data set. It is also the most direct source for calculating geopotential values. However, it is not known whether any operational automatic system actually drives the message data set directly from the received data set. In at least one operational system the message data set is based upon the fine-structure data set of stage (b), rather than upon the received data set. In consequence, the message data reduction is undertaken in two stages. This procedure has a number of advantages (and one constraint) and is the method referred to hereafter.
5.1.6.1.1 Quality control of received data
The telemetry systems used in radiosonde systems have for very many years been analogue in nature. Such systems are vulnerable to radio interference and to signal losses. In a manual processing system, visual inspection of a plot of the data sequence will generally identify all but the smallest errors. When the sounding data are processed automatically it is necessary for a corresponding numerical quality- control procedure to be included in the software. The intention is to detect and remove erroneous signals without replacement so that only received data which have been tested and deemed valid enter the meteorological data set. Methods in use in one operational system for the quality control of radiosonde signals (both fast and slow response times) and for the observed parameters obtained when using a radar for wind finding are given in section 2 of Algorithms for Automat ed ic Aerological
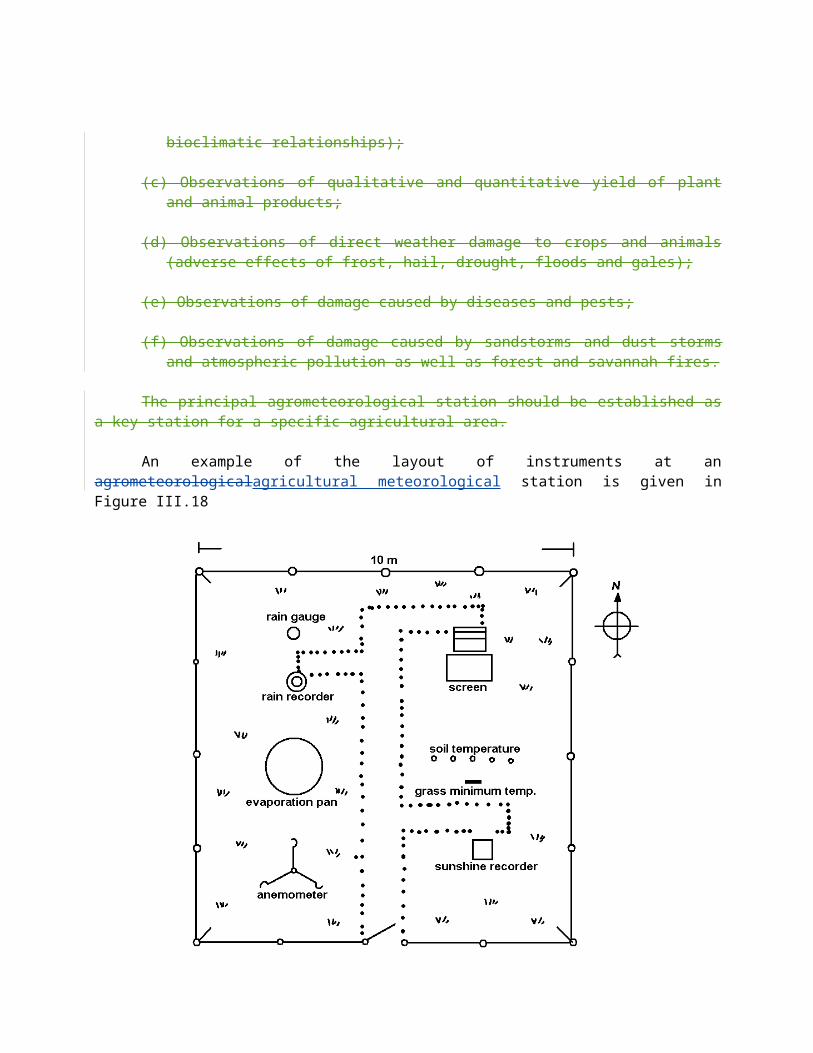
Soundings (Instruments and Observing Methods Report No. 21, WMO/TD - No. 175).
Recently, radiosonde systems have been described which use digital transmission and which include built-in quality control, thereby eliminating the need for quality-control software. However, the operational performance of these sounding systems is not yet known. Therefore, the received data set should be archived in a standard computer format on floppy disks for later inspections and system intercomparisons. The coding standard should be based on the Binary Universal Form for the Representation of meteorological data (FM 94-IXI BUFR). This is a design requirement for the ASAP system.
5.1.6.1.2 Selection of a fine-structure data set
The WMO reporting tolerances are such that the message data set cannot be relied upon to preserve the geopotentials represented by the received data set (except by occasional chance). Thus, the geopotentials have to be obtained by direct calculation from level to level of either the received data set or the fine-structure data set. The latter source reduces the precision required of the geopotential calculations, but imposes a constraint upon the technique used to obtain the fine-structure data set. The constraint is that the fine-structure data set shall be derived from the received data set by the "method of least squares". When this is done, the underlying geopotentials are preserved in the fine-structure data set.
It should be rioted that the fine-structure data set is not just a selection of the received data set. Instead, the fine-structure data set represents the sounding profile by set of calculated turning points which comply with the "least squares" condition together with various tolerances. In addition to preserving the underlying geopotentials, the use of the "least squares" condition has the advantage that it is easy to adjust the extent to which very fine details of the observed structure are filtered out, without effect upon the geopotentials implied. An operational procedure of this type is given in section 3 of Instruments and Observing Methods Report No. 21 for both radiosonde and radar wind data.
5.1.6.1.3 Selection of turning pointssignificant levels for the TEMP and PILOT messages
As already stated, these notes refer to the selection of message data from the fine-structure data set. Those levels which are the subject of WMO numerical specification are readily selected and the task will not be reviewed here. The selection of further levels to represent any additional prominent features of the sounding profile is a more complicated task. A suitable procedure is given in generalized form in section 5 of Instruments and Observing Methods Report No. 21. The method has been developed from one in operational use. The selections provided have been compared with human selection over 80 sets of sounding data. The results, together with other information, are given in an unpublished paper (OSM 22) available in the library of the UK Meteorological Office, Bracknell.
5.1.6.2 Radiowind observations
Measurements of wind speed and direction as a function of height are usually made by tracking a balloon-borne radiosonde or radar target from launch at the Earth's surface to balloon burst, which may be as high as 30 km above sea -level. Tracking systems actually determine the balloon position as a function of time, but the wind velocity must be estimated by first taking differences of position and assuming the balloon drifts with the horizontal component of the wind as it ascends. Three systems are frequently used to track the balloon: radar, radiotheodolite and NAVAID.

A radar emits a microwave frequency pulse in the direction of a balloon-borne target, senses the backscattered energy with a highly directional antenna, and determines slant range and azimuth and elevation angles to the target as a function of time. The application of simple trigonometric relationships to convert from polar to Cartesian co-ordinates allows the computation of northerly and easterly wind components from which speed and direction readily follow.
Radiotheodolites operate in one of two modes. In both cases, a highly directional antenna is used to sense the telemetry signal emitted by a balloon-borne radiosonde and to determine azimuth and elevation angles. In one mode, the radiotheodolite emits a continuous, phase-modulated signal which is received at the radiosonde and echoed back to the radiotheodolite by a device called a transponder. By measuring the phase delay of the echoed signal, the slant range between radiotheodolite and balloon may be determined. In the other mode, a transponder is not used and slant range cannot be determined. In its place, however, balloon height computed from the telemetered pressure, temperature and humidity (PTU) can be used as the third variable, with azimuth and elevation angles, to calculate position as a function of time.
NAVAIDs, typically LORAN-G and OMEGA, are networks of radio frequency (RF) transmitters permanently located at various sites around the globe, offering navigation service or a means to determine position to users, such as ships and aircraft, equipped to receive and process the RF signals. These receiver/processors are too cumbersome and expensive to carry abroad a small, expendable balloon. Instead, it is practical to receive the NAVAID signals in radiosonde and use them to modulate the telemetry signal carrying the PTU data to the surface. A simple antenna is used to intercept the telemetry, a receiver to recover the NAVAID signal, and a processor to compute position of the balloon-borne radiosonde as a function of time.
The use of automatic and semi-automatic systems such as that referred to in section 5.1.6.1 above also implies the need to derive winds by objective means. The problems are similar though there are differences in detail. Again, the greatest difficulty lies in the quality-control routines. Redundant information in the raw data stream is of great assistance in identifying and eliminating wildly erroneous data and other outliers, thus decontaminating the calculations. While radars, radiotheodolites and LORAN-C are capable of producing useful wind data most of the time without elaborate quality control, it is essential to OMEGA windfinding. In the former cases, however, the application of effective quality-control measures in the computations greatly extends the capabilities of the systems and increases the level of confidence in the resultant winds.
5.1.7 Special stations
5.1.7.1 Radar meteorological observations
The following text deals only with radar measurements of precipitation. It summarizes the errors which may arise in attempting to obtain accurate precipitation measurements and points towards ways in which they may be reduced. The sources of error in radar measurements fall into the following categories:
(a) Those due to shortcomings in the system and in the processing of data;
(b) Those arising from a variety of geographical and geometric features;
(c) Those due to uncertainties in physical properties.
The errors of the third category pose a considerable problem. They include the major difficulty of determining the precise Z-R relationship for calculation of precipitation intensity, the effects of orographic rain and associated vertical gradient, low-level enhancement or evaporation and bright-band enhancement.
The drop-size distribution in rain leads to an empirical formula relating echo intensity and rate of rainfall, viz:
Z = a · Rb
where Z is known as the reflectivity factor depending on the size of raindrops, R is the rate of rainfall and a and b are constants. The size of raindrops and their distribution in a given volume vary considerably, both within one type of precipitation and, even more, from one type of precipitation to another. Thus, the "constants" a and b can vary considerably. Generally, the coefficient, a, increases and the exponent, b, decreases with increasing convective intensity of precipitation. The errors which can arise from selecting the wrong constants are considerable.
It is apparent that a totally wrong choice could lead to the rate of rainfall being incorrectly assessed by a factor of 10 or more. Use of the compromise relationship appropriate to stratiform rain, where 200 and 1.6 (or figures close to them) are adopted for a and b respectively, reduces that possibility considerably.
Although radar and raingauges make different measurements, the one over an area and the other at specific locations, the use of gauges for comparison purposes is generally accepted by radar meteorologists. But there are considerable problems, first in obtaining genuine radar-gauge comparisons and secondly in knowing how best to make use of them in order to improve the quality of the precipitation data in real time. The techniques are continually evolving. The problem is discussed in section 5.8 of Use of Radar in Meteorology (TN No. 181, WMO-No. 625) which deals with the use of raingauges for comparison and adjustment.
In addition to the improvements taking place in the objective assessment of precipitation intensities, for example the increasing ability of computers to recognize rainfall types and the presence of a bright band, there is some thought being given to methods of human intervention through a combined use of radar and satellite imagery. Information about this subject will be found in the above-mentioned Technical Note.
5.1.7.2 Radiation
Radiation measurement is made from measurement of small voltages which are usually recorded on suitable chart recorders or by data loggers on paper or magnetic tape. The raw data are therefore accumulated as a series of voltages or, in some cases, as integrals of voltage over suitable time intervals. These data are reduced to the solar radiation units required by the application of calibration data and corrections for the sensor and the recording system. More information on recording and data reduction with different radiation instruments may be obtained from the Guide to Meteorological Instruments and Methods of Observation (WMO-No. 8), Chapter 97, sections 9.3.4, 9.4.4, 9.5.4.
The sensitivity of radiation sensors normally changes slowly with time and the calibration methods used have an experimental error of the same order as the probable annual change. It may be necessary, therefore, to accumulate a number of calibrations over

a period of a year or two before a change in sensitivity can be allocated with some certainty. Raw data are therefore usually reduced afterwards and the data set produced may need correction in the light of subsequent experience.
Reduced data are reported to the World Radiation Data Centre in Leningrad Saint Petersburg as well as to the Regional Radiation Centres on forms published by WMO for the purpose.
5.1.7.3 Observations of atmospherics
Raw data are obtained as bearings from known points which are combined on a plotting table in order to find out the location of the sources of atmospherics. These data maybe verified by the provision of redundant atmospherics detection stations in a network; however, this kind of data reduction is rather subjective.
Technical progress has now made reduction of data on location of atmospherics feasible by timing the arrival of an atmospherics wave front at different stations in a network. This method forms the basis of a completely automatic method in which all data reduction, objective quality control and encoding is done centrally or at the station site by microcomputers.
5.2 REDUCTION OF LEVEL I DATA FROM THE SPACE-BASED SUBSYSTEM
5.2.1 Introduction
In the case of meteorological satellites, Level I data are raw information representing the outputs of the various meteorological sensors, special attitude sensors and certain housekeeping and status indicators. The conversion to meaningful meteorological parameters or information requires in addition to calibration data, precise timing such as the time at the beginning of a picture frame, or an individual scan line, of the radiometry. Other necessary inputs will be ground based and they will include orbital tracking data and meteorological information drawn from other sources. The reduction of Level I data from the space-based subsystem can therefore be divided into several processing steps:
(a) Orbit and attitude processing;
(b) Pre-processing of radiometer raw data;
(c) Generation of imagery;
(d) Extraction of quantitative meteorological information:
(i) Extraction from the imagery data;
(ii) Extraction from the geophysical sensor data.
5.2.2 Orbit and attitude processing
The main objectives of orbit and attitude processing are to fulfil certain requirements associated with the control of the orbit and orientation of the spacecraft, and to derive the necessary information for allocating geographical co-ordinates to the radiometry data. The basic inputs for orbital processing are the tracking data and the orbital models. Inputs to the attitude processing are more diverse; they include the outputs of special attitude sensors, the

radiometric data itself, dynamical models describing the motion of the radiometers and the spacecraft, and the results of the orbital processing. The requirements associated with this processing task depend on the type of spacecraft and its mission. The basic processing tasks are:
(a) Calibration and pre-treatment of input data from the orbital tracking system and the determination of the parameters of the orbital model;
(b) Production of predicted orbital positions for use in the radiometric data processing and for antenna orientation, particularly at the various users' stations;
(c) Calibration and pre-treatment of the inputs from special attitude sensors and the derivation of a coarse attitude solution;
(d) Extraction of information from the image data stream, pre-treatment of certain features (landmarks and horizon crossings) in order to produce suitable inputs and the derivation of a high-accuracy solution, especially for the radiometer and spacecraft attitude of geostationary satellites;
(e) Computation of intermediate products (such as a deformation model) which express actual and forecast attitude and orbit in a form which can readily be used to provide geographical location of the radiometric data.
5.2.3 Pre-processing of radiometer raw data
Processing is generally concerned with the determination and elimination from the raw radiometer data of the effects of the spacecraft and instrumentation, e.g. changes in spin rate, differences in performance of individual sensors, phase errors introduced by spacecraft hardware limitations, etc. The pre-processing task depends largely on the design of the spacecraft and the instrumentation and thus varies greatly, but the following processing steps are generally involved:
(a) Determination and correction of any phase distortion caused, for example, by changes in the sampling rate or in changes of phase angles of successive scan lines, the phase adjustment;
(b) Application of corrections to compensate for any errors induced by spacecraft and instrument hardware limitations, for example errors resulting from truncation and rounding off and also errors needing treatment by unidimensional deconvolution methods (electrical filter compensations or optical modulation transfer function compensation, respectively);
(c) Registration of picture elements in case of multi-spectral data in order to compensate for the fact that in multi-channel radiometers the channels may not have identical fields of view;
(d) Calibration of the radiometric data in order to compensate for differences in performance between individual sensors and for long-term drifts in their sensitivity.
5.2.4 Generation of imagery
The main aim of imagery is to improve the usefulness of the radiometric data as an image which could be used as qualitative information in routine meteorological operations. The generation of imagery may involve providing a simple method of geographically locating image features, or processing the data in some way which accentuates the required characteristics. Some tasks which could be implemented are:
(a) Transformation of the pre-processed radiometric data into the projection which would be generated by a perfect radiometer on an ideal satellite. This process, known as rectification, is especially necessary for imagery obtained from radiometric data from geostationary satellites;
(b) Transformation of selected pre-processed radiometric data into a standard cartographic projection, such as polar-stereographic, to facilitate comparison with other meteorological charts;
(c) Computation of grids (latitude-longitude lines and coastlines) from the orbital and attitude data;
(d) Generation of annotations for image products;
(e) Transformation of image information, either involving the presentation of all the information while producing a useful data compression or permitting some loss of image information by employing techniques such as filtering, enhancement or contouring.
5.2.5 Extraction of quantitative meteorological information
5.2.5.1 Extraction from the imagery data
The imagery data from both the near-polar-orbiting and the geostationary satellites can be used for several kinds of quantitative meteorological information such as the wind field derived from the measurement of cloud displacements; the analysis of sea, land and cloud top surface temperatures; the cloud amount; the type and height of cloud tops; the snow and ice cover and, to some extent, the radiation balance data. Apart from the imagery data these tasks require Earth location information and other meteorological data. The latter are mainly needed for quality-control purposes. The detailed nature of some of the processing is naturally dependent on the particular methods used but the following tasks can be foreseen:
(a) The recognition and identification of individual or general areas of suitable cloud tracers for wind determination;
(b) The determination of the displacements of cloud tracers between successive images, their conversion to wind velocity and the establishment of their geographic location;
(c) The separation of the radiation data into data sets based on a geographical grid and the construction of n-dimensional histograms, where n depends on the number of channels and on the processing method chosen;
(d) The analyses of these histograms will be performed together with other

meteorological data in order to yield all the other quantitative meteorological information mentioned above, e.g. sea-surface temperature, cloud top height amount and type of clouds, snow and ice cover and the radiation balance data.
5.2.5.2 Extraction from the geophysical sensor data
Other quantitative products can be derived best without first being converted to imagery. Such products are atmospheric temperature and moisture profiles, sea-surface temperatures, ozone profiles and measurement: of radiation budget. The general processing steps for generation of these products are:
(a) Append Earth location information, calibration parameter and quality indicators to each Level I raw Earth-view data record; for example, to each Earth-view scan line;
(b) Assemble data from the required instruments, if more than one is required. Some products like atmospheric temperature profiles require simultaneous data from up to three different satellite instruments;
(c) Obtain auxiliary data needed to make measurements from the satellite data. These include meteorological analyses and forecasts, land/sea discrimination maps and climatological data;
(d) Screen the data to eliminate noisy or inappropriate data; calibrate, and eliminate clouds if necessary;
(e) Make quantitative measurements from the instrument an, auxiliary data of parameters such as temperature profiles and sea-surface temperatures;
(f) Quality control the output products using surface truth data, data consistency checks or interactive editing.
REFERENCES
Manual on the Global Observing System (WMO-No. 544), Volume I, Part V.
Use of radar in meteorology (TN No. 181, WMO-No. 625).
A method for the automatic selection of upper air "significant levels" from radiosonde data by G. F. Forrester and A. H. Hooper. Proceedings of the Fifth AMS/WMO Symposium on Observations and Instrumentation, Toronto, 1985.
Algorithms for automatic aerological soundings. Instruments and Observing Methods Report No. 21 (WMO/TD-No. 175), Nov. 1986.
____________

A P P E N D I X
QUALITY CONTROL OF DATA
1. QUALITY CONTROL OF DATA FROM THE SURFACE-BASED SUBSYSTEM
1.1 General
Several different quality-control methods are used for surface synoptic data, i.e. data related to standard observational times. These include horizontal, vertical, three-dimensional, time and hydrostatic checks as well as a combination of these methods.
1.2 Tests using statistical structure parameters within interpolation scheme
1.2.1 Horizontal check
The horizontal check can be performed with the aid of methods used for objective analysis by means of optimum interpolation for every station according to data from several (usually four to eight) surrounding stations and comparison of the interpolated value against the observed value. The interpolation is made according to the formula:
(1)
where is the interpolated value of deviation of the element from its normal at the station in question;
are the observed deviations of this element from its normal at the surrounding stations;
are the weight multipliers found by solving the equation system.
(2)
where are covariances describing statistic relation of the element values at different points, namely;
(3)
(the bar above indicates statistical averaging), δ is the mean square of the observational errors. It is rational to perform control by proceeding not from the absolute value of residue between the interpolated and observed values, but from the ratio:
(4)where is the mean square difference between and which can be computed according to the formula:

(5)
after weights ρi definition. If k0 does not exceed some critical value K, the data are recognized to be correct; otherwise an error is assumed to exist. According to available data, may be used; this ensures that the correct values are never called into question. In the light of the above assumption it is perhaps advisable to use smaller values.
The inequality k0 > K indicates (with a rather high probability) that the presence of errors can arise not only from an erroneous value f0 at the checked station, but also from an erroneous value at the surrounding stations, especially in the case where the weight ρi for this value is large. Therefore, it is first necessary to perform a similar check for the surrounding stations to ensure that the erroneous value has been detected. In most cases this procedure assures the indication of the erroneous value and its replacement by the interpolated value. In the case when the values are erroneous at several surrounding stations, this method does not hold.
1.2.2 Vertical check
The vertical check is also based on the comparison of the observed value against the interpolated one. However, this interpolation is not carried out with data from the neighbouring stations related to the same level but rather with data from the same station related to other levels. As the covariances in the vertical do not possess characteristics of homogeneity and isotropy, the values of mij (3) entering formulae (2) and (5) depend not on the distance between levels but on the height (pressure) of both levels.
Vertical checking as well as horizontal checking (with respect to upper-air data) is used mainly for the geopotential. However, with information on covariance matrices it is easy to tell how this method might be used for other meteorological elements as well.
1.2.3 Three-dimensional check
The three-dimensional check is performed by comparing the observed value against the value interpolated from data on several levels, both at the station in question and at neighbouring stations. Since the data on the three-dimensional statistical structure of a number of basic meteorological fields are available, there should be no difficulty in the use of this procedure.
1.2.4 Time check
The time check involves data from both the current and previous observational times. However, this control method requires time extrapolation instead of interpolation. It is therefore expedient to use as a reference data computed from previous observations for checking the results of the numerical prognosis for the time under consideration.
1.2.5 Hydrostatic check
The hydrostatic check is based on the use of the static equation or the geopotential barometric formula to show that the geopotential and temperature at different isobaric surfaces are internally consistent. The essence of this method is given below.
Integrating the hydrostatic equation:

(6)
for the layer located between two adjacent isobaric surfaces ρn and ρn+1 and turning from the absolute temperature T to the temperature in degrees Celsius, one has:
(7)
where R is the gas constant for air, An is the layer thickness at 0°C.
Assuming the mean temperature t in the layer is equal to the arithmetic mean of its boundary values, one can reduce (7) to the following form:
(8)
The numerical values of coefficients An and Bn are listed in the table given below.
TABLE I
The estimate of the static check potentialities
p (hPa) 1000 850 700 500 400 300 200An,m 1300 1553 2692 1786 2302 3244 5546Bn,m/degr. 2.38 2.84 4.03 3.27 4.21 5.94 10.15KΔ1,m 20 24 35 09 19 70 64KΔ,m 01 01 06 10 10 10 10KΔ1 + Δ2,m 20 25 41 19 29 80 74Δ,m 30 30 40 30 40 100 120
As the upper-air reports contain information on both the geopotential and temperature of isobaric surfaces, ratio (8) can be used for checking this information. For this purpose the difference between the values of the left- and right-hand sides of relation (8) need to be computed for each layer located between adjacent mandatory isobaric surfaces.
(9)
Also, the values of δn need to be compared against its tolerable values Δn. The latter can be estimated both empirically (by handling a large number of observations) and theoretically.
These estimates, as well as the estimates of the given method in general, depend to a large extent on the method used for defining the temperature and geopotential of the isobaric surfaces at each station.
A theoretical estimation of the tolerable discrepancies in the hydrostatic check is more difficult than it is for the methods described above, for these discrepancies have a variety of causes, namely: random errors of temperature measurement, random and systematic deviations of the vertical temperature profile t (lnp) from the linear one, and rounding-off errors in the geopotential computation. The joint action of random observational errors and random deviations t (lnp) from the linear variation can be estimated with the aid of the formula
(10)
where is the mean square of the corresponding discrepancy δ, q is the correlation coefficient between temperature values of the particular adjacent surfaces.
The values of KΔ1 cited in the above table are computed for the winter season; for the summer season they are somewhat smaller. The coefficient K is taken rather large (K=3.5), for besides large-scale disturbances of the temperature vertical profile, taken into account in formula (10), mesoscale disturbances can take place.
The values Δ2 given in this table represent maximum discrepancies resulting from rounding of geopotential values, while Δ are the tolerable discrepancies of equation (8) defined empirically. Comparing them with KΔ1+Δ2, one should keep in mind that natural deviations of t (lnp) from its linear form due to great curvature of the profile of t near the Earth's surface take place in the 1 000-850 hPa layer and in the 300-200 and 200-100 hPa layers due to the presence of the tropopause. This evidently explains the difference between Δ and KΔ1+Δ2 for the indicated layers. As for the 500-400 and 400-300 hPa layers, the values of Δ can perhaps be smaller.
Besides detecting errors exceeding tolerable discrepancies, the static checking procedure enables one to determine the source of the error and consequently to correct it. This is true because errors from different causes result in diverse combinations of discrepancies. For example, an error in a geopotential value due to transmission garbling will result in discrepancies in equation (8) for the two adjacent layers, which are equal to this error and have opposite signs. Garbling of a temperature value will cause two discrepancies of the same sign proportional to the Bn coefficients. Also, an error in computing the thickness of a layer results in a discrepancy for that layer only.
1.2.6 Combined check
The combined quality-control check is realized using various control methods not merely consecutively, but in close interrelation. This is necessary first because no single control method is sufficient to detect and correct all the erroneous information, and second because different methods react on the errors in different ways, depending on the source.
The potential success of quality control increases significantly if we use several methods in combination, i.e. if we draw conclusions as to the character and the value of a certain error using results obtained from all the methods. This enables one to detect the source of the error, to localize the error (i.e. to determine which of the suspected values is erroneous), to define its numerical value and to correct it. For example, the error localization obtained by the combined use of the horizontal and vertical checks is attained by the following means: the value of the tolerable discrepancy for a station changes during a horizontal check, based on the results of a previous, e.g. vertical check; if the vertical check had indicated an error then the tolerable discrepancy for the horizontal check has to be diminished.
2. QUALITY CONTROL OF DATA FROM THE SPACE-BASED SUBSYSTEM
2.1 General
Indirect-sounding data from satellites refer to a rapid succession of non-standard observational times, i.e. the data are asynoptic. In order to check and to take into account (assimilate) asynoptic information for the objective analysis of meteorological fields, one should be in a position to use data

which refer both to various points in space and to various times. In other words, a conversion from space (three-dimensional) analysis of meteorological fields to four-dimensional space-time analysis is required.
At the same time, direct-sounding data possess at least three more peculiarities distinguishing them upper-air sounding data. First, the former give space-mean values, i.e. the scale of averaging is considerably larger than for values obtained by means of conventional upper-air sounding. Second, satellite-based instruments operate under more complicated conditions in comparison with upper-air sounding instruments and conversion from spectral intensity to temperature and geopotential is approximate. Therefore, the errors of indirect-sounding data are greater than those of radiosondes. Third, all satellite measurements are performed by only one set of instruments during the satellite's lifetime; the errors of indirect sounding at various points should therefore be intercorrelated.
The above-mentioned properties of indirect-sounding data allow the validity of the data to be estimated only during - not before - the four-dimensional analysis and control.
2.2. Estimation of data reliability
The methods for estimating the reliability of the four-dimensional analysis for data-control purposes (taking into account both the asynoptic nature of the indirect-sounding data and the value of sounding errors and degree of their correlation) are examined below. It is assumed that four-dimensional assimilation of the information is made with the aim of optimum time-space interpolation. It is known that if the observational errors are intercorrelated and do not correlate with the true values of the observed meteorological elements f, the equation of the optimum interpolation method for determining the weight multipliers ρi takes the form
(11)
where μij is the correlation coefficient between the true values of f of two stations with indexes i and j; μoi is the correlation coefficient between the true value of f of the station with index i and the unknown value of this element at the point o; n is the quantity of data used for interpolation; ηi
2 is the mean square of the observational error of this meteorological element divided by its dispersion σ2; νij is the correlation coefficient between observational errors of two stations with indexes i and j.
Having computed the weights ρi by solving equation (11), it is easy to perform the interpolation according to the formula:
(12)
where the values with the prime sign imply deviations of f from its mean of climatological value (normal) f the sign ~ refers to the observed values of the element (in contrast to the true values), and ^ refers to the result of the interpolation (also in contrast to the true values).
Having solved system (11), one is in a position to estimate the mean square interpolation error with the aim of formula:
(13)

where ε2 is the degree of interpolation error, i.e. the mean square of the interpolation error divided by σ2; the value σ is supposed to re constant.
As is known, the spatial correlation functions of basic meteorological elements can be considered homogeneous and isotropic in the horizontal plane or along isobaric surfaces, i.e.
(14)
may be assumed, where rij is the distance between two stations with indexes i and j; μ(r) is the function of the given form.
Formula (14) is correct if both observations refer to the same isobaric surface and both observations are performed at the same time. The more general hypothesis on time-space (horizontal-time) homogeneity and isotropy can therefore be implemented with sufficiently accurate results. If the distance between two stations is equal to rij and the time interval between observations is τij, the following formula may be used:
(15)
where c is the constant denoting velocity. For the surface pressure c 35 km.h-l. This value of c will be used later on.
Let us now assume that part of the basic data (e.g. data from stations with indexes i=l, 2, ... k) is obtained by means of conventional radiosondes while the rest (i=k+1, k+2, ... n) is obtained indirectly. The errors of radiosondes are considered to be white noise, i.e. they do not correlate between each other or with indirect-sounding errors:
1 at j=1;νij = 0 at i=1,2, … k; j≠1,2, … n; j≠i; (16)
0 at j=1,2, … k; i=1,2, … n; i≠j;
The mean square, and consequently the degree of radiosonde error, is taken to be equal for all the radiosonde points
(17)
The degree of indirect-sounding error is also identical (but different from direct-sounding errors):
(18)
System (11) then becomes:
(19)

For example, if k=2 and n=5, the matrix of coefficients of system (19) (taking into account that and ) is of the form:
As regards the correlation coefficients vij between indirect-sounding errors, the latter are accepted as being dependent only on the distance between points, Here the limiting case is of interest when these errors are of the "black noise" character, i.e. when for all i and j exceeding k
(20)
It follows from the above that the criteria of the quality control performed during the four-dimensional analysis (assimilation) of information do not, for all practical purposes, differ from those stated in 1.2.1 above, based on the application of the optimum interpolation. The essence of the control itself consists, as previously, in the comparison of the residue between the interpolated and reported values against the tolerable discrepancy and - depending on their relation - the determination of the validity or erroneousness of the checked data.
P A R T VI
QUALITY CONTROL
6. 1 GENERAL
Meteorological observations are exchanged between countries on a world wide basis. Users need to be confident that the observations they receive from other countries are made according to agreed standards set by WMO. The accuracy of the data is of primary importance to many kinds of analyses, computations and scientific investigations. The need for quality control of observational data, therefore, is linked with the fundamental importance of obtaining data of the highest possible quality for all purposes, including the World Weather Watch Programme, regional and national requirements, and international research programmes.
The basic characteristics of quality control within the framework of the GOS and the general principles to be followed both as standard and recommended practices are set down in the Manual on the G lobal O bserving S ystem (WMO-No. 544) , Volume I - Global Aspects (Annex V to the WMO Technical Regulations), and Part VI - Quality Control (WMO-No. 544). The purpose of Part VI of the present publicationthe chapter is to supply supplementary information and to describe in more detail the practices, procedures and specifications which Members are invited to follow for quality control of observations made by their respective Meteorological Services. The information and suggestions contained in this chapter should be used in conjunction with the appropriate parts of the Manual on the GOS (WMO-No. 544) , Volume I and of the other WMO manuals and guides listed at the end.
6.1.1 Levels of application of quality- control procedures
It is generally agreed that quality control of meteorological data begins with the installation of the instruments at the observationing site and ends with the last stage of processing prior to final delivery of the data to the user. This means that observational data have to be quality controlled at different levels of data transfer in both real time and non-real time, using various procedures.
The levels of quality- control procedure are as follows:
(a) The observationing site starting with data acquisition by manual or automatic meteorological stations;
(b) Collectiong centres, prior to the transmission of observational data over the GTS;
(c) GTS centres (standard telecommunication procedures, e.g. error detection and control of formats);
(d) GDPFS centres and other available facilities.
Within the framework of the GOS, quality control is restricted to items (a) and (b) above; the instructions and guidance provided in the present Guide are concerned with observationing sites and collectiong centres only. The reliability and accuracy of meteorological observations, the causes of observational errors and observing methods of preventing such errors are with in the scope of the areas of quality control under discussion.

6.1.2 Observational errors
The entire range of observational errors may be divided into the following three main groups:
Errors of technical devices, including instruments;
Errors inherent in observationing procedures and methods:
Subjective or inadvertent errors on the part of observers and collectiong operators.
The goal in preventing errors is to reduce to a minimum the main sources of errors, which are the conversion stages in the process of making observations and the subjective factor. This can be accomplished automating observations and processing raw information by computer. Fortunately, the increasing availability of minicomputers now permits the speedy application of objective methods. The level of sophistication of such methods is determined by the resources available and considerations of cost-effectiveness. The most effective methods are likely to be interactive man-machine systems. In some cases, Members may consider that relatively simple schemes can be justified because the fraction of errors that go undetected is acceptably small.
Quality control can be carried out by manual as well as automatic methods; in principle, all the necessary quality- control procedures can be applied manually, but the time needed is usually unacceptably long. No appreciable delay should be caused by quality control because the data must be transmitted in real time for operational use. The real-time quality control at the observationing point is, however, of paramount importance since many of the errors introduced during the observationing process cannot be eliminated later.
The real-time activity of quality control within the GOS includes data up to one month old for land or sea stations. This applies particularly to the monthly CLIMAT and CLIMAT TEMP messages and BATHY/TESAC reports.
When implementing a quality- control programme in a Service, each Member must consult the relevant standard and recommended practices contained in the Manual on the G lobal O bserving S ystem (WMO-No. 544), Volume I. The requirements at the observationing site with regard to exposure, measurement and observation are set out in detail for each variable to be measured in the Guide to Meteorological Instruments and Methods of Observation (WMO-No. 8). The latter contains in addition a special chapter outlining quality- control procedures forof observations in general and deals with the quality-control of upper-air observations in more detail.
6.2 PROCEDURAL ASPECTS OF QUALITY CONTROL
6.2.1 Minimum standards
The primary responsibility for the quality control of observational data rests with the Nnational Meteorological Service from which the data originate. It is of the utmost importance, therefore, that Members should make adequate provision for quality control of data to ensure that they are as free from error as possible.
According to the Manual on the GOS (WMO-No. 544), Volume I, Members are obliged to implement minimum standards of real-time quality control at all levels for which they are responsible (e. g. observing stations, NMCs, RMCs, WMCs) and, according to the

Manual on the GDPS (WMO-No. 485) , Volume I , it is recommended that they do so before data received via telecommunication links are processed.
Recommended minimum standards of real-time quality control at the level of the observing station and at that of the NMC are similar to those given in the Manual on the GDPS (WMO-No. 485), Volume I, Attachment II-I, Table I.
6.2.2 Scope of quality control
All stations listed in the Rregional Bbasic Ssynoptic Nnetworks of observing stations as given in Volume II of the Manual on the GOS (WMO-No. 544) are to be subject to quality control according to the following table.
Table VI.1
Parameters Code forms and time of observations subjected to quality control - time of observation and code form
Type of observational data
Time of observations
Code form*
SYNOP 00, 06, 12, 1803, 09, 15, 21
FM- 12
SHIP 00, 06, 12, 1803, 09, 15, 21
FM -13
DRIBU Asynoptic FM-14PILOT 00, 06, 12, 18 FM -32
Parts A, B, C and DSections 1, 2, 3 and 4
PILOT SHIP ** 00, 06, 12, 18 FM- 33Parts A, B, C and DSections 1, 2, 3 and 4
TEMP 00, 12 FM -35Parts A, B, C and DSections 1, 2, 3, 4, 5 and 6
TEMP SHIP ** 00, 12 FM- 36Parts A, B, C and DSections 1, 2, 3, 4, 5 and 6
ROCOB VariableAsynoptic FM -39Sections 1, 2 and 3
CLIMAT Monthly FM -71Sections 1 and 2
CLIMAT SHIP ** Monthly FM -72Sections 1 and 2
CLIMAT TEMP Monthly FM -75CLIMAT TEMP SHIP ** Monthly FM -76
*According to specification in the Manual on Codes (WMO-No. 306) 1988 edition, Volume I.
** Ocean weather ships only.

Further, the following observational data should be involved according to the global exchange list in the Manual on the GTS (WMO-No. 386):
Type of observational data
Time of observations
Code form*
SATEMSATOB
Asynoptic FM -86 - Mean temperatures FM -88 - Cloud-motion winds
AIREP Asynoptic - Time and position- Wind- Temperature- Flight level
RADAR Asynoptic Reflectivity - manual or automatic for AP, ground clutter
For these data quality control includes:
(a) Checking
(i) Gross error check;(ii) Internal consistency check;(iii) Time consistencyTemporal check;(iv) Accuracy of copying data;(v) AccuracyCheck of encoding.
(b) Remedial action
(i) Before transmission: correct data and message;(ii) After transmission: correct data and prepare 'COR' message;
(c) Response to evidence from an outside source
Check NMC output and prepare 'COR' message as appropriate when inconsistencies occur in a reasonable time by observationing sites and NMC.
In the event that these procedures cannot be applied at certain observationing stations, they may be carried out at collectiong centres.
6.2.3 Implementation
Standardization of quality -control procedures to be implemented at observation sites within the framework of the WWW is still far from complete. The growing volume of international exchange of observationaling data calls for urgent measures to ensure that the meteorological information originating in different countries is of comparable quality. The practical steps to be taken for this purpose must aim at the maximum possible standardization.
In order to ensure that national obligations within the framework of the WWW system are fulfilled, regulatory material is required on tasks of meteorological stations and weather offices in the area of checking and correcting synoptic observational data. Both manual and automatic quality -control methods may be used. Standard software modules are being developed to support computer-based quality control at observationing sites or Ccollectiong

centres.
6.2.3.1 Manual methods
If manual quality- control methods are used, a Member should include the following procedures in its national instructions or regulations on real-time monitoring of surface and upper-air observations before transmitting them over the GTS:
(a) Surface synoptic observations
Quality control and monitoring of the observing programme is to be carried out at the NMC for all stations concerned, at least those included in the list of the rRegional bBasic sSynoptic nNetwork at main and intermediate standard times.
‘COR’ - and ‘RTD’ - messages are to be prepared and distributed according to the telecommunication plan:
For stations from which reports are to be exchanged globally, up to 12 hours after the time of observation;
For stations from which reports are to be exchanged regionally, at main and intermediate standard times, up to three hours after the time of observation.
(b) Upper-air observations
Upper-air observations from stations of the rRegional bBasic sSynoptic nNetwork are processed and encoded either at the station itself or centrally. Quality control and monitoring should be carried out starting at the station and the other centres responsible for communicating or processing the data.
Data checking is applied to the following areas:
Occurrences of hyper adiabatic vertical gradients of temperature in the free atmosphere;
Comparison of some values in selected points against temporal change since the last observingation time and against values obtained by interpolation from data of neighbouring stations;
Checking of the vertical wind profile against inhomogeneities.
Obviously erroneous TEMP data should be rejected from distribution either completely or partially, depending on the height where errors occur. In the case of minor errors detected after checking, these TEMP data are manually corrected. In any case, such corrected parts should be distributed nationally marked as "’COR"’ messages. Checked and controlled TEMP data are distributed internationally in accordance with the transmission schedule and are therefore only marked as "’RTD"’ messages if data cannot be corrected and distributed in time.
In the second phase, after the data have been scrutinized and controlled at the station in the first phase, quality control and correction (if possible) of all national meteorological data prior to their transmission over the GTS can be carried out manually at
several centres, e.g.:
At data-collectiong centres At steering centres At the NMC.
Monitoring the process of observations, timing, encoding and preparation for transmission is performed by the NMC in both real time and non-real time, the latter aiming at ensuring improved quality for later data. Checks and initiating appropriate actions are made for:
Missing or delayed messages Observational errors Incorrect formats.
6.2.3.2 Automat ed ic methods
The automation of the quality control of large quantities of meteorological data has become essential and is now made possible through computer systems and control programmes. By definition, control programmes should reveal any deviations from existing accuracy standards of meteorological observations. Such programmes reflect a compromise between the volume of the programme, the thoroughness of the control and the capabilities of the computer. In designing the programmes, it should be borne in mind that the effects of small deviations in measured values are considerably less than those of large deviations and that they have little effect on the results of practical application.
The main advantages of automatic control methods within the scope of their natural limits are as follows:
(a) Objectivity and repeatability;
(b) Uniformity;
(c) Possibility of using complex control parameters and practically unlimited specifications;
(d) Elimination of tedious checking of enormous amounts of correct data;
(e) Close supervision of the quality -control results on display units by experts so that any possible errors can be rapidly analysed.
The structure and state of software development for an automated system of data processing comprises the following basic functions in respect of meteorological data:
Collectiong Primary pre-processing Real-time control Non-real-time control Storage Retrieval.
The principles of organizing an automated quality control of meteorological data depend on the stage of development of methods of algorithms for quality control and

automatic data acquisition. The algorithms used by Members for quality control at the station are quite similar. In most cases they are based on physical and/or climatological interdependence and some statistical relations. There is, however, a requirement for further increasing the efficiency of the algorithms and programmes in use and it is recommended that Members exchange information on practical experience with the methods used which could be of great benefit for others.
NOTE: For non-real-time purposes the recovered data must be labelledflagged in order to be able to distinguish them from the measured data.
In order to improve methods and programmes on quality control, it is worthwhile taking into account the present conditions of the observing system (accuracyuncertainty of measurements, station network density, change of observing conditions), the targets or results of data processing (real -time, non-real -time), the technical resources available for data processing (access time of the central processor, capacity of the operational memory and disks).
6.3 STAGES OF QUALITY CONTROL (REAL TIME)
Since the GOS is concerned with Level I data and their reduction and conversion into Level II data, quality control can and should be performed at all stages until the data are transmitted over the GTS. All measurements of physical parameters, including standard meteorological observations, are of an approximate nature. For this reason, any observational value can be regarded as the sum total of two components:
(a) The true magnitude of the value
The precise magnitude of a true value always remains unknown. In practice, the most probable value of the element being measured is regarded as its true value. The relationship between the measurement errors of the meteorological variable and its most probable value expresses the relative error of the measurement. Meteorological phenomena encoded as dimensionless figures such as CL, CM, ww and W1, W2 are determined approximately in relation to standards, which in turn bear the mark of approximation.
(b) Measurement errors
Measurement errors in observations cannot be eliminated completely. The problem is to reduce them to an acceptable level. We may regard measurement error as the sum of the following components:
(i) The reading error, which includes the subjective errors made by the observer; and
(ii) The error of the observationing method, which depends on how far the value being measured approximates its most probable value in nature, provided that there is strict compliance with observationing procedures when the measurement is made.
For example, turbulence is not taken into account in standard observations. Yet it is known that averaged variations in meteorological elements due to turbulence at the levels measured sometimes exceed the magnitude of corrections and the accuracy of readings.
Modern measurements in meteorology require a scientifically sound definition of what

is called the objectively measured value of the meteorological variable, or its "physical" accuracy. On this point depends the economy of meteorological instrument-making and the development of physically sound programmes of meteorological observations, and therefore also the quality control.
Regardless of the method of measurement used, errors in respect of a given element may be systematic or random. The first type of error reflects a deviation of the same sign and almost the same value. Random errors generally have the effect of altering the sign and the value haphazardly.
Most meteorological instruments convert meteorological variables into readings on a visual indicator, calibrated in accordance with a specific scale of physical units of measurement. At worst, this may consist of a number of conversion stages and inherent in each stage is the danger that a specific error will be introduced. It is therefore desirable to have as few such stages as possible in the measuring process. Automated systems usually reduce the number of conversion stages involved, especially if the initial signal is put directly into a computer.
The danger of new errors appearing at each handling stage exists even before an observation is made, i.e.:
(a) When the instrument is being manufactured or transported;
(b) When the instrument is being set up at the observationing site;
(c) As the result of the prolonged operation of the instrument.
Whereas the control of deviations caused by (a) and (b) is more the duty of persons responsible for accepting meteorological instruments, the control of (c) is to be carried out by the observer. During the course of time, errors will result from wear and tear. This may occur before the end of its "guaranteed" lifetime.
6.3.1 Quality control during and after obtaining Level I data
During visual observations, errors will sometimes occur through inefficiency or inexperience on the part of the observer leading to a misrepresentation of phenomena such as cloud forms or the character of precipitation.
During the instrument reading, errors are due mainly to either the design of the instrument or to subjective factors and can be tabulated as follows:
(a) Crudeness of instrument settings;
(b) Poor definition of the indicating device;
(c) Inexperience or carelessness of the observer;
(d) Psychological bias of the observer.
During the recording of observations, errors are mainly of a subjective nature and are due to the personal characteristics of the observer. Of great importance in this connection is the ability to make rapid but unhurried legible entries.

6.3.2 Quality control during the reduction and conversion into Level II data
During initial processing, errors may occur during the conversion of the "raw" signal or instrument reading, such as in calculating data for standard heights and levels, dew points, etc. They may consist of errors in intermediate data, for example in the construction of working radiosonde curves, in calculations based on formulae, and in transferring data from tables and graphs. Errors made in the initial processing of "raw" data information (instrument readings or sensor signals) by the observer are of a subjective nature. Although the introduction of more advanced instruments and systems eases the task of the observer in the field, it is hardly possible to reproduce the complex activity of the human brain in carrying out apparently simple tasks.
Quality control to be established during conversion of Level I into Level II data depends on the conversion techniques used and, in some cases, on the computational procedures involved in these conversion techniques. Examples are:
(a) Quality control by repeating the data conversion at various stages, when the data conversion is performed manually;
(b) Quality control during data reduction, if appropriate (see Note 1 to paragraph 3.1.2, Part VI of the Manual on the GOS);
(c) Quality control by selection of computational procedures, if appropriate (see Notes 2 and 3 to paragraph 3.1.2, Part VI of the Manual on the GOS).
NOTE: For more details see Part V of the Guide.
6.3.3 Control after obtaining Level II data
Quality control at this stage is normally not necessary if all errors have been detected and corrected at the previous stages. Where errors remained unnoticed or quality control was not practised at the previous stages, it is advised that quality control be applied.
6.3.3.1 Quality checks
(a) The absolute check verifies that the observed value lies within the absolute limits of variability. The limits of the absolute intervals are given in the form of values having a physical dimension or code values, and the limits can be given in one of the following ways in the form of limits of the absolute variability:
(i) In nature of the meteorological variable or phenomena;(ii) In geographical area and time of year;(iii) At the observationing site at a given time of year.
(b) The relative check verifies the acceptability of data by relation to other elements. Comparisons are made with respect to time, space, elements with the same observation (internal consistency) and climaticological parameters. The relation to other meteorological elements (i.e. variables and phenomena) as a form of internal control is widely used in checking almost all types of meteorological observations. These tests represent a

method of checking the compatibility of various elements within an observation. A large number of control combinations are used.
(c) The physico-statistical check verifies the acceptability of data in satisfying the requirements of the established correlation of meteorological parameters. Depending on the nature of the correlation (functional or stochastic), a distinction is made between the following types of check:
(i) Conformity with general physical laws, usually expressed in relation to the variability of atmospheric characteristics;
(ii) Conformity with empirical relationships.
6.3.3.2 Methods of quality control
(a) Internal consistency
This is established by comparing various quantitative meteorological variables or by using qualitative information. Examples of internal consistency checks are:
Station pressure with mean sea-level pressure, if appropriate, or station pressure with tendency;
Temperature with dew-point depression;
Height of base of cloud with type of cloud;
Sea state with reported wind speed;
High relative humidity with such weather phenomena as rain, snow, sleet, fog, dense mist and drizzle;
Check of the upper air sounding to ensure that winds reported are less than, or equal to, the maximum wind for the sounding.
(b) Logical rules
These can be used to check the consistency of qualitative meteorological information. A typical example is present weather compared to type of cloud.
(c) Consistency in space
This may be accomplished by using one-dimensional, two-dimensional, three-dimensional checks or combinations. Examples are:
Hydrostatic checks;
Horizontal check of observations of adjacent stations using interpolation methods and dynamical constraints;
Complex horizontal and vertical checks (using both hydrostatic relation and statistical rules).

(d) Consistency in timeTemporal checks
This is established mainly by checks or a sequence of meteorological variables against tendencies or by comparison of the present value with that obtained previously. Examples are:
Check ofn pressure against pressure tendency;
Check ofn reported air temperature with maximum and minimum temperature for the day as appropriate;
Check on the reported position of a ship in relation to its previous position and its speed of movement.
In space-time quality- control procedures use is made of physical and dynamical constraints which exist between non-simultaneous observations taken at adjacent stations or locations. Examples of quality- control methods based on checking consistency in space and in time using statistical structure parameters within the interpolation scheme are given in the Appendix to Part VI of the Guide.
(e) Limits
Tests may be performed against physical, climatological and absolute limits. Examples are:
Tests of actual lapse rate against dry adiabatic lapse rate in the free atmosphere;
Tests against climatological parameters;
Tests against absolute limits (e.g. wind direction within the range 0-360°)
(f) Statistical rules
These are applied in several quality -control procedures, e.g.:
Tests against statistical limits;
Tests using statistical structure parameters within interpolation schemes.
(g) Empirical relationships
Some of the quality- control procedures make use of empirical relationships between the meteorological variables concerned, for example, checking the empirical relationship between consecutive levels of a complete wind profile.
6.4 OTHER QUALITY- CONTROL PROCEDURES
There are a number of minor innovations which can be introduced into an observing station which will help to ensure that the observer is carrying out his duties correctly. The following is not intended to be a comprehensive list, but to serve as a guide to the many

ways in which control can be expected, especially at single-observer stations.
6.4.1.1 Availability of statistics on variables
In practice, checking programmes are designed to reveal all gross errors, and substantive errors which recur regularly. The detection of rare and irrelevant measurement errors is not worthwhile, as the reliability of tests varies in inverse proportion to the size of errors they are designed to detect. In other words, the degree of accuracy of the check tests itself varies, i.e. there is always the risk of not noticing an error or of taking a correct value to be a doubtful one. Most tests have been compiled on the basis of experience; they are the result of practical intuition or statistical analysis.
The statistics on variables must be made available at the site of observation in order that the observer has a chance to compare the current observation with the statistics on what happened in the past at the station concerned. Such statistics may be essential in detecting equipment malfunctions. There will always be a need for a complete check of the overall results before dispatch of the message, even for a fully automated observing system.
6.4.1.2 Use of accepted abbreviations
In order to reduce subjective errors during the recording of visual observations and instrument readings, the human observer should make use of accepted abbreviations. They should be unified within a nNational Meteorological Service and laid down in national observing instructions.
6.4.3 Pictorial representations and diagrams
A plot of hourly values of the main variable can be used by the observer to detect gross errors. The particular variables subject to this type of error are pressure and temperature, but the plotting of other variables may also be useful in this respect. Care should be taken to keep a certain number of plots of the different variables on the sheet at anyone time and to use the same sheet on the following day. Simultaneous plots of not less than six entries are required to maintain an adequate history.
A chart showing the average diurnal change in temperature representative of a recent period of several years and relevant to the observingational data can also be useful to the observer as a guard against gross errors. In areas which do have large variations from such averages the succession of hourly readings as indicated in the previous paragraph can provide an additional check. If the observed value appears incompatible with the plot or charge then the observer should take a further independent reading. The existence of these averages can also stimulate additional interest in the observer who will then be able to recognize at the time those occasions which are not typical or which are likely to be notable.
In tropical areas a chart showing the average diurnal change of pressure will provide a useful guide, familiarizing the observer with the magnitude of the changes to be expected.
In making cloud reports the observer is confronted with a wide variety of cloud types and a complicated set of regulations. The inexperienced observer should use flow diagrams to enable the correction of a report. These diagrams are comparatively simple to construct and are available in the International Cloud Atlas (WMO-No. 407), Vol. I.
At all times observers should not only have access to publications dealing with

observing and coding procedures, but whenever possible the procedures should be displayed as visual reminders of the responsibilities of their work. Pictorial representations and diagrams are generally more effective, but when lists or tables are necessary they should be placed in a prominent position.
6.4.4 Simplified mathematical checks
Experience has shown that the greatest numbers of errors are detected at the pre-processing stage which precedes the analysis. Mathematical checks are made of upper-air and surface synoptic data received on an operational basis over communications channels by data-processing centres.
Control programmes may be divided into three main parts, namely:
(a) Identification;
(b) Decoding;
(c) Analytical checking.
Simplified mathematical checks are used during the comparison of observed values with their 'approximated values'. The comparison may be carried out both vertically over the observationing site and in a horizontal plane between data for the same level.
The following are used as 'approximated values':
(a) The values of the meteorological variables computed using the hydrostatic equation assuming polytropy of the atmosphere or linear variability within layers, etc. (hydrostatic control);
(b) The value and sign (for temperature) in adjacent layers, assuming a maximum gradient;
(c) Interpolated values which may vary depending on the way in which they were observed;
(d) Forecast values for the actual period;
(e) Approximated values (mainly polynomials of the second and third degree);
(f) Average value for groups of adjacent stations;
(g) Local statistical parameters of meteorological variables calculated on the basis of empirical relationships (regression equation).
Many quality control procedures make it possible not only to detect errors but also to correct them or to reconstruct omitted observations. However, the correction of observations raises a new problem area that is discussed under 6.5 below.
6.5 QUALITY CONTROL AND FEEDBACK
A manual, as opposed to automatic, quality- control procedure typically includes only the decision to either accept or reject a data element. For the increasingly sophisticated
World Weather Watch system the quality control of observational data also depends to a large extent on automation and feedback loops (see Part VII).
6.5.1 Stability of feedback system
A system such as the integrated GOS/GTS/GDPFS that has various feedback loops is stable in the sense of control theory only if certain conditions that guarantee its stability are satisfied. The major GDPFS centres are well aware of the potential risks of instability if it exists in any part or hierarchical level of the WWW system.
However, it is necessary for all operators of the various observing components of the GOS to recognize the importance of the continued stability of their own operations. There are two main principles to be taken into account:
(a) The observing system is controllable (feedback information is used only for problem detection but neither for instrument calibration nor for correction);
(b) All information that is reported is truly observable (the observingational instruments have been calibrated using verified standards).
New regulations have been and will be introduced in the Manual on the Global Observing System in order to ensure that the objectives of the WWW and other programmes are met in the future. The next sub-section deals with the current provisions made towards more secure controllability and observability of the GOS.
6.5.2 Utilization of general code concepts in support of data quality control
Appropriate code forms should be utilized to exchange together with the observational data:
(a) Information on instruments and observationaling procedures used;
(b) Information on data correction applied;
(c) Information on quality control.
With the advent of general code concepts, such as FM 94-IXI BUFR, constraints imposed by character codes for the exchange of observations and any associated information have been removed where centres have the possibility to process such code forms.
FM 94-IXI BUFR allows the dissemination of observations together with any relevant quality- control information. Together with basic information on the location of the station, the date and time, the type of instrument and observationaling procedures, such data can be disseminated regularly. This is particularly important for stations frequently changing the equipment or when new systems are brought into operation. Corrections to observations may be applied at the observing site or the collectiong centre. These corrections should be specified in the message. BUFR provides the means of exchanging corrections for elements without having the need to repeat complete reports.
The general code concepts may also be used to provide real-time feedback from data users to data producers.

REFERENCES
Manual on the Global Observing System (WMO-No. 544).
Manual on the GDPS (WMO-No. 485).
Manual on Codes (WMO-No. 306).
Guide to Meteorological Instruments and Methods of Observation (WMO-No. 8).
International Cloud Atlas, Vol. I (WMO-No. 407), Vol. I.
____________
P A R T VII
MONITORING OF THE GLOBAL OBSERVING SYSTEM
7.1 GENERAL
The WWW Plan provides for the monitoring of the operational performance of its various components in order to evaluate their efficiency, to identify deficiencies and to take corrective action with a view to maintaining the overall efficiency and effectiveness of the WWW on a global, regional and national level.
As the operations of the three elements of the WWW, namely the GOS, the GDPFS and the GTS, are so closely interrelated, each element cannot be monitored independently. For this reason, in order to monitor the WWW as an integrated system close co-ordination between all centres concerned and the WMO Secretariat is essential if deficiencies are to be identified and corrective action initiated quickly.
The “Plan for Monitoring the Operation of the WWW” is reproduced in the Manual on the GOS as Part VII as well as in the Manual on the GDPS (WMO-No. 485) and in the Manual on the GTS (WMO-No. 386). According to this Plan, the monitoring is performed on a real-time basis and on a non-real-time basis. Explanations of these terms, as well as the procedures for follow-up action are given in the Plan.
7.2 IMPLEMENTATION OF THE MONITORING OF THE GOS
7.2.1 Monitoring of the availability of observational data
The periodic status report on the implementation of the WWW, issued by the WMO Secretariat at two-year intervals, includes statistics concerning the availability of observational reports of various kinds. The information is based on monitoring on a non-real-time basis, carried out over a specified 15-day period preceding the preparation of the report. Such limited monitoring is, however, carried out every year although the status report is published in alternate years.
The Plan mentioned above states that, in the context of monitoring, the GOS is responsible for ensuring that the observations are made according to the prescribed standards, are encoded correctly and are presented for transmission at the stipulated times. Monitoring of the GOS is thus essentially a question of quality control of the observations. The basic rules of quality control within the framework of the GOS are contained in the Manual on the GOS (WMO-No. 544) , Volume I, Part VI. Detailed instructions about the quality- control procedures which Members are invited to follow are given in Part VI of the present publication.
7.2.2 Monitoring of observational data quality
7.2.2.1 Lead centres for data - quality monitoring
Quality- control procedures operated by major GDPFS centres through their data- assimilation systems produce valuable information, which, if fed back to the data providers, gives a sound basis for critical on- site evaluation of the observing system.
Three lead centres have so far been appointed to perform real-time monitoring tasks on a global basis and to provide consolidated results over periods of several months. These centres are:
RSMC Bracknell - Marine surface dataRSMC ECMWF - Upper-air dataWMC Washington - Satellite and aircraft data
Lead centres to carry out the monitoring of land- surface data quality are to be nominated in each WMO Region. By the end of 1993 such centres had been designated: RSMC Tokyo (Region II), WMC Melbourne (Region V), RSMC Offenbach (Region VI), RSMC Montreal (Region IV), and (RSMC Buenos Aires (RA III).
7.2.2.2 Role of the appointed lead centres
7.2.2.2.1 Real-time feedback
The feedback of data- monitoring results to the data producers is of prime importance, not only in delayed mode but also in near-real time. This was established through a pilot study undertaken by RSMC ECMWF exchanging near-real-time information on the performance of upper-air stations with focal points directly responsible for the operation of such stations. The lead centres, in co-operation with other GDPFS centres, are encouraged to widen their contacts with data providers. Errors identified in one or more data items through real-time quality- control procedures can be immediately communicated back to the data producers for correction.
7.2.2.2.2 Exchange of consolidated results
The consolidated lists of suspect stations and data platforms compiled by the lead centres contain those stations for which it has been established with confidence that they produce observations of consistently low quality. Where possible, the problem is defined through clear evidence. Recognizing the fact that deteriorations in observation quality of observational data can be detected on time scales much shorter than six months, which is the current interval for producing consolidated monitoring information, each lead centre determines the appropriate response time for communicating suspect stations, observing platforms or systems to the appropriate focal points, the WMO Secretariat and other GDPFS centres.
The reports attached to the consolidated lists sent to WMO should be short. They may have a technical attachment, and it should also be made clear that detailed information can be provided by the lead centre on request.
7.2.2.3 Procedures and formats for the exchange of monitoring results
7.2.2.3.1 General remarks
Centres participating in the exchange of monitoring results will implement standard procedures and use agreed formats for communicating the information to both other centres and the data providers. The following list is incomplete and requires further development in the light of practical experience. Guidance will be given through the initiative of the lead centres in their corresponding fields of responsibility.
In view of the fact that the monthly lists of suspect stations could be misinterpreted if the methods of compilation are not completely understood, they should be circulated only to those centres which indicate that they would like to participate in the monitoring programme. In addition, they should contain a clear explanation of the criteria used and the limitations of the system.
7.2.2.3.2 Upper-air observations
Monthly exchange of monitoring results for upper-air observations should include lists of
stations/ships with the following information:
List 1: GEOPOTENTIAL HEIGHT
Month/yearMonitoring centreStandard of comparison (first-guess/background field)
Selection criteria:
For 0000 and 1200 UTC separately, at least three levels with ten observations during the month and 100 m weighted rms departure from the field used for comparison between 1000 hPa and 50 hPa.
The gross error limits to be used for observed minus reference field are as follows:
Level (hPa) Geopotential height (m)1000 100
925 100850 100700 100500 150400 175300 200250 225200 250150 275100 300
70 37550 400
Weights to be used at each level are as follows:
Level (hPa) Weight1000 3.70
950 3.55700 3.40500 2.90400 2.20300 1.60250 1.50200 1.37150 1.19100 1.00
70 0.8750 0.80
Data to be listed for each selected station/ship should include:
WMO identifier;Observation time;Latitude/longitude (for land stations);Pressure of the level with largest weighted rms departure;Number of observations received (including gross errors); Number of gross errors;Percentage of observations rejected by the data assimilation; Mean departure from reference field;Rms departure from reference field (unweighted).
Gross errors should be excluded from the calculation of the mean and rms departures; they should not be taken into account in the percentage of rejected data (in either the numerator or the denominator).
List 2: WIND
Month/yearMonitoring centreStandard of comparison (first-guess/background field)
Selection criteria:
For 0000 and 1200 UTC separately, at least one level with ten observations during the month and 15 m.s-1 rms vector departure from the field use for comparison, between 1000 hPa and 100 hPa.
The gross error limits to be used are as follows:
Level (hPa) Wind (m.s -1 ) 1000 35
925 35850 35700 40500 45400 50300 60250 60200 50150 50100 45
Data to be listed for each selected station/ship should include:
WMO identifier;Observation time;Latitude/longitude (for land stations);Pressure of the level with largest rms departure;Number of observations received (including gross errors);Number of gross errors;Percentage of observations rejected by the data assimilation;Mean departure from reference field for u-component;Mean departure from reference field for v-component;Rms vector departure from reference field.
Gross errors should be handled in the same way as for List 1.
List 3: WIND DIRECTION
Month/yearMonitoring centreStandard of comparison (first-guess/background field)
Selection criteria:
For 0000 and 1200 UTC separately, at least five observations at each standard level from 500 to 150 hPa, and, for the average over that layer, mean departure from reference field

at least +/-10 degrees, standard deviation less than 30 degrees, maximum vertical spread less than 10 degrees.
Same limits for gross errors as above; data for which the wind speed is less than 5 m.s-1, either observed or calculated, should also be excluded from the statistics.
Data to be listed for each selected station/ship should include:
WMO identifier;Observation time;Latitude/longitude (for land stations);Minimum number of observations at each level from 500 to 150 hPa (excluding gross errors and data with low wind speed);Mean departure from reference field or wind direction, averaged over the layer;Maximum spread of the mean departure at each level around the average:Standard deviation of the departure from reference field, averaged over the layer.
7.2.2.3.3 Marine surface observations
(a) Monthly exchange of monitoring results for marine surface observations should include lists of observing platforms arranged as follows:
(b)
Each list should contain the following information:
(i) Month/year;Monitoring centre;Standard of comparison (first guess/background field);
(ii) The following data for each selected platform:
WMO identifier;Average latitude/longitude over the month (for Lists 4-6 only);Number of observations received (including gross errors);Number of observations containing gross errors;Percentage of observations containing gross errors;Standard deviation of the departures from the reference field;Mean departure from the reference field;RMS departure from the reference field;
(Gross errors should be excluded from the calculation of the mean, standard deviation and RMS departures. For Lists 3 and 5, data for which the wind speed is less than 3 m.s-1, either observed or calculated, should also be excluded from all the statistics);
(c) The selection criteria for observing platforms in each of the lists are as follows:
LIST 1: MEAN SEA LEVEL PRESSURE FROM SHIPS, MOORED BUOYS AND OTHER FIXED MARINE PLATFORMS
Selection criteria:
List 1: Mean sea-level pressure List 2: Wind speed List 3: Wind direction
} from ship, moored buoys other fixed marine platforms
List 4: Mean sea-level pressureList 5: Wind speed List 6: Wind direction
} from drifting buoys

For 0000, 0600, 1200 and 1800 UTC combined, at least 20 observations during the month and at least one of the following:
The absolute value of the mean difference from the reference field is at least 4 hPa;
The standard deviation of the differences front the reference field is at least 6 hPa;
At least 25 per cent of observations have gross errors.
(The gross error limit to be used for observed minus reference field is 15hPa).
LIST 2: WIND SPEED FROM SHIPS, MOORED BUOYS AND OTHER FIXED PLATFORMS
Selection criteria:
For 0000, 0600, 1200 and 1800UTC combined, at least 20 observations during the month and at least one of the following:
The absolute value of the mean difference from the reference field is at least 5 m.s-1;
At least 25 per cent of observations have gross errors.
(The gross error limit to be used for observed minus reference field (vector wind difference) is 25 m.s-1).
LIST 3: WIND DIRECTION FROM SHIPS, MOORED BUOYS AND OTHER FIXED PLATFORMSSelection criteria:
For 0000, 0600, 1200 and 1800 UTC combined, at least 20 observations during the month and at least one of the following:
The absolute value of the mean difference from the reference field is at least 30 degrees;
The standard deviation of the differences from the reference field is at least 80 degrees.
(The gross error limit to be used for observed minus reference field (vector wind difference) is 25 m.s-1).
LIST 4: MEAN SEA-LEVEL PRESSURE FROM DRIFTING BUOYS
Selection criteria:
For all data times combined, at least 20 observations during the month and at least one of the following:
The absolute value of the mean difference from the reference field is at least 4 hPa;

The standard deviation of the differences from the reference field is at least 6 hPa;
At least 25 per cent of observations have gross errors.
(The gross error limit to be used for observed minus reference field is 15 hPa).
LIST 5: WIND SPEED FROM DRIFTING BUOYS
Selection criteria:
For all data times combined, at least 20 observations during the month and at least one of the following:
The absolute value of the mean difference from the reference field is at least 5 m.s-1;
At least 25 per cent of observations have gross errors.
(The gross error limit to be used for observed minus reference field (vector wind difference) is 25 m.s-1).
LIST 6 : WIND DIRECTION FROM DRIFTING BUOYS
Selection criteria:
For all data times combined, at least 20 observations during the month and at least one of the following:
The absolute value of the mean difference from the reference field is at least. 30 degrees;
The standard deviation of the differences from the reference field is at least 80 degrees.
(The gross error limit to be used for observed minus reference field (vector wind difference) is 25 m.s-1.
7.2.2.3.4 Land surface observations
(To be completed with information from lead centres)
REFERENCES
Manual on the Global Data-processing System (WMO-No. 485).
Manual on the Global Observing System (WMO-No. 544).
Manual on the Global Telecommunication System (WMO-No. 386).
____________