incorporating computer control into student project work
TRANSCRIPT

Incorporating Computer
Control into Student
Project Work using a PIC
Microcontroller

1
Incorporating Computer Control into StudentProject Work using a PIC Microcontroller
Published by:
The National Centre for Technology in EducationAndT4 – Technology Subjects Support Service
National Centre for Technology in EducationDublin City UniversityGlasnevinDublin 9Tel: +353 1 700 8200Email: [email protected]: www.ncte.ie / www.scoilnet.ie
T4 – Technology Subjects Support ServiceGalway Education CentreCluain MhuireWellparkGalwayTel: +353 91 745 650Email: [email protected]: www.t4.ie
Copyright © National Centre for Technology in Education 2010.
Permission granted to reproduce for educational use providing the source is acknowledged.Copying for any other purposes prohibited without the prior written permission of thepublisher.
Please note
Screenshots used in this manual may appear different to those on computer screensused by participants; variations in versions of the software and differing operatingsystems may be in use.
GENIE Design Studio is the electronic simulation software on which this module is based.This does not imply any endorsement by the NCTE of a product or company. The readershould be aware that typically there are many products and companies providing similarservices in areas related to ICT. Participants should be as informed as possible beforemaking decisions on purchases of ICT products or services.

2
Incorporating Computer Control into StudentProject Work using a PIC Microcontroller
Duration
12 hours
Aim
The aim of the Incorporating Computer Control into Student Project Work using aPIC Microcontroller course is to support the integration of ICT into the learning andteaching of basic electronic principles and the application of these principles in the designand production of circuits suitable for student project work.
The course involves hands-on practical work for teachers and focuses on using GENIEDesign Studio to enhance the teaching and learning of Electronics across the technologysubjects.
Objectives
Participants will be able to:
Understand how the evolution of electronic engineering has affected control
technology since the 1940s.
Appreciate the need to improve student project work through the use of control
technology.
Build a generic PIC project board suitable for use in student projects.
Program the PIC board, using the free GENIE Design Studio software, to control a
range of inputs and outputs relevant to a range of student projects.
Carry out basic troubleshooting and fault finding where necessary.
The course material CD contains folders that are designed to be dealt with in order.
Prior to commencing the course, it is assumed that participants have basic skills in ICT andElectronics.
3
Table of Contents
1 GENIE Design Studio Interface ........................................................................ 4
2 Connecting the PIC Board to the PC................................................................. 5
3 Testing the PIC board...................................................................................... 5
4 Controlling Single Outputs............................................................................. 10
5 Controlling Multiple Outputs.......................................................................... 12
6 Simulating a Program.................................................................................... 13
7 Creating a Loop & Debugging Live ................................................................. 14
8 Playing Sounds .............................................................................................. 15
9 Playing Tunes ................................................................................................ 15
10 Responding to Digital Signals ...................................................................... 17
11Responding to Analogue Signals................................................................... 20
12 Using Subroutines ....................................................................................... 22
13 Compare ...................................................................................................... 23
14 Increment and Expression Commands......................................................... 24
15 Parallel Processing ...................................................................................... 27
16 GENIE Design Studio Help ........................................................................... 28
17 Further Exercises......................................................................................... 29
18 Useful Links ................................................................................................. 30

GENIE Design Studio Training
To open GENIE Design Studio: Click the GENIE Design Studio icon on thedesktop or use the start menu.
1 GENIE Design Studio Interface:
Menu Bar
4
ProgrammingCommands
Work Area
Tool Bar

2 Connecting the PIC Board to the PC
Connect your PIC board to a suitable power supply – either via the 9v PSU or using 4 or 6 x1.5v batteries. It is not recommended to use a 9v PP9 battery due to their tendency to rundown quickly and inability to sustain a steady voltage.
Now connect the GENIE USB Plug & Play Cable. The following should appear:
NOTE: You must install the driver for ththe Software folder on your CD or in the
3 Testing the PIC Board
Before commencing programming, test
Firstly tell the software what PIC chip yofollowed by Program Settings. Select
NOTE: Please consult the file Setting G4. GENIE Design Studio Training fordefault chip selection. Otherwise, it willstarted.
5
is cable beforehand. Instructions are available inHelp and Support Guides in the main Help menu.
that the outputs are all working properly.
u are using. Select Program from the menu barthe GENIE E18 chip.
ENIE E18 chip as default.avi located in the folderinstructions on how to set the E18 chip as thehave to be selected each time a new program is
Select OK

6
The Program Settings window provides information about the inputs and outputsavailable on the selected chip:
The following conventions are followed for identification purposes:
Outputs are denoted by the letter ‘Q’ Analogue inputs e.g. LDR or thermistor are denoted by the letter ‘A’ Digital inputs e.g. switches are denoted by the letter ‘D’
Number of inputs and outputs available Chip configuration

7
For the purposes of this course we will connect the following inputs and outputs to the PICboard:
INPUTS CONNECTED DEVICE
D0/A0 NTC Thermistor 20K
D1/A1 NORPS12 LDR
D2/A2 NONE
D6 Micro switch
D7 Push Switch PTM
OUTPUTS CONNECTED DEVICE
Q0 Speaker/Sounder
Q1 Motor
Q2 Red LED
Q3 Yellow LED
Q4 Green LED
Q5 Red LED
Q6 Yellow LED
Q7 Green LED
The specified devices should be connected to the PIC board as shown during manufacture:
NOTE:a) Outputs Q2 to Q7 are connected to a 330Ω resistor in order to reduce the voltage to
approx 2.2V, suitable for use with most common LEDs.
b) On the student project board at the position for outputs Q0 and Q1 there areterminal blocks so that outputs such as bulbs and motors can be attached. Theseoutputs require a larger current than is available directly from the PIC. To overcomethis, a transistor is used with its base attached to the PIC. The small current fromthe PIC is used to switch on the transistor allowing a large current to enter thecollector. This makes it possible to use outputs like bulbs, motors and relays etc.

8
c) Some DC motors can cause the PIC to malfunction due to the generation ofelectromagnetic interference (sometimes called ‘noise’) by the motor commutators.To counteract this, fit a 220nF suppression capacitor directly across the motorconnections or use a solar type motor.
There are 2 simple methods of testing that outputs are working properly beforeprogramming:
1. Open the Microcontroller menu from the tool bar and select Control Device. Inthe Controlling menu, click on each output from Q7 to Q0 in turn changing it froma 0 to a 1. Each connected output on the PIC board should activate in turn.
NOTE:The following conventions are used foroutputs:
0 Make output low (off). 1 Make output high (on). T Toggle this output (where high is set to low and low is set to high). X Leave output alone.
Using the Control Device command is very useful as it helps to check if PCB tracksand soldered joints are secure and working properly.
2. Download a simple program to activate all the outputs such as the one shown below.This program activates all the outputs for 5 seconds. Writing programs will be dealtwith in the next section.
To turn on outputQ7 click to changeform 0 to 1

9
We can also check that our analogue sensors are operating:
In the Microcontroller menu, select Calibrate Sensor. Ensure that the thermistor isconnected in A0/D0 input and the LDR is connected in A1/D1 input.
NOTE:
1. For the purposes of this training, we are not using input A2/D2.
2. It is not necessary to always connect the LDR into A1/D1. It could be connected into
either of the other two combined analogue/digital inputs i.e. A0/D0 or A2/D2. This
applies to all analogue inputs.
3. This method of calibrating analogue sensors is very useful because the
readings shown here by the software can be used to determine suitable
values for use in your programs later.
This shows thecurrent readingfrom thethermistor (A0)when convertedto a value from 1to 255. As youheat thethermistor thereading shouldchange.
This shows thecurrent readingfrom the LDR (A1)when converted toa value from 1 to255. As youun/cover the LDRthe reading shouldchange.

10
4 Controlling Single Outputs
Construct the following flowchart by left clicking and dragging the programming commandsfrom the Gallery. Commands will automatically link together when you drop them in place.
Click on the High command to open the High Properties window. Select Q4 and then OK.
This will turn on (referred to as high) output Q4.
Click on the Low command to open the Low Properties window. Select Q4 and then OK.
This will turn off (referred to as low) output Q4.
In order to download the program to the GENIE chip select Run Live from Microcontroller
on the tool bar as shown below:
NOTE: Ensure you have selected the correct GENIE E18 chip as shown in section 1.3
The Run Live commandallows you to download andrun your program at full speedjust as if the PCB were notconnected to the computer atall. While in this mode you willnot be able to animate normonitor the state of inputs,outputs and variables etc.

11
The software will now show that the program is running on the board as follows:
QUESTION:
Why does nothing appear to be happening?
ANSWER:
We instructed the software to turn on output Q4and then turn it off again.
All this happened so quickly that we did not havetime to see it!
This problem can be rectified by adding a wait after setting the output as shown below:
Open the High Properties window again, tick thebox to add wait after setting output and then select4 seconds. Click OK.
NOTE: Many commands such as High and Lowallow you to automatically include a Wait. It canalso be included as a separate command as shownin the next section.
The 4s delay is indicated beside the output.
Now download the edited program using the Run Livecommand.
QUESTION:
What happens?
ANSWER:
The LED connected to Q4 comes on for 4 seconds.

12
5 Controlling Multiple Outputs
Set up the commands shown below as a new program:
The Outputs command lets us control all of the 8 possible outputs simultaneously:
Turn on the 6 LEDS Q2 to Q7 by activating the command and editing the Outputs Propertieswindow as shown below:
This is a separate Wait command. it can be used anywhere in aflowchart in order to delay it or to set a time to keep the outputson for as shown:
Set the Outputs command again to turn off the LEDs Q2 to Q7as shown:
NOTE: Captions are very useful as a clear indicator of what is happening and studentsshould be encouraged to use them.
Now download the program using the Run Live command. The 6 LEDs in outputs Q2 to Q7will activate for 3 seconds.
NOTE: Pressing the on board reset switch will re-run the latest downloaded program.
We will now look at how programs can be simulated before downloading.

13
6 Simulating a Program
Using the same program, select the Run command on the tool bar.
The Simulating window shown will open:
This panel displays what is happening to each of theinputs and outputs as the program is put through asimulation.
As the simulation progresses, each command in theflowchart highlights as it is processed.
The speed at which the simulation runs at can beadjusted by rotating the Speed Dial.
By selecting Panels on the tool bar, a menu appears offering various panels that can beopened in order to monitor the operation of a program either during simulation or in debuglive mode which we will look at later:
A separate Digital Panel similar to that shownalready is available. It should display the followingduring operation:
The Device Panel will display what is happening onthe actual GENIE chip during operation of theprogram:

14
7 Creating a Loop & Debugging Live
Create the new program shown below by removing the stop and adding a loop back to thestart:
Select Debug Live from the Microcontroller menu. An information panel will appeargiving details of the program that is about to be debugged. Read the information and clickon the Start button when you are ready to begin.
Once started the software will enter Debugging Livemode allowing you to see your program animate. It willbe coloured red to indicate it is animating in live mode.
The Speed Dial can stillbe used to control how
fast it animates.
Debugging Live is very useful for watching differentaspects of programs in terms of inputs and outputs asthey operate, in order to identify a problem or improveperformance. The option to monitor several differentpanels at once is very useful.
NOTE: Debugging Live can be paused allowing you stop the program and check your PCB.
Question: Why will this program not operate as expected if we download using Run Live?

15
8 Playing Sounds
Create the following program using the settings shown. The Sound command is located inthe Input and Output folder in the main Gallery:
We must select the output that has a suitable speaker connected in order to play the middleC note for 3 seconds – in this case Q0.
Download and test the program using either Debug Live or Run Live. Disconnect the USBand test the program using the reset switch on the PCB.
9 Playing Tunes
Create the following program using the settings shown. The Tune command is located inthe Input and Output folder in the main Gallery:
Monophonic tunesplay one note at atime. Polyphonictunes play two notes ata time. They soundbetter but require asecond (hidden)flowchart and take upmore memory space.You can choose in-builttunes or Importsuitable music files.The Play button allowsyou listen to a previewof the tune.
EXERCISE 1Create a program to play a simple tune repeatedly, for example:
Batman theme Twilight Zone theme
Test the program on the PCB and save as Ex1.

16
There are a number of features available for playing tunes:
Choosing Play tune in the background means that the flowchart does not wait forthe tune to stop playing before moving on to the next command.
A background tune will play once before stopping unless the Repeat playing untilstopped option is enabled.
You can stop a tune playing in the background anytime by using the Stop Tunecommand located in the Input and Output folder.
Signals determines which of the outputs is connected to your speaker component –Q0 in this case. Polyphonic music requires a separate output for each musicalchannel.
You can also select LED outputs to flash in time with the music:
NOTE: Start has been replaced by ‘Birthday’ by editing the Start Properties window. Thisshould always be done as a reminder of what a flowchart does as shown:
EXERCISE 2A student has been trying to create a program that will:
Play ‘Happy Birthday’ repeatedly. Flash all the LEDs on/off while the tune is playing.
He has created the following program, but it is still not doing exactly what he wants:
1. Create the flowchart show and observe what it does using Debug Live.
2. Edit the flowchart so that it does what he wants it to do. Save as Ex2.

17
10 Responding to Digital Signals
Some types of signal, such as push switches or micro switches, can only be either on or off.These are known as digital signals.
We will be using the Digital command, found in the Flow Control folderto respond to digital signals.
The Digital command allows the program to make a decision based on whether the digitalsignal is on (high) or off (low). When a digital signal is on, it has the value ‘1’ whereaswhen it is off, it has the value ‘0’.
Set up the following flowchart used to control the motor on output Q1 using the push switchon input D7:
If we select Run to simulate the program we will initially observe the program following the‘N’ path through Low Q1. There are two options that allow us simulate switch D7 beingpressed:
1. Click the Digital commandto open the window shown.Left click and hold down onD7 to simulate the switchbeing pressed. Theprogram will now follow the‘Y’ path through High Q1turning on the motor.When D7 is released theprogram will revert to the‘N’ path and the motor Q1will be off.
Double click on the command toselect which digital inputs youwant to check. GENIE will followthe ‘Y’ (yes) path when thedigital signal matches thechosen pattern; otherwise it willfollow the ‘N’ (no) path.

18
2. Select the View the digital inputs andoutputs option in the Simulating window.As before, left click and hold down on D7 tosimulate the switch being pressed.
NOTE: The Memory Bar shows how much spacehas been used on the microcontroller. Hold themouse over the bar for more details as shown.
Now consider the case of a stamping machine used for making aluminium ID tags. Themachine is activated by pressing a push switch causing the motor to run for 3 seconds.However, for safety reasons the push switch will only activate the motor if a protectivescreen is pulled down far enough that it activates a NO (normally open) micro switch.
EXERCISE 3
GENIE offers multiple options forobservation of the inputs and outputs.Using Debug Live mode can youdemonstrate how to monitor what ishappening on the actual microcontrollerdevice while input D7 is pressed?
GENIE will follow the ‘Y’ path when both D7 andD6 are on.
This flowchart uses the Outputs commandrather than the High and Low commands usedin the previous example. This will allow us toedit the program as outlined in EXERCISE 4.
NOTE: This program operates as a digital ‘AND’gate.

19
Edit the previous flowchart in order to create the program shown below:
NOTE: You can reverse the flowof control in a Digital command byclicking the right mouse buttonover the command and choosingSwap YES and NO as shownabove.
EXERCISE 4
What type of digital gate does this program simulate?
Design a flowchart to simulate two switches connected to a digital ‘NAND’ gate.
Save as Ex4.
20
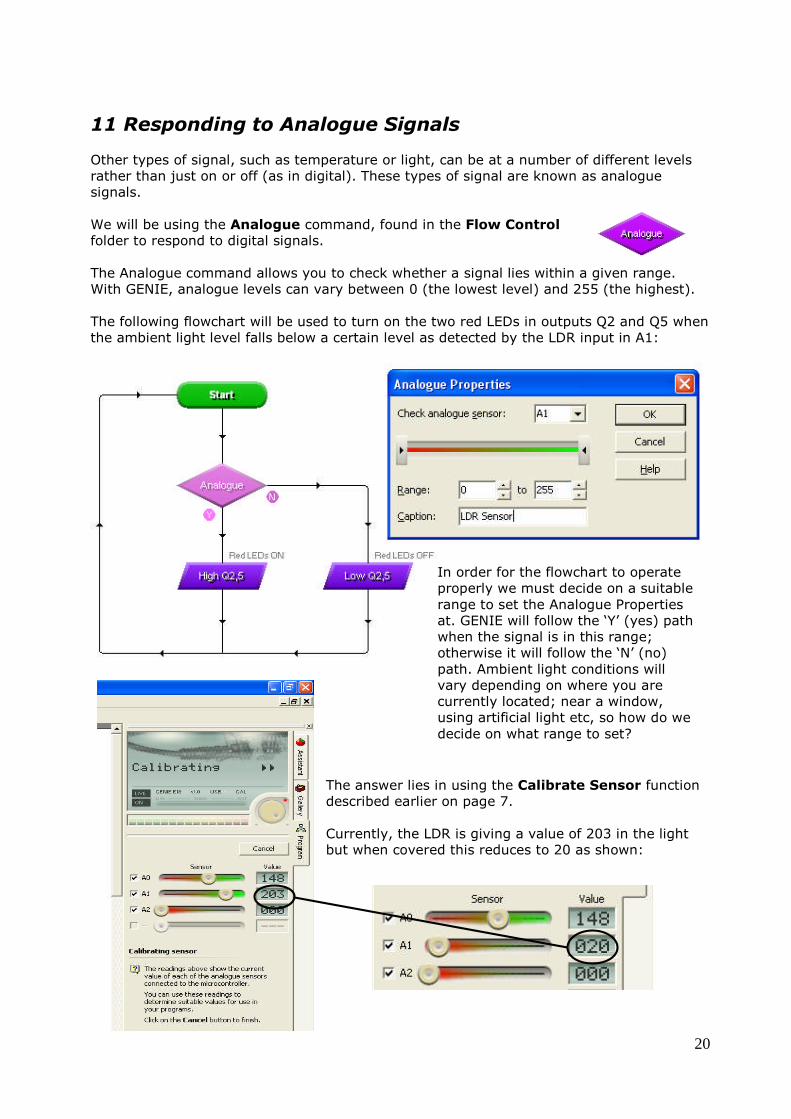
11 Responding to Analogue Signals
Other types of signal, such as temperature or light, can be at a number of different levelsrather than just on or off (as in digital). These types of signal are known as analoguesignals.
We will be using the Analogue command, found in the Flow Controlfolder to respond to digital signals.
The Analogue command allows you to check whether a signal lies within a given range.With GENIE, analogue levels can vary between 0 (the lowest level) and 255 (the highest).
The following flowchart will be used to turn on the two red LEDs in outputs Q2 and Q5 whenthe ambient light level falls below a certain level as detected by the LDR input in A1:
The answer lies in using the Calibrate Sensor functiondescribed earlier on page 7.
Currently, the LDR is giving a value of 203 in the lightbut when covered this reduces to 20 as shown:
In order for the flowchart to operateproperly we must decide on a suitablerange to set the Analogue Propertiesat. GENIE will follow the ‘Y’ (yes) pathwhen the signal is in this range;otherwise it will follow the ‘N’ (no)path. Ambient light conditions willvary depending on where you arecurrently located; near a window,using artificial light etc, so how do wedecide on what range to set?

21
This means that if the Analogue Properties are set from 0 to 150 GENIE will follow the ‘Y’path (turning on Q2 and Q5) when A1 reads anything less than 150 (relatively dark), andfollow the ‘N’ path (turning off Q2 and Q5) when A1 reads anything above 150 (bright):
Complete this flowchart and test using Debug Live with the View several monitorpanels at once option selected. Observe the value of A1 change as you cover it and howQ2 and Q5 activate once it falls below 150 and deactivate when A1 rises above 150.
NOTE: When the Caption is leftblank GENIE will show the inputand range instead.
EXERCISE 5
What are the advantages of being able to calibrate sensors in this way?
Design a flowchart that will turn on a motor (Q1) when the temperature rises to a setlevel.
Use Calibrate Sensor to identify a suitable value range for the thermistor input A0.
Save as Ex5.
22
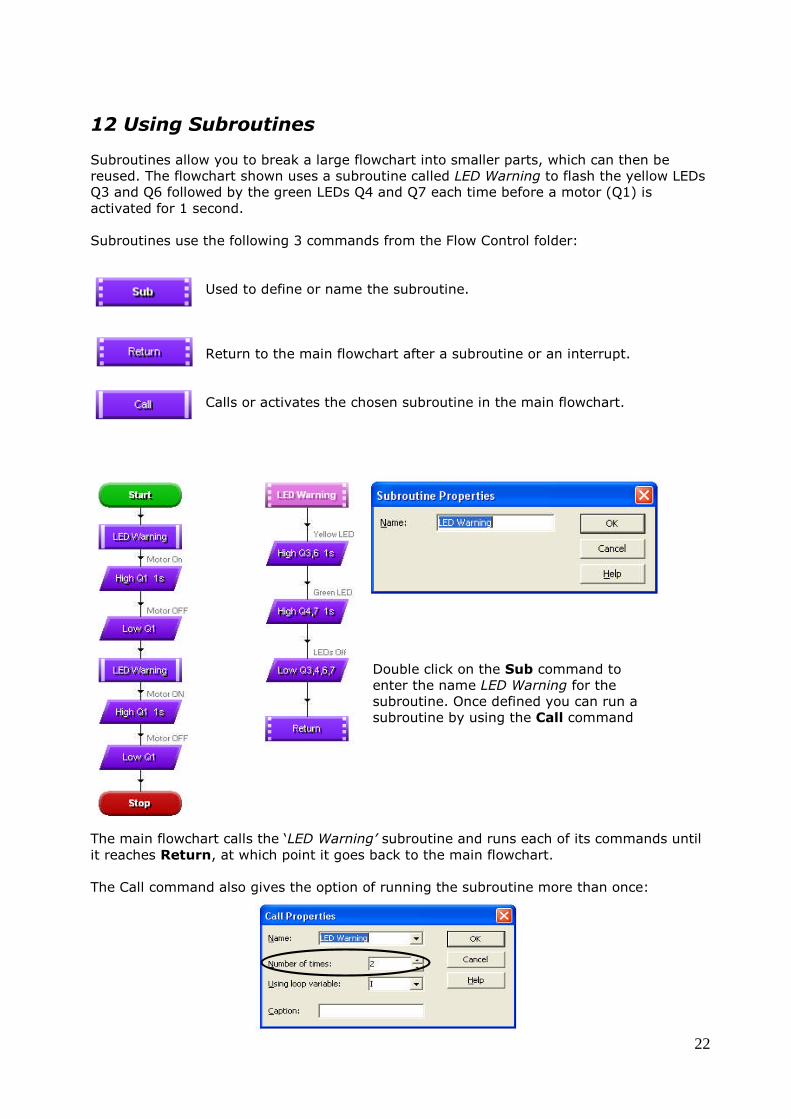
12 Using Subroutines
Subroutines allow you to break a large flowchart into smaller parts, which can then bereused. The flowchart shown uses a subroutine called LED Warning to flash the yellow LEDsQ3 and Q6 followed by the green LEDs Q4 and Q7 each time before a motor (Q1) isactivated for 1 second.
Subroutines use the following 3 commands from the Flow Control folder:
Used to define or name the subroutine.
Return to the main flowchart after a subroutine or an interrupt.
Calls or activates the chosen subroutine in the main flowchart.
The main flowchart calls the ‘LED Warning’ subroutine and runs each of its commands untilit reaches Return, at which point it goes back to the main flowchart.
The Call command also gives the option of running the subroutine more than once:
Double click on the Sub command toenter the name LED Warning for thesubroutine. Once defined you can run asubroutine by using the Call command

23
13 Compare
The Compare command is found in the Flow Control folder. It performs a mathematicalcomparison between one or more variables or values. There are 10 variables named A to J.Each variable can hold a single whole number between 0 and 255.The flowchart will followthe ‘Y’ (yes) path if the comparison is true otherwise the ‘N’ (no) path will be followed.
Create the flowchart below designed to simulate the tossing of a coin with LED Q2 lightingto simulate a ‘Head’ and LEDs Q2 & Q3 lighting to simulate a ‘Tail’. The simulation is onlyactivated when the push switch on input D7 is pressed:
The Compare command allows you to specify which variables or values are to be compared:
In this case, if the value stored in A is a 0 thenthe flowchart will follow the ‘Y’ path and lightLED Q2 indicating a ‘Head’.If the value stored in A is a 1 then theflowchart will follow the ‘N’ path and light LEDsQ2 and Q3 indicating a ‘Tail’.
Selecting either the and or or options will allow you to perform a second comparison at thesame time. With the and option checked the ‘Y’ path will only be followed when bothexpressions are true, while selecting the or option will mean that the ‘Y’ path will befollowed when either, or both expressions are true.
The Random command usedhere is found in the Processingfolder. It has been edited togenerate a random 0 or 1 whichis then stored as variable A.
0 will represent a ‘Head’.
1 will represent a ‘Tail’.
EXERCISE 6
Create a flow chart to simulate the rolling of a die with one LED lightingto indicate a 1, two LEDs lighting to indicate a 2 and so on.
Pressing the push switch D7 causes a new roll each time.
Save as Ex6.

24
14 Increment and Expression Commands
The Increment command increases the value a variable by 1. It is located inthe Processing folder.
Double clicking on the Inc commandallows you to specify which variable is tobe incremented.
There are 10 variables named A to J andeach can hold a single number between 0and 255.
The Expression command performs a mathematical operation and stores theresult in a given variable.
Double clicking on the Expr commandallows you to decide how the value of avariable is to be changed.
Select the variable (A to J) to be changedfrom the left hand box and the value to beset in the second box as shown in theexample.
For more complex operations you can also use the third and fourth boxes as shown below:

25
Create the following flowchart, designed to simulate the control of a machine designed topack every 5 items passing on a conveyor belt into a box.
Using Debug Live, download and animate the program on your project board.
The variable A is resetto 0 at the start inorder to count anothergroup of 5 items
Two yellow LEDs (Q3 & Q6) indicate that the machine ispowered and in the process of counting.
Counting of the items is achieved by placing a microswitch (D6) so that each passing item activates it.
Each time the micro switch (D6) is pressed, variable ‘A’is increased by 1 using the Increment command.
When the micro switchhas been activated 5times, the 2 yellowLEDs are turned offand the motor isturned on for 1 sec.
The motor is turned off and 2 green LEDs (Q4 & Q7) areactivated for 2 seconds to indicate that a box has beenpacked.
The flowchart now returns to the start, variable ‘A’ isreset to 0 and another 5 items can be counted andpacked.
Use the Multiple panel view to observethe inputs, outputs and variable ‘A’ increaseby 1 each time switch D6 is pressed.
A=003 indicates that micro switch D6 hasbeen pressed 3 times.
If you are happy that the program appearsto be running OK on your board, downloadit using the Run Live option. Does it nowwork properly?

26
You will probably find that the program does not operate properly. More than likely whenyou press the micro switch D6 once the program jumps straight to activating the motorfollowed by the 2 green LEDs and then returns to the start. It does not appear to wait untilthe switch has been pressed 5 times?
Switches can do some really odd things. Most engineers learn this after connecting a switchor a relay to a digital system. Switches don't make and break cleanly on the time scales ofdigital systems. Instead, a typical switch makes multiple transitions during the tens ofmilliseconds required to open or close, due to effects that include age, operating inertia,mechanical design, and the microscopic condition of the switch-contact surfaces. Commonlycalled "switch bounce," this behaviour is an inescapable fact of life.
After connecting a standard switch to a digital counting circuit, you can observe severalcounts on opening and several counts on closing. This erratic action can wreak havoc ondata, because the exact number of counts does not necessarily repeat in the long term.Switch bounce is not consistent from unit to unit, lot to lot, or even over the life of anindividual switch. Some switch types don't appear to bounce when new, but all mechanicalswitches bounce sometimes. Nothing can ensure that another switch of the same type willact the same way, or that a particular switch will remain bounce-free as it ages.
This oscilloscope display shows the rising-edge switch bounce for a small pushbutton switchshowing an approximate 5ms bounce interval that includes 10 transitions between the offand on states. Like a bouncing ball, the switch-action frequency increases toward the right.
In order to overcome this problem in our program a shorttime delay (usually 0.25 to 0.5 seconds) can beintroduced into the flowchart after the switch is activatedas shown.
This allows the ‘bounce’ to settle before the switch inputis used to control anything; in this case, beforeincrementing variable ‘A’ by 1.
Edit your flowchart as shown and retest on yourboard using the Run Live option.

27
15 Parallel Processing
Adding another start to a flowchart program will cause the PIC microcontroller to run bothflowcharts at the same time. This is known as Parallel Processing.
The GENIE E18 microcontroller will allow 4 separate flowcharts to be run simultaneously.
Create the flowchart shown below and download using the Debug Live option:
In the above example, two separate things happen at the same time:
1. LED outputs Q2, Q3 and Q4 are made to go high and low in sequence for 0.5seconds each.
2. LED outputs Q5, Q6 and Q7 are also made to go high and low in sequence but for0.75 seconds each.
This means that both groups of LEDs are flashing at different rates. This is known as beingout of phase.
For programs with more than one flowchart you can choose for a flowchart to startsuspended (not running) by selecting the Start with this flowchart suspended optionfound in the Start Properties window.
A suspended flowchart can be restarted by using the Resume command (in which case aflowchart name must have been entered).
The Resume command can be found in the Advanced Control folder.

28
16 GENIE Design Studio Help
These notes are only an introduction to GENIE Design Studio. It contains many morecommands that have not been mentioned at all.
Explanations of these other commands can be found in the Help section of the software byclicking on GENIE Design Studio Help as shown below:
Then select Flowchart commands as shown:
This will open a window displaying all current GENIE commands. By clicking on anycommand the user will be given a simple explanation of what the command does along witha sample flowchart showing how the command may be used.

29
17 Further Exercises
Exercise 7
A set of pedestrian traffic lights are located near a school. They stay
continuously green for the traffic and red for the pedestrians unless a button
is pressed by a pedestrian. When the button is pressed, amber light comes
on for the traffic. The pedestrian light turns green when the traffic light turns
red. The pedestrian has 10 seconds to cross before the lights turn back to
the original setting.
Exercise 8
A system is required to control three separate lamps based on light levels. It
automatically switches them on one by one as darkness falls, and switches
them off in the same way as conditions grow lighter.
Exercise 9
Expand Exercise 8 in order to create a light meter. In bright sunlight the 6
LED outputs will be lit. As the light level falls, the LEDs will switch off one by
one.
Exercise 10
You have been requested to design an alarm system which will sound a two
note alarm when a burglar steps on a pressure pad (simulated by a micro
switch). The two note alarm will continue to play until a push switch is
pressed. When it is pressed the alarm turns off until reactivated by the
pressure pad.
Exercise 11
Using the flowchart from Exercise 8, design a flowchart for an alarm system
suitable for protecting a safe with both a pressure pad located on the floor in
front of the safe and a method of activating an alarm if the safe door is
opened. Include a reset push switch as before.
Exercise 12Parallel
Processing
Intelligent houses will help conserve energy in the future. Design a system
that will simulate the following automatically:
Turn off the lights when they are not needed
Turn off the heating when the house is warm enough
Turn on ventilation fans if the house gets too warm
Use the following outputs as simulations:
2 yellow LEDs Q3 and Q6 to simulate house lights
1 red LED Q2 to simulate the heating system
Motor Q1 to simulate the ventilation fans
Exercise 13Parallel
Processing
Students are required to design a project based on a vehicle theme in order
to demonstrate some of the capabilities of their PIC project board. The
vehicle should demonstrate the following:
1. Headlights (Q3&Q6) activate automatically when darkness falls.
2. Air conditioning fan (Q1) activates automatically when temperature rises.
3. Horn plays a simple tune when activated by push switch (D7).
4. Brake lights (Q2 & Q5) flash in a set sequence when activated by the
pedal/micro switch (D6).
The vehicle structure should be designed and manufactured in order to allow
the observer see as much of the PIC project as possible and to allow them
interact easily with the required inputs.

30
18 Useful Links
The following website links will be useful for further study in the area of PICmicrocontrollers:
http://www.genieonline.com/
http://www.rev-ed.co.uk/
http://www.picaxeforum.co.uk/
http://www.logicator.co.uk/
http://www.technologystudent.com/pics/picdex1.htm
http://www.ajbox.co.uk/
http://www.new-wave-concepts.com/
http://www.youtube.com/watch?v=u4Ia_YRUCy0
http://www.t4.ie/Professional_Development/RD8_Technology/Robotics/A%20Guideli
ne%20to%20using%20%20Pic%20Logicator.pdf
http://www.economatics-education.co.uk/secondary/education/90,94,0/1536/PIC-
Logicator_Version_2.htm
http://www.bbc.co.uk/science/robots/techlab/sub_selector.shtml