incorporating greenhouse gas considerations in rtp modeling jerry walters, fehr & peers ctc work...
TRANSCRIPT
Incorporating Greenhouse Gas Considerations in Incorporating Greenhouse Gas Considerations in RTP ModelingRTP Modeling
Jerry Walters, Fehr & PeersJerry Walters, Fehr & Peers
CTC Work Group Meeting on CTC Work Group Meeting on RTP GuidelinesRTP Guidelines June 28, 2007June 28, 2007
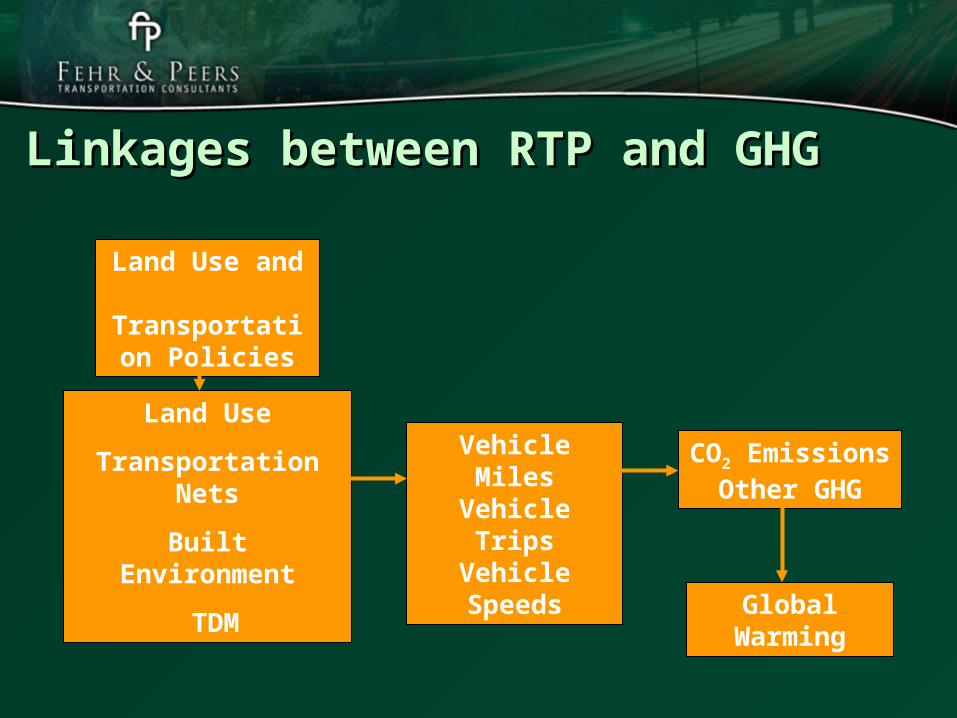
Linkages between RTP and GHGLinkages between RTP and GHG
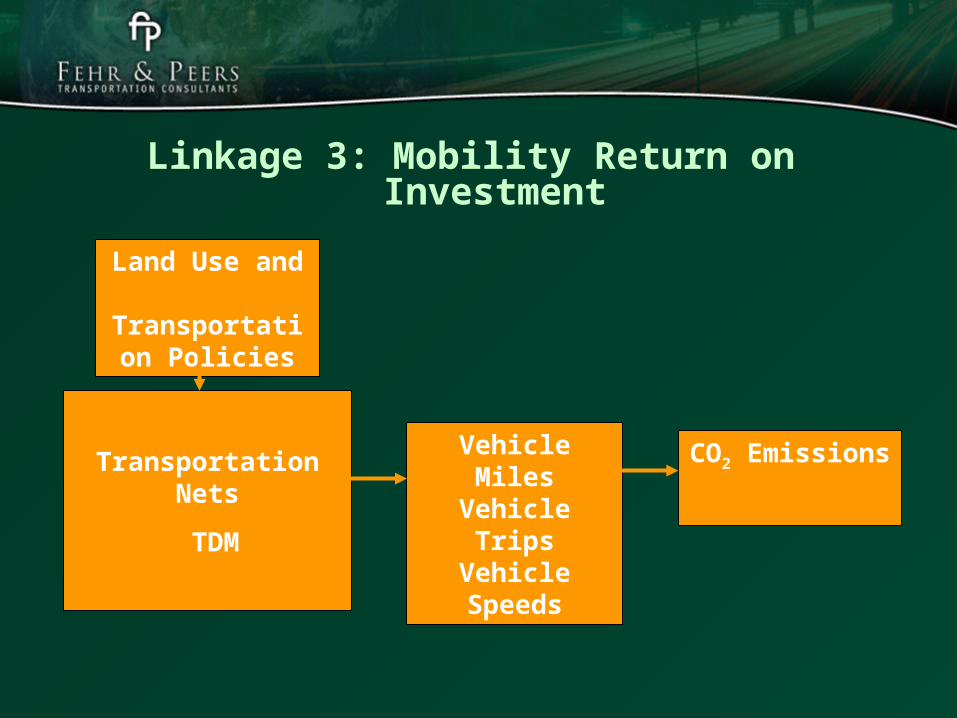
Land Use and Transportation
Policies
Land Use
Transportation Nets
Built Environment
TDM
Vehicle Miles Vehicle Trips
Vehicle Speeds
CO2 Emissions Other GHG
Global Warming
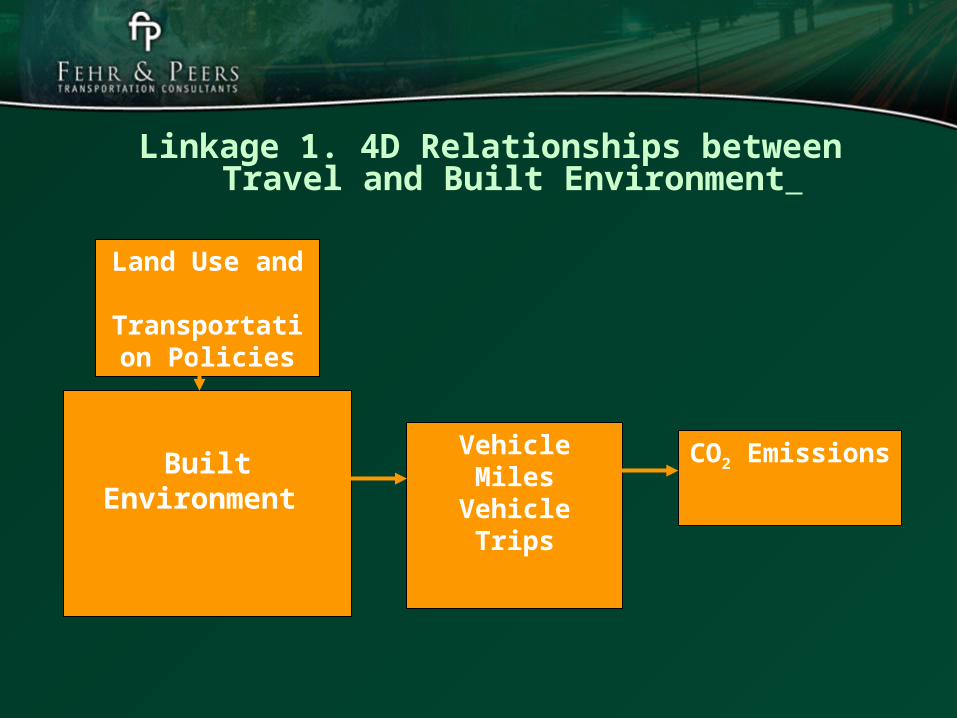
Linkage 1. 4D Relationships between Travel and Built Environment
Land Use and Transportation
Policies
Built Environment
Vehicle Miles Vehicle Trips
CO2 Emissions
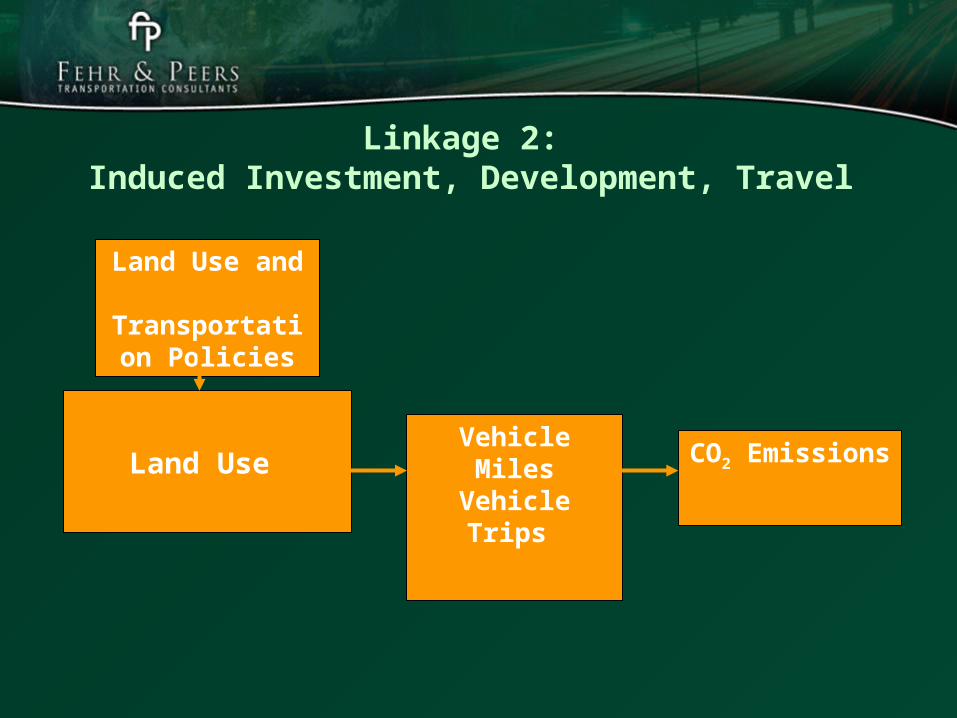
Land Use and Transportation
Policies
Land Use Vehicle Miles Vehicle Trips
CO2 Emissions
Linkage 2: Induced Investment, Development, Travel
Land Use and Transportation
Policies
Transportation Nets
TDM
Vehicle Miles Vehicle Trips
Vehicle Speeds
CO2 Emissions
Linkage 3: Mobility Return on Investment
Linkage 1: 4D Relationships between
Travel and Built Environment
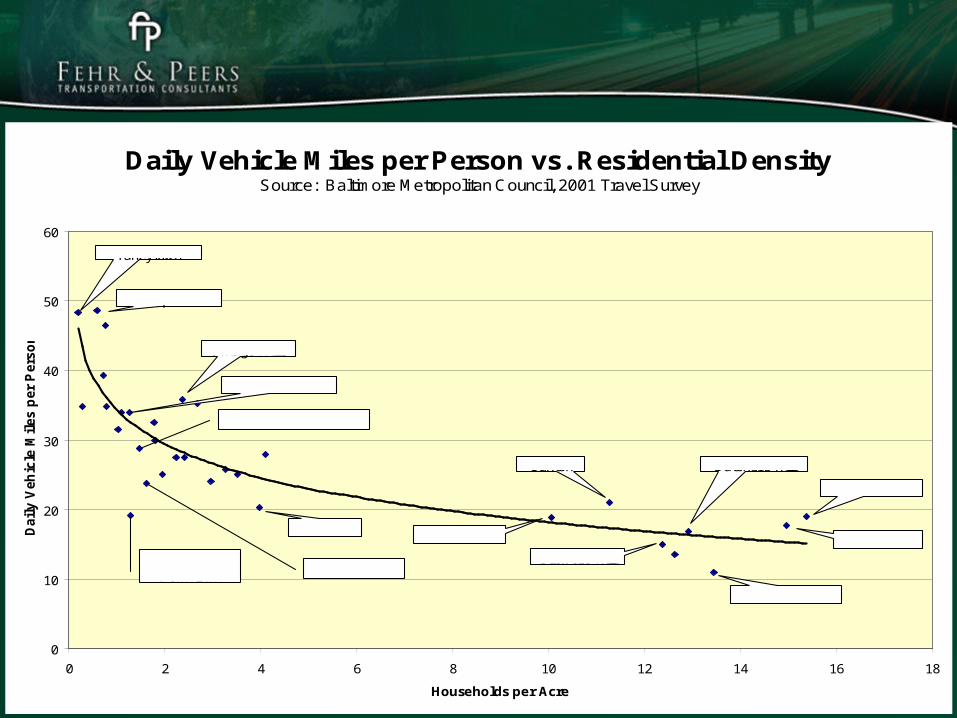
Daily Vehicle Miles per Person vs. Residential DensitySource: Baltimore Metropolitan Council, 2001 Travel Survey
0
10
20
30
40
50
60
0 2 4 6 8 10 12 14 16 18
Households per Acre
Dail
y V
eh
icle
Mil
es p
er
Pers
on
Charles Street
Hampstead
Odenton
Owings Mills
Dundalk
Reservoir Hill
Butcher's Hill
Brewer's HillBolton Hill
Canton
Federal Hill
Taneytown
Westminster Greens
Westminster Downtown
Havre de Grace
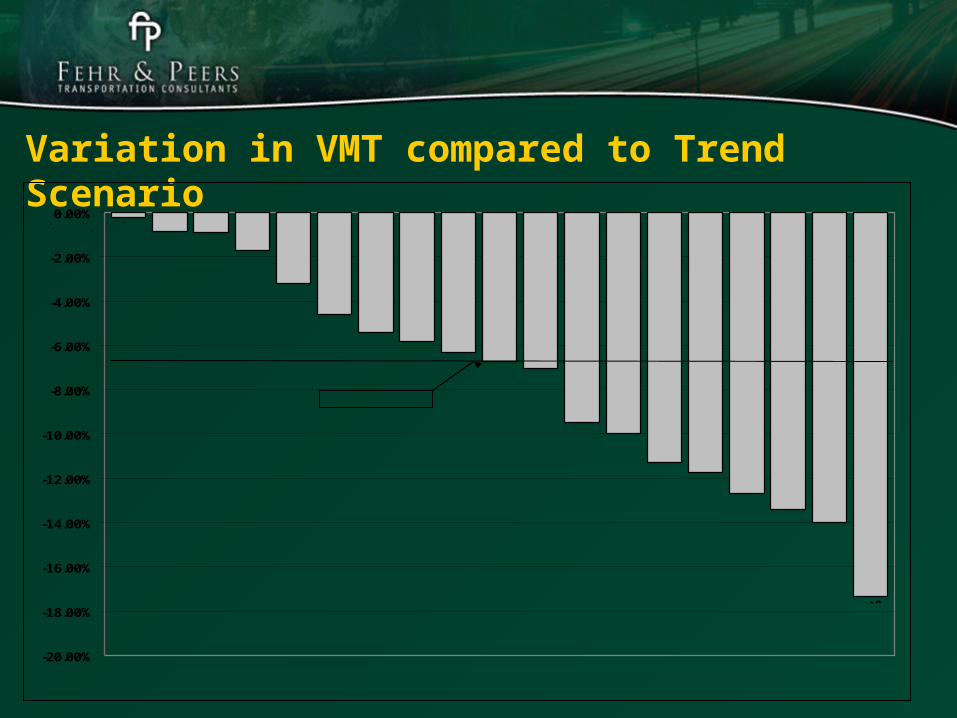
Variation in VMT compared to Trend Scenario
-20.00%
-18.00%
-16.00%
-14.00%
-12.00%
-10.00%
-8.00%
-6.00%
-4.00%
-2.00%
0.00%
-.23
%
-17.3
3%
median: -6.7%
(trend)
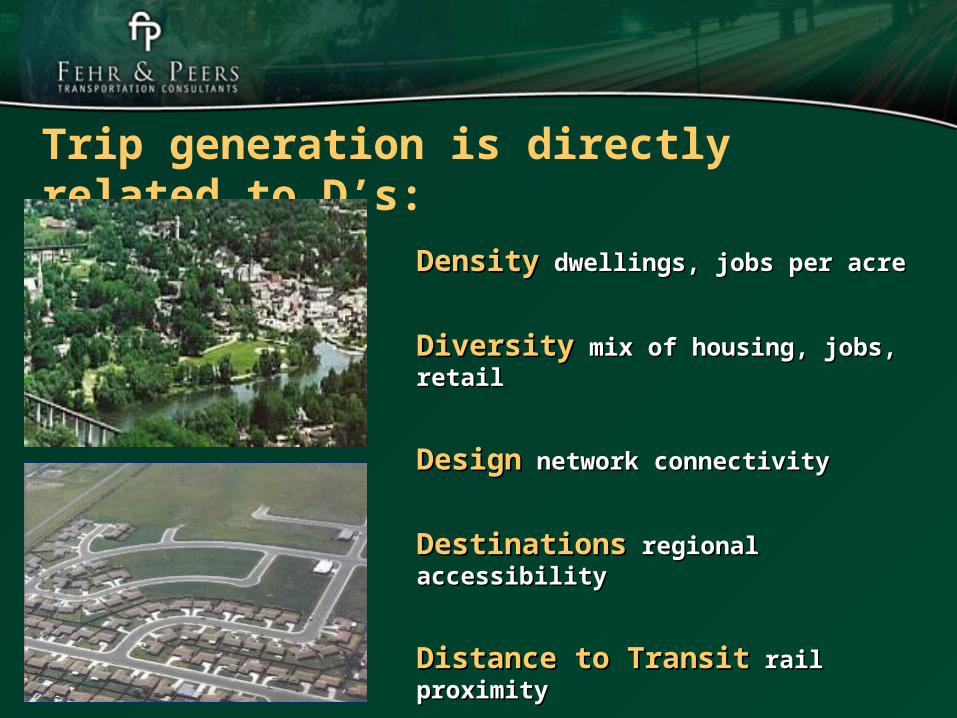
Trip generation is directly related to D’s:
DensityDensity dwellings, jobs per acredwellings, jobs per acre
DiversityDiversity mix of housing, jobs, retailmix of housing, jobs, retail
DesignDesign network connectivity network connectivity
DestinationsDestinations regional accessibility regional accessibility
Distance to TransitDistance to Transit rail proximity rail proximity
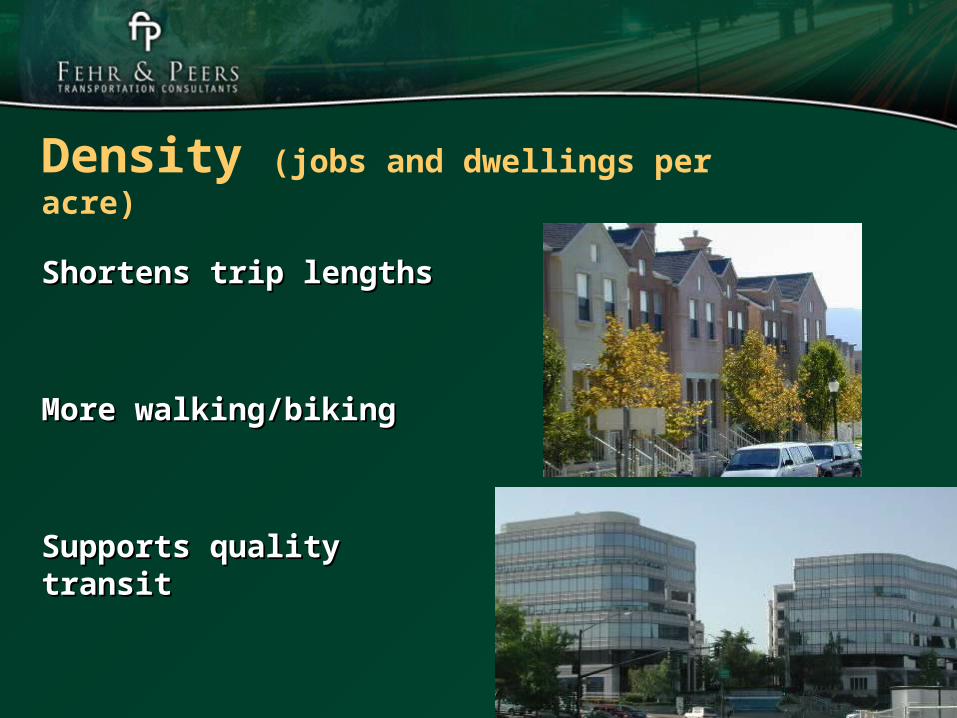
Shortens trip lengthsShortens trip lengths
More walking/bikingMore walking/biking
Supports quality transitSupports quality transit
Density (jobs and dwellings per acre)
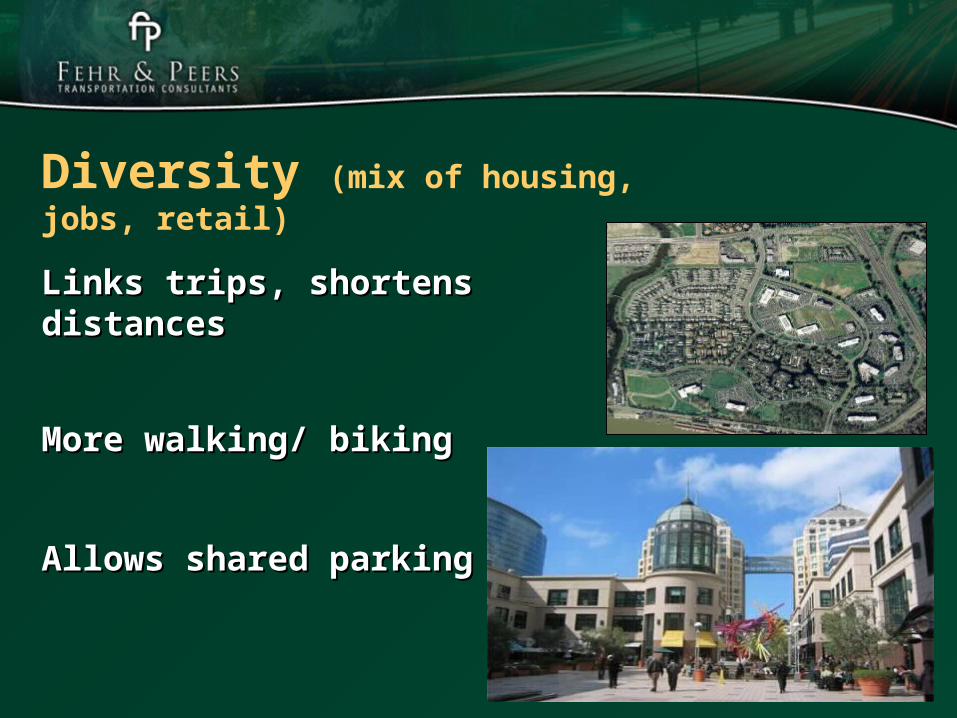
Links trips, shortens distancesLinks trips, shortens distances
More walking/ bikingMore walking/ biking
Allows shared parkingAllows shared parking
Diversity (mix of housing, jobs, retail)
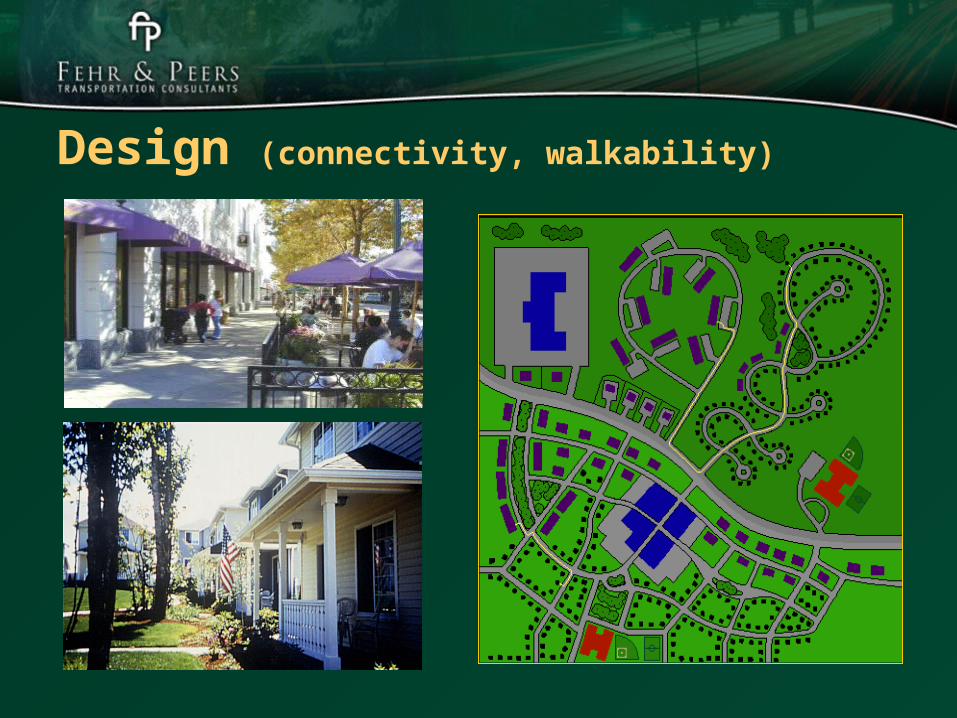
Design (connectivity, walkability)
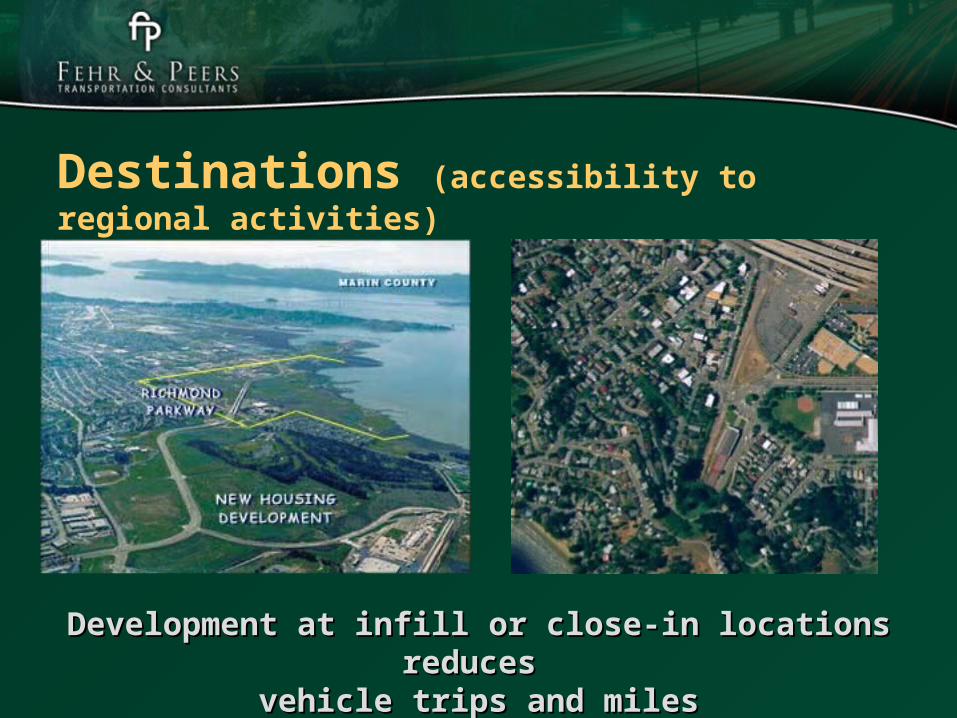
Destinations (accessibility to regional activities)
Development at infill or close-in locations reduces Development at infill or close-in locations reduces vehicle trips and milesvehicle trips and miles
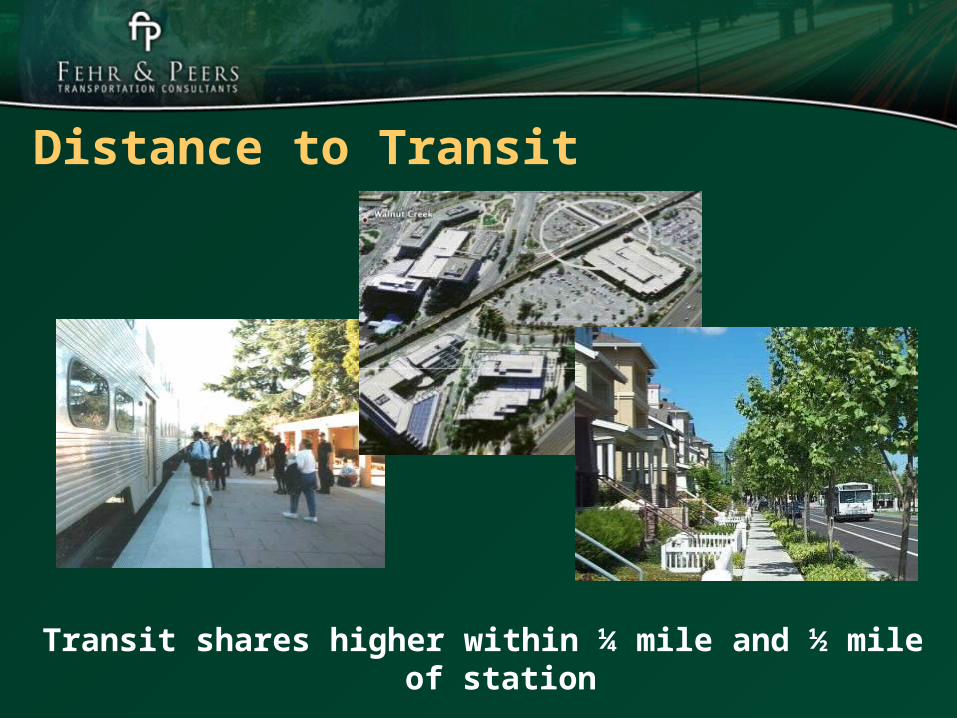
Transit shares higher within ¼ mile and ½ mile of station
Distance to Transit
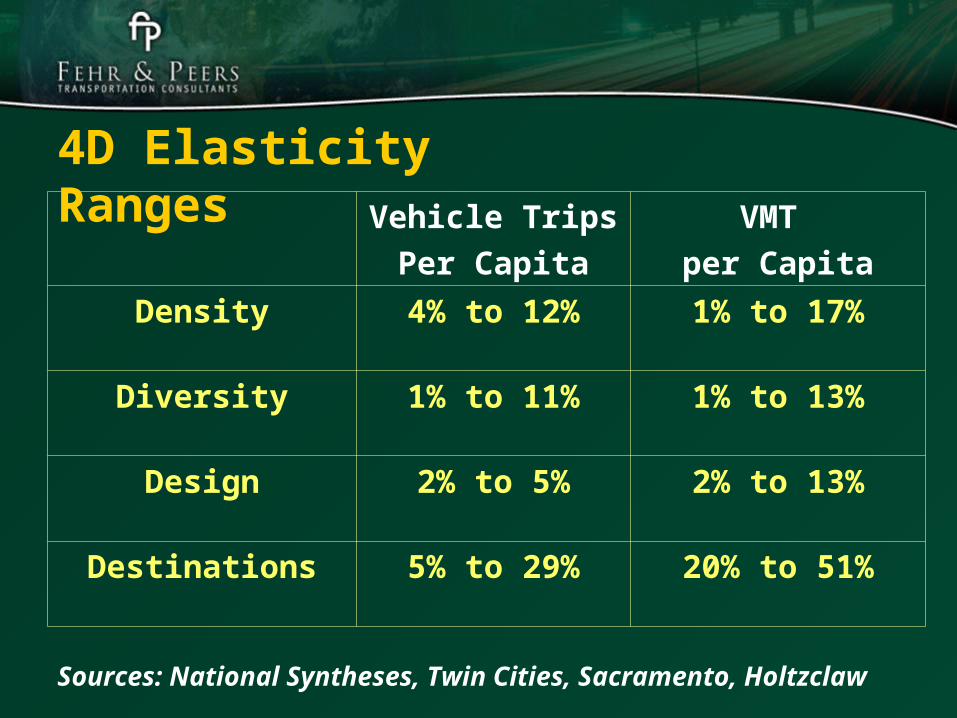
Vehicle Trips
Per Capita
VMT
per Capita
Density 4% to 12% 1% to 17%
Diversity 1% to 11% 1% to 13%
Design 2% to 5% 2% to 13%
Destinations 5% to 29% 20% to 51%
4D Elasticity Ranges
Sources: National Syntheses, Twin Cities, Sacramento, Holtzclaw
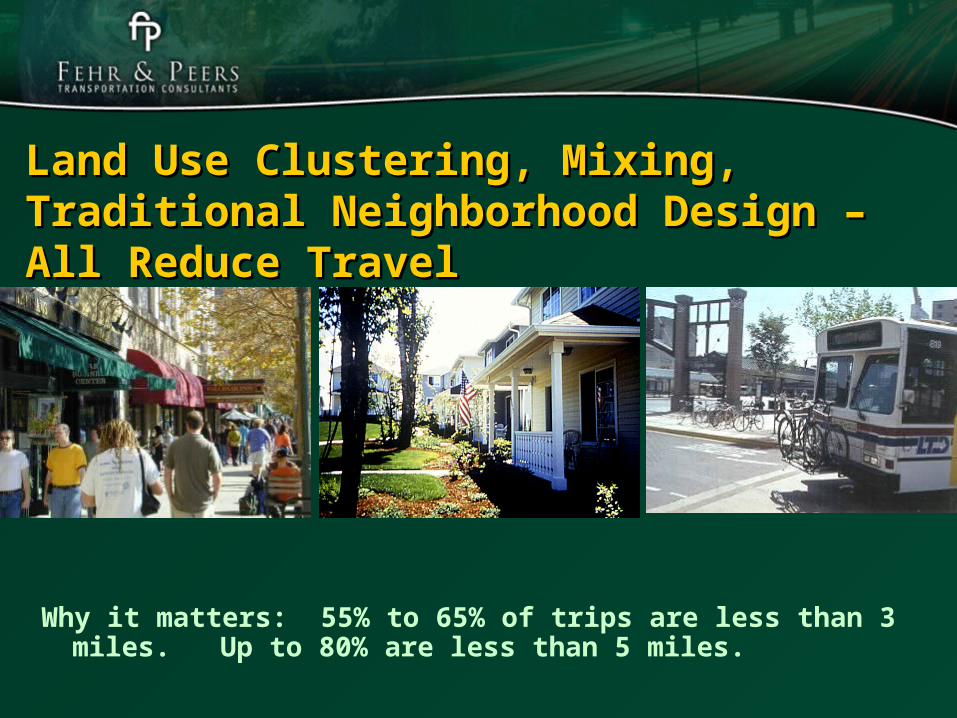
Land Use Clustering, Mixing, Traditional Land Use Clustering, Mixing, Traditional Neighborhood Design – All Reduce TravelNeighborhood Design – All Reduce Travel
Why it matters: 55% to 65% of trips are less than 3 miles. Up to 80% are less than 5 miles.
Shortcomings of Conventional Travel Models Shortcomings of Conventional Travel Models in Assessing Smart Growthin Assessing Smart Growth
• Primary use is to forecast long-distance auto travel on Primary use is to forecast long-distance auto travel on freeways and major roadsfreeways and major roads
• Secondary use is to forecast system-level transit useSecondary use is to forecast system-level transit use
• Short-distance travel, local roads, non-motorized travel Short-distance travel, local roads, non-motorized travel modes are not addressed in model validationmodes are not addressed in model validation
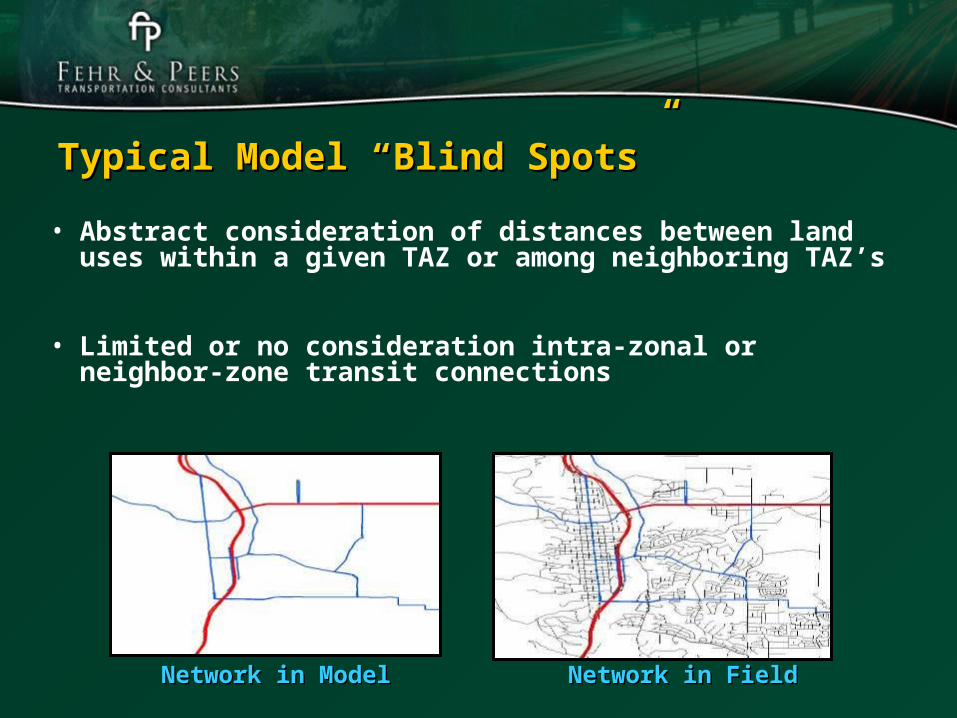
Typical Model “Blind Spots”Typical Model “Blind Spots”
• Abstract consideration of distances between land uses within a given TAZ or among neighboring TAZ’s
• Limited or no consideration intra-zonal or neighbor-zone transit connections
Network in ModelNetwork in Model Network in FieldNetwork in Field
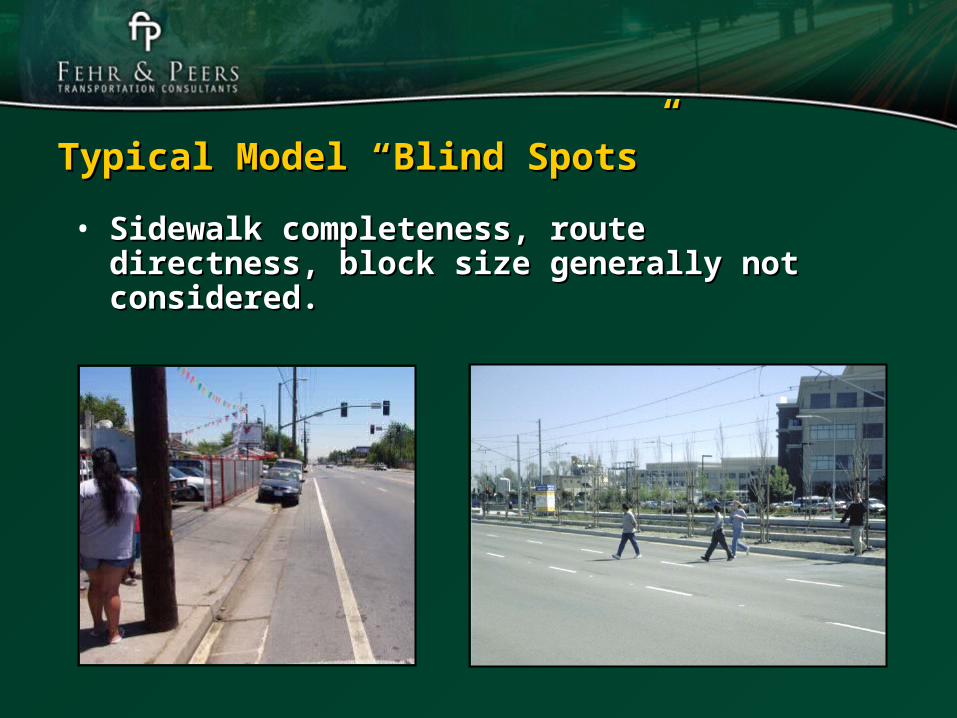
Typical Model “Blind Spots”Typical Model “Blind Spots”
• Sidewalk completeness, route directness, block Sidewalk completeness, route directness, block size generally not considered.size generally not considered.
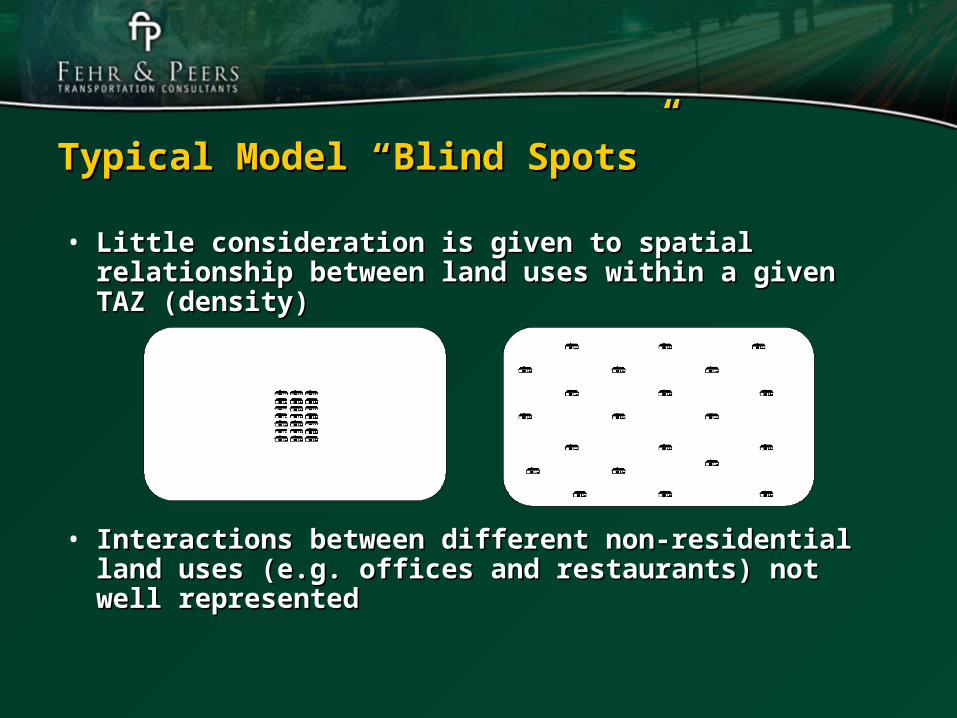
Typical Model “Blind Spots”Typical Model “Blind Spots”
• Little consideration is given to spatial relationship Little consideration is given to spatial relationship between land uses within a given TAZ (density)between land uses within a given TAZ (density)
• Interactions between different non-residential land Interactions between different non-residential land uses (e.g. offices and restaurants) not well uses (e.g. offices and restaurants) not well representedrepresented
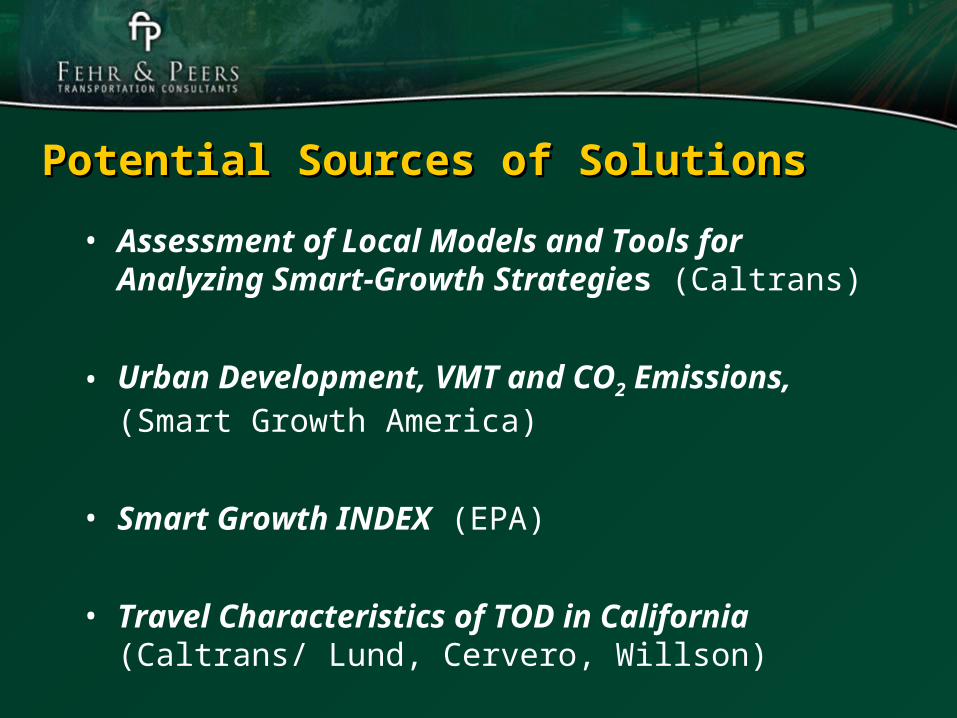
Potential Sources of SolutionsPotential Sources of Solutions
• Assessment of Local Models and Tools for Analyzing Smart-Growth Strategies (Caltrans)
• Urban Development, VMT and CO2 Emissions, (Smart Growth America)
• Smart Growth INDEX (EPA)
• Travel Characteristics of TOD in California (Caltrans/ Lund, Cervero, Willson)
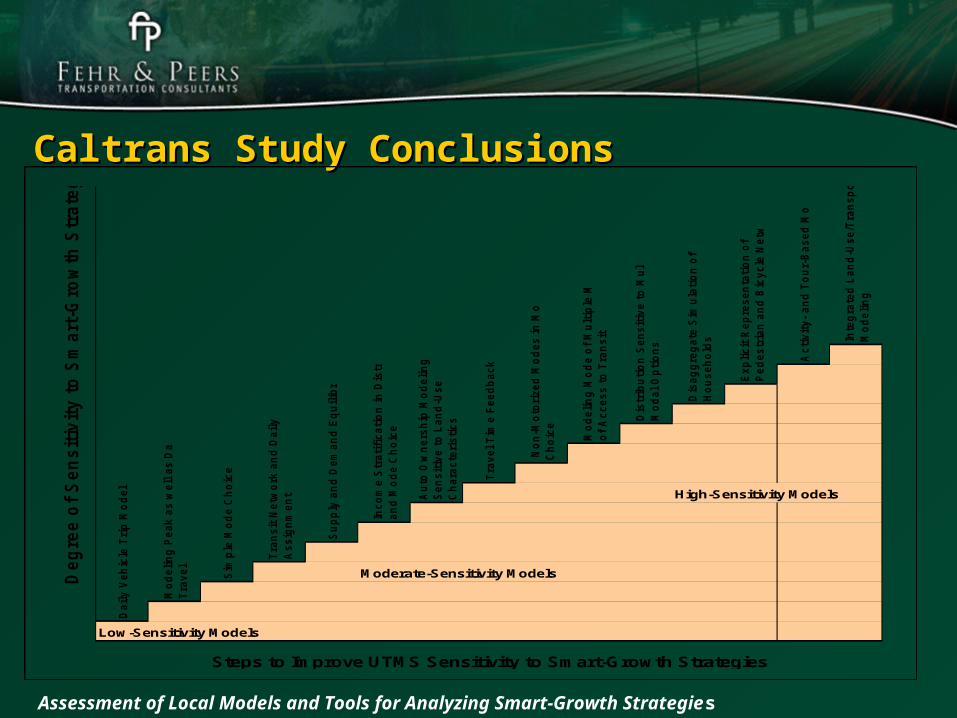
Caltrans Study ConclusionsCaltrans Study Conclusions
Assessment of Local Models and Tools for Analyzing Smart-Growth Strategies
High-Sensitivity Models
Moderate-Sensitivity Models
Low-Sensitivity Models
Steps to Improve UTMS Sensitivity to Smart-Growth Strategies
Tra
vel
Tim
e F
ee
db
ac
k
No
n-M
oto
rize
d M
od
es
in
Mo
de
Ch
oic
e
Mo
de
lin
g P
ea
k a
s w
ell
as
Da
ily
Tra
vel
Sim
ple
Mo
de C
ho
ice
Tra
nsit
Netw
ork
an
d D
ail
y
As
sig
nm
en
t
Su
pp
ly a
nd
Dem
an
d E
qu
ilib
rati
on
Inte
gra
ted
La
nd
-Use
/Tra
nsp
ort
ati
on
Mo
de
lin
g
Ac
tiv
ity-
an
d T
ou
r-B
ase
d M
od
eli
ng
Ex
pli
cit
Re
pre
sen
tati
on
of
Pe
des
tria
n a
nd
Bic
ycle
Ne
two
rks
Inc
om
e S
tra
tifi
ca
tio
n i
n D
istr
ibu
tio
n
an
d M
od
e C
ho
ice
Au
to O
wn
ers
hip
Mo
deli
ng
Se
nsit
ive
to
Lan
d-U
se
Ch
ara
cte
ris
tic
s
Deg
ree
of
Sen
sit
ivit
y t
o S
mart
-Gro
wth
Str
ate
gie
s
Mo
de
lin
g M
od
e o
f M
ult
iple
Mo
de
s
of
Ac
ces
s t
o T
ran
sit
Dis
trib
uti
on
Sen
sit
ive t
o M
ult
i-
Mo
da
l O
pti
on
s
Dis
ag
gre
ga
te S
imu
lati
on
of
Ho
us
eh
old
s
Da
ily
Ve
hic
le T
rip
Mo
del
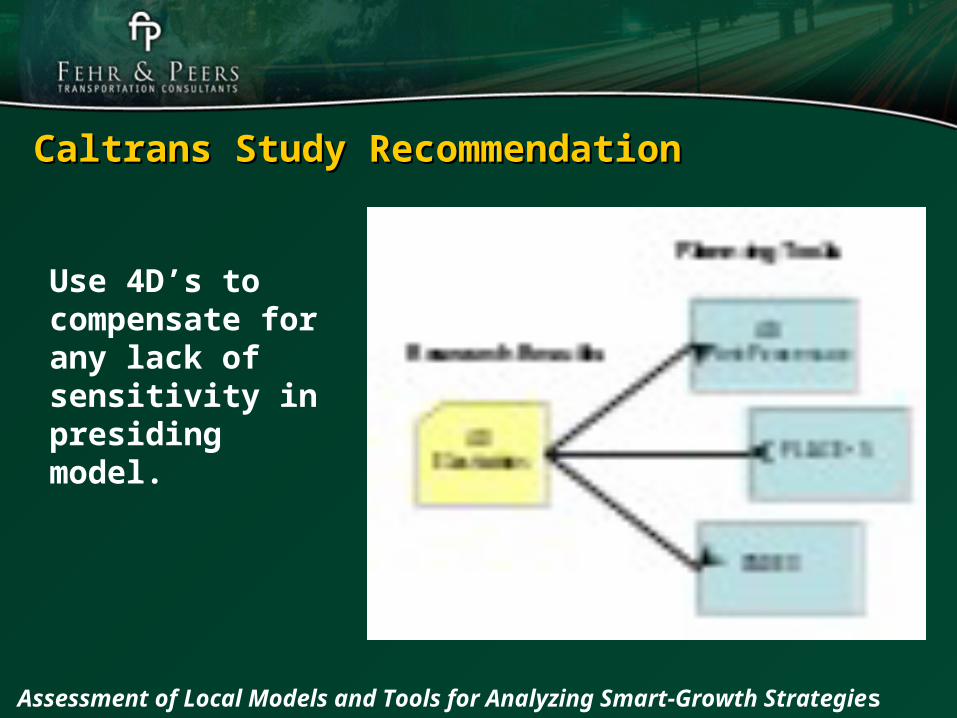
Caltrans Study RecommendationCaltrans Study Recommendation
Assessment of Local Models and Tools for Analyzing Smart-Growth Strategies
Use 4D’s to compensate for any lack of sensitivity in presiding model.
2 Induced Investment Development, Travel
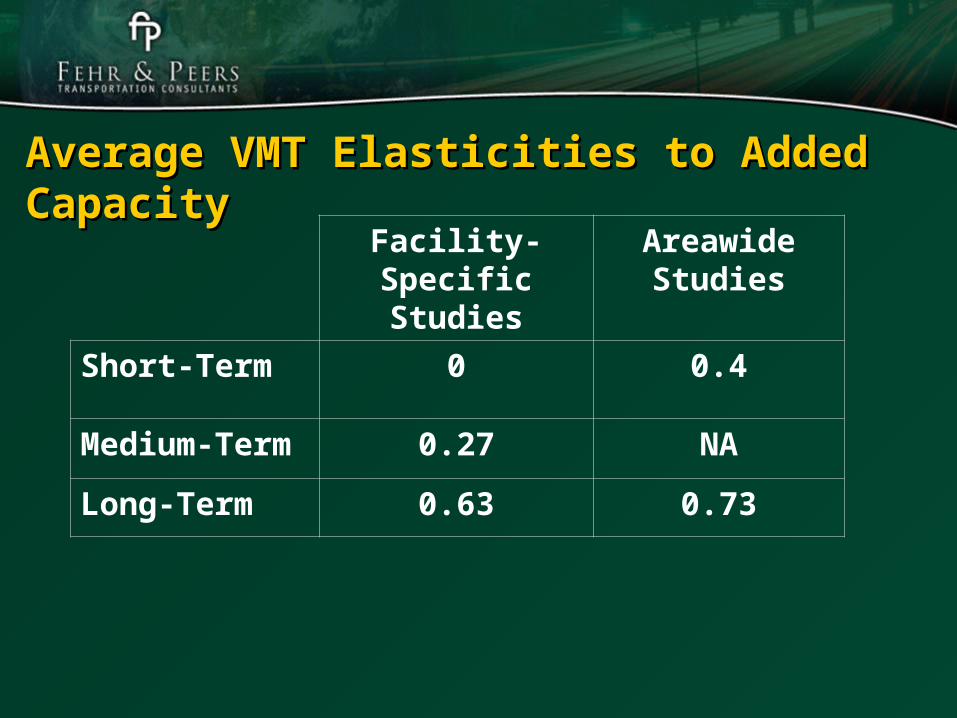
Average VMT Elasticities to Added CapacityAverage VMT Elasticities to Added Capacity
Facility-Specific Studies
Areawide Studies
Short-Term 0 0.4
Medium-Term 0.27 NA
Long-Term 0.63 0.73
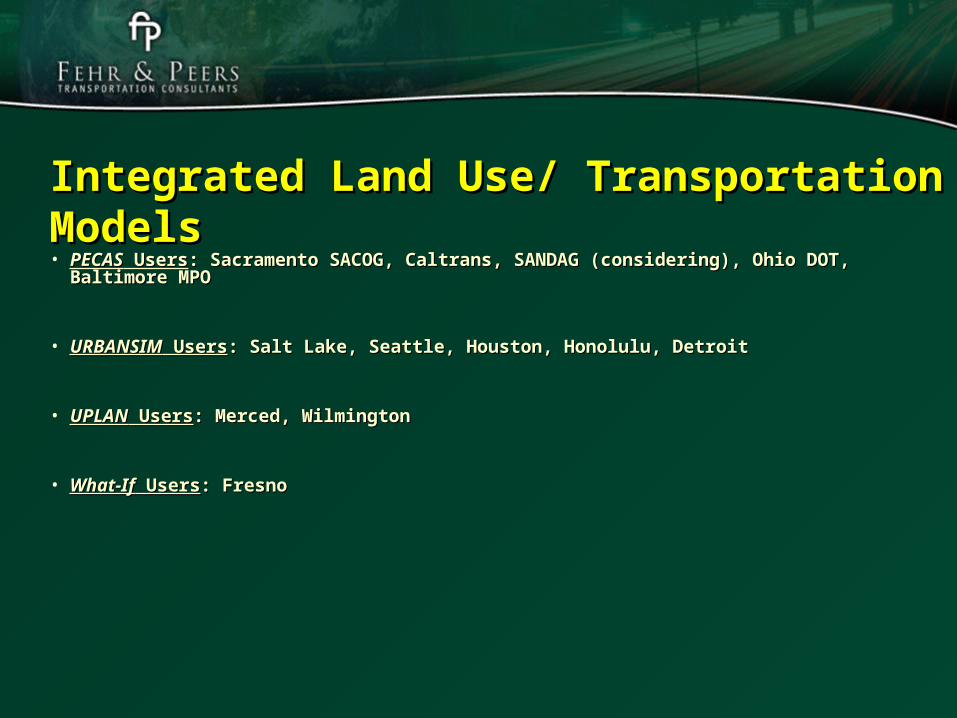
Integrated Land Use/ Transportation ModelsIntegrated Land Use/ Transportation Models
• PECASPECAS Users Users: Sacramento SACOG, Caltrans, SANDAG (considering), Ohio DOT, : Sacramento SACOG, Caltrans, SANDAG (considering), Ohio DOT, Baltimore MPO Baltimore MPO
• URBANSIMURBANSIM Users Users: Salt Lake, Seattle, Houston, Honolulu, Detroit: Salt Lake, Seattle, Houston, Honolulu, Detroit
• UPLANUPLAN Users Users: Merced, Wilmington: Merced, Wilmington
• What-IfWhat-If Users Users: Fresno: Fresno
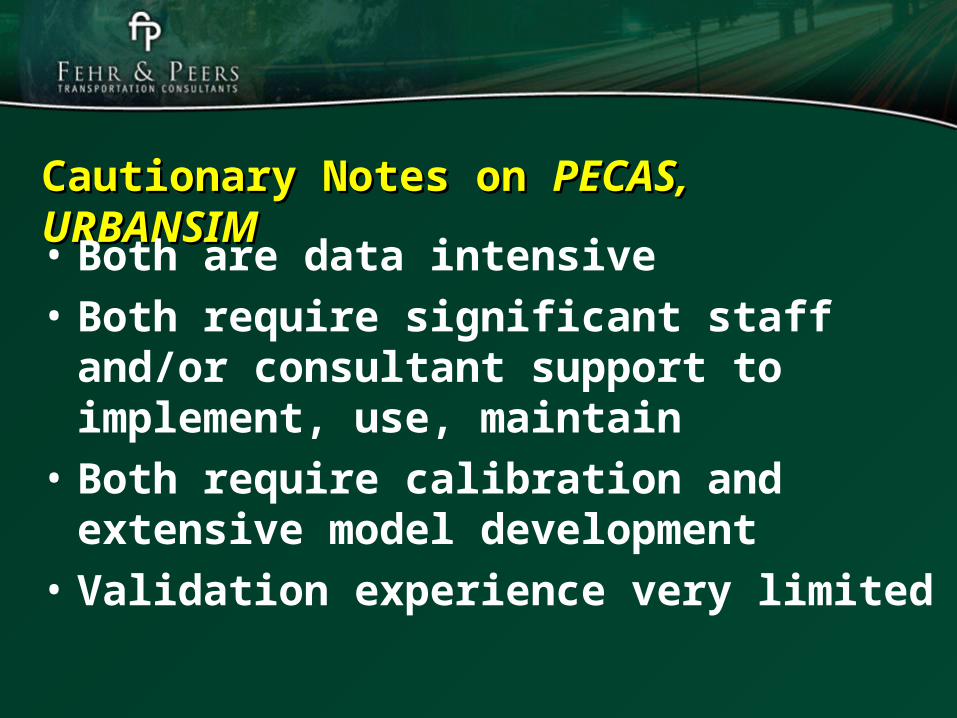
Cautionary Notes on Cautionary Notes on PECAS, URBANSIMPECAS, URBANSIM
• Both are data intensive
• Both require significant staff and/or consultant support to implement, use, maintain
• Both require calibration and extensive model development
• Validation experience very limited
3 Mobility ROI
Investment in System ContinuityInvestment in System Continuity

Q&AQ&A