increased airway smooth muscle in preschool wheezers who ... · increased airway smooth muscle in...
TRANSCRIPT
Increased airway smoothmuscle in preschool wheezers whohave asthma at school age
Ruth O’Reilly, MBChBBAO,a,b Nicola Ullmann, MD,a,b Samantha Irving, BSc,a,b Cara J. Bossley, MBChB,a,b
Samatha Sonnappa, PhD,c Jie Zhu, PhD,d Timothy Oates, BSc,b Winston Banya, BSc,e Peter K. Jeffery, DSc,d
Andrew Bush, MD,a,b and Sejal Saglani, MDa,b London, United Kingdom
Background: Increased airway smooth muscle (ASM) is afeature of established asthma in schoolchildren, but nothing isknown about ASM in preschool wheezers.Objective: We sought to determine endobronchial biopsyspecimen ASM area fraction in preschool wheezers and itsassociation with asthma at school age.Methods: ASM area, reticular basement membrane thickness,andmucosal eosinophil andASMmast cell valueswere quantifiedin endobronchial biopsy specimens previously obtained frompreschool children undergoing clinically indicatedbronchoscopy: severe recurrent wheezers (n 5 47; median age,26 months) and nonwheezing control subjects (n 5 21; medianage, 15 months). Children were followed up, and asthma statuswas established at age 6 to 11 years. Preschool airway pathologywas examined in relation to asthma at school age.Results: Forty-two (62%) of 68 children had 1 or moreevaluable biopsy specimens for ASM. At school age, 51 of 68children were followed up, and 15 (40%) of 37 preschoolwheezers had asthma. Children who had asthma and anevaluable biopsy specimen had increased preschool ASM areafraction (n 5 8; median age, 8.2 years [range, 6-10.4 years];median ASM, 0.12 [range, 0.08-0.16]) compared with that seenin children without asthma (n 5 24; median age, 7.3 years[range, 5.9-11 years]; median ASM, 0.07 [range, 0.02-0.23]; P 5.007). However, preschool reticular basement membranethickness and mucosal eosinophil or ASM mast cell values werenot different between those who did or did not have asthma atschool age.Conclusion: Increased preschool ASM is associated with thosechildren who have asthma at school age. Thus a focus on earlychanges in ASM might be important in understanding thesubsequent development of childhood asthma. (J Allergy ClinImmunol 2013;131:1024-32.)
From the Departments of aPaediatric Respiratory Medicine, dGene Therapy, and eMed-
ical Statistics, Royal Brompton Hospital; bLeukocyte Biology, National Heart and
Lung Institute, Imperial College London; and cPortex Unit, Respiratory Medicine
and Physiology and the Department of Epidemiology and Biostatistics, UCL Institute
of Child Health.
R. O’Reilly and S. Saglani were both supported by an Asthma UK project grant.
S. Saglani was supported by a Clinical Intermediate Fellowship from the Wellcome
Trust, United Kingdom. The project was supported by the National Institute for Health
Research Respiratory Disease Biomedical Research Unit at the Royal Brompton and
Harefield NHS Foundation Trust and Imperial College London.
Disclosure of potential conflict of interest: The authors declare that they have no relevant
conflicts of interest.
Received for publication July 9, 2012; revised August 24, 2012; accepted for publication
August 24, 2012.
Available online October 12, 2012.
Corresponding author: Sejal Saglani, MD, Leukocyte Biology, National Heart and Lung
Institute, Imperial College London, Exhibition Road, London SW7 2AZ, United
Kingdom. E-mail: [email protected].
0091-6749/$36.00
� 2012 American Academy of Allergy, Asthma & Immunology
http://dx.doi.org/10.1016/j.jaci.2012.08.044
1024
Key words: Preschool wheeze, airway smooth muscle, asthma,pediatric, pathology
Airway wall inflammation and structural changes (ie, remod-eling), which include increased reticular basement membrane(RBM) thickness and increased airway smooth muscle (ASM),are pathologic characteristics of asthma.1 In particular, alterationsin ASM are most consistently associated with abnormal lungfunction. ASM hypertrophy and hyperplasia in school-aged andadult asthmatic patients have been significantly associated withbronchodilator responsiveness2-4 and airway hyperresponsive-ness.5 Furthermore, the proportion of ASM increases as airflowlimitation worsens.6,7 ASM mast cell infiltration distinguishesasthma from eosinophilic bronchitis in adults and correlateswith airway hyperresponsiveness.8-10
Although one third of all preschool children wheeze,11 onlyhalf of these will have persistent symptoms and be given a diag-nosis of asthma at school age.12 However, our understanding ofairway pathology in preschool children and its relationship to fu-ture asthma remains limited. Increased RBM thickness and eosin-ophilic inflammation have been demonstrated in endobronchialbiopsy (EB) specimens from preschool children with severe re-current wheeze aged 2 to 3 years when compared with that seenin preschool control subjects with no lower respiratory tractsymptoms.13 Although increased ASMmass is a feature of estab-lished asthma in adults and children as young as 7 years,1,3 noth-ing is known about ASM in preschool wheezers or the long-termsignificance of airway remodeling in preschool wheezers.We have previously performed bronchoscopy and obtained EB
specimens in wheezy preschool children attending our clinic, butat that time, their future clinical outcome was not known.13 Wehypothesized that children with severe recurrent wheeze at pre-school age would exhibit increased ASM compared with thatseen in nonwheezing control subjects and that preschool airwaypathology would be predictive of the later development of asthmaat school age.We therefore followed up a prospectively recruited group of
preschool wheezers and control subjects who underwent aclinically indicated bronchoscopy and EB between 2002 and2005 to school age (2009-2010) to establish the presence orabsence of asthma and then examined the relationships betweenpreschool airway pathology and asthma status at school age.13
Some of the results in these studies have been reported in theform of abstracts.14,15
METHODS
Preschool subjectsFull subject details have been reported previously and are fully described in
the Methods section in this article’s Online Repository at www.jacionline.
org.13 EB specimens were obtained from preschool children undergoing

J ALLERGY CLIN IMMUNOL
VOLUME 131, NUMBER 4
O’REILLY ET AL 1025
Abbreviations used
ASM: A
irway smooth muscleEB: E
ndobronchial biopsyFENO50: F
raction of exhaled nitric oxide at 50 mL/sFRC: F
unctional residual capacityRBM: R
eticular basement membraneROC: R
eceiver operating curveScond: C
onducting airways inhomogeneitySPT: S
kin prick testclinically indicated bronchoscopy between 2002 and 2005: severe recurrent
wheezers (n 5 47; median age, 26 months [range, 6-58 months]) and
nonwheezing control subjects (n 5 21; median age, 15 months [range, 3-42
months]). We measured total IgE levels and RAST results to 3 food allergens
and 5 aeroallergens. Children were further divided into confirmed or reported
wheezers based on parental identification of wheeze on a video question-
naire.16 The majority of nonwheezing control subjects had bronchoscopy for
assessment of upper airway problems.
Follow-up at school ageClinical diagnosis of asthma. Children were followed up at age
6 to 11 years (Fig 1). Caregivers completed International Study of Asthma and
Allergy in Children core questionnaires for asthma, eczema, and allergic rhi-
nitis.17 Asthma was defined as both a positive caregiver response to the ques-
tion ‘‘Has your child had wheezing or whistling in the chest in the last 12
months?’’ and a caregiver report of doctor-diagnosed asthma ever.18-23 Care-
givers were asked to identify wheeze at school age using a validated video
questionnaire.24 Two asthma clinical prediction indices, the ‘‘stringent index’’
derived from the Tucson cohort and thewheeze severity score, were calculated
from data obtained at preschool recruitment.25,26 For the stringent index,
wheezing apart from colds or peripheral blood eosinophilia were used as the
minor criteria. For the wheeze severity score, 3 to 4 episodes of wheeze
plus the number of hospital admissions was used to approximate the score.
Lung function. Spirometry was performed in accordance with
American Thoracic Society guidelines.27 Multiple-breath washout was mea-
sured with a modified Innocor photoacoustic device (Innovision, Odense,
Denmark) that has been validated in children older than 5 years.28,29 Children
breathed 0.2% sulphur hexafluoride in air (BOC, Hertford, United Kingdom)
until a steady state was reached. The gas supply was then detached during ex-
piration, and patients then breathed room air until the end-tidal sulphur hexa-
fluoride concentration was one fortieth of the starting concentration (0.005%).
Washouts were performed 3 times.30 Washouts were excluded if the measured
functional residual capacity (FRC) differed bymore than 10% from both of the
repeat washouts.30 Lung clearance index, FRC, acinar airways inhomogene-
ity, and conducting airways inhomogeneity (Scond) values are reported as
the mean of 2 or more reproducible measurements.28
Airway inflammation and atopy. Fraction of exhaled nitric
oxide at 50 mL/s (FENO50) was measured with a chemiluminescence analyzer
(NiOX; Aerocrine AB, Solna, Sweden).31 Skin prick tests (SPTs) were per-
formed for 3 food allergens (hen’s egg, cow’s milk, and peanut) and 6 aeroal-
lergens (cat, dog, grass, tree, Aspergillus fumigatus, and Dermatophagoides
pteronyssinus; Soluprick SQ, Alk-Abell�o, Hørsholm, Denmark).32 Positive
and negative controls were included.
Quantification of RBM thickness, ASM, and inflam-
matory cells. Full details of bronchoscopy, biopsy processing, immu-
nostaining, and quantification of RBM thickness and subepithelial eosinophil
values have been reported previously (and see the Methods section in this ar-
ticle’s Online Repository).13,33 These were quantified again by a different ob-
server (R.O.) using the same techniques for this report. ASMwas assessed for
the first time in sections stained with hematoxylin and eosin by using 2 tech-
niques: (1) ASM area was represented as a fraction of subepithelial area
(LEICA Qwin version 3; see Fig E1 in this article’s Online Repository at
www.jacionline.org),34 and (2) the volume fraction of ASM was measured
by using point and line intersection counting (see Fig E2 in this article’s Online
Repository at www.jacionline.org).3,4 Biopsy specimens of less than 0.2 mm2
were excluded. Each child had the mean recorded ASM from all sections mea-
sured. A second blinded observer also quantified the ASM area fraction to
assess interobserver repeatability. Mast cells were stained with mast cell tryp-
tase and were expressed as numbers per square millimeter of ASM.8 ASM
was quantified in biopsy specimens from nonasthmatic school-aged children
(n 5 13) between 5.9 and 14.2 years old to assess the relationship between
age and ASM (see the Methods section in this article’s Online Repository).
Statistical analysisSample size was opportunistic, and there are no previous data in
preschoolers to inform a power calculation. Differences between groups
were analyzed by using nonparametric tests. A P value of less than .05 was
considered statistically significant. Analyses were performed with MedCalc
version 12.1.0 (MedCalc Software, Mariakerke, Belgium) and GraphPad
Prism version 5.02 (GraphPad, La Jolla, Calif) software (see the Methods sec-
tion in this article’s Online Repository).
RESULTS
Clinical characteristics and asthma status at school
ageAt school age, 37 of 47 preschool wheezers and 14 of 21 control
subjects were followed up. Questionnaires were completed by 51(75%) of 68 families, and 39 children attended a full research visit(Fig 1). Twelve families would not or could not attend a researchvisit, but all subsequently agreed to answer a telephone question-naire. Seventeen children were lost to follow-up. Fifteen (40%) of37 preschool wheezers and 1 control subject (1/14) had asthma atschool age. There was no difference between children who partic-ipated in the study and those lost to follow-up in terms of sex (P5.77), age at bronchoscopy and EB (P 5 .77), or preschool IgElevel (P 5 .99, see Tables E1-E4 in this article’s Online Reposi-tory at www.jacionline.org). The clinical characteristics of chil-dren followed up at school age are detailed in Table I.
Preschool ASM related to asthma status at school
ageForty children had 1 evaluable biopsy specimen, and 2 children
had 2 evaluable biopsy specimens. Reasons for exclusion were noevaluable biopsy specimen (n5 12), biopsy specimen size of lessthan 0.2 mm2 (n5 7), and no identifiable ASM (n5 7). The intra-class correlation coefficient was 0.78 for the 2 measurement tech-niques used to determine ASM area fraction34 and ASM volumefraction.3,4 The intraobserver repeatability (expressed as the per-centage mean coefficient of variation) was better for ASM mea-sured by using computer-aided analysis (7.5%) compared withpoint and line intersection counting (15%). There was good re-peatability between 2 independent observers for ASM area frac-tion measurements (see Fig E3 in this article’s OnlineRepository at www.jacionline.org).Of 51 children followed up at school age, 32 had an evaluable
EB specimen with ASM visible. Eight of 32 children (7 preschoolwheezers and 1 preschool control subject) had asthma at schoolage, and 24 of 32 (14 preschool wheezers and 10 preschoolcontrol subjects) did not. Children with asthma at school age (n58) had increased preschool ASM area fraction (Fig 2, B, and TableII) and increased ASM volume fraction (median, 0.153 [range,0.094-0.266] vs median, 0.097 [range, 0.02-0.314]; P 5 .016).

FIG 1. Flow diagram showing follow-up at school age (2009-2010) and tests performed in previously
recruited preschool children.
J ALLERGY CLIN IMMUNOL
APRIL 2013
1026 O’REILLY ET AL
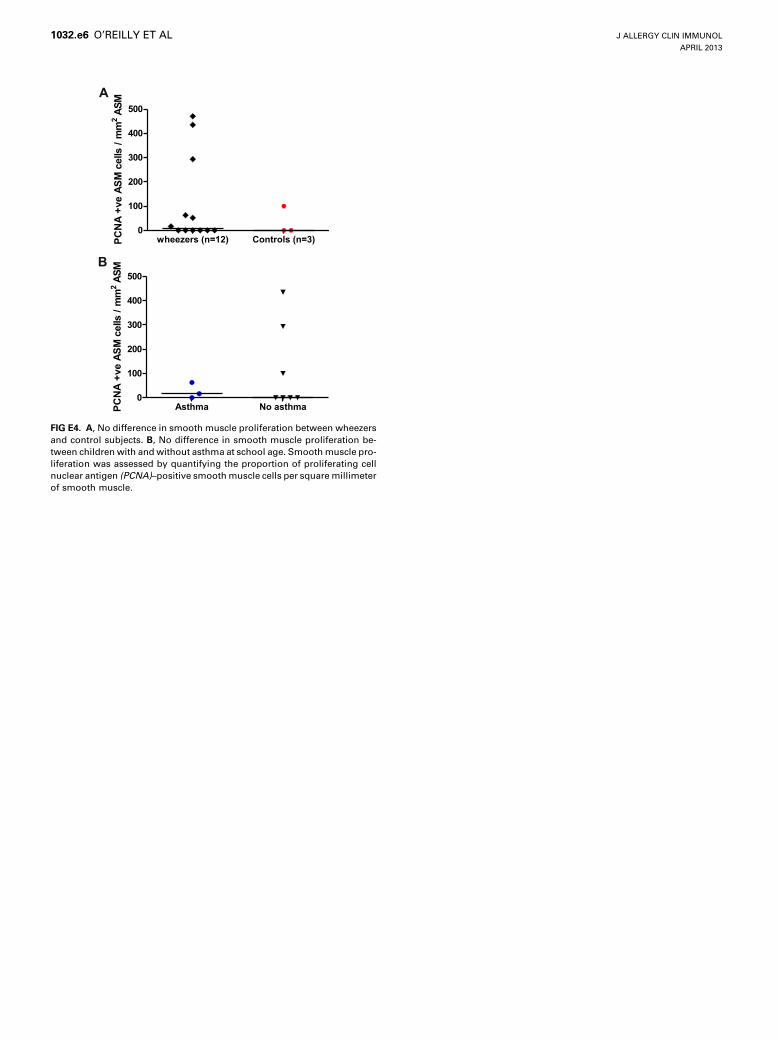
The total subepithelial biopsy area measured was larger in thosewith asthma at school age (median, 0.81 mm2 [range, 0.35-1.27mm2]) when compared with those without asthma at school age(median, 0.52 mm2 [range, 0.26-1.54 mm2]; P5 .043). ASM pro-liferation was assessed based on myocyte proliferating cell nu-clear antigen levels in children with remaining biopsy tissue,and no difference was seen between those with (n5 3) and with-out (n5 7) asthma at school age. However, because the numbersare small, no statistical analysis is feasible (see Fig E4 in this ar-ticle’s Online Repository at www.jacionline.org).
Age and ASMChildren with asthma were older at the time of EB (28 months)
compared with those without asthma at school age (17 months,P 5 .01). To evaluate further the relationship between age andASM, nonwheezing school-aged children who were undergoingclinically indicated bronchoscopy, mainly for evaluation of upperairway problems, had EB specimens taken for research purposes,and the ASM volume fraction was quantified. There was no cor-relation between age and ASM volume fraction in nonwheezingpreschool children (n 5 14) and school-aged children (n 5 13)aged 0.25 to 14.2 years (Spearman r 5 0.027, P 5 .89).
Relationship between preschool ASM and
preschool wheezeAt preschool age, there was no difference in area fraction of
ASM between wheezers and nonwheezing control subjects (P 5.97; Fig 2,A) or ASMvolume fraction betweenwheezers and con-trol subjects (P5 .6). There was also no difference in ASM whenpreschool wheezers were divided into confirmed (n 5 15) or
reported (n 5 13) wheezers based on parental identification ofwheeze on video questionnaires (P 5 .16; see Fig E5, A, in thisarticle’s Online Repository at www.jacionline.org). Only 5 chil-dren with episodic wheeze (ie, wheezing only with colds) hadASM measured at preschool age, and therefore we were unableto assess differences between children with episodic ormultiple-trigger wheezing at preschool age (see Fig E5, B).
Preschool RBM thickness and subepithelial
eosinophils related to asthma status at school ageChildren with severe recurrent wheeze at preschool age
had increased RBM thickness (P5 .009) and subepithelial eosin-ophil numbers (P5 .01) when compared with nonwheezing con-trol subjects at preschool age (Fig 2, C and E). However,preschool RBM thickness (P 5 .16) and subepithelial eosinophildensity (P5 .14) were similar in children who did or did not haveasthma by school age (Fig 2, D and F, and Table II). RBM thick-ness (P5 .12) and subepithelial eosinophil numbers (P5 .44) didnot discriminate asthma when the preschool wheezers were con-sidered alone (see Fig E6 in this article’s Online Repository atwww.jacionline.org).
Preschool smooth muscle mast cell values and
asthma status at school ageTwelve of 32 children did not have smooth muscle in the
sections stained with mast cell tryptase. The number of mast cellsper smooth muscle area was similar in control subjects andwheezers (Fig 2, G). There was no relationship between smoothmuscle mast cells and asthma status at school age (Fig 2, H,and Table II). There was no correlation between ASM mast cells

TABLE I. Clinical characteristics of children followed up at school age
Asthma (n 5 16) No asthma (n 5 35) P value
Male/female sex 11/5 21/14 .54
Birth weight (kg) 3.41 (1.87-4.21) 3.38 (1.6-4.41) .57
Gestation (wk) 39 (30-42) 40 (34-42) .51
Age at bronchoscopy (mo) 28 (3-57) 17 (3-55) .01
Weight at bronchoscopy (kg) 13.35 (5.6-25) 11 (5.45-26.4) .043
Preschool IgE (IU/mL) 70 (1-635) 9 (1-432)* .04
Preschool >_1 positive RAST, no. (%) 6 (37.5) 10 (31.3)* .75
Age at first episode of wheeze (mo) 14 (1.5-24) 6.5 (0.5-66) .21
Wheeze at preschool age 15 22
Confirmed wheezers 11 10
Reported wheezers 4 12
No wheeze 1 13
Parental history of doctor-diagnosed asthma� 13 17� .04
Paternal history of doctor-diagnosed asthma 5 1 .01
Maternal history of doctor-diagnosed asthma 5 7 .28
Age at follow-up (y) 8.2 (6-10.4) 7.3 (5.9-11) .1
Reported wheeze in last 12 mo 16 7
Wheeze pattern
Episodic (with colds) 3 5
Multiple trigger 13 2
Frequency of wheeze
None 0 28
1-3 attacks of wheezing 4 4
4-12 attacks of wheezing 8 2
>12 attacks of wheezing 4 1
Exercise-induced wheeze 13 2
Dry cough at night� 14 7
Wheeze assessed by VQ at school age 12 27
Identified wheeze at school age 9 (75%) 8 (30%)
No. of hospital admissions with wheeze 17 (0-160) 3 (0-20) .005
Use of ICS 13 4
Dose of ICS (mg beclomethasone)§ 400 (200-1200)§ 300 (200-400)
Eczema 12 4 .0001
Allergic rhinitis 7 9 .001
ICS, Inhaled corticosteroid; V/Q, video questionnaire.
Data are reported as the median and range. The Mann-Whitney U test was used for ordinal data, and the Fisher exact test was used for categorical data. Boldface represents
statistically significant results.
*Results not available for 3 children.
�Family history was unknown in 2 children because both were adopted at birth (previously in the control group).
�Dry cough at night apart from a cough associated with a cold or chest infection.
§Or beclomethasone equivalent (2 parents did not know the ICS dose).
J ALLERGY CLIN IMMUNOL
VOLUME 131, NUMBER 4
O’REILLY ET AL 1027
and either ASM area or volume fraction (see Table E5 in thisarticle’s Online Repository at www.jacionline.org).
Using ASM to predict asthma at school age in
preschool wheezersWhen preschool wheezers were considered alone, those in
whom asthma developed had increased ASM area fraction (n5 7;median, 0.127 [range, 0.083-0.156]) comparedwith those inwhomasthma did not develop (n 5 14; median, 0.058 [range, 0.038-0.163]; P5 .006; see Fig E6 in this article’s Online Repository atwww.jacionline.org). The positive predictive value of ASM areafraction of greater than 0.1 at preschool age for asthma at schoolage was 75% (35% to 97%), and the negative predictive valuewas 92% (64% to 100%, Table III).25,26 The area under the receiveroperating curve (ROC) was 0.88 (95% CI, 0.66-0.98; P < .0001;
Fig 3). ASM volume fraction showed similar results, (see Fig E7in this article’s Online Repository at www.jacionline.org).
Exhaled nitric oxide levels, atopy, and lung function
at school ageOf children who attended a research visit at school age, those
with asthma at school age had higher FENO50 values (P 5 .02)and were more likely to have 1 or more positive SPT responses(P 5 .002) when compared with those without asthma (TableIV). There was no difference in spirometric, lung clearance in-dex, or FRC values between children with and without asthmaat school age (Table IV). However, children with asthma didhave increased Scond values, a marker of ventilation inhomogene-ity in the conducting airways (n5 7; 0.043 [range, 0.003-0.06]),when compared with those without asthma (n 5 22; 0.014

Preschool age School age
p=0.97
Wheezers (n=28) Controls (n=14)
0.00
0.05
0.10
0.15
0.20
0.25
sm
oo
th
mu
sc
le / s
ub
ep
ith
eliu
m p=0.007
Asthma (n=8) No Asthma (n=24)
0.00
0.05
0.10
0.15
0.20
0.25
sm
oo
th
mu
sc
le / s
ub
ep
ith
eliu
m
p=0.009
Wheezers (n=37) Controls (n=16)
0
2
4
6
8
RB
M t
hic
kn
es
s (
µm)
p=0.16
Asthma (n=12) No asthma (n=27)
0
2
4
6
8
RB
M t
hic
kn
es
s (
m)
p=0.01
Wheezers (n=29) Controls (n=8)
0
1
2
3
4
Su
be
pit
he
lia
l e
os
ino
ph
ils
(%
)
p=0.14
Asthma (n=8) No asthma (n=19)
0
1
2
3
4
Su
be
pit
he
lia
l e
os
ino
ph
ils
(%
)
p=0.078
Wheezers (n=15) Controls (n=5)
0
100
200
300
400
500
Sm
oo
th
mu
sc
le m
as
t c
ells
/ m
m2
p=0.16
Asthma (n=5) No Asthma (n=10)
0
100
200
300
400
500
Sm
oo
th
mu
sc
le m
as
t c
ells
/ m
m2
Preschool Wheezers Preschool Controls
A B
µ
C D
E F
G H
FIG 2. Preschool airway pathology and its relationship to preschool wheeze and asthma at school age.
A, No difference in ASM area fraction between preschool wheezers and control subjects. B, Increased pre-
school ASM area fraction in school-aged asthmatic subjects. C, Increased RBM thickness in preschool
wheezers. D, No difference in preschool RBM thickness in school-aged asthmatic subjects. E, Increased sub-
epithelial eosinophil numbers at preschool age. F, No difference in preschool subepithelial eosinophil num-
bers in school-aged asthmatic subjects. G, No difference in ASM mast cell numbers between preschool
wheezers and control subjects. H, No difference in ASM mast cell numbers in school-aged asthmatic sub-
jects. Analysis was performed with the Mann-Whitney U test.
J ALLERGY CLIN IMMUNOL
APRIL 2013
1028 O’REILLY ET AL
[range, 20.027 to 0.03]; P 5 .049; Table IV). FENO50 values atschool age correlated with preschool ASM area fraction (Spear-man r 5 0.58, P 5 .01) but showed no relationship with RBMthickness in preschool wheezers (Fig 4).
DISCUSSIONWe report for the first time that ASM, expressed either as area
or volume fraction, was discriminatory for those preschoolwheezers who subsequently had asthma by school age. In

TABLE II. Preschool airway pathology related to the presence or absence of asthma at school age
Asthma No asthma P value
ASM area/subepithelial area n 5 8, 0.12 (0.08-0.16) n 5 24, 0.066 (0.024-0.23) .007
V/v 2 ASM/subepithelium n 5 8, 0.153 (0.094-0.266) n 5 24, 0.097 (0.02-0.314) .016
V/S mm2/mm3 n 5 8, 73.45 (28.3-127.7) n 5 24, 34 (9.3-374) .15
RBM thickness (mm) n 5 12, 4.77 (3.14-7.02) n 5 27, 4.14 (1.21-5.99) .16
Subepithelial eosinophil volume density (%) n 5 8, 1.47 (0-3.33) n 5 19, 0 (0-2.8) .14
ASM mast cells (no./mm2) n 5 5, 22.9 (0-239.2) n 5 10, 91.8 (0-396.6) .16
V/S, Volume fraction of smooth muscle indexed to surface area of RBM; V/v, volume fraction of smooth muscle/subepithelium.
Data are reported as the number of children with available data (n), median, and range. The Mann-Whitney U test was used. Boldface represents statistically significant results.
TABLE III. Sensitivity, specificity, positive and negative predictive values, and likelihood ratios for a proportion of ASM area greater
than 10% in the EB specimen compared with the clinical predictive stringent index and wheeze severity score in preschool wheezers
Sensitivity (%) Specificity (%) NPV (%) PPV (%) P value Likelihood ratio
ASM area >10%* 86 (42.1-99.6) 85.7 (57.1-98.2) 92.3 (63.9-99.8) 75 (34.9-96.8) .003 6
Stringent index25 78.8 (49.2-95.4) 45 (23.1-68.5) 50 (28.2-71.8) 75 (49.2-94.5) .27 1.6
Severity score >626 60 (32.3-83.7) 77.3 (54.6-92.2) 64.3 (35.1-87.2) 73.9 (51.6-89.7) .03 2.6
Castro-Rodriguez stringent predictive index: frequent wheeze plus 1 major or 2 minor criteria (major criteria: parental-doctor diagnosed asthma or doctor-diagnosed eczema in the
child; minor criteria: wheezing apart from colds or peripheral blood eosinophilia).25 Wheeze severity score: 3 to 4 episodes of wheeze plus the number of hospital admissions was
used to approximate the score.26
NPV, Negative predictive value; PPV, positive predictive value.
*ASM was measured by using computer-aided analysis as a proportion of the total subepithelial area.
AUC=0.88
0 20 40 60 80 1000
20
40
60
80
100
100-Specificity%
FIG 3. Area under the receiver operating characteristics curve (AUC) for
ASM area fraction in preschool wheezers for the diagnosis of asthma at
school age was 0.88 (SE, 0.08; 95% CI, 0.66-0.98; P < .0001). CIs are repre-
sented by the broken line, and the area under the curve is represented by
the continuous line.
J ALLERGY CLIN IMMUNOL
VOLUME 131, NUMBER 4
O’REILLY ET AL 1029
contrast, increased RBM thickness and subepithelial eosinophilvalues in children with severe recurrent preschool wheeze werenot discriminatory and might instead be related to currentsymptoms rather than future asthma prognosis. We have alsoshown that preschool ASM mast cells did not predict thedevelopment of asthma at school age. Wheeze at preschool andschool age (in those who attended for a research visit) wasobjectively assessed by using a video questionnaire,13 and subjectretention to school age (75%) was comparable with that seen inother studies (54% to 88%).11,35-38
We appreciate that the necessarily imposed limitations to ourstudy give rise to the need to interpret our results with caution.
ASM massThe proportion of EB specimen ASM in the preschool
wheezers was less than reported in older children and adultswith asthma.2,3 The subgroup of children with asthma at schoolage had 12% (8% to 16%) of the EB specimen subepithelium
occupied byASM,which is similar to the values reported in adults(16% to 18%) with mild-to-moderate asthma.2,39 Further in-creases in ASM have been reported with increasing asthma sever-ity, with 16% to 27% of subepithelial tissue occupied by ASM inschool-aged children with moderate-to-severe asthma3,4 com-pared with 40% in adults with severe asthma.2 The proportionof ASM occupying the subepithelial tissue in the preschoolwheezers and control subjects who did not have asthma was6%, which is similar to that reported for children aged 6 to 16years without lower airway disease (4%)3 but less than that re-ported in adults with no respiratory symptoms (9% to 11.5%).2,34
ASM mast cellsAlthough infiltration of ASM by mast cells is associated with
increased ASM mass in adults,8 there was no significant associa-tion found between smooth muscle and mast cells in our pre-school wheezers. However, we acknowledge that only arelatively small number of the original preschool group (n 520) had sufficient endobronchial tissue with ASM remaining tostain for smooth muscle mast cells (ie, only 15 whowere followedup at school age). Although the numbers of mast cells per ASMarea were much higher for both wheezers and control subjectswhen compared with those seen in adult asthmatic patients, theabsolute values for mast cells seen in ASM were low (median,2 [range, 0-12]) and similar to those reported in adult studies.8
Prediction of future asthmaThe area under the ROC curve, which shows the tradeoff
between sensitivity and specificity for the capacity of preschoolASM to predict future asthma at school age in preschoolwheezers, was high (0.88), but the small numbers had wide CIs.This is comparable with scores for wheeze severity at age 2 yearsin children from Oslo predicting asthma at 10 years, with an areaunder the ROC of 0.78; when this score was applied to our

TABLE IV. Measurements of lung function, airway inflammation, and atopy at school age in children who attended a research visit
Asthma (n 5 12) No asthma (n 5 27) P value
Height (cm) 127.9 (110 to 157) 135.4 (109 to 146.1) .6
Height (z score) 20.13 (23.79 to 2.66) 0.06 (23 to 2.16) .61
Weight (kg) 24.7 (21.5 to 48) 26 (16.7 to 37.1) .64
Weight (z score) 0.26 (21.66 to 3.13) 0.35 (22.07 to 2.81) .98
Children who completed FENO50 11 22
FENO50 (ppb) 13.3 (4.9 to 40.3) 7.08 (2 to 42.6) .02
No. of children with SPTs 12 23
0 positive SPTs 4 20>_1 positive SPTs 8 3 .002>_1 positive SPTs, aeroallergen 7 3 .01>_1 positive SPTs, food allergen 3 0
No. of children with spirometry 12 23
FEV1, z score 20.32 (22.79 to 1.11) 20.59 (23.01 to 2.15) .43
FVC, z score 20.24 (22.14 to 1.15) 20.48 (22.64 to 1.68) .48
FEV1/FVC ratio, z score 0.105 (22.39 to 2.55) 20.4 (22.75 to 2.15) .84
No. of children with MBW 12 24
LCI 7.33 (6.1 to 10.99) 7.24 (6.28 to 10.95) .5
FRC (L) 1.06 (0.75 to 2.09) 1.05 (0.71 to 1.61) .69
No. of children with Scond and Sacin 7 22
Scond 0.043 (0.003 to 0.06) 0.014 (20.027 to 0.03) .049
Sacin 0.08 (0.06 to 0.21) 0.1 (0.028 to 0.62) .97
Data are reported as the median and range. The Mann-Whitney U test and Fisher exact test were used, as appropriate. Boldface represents statistically significant results.
FVC, Forced vital capacity; LCI, lung clearance index; MBW, multiple-breath washout; Sacin, acinar airways inhomogeneity.
µ
FIG 4. Correlation between FENO50 values and RBM thickness at school age (i) and ASM area fraction (ii) inpreschool children with severe wheeze. There is a positive correlation between FENO50 values and ASM area
fraction. There is no correlation between RBM thickness and FENO50 values.
J ALLERGY CLIN IMMUNOL
APRIL 2013
1030 O’REILLY ET AL
preschool wheezers, it resulted in an area under the ROC of 0.70(see Fig E8 in this article’s Online Repository at www.jacionline.org).26 However, a higher severity score was needed to predictasthma in this group of preschool children compared with theOslo cohort (>6 vs >5).26 The median age at follow-up for ourstudy was 8 years; when compared with the Castro-Rodriguezstringent predictive index for asthma at 8 years, an ASM biopsyspecimen proportion of greater than 10% had similar negativepredictive value (93% vs 88%) but improved positive predictivevalue (72% vs 44%).25
Subject numbersThe subject numbers were small because only 32 of 42 with
ASM in EB specimens could be followed up at school age, andonly 8 (25%) of these children had asthma development.
However, there was no difference in terms of age at biopsy, sex,or atopy between thosewhowere analyzed at school age and thosewho were not, such that we do not consider dropouts to haveintroduced significant bias. To our knowledge, this is the onlyprospective study in which preschool children had a bronchos-copy and EB at recruitment and have been followed up to schoolage. Of course, we acknowledge that it would have beeninformative to repeat EBs at school age to compare airwaypathology in preschool and school-aged subjects, but this wasethically impossible in the absence of a clinical indication.
SeverityThewheezers enrolled in the original study had severe wheeze;
otherwise, they would not have undergone bronchoscopy. Thusour data only apply to children with severe preschool wheeze and

J ALLERGY CLIN IMMUNOL
VOLUME 131, NUMBER 4
O’REILLY ET AL 1031
cannot be generalized to hose with milder disease. Moreover, theoverlap in ASM between children who had childhood asthma andthose who did not is too great to be of clinical prognostic value inan individual. However, what this study does suggest is that anearly focus on the mechanisms underlying ASM increase mightprovide a new insight into our understanding of what driveschildren with severe preschool wheeze to have later asthma.
Biopsy sizeThe bronchoscope used to perform biopsies in preschool
children was smaller (ie, 2.8 or 3.6 mm) than that used in adultsand older children (>_4 mm). The instrument channel was corre-spondingly smaller (1.2 vs >_2 mm), and in consequence, theminimum amount of tissue in the biopsy specimen (0.2 mm2) wasless than in studies of adults and older children (1 mm2).
Sample variabilityThere is variability in structural characteristics between and
within EB specimens. The majority of children (40/42) had asingle good-quality biopsy specimen for assessment of ASM. Forthis reason, ASM was analyzed on a per-child basis (the mean ofthe measurements obtained from all sections from the >_1 speci-mens available). However, not all sections from the preschoolchildren that were assessed for ASM were consecutive becausesections had also been stained for analyses of other inflammatorycell populations.
AgeThechildrenwhohadasthmabyschool agewereolder at the time
of EBwhen comparedwith the childrenwho did not have asthma atschool age. Similarly, the children who had asthma at school agehad increased endobronchial tissue measured when compared withthat seen in control subjects. Data on normalASMdevelopment arescanty. However, there was no relationship between age andASM in the preschool and school-aged nonwheezing controlsubjects. A postmortem study has shown that ASM increaseslinearly with airway diameter during infancy and childhood,40 butalthough adults have increased amounts of actual ASMwhen com-pared with children, the proportion of ASM in the airway wallremains similar.41 All biopsy specimens were taken from the third-and fourth-generation peripheral airways in this study.
Lung functionLung function testing was not performed at entrance to the
study because at the time of the original study (2002-2005), therewere no established standards for preschool lung function.13
However, those children with multiple-trigger wheeze at age 4to 5 years42 and asthma at school age had increased ventilation in-homogeneity of the conducting airways. Scond has been shown tobe the most sensitive marker of distal airways disease in both pre-school children with multiple-trigger wheeze and school-agedchildren with asthma.42,43 However, at school age, we had littlesuccess with measuring AHR, and the numbers were too smallto compare with ASM. FENO50, a marker of distal airway inflam-mation, at 4 to 5 years42 and 8 years, correlated with ASM areafraction in preschool wheezers. Although therewas a positive cor-relation between subepithelial eosinophil numbers and FENO50values at age 4 to 5 years,42 none was seen at school age.
Asthma diagnosisDefining asthma in young children is difficult.44 Several chil-
drenwithout asthma reported a dry cough at night (n5 7), wheeze(n 5 7), and use of inhaled corticosteroids (n 5 4), but none ofthese had ever had a doctor’s diagnosis of asthma, and manyhad a history of upper airway noises or comorbid pathology. Ofthe children who did not have asthma at school age, 4 had congen-ital heart disease, 1 had a vascular ring causing some mild airwaycompression, 1 had ulcerative colitis, 1 had non–cystic fibrosisbronchiectasis, and 1 had a diagnosis of scimitar syndrome atschool age. We concede that it is possible we might have misclas-sified some children as nonasthmatic at school age; however, theincrease in FENO50 values and the increased likelihood of 1 ormore positive SPT responses in the asthma group supports the ac-curacy of the diagnosis. Seven of the 8 children given a diagnosisof asthma who had ASM measured were still attending tertiaryservices for asthma management at school age. Longitudinalstudies have suggested that children with severe wheeze earlyin life are more likely to have severe asthma later in life.45 Sixchildren had persistent asthma symptoms despite treatment with800 mg of beclomethasone or greater at the time of follow-up,of whom 4 children were treated for severe asthma at schoolage at the Royal Brompton Hospital (Table I).46
Unfortunately, there is no remaining endobronchial tissue in thisgroup of children to explore further the role of ASM in thedevelopment of asthma. Although we were unable to characterizethe increase in ASM in this group of preschool wheezers, bothsmooth muscle hypertrophy and hyperplasia contribute to theincrease in ASM in adults and school-aged children withasthma.2,3,39,47 Second, it is likely thatASMcells in asthmatic chil-dren are functionally distinct from those in children who do nothave asthma. ASM cells express a wide variety of mediators, inparticular thymic stromal lymphopoietin and IL-33, both of whichare known mediators of airway hyperresponsiveness,48,49 and itmight be that these or other ASM-derived mediators50 are impor-tant in the switch from preschool wheeze to asthma at school age.In conclusion, we have shown, for the first time, that ASM is
increased in those preschool children with severe wheeze who goon to have asthma at school age. The numbers are small andrepresent children with particularly severe wheeze at preschoolage, such that our findings cannot be assumed to be applicable tochildren with less severe wheeze. However, we consider our datato indicate that future studies exploring the mechanisms under-lying the persistence of preschool wheeze and its progression toasthma should focus on ASM.
Key message
d ASM, but not RBM thickness, eosinophilic inflammation,or ASM mast cell numbers discriminate those childrenwith severe recurrent preschool wheeze who go on tohave asthma at school age.
REFERENCES
1. Jeffery PK. Remodeling in asthma and chronic obstructive lung disease. Am J Re-
spir Crit Care Med 2001;164(suppl):S28-38.
2. Benayoun L, Druilhe A, Dombret MC, Aubier M, Pretolani M. Airway structural
alterations selectively associated with severe asthma. Am J Respir Crit Care Med
2003;167:1360-8.
3. Regamey N, Ochs M, Hilliard TN, Muhlfeld C, Cornish N, Fleming L, et al.
Increased airway smooth muscle mass in children with asthma, cystic fibrosis,

J ALLERGY CLIN IMMUNOL
APRIL 2013
1032 O’REILLY ET AL
and non-cystic fibrosis bronchiectasis. Am J Respir Crit Care Med 2008;177:
837-43.
4. Gupta A, Sjoukes A, Richards D, Banya W, Hawrylowicz C, Bush A, et al. Rela-
tionship between serum vitamin d, disease severity, and airway remodeling in chil-
dren with asthma. Am J Respir Crit Care Med 2011;184:1342-9.
5. Tsurikisawa N, Oshikata C, Tsuburai T, Saito H, Sekiya K, Tanimoto H, et al.
Bronchial hyperresponsiveness to histamine correlates with airway remodelling
in adults with asthma. Respir Med 2010;104:1271-7.
6. Kaminska M, Foley S, Maghni K, Storness-Bliss C, Coxson H, Ghezzo H, et al.
Airway remodeling in subjects with severe asthma with or without chronic persis-
tent airflow obstruction. J Allergy Clin Immunol 2009;124:45-51.
7. James AL, Bai TR, Mauad T, Abramson MJ, Dolhnikoff M, McKay KO, et al. Air-
way smooth muscle thickness in asthma is related to severity but not duration of
asthma. Eur Respir J 2009;34:1040-5.
8. Brightling CE, Bradding P, Symon FA, Holgate ST, Wardlaw AJ, Pavord ID. Mast-
cell infiltration of airway smooth muscle in asthma. N Engl J Med 2002;346:
1699-705.
9. Siddiqui S, Mistry V, Doe C, Roach K, Morgan A, Wardlaw A, et al. Airway hyper-
responsiveness is dissociated from airway wall structural remodeling. J Allergy
Clin Immunol 2008;122:335-41.
10. Kaur D, Saunders R, Hollins F, Woodman L, Doe C, Siddiqui S, et al. Mast cell
fibroblastoid differentiation mediated by airway smooth muscle in asthma.
J Immunol 2010;185:6105-14.
11. Martinez FD, Wright AL, Taussig LM, Holberg CJ, Halonen M, Morgan WJ.
Asthma and wheezing in the first six years of life. The Group Health Medical
Associates. N Engl J Med 1995;332:133-8.
12. Morgan WJ, Stern DA, Sherrill DL, Guerra S, Holberg CJ, Guilbert TW, et al. Out-
come of asthma and wheezing in the first 6 years of life: follow-up through adoles-
cence. Am J Respir Crit Care Med 2005;172:1253-8.
13. Saglani S, Payne DN, Zhu J, Wang Z, Nicholson AG, Bush A, et al. Early detection
of airway wall remodeling and eosinophilic inflammation in preschool wheezers.
Am J Respir Crit Care Med 2007;176:858-64.
14. O’Reilly R, Oates T, Zhu J, Jeffery PK, Bush A, Saglani S. Increased reticular
basement membrane thickness but not airway smooth muscle in endobronchial
biopsies of severe preschool wheezers [abstract]. Thorax 2010;65:A2.
15. O’Reilly R, Oates T, Zhu J, Jeffery PK, BushA, Saglani S.More airway smoothmus-
cle in preschool children increases risk of future asthma [abstract]. Presented at the
EuropeanRespiratory SocietyAnnualCongress, September 2011,Amsterdam, 1407.
16. Saglani S, McKenzie SA, Bush A, Payne DN. A video questionnaire identifies
upper airway abnormalities in preschool children with reported wheeze. Arch
Dis Child 2005;90:961-4.
17. Asher MI, Keil U, Anderson HR, Beasley R, Crane J, Martinez F, et al. Interna-
tional Study of Asthma and Allergies in Childhood (ISAAC): rationale and
methods. Eur Respir J 1995;8:483-91.
18. Illi S, von ME, Lau S, Nickel R, Gruber C, Niggemann B, et al. The natural course
of atopic dermatitis from birth to age 7 years and the association with asthma.
J Allergy Clin Immunol 2004;113:925-31.
19. Celedon JC, Milton DK, Ramsey CD, Litonjua AA, Ryan L, Platts-Mills TA, et al.
Exposure to dust mite allergen and endotoxin in early life and asthma and atopy in
childhood. J Allergy Clin Immunol 2007;120:144-9.
20. Arshad SH, Kurukulaaratchy RJ, Fenn M, Matthews S. Early life risk factors for
current wheeze, asthma, and bronchial hyperresponsiveness at 10 years of age.
Chest 2005;127:502-8.
21. Ramsey CD, Gold DR, Litonjua AA, Sredl DL, Ryan L, Celedon JC. Respiratory
illnesses in early life and asthma and atopy in childhood. J Allergy Clin Immunol
2007;119:150-6.
22. Raby BA, Celedon JC, Litonjua AA, Phipatanakul W, Sredl D, Oken E, et al. Low-
normal gestational age as a predictor of asthma at 6 years of age. Pediatrics 2004;
114:e327-32.
23. Celedon JC, Wright RJ, Litonjua AA, Sredl D, Ryan L, Weiss ST, et al. Day care
attendance in early life, maternal history of asthma, and asthma at the age of 6
years. Am J Respir Crit Care Med 2003;167:1239-43.
24. Cane RS, McKenzie SA. Parents’ interpretations of children’s respiratory symp-
toms on video. Arch Dis Child 2001;84:31-4.
25. Castro-Rodriguez JA, Holberg CJ, Wright AL, Martinez FD. A clinical index to
define risk of asthma in young children with recurrent wheezing. Am J Respir
Crit Care Med 2000;162:1403-6.
26. Devulapalli CS, Carlsen KC, Haland G, Munthe-Kaas MC, Pettersen M, Mo-
winckel P, et al. Severity of obstructive airways disease by age 2 years predicts
asthma at 10 years of age. Thorax 2008;63:8-13.
27. Miller MR, Hankinson J, Brusasco V, Burgos F, Casaburi R, Coates A, et al. Stand-
ardisation of spirometry. Eur Respir J 2005;26:319-38.
28. Macleod KA, Horsley AR, Bell NJ, Greening AP, Innes JA, Cunningham S.
Ventilation heterogeneity in children with well controlled asthma with normal
spirometry indicates residual airways disease. Thorax 2009;64:33-7.
29. Horsley AR, Gustafsson PM, Macleod KA, Saunders C, Greening AP, Porteous DJ,
et al. Lung clearance index is a sensitive, repeatable and practical measure of
airways disease in adults with cystic fibrosis. Thorax 2008;63:135-40.
30. Beydon N, Davis SD, Lombardi E, Allen JL, Arets HG, Aurora P, et al. An official
American Thoracic Society/European Respiratory Society statement: pulmonary
function testing in preschool children. Am J Respir Crit Care Med 2007;175:
1304-45.
31. ATS/ERS recommendations for standardized procedures for the online and offline
measurement of exhaled lower respiratory nitric oxide and nasal nitric oxide, 2005.
Am J Respir Crit Care Med 2005;171:912-30.
32. Weiland SK, Bjorksten B, Brunekreef B, Cookson WO, von ME, Strachan DP.
Phase II of the International Study of Asthma and Allergies in Childhood (ISAAC
II): rationale and methods. Eur Respir J 2004;24:406-12.
33. Sullivan P, Stephens D, Ansari T, Costello J, Jeffery P. Variation in the measure-
ments of basement membrane thickness and inflammatory cell number in bronchial
biopsies. Eur Respir J 1998;12:811-5.
34. Niimi A, Torrego A, Nicholson AG, Cosio BG, Oates TB, Chung KF. Nature of
airway inflammation and remodeling in chronic cough. J Allergy Clin Immunol
2005;116:565-70.
35. Caudri D, Wijga A, AS CM, Hoekstra M, Postma DS, Koppelman GH, et al. Pre-
dicting the long-term prognosis of children with symptoms suggestive of asthma at
preschool age. J Allergy Clin Immunol 2009;124:903-10.
36. Henderson J, Granell R, Heron J, Sherriff A, Simpson A, Woodcock A, et al.
Associations of wheezing phenotypes in the first 6 years of life with atopy,
lung function and airway responsiveness in mid-childhood. Thorax 2008;63:
974-80.
37. Kurukulaaratchy RJ, Matthews S, Holgate ST, Arshad SH. Predicting persistent
disease among children who wheeze during early life. Eur Respir J 2003;22:
767-71.
38. Lodrup Carlsen KC, Haland G, Devulapalli CS, Munthe-Kaas M, Pettersen M,
Granum B, et al. Asthma in every fifth child in Oslo, Norway: a 10-year follow
up of a birth cohort study. Allergy 2006;61:454-60.
39. Woodruff PG, Dolganov GM, Ferrando RE, Donnelly S, Hays SR, Solberg OD,
et al. Hyperplasia of smooth muscle in mild to moderate asthma without changes
in cell size or gene expression. Am J Respir Crit Care Med 2004;169:1001-6.
40. Hislop AA, Haworth SG. Airway size and structure in the normal fetal and infant
lung and the effect of premature delivery and artificial ventilation. Am Rev Respir
Dis 1989;140:1717-26.
41. James A, Carroll N. Airway smooth muscle in health and disease; methods of mea-
surement and relation to function. Eur Respir J 2000;15:782-9.
42. Sonnappa S, Bastardo CM, Wade A, Saglani S, McKenzie SA, Bush A, et al.
Symptom-pattern phenotype and pulmonary function in preschool wheezers.
J Allergy Clin Immunol 2010;126:519-26.
43. Keen C, Olin AC, Wennergren G, Gustafsson P. Small airway function, exhaled
NO and airway hyper-responsiveness in paediatric asthma. Respir Med 2011;
105:1476-84.
44. Van Wonderen KE, Van Der Mark LB, Mohrs J, Bindels PJ, van Aalderen WM, Ter
RG. Different definitions in childhood asthma: how dependable is the dependent
variable? Eur Respir J 2010;36:48-56.
45. Phelan PD, Robertson CF, Olinsky A. The Melbourne Asthma Study: 1964-1999.
J Allergy Clin Immunol 2002;109:189-94.
46. Bush A, Saglani S. Management of severe asthma in children. Lancet 2010;376:
814-25.
47. James AL, Elliot JG, Jones RL, Carroll ML, Mauad T, Bai TR, et al. Airway
smooth muscle hypertrophy and hyperplasia in asthma. Am J Respir Crit Care
Med 2012;185:1058-64.
48. Moffatt MF, Gut IG, Demenais F, Strachan DP, Bouzigon E, Heath S, et al. A large-
scale, consortium-based genomewide association study of asthma. N Engl J Med
2010;363:1211-21.
49. Kaur D, Doe C, Woodman L, Wan H, Sutcliffe A, Hollins F, et al. Mast cell-airway
smooth muscle crosstalk: the role of thymic stromal lymphopoietin. Chest 2011
[Epub ahead of print].
50. Yeganeh B, Xia C, Movassagh H, Koziol-White C, Chang Y, Al-Alwan L, et al.
Emerging mediators of airway smooth muscle dysfunction in asthma. Pulm
Pharmacol Ther 2012 [Epub ahead of print].

J ALLERGY CLIN IMMUNOL
VOLUME 131, NUMBER 4
O’REILLY ET AL 1032.e1
METHODS
Preschool wheezersAll children with severe recurrent wheeze aged 3 months to 5 years had
been referred to our tertiary center for further evaluation of symptoms between
2002 and 2005. All children had at least 3 episodes of wheeze (each episode
lasting >3 days) in the previous 6 months, and most of the children had at least
1 acute admission to the hospital with wheeze.Wheeze persisted despite trials
of bronchodilators and in most children either inhaled corticosteroids, oral
corticosteroids, or both. Exclusion criteria were (1) children with isolated
cough without associated noisy breathing, (2) children whose main problem
was recurrent lower respiratory tract infections, (3) children who were
receiving long-term oxygen therapy, and (4) children with chronic lung
disease of prematurity. Children were divided into confirmed or reported
wheezers based on parental identification of wheeze at preschool age.E1
Nonwheezing preschool control subjectsThe majority of nonwheezing control subjects had bronchoscopy for
further assessment of upper airway problems, such as stridor, or to assess the
degree of compression caused by a vascular ring. Parents provided consent for
EBs to be performed for research purposes. Two control subjects with no
respiratory symptoms were recruited from patients undergoing a right-sided
diagnostic cardiac angiogram. Parental consent was obtained to perform
bronchoscopy and research biopsy before angiography.
Fiberoptic bronchoscopy and EBFiberoptic bronchoscopy and EB were performed after achievement of
general anesthesia by using a 2.8-mm or 3.6-mm bronchoscope (Olympus
KeyMed, Southend on Sea, United Kingdom) with a 1.2-mm channel,
allowing 1-mm rat-tooth forceps (Olympus Key Med, serial no. FB-56D-1)
to be used. Up to 4 EB specimens were taken from the third- or fourth-
generation subsegmental bronchi of the right lower lobe. Full blood counts,
IgE levels, and specific RAST results (milk, egg, peanut, house dust mite, cat,
dog, and grass pollens) were obtained from a blood sample taken while the
child was anesthetized.
Recruitment at school ageThe study was approved by the local research ethics committee, and all
procedures were performed with informed parental consent and child assent,
where appropriate.
Spirometry and exhaled nitric oxideFormany children, it was their first attempt at spirometry andmeasurement
of FENO50, and a period of training was necessary. FENO50 values were mea-
sured before spirometry.E2 For the measurement, nitric oxide–free air was in-
haled to near-total lung capacity over a period of 2 to 3 seconds through the
mouthpiece of the instrument. The exhaled nitric oxide value is themean nitric
oxide level during a 3-second nitric oxide plateau. Three acceptable readings
after a period of practice (defined as agreement towithin 10%)were performed
with at least 30-second intervals between maneuvers. FENO50 values were cal-
culated as themean of the plateaus from 3 technically satisfactory exhalations.
Spirometry was performed with a Vitalograph Compact (Vitalograph, Buck-
ingham, United Kingdom). The highest sum of forced vital capacity and
FEV1 of the 3 maneuvers was recorded as per American Thoracic Society/Eu-
ropean Respiratory Society guidelines.E3 All spirometric results were com-
pared with appropriate recent reference ranges and analyzed as z scores.E4
Clinical history at school ageThe study questionnaire used was the International Study of Asthma and
Allergy in Children core questionnaire for asthma, eczema, and allergic
rhinitis.E5 A second questionnaire recorded medication history, including oral
and inhaled corticosteroid use; total number of hospital admissions with
wheeze; presence of household pets; length of time spent in the nursery;
and parental smoking. Parents were also askedwhether their child’s symptoms
weremainly associatedwith colds or allergy or whether theywere triggered by
multiple stimuli. Although information, such as family history of asthma, birth
details, and parental smoking during pregnancy, had previously been recorded,
the answers were rechecked. Both questionnaires were interviewer directed,
and the answers were recorded by the interviewer. Current eczemawas defined
as a positive response to both of the following questions: ‘‘Has your child ever
had an itchy rash which was coming and going for at least 6 months?’’ and
‘‘Has your child had this itchy rash at any time in the last 12 months?’’ Current
allergic rhinitis was defined as a positive response to the following question:
‘‘In the past 12months, has your child had a problemwith sneezing, or a runny,
or a blocked nose when he/she did not have a cold or the flu?’’
Video questionnaire at school ageParents were shown amodified video questionnairewith 4 clips: (1) wheeze
(male, 6 years), (2) nasal upper respiratory noises (female, 10 months), (3) wet
cough (male, 7 years), and (4) stridor (male, 4 years). Video clips 1 and 2 were
shown at preschool and school age. The third and fourth video clips were
changed from those used at preschool age, which showed children aged 6 and
10 months, to more age-appropriate examples of stridor and wet cough. All
video clips had been previously validated.E6 Parents were again asked ‘‘Which
if any of these noises does your childmake?’’ Theywere also asked the follow-
ing: ‘‘Has your child made any of these noises in the past?’’ They were free to
choose 1 or more video clips.
School-aged nonwheezing control subjectsTo assess the relationship between age and ASM, school-aged children
(n 5 13; age, 5.9-14.2 years) had ASM measured by using point and line
intersection counting (by C.J.B.). Children had clinically indicated bronchos-
copy for evaluation of recurrent croup or a barking cough (n 5 6), noisy
breathing (n 5 1), stridor (n 5 2), and shortness of breath (n 5 1).E7 Three
children had bronchoscopy for investigation of hemoptysis but had normal an-
atomic appearances on bronchoscopy. All parents consented to EB for re-
search purposes. EB specimens were processed and stained in an identical
manner to the preschool EB specimens.
Asthma predictive indexesClinical data at preschool age were used to classify preschool wheezers by
using the Castro-Rodriguez stringent clinical predictive index of frequent
wheeze plus 1 major or 2 minor criteria (major criteria: parental doctor-
diagnosed asthma or doctor-diagnosed eczema in the child; minor criteria:
wheezing apart from colds or peripheral blood eosinophilia).E8 Frequent
wheeze for this study was defined as a score of greater than 3 at both the
year 2 and year 3 wheeze surveys (scale, 1-5; from ‘‘very rarely’’ to ‘‘on
most days’’). A history of doctor-diagnosed allergic rhinitis had not been re-
corded, and therefore wheezing apart from colds or peripheral blood eosino-
philia was used as the minor criteria. All children had at least 3 episodes of
wheeze at the time of the EB; however, the exact number was not recorded.
For application of the wheeze severity score, 3 to 4 episodes of wheeze plus
the number of hospital admissions was used to approximate the score.E9
Both clinical predictive indexes were compared with current asthma at
school age.
Biopsy specimen processing and immunostainingUp to 4 EB specimens were immersed in 10% formal saline and processed
to paraffin blocks between 4 and 24 hours after fixation. Five-micrometer-
thick sections were taken at 25- to 50-mm step intervals depending on the
biopsy specimen size and were stained with hematoxylin and eosin to assess
RBM thickness and ASM.Monoclonal antibody was applied, which had been
raised from mice against human intracellular isotopes to sections, for
eosinophil protein X (EG2; Pharmacia & Upjohn Diagnostics AB, Uppsala,
Sweden) and mast cells (mast cell tryptase; clone AA1, Dako, Glostrup,
Denmark).
Evaluable biopsy specimensEvaluable biopsy specimens were those fulfilling the following criteria: (1)
presence of epithelium, RBM, and associated subepithelial tissue and (2)
minimal crush artifact, edema, or blood within the biopsy specimen.

REFERENCES
E1. Saglani S, Payne DN, Zhu J, Wang Z, Nicholson AG, Bush A, et al. Early detec-
tion of airway wall remodeling and eosinophilic inflammation in preschool
wheezers. Am J Respir Crit Care Med 2007;176:858-64.
E2. Silkoff PE, Wakita S, Chatkin J, Ansarin K, Gutierrez C, Caramori M, et al. Ex-
haled nitric oxide after beta2-agonist inhalation and spirometry in asthma. Am J
Respir Crit Care Med 1999;159:940-4.
E3. Miller MR, Hankinson J, Brusasco V, Burgos F, Casaburi R, Coates A, et al.
Standardisation of spirometry. Eur Respir J 2005;26:319-38.
E4. Stanojevic S, Wade A, Stocks J, Hankinson J, Coates AL, Pan H, et al. Reference
ranges for spirometry across all ages: a new approach. Am J Respir Crit Care
Med 2008;177:253-60.
E5. Asher MI, Keil U, Anderson HR, Beasley R, Crane J, Martinez F, et al. Interna-
tional Study of Asthma and Allergies in Childhood (ISAAC): rationale and
methods. Eur Respir J 1995;8:483-91.
E6. Cane RS, McKenzie SA. Parents’ interpretations of children’s respiratory symp-
toms on video. Arch Dis Child 2001;84:31-4.
E7. Bossley CJ, Fleming L, Gupta A, Regamey N, Frith J, Oates T, et al. Pediatric
severe asthma is characterized by eosinophilia and remodeling without T(H)2 cy-
tokines. J Allergy Clin Immunol 2012;129:974-82.
E8. Castro-Rodriguez JA, Holberg CJ, Wright AL, Martinez FD. A clinical index to
define risk of asthma in young children with recurrent wheezing. Am J Respir
Crit Care Med 2000;162:1403-6.
E9. Devulapalli CS, Carlsen KC, Haland G, Munthe-Kaas MC, Pettersen M, Mo-
winckel P, et al. Severity of obstructive airways disease by age 2 years predicts
asthma at 10 years of age. Thorax 2008;63:8-13.
E10. Sullivan P, Stephens D, Ansari T, Costello J, Jeffery P. Variation in the measure-
ments of basement membrane thickness and inflammatory cell number in bron-
chial biopsies. Eur Respir J 1998;12:811-5.
E11. Regamey N, Ochs M, Hilliard TN, Muhlfeld C, Cornish N, Fleming L, et al. In-
creased airway smooth muscle mass in children with asthma, cystic fibrosis, and
non-cystic fibrosis bronchiectasis. Am J Respir Crit Care Med 2008;177:837-43.
J ALLERGY CLIN IMMUNOL
APRIL 2013
1032.e2 O’REILLY ET AL
Measurement of RBM thickness and subepithelial
eosinophilsRBM thickness and subepithelial eosinophils were remeasured while
blinded to the children’s clinical history (by R.O.). The geometric mean of 40
measurements taken 20 mm along the RBM was used to represent the mean
thickness for that biopsy specimen.E1,E10 Volume density of subepithelial eo-
sinophils was measured by using point counting.E1 Areas of smooth muscle,
vessels, and glands were excluded.
Measurement of ASMASM was measured in 2 ways, the first using computer-aided image
analysis and the second using stereologic techniques.
Method 1. ASM area and total subepithelial area were measured at a
3100 magnification by drawing around the outer limits of the smooth
muscle bundles and the subepithelial area of the biopsy specimen (Fig E1).
The subepithelial and ASM area was then calculated by using computer-
aided image analysis. ASM was then expressed as a fraction of the total sub-
epithelial area.
Method 2. ASM volume fraction was also measured by using a
stereologic technique, namely point and line intersection counting. AWeibel
(M168) grid was placed on the biopsy specimen at random and moved
systematically until thewhole specimenwasmeasured (Fig E2). ASM volume
fraction was measured at 3200 magnification and expressed as a fraction of
the total number of points falling on smooth muscle over the total number
of points falling on the subepithelium. The formula used to calculate this
was as follows:
Vvðsm=subepitheliumÞ5 �+ points on ASM
��
�+ points on subepithelial tissue
�:
ASM volume fraction was also indexed to the surface area of the RBM
by counting the number of lines intersecting the apical surface of theRBM.The
following formula was used:
Volume fraction of ASM indexed to surface area of RBM:
V=S ðsm=rbmÞ5 �+ points on ASM3 1½p���
�23 + line intersections with RBM
�;
where l(p) denotes the length per point (68 mm, Fig E9).E11

FIG E1. Smooth muscle bundles were traced with a computer mouse, and
then the area was calculated by using computer-aided analysis. ASM was
represented as a fraction of the total subepithelial area (scale not shown:
image shown for illustration purposes).
J ALLERGY CLIN IMMUNOL
VOLUME 131, NUMBER 4
O’REILLY ET AL 1032.e3

FIG E2. Smooth muscle volume fraction was quantified by using point and line intersection counting.
AWeibel grid (M168) was overlaid at the section, and ASMwasmeasured at3200magnification. The length
between 2 points was 68 mm.
J ALLERGY CLIN IMMUNOL
APRIL 2013
1032.e4 O’REILLY ET AL

0.05 0.10 0.15 0.20 0.25
-0.25
0.00
0.25
+2SD
-2SD
Bias
Mean of measurements 1&2
Differen
ce o
f m
easu
rem
en
t 1&
2
FIG E3. A Bland-Altman plot of ASM area fraction measurements between
observer 1 and observer 2. Good repeatability between ASM area fraction
measurements was shown between observer 1 and observer 2.
J ALLERGY CLIN IMMUNOL
VOLUME 131, NUMBER 4
O’REILLY ET AL 1032.e5
wheezers (n=12) Controls (n=3)
0
100
200
300
400
500
PC
NA
+
ve A
SM
cells / m
m2
AS
M
Asthma No asthma
0
100
200
300
400
500
PC
NA
+
ve A
SM
cells / m
m2
AS
M
A
B
FIG E4. A, No difference in smooth muscle proliferation between wheezers
and control subjects. B, No difference in smooth muscle proliferation be-
tween children with andwithout asthma at school age. Smoothmuscle pro-
liferation was assessed by quantifying the proportion of proliferating cell
nuclear antigen (PCNA)–positive smoothmuscle cells per squaremillimeter
of smooth muscle.
J ALLERGY CLIN IMMUNOL
APRIL 2013
1032.e6 O’REILLY ET AL

p=0.16
CW (n=15) RW (n=13)
0.00
0.05
0.10
0.15
0.20
sm
oo
th
m
uscle
/ su
bep
ith
eliu
m
p=0.33
Multiple trigger (n=23) Episodic (n=5)
0.00
0.05
0.10
0.15
0.20
sm
oo
th
m
uscle
/ su
bep
ith
eliu
m
A
B
FIG E5. There was no difference between ASM area fraction in confirmed
(CW) and reported (RW) wheezers (A) or in multiple-trigger or episodic (vi-
ral) wheezers (B) at preschool age. The Mann-Whitney U test was used.
J ALLERGY CLIN IMMUNOL
VOLUME 131, NUMBER 4
O’REILLY ET AL 1032.e7

p=0.006
Asthma (n=7) No asthma (n=14)
0.00
0.05
0.10
0.15
0.20
sm
/ su
bep
ith
eliu
m
p=0.12
Asthma (n=11) Asthma (n=18)
0
2
4
6
8
RB
M t
hic
kn
es
s (
m)
p=0.44
Asthma (n=8) Asthma (n=13)
0
1
2
3
4
Su
be
pit
he
lia
l e
os
ino
ph
ils
(%
)µ
A
B
C
FIG E6. ASM area fraction is increased in preschool wheezers with asthma
at school age (A), but there was no difference in RBM thickness (B) or sub-
epithelial eosinophil numbers (C) between preschool wheezers who did
and did not have asthma at school age. TheMann-WhitneyU test was used.
J ALLERGY CLIN IMMUNOL
APRIL 2013
1032.e8 O’REILLY ET AL

AUC=0.79
0 20 40 60 80 1000
20
40
60
80
100
100-Specificity%
FIG E7. Receiver operating characteristics curve for ASM volume fraction
measured by using point and line intersection counting in preschool
wheezers related to asthma at school age (area under the curve [AUC],0.79; SE, 0.08; 95% CI, 0.61-0.91; P 5 .0008). CIs are represented by the bro-ken line, and the area under the curve was represented by the continuous
line.
J ALLERGY CLIN IMMUNOL
VOLUME 131, NUMBER 4
O’REILLY ET AL 1032.e9

AUC=0.70
0 20 40 60 80 1000
20
40
60
80
100
100-Specificity%
FIG E8. Receiver operating characteristics curve for wheeze severity score
related to asthma at school age (area under the curve [AUC], 0.7; SE, 0.08;95% CI, 0.53-0.84; P 5 .01) in preschool wheezers recruited from the Royal
Brompton Hospital from 2002-2005. CIs are represented by the broken line,and the area under the curve was represented by the continuous line.
J ALLERGY CLIN IMMUNOL
APRIL 2013
1032.e10 O’REILLY ET AL

p=0.24
Wheezers (n=28) Controls (n=13)
0
100
200
300
400
V/S
(rb
m/ su
bep
ith
eliu
m)
m2/
m3
p=0.15
Asthma (n=8) No asthma (n=24)
0
100
200
300
400
V/S
(rb
m/ su
bep
ith
eliu
m)
m2/
m3
µµ
µµ
A
B
FIG E9. No difference in volume fraction of ASM indexed to surface area of
RBM between preschool wheezers and control subjects (A) and children
with and without asthma at school age (B). The Mann-Whitney U test was
used. V/S, Volume fraction of smooth muscle indexed to surface area of
RBM.
J ALLERGY CLIN IMMUNOL
VOLUME 131, NUMBER 4
O’REILLY ET AL 1032.e11
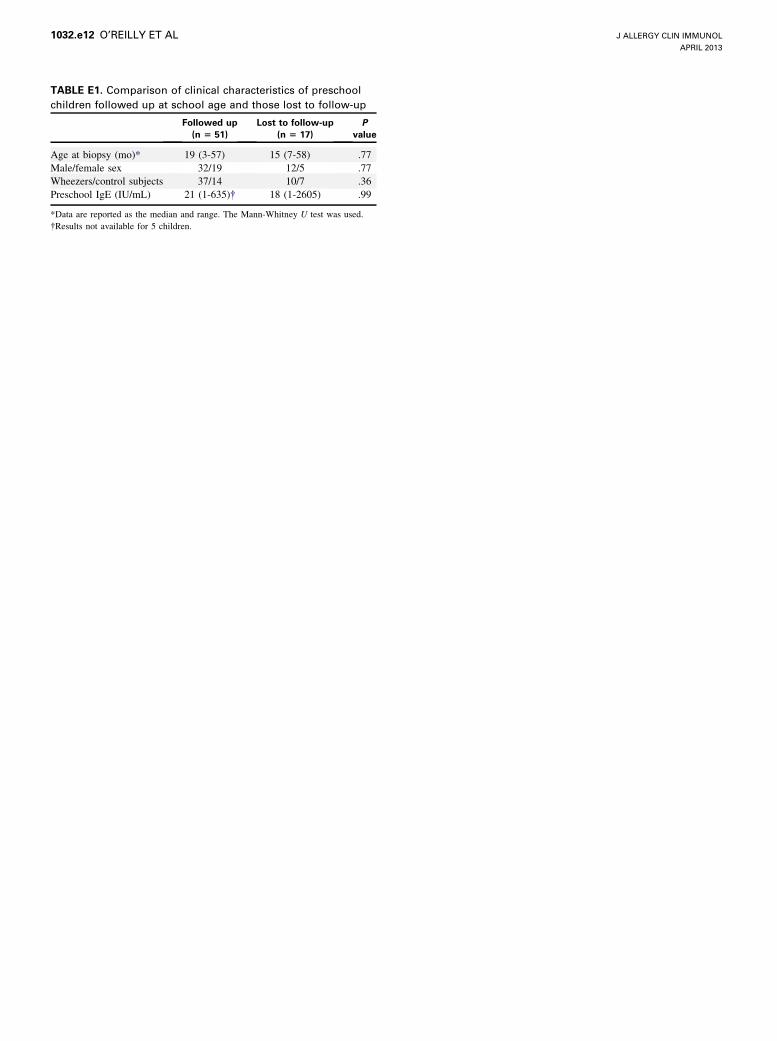
TABLE E1. Comparison of clinical characteristics of preschool
children followed up at school age and those lost to follow-up
Followed up
(n 5 51)
Lost to follow-up
(n 5 17)
P
value
Age at biopsy (mo)* 19 (3-57) 15 (7-58) .77
Male/female sex 32/19 12/5 .77
Wheezers/control subjects 37/14 10/7 .36
Preschool IgE (IU/mL) 21 (1-635)� 18 (1-2605) .99
*Data are reported as the median and range. The Mann-Whitney U test was used.
�Results not available for 5 children.
J ALLERGY CLIN IMMUNOL
APRIL 2013
1032.e12 O’REILLY ET AL

TABLE E2. Comparison of clinical characteristics of children with
and without ASM on evaluable EB specimens
ASM (n 5 49) No ASM (n 5 7) P value
Age at biopsy (mo)* 19 (3-58) 13 (6-55) .39
Male/female sex 31/18 3/4 .42
Wheezers/control subjects 34/15 4/3 .67
Preschool IgE (IU/mL) 16 (1-635)� 17 (2-559) .89
*Data are reported as the median and range. The Mann-Whitney U test was used.
�Results not available for 3 children.
J ALLERGY CLIN IMMUNOL
VOLUME 131, NUMBER 4
O’REILLY ET AL 1032.e13

TABLE E3. Comparison of clinical characteristics of children
followed up at school age with ASM on EB and those who were
either lost to follow-up or did not undergo ASM on EB
Followed up
(n 5 32)
Lost to follow-up
(n 5 36)
P
value
Age at biopsy (mo)* 18.5 (3-57) 20 (3-58) .5
Male/female sex 19/13 25/11 .45
Wheezers/control subjects 21/11 26/10 .6
Preschool IgE (IU/mL) 28.5 (1-635)� 17 (1-2605)� .99
*Data are reported as the median and range. The Mann-Whitney U test was used.
�Results not available for 2 children.
�Results not available for 3 children.
J ALLERGY CLIN IMMUNOL
APRIL 2013
1032.e14 O’REILLY ET AL

TABLE E4. Comparison of clinical characteristics of children
followed up at school age by research visit and by telephone
questionnaire
Research visit
(n 5 39)
Telephone
questionnaire
(n 5 12)
P
value
Age at biopsy (mo)* 18 (3-57) 32.5 (3-55) .36
Male/female sex 14/15 8/4 .32
Wheezers/control subjects 27/12 10/2 .47
Preschool IgE (IU/mL) 21 (1-635)� 27 (1-559)� .75
*Data are reported as the median and range. The Mann-Whitney U test was used.
�Results not available for 2 children.
�Results not available for 3 children.
J ALLERGY CLIN IMMUNOL
VOLUME 131, NUMBER 4
O’REILLY ET AL 1032.e15
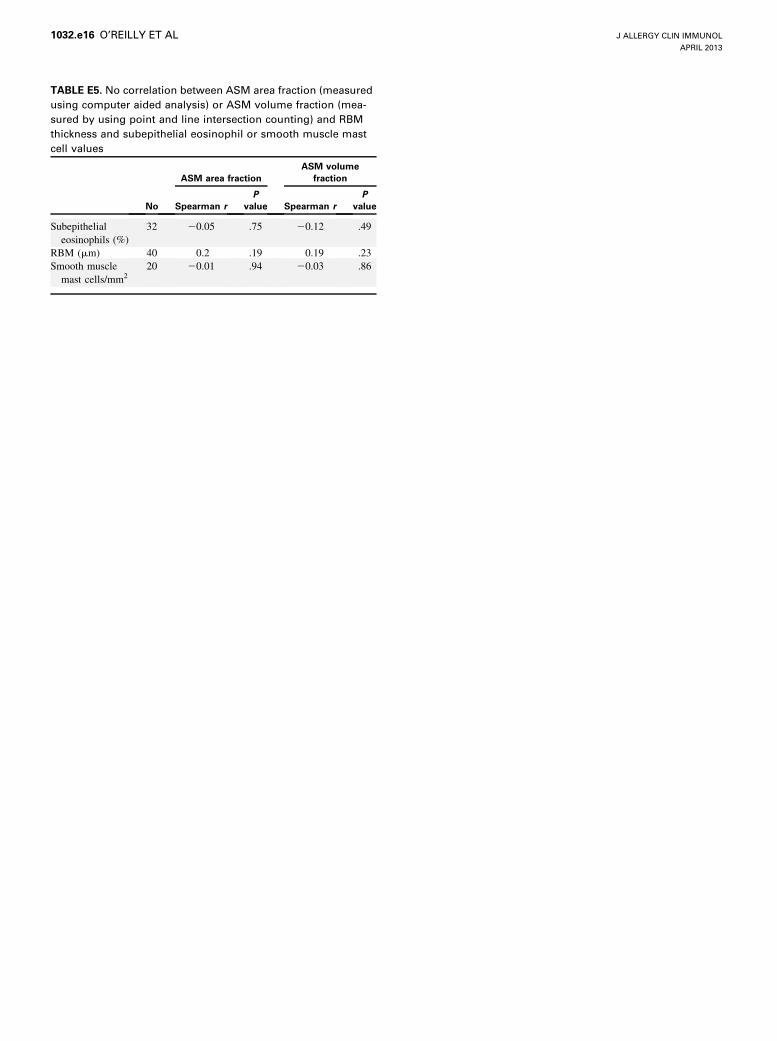
TABLE E5. No correlation between ASM area fraction (measured
using computer aided analysis) or ASM volume fraction (mea-
sured by using point and line intersection counting) and RBM
thickness and subepithelial eosinophil or smooth muscle mast
cell values
No
ASM area fraction
ASM volume
fraction
Spearman r
P
value Spearman r
P
value
Subepithelial
eosinophils (%)
32 20.05 .75 20.12 .49
RBM (mm) 40 0.2 .19 0.19 .23
Smooth muscle
mast cells/mm220 20.01 .94 20.03 .86
J ALLERGY CLIN IMMUNOL
APRIL 2013
1032.e16 O’REILLY ET AL