increased proportion of the cd56bright nk cell subset in patients chronically infected with...
TRANSCRIPT

Journal of Medical Virology 82:568–574 (2010)
Increased Proportion of the CD56bright NK CellSubset in Patients Chronically Infected WithHepatitis C Virus (HCV) Receiving Interferon-aand Ribavirin Therapy
Silvia Lee,1,2* Mark W. Watson,3 James P. Flexman,1 Wendy Cheng,4 Talia Hammond,2
and Patricia Price2,5
1Department of Microbiology and Infectious Disease, Royal Perth Hospital, Perth, Western Australia, Australia2School of Pathology and Laboratory Medicine, University of Western Australia, Crawley, Western Australia, Australia3Centre for Clinical Immunology & Biomedical Statistics, Royal Perth Hospital, Perth, Western Australia, Australia4Department of Gastroenterology and Hepatology, Royal Perth Hospital, Perth, Western Australia, Australia5Clinical Immunology and Immunogenetics, Royal Perth Hospital, Perth, Western Australia, Australia
Natural killer (NK) cells are implicated in theregulation of a protective immune response inpatients chronically infected with hepatitis Cvirus (HCV), but effects of interferon-a/ribavirintherapy on NK cell subsets and the consequencesof viral clearance during therapy remain unclear.Samples were collected from chronically infectedpatients (n¼34) at baseline and from a subsetafter 3–10 months on pegylated interferon-a andribavirin therapy (n¼ 19). NK cells present incryopreserved PBMC were characterized by flowcytometry. Before therapy, the frequency ofCD3�CD56þ NK cells was lower in patients thanuninfected controls. Therapy increased propor-tions of CD56bright NK cells. Frequencies ofCD56dim NK cells declined slightly while perforinand CD16 expression on CD56dim NK cellsdecreased compared to baseline samples. Eval-uation of NK cell subsets at baseline did notidentify patients able to achieve sustained viro-logical response following therapy. However,therapy may promote the expansion of NK cellsable to produce interferon-g, while minimizingcytotoxicity to limit liver damage. J. Med. Virol.82:568–574, 2010. � 2010 Wiley-Liss, Inc.
KEY WORDS: HCV; therapy; natural killercells; flow cytometry
INTRODUCTION
Current therapy for hepatitis C virus (HCV) infectioncomprises pegylated interferon-a (pegIFN-a) with theguanosine analog, ribavirin. Sustained virologicalresponses (SVRs) are achieved in 70–80% of patientsinfected with HCV genotype 2 or 3 and 40–50% ofpatients infected with HCV genotype 1 [Deutsch and
Hadziyannis, 2008]. In addition to their antiviralactivities, IFN-a and ribavirin can modulate innateand adaptive immune responses, including naturalkiller (NK) cells [Feld and Hoofnagle, 2005].
NK (CD3�CD56þ) cells mediate protective innateimmune responses against viral infections. Their fre-quencies may decline in chronic HCV disease [Morish-ima et al., 2006; Golden-Mason et al., 2008], thoughother investigators challenge these results [Pernolletet al., 2002; Lin et al., 2004; Gonzalez et al., 2008]. Thismay reflect variations in the methods used to identifyNK cells. NK cells with different functions can bedistinguished by their expression of CD56 [Cooperet al., 2001]. CD56dim NK cells account for >90% ofperipheral NK cells and possess perforin and granzymegranules essential for cytotoxic activity [Cooper et al.,2001]. CD56bright NK cells are weakly cytotoxic butare more efficient producers of IFN-g [Poli et al., 2009].Here NK cell subsets were investigated before andduring therapy in patients with and without a SVR.
PATIENTS AND METHODS
Patients
Patients chronically infected with HCV were recruitedfrom Royal Perth Hospital (Western Australia). HCVinfection was diagnosed by third-generation enzyme-linked immunosorbent assay (ELISA) for antibodies to
Grant sponsor: Schering-Plough Pty Limited, North Ryde,NSW.
*Correspondence to: Silvia Lee, Level 2, MRF Building, Rear50 Murray Street, Perth, Western Australia 6000, Australia.E-mail: [email protected]
Accepted 1 December 2009
DOI 10.1002/jmv.21742
Published online in Wiley InterScience(www.interscience.wiley.com)
� 2010 WILEY-LISS, INC.

HCV and confirmed by qualitative reverse transcriptasepolymerase chain reaction (RT-PCR) for HCV RNA inserum (Cobas Amplicor HCV Test, Roche Diagnostics,Branchburg, NJ). All patients were negative for hep-atitis B (HBV) surface antigens and antibodies againstHIV. Peripheral blood mononuclear cells (PBMC) werecollected from 34 patients before treatment. Sampleswere also available for 19 of the 34 patients duringtherapy [median time on therapy 5 (3–10) months].PBMC were isolated by Ficoll density gradient centri-fugation and cryopreserved in 10% DMSO and 90%FCS. All patients commenced pegIFN-a and ribavirin(Pegasys, Roche, Dee Why, NSW, Australia, or Pega-tron, Schering-Plough, North Ryde, NSW, Australia).Patients with HCV genotypes 1 or 4 were treated for48 weeks and those with genotypes 2 or 3 were treatedfor 24 weeks. Healthy individuals with no evidenceof exposure to HIV or HCV were included as controls [42(21–73 years); 7 males, 9 females]. The study wasapproved by the Royal Perth Hospital Research Ethicscommittee, and all patients and controls gave writteninformed consent.
Detection of HCV RNA and HCV Genotyping
Sera were stored at �808C. Viral RNA was extractedusing the QIAamp Viral RNA Mini-Kit (Qiagen, Valencia,CA). HCV genotype was determined using the Line ProbeAssay (Inno-LiPA, Innogenetics, Gent, Belgium) or byreal-time PCR and melting curve analysis using FRETprobes [Bullock et al., 2002]. HCV viral load was assessedusing specific primers for the conserved 50UTR region[Castelain et al., 2004].
Liver Biopsy
All patients underwent a liver biopsy prior to treat-ment. Necroinflammatory activity and fibrosis wereevaluated using the Scheuer scoring systems [Bedossaand Poynard, 1996]. Fibrosis was staged as: F0, nofibrosis; F1, portal fibrosis without septa; F2, portalfibrosis with few septa; F3, fibrosis with architecturaldistortion but no obvious cirrhosis; F4, cirrhosis.
Flow Cytometry
To detect perforin, cells were incubated (15 min) withmAbs CD8-APC-Cy7, CD16-PE-Cy7, CD3-APC (BDBiosciences, San Jose, CA) and CD56-PE (CoulterImmunotech, Marseille, France). Cells were thenwashed, fixed, and permeabilized using Cytofix/Cyto-perm KitTM and incubated for 30 min at 48C withPerforin-FITC. Stained cells were analyzed on a FACS-CantoTM (Becton Dickinson, San Jose, CA). At least200,000 events were acquired and analyzed usingFlowJo (Treestar, San Carlos, CA). Lymphocytes wereidentified by forward and side scatter (FSC and SSC).
Statistics
Statistical analyses were performed using PrismVersion 5.01 (Graphpad Software, San Diego, CA).
Differences were evaluated using Mann–Whitney test.Correlations were assessed using Spearman’s rankcorrelation coefficient. P-values <0.05 were consideredsignificant and 0.05<P< 0.10 is noted. Data in figuresare presented as box and whisker plots showing median,25th and 75th percentiles, and range.
RESULTS
HCV Disease Reduced NK Frequencies ButTherapy Expanded the CD56bright NK Cell Subset
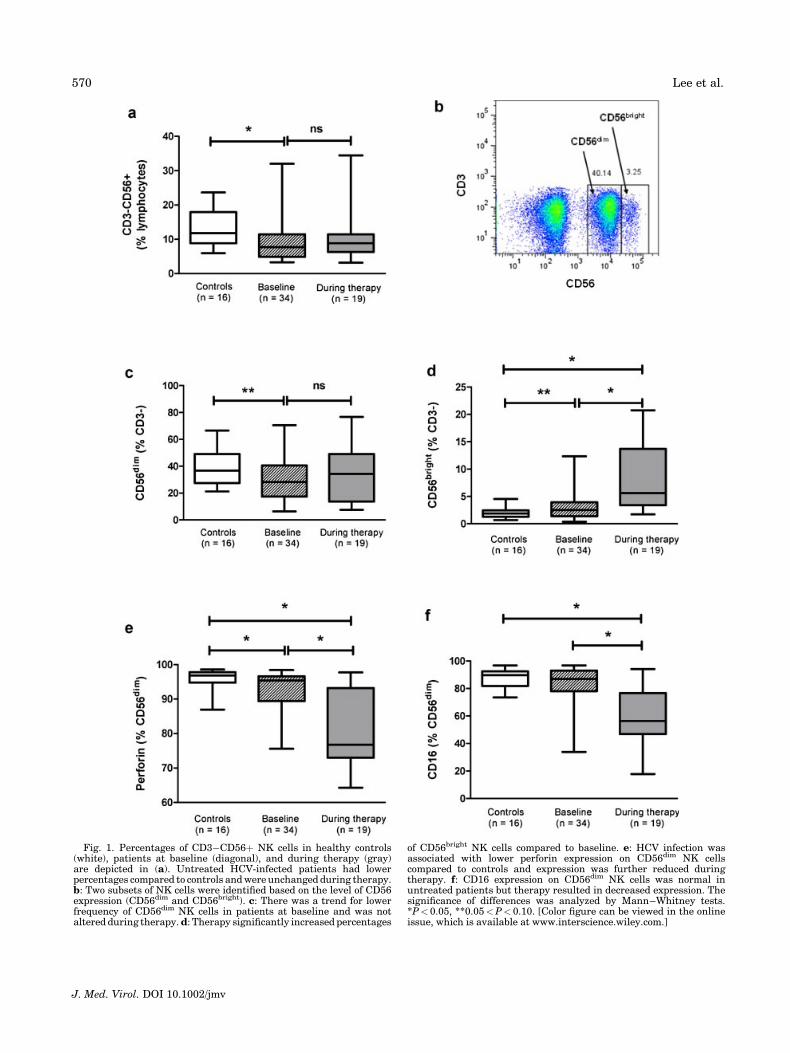
We first determined frequencies of NK cells inchronically HCV-infected patients before pegIFN-a/ribavirin therapy (n¼ 34). Analysis of CD3�CD56þNK cells by flow cytometry showed that untreatedpatients had significantly lower proportions comparedto age- and sex-matched healthy controls (n¼ 16) [7.7%(3.3–32%) vs. 12% (5.9–24%), P¼ 0.02] (Fig. 1a). NKcells can be classified into two subsets based on the levelof CD56 expression [Cooper et al., 2001] as shown inFigure 1b. Frequencies of CD56dim NK cells were low inuntreated patients [28% (6.4–71%) vs. 37% (21–67%),P¼ 0.08] (Fig. 1c). Accordingly, the percentage ofCD56bright NK cells was slightly higher than controls[2.5% (0.4–12%) vs. 1.9% (0.7–4.5%), P¼0.07] (Fig. 1d).The frequency of CD56dim NK cells expressing CD16was similar in untreated patients and controls [87%(34–97%) vs. 90% (74–97%)] but perforin expressionwas significantly decreased on CD56dim NK cells fromuntreated patients compared to controls [95% (76–98%)vs. 97% (87–99%), P¼ 0.02].
Samples were available from 19 of the 34 patientsduring their treatment with pegIFN-a/ribavirin therapy[median (range) time on therapy 6 (3–10) months].These patients were similar to the parent group (by allparameters tested) at baseline, but had lower HCV RNAlevels (P<0.0001) and serum alanine aminotransferase(ALT) levels (P<0.0001) than untreated patients whentested on therapy (Table I). Proportions of circulatingCD3�CD56þ NK cells remained unchanged (Fig. 1a)but absolute counts were significantly lower duringpegIFN-a/ribavirin therapy compared to baseline [211(76–1,440) vs. 126 (62–655), P¼0.012]. We observedhigher percentages of CD56bright NK cells in patients ontreatment [5.6% (1.7–21%)] compared to baseline [2.5%(0.4–12%), P<0.0001] and controls [1.9% (0.7–4.5%),P< 0.0001] (Fig. 1d). Absolute numbers of CD56bright
NK cells were also increased during therapy [17 (2.3–49) vs. 28 (9.3–84), P¼0.039]. Expansion of proportionsof CD56bright NK cells was not associated with dimin-ished CD56dim population, with no difference in thepercentages reported before and during therapy [28%(6.4–71%) vs. 34% (7.6–77%)] (Fig. 1c). However,absolute numbers were significantly decreased [186(45–698) vs. 90 (36–499), P¼0.005]. Despite similarproportions of CD56dim NK cells, therapy reduced thefrequencies of CD56dim NK cells expressing perforin[95% (76–98%) vs. 77% (64–98%), P¼ 0.0008] and CD16[87% (34–97%) vs. 56% (18–94%), P<0.0001] (Fig. 1e,f).A similar trend was also observed for absolute counts
J. Med. Virol. DOI 10.1002/jmv
NK Cells in HCV Infection 569
J. Med. Virol. DOI 10.1002/jmv
Fig. 1. Percentages of CD3�CD56þ NK cells in healthy controls(white), patients at baseline (diagonal), and during therapy (gray)are depicted in (a). Untreated HCV-infected patients had lowerpercentages compared to controls and were unchanged during therapy.b: Two subsets of NK cells were identified based on the level of CD56expression (CD56dim and CD56bright). c: There was a trend for lowerfrequency of CD56dim NK cells in patients at baseline and was notaltered during therapy. d: Therapy significantly increased percentages
of CD56bright NK cells compared to baseline. e: HCV infection wasassociated with lower perforin expression on CD56dim NK cellscompared to controls and expression was further reduced duringtherapy. f: CD16 expression on CD56dim NK cells was normal inuntreated patients but therapy resulted in decreased expression. Thesignificance of differences was analyzed by Mann–Whitney tests.*P< 0.05, **0.05<P< 0.10. [Color figure can be viewed in the onlineissue, which is available at www.interscience.wiley.com.]
570 Lee et al.

[perforin: 166 (34–674) vs. 63 (28–487), P¼0.002;CD16: 146 (27–559) vs. 39 (11–408), P¼0.001].
NK Cell Proportions Before and During Therapyin Relation to Treatment Outcome
Nineteen of the 34 patients (56%) were sustainedvirological responders (SVR). Patients with a SVR hadsignificantly lower proportion of CD3�CD56þ NK cellsat baseline than controls and this remained low duringtherapy (Table II). Percentages of CD3�CD56þ NKcells in non-SVR before and during therapy were similarto controls. Absolute numbers of CD3�CD56þ NK cellsdecreased during therapy, reaching statistical signi-ficance for SVR (P¼0.028). Normal percentages ofCD56dim NK cells were observed in SVR and non-SVRbefore and during therapy. During therapy, SVR hadsignificantly lower absolute numbers of CD56dim NKcells (P¼0.045). A similar trend was observed for non-SVR but this was not significant (P¼ 0.139). Therapyincreased proportions and absolute numbers ofCD56bright NK cells in SVR (P¼0.0006 and 0.045,respectively). Percentages but not absolute counts of
CD56bright NK cells showed a marginal increase in non-SVR (P¼0.064).
Baseline proportions of CD56dim NK cells expressingCD16 were similar, while perforin expression was lowerin SVR and non-SVR than controls (Table II). Regard-less of treatment outcome, percentages and absolutenumbers of CD16- and perforin-expressing CD56dim NKcells decreased with therapy in all patients. Of all theparameters assessed, only proportions of CD56bright NKcells expressing CD16 at baseline were marginallyhigher in SVR compared to non-SVR (49% vs. 39%,P¼ 0.07). Together the results suggest that analyses ofNK cell proportions or absolute numbers at baseline arenot useful in predicting response to therapy.
Proportions of NK Cells Correlate WithFibrosis and Serum ALT Levels
All patients underwent a liver biopsy prior to treat-ment and Scheuer scores were available. Among these,the percentage of CD3�CD56þ NK cells correlatedinversely with Scheuer fibrosis score (r¼�0.346,P¼ 0.045) (Fig. 2a). Classification of NK cells into
J. Med. Virol. DOI 10.1002/jmv
TABLE I. Characteristics of HCV-Infected Patients
Baseline (n¼ 34) During therapy (n¼19)
Age 47 (21–66) 43 (21–56)Sex (male/female) 20/14 9/10HCV genotype
1/2/3 19/2/13 13/1/5Serum HCV RNA (log10 copies/ml) 5.37 (3.97–6.55) 2.54 (2.54–6.16)*,a
Serum ALT (U/ml) 133 (25–449) 29 (10–177)*Fibrosis (Scheuer)
1/2/3/4 12/11/4/7 ND
ND, not done.*P<0.05 Mann–Whitney test.aHCV RNA data were not available for four patients.
TABLE II. Analysis of NK Cells in Healthy Controls and HCV-Infected Patients in Relation to Treatment Outcome
Healthycontrols(n¼16)
SVR Non-SVR
Baseline (n¼19)During therapy
(n¼13) Baseline (n¼14) During therapy (n¼6)
Lymphocyte count (cells/ml) 2,900 (1,700–4,200) 1,800 (900–3,200)# 3,200 (2,000–4,500) 2,000 (1,200–4,800)#
Lymphocyte (%) 69 (59–84) 71 (65–84) 79 (65–82) 74 (63–78)NK cellsCD3�CD56þ (%) 12 (5.9–24) 6.5 (3.3–22)* 8.8 (3.5–34)* 11 (3.5–32) 9.9 (3.2–23)Absolute CD3�CD56þ 206 (76–715) 114 (64–655)# 283 (96–1,440) 151 (62–531)CD56dim (% CD3�) 37 (21–67) 27 (6.4–71) 34 (7.6–61) 35 (7.2–64) 28 (10–77)Absolute CD56dim 155 (45–585) 74 (39–484)# 265 (72–698) 93 (36–499)CD56bright (% CD3�) 1.9 (0.7–4.5) 2.5 (0.9–12) 6.4 (1.7–21)*,# 2.7 (0.4–5.0)* 5.3 (1.8–20)*Absolute CD56bright 15 (6.4–49) 30 (9.3–56)# 24 (2.3–40) 18 (15–84)Perforin (% CD56dim) 97 (87–99) 95 (76–98)* 76 (64–98)*,# 95 (83–98)* 79 (66–98)*,#
Absolute perforin CD56dim 150 (34–565) 51 (28–362)# 255 (65–674) 66 (28–487)Perforin (% CD56bright) 22 (8.9–51) 30 (10–74) 25 (6.3–59) 27 (9.8–78) 33 (9.7–51)Absolute perforin CD56bright 6.0 (1.2–21) 5.5 (1.1–17) 4.7 (0.5–9.0) 6.3 (1.7–23)CD16 (% CD56dim) 90 (74–97) 86 (43–97) 56 (29–94)*,# 91 (34–94) 64 (18–85)*,#
Absolute CD16 CD56dim 145 (27–559) 45 (11–310)# 208 (59–551) 30 (17–408)#
CD16 (% CD56bright) 30 (19–78) 49 (20–67)* 42 (18–61) 39 (26–55)* 44 (36–57)*Absolute CD16 CD56bright 7.8 (2.0–26) 11 (2.4–23) 6.6 (0.8–22) 9.4 (5.5–48)
NK, natural killer; SVR, sustained virological response.Results are presented as median (range). P-values were determined by Mann–Whitney test.*P< 0.05 compared to healthy controls.#P< 0.05 compared to baseline.
NK Cells in HCV Infection 571

CD56dim and CD56bright confirmed this trend (r¼�0.356, P¼ 0.039 and r¼�0.412, P¼0.016, respec-tively) (Fig. 2b,c). Frequency of NK cells showed a weaknegative correlation with serum ALT levels (r¼�0.307,P¼0.082) (Fig. 2d), but not with hepatic inflammation,HCV viral load, or HCV genotype (data not shown).
DISCUSSION
Chronic HCV infection reduced the percentage ofCD3�CD56þ NK cells compared to healthy controls.Frequencies of CD56dim NK cells were also low inuntreated patients as expected since this populationaccounts for >90% of the total CD3�CD56þ NK cells.Depletion of CD56dim NK cells is previously describedin chronic HCV infection [Lin et al., 2004; Meier et al.,2005; Morishima et al., 2006; Golden-Mason et al.,2008]. CD56dim NK cells mediate cytotoxicity andexpress high levels of perforin and CD16, a receptorinvolved in antibody-dependent cellular cytotoxicity.CD16 expression was not affected by HCV disease butperforin expression in CD56dim NK cells was decreased.This is consistent with poor cytolytic activity of cellsfrom HCV-infected patients described in some studies[Corado et al., 1997; Par et al., 2002], but this is nota universal finding [Duesberg et al., 2001; Morishimaet al., 2006].
The effects of pegIFN-a/ribavirin therapy on NKcell subsets are unclear. Proportions of circulating
CD3�CD56þ NK cells were not changed by pegIFN-a/ribavirin therapy consistent with previous studies[Itose et al., 2007; Yamagiwa et al., 2008]. However,we observed more CD56bright NK cells in patientson treatment. This has been described in HIV/HCVco-infected patients receiving IFN-a/ribavirin therapy[Gonzalez et al., 2008]. In vitro stimulation of PBMCfrom HCV-infected patients and healthy controls withpegIFN-a also increased the percentage of CD56bright
NK cells [Lin et al., 2004]. Expansion of proportions ofCD56bright NK cells was not associated with diminishedCD56dim population. Despite similar proportions, ther-apy reduced the expression of perforin and CD16 onCD56dim NK. A limitation to this study was that sampleswere only available from 19 of the 34 patients ontherapy. However, when analyses of baseline sampleswere restricted to the same 19 patients (creatingmatched pairs at baseline and during therapy), similarresults were demonstrated (data not shown). Functionaldata are required to confirm the significance of increasedproportions of CD56bright NK cells during therapy, butthese cells are known to be efficient producers of IFN-g[Poli et al., 2009].
Expansion of NK cells able to produce cytokines maybe an anti-viral mechanism in HCV-infected patients.This is supported by evidence of more CD56bright NKcells in untreated non-viremic patients comparedto viremic patients [Golden-Mason et al., 2008;Zarife et al., 2009]. In contrast, we showed increased
J. Med. Virol. DOI 10.1002/jmv
Fig. 2. Proportions of CD3�CD56þ (a), CD56dim (b), and CD56bright (c) NK cells correlate inversely withfibrosis score whilst proportions of CD3�CD56þ NK cells correlate inversely with serum ALT levels (d) inHCV-infected patients at baseline (n¼34).
572 Lee et al.

proportions in all patients regardless of treatmentoutcome. We suggest that increased CD56bright NK cellsmay compensate for poor IFN-g responses by CD4 T cellsto HCV and CMV antigens observed in our patientsduring therapy. CD56bright NK cells are able to interactwith dendritic cells resulting in their proliferation andproduction of IFN-g [Vitale et al., 2004].
Few studies have correlated NK cell proportions andhistological parameters (necroinflammatory activity orfibrosis). One found no correlation [Pernollet et al.,2002], whereas another found lower proportions ofintrahepatic NK cells in HCV-infected patients withcirrhosis [Kawarabayashi et al., 2000]. Neither studyaddressed CD56bright and CD56dim NK cell populations.In a recent study, a positive correlation was reportedbetween CD3�CD56bright NK cells expressing NKG2Aand Metavir inflammation and fibrosis [Bonorino et al.,2009]. Here inverse correlations were observed in ourpatient cohort between frequencies of NK cells (CD56dim
and CD56bright) and Scheuer fibrosis score and serumALT levels. We have previously shown that PBMC fromHCV-infected patients with advanced fibrosis (Scheuerscore 4) showed poor HCV core antigen-specific IFN-gproduction assessed by ELISpot [Watson et al., 2003].Hence NK and T cells able to produce IFN-g may inhibithepatic fibrogenesis [Baroni et al., 1996]. Possiblemechanisms include the destruction of cells producingTGF-b1 or activated hepatic stellate cells [Melhem et al.,2006].
In summary, HCV therapy changed the profile of NKcell subsets with increased percentage of CD56bright NKcells. Expansion of CD56bright NK cells was associatedwith diminished CD56dim population and decreasedperforin and CD16 expression on these cells. Theseresults suggest that therapy may promote the expansionof cytokine-producing NK cells while minimizing cyto-toxicity to limit liver damage.
ACKNOWLEDGMENTS
The authors thank the patients who donated bloodand Saroj Nazareth and Marion McInerney whofacilitated the collection of samples from patientschronically infected with HCV. This is publication2009-22 (Clinical Immunology and Immunogenetics,RPH).
REFERENCES
Baroni GS, D’Ambrosio L, Curto P, Casini A, Mancini R, Jezequel AM,Benedetti A. 1996. Interferon gamma decreases hepatic stellate cellactivation and extracellular matrix deposition in rat liver fibrosis.Hepatology 23:1189–1199.
Bedossa P, Poynard T. 1996. An algorithm for the grading of activity inchronic hepatitis C. The METAVIR Cooperative Study Group.Hepatology 24:289–293.
Bonorino P, Ramzan M, Camous X, Dufeu-Duchesne T, Thelu MA,Sturm N, Dariz A, Guillermet C, Pernollet M, Zarski JP, MarchePN, Leroy V, Jouvin-Marche E. 2009. Fine characterization ofintrahepatic NK cells expressing natural killer receptors in chronichepatitis B and C. J Hepatol 51:458–467.
Bullock GC, Bruns DE, Haverstick DM. 2002. Hepatitis C genotypedetermination by melting curve analysis with a single set of
fluorescence resonance energy transfer probes. Clin Chem 48:2147–2154.
Castelain S, Descamps V, Thibault V, Francois C, Bonte D, Morel V,Izopet J, Capron D, Zawadzki P, Duverlie G. 2004. TaqManamplification system with an internal positive controls for HCVRNA quantitation. J Clin Virol 31:227–234.
Cooper MA, Fehniger TA, Caligiuri MA. 2001. The biology of humannatural killer-cell subsets. Trends Immunol 22:633–640.
Corado J, Toro F, Rivera H, Bianco NE, Deibis L, De Sanctis JB. 1997.Impairment of natural killer (NK) cytotoxic activity in hepatitis Cvirus (HCV) infection. Clin Exp Immunol 109:451–457.
Deutsch M, Hadziyannis SJ. 2008. Old and emerging therapies inchronic hepatitis C: An update. J Viral Hepat 15:2–11.
Duesberg U, Schneiders AM, Flieger D, Inchauspe G, Sauerbruch T,Spengler U. 2001. Natural cytotoxicity and antibody-dependentcellular cytotoxicity (ADCC) is not impaired in patients sufferingfrom chronic hepatitis C. J Hepatol 35:650–657.
Feld JJ, Hoofnagle JH. 2005. Mechanism of action of interferon andribavirin in treatment of hepatitis C. Nature 436:967–972.
Golden-Mason L, Madrigal-Estebas L, McGrath E, Conroy MJ, RyanEJ, Hegarty JE, O’Farrelly C, Doherty DG. 2008. Altered naturalkiller cell subset distributions in resolved and persistent hepatitis Cvirus infection following single source exposure. Gut 57:1121–1128.
Gonzalez VD, Falconer K, Michaelsson J, Moll M, Reichard O, AlaeusA, Sandberg JK. 2008. Expansion of CD56� NK cells in chronicHCV/HIV-1 co-infection: Reversion by antiviral treatment withpegylated IFNalpha and ribavirin. Clin Immunol 128:46–56.
Itose I, Kanto T, Inoue M, Miyazaki M, Miyatake H, Sakakibara M,Yakushijin T, Oze T, Hiramatsu N, Takehara T, Kasahara A,Katayama K, Kato M, Hayashi N. 2007. Involvement of dendriticcell frequency and function in virological relapse in pegylatedinterferon-alpha and ribavirin therapy for chronic hepatitis Cpatients. J Med Virol 79:511–521.
Kawarabayashi N, Seki S, Hatsuse K, Ohkawa T, Koike Y, Aihara T,Habu Y, Nakagawa R, Ami K, Hiraide H, Mochizuki H. 2000.Decrease of CD56(þ)T cells and natural killer cells in cirrhoticlivers with hepatitis C may be involved in their susceptibility tohepatocellular carcinoma. Hepatology 32:962–969.
Lin AW, Gonzalez SA, Cunningham-Rundles S, Dorante G, Marshall S,Tignor A, Ha C, Jacobson IM, Talal AH. 2004. CD56(þdim) andCD56(þbright) cell activation and apoptosis in hepatitis C virusinfection. Clin Exp Immunol 137:408–416.
Meier UC, Owen RE, Taylor E, Worth A, Naoumov N, Willberg C, TangK, Newton P, Pellegrino P, Williams I, Klenerman P, Borrow P.2005. Shared alterations in NK cell frequency, phenotype, andfunction in chronic human immunodeficiency virus and hepatitis Cvirus infections. J Virol 79:12365–12374.
Melhem A, Muhanna N, Bishara A, Alvarez CE, Ilan Y, Bishara T,Horani A, Nassar M, Friedman SL, Safadi R. 2006. Anti-fibroticactivity of NK cells in experimental liver injury through killing ofactivated HSC. J Hepatol 45:60–71.
Morishima C, Paschal DM, Wang CC, Yoshihara CS, Wood BL, Yeo AE,Emerson SS, Shuhart MC, Gretch DR. 2006. Decreased NK cellfrequency in chronic hepatitis C does not affect ex vivo cytolytickilling. Hepatology 43:573–580.
Par G, Rukavina D, Podack ER, Horanyi M, Szekeres-Bartho J,Hegedus G, Paal M, Szereday L, Mozsik G, Par A. 2002. Decrease inCD3-negative-CD8dim(þ) and Vdelta2/Vgamma9 TcRþ peripheralblood lymphocyte counts, low perforin expression and the impair-ment of natural killer cell activity is associated with chronichepatitis C virus infection. J Hepatol 37:514–522.
Pernollet M, Jouvin-Marche E, Leroy V, Vigan I, Zarski JP, Marche PN.2002. Simultaneous evaluation of lymphocyte subpopulations inthe liver and in peripheral blood mononuclear cells of HCV-infectedpatients: Relationship with histological lesions. Clin Exp Immunol130:518–525.
Poli A, Michel T, Theresine M, Andres E, Hentges F, Zimmer J. 2009.CD56bright natural killer (NK) cells: An important NK cell subset.Immunology 126:458–465.
Vitale M, Della Chiesa M, Carlomagno S, Romagnani C, Thiel A,Moretta L, Moretta A. 2004. The small subset of CD56brightCD16�natural killer cells is selectively responsible for both cell prolifera-tion and interferon-gamma production upon interaction withdendritic cells. Eur J Immunol 34:1715–1722.
Watson MW, Jaksic A, Price P, Cheng W, McInerney M, French MA,Fisher S, Lee S, Flexman JP. 2003. Interferon-gamma response byperipheral blood mononuclear cells to hepatitis C virus core antigen
J. Med. Virol. DOI 10.1002/jmv
NK Cells in HCV Infection 573
is reduced in patients with liver fibrosis. J Infect Dis 188:1533–1536.
Yamagiwa S, Matsuda Y, Ichida T, Honda Y, Takamura M, Sugahara S,Ishikawa T, Ohkoshi S, Sato Y, Aoyagi Y. 2008. Sustained responseto interferon-alpha plus ribavirin therapy for chronic hepatitis C isclosely associated with increased dynamism of intrahepatic naturalkiller and natural killer T cells. Hepatol Res 38:664–672.
Zarife MA, Reis EA, Carmo TM, Lopes GB, Brandao EC, Silva HR,Santana N, Martins-Filho OA, Reis MG. 2009. Increased frequencyof CD56Bright NK-cells, CD3�CD16þCD56� NK-cells and acti-vated CD4þT-cells or B-cells in parallel with CD4þCD25HighT-cells control potentially viremia in blood donors with HCV. J MedVirol 81:49–59.
J. Med. Virol. DOI 10.1002/jmv
574 Lee et al.