increasing contribution from cee - vienna insurance … · increasing contribution from cee....
TRANSCRIPT
3M 2011 results telephone conference
Vienna, 17 May 2011
Increasing contribution from CEE

Presenting Team and Topics
Presenting Team Topics
Martin Simhandl, CFO
Peter Hagen, Member of the Managing Board
Peter Höfinger, Member
of the
Managing
Board
Roland Gröll, Head of Group Finance and Accounting
Thomas Schmee, Head of Investor Relations
Highlights
p. 3
P&L and Balance Sheet
p. 7
Outlook and Dividend
p. 18
Appendix p. 19
2
Highlights
Vienna Insurance Group –
3M 2011 results
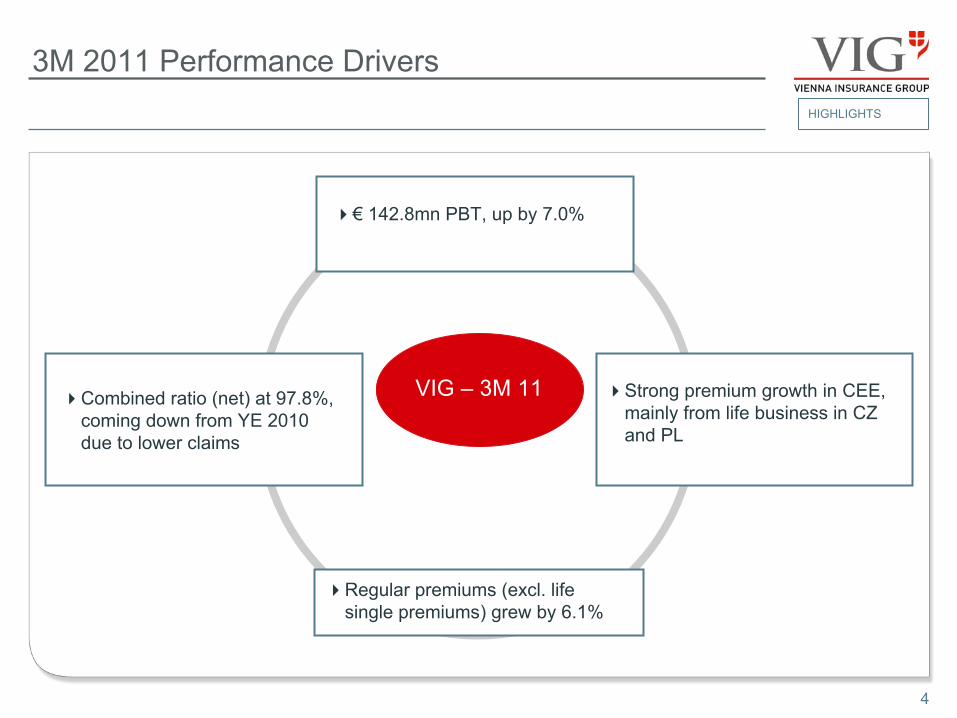
3M 2011 Performance Drivers
4
HIGHLIGHTS
VIG –
3M 11
€
142.8mn PBT, up by 7.0%
Combined ratio (net) at 97.8%, coming down from YE 2010 due to lower claims
Strong premium growth in CEE, mainly from life business in CZ and PL
Regular premiums (excl. life single premiums) grew by 6.1%
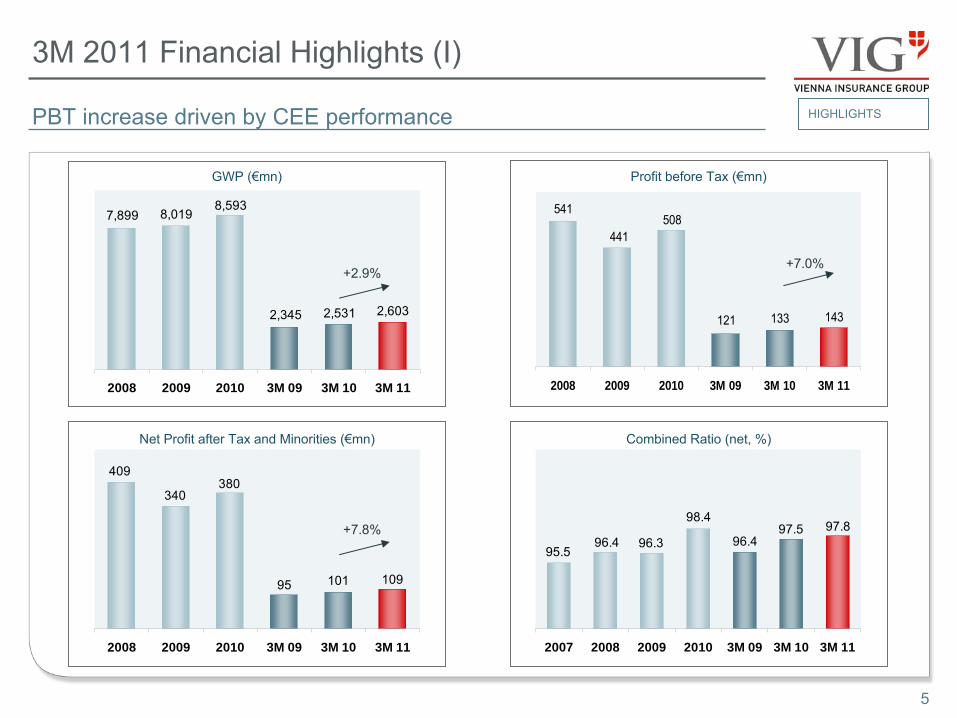
7,899 8,0198,593
2,345 2,531 2,603
2008 2009 2010 3M 09 3M 10 3M 11
3M 2011 Financial Highlights (I)
GWP (€mn)
Net Profit after
Tax and Minorities
(€mn)
Profit before
Tax (€mn)
Combined
Ratio (net, %)
HIGHLIGHTS
5
+2.9%
541
441508
121 133 143
2008 2009 2010 3M 09 3M 10 3M 11
+7.0%
10910195
380340
409
2008 2009 2010 3M 09 3M 10 3M 11
+7.8%
PBT increase driven by CEE performance
97.596.4
98.4
96.396.495.5
97.8
2007 2008 2009 2010 3M 09 3M 10 3M 11
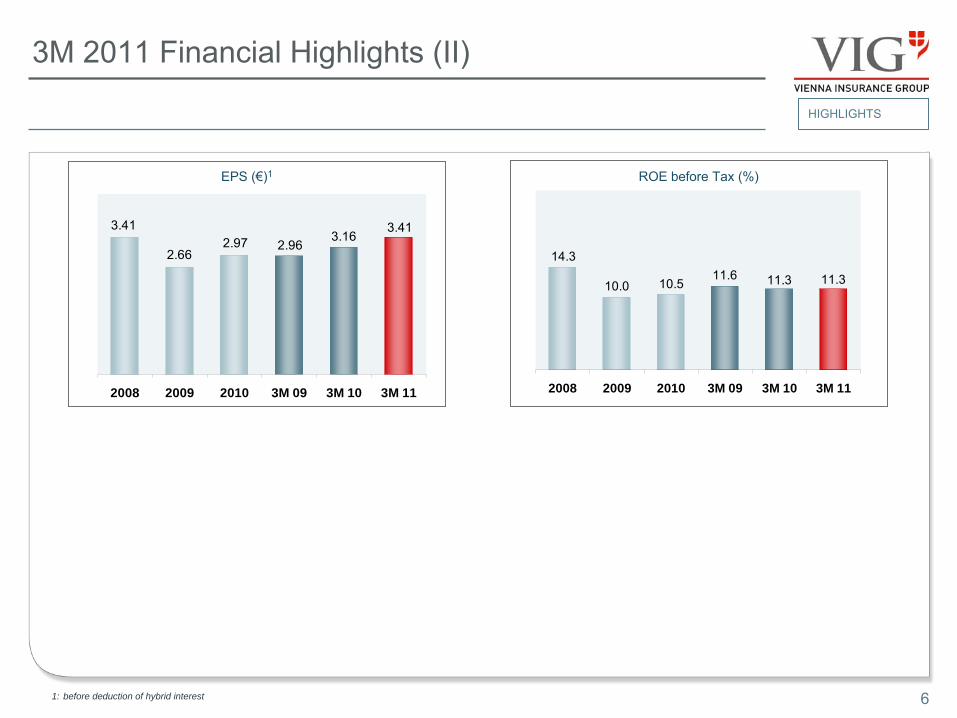
3M 2011 Financial Highlights (II)
EPS (€)1 ROE before
Tax (%)
HIGHLIGHTS
6
3.41
2.662.97 2.96
3.163.41
2008 2009 2010 3M 09 3M 10 3M 11
11.311.311.610.510.0
14.3
2008 2009 2010 3M 09 3M 10 3M 11
1: before deduction of hybrid interest

P&L and Balance Sheet Details
Vienna Insurance Group –
3M 2011 results
IFRS (€mn)
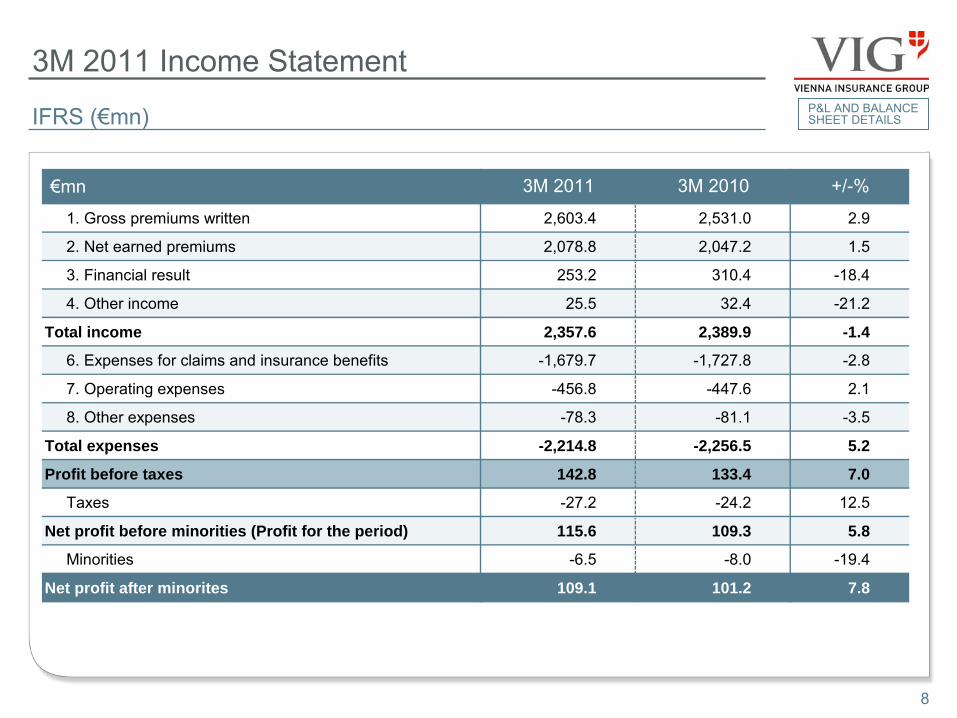
3M 2011 Income StatementP&L AND BALANCE SHEET DETAILS
8
€mn
1. Gross premiums written 2,603.4 2,531.0 2.9
2. Net earned premiums 2,078.8 2,047.2 1.5
3. Financial result 253.2 310.4 -18.4
4. Other income 25.5 32.4 -21.2
Total income 2,357.6 2,389.9 -1.4
6. Expenses for claims and insurance benefits -1,679.7 -1,727.8 -2.8
7. Operating expenses -456.8 -447.6 2.1
8. Other expenses -78.3 -81.1 -3.5
Total expenses -2,214.8 -2,256.5 5.2
Profit before taxes 142.8 133.4 7.0
Taxes -27.2 -24.2 12.5
Net profit before minorities (Profit for the period) 115.6 109.3 5.8
Minorities -6.5 -8.0 -19.4
Net profit after minorites 109.1 101.2 7.8
3M 2011 3M 2010 +/-%
IFRS (€mn)
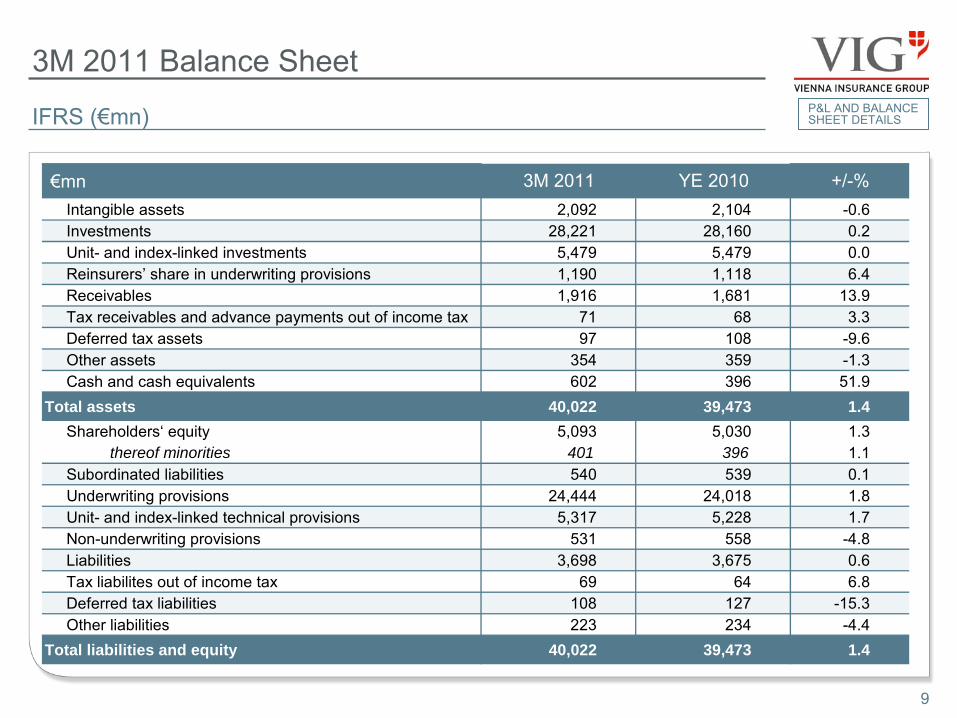
3M 2011 Balance SheetP&L AND BALANCE SHEET DETAILS
9
€mnIntangible assets 2,092 2,104 -0.6Investments 28,221 28,160 0.2Unit- and index-linked investments 5,479 5,479 0.0Reinsurers’ share in underwriting provisions 1,190 1,118 6.4Receivables 1,916 1,681 13.9Tax receivables and advance payments out of income tax 71 68 3.3Deferred tax assets 97 108 -9.6Other assets 354 359 -1.3Cash and cash equivalents 602 396 51.9
Total assets 40,022 39,473 1.4Shareholders‘ equity 5,093 5,030 1.3
thereof minorities 401 396 1.1Subordinated liabilities 540 539 0.1Underwriting provisions 24,444 24,018 1.8Unit- and index-linked technical provisions 5,317 5,228 1.7Non-underwriting provisions 531 558 -4.8Liabilities 3,698 3,675 0.6Tax liabilites out of income tax 69 64 6.8Deferred tax liabilities 108 127 -15.3Other liabilities 223 234 -4.4
Total liabilities and equity 40,022 39,473 1.4
3M 2011 YE 2010 +/-%
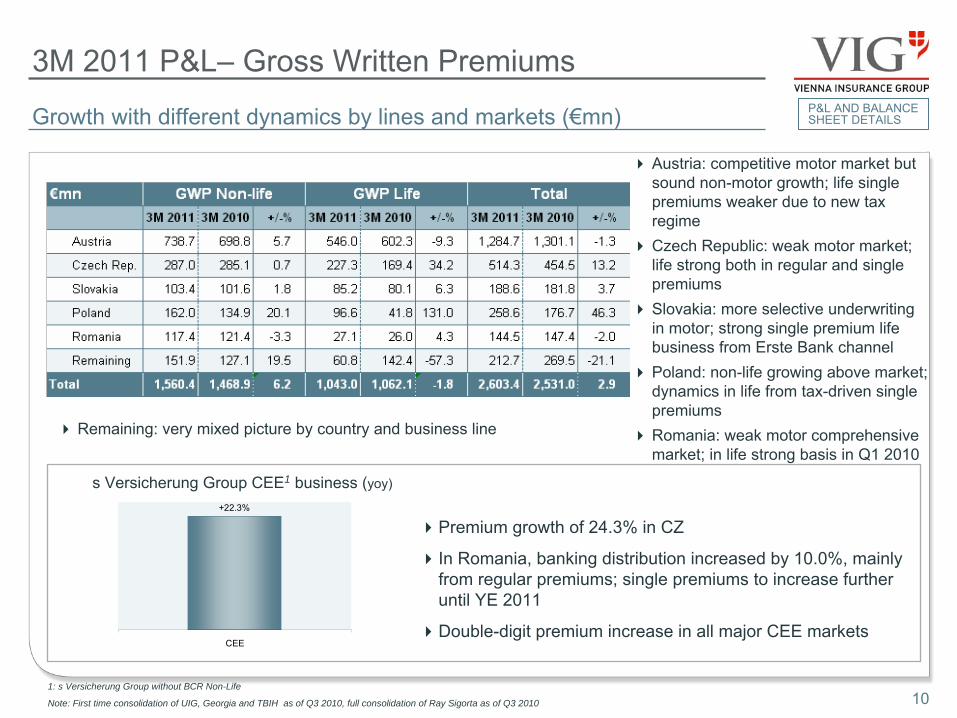
3M 2011 P&L–
Gross
Written
Premiums
Growth with
different dynamics
by
lines
and markets
(€mn)
1: s Versicherung Group without BCR Non-Life
Note: First time consolidation of UIG, Georgia and TBIH as of Q3 2010, full consolidation of Ray Sigorta as of Q3 2010
P&L AND BALANCE SHEET DETAILS
10
Austria: competitive motor market but sound non-motor growth; life single premiums weaker due to new tax regime
Czech Republic: weak motor market; life strong both in regular and single premiums
Slovakia: more selective underwriting in motor; strong single premium life business from Erste
Bank channel Poland: non-life growing above market;
dynamics in life from tax-driven single premiums
Romania: weak motor comprehensive market; in life strong basis in Q1 2010
Premium growth of 24.3% in CZ
In Romania, banking distribution increased by 10.0%, mainly from regular premiums; single premiums to increase further until YE 2011
Double-digit premium increase in all major CEE markets
s Versicherung Group CEE1 business (yoy)
Remaining: very mixed picture by country and business line
+22.3%
CEE
3M 2011 –
Expenses
for Claims Incurred
Loss ratio improving due to absence of NatCat
events
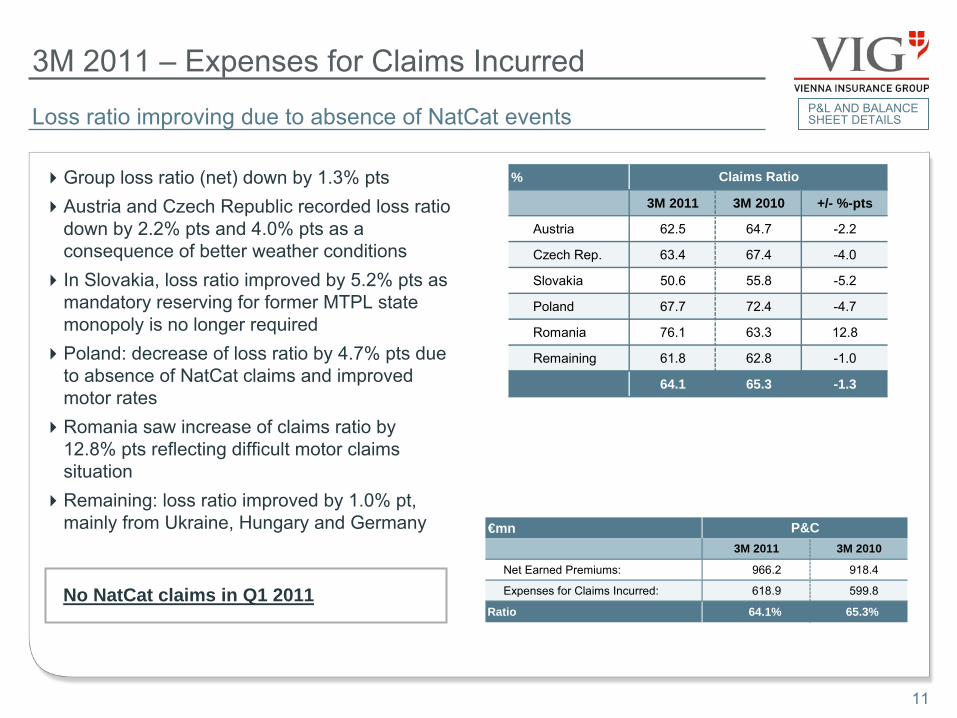
Group loss ratio (net) down by 1.3% pts Austria and Czech Republic recorded loss ratio
down by 2.2% pts and 4.0% pts as a consequence of better weather conditions
In Slovakia, loss ratio improved by 5.2% pts as mandatory reserving for former MTPL state monopoly is no longer required
Poland: decrease of loss ratio by 4.7% pts due to absence of NatCat
claims and improved motor rates
Romania saw increase of claims ratio by 12.8% pts reflecting difficult motor claims situation
Remaining: loss ratio improved by 1.0% pt, mainly from Ukraine, Hungary and Germany
P&L AND BALANCE SHEET DETAILS
11
No NatCat claims in Q1 2011
%
3M 2011 3M 2010 +/- %-pts
Austria 62.5 64.7 -2.2
Czech Rep. 63.4 67.4 -4.0
Slovakia 50.6 55.8 -5.2
Poland 67.7 72.4 -4.7
Romania 76.1 63.3 12.8
Remaining 61.8 62.8 -1.0
64.1 65.3 -1.3
Claims Ratio
€mn
Net Earned Premiums: 966.2 918.4
Expenses for Claims Incurred: 618.9 599.8
Ratio 64.1% 65.3%
P&C3M 2011 3M 2010
€mn
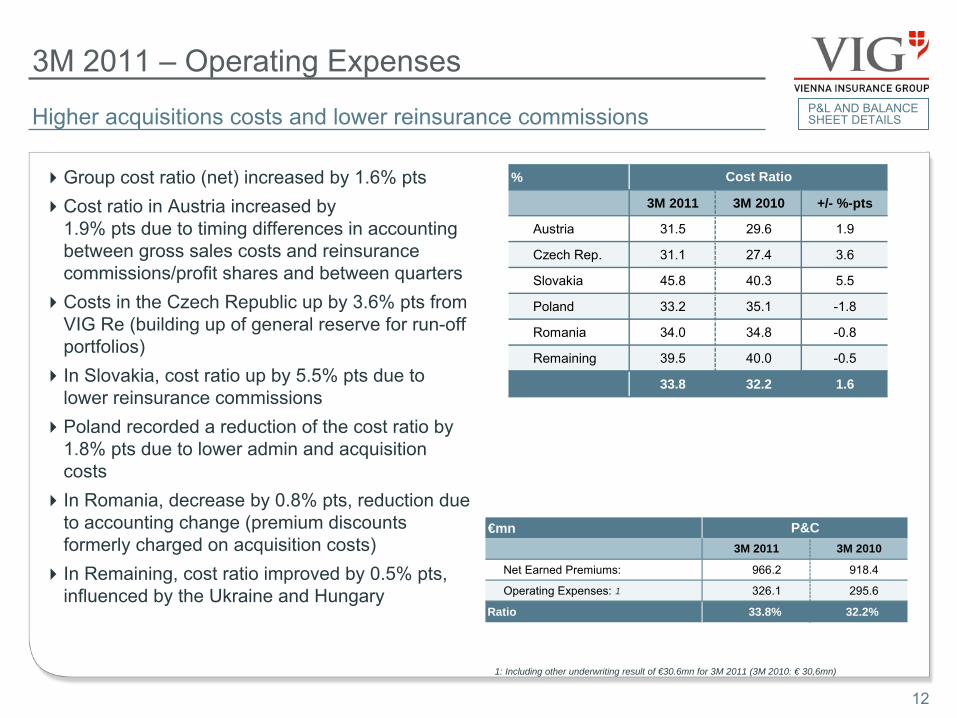
Net Earned Premiums: 966.2 918.4
Operating Expenses: 326.1 295.6
Ratio 33.8% 32.2%
3M 2011 3M 2010
P&C
3M 2011 –
Operating
Expenses
Higher acquisitions costs and lower reinsurance commissions P&L AND BALANCE SHEET DETAILS
Group cost ratio (net) increased by 1.6% pts Cost ratio in Austria increased by
1.9% pts due to timing differences in accounting between gross sales costs and reinsurance commissions/profit shares and between quarters
Costs in the Czech Republic up by 3.6% pts from VIG Re (building up of general reserve for run-off portfolios)
In Slovakia, cost ratio up by 5.5% pts due to lower reinsurance commissions
Poland recorded a reduction of the cost ratio by 1.8% pts due to lower admin and acquisition costs
In Romania, decrease by 0.8% pts, reduction due to accounting change (premium discounts formerly charged on acquisition costs)
In Remaining, cost ratio improved by 0.5% pts, influenced by the Ukraine and Hungary
12
1
1: Including other underwriting result of €30.6mn for 3M 2011 (3M 2010: € 30,6mn)
%
3M 2011 3M 2010 +/- %-pts
Austria 31.5 29.6 1.9
Czech Rep. 31.1 27.4 3.6
Slovakia 45.8 40.3 5.5
Poland 33.2 35.1 -1.8
Romania 34.0 34.8 -0.8
Remaining 39.5 40.0 -0.5
33.8 32.2 1.6
Cost Ratio
3M 2011 P&L Major Items –
Financial Result
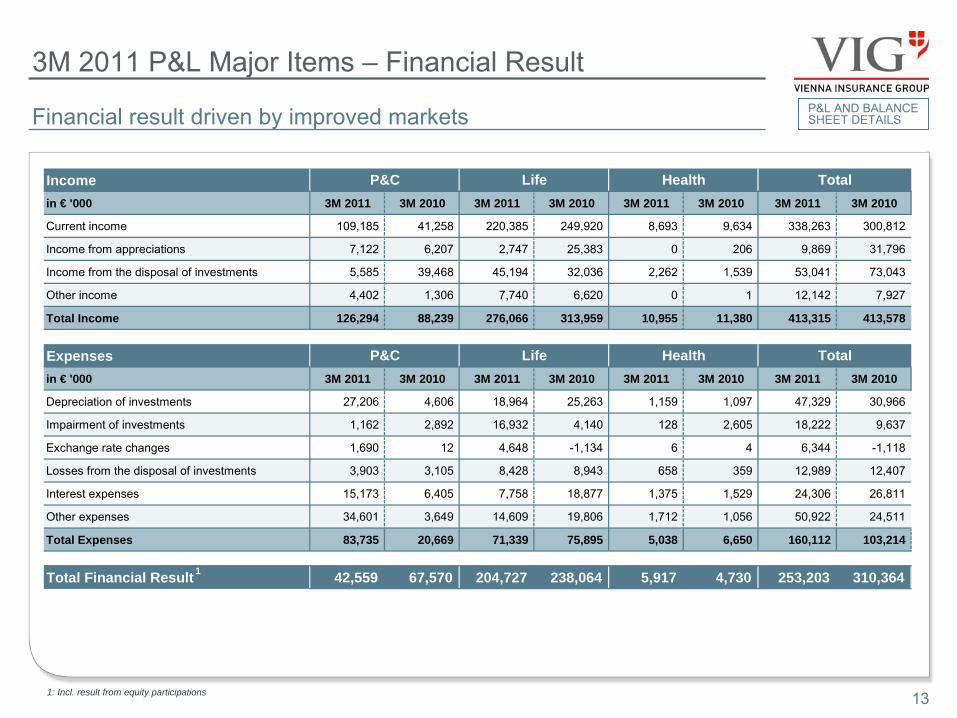
Financial result driven by improved markets P&L AND BALANCE SHEET DETAILS
131: Incl. result from equity participations
Incomein € '000 3M 2011 3M 2010 3M 2011 3M 2010 3M 2011 3M 2010 3M 2011 3M 2010
Current income 109,185 41,258 220,385 249,920 8,693 9,634 338,263 300,812
Income from appreciations 7,122 6,207 2,747 25,383 0 206 9,869 31,796
Income from the disposal of investments 5,585 39,468 45,194 32,036 2,262 1,539 53,041 73,043
Other income 4,402 1,306 7,740 6,620 0 1 12,142 7,927
Total Income 126,294 88,239 276,066 313,959 10,955 11,380 413,315 413,578
Expensesin € '000 3M 2011 3M 2010 3M 2011 3M 2010 3M 2011 3M 2010 3M 2011 3M 2010
Depreciation of investments 27,206 4,606 18,964 25,263 1,159 1,097 47,329 30,966
Impairment of investments 1,162 2,892 16,932 4,140 128 2,605 18,222 9,637
Exchange rate changes 1,690 12 4,648 -1,134 6 4 6,344 -1,118
Losses from the disposal of investments 3,903 3,105 8,428 8,943 658 359 12,989 12,407
Interest expenses 15,173 6,405 7,758 18,877 1,375 1,529 24,306 26,811
Other expenses 34,601 3,649 14,609 19,806 1,712 1,056 50,922 24,511
Total Expenses 83,735 20,669 71,339 75,895 5,038 6,650 160,112 103,214
Total Financial Result 42,559 67,570 204,727 238,064 5,917 4,730 253,203 310,364
Total
P&C Life Health Total
P&C Life Health
1
YE 2010 3M 2011
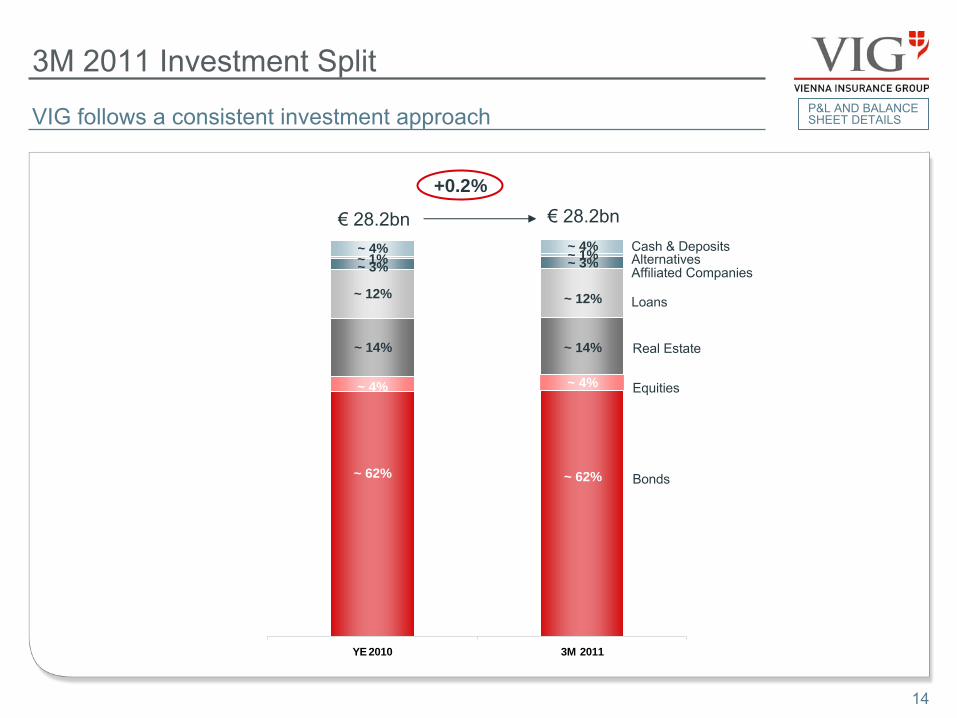
+0.2%
~ 62%
~ 4%
~ 14%
~ 12%
~ 3%~ 1%~ 4%
Bonds
Equities
Real Estate
Loans
Affiliated Companies
Cash & DepositsAlternatives
~ 62%
~ 4%
~ 14%
~ 12%
~ 4%~ 1%~ 3%
3M 2011 Investment Split
VIG follows a consistent investment approach P&L AND BALANCE SHEET DETAILS
14
€
28.2bn €
28.2bn
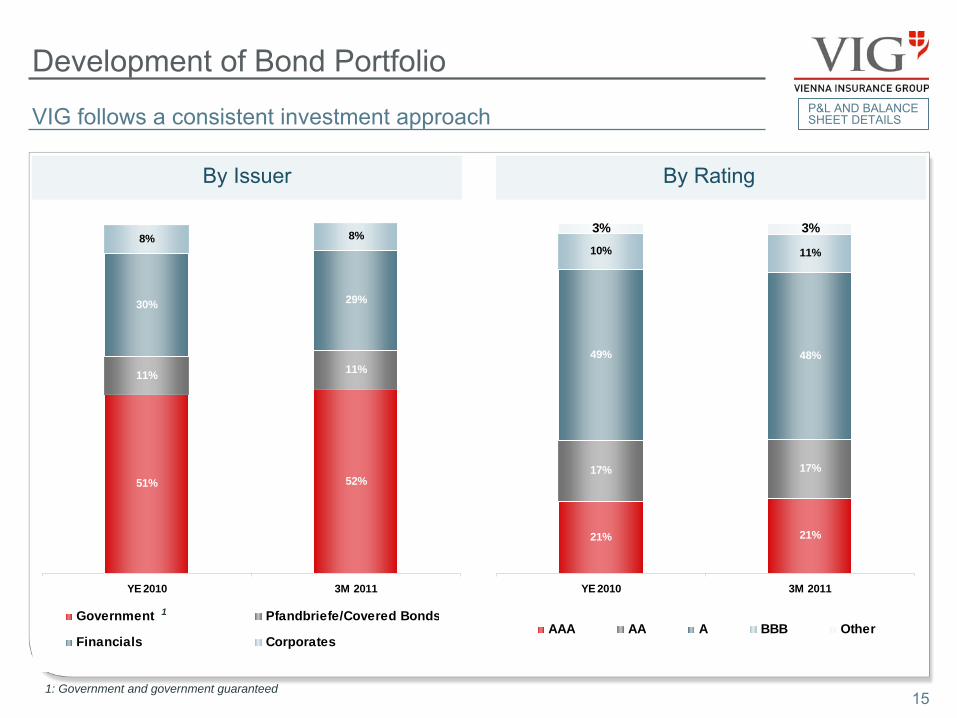
51% 52%
11% 11%
30% 29%
8% 8%
YE 2010 3M 2011
Government Pfandbriefe/Covered Bonds
Financials Corporates
Development of Bond Portfolio
15
By
Rating
P&L AND BALANCE SHEET DETAILS
By
Issuer
1
1: Government and government guaranteed
VIG follows a consistent investment approach
21% 21%
17% 17%
49% 48%
10% 11%
3% 3%
YE 2010 3M 2011
AAA AA A BBB Other
YE 2010 3M 2011
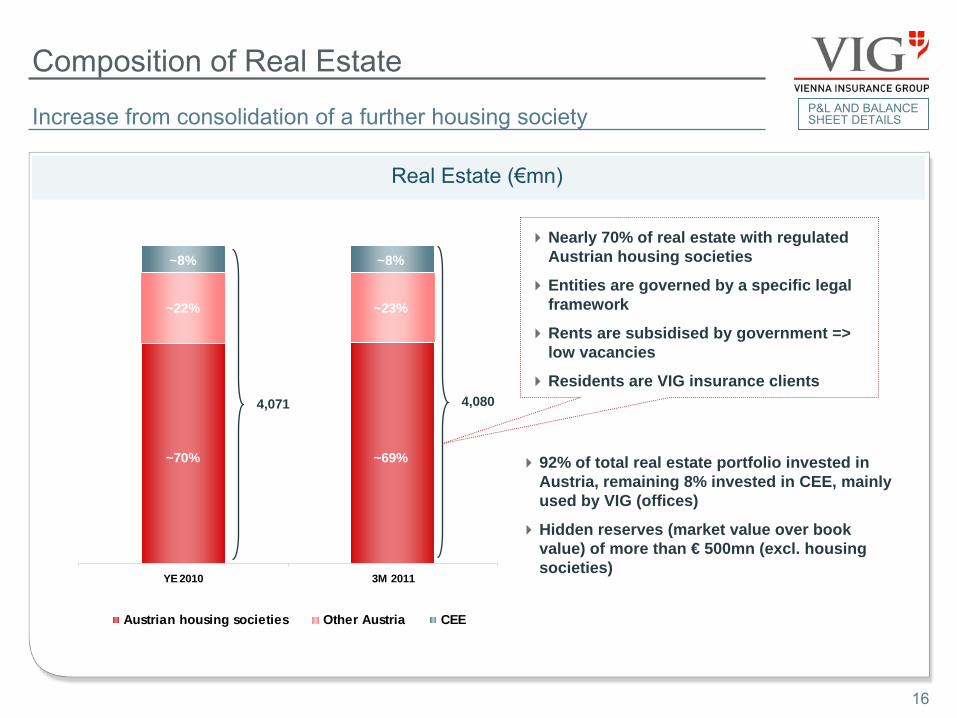
Austrian housing societies Other Austria CEE
Nearly 70% of real estate with regulated Austrian housing societies
Entities are governed by a specific legal framework
Rents are subsidised by government => low vacancies
Residents are VIG insurance clients
92% of total real estate portfolio invested in Austria, remaining 8% invested in CEE, mainly used by VIG (offices)
Hidden reserves (market value over book value) of more than € 500mn (excl. housing societies)
Composition of Real Estate
By
Issuer Real Estate (€mn)
16
4,080
~69%
~23%
~8%
Increase from consolidation of a further housing society P&L AND BALANCE SHEET DETAILS
~70%
~22%
~8%
4,071
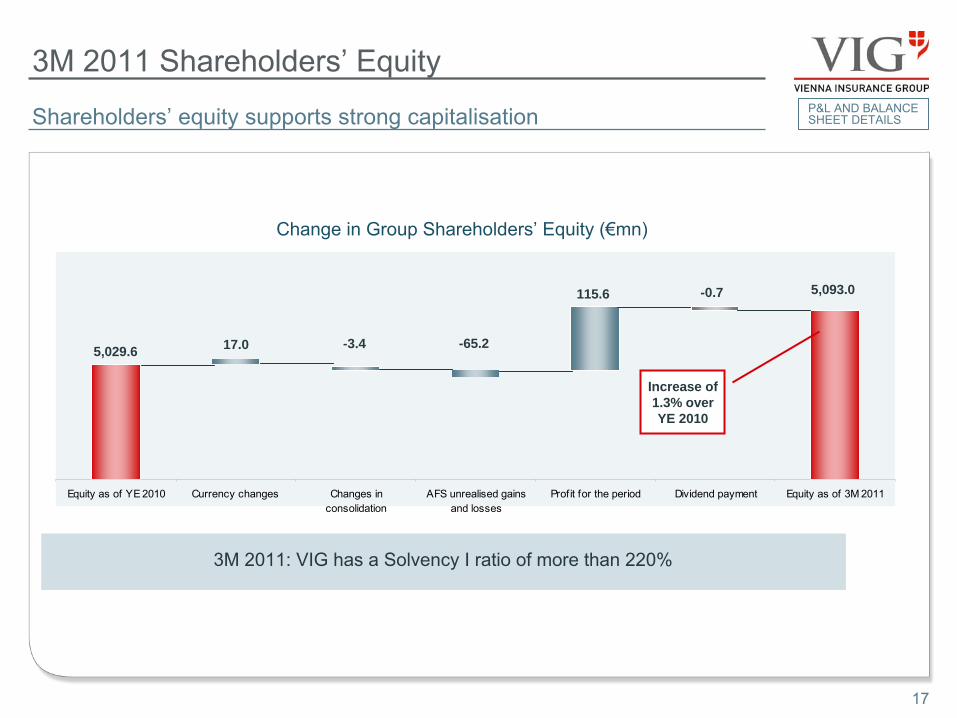
Equity as of YE 2010 Currency changes Changes inconsolidation
AFS unrealised gainsand losses
Profit for the period Dividend payment Equity as of 3M 2011
Change in Group Shareholders’
Equity (€mn)
5,029.6 17.0 -3.4
115.6 -0.7 5,093.0
-65.2
3M 2011 Shareholders’
Equity
Shareholders’
equity supports strong capitalisation
Increase of 1.3% over YE 2010
P&L AND BALANCE SHEET DETAILS
17
3M 2011: VIG has a Solvency I ratio of more than 220%
Outlook/Dividend
18
-
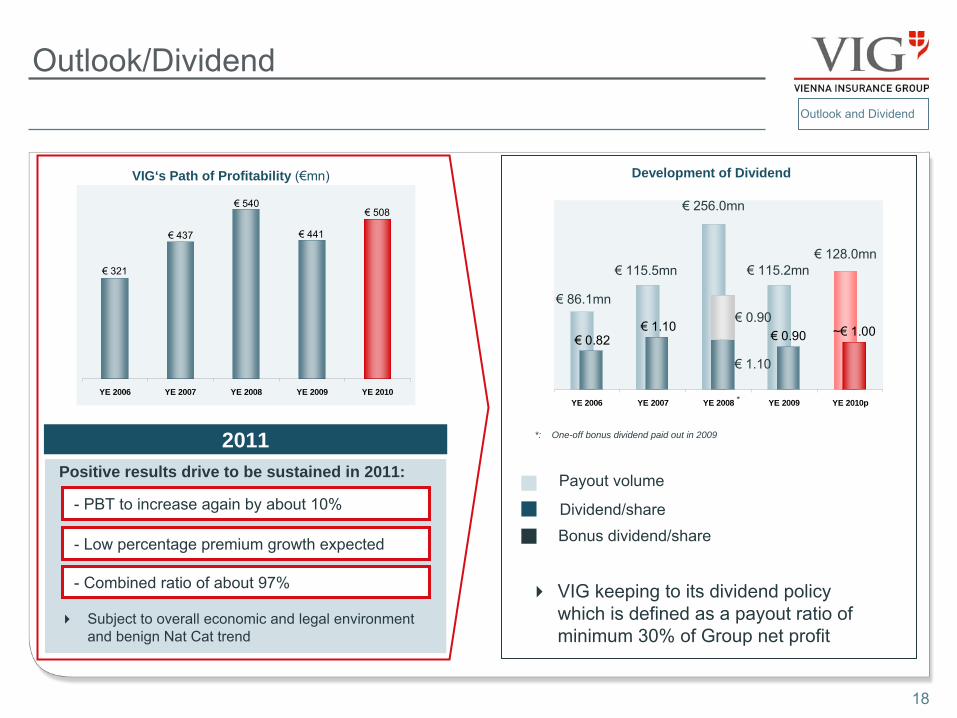
Low percentage premium growth expected
-
PBT to increase again by about 10%
Subject to overall economic and legal environment and benign Nat Cat trend
Positive results drive to be sustained in 2011:
2011
VIG‘s Path of Profitability (€mn)
~€ 1.00€ 0.90€ 1.10
€ 0.82
YE 2006 YE 2007 YE 2008 YE 2009 YE 2010p
€
86.1mn
€ 115.5mn
€
256.0mn
€
115.2mn€
128.0mn
€ 0.90
€ 1.10
Payout volume
Dividend/shareBonus dividend/share
VIG keeping
to its
dividend
policy
which
is
defined
as a payout
ratio
of minimum
30% of Group net
profit
*
*: One-off bonus dividend paid out in 2009
Development of Dividend
-
Combined ratio of about 97%
Outlook and Dividend
€ 321
€ 437
€ 540
€ 441
€ 508
YE 2006 YE 2007 YE 2008 YE 2009 YE 2010
Appendix
Vienna Insurance Group –
3M 2011 results
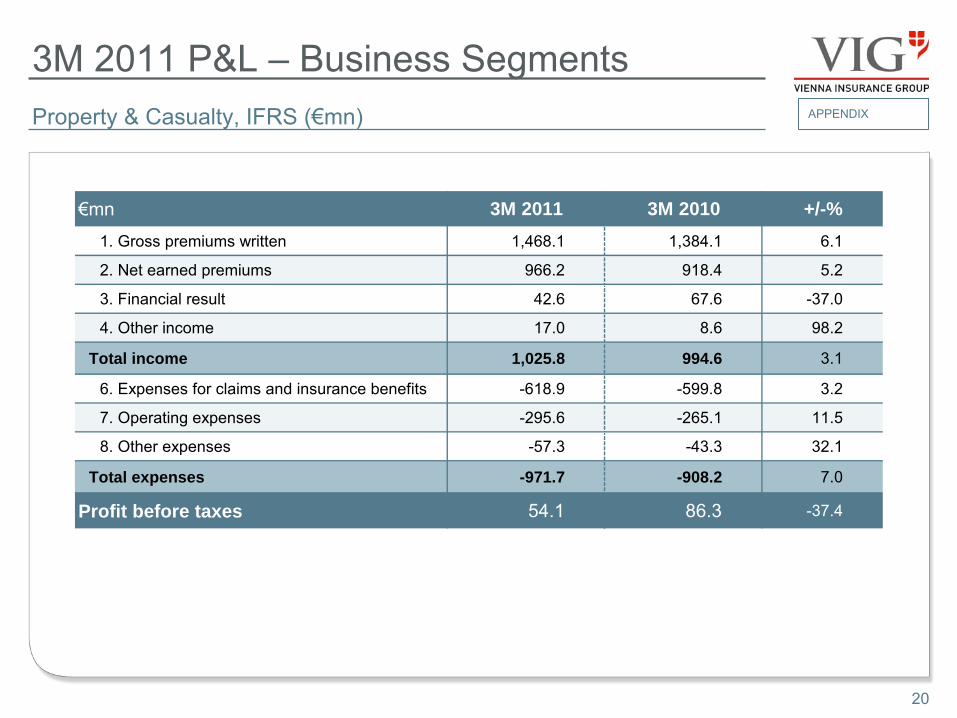
3M 2011 P&L –
Business Segments
20
Property & Casualty, IFRS (€mn) APPENDIX
€mn
1. Gross premiums written 1,468.1 1,384.1 6.1
2. Net earned premiums 966.2 918.4 5.2
3. Financial result 42.6 67.6 -37.0
4. Other income 17.0 8.6 98.2
Total income 1,025.8 994.6 3.1
6. Expenses for claims and insurance benefits -618.9 -599.8 3.2
7. Operating expenses -295.6 -265.1 11.5
8. Other expenses -57.3 -43.3 32.1
Total expenses -971.7 -908.2 7.0
Profit before taxes 54.1 86.3 -37.4
3M 2011 3M 2010 +/-%
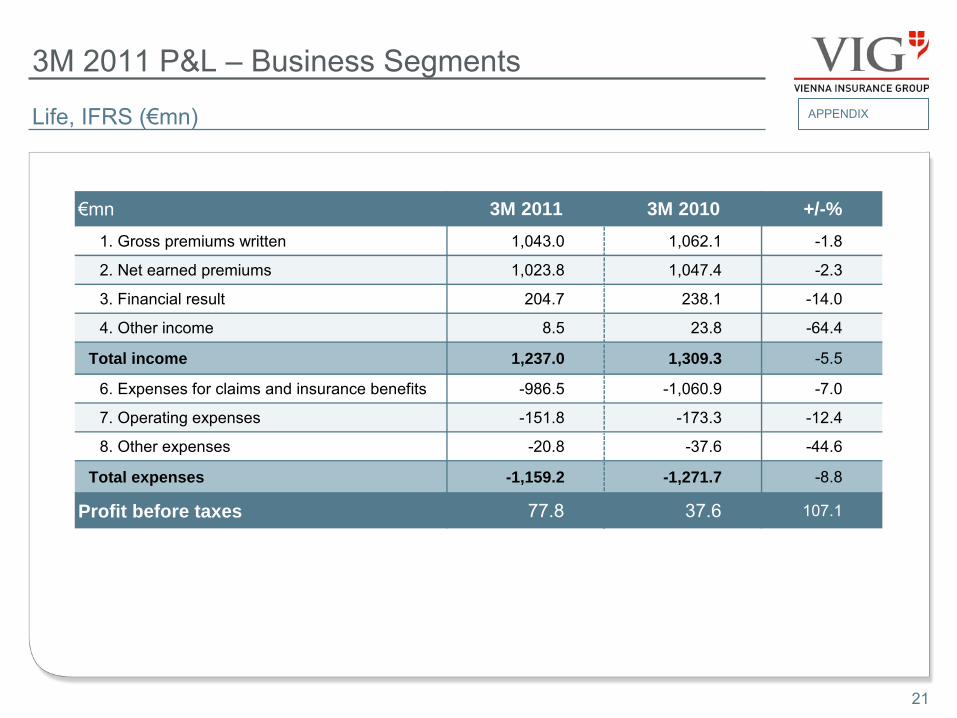
3M 2011 P&L –
Business SegmentsAPPENDIXLife, IFRS (€mn)
21
€mn
1. Gross premiums written 1,043.0 1,062.1 -1.8
2. Net earned premiums 1,023.8 1,047.4 -2.3
3. Financial result 204.7 238.1 -14.0
4. Other income 8.5 23.8 -64.4
Total income 1,237.0 1,309.3 -5.5
6. Expenses for claims and insurance benefits -986.5 -1,060.9 -7.0
7. Operating expenses -151.8 -173.3 -12.4
8. Other expenses -20.8 -37.6 -44.6
Total expenses -1,159.2 -1,271.7 -8.8
Profit before taxes 77.8 37.6 107.1
3M 2011 3M 2010 +/-%
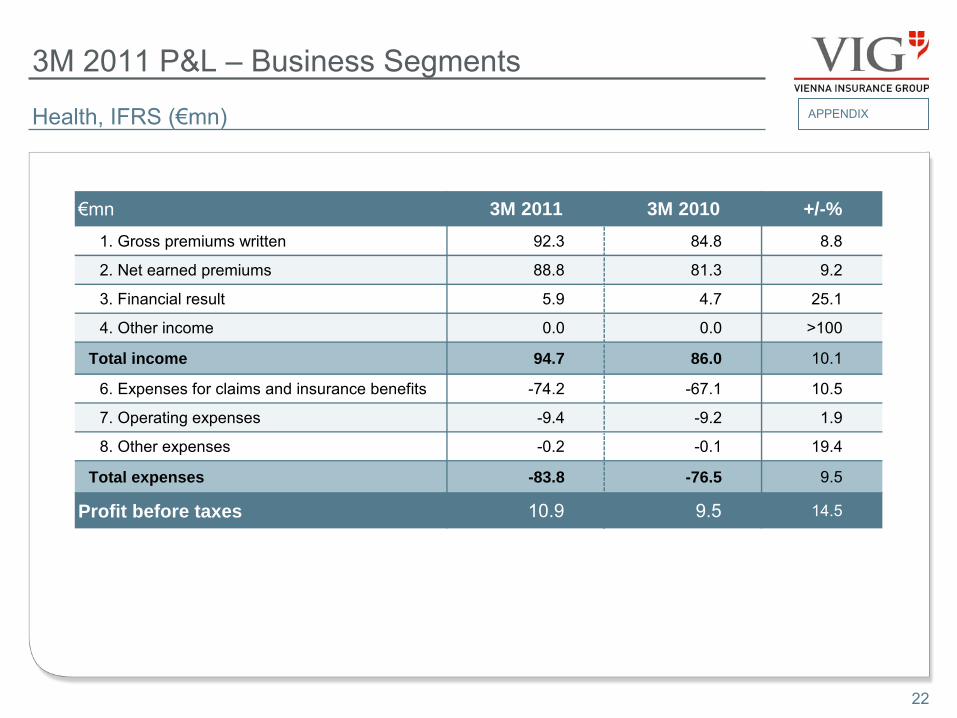
3M 2011 P&L –
Business SegmentsAPPENDIXHealth, IFRS (€mn)
22
€mn
1. Gross premiums written 92.3 84.8 8.8
2. Net earned premiums 88.8 81.3 9.2
3. Financial result 5.9 4.7 25.1
4. Other income 0.0 0.0 >100
Total income 94.7 86.0 10.1
6. Expenses for claims and insurance benefits -74.2 -67.1 10.5
7. Operating expenses -9.4 -9.2 1.9
8. Other expenses -0.2 -0.1 19.4
Total expenses -83.8 -76.5 9.5
Profit before taxes 10.9 9.5 14.5
3M 2011 3M 2010 +/-%

23
Regional segments, IFRS (€mn)
3M 2011 P&L –
Split by Regions (I)APPENDIX
€mn
1. Gross premiums written 1,284.7 1,301.1 -1.3 514.3 454.5 13.2
2. Net earned premiums 942.5 980.7 -3.9 451.6 392.6 15.0
3. Financial result 177.0 232.6 -23.9 32.0 29.1 10.2
4. Other income 5.8 2.5 130.9 7.0 3.6 96.7
Total income 1,125.3 1,215.8 -7.4 490.7 425.3 15.4
6. Expenses for claims/benefits -866.1 -970.4 -10.7 -321.4 -277.0 16.0
7. Operating expenses -169.2 -166.9 1.4 -108.3 -98.7 9.8
8. Other expenses -11.2 -8.3 34.1 -19.8 -18.1 9.4
Total expenses -1,046.4 -1,145.6 -8.7 -449.6 -393.8 14.2
Profit before taxes 78.8 70.3 12.2 41.1 31.5 30.6
Combined Ratio 94.0% 94.3% 94.5% 94.8%
Austria Czech Republic
3M 2011 3M 2010 +/-% 3M 2011 3M 2010 +/-%
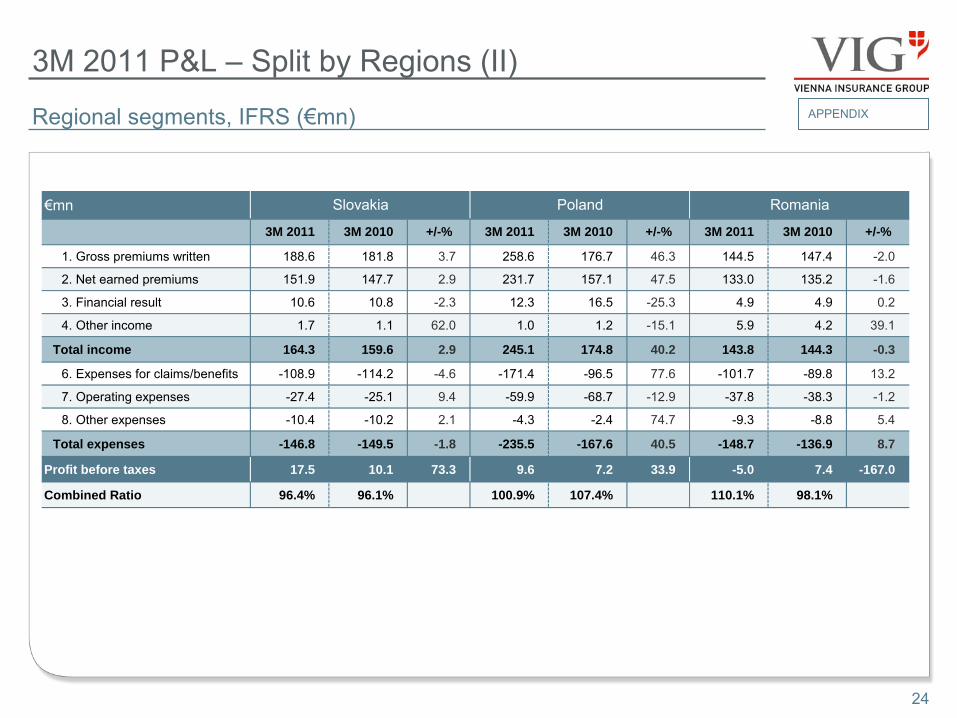
3M 2011 P&L –
Split by Regions (II)
Regional segments, IFRS (€mn) APPENDIX
24
€mn
1. Gross premiums written 188.6 181.8 3.7 258.6 176.7 46.3 144.5 147.4 -2.0
2. Net earned premiums 151.9 147.7 2.9 231.7 157.1 47.5 133.0 135.2 -1.6
3. Financial result 10.6 10.8 -2.3 12.3 16.5 -25.3 4.9 4.9 0.2
4. Other income 1.7 1.1 62.0 1.0 1.2 -15.1 5.9 4.2 39.1
Total income 164.3 159.6 2.9 245.1 174.8 40.2 143.8 144.3 -0.3
6. Expenses for claims/benefits -108.9 -114.2 -4.6 -171.4 -96.5 77.6 -101.7 -89.8 13.2
7. Operating expenses -27.4 -25.1 9.4 -59.9 -68.7 -12.9 -37.8 -38.3 -1.2
8. Other expenses -10.4 -10.2 2.1 -4.3 -2.4 74.7 -9.3 -8.8 5.4
Total expenses -146.8 -149.5 -1.8 -235.5 -167.6 40.5 -148.7 -136.9 8.7
Profit before taxes 17.5 10.1 73.3 9.6 7.2 33.9 -5.0 7.4 -167.0
Combined Ratio 96.4% 96.1% 100.9% 107.4% 110.1% 98.1%
Slovakia Poland Romania
3M 2011 3M 2010 +/-% 3M 2011 3M 2010 +/-% 3M 2011 3M 2010 +/-%
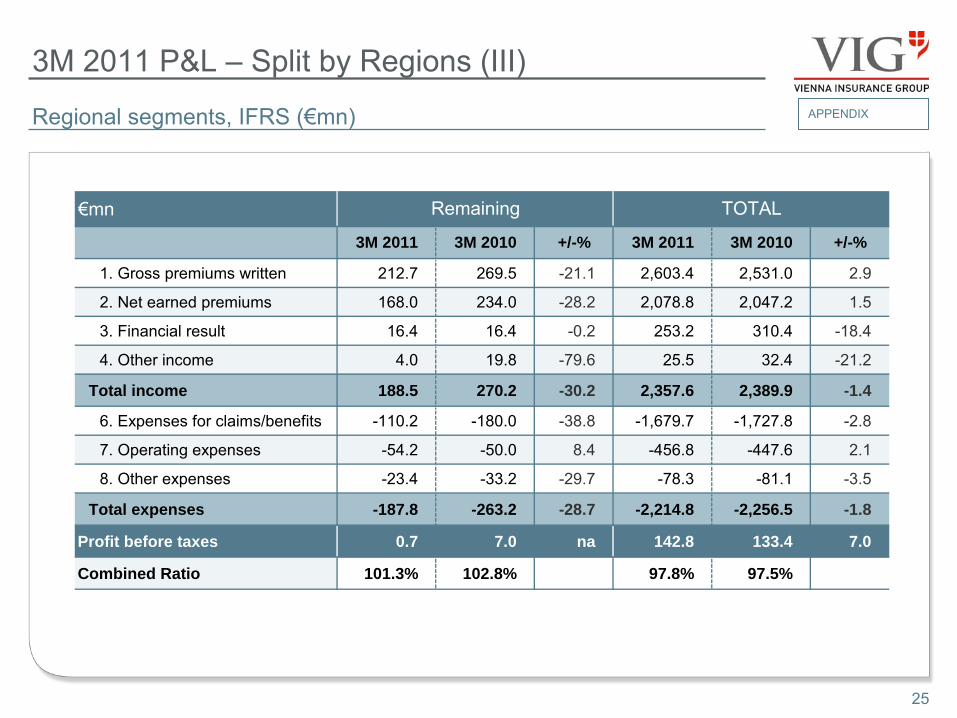
3M 2011 P&L –
Split by Regions (III)
Regional segments, IFRS (€mn) APPENDIX
25
€mn
1. Gross premiums written 212.7 269.5 -21.1 2,603.4 2,531.0 2.9
2. Net earned premiums 168.0 234.0 -28.2 2,078.8 2,047.2 1.5
3. Financial result 16.4 16.4 -0.2 253.2 310.4 -18.4
4. Other income 4.0 19.8 -79.6 25.5 32.4 -21.2
Total income 188.5 270.2 -30.2 2,357.6 2,389.9 -1.4
6. Expenses for claims/benefits -110.2 -180.0 -38.8 -1,679.7 -1,727.8 -2.8
7. Operating expenses -54.2 -50.0 8.4 -456.8 -447.6 2.1
8. Other expenses -23.4 -33.2 -29.7 -78.3 -81.1 -3.5
Total expenses -187.8 -263.2 -28.7 -2,214.8 -2,256.5 -1.8
Profit before taxes 0.7 7.0 na 142.8 133.4 7.0
Combined Ratio 101.3% 102.8% 97.8% 97.5%
TOTAL
+/-%
Remaining
3M 2011 3M 20103M 2011 3M 2010 +/-%
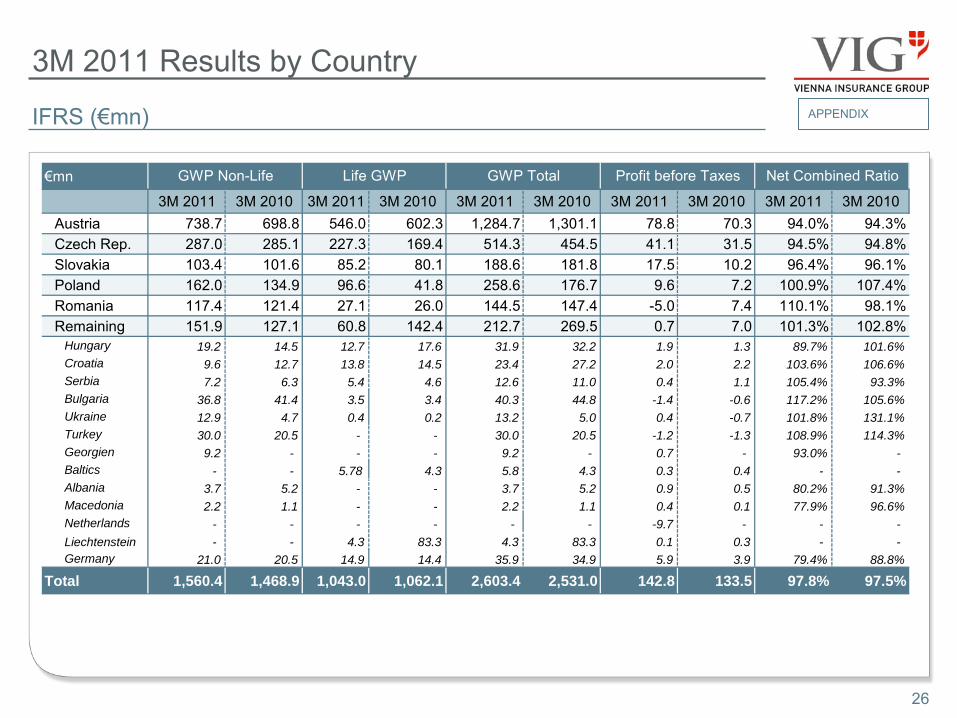
3M 2011 Results by Country
IFRS (€mn) APPENDIX
26
€mn
3M 2011 3M 2010 3M 2011 3M 2010 3M 2011 3M 2010 3M 2011 3M 2010 3M 2011 3M 2010Austria 738.7 698.8 546.0 602.3 1,284.7 1,301.1 78.8 70.3 94.0% 94.3%Czech Rep. 287.0 285.1 227.3 169.4 514.3 454.5 41.1 31.5 94.5% 94.8%Slovakia 103.4 101.6 85.2 80.1 188.6 181.8 17.5 10.2 96.4% 96.1%Poland 162.0 134.9 96.6 41.8 258.6 176.7 9.6 7.2 100.9% 107.4%Romania 117.4 121.4 27.1 26.0 144.5 147.4 -5.0 7.4 110.1% 98.1%Remaining 151.9 127.1 60.8 142.4 212.7 269.5 0.7 7.0 101.3% 102.8%
Hungary 19.2 14.5 12.7 17.6 31.9 32.2 1.9 1.3 89.7% 101.6%Croatia 9.6 12.7 13.8 14.5 23.4 27.2 2.0 2.2 103.6% 106.6%Serbia 7.2 6.3 5.4 4.6 12.6 11.0 0.4 1.1 105.4% 93.3%Bulgaria 36.8 41.4 3.5 3.4 40.3 44.8 -1.4 -0.6 117.2% 105.6%Ukraine 12.9 4.7 0.4 0.2 13.2 5.0 0.4 -0.7 101.8% 131.1%Turkey 30.0 20.5 - - 30.0 20.5 -1.2 -1.3 108.9% 114.3%Georgien 9.2 - - - 9.2 - 0.7 - 93.0% -Baltics - - 5.78 4.3 5.8 4.3 0.3 0.4 - -Albania 3.7 5.2 - - 3.7 5.2 0.9 0.5 80.2% 91.3%Macedonia 2.2 1.1 - - 2.2 1.1 0.4 0.1 77.9% 96.6%Netherlands - - - - - - -9.7 - - -Liechtenstein - - 4.3 83.3 4.3 83.3 0.1 0.3 - -Germany 21.0 20.5 14.9 14.4 35.9 34.9 5.9 3.9 79.4% 88.8%
Total 1,560.4 1,468.9 1,043.0 1,062.1 2,603.4 2,531.0 142.8 133.5 97.8% 97.5%
Net Combined RatioGWP Non-Life Life GWP GWP Total Profit before Taxes
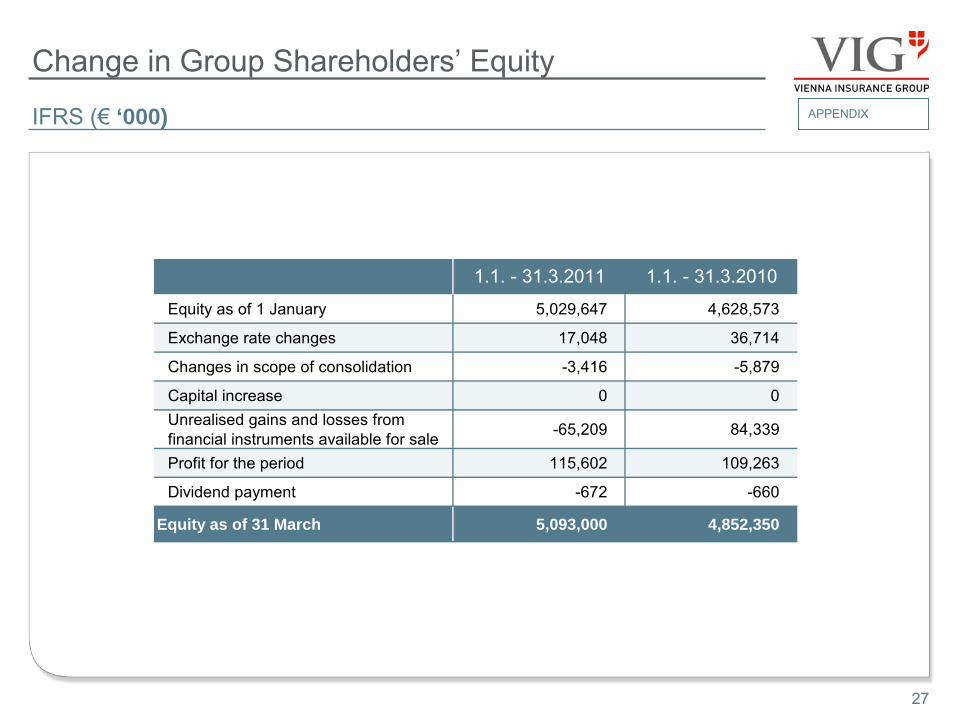
Change in Group Shareholders’
Equity
IFRS (€
‘000) APPENDIX
27
Equity as of 1 January 5,029,647 4,628,573
Exchange rate changes 17,048 36,714
Changes in scope of consolidation -3,416 -5,879
Capital increase 0 0Unrealised gains and losses from financial instruments available for sale -65,209 84,339
Profit for the period 115,602 109,263
Dividend payment -672 -660
Equity as of 31 March 5,093,000 4,852,350
1.1. - 31.3.2011 1.1. - 31.3.2010
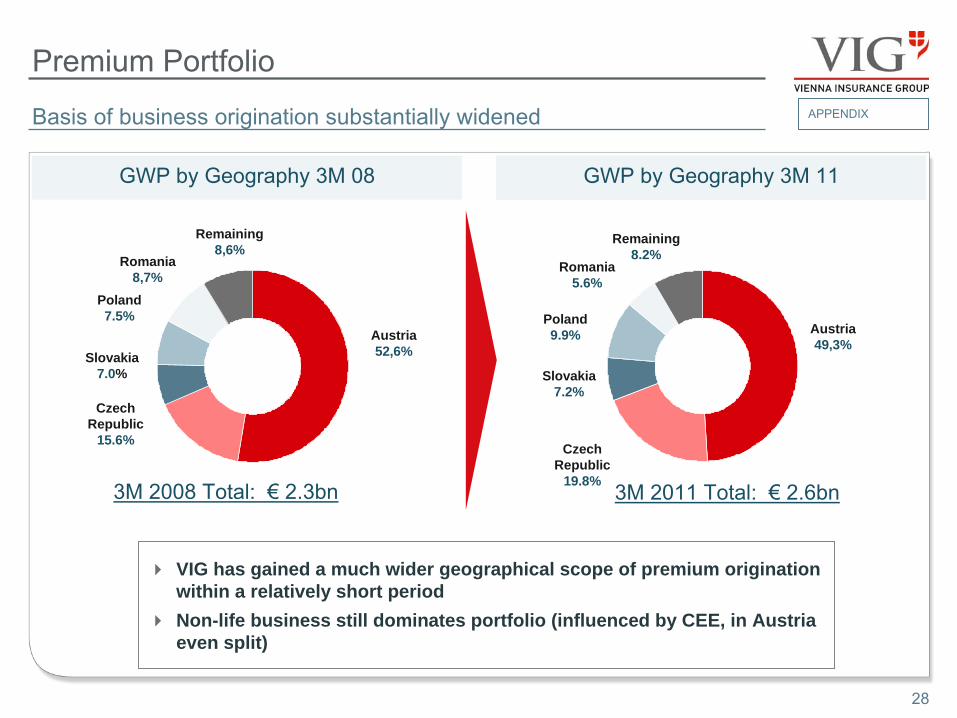
Premium Portfolio
Basis of business origination substantially widened
GWP by Geography 3M 08 GWP by Geography 3M 11
VIG has gained a much wider geographical scope of premium origination within a relatively short period
Non-life business still dominates portfolio (influenced by CEE, in Austria even split)
Austria52,6%Slovakia
7.0%
CzechRepublic
15.6%
Remaining8,6%
Poland7.5%
Romania8,7%
Austria49,3%
CzechRepublic
19.8%
Slovakia7.2%
Remaining8.2%
Poland9.9%
Romania5.6%
3M 2011 Total: €
2.6bn3M 2008 Total: €
2.3bn
APPENDIX
28
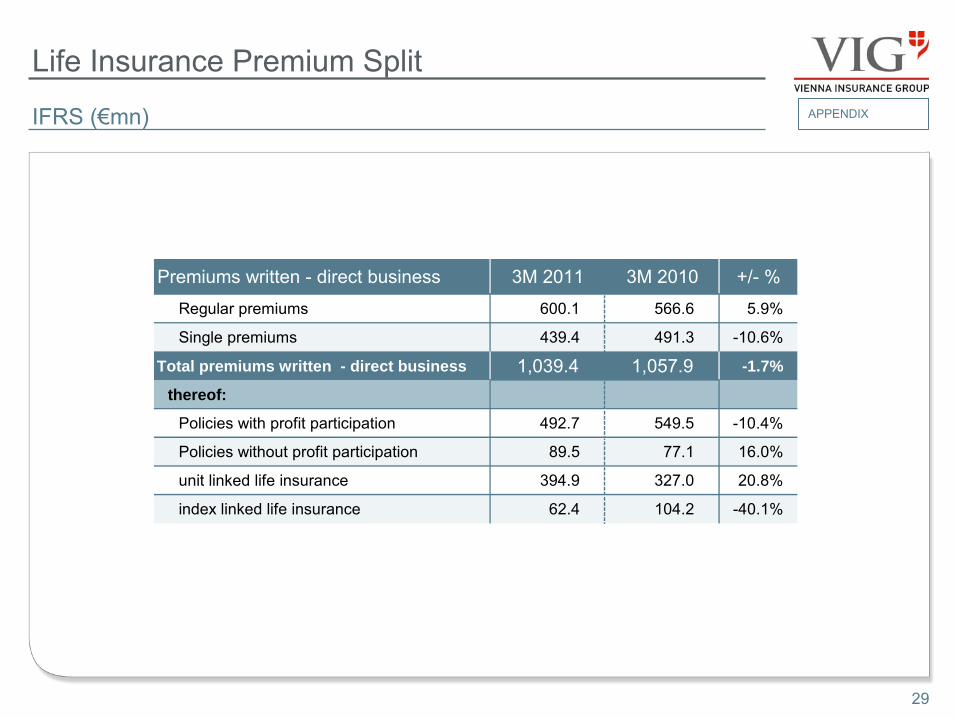
Life Insurance Premium Split
IFRS (€mn) APPENDIX
29
Premiums written - direct business 3M 2011 3M 2010 +/- %
Regular premiums 600.1 566.6 5.9%
Single premiums 439.4 491.3 -10.6%
Total premiums written - direct business 1,039.4 1,057.9 -1.7%
thereof:
Policies with profit participation 492.7 549.5 -10.4%
Policies without profit participation 89.5 77.1 16.0%
unit linked life insurance 394.9 327.0 20.8%
index linked life insurance 62.4 104.2 -40.1%
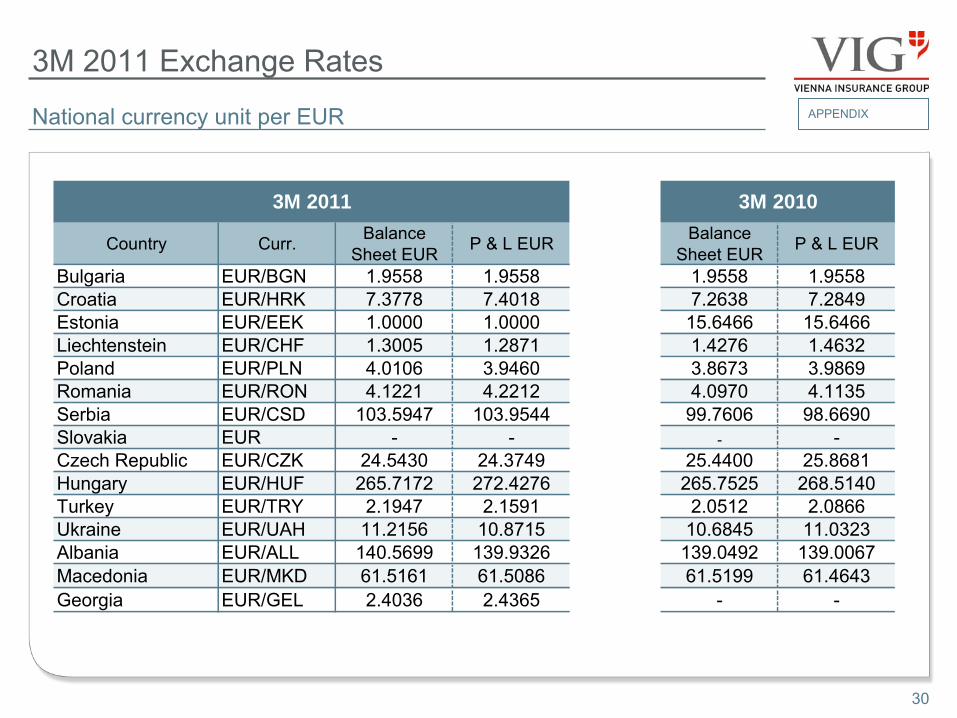
Country Curr. Balance Sheet EUR P & L EUR Balance
Sheet EUR P & L EUR
Bulgaria EUR/BGN 1.9558 1.9558 1.9558 1.9558Croatia EUR/HRK 7.3778 7.4018 7.2638 7.2849Estonia EUR/EEK 1.0000 1.0000 15.6466 15.6466Liechtenstein EUR/CHF 1.3005 1.2871 1.4276 1.4632Poland EUR/PLN 4.0106 3.9460 3.8673 3.9869Romania EUR/RON 4.1221 4.2212 4.0970 4.1135Serbia EUR/CSD 103.5947 103.9544 99.7606 98.6690Slovakia EUR - - - -Czech Republic EUR/CZK 24.5430 24.3749 25.4400 25.8681Hungary EUR/HUF 265.7172 272.4276 265.7525 268.5140Turkey EUR/TRY 2.1947 2.1591 2.0512 2.0866Ukraine EUR/UAH 11.2156 10.8715 10.6845 11.0323Albania EUR/ALL 140.5699 139.9326 139.0492 139.0067Macedonia EUR/MKD 61.5161 61.5086 61.5199 61.4643Georgia EUR/GEL 2.4036 2.4365 - -
3M 2011 3M 2010
3M 2011 Exchange Rates
National currency
unit
per EUR APPENDIX
30
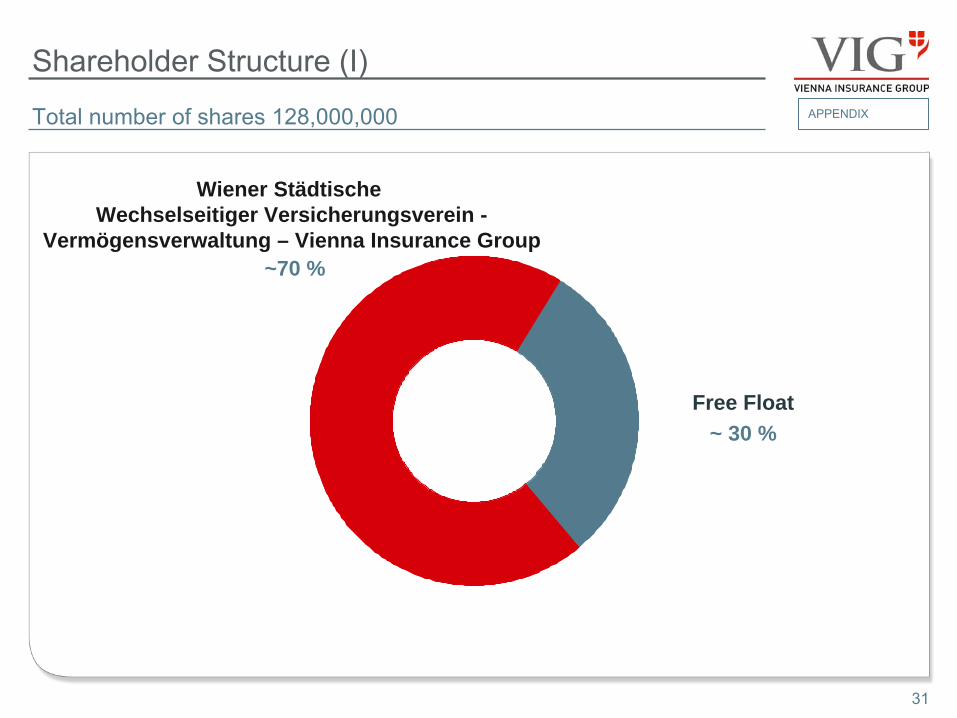
Shareholder Structure (I)
Total number of shares 128,000,000
Wiener Städtische Wechselseitiger Versicherungsverein -
Vermögensverwaltung – Vienna Insurance Group ~70 %
Free Float~ 30 %
APPENDIX
31
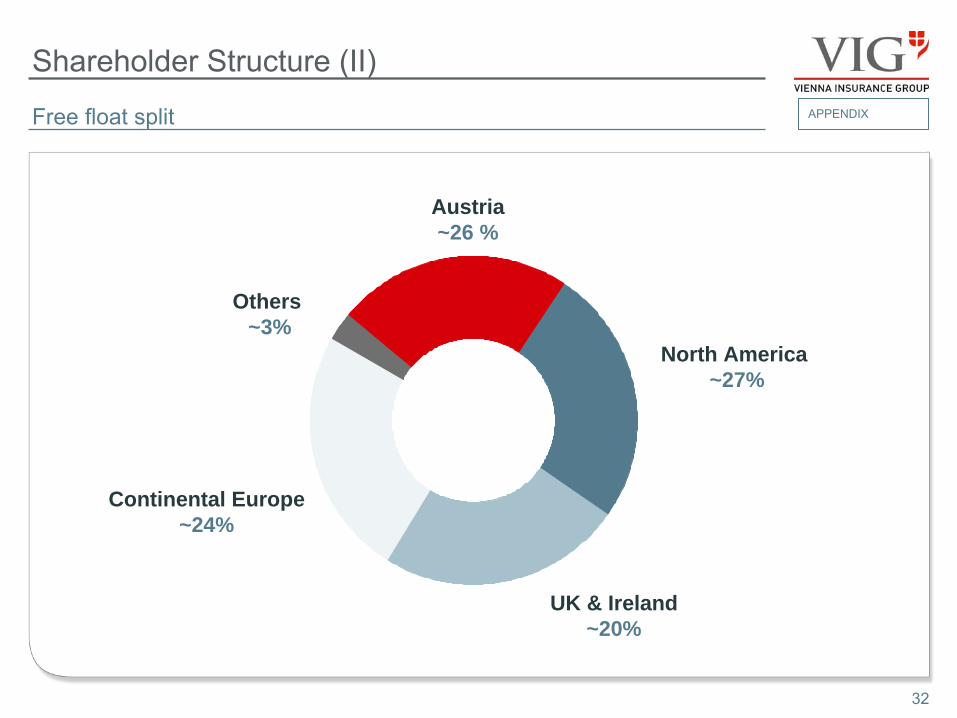
Shareholder Structure (II)
Free float split
Austria ~26 %
North America ~27%
Others ~3%
Continental Europe ~24%
UK & Ireland ~20%
32
APPENDIX
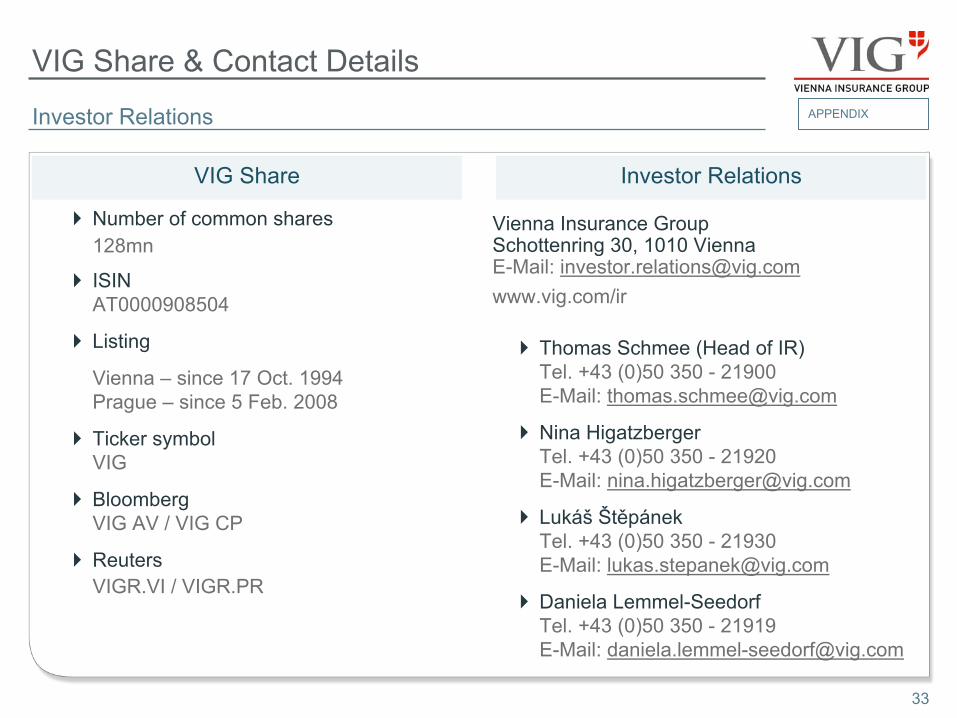
VIG Share & Contact
Details
33
VIG Share Investor Relations
Number of common shares128mn
ISIN
AT0000908504
Listing
Vienna –
since 17 Oct. 1994
Prague –
since 5 Feb. 2008
Ticker symbol
VIG
Bloomberg
VIG AV / VIG CP
Reuters
VIGR.VI / VIGR.PR
Investor Relations
Vienna Insurance Group
Schottenring 30, 1010 Vienna
E-Mail: [email protected]/ir
Thomas Schmee (Head of IR)
Tel. +43 (0)50 350 -
21900
E-Mail: [email protected]
Nina Higatzberger
Tel. +43 (0)50 350 -
21920
E-Mail: [email protected]
Lukáš
Štěpánek Tel. +43 (0)50 350 -
21930
E-Mail: [email protected]
Daniela Lemmel-Seedorf
Tel. +43 (0)50 350 -
21919 E-Mail: [email protected]
APPENDIX
Disclaimer
IMPORTANT NOTICE
These materials do not constitute or form part, or all, of any offer or invitation to sell or issue, or any solicitation of any offer to purchase or subscribe for, any securities in any jurisdiction in which such solicitation, offer or sale would be unlawful, nor shall part, or all, of these materials form the basis of, or be relied on in connection with, any contract or investment decision in relation to any securities.
These materials contain forward-looking statements based on the currently held beliefs and assumptions of the management of VIENNA INSURANCE GROUP AG Wiener Versicherung Gruppe
(“VIG”), which are expressed in good faith and, in their opinion, reasonable. These statements may be identified by words such as “expectation”
or “target”
and similar expressions, or by their context. Forward-looking statements involve known and unknown risks, uncertainties and other factors, which may cause the actual results, financial condition, performance, or achievements of VIG, or results of the insurance industry generally, to differ materially from the results, financial condition, performance or achievements express or implied by such forward-
looking statements. Given these risks, uncertainties and other factors, recipients of this document are cautioned not to place undue reliance on these forward-looking statements. VIG disclaims any obligation to update these forward-looking statements to reflect future events or developments.
34
APPENDIX