increasing differences between firms: market power and the
TRANSCRIPT

19
Increasing Differences Between Firms: Market Power
and the Macroeconomy
John Van Reenen
I. Introduction
Increasingly, researchers have been using microeconomic data on firm differences to better understand macroeconomic outcomes. It is now widely accepted that there is enormous cross-sectional heteroge-neity in establishment performance even within narrowly defined in-dustries. But what is less recognized is that these inequalities between firms have been increasing over time, not just in terms of productivity, but also in terms of sales—leading to a substantial increase in sales concentration across a wide range of markets. This polarization has also been evident in wages, with almost all of the increase in earn-ings inequality happening between firms with rather little change in inequality within firms.
The aim of this paper is to document some of the emerging facts on firm heterogeneity especially in terms of recent changes. It is de-signed to “set the scene” for discussions in terms of macro implica-tions, causes and policy responses. I do not aim to give definitive answers to what these changes imply in terms of specific policies, but I do speculate on some potential policy implications toward the end of the paper.

20 John Van Reenen
A theme of this paper is whether the increasing gap between large and small firms reflects an increase in market power due to a reduc-tion in competition arising from (for example) weakened antitrust enforcement. The fall in the labor share of gross domestic product (GDP) and the rise in estimated aggregate price-cost markups are consistent with a rise in market power. A generalized rise in market power can have several important (and often harmful) macroeconom-ic consequences. For example, there is much evidence that weakened competition undermines productive efficiency1 and it is clear that productivity growth has been very disappointing over the last decade across Organisation for Economic Co-operation and Development (OECD) countries. Even without cost inefficiencies, greater monop-oly power is still a negative supply shock to the economy. In the long run real wages will need to fall to restore an inflation rate consistent with the central bank’s target. This will mean a lower participation rate (as work is less attractive) and/or higher unemployment.
Although such arguments over rising market power from lax an-titrust enforcement should be taken seriously, I suggest a more nu-anced view. There are other explanations of the increasing differences that do not rest on a generalized fall in product market competition. Indeed, an equally strong case could be made that the forces of glo-balization and new technologies have changed the nature of com-petition without necessarily diminishing it across the board. For ex-ample, if more markets are becoming “winner take all” as with digital platform competition, this will generate the dominance of “superstar firms” such as Amazon, Apple, Facebook, Google and Microsoft. The success of such firms may be as much due to intensified competition “for the market” rather than anti-competitive mergers or collusion “in the market.” Furthermore, even in lower-tech markets like retail and wholesale, rapid falls in quality-adjusted information and com-munication technologies (ICT) prices may give larger firms—who can invest heavily in developing proprietary software—major advan-tages in logistics and inventory control management.
We will discuss several pieces of evidence that are suggestive of some role for the superstar firm hypothesis. First, using firm-level data to decompose the changes in aggregate markups and labor shares, the vast

Increasing Differences Between Firms: Market Power and the Macroeconomy 21
majority of the changes are due to reallocation between firms toward larger, more productive and profitable firms. Most American firms have seen either no increase or a fall in their markups and labor shares. Second, the industries growing most concentrated appear to have ris-ing productivity and innovation which is consistent with reallocation to more efficient and innovative firms. Third, the qualitative trends of concentration and markups seem similar across countries, which sug-gests global changes, rather than country specific institutional changes such as the relative weakening of U.S. competition policy compared to Europe. None of these are dispositive, so we also look at other explana-tions—such as an increasing role for intangible capital.
I focus on long-run secular changes rather than how price-cost markups change over the business cycle. Short-run fluctuations in markups are a very important research area, especially for New Keynesian models, which focus on sticky prices implying countercy-clical markups. The empirical evidence, however, casts doubt on this as markups appear acyclical or even pro-cyclical (Nekarda and Ramey 2013). Some of the methodological issues in estimating markups will also appear in the discussion below.
The structure of this paper is as follows. Section II lays out some facts on the level of firm heterogeneity and Section III focuses on changes over time. In Section IV, I discuss alternative explanations of the increase in concentration and markups based on (i) declining competition and (ii) superstar firms. Section V gives some tentative policy implications and Section VI concludes.
II. Productivity Variation
II.i. TFP Differences at a Point of Time
Chart 1 shows GDP per worker and total factor productivity (TFP) for a large number of countries where the values are normalized to be 1 in the United States (so a number like ½ on the vertical axis implies that a country has 50 percent of the TFP of the United States). Two things stand out. First, it is clear that those countries with high TFP are also the countries with high GDP per worker, implying that capital accumulation cannot explain all of the differential wealth of nations.2
Second, it is striking that there is such a wide dispersion in TFP.

22 John Van Reenen
Taken literally this suggests that it takes a Liberian worker a month to produce what an American worker can produce in a day with the same inputs.
Many scholars have looked to firm heterogeneity to understand these stark developmental differences (e.g. see the review in Hopen-hayn 2014). Firm heterogeneity has a long history in social science. The first systematic empirical analysis focused on the firm size distri-bution measured by employment, sales or assets. Gibrat (1931) char-acterized the size distribution as approximately log normal and sought to explain this with reference to simple statistical models of growth. In fact, the firm size distribution is closer to a power law is now well documented in every country in the world where data are available.3
Today we are lucky to live in a world of large-scale (fre-quently near population) data on firms and establishments.4
These are usually from national statistical agencies that collect mi-crodata primarily to build aggregate information either at the in-dustry or macro level. Increasingly, researchers have been granted confidential access to such government data (e.g. the Longitudinal Business Database of U.S. establishments). A second major source is from the private sector. For example, Bureau van Dijk’s Orbis
Chart 1Big Spread of Productivity Between Countries
Notes: 2010 data; Total Factor Productivity (Labor augmenting with common share α =1/3).Sources: Penn World Tables 8.0; Jones (2015).
TFP (Labor-augmenting, U.S.=1)
GDP per worker (U.S.=1)
1
2
1
½
½
¼
¼
⅛
⅛
16
16
32
3264
C. Afr. Republic
Liberia
Niger
Sierra LeoneBenin
Tanzania
Rwanda Uganda
MalawiTogo
Cote D’lvoireMali
Senegal
GhanaVietnam
CongoBolivia
Pakistan
India
SwazilandMongolia
UkraineChina
�ailandBrazil
Egypt
Sudan Guatemala IraqBelize
VenezuelaPanama
PolandMaldives
Zimbabwe
TurkeyIsrael
BarbadosTrinidad/Tobago
United KingdomIreland
Norway
Macao KuwaitQatar
JordanAlbania
Malaysia
HungaryCzech Republic
South KoreaJapan
SpainFrance
United States
Kenya
Increasing Differences Between Firms: Market Power and the Macroeconomy 23
dataset has accounting panel data from about 200 million firms from almost every country in the world (e.g., Bajgar et al. 2018). Since this includes private companies, researchers can move beyond a focus on simply publicly listed firms such as Compustat. Liberalization of access to administrative data and rapid increases in computer pow-er have enormously enhanced our capacity to store and interrogate these new microdata sources.
One of the robust facts emerging from the analysis of large-scale firm-level databases is the very high degree of productivity disper-sion. For example, Syverson (2004, 2011) analyzed labor productiv-ity (value-added per worker) in U.S. manufacturing establishments in the 1997 U.S. Economic Census and shows that on average, an es-tablishment at the 90th percentile of the distribution had four times higher labor productivity than one at the 10th percentile in the same four-digit sector. Even after controlling for other inputs the TFPR ratio is still 2 to 1. Bartelsman, Haltiwanger and Scarpetta (2013) show that even larger differences exist for other OECD countries.5
The aggregate TFP differences documented in Chart 1 are influ-enced by how different economies allocate output to firms of dif-ferent productivity levels. For example, India, China and Mexico appear to allow less efficient firms to survive for much longer than in the U.S. (Hsieh and Klenow 2009, 2014). A large number of pos-sible explanations present themselves that we will later examine, such as competitive intensity in the product market, labor, capital or hous-ing market frictions, size-related regulations and other distortions due to corruption and arbitrary tax.
II.ii. Aggregate Changes in Productivity Over Time
Solow (1957) found that the vast majority of the growth of output per worker in the United States was due to growth in TFP rather than capital accumulation. The finding that TFP is at least as impor-tant as observable factors of production in such growth accounting exercises has been replicated for numerous countries. The traditional view is to analyze the productivity growth of a representative firm. This within-firm growth could be from innovation expanding the

24 John Van Reenen
technological frontier outward or from the adoption of existing ideas by follower firms.
By contrast, the Schumpeterian tradition has long emphasized the between-firm component. Much of aggregate productivity growth is from the reallocation of output away from less productive firms toward more productive firms. This reallocation can take place on the extensive margin as less productive firms exit and more productive firms enter.6
This is the traditional notion of creative destruction, which is a Dar-winian force of natural selection. But reallocation can also take place on the intensive margin as market shares get reallocated among in-cumbents away from the least efficient and toward the more efficient firms. In either case these are between-firm effects that are distinct from the traditional within-firm effects.
Bailey, Hulten and Campbell (1992) found that over a five-year period about half of a typical U.S. industry’s TFP growth was due to the reallocation of output between establishments rather than ongoing incumbent within plant productivity growth. There are mul-tiple ways in which to perform such statistical decompositions of pro-ductivity growth into within-firm and between-firm components.7
But whatever way this is performed, subsequent work has confirmed that there is always a substantial between-firm/reallocation component.
II.iii. Where Do Firm Productivity Differences Come From?
What could explain these differences in productivity, and how can they persist in a competitive industry? One explanation is that the differences are just measurement error. Although there is cer-tainly some measurement error, substantial productivity differences show up clearly even for quite homogeneous well-measured goods.8
It is also the case that higher measured TFP is positively related to firm size, growth and survival probabilities, which suggests that there is some signal. Further, there is substantial persistence in productivity, which would not be the case if measured TFP was just transitory errors.9
What lies behind these firm-level TFP differences? There are two levels to addressing this issue. One level is the proximate causes of the differences and the second is more fundamental causes. This is like peeling the layers of an onion. If we discovered that all labor

Increasing Differences Between Firms: Market Power and the Macroeconomy 25
productivity differences were due to fixed capital like plant and machinery (i.e., no TFP differences) we would then have to ad-dress the question of why these differed. But at least observable capital would give us a proximate explanation. Consider one of the proximate causes of TFP differences—new technologies. The generation of technological innovation (as proxied by measures of R&D or citation-weighted patents) or the adoption of technolo-gies (e.g., robotics, AI, other ICTs, hybrid corn, new drugs, etc.) would therefore be the things to focus on. There is a huge literature on such observable measures of innovation and diffusion and their relationship to firm performance.
Differences in the generation and use of new technologies, how-ever, are not able to fully account for firm productivity spreads. First, even after controlling for a host of observable technology measures there remains a very large TFP residual. Second, the impact of ob-servable technologies seems to vary systematically with the manage-ment and organization of the firm. This has most clearly been seen in studies of the effect of ICT on productivity (e.g., Bresnahan, Bryn-jolfsson and Hitt 2002; Bloom, Sadun and Van Reenen 2012). There is a very wide range of effects of ICT on productivity and the impact depends very much on the organizational and management practice in the firm.
There is now a considerable body of evidence suggesting that man-agement practices are a major reason for TFP differences. To measure management practices, we developed a methodology (World Man-agement Survey, WMS) first described in Bloom and Van Reenen (2007). In summary, we use an interview-based evaluation tool that defines and scores from 1 (“worst practice”) to 5 (“best practice”) across 18 key management practices relating to data collection/moni-toring, targets and incentives. The WMS now covers 34 countries and multiple sectors (e.g., manufacturing, retail, health care and edu-cation). More recently, we have developed the questions in a form that can be sent out with the standard Census Bureau surveys. These Management and Organizational Practice Surveys (MOPS) are being run in nine countries, with the largest samples in the United States

26 John Van Reenen
(which now covers over 80,000 establishments in two panel waves—see Bloom et al. 2017).
These surveys show large heterogeneity in firm-level manage-ment quality within every country. For example, Chart 2 shows this firm-level dispersion for the different countries in the WMS, which broadly mimics the variation observed in productivity. As with the average productivity levels in Chart 1, the United States has a very high management score, but there is large variation within the Unit-ed States and indeed every country. The American advantage over India is not because every U.S. firm has managerial superiority over every Indian firm.
These management differences are strongly correlated with mea-sures of firm performance such as productivity, size and survival. And a number of randomized control trials and natural experiments sug-gests that this correlation is causal (e.g., Bloom et al. 2013, Bruhn et al. 2017 and Giorcelli 2017). Across countries, around a third of the aggregate TFP differences in Chart 1 are accounted for by the management scores, and around half of the U.S.-EU TFP differences in the decade after 1995 (see Bloom, Sadun and Van Reenen 2017).
If these management and technological capabilities are so beneficial to firms, why are they not quickly imitated? There is certainly dif-fusion of capabilities over time, but there are many barriers to dif-fusion. This is the central topic of organizational economics which emphasizes issues of information, complementarities, incentives and collective action problems within the firm (Gibbons and Roberts 2013, Rivkin 2000).
III. Increasing Differences Between Firms Over Time
Having established the fact of a large degree of firm heterogeneity in the cross section, I now move to a less well-known set of facts—that there has been an increase in many dimensions of firm inequality in the last few decades.
III.i. Concentration Trends
As discussed in the previous section, the most basic measure of heterogeneity is firm size. Gabaix and Landier (2010) were among

Increasing Differences Between Firms: Market Power and the Macroeconomy 27
Chart 2Management Varies Heavily Within Countries
.511.5 .511.5 .511.5 .511.5 .511.5 .511.5
12
34
51
23
45
12
34
51
23
45
12
34
51
23
45
Tot
alAr
gent
ina
Austr
alia
Braz
ilC
anad
aC
hile
Chi
naC
olom
bia
Ethi
opia
Fran
ceG
erm
any
Gha
na
Gre
at B
ritai
nG
reec
eIn
dia
Ital
yJa
pan
Ken
ya
Mex
ico
Moz
ambi
que
Mya
nmar
New
Zea
land
Nic
arag
uaN
iger
ia
Nor
ther
n Ir
elan
dPo
land
Port
ugal
Rep
ublic
of I
rela
ndSi
ngap
ore
Spai
n
Swed
enT
anza
nia
Tur
key
Uni
ted
Stat
esV
ietn
amZ
ambi
a
Fraction of firms
Note: Firm level average management scores, 1 (worst practice) to 5 (best practice). Source: World Management Survey data from Bloom, Sadun and Van Reenen (2017).

28 John Van Reenen
the first to argue for an increase in average firm size in their explana-tion of increasing CEO pay. However, their measure of firm size was stock market value, which can fluctuate for many reasons unrelated to fundamentals. But more critically, their sample was only over U.S. publicly listed firms from Compustat. This has the problem that (i) it covers only around 30 percent of U.S. employment (the very larg-est firms) and (ii) the Compustat sample changes in a very nonran-dom way over time due to declining IPOs and the addition of many smaller high tech start-ups (see Davis et al. 2007).
In Autor et al. (2017, 2018) we calculate measures of concentration for a consistent set of four-digit (SIC) industries using the U.S. Eco-nomic Census between 1982 and 2012. We do this for the six main Economic Census sectors that cover over 80 percent of private sector jobs. Chart 3 presents the data for each sector showing weighted aver-age changes in four-firm (CR4) and 20-firm (CR20) concentration measures. The data show sharp increases in concentration across the whole U.S. economy in the last 30 years, with the growth generally stronger in the second half of the sample. A similar picture of generally rising concentration emerges from alternative measures such as the Herfindahl Index or CR1.
This finding is consistent with other papers examining concentra-tion trends. Council of Economic Advisers (2016) discuss various industry studies such as airlines and telecoms which have shown sig-nificant consolidation. Grullon et al. (2016) also conclude that more than three-quarters of U.S. industries have had an increase in con-centration since 1997.
Chart 3 shows that concentration has risen across industries within all six of the Economic Census sectors in a broadly secular way. No-tice that the upper lines are for sales and the lower ones are for em-ployment. Both measures of concentration have tended to rise, but sales concentration is greater than employment concentration at any point of time. This illustrates that many firms have “scale without mass”—e.g., many high-revenue firms like Google and Facebook have relatively few employees (see Brynjolfsson et al. 2008). Furthermore, unlike other sectors, in manufacturing the growth in employment concentration is pretty flat compared to sales concentration. Some

Increasing Differences Between Firms: Market Power and the Macroeconomy 29
Chart 3Rising Concentration in the United States
CR20
CR4
Top Four Concentration Top 20 Concentration
44
42
40
38
36
34
1980 1990 2000 2010
75
70
65
60
CR4 With Sales
CR20 With Sales CR20 With Employment
CR4 With Employment
Top Four Concentration Top 20 Concentration
30
25
20
15
10
1980 1990 2000 2010
45
40
35
30
25
CR4 With Sales
CR20 With Sales CR20 With Employment
CR4 With Employment
A. Manufacturing Sector
B. Retail Trade
Notes: Weighted average of four-digit industries within each large sector. Manufacturing: 388 inds; Retail: 58.Source: Autor, Dorn, Katz, Patterson and Van Reenen (2017).

30 John Van Reenen
C. Services
D. Wholesale Trade
Top Four Concentration Top 20 Concentration
16
14
12
10
8
1980 1990 2000 2010
26
28
24
22
20
18
CR4 With Sales
CR20 With Sales CR20 With Employment
CR4 With Employment
Top Four Concentration Top 20 Concentration30
25
20
15
10
60
50
40
30
20
1980 1990 2000 2010
CR4 With Sales CR4 With Employment
CR20 With EmploymentCR20 With Sales
Notes: Weighted average of four-digit industries within each large sector. Wholesale: 56. Services: 95.Source: Autor, Dorn, Katz, Patterson and Van Reenen (2017).

Increasing Differences Between Firms: Market Power and the Macroeconomy 31
E. Utilities Plus Transportation Sector
F. Finance Sector
Notes: Weighted average of four-digit industries within each large sector. Utilities & Transport: 48; Finance 31Source: Autor, Dorn, Katz, Patterson and Van Reenen (2017).
1990 1995 2000 2005 2010
CR4 With Sales
CR20 With Sales
CR4 With Employment
CR20 With Employment
Top Four Concentration Top 20 Concentration
40 64
62
60
58
56
35
30
25
Top Four Concentration Top 20 Concentration
1990 1995 2000 2005 2010
35
25
30
60
55
50
4520
CR4 With Sales
CR20 With Sales
CR4 With Employment
CR20 With Employment

32 John Van Reenen
commentators have underestimated the growth of firm concentration by focusing on employment instead of sales (or value added) and on just the manufacturing sector instead of the whole economy.
Another fact about concentration is that the trends are still there, but are more muted when we aggregate over the whole economy (or even look at the two- or three-digit level industry level). This illus-trates that it is not simply growth of conglomerates that dominate multiple industries causing these trends, but rather that firms are fo-cusing in particular sectors where their core competency is stronger.
Finally, note that one might be less concerned if this increased concentration was accompanied by an increase in firm mobility. In other words, it could be very different firms who were in the top four in an industry in one year compared to being in the top four five years earlier. There is certainly turnover at the top. However, there is no evidence in our data that this turnover has increased over time. If anything, firms in the top group in one Census year are increasingly likely to remain there five years later (so-called “persis-tent dominance”).
What about other countries? The most comprehensive analysis of this issue is in a series of OECD reports using MULTIPROD, which is a firm-level database they have constructed in cooperation with the national statistical agencies in many countries and so are broadly similar to the U.S. Economic Census in Chart 3. Chart 4 is taken from Criscuolo (2018) who uses these data to show that, on average, within the nine EU countries where comprehensive data are available, sales concentration has risen since 2000. This remains true when adding other non-EU OECD countries such as Australia, Japan and Switzerland. Some of the countries are small relative to the United States, so one might be concerned that the relevant market is geographically much wider. So an alternative is to look at concentra-tion in each industry across Europe as a whole. Using this alternative measure the OECD also find increases in concentration since 2000.10
III.ii. Productivity Dispersion Trends
The increase in productivity dispersion in the United States has been pointed out in several papers (e.g., Decker, Haltiwanger, Jarmin

Increasing Differences Between Firms: Market Power and the Macroeconomy 33
and Miranda 2018)—see Chart 5 for example. Decker et al. (2018) see this as one of many indicators suggesting a fall in U.S. business dynamism (particularly since 2000). These indicators include a fall in the fraction of workers employed in young firms; slowing job mo-bility across firms and geographical areas; slower employment respon-siveness of firms to TFP shocks and a falling number of start-ups. Bils, Klenow and Ruane (2017) have argued that observed increases in productivity dispersion are misleading because they could be gener-ated by increased measurement error. This seems unlikely, however, as the LBD series in Chart 5 is based on administrative rather than survey data and there is little direct evidence that classical measure-ment error has increased over time. Furthermore, as White et al. (2018) show, although there are errors in the raw Census data, the extensive cleaning and imputations performed by the U.S. Census actually tend to underestimate the true level of productivity disper-sion rather than overestimate it.
Again, the OECD has examined this in 14 other developed countries. Chart 6 (Andrews et al. 2017) is also taken from MULTI-PROD administrative data and documents an increase in both labor
Chart 4Like U.S., Sales Concentration has Increased in the EU
Note: Year effects from regressions with country-industry dummies and year dummies (BEL, DEU, DNK, FIN, FRA, HUN, NOR, PRT, SWE).Sources: OECD Multiprod, https://www.oecd.org/sti/ind/multiprod.htm; Criscuolo (2018).
3
2
1
2001 2003 2005 2007 2009 2011 2001 2003 2005 2007 2009 2011
3
2
1
Cha
nge
Sinc
e In
itial
Yea
r (pe
rcen
tage
poi
nt) C
hange Since Initial Year (percentage point)
Manufacturing Market ServicesShare of GO in Top Decile of Sales

34 John Van Reenen
Chart 5Rising U.S. Productivity Dispersion (manufacturing)
Chart 6Change in Firm-Level Productivity Dispersion, 2001-12
Notes: Standard Deviation of log(real sales/employment) normalized in a NAICS six digit industry-year. HP filtered series in dashed lines. LBD is population whereas ASM is corrected for sample selection. Weights are employment weights.Source: Decker, Haltiwanger, Jarmin and Miranda (2018, figure A6).
Notes: Coefficients on year dummies from regression of 90-10 log(productivity) within an industry-year cell in 16 OECD countries (AUS, AUT, BEL, CHL, DEU, DNK, FIN, FRA, HUN, ITA, JPN, NLD, NOR, NZL, PRT SWE).Source: Berlingieri, Blanchenay and Criscuolo (2017) https://www.oecd.org/sti/ind/multiprod.htm.
Survey (ASM)
Survey (ASM), weightedAdmin (RE-LBD)
Admin (RE-LBD), weighted
1.00
.95
.90
.85
.80
.75
.70
1.00
.95
.90
.85
.80
.75
.70
1996
1997
1998
1999
2000
2001
2002
2003
2004
2005
2006
2007
2008
2009
2010
2011
2012
15
10
5
15
10
5
2001 2003 2005 2007 2009 2011 2001 2003 2005 2007 2009 2011
Manufacturing Services
Perc
ent Percent
LP MFP (Solow)

Increasing Differences Between Firms: Market Power and the Macroeconomy 35
productivity and TFP dispersion, qualitatively similar to the U.S. trends in the previous graphs (they also find these patterns in BVD Orbis company accounts).
III.iii. Trends in Firm-Level Pay Dispersion
Labor economists have long pointed to large wage differences across individuals and, more recently, to the big increase in individ-ual earnings inequality that began in the United States in the late 1970s. Most other countries followed, some more quickly (like the U.K.) than others (e.g., Card et al. 2013, show that the increase in German inequality only really started in the mid-1990s). A lead-ing factor behind the wage inequality increase is the increasing return to skill, mainly driven by skill-biased technical change.11
Institutional changes such as declining union power and falls in the real value of the minimum wage also played a role.
Many authors long suspected that there was a large between-firm component to wage inequality (e.g., Davis and Haltiwanger 1991, Faggio et al. 2010), but this was difficult to convincingly demonstrate as matched comprehensive employer-employee data were unavailable in those countries where inequality had grown the most. This meant that one could not track within firm wage inequality across individu-als. Further, the average wage at the plant level in Census type data is payroll divided by workers (or hours) and this can change due to changing worker composition (e.g., by skill group, age, etc.—vari-ables which most Census data do not track).
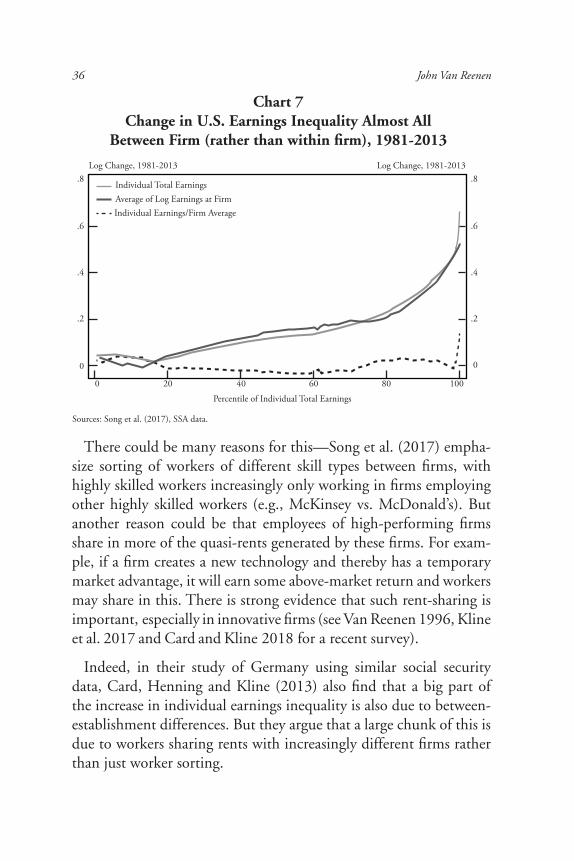
Recently, Song et al. (2017) have used U.S. Social Security Adminis-tration (SSA) data which are near population data following the same workers over time and across firms. This allows them to decompose the overall increase in individual earnings inequality into between firm and within firm components. Chart 7 shows that just about all of the increase in earnings inequality has happened between firms rather than within firms (except maybe for the top percentile, domi-nated by the CEO). In other words the oft-cited differences within companies between high- and low-paid workers explain very little of the increase in overall U.S. earnings inequality.
36 John Van Reenen
There could be many reasons for this—Song et al. (2017) empha-size sorting of workers of different skill types between firms, with highly skilled workers increasingly only working in firms employing other highly skilled workers (e.g., McKinsey vs. McDonald’s). But another reason could be that employees of high-performing firms share in more of the quasi-rents generated by these firms. For exam-ple, if a firm creates a new technology and thereby has a temporary market advantage, it will earn some above-market return and workers may share in this. There is strong evidence that such rent-sharing is important, especially in innovative firms (see Van Reenen 1996, Kline et al. 2017 and Card and Kline 2018 for a recent survey).
Indeed, in their study of Germany using similar social security data, Card, Henning and Kline (2013) also find that a big part of the increase in individual earnings inequality is also due to between-establishment differences. But they argue that a large chunk of this is due to workers sharing rents with increasingly different firms rather than just worker sorting.
Chart 7Change in U.S. Earnings Inequality Almost All
Between Firm (rather than within firm), 1981-2013
Sources: Song et al. (2017), SSA data.
.8
.6
.4
.2
0
0 20 40 60 80 100
.8
.6
.4
.2
0
Individual Total EarningsAverage of Log Earnings at FirmIndividual Earnings/Firm Average
Log Change, 1981-2013 Log Change, 1981-2013
Percentile of Individual Total Earnings

Increasing Differences Between Firms: Market Power and the Macroeconomy 37
III.iv. Summary on Increasing Differences
Not only are there enormous differences between firms at a point of time in terms of performance (as shown in Section II), these dif-ferences appear to be increasing over time in the United States and other developed countries. I have focused on the evidence for disper-sion in size, productivity and wages—three key indicators—but there is also evidence of increased dispersion of other firm measures such as rates of return on investment in public firms (Council of Economic Advisers 2016).
IV. The Weakening Competition Explanation
One popular explanation of the patterns documented in the pre-vious section is that they reflect a generalized increase in product market power. Competition authorities often use the degree of sales concentration as a signal of market power—for example mergers between large firms are subject to additional scrutiny if they are in very concentrated markets. The fact that the productivity gap has widened could reflect anti-competitive practices to prevent the less productive firms from catching up. And rent-sharing would mean a privileged elite of workers were able to share in the bounty from monopolistic practices (an example might be the high pay of workers in the financial services sector).
In this section we evaluate the weakening competition argument by examining the evidence on markups (IV.i); look at possible causes of declining competition (IV.ii) and briefly mention welfare implica-tions (IV.iii), which we link more explicitly with policy in Section V. In subsections IV.iv and IV.v we detail an alternative perspective—superstar firm models and look at the empirical evidence that could distinguish this model from the weakening competition story (IV.vi). Finally we examine some alternative explanations in subsection IV.vii.
IV.i. Evidence—Markups and the Labor Share
Concentration is a crude measure of market power partly because of the difficulty of defining the relevant market. A more direct approach is to try to measure producer price-cost markups. The

38 John Van Reenen
well-documented decline in the labor share of GDP—see Chart 8—is broadly consistent with a rise in markups. To see this, note that in a wide class of imperfect competition models (e.g., Hall 1988)12, one can write the markup μi of firm i ’s ratio of its price (p
i) to its marginal
cost (ci) as:
µi =α iv / si
v (1)
whereα iv is the output elasticity with respect to a variable factor v
and siv is the factor share, the cost of factor v in total revenue (i.e.,
siv =wi
vxiv / piqi where w is the factor price, x the factor quantity
and q the firm’s output). This implies that the markup can be estimat-ed from just a production function parameter and a variable factor share. For example, in a representative firm model with a time invari-ant Cobb-Douglas production function we can write the markup as a function of the labor share at time t as:
µt =αL / st
L (2)
Hence, the fall in the labor share is the inverse of the rise in the markup. Using Chart 8 we see the labor share fell from about 64 percent in 1982 to 58 percent in 2016. If α L= ⅔, for example, this implies that the markup rose from 4 percent in 1982 to 15 percent by 2016 (1.04 to 1.15).
There are many issues with accurately measuring the labor share of GDP such as the treatment of the property sector; the income of the self-employed and business owner-managers; differences between net and gross GDP. Although such corrections affect the magnitude of the fall of the labor share, the fact that there has been a fall in the United States and other OECD countries seems robust to different ways of dealing with these issues (e.g., Karabarounis and Neiman 2014 and Autor et al. 2018 focus on the corporate sector).
An alternative to relying on equation (2) is to take a more direct approach of measuring capital. Barkai (2017) uses macroeconomic data and calculates the share of profits ( Π ) in GDP (PY ) since the early 1980s using the accounting formula:
ΠPY
⎛⎝⎜
⎞⎠⎟ t
= 1− w LLPY
⎛⎝⎜
⎞⎠⎟ t
− rKPY
⎛⎝⎜
⎞⎠⎟ t (3)

Increasing Differences Between Firms: Market Power and the Macroeconomy 39
He finds that the profit share has risen because both the labor share and the capital share have declined, which is consistent with rising market power. The capital share is more challenging to calculate than the labor share as one needs to robustly calculate the opportunity cost of capital (r). Karabarbounis and Neiman (2018) revisit Barkai’s calculations over a longer period (from 1960) and broadly replicate the results, but label the residual profit share as “factorless income” highlighting the uncertainty over the measurement of the risk-ad-justed user cost of capital and the capital stock.13 They also empha-size that profit shares appear high in the 1960s and 1970s, before falling in the early 1980s, a pattern driven mainly by sharp swings in the interest rate.
Given the difficulty with macroeconomic estimates, De Loecker and Eeckhout (2017) use U.S. Compustat firms to estimate a version of equation (1). They econometrically estimate two-digit industry specific production functions to obtain the output elasticity with re-spect to the sum of variable costs and then divide these estimates by the factor revenue shares.14 They reach the dramatic conclusion that aggregate markups have risen from 1.1 to 1.6 between 1980 and 2015. One challenge is separating variable costs from fixed costs in
Chart 8U.S. Labor Share, 1947-2016
Notes: Labor’s share of output in the nonfarm business sector, first quarter 1947 through third quarter 2016. Shaded areas indicate recessions, as determined by the National Bureau of Economic Research. Source: BLS https://www.bls.gov/opub/mlr/2017/article/estimating-the-us-labor-share.htm.
Percent Percent68
66
64
62
60
58
56
54
68
66
64
62
60
58
56
541947 1952 1957 1962 1967 1972 20121977 1982 1987 1992 1997 2007 20162002

40 John Van Reenen
the company accounts. They use “cost of goods sold” (COGS) as their measure of variable costs. This is potentially problematic because this may include some fixed cost components and it may also miss out other variable costs. Traina (2018) shows that using all operating ex-penses results in markups that do not grow very dramatically as the COGS share of revenue has declined a lot.15 However, an even more important concern with their paper (as noted in the previous section) is that generalizing from publicly listed can be dangerous because of the serious sample selection problems both in a point of time and over time, making it very hard to describe robust macroeconomic trends.
Others have estimated markups using administrative data which are much more representative of the economy as a whole. Hall (2018) uses industry level data and also finds an increase in aggregate mark-ups over time.16 Autor et al. (2018) use Census microdata to estimate markups using both accounting approaches (as in Antras et al. 2017) and also econometric estimation (as in De Loecker and Warzynski 2012). Like De Loecker and Eeckhout (2017) and Hall (2018) they also find increases in the aggregate markup. However, they find little change in the unweighted average or median firm markup (either from direct production function estimation or accounting exercises). This mirrors their finding on the changes in the labor share—the fall in the labor share is due to reallocation towards large, high margin firms rather than a general increase in the markup across all firms.
Looking more generally across 26 OECD countries between 2001 and 2014, Calligaris et al. (2018) use equation (2) to estimate mark-ups and also find that although the size-weighted average (i.e., ag-gregate) markup has risen, most firms have not seen increases in their individual markups.17 This is also the conclusion of Baqaee and Fahri (2017) and is again consistent with the reallocation effects stressed by Autor et al. (2018). We discuss the interpretation of this more below.
IV.ii. Implications of Weakening Competition
A generalized increase in market power has many worrying im-plications (see De Loecker and Eeckhout 2017). Because of lower

Increasing Differences Between Firms: Market Power and the Macroeconomy 41
allocative efficiency it directly leads to higher prices, an inflation-ary force that cannot be effectively counteracted by monetary policy (see Section V). Secondly, there is loss of efficiency as market power tends to inhibit productivity which will be a further upward pressure on costs and prices. Third, these forces will all feed into lower real wages. Fourth, lower average wages makes working less attractive and so could lead to lower participation rates, something observed in the United States, especially for men.
IV.iii. Possible Causes of Rising Market Power
What might have caused an increase in market power? Proponents have a difficult time pinning down plausible explanations, but anti-trust and regulation are the two most cited culprits.
Antitrust Policy
One view is that U.S. antitrust enforcement has weakened over time. Grullon et al. (2017) claim that there was a significant de-cline in antitrust enforcement during the administrations of George W. Bush and Barack Obama (e.g., Harty, Shelanski and Solomon 2012, Crane 2012). Use of Section 2 of the Sherman Act, which al-lows antitrust agencies to prevent increase in market power of existing dominant firms, has declined from an average of 15.7 cases per year over 1970-1999 to fewer than three over 2000-14. Global activity in mergers and acquisitions surpassed $5 trillion in 2015, about $2.5 trillion of which was in the United States, the highest amount in a year on record. Between 1998 and 2008 the Federal Trade Commis-sion essentially stopped enforcing mergers when there were at least five firms remaining in the market (Kwoka 2017). Wollman (2018) points to the amendment to the Hart-Scott-Rodino Act in late 2000, which allowed many more exemptions for merger notification and shows evidence that it lead to more anti-competitive mergers.
Other measures of antitrust enforcement, however, exhibit oppo-site trends. For instance, Council of Economic Advisers (2016) pro-vide evidence of increased cartel enforcement in the form of fines/penalties and prison sentences (e.g., from $0.36 billion in 2004 to $1.3 billion in 2014). In the 1990s under Bill Clinton there was a

42 John Van Reenen
spike in antitrust enforcement, perhaps most famously in the moves against Microsoft in the browser wars. And the competition authori-ties in the EU have actually been strengthened in the last 20 years leading to many high profile cases, such as the recent $5.1 billion fine on Google.18
A related issue is common ownership of many stocks by financial companies such as Blackrock. These institutional owners have become larger and more concentrated themselves. Azar et al. (2015, 2016) have argued that increasing common ownership of corporations by banks and other financial institutions has softened price competition between firms. Yet, there is little direct evidence that these large share-holders are at all active in pushing for such coordination.
Regulation
Regulation could reduce competition in at least three ways: (i) regulations often have a big fixed cost component which benefits larger firms; (ii) regulation may introduce barriers to entry; and (iii) increased rent seeking may allow larger firms to affect regulation through lobbying, thereby strengthening their position as leaders.
Some have argued that the United States has become substantially more regulated in recent decades. For example, financial service regu-lation has increased enormously since the credit crunch (e.g., Dodd-Frank), as has health-care regulation (e.g., American Care Act, ACA) and environmental regulation. Gutierrez and Philippon (2017) show a secular increase in the Mercatus Regulation index since 1970.19
Kleiner and Krueger (2013) show a large increase in occupational li-censing—this creates a barrier to entry making it harder to start a new business in some services. For example, the share of workers in occupations requiring some sort of state license grew fivefold over the last half of the 20th century.
Yet not all indicators show moves to greater regulation. The more standard OECD index of product market regulations shows broad stability for the United States from the late 1990s to today. And this index also shows substantial deregulation in the EU over this time period. Furthermore, as with antitrust, one could also point to many

Increasing Differences Between Firms: Market Power and the Macroeconomy 43
ways in which there have been significant deregulatory activities over time, especially under Ronald Reagan in the 1980s when concentra-tion was also rising. In many ways the regulation under Dodd-Frank and the ACA were in response to crises arising, in part, from the heavy concentration of the banking sector (“too big to fail”) and health-care markets. So the new regulations may be more effects than causes of greater concentration.
IV.iv. An Alternative Perspective on Market Power: Superstar Firms
The rising market power argument has many attractions as it seems to explain disparate and surprising macro trends. But on one level it is still quite puzzling. As discussed above, it is not clear that institu-tional factors such as antitrust and regulation have moved in a strong anti-competitive direction. And many other major changes would lead observers to believe that markets have become more competitive over time. Trade costs have declined over the last 40 years as more countries have signed up to the rules-based trading system under the Word Trade Organization (WTO). In particular, China’s re-integra-tion into the global trading system and in particular its accession to the WTO in December 2001 has been a major pro-competitive shock to the OECD markets (e.g., Draca et al. 2016, Autor et al. 2013). Nontariff trade barriers have also fallen with “deep” regional integration such as the development of the EU’s Single Market.
Technological change has helped reduce the frictions to product markets within and between countries. Shipping is less expensive and with digital goods essentially costless and communication costs have fallen dramatically. The internet has enabled firms to enter each other’s markets more aggressively (think of Amazon) and for con-sumers to more easily compare prices (and characteristics) of goods and services online.
It may seem more natural to think that these new technologies and globalization trends would make markets more competitive, rather than less competitive.

44 John Van Reenen
An important insight from classic debates in Industrial Organiza-tion between Bain (1951) and Demsetz (1973) over the Structure-Conduct-Performance paradigm (see Schmalensee 1987) has been lost in many recent discussions. Increases in market toughness can go hand in hand with many of the trends we have documented. For ex-ample, in Autor et al. (2018) we show this in the context of a simple model with heterogeneous firms and imperfect competition, but the intuition is straightforward.20 As discussed in Section II if firms differ in their productivity and markets are not perfectly competitive more productive firms will have bigger market shares. Furthermore, these large “superstar” firms will tend to have higher profit margins and lower labor shares of value added.21 If market competition rises (e.g., consumers become more price sensitive) then more output is allocated to the larger, most productive firms—i.e., concentration rises. This can be through the extensive margin (less productive badly managed firms exit) and the intensive margin (among the survivors, high productivity firms get even larger market shares). Hence an in-crease in competition could easily lead to rising concentration.
What about the aggregate labor share and price cost margin? For any individual firm a rise in competition will mean its price-cost mar-gin tends to fall (and labor share of value added rises) when market toughness increases. But offsetting this “within firm” effect is the “be-tween firm reallocation” effect that moves more market share toward the high margin, larger, more productive firms when competition rises. If the underlying skewness of productivity is great enough, this reallocation effect dominates and aggregate markups rise and the la-bor share falls when market toughness increases. In this case we will see an increase in concentration and an increase in the aggregate/in-dustry markup arising from an increase in competition.
The lesson from this simple analysis is that we cannot conclude from aggregate industry wide changes in concentration and mark-ups, etc. that competition has fallen. One needs to look into more detail at the microdata. As noted above, Autor et al. (2018) find that the labor share and markup has hardly changed in 30 years for the typical U.S. firm. What explains the fall in the aggregate labor share and rise in the markup is a reallocation toward the larger and more productive firms.22

Increasing Differences Between Firms: Market Power and the Macroeconomy 45
A more specific version of this superstar firm hypothesis is to con-sider “winner takes most” markets. Higher competition in general will give firms with a cost or quality advantage a large share of the market. But the growth of platform competition in digital markets has led to dominance by a small number of firms such as internet search (Google), ride sharing (Uber), social media (Facebook, Twit-ter), operating systems for cellphones (Apple, Android), home shar-ing (AirBnB), etc. Network effects mean that small quality differences can tip a market to one or two players who earn very high profits.
The growth of such industries does not mean that competition has disappeared, rather its nature has changed. There is more competition “for the market” rather than “in the market.”
IV.v. The Role of Information and Communications Technology (ICT)
We have discussed the superstar firm explanation of the trend toward higher concentration in the context of (i) high tech digital markets engaging in platform competition and (ii) a general increase in market toughness due to globalization and/or the Internet. But a third rea-son why larger firms may expand more relates to the ICT revolution. Quality adjusted ICT prices have been falling dramatically for some time, meaning that there were huge opportunities for firms who could exploit this opportunity effectively. For example, retailers like Walmart were able to develop deeply integrated supply chain networks based on proprietary logistical software. More efficient logistics, higher turnover of inventory, and greater product variety at lower cost gave these big box retailers major advantages over smaller chains and independent mom-and-pop retailers (e.g., Foster, Haltiwanger and Kirzon 2006). This proprietary own-account software is also a feature of many other industries, such as banking and online shopping (Amazon), giving large players competitive advantage.
Bessen (2017) finds that U.S. industries since 2002 with greater software developer employment (a proxy for proprietary software) had faster growth in concentration ratios, profit margins and plant sizes). Bauer and Lashkari (2018) analyze French firm-level data with rich measures of IT software and hardware. They find that larger

46 John Van Reenen
firms use IT much more intensively than smaller firms and show that there has been a large reallocation of output (and rising IT intensity) in these firms.23 This helps explain the fall in labor shares in France.
This is suggestive evidence that part of the growth of superstar firms is related to the fall in price of ICT (as suggested by Karabar-bounis and Neiman 2013). But the mechanism is not through a gen-eral substitution toward capital, but rather a reallocation of output toward highly profitable and more IT intensive companies.
IV.vi. Distinguishing Between Declining Competition vs. Superstar Firms Explanations
Is the increase in aggregate markups and concentration due to a general fall in competition or rather a change in the economic envi-ronment reallocating more activity towards superstar firms?
If the increase in the aggregate markup reflects weakened antitrust enforcement this will generally lead to worse allocative efficiency, higher prices and lower productivity as discussed above. On the other hand, if it is due to tougher markets reallocating more output to the more efficient firms this should lead to higher productivity.
We can shed light on these alternative explanations by examining the changing characteristics of the industries that are becoming more concentrated. Autor et al. (2018) find that the U.S. four-digit indus-tries with the greatest increases in concentration have also had higher TFP growth and a faster growth in innovation (as measured by such indicators as cite-weighted patents). Ganapati (2018) and Bes-sen (2017) also find a positive relationship between concentration growth and productivity changes.24 Looking across all the Economic Census data 1977-2012 Ganapati (2018) also finds little correlation between increases in prices and changes in concentration, as would be expected if concentration was being driven by weaker competition (Peltzman 2018 reaches the same conclusion).
These pieces of evidence do not seem consistent with the simple story of falling competition lying behind increasing size differences, as the concentrating industries appear to be the more dynamic sectors.25

Increasing Differences Between Firms: Market Power and the Macroeconomy 47
One implication of this discussion is that to understand the aggre-gate productivity slowdown we have to look elsewhere for explanations than simply declining competition. Fortunately, there is no shortage of alternative hypotheses such as mismeasurement, the rapid buildup of in-tangible capital investments in new technologies such as AI and automa-tion, declining R&D productivity, secular stagnation, continued finan-cial frictions, demographic changes or even a return to the 1974-1994 trend.26 Unfortunately, there is no consensus (yet) on which ones—if any—matter the most (see Syverson 2018 for an overview).
Finally, it is useful to reflect on the finding that the main trends of increasing differences appear to be broadly common across the OECD. Institutional changes across countries—for example, anti-trust, regulation, union power, the minimum wage—have evolved in very different ways in the United States and EU. Although these institutions clearly may play some role, the global similarity of the changes suggest that something more fundamental is at play.
IV.vii. Other Explanations
Overhead Fixed Costs and Intangible Capital
The evidence suggests that aggregate markups over marginal costs have increased. However, it may be that there has also been a rise in fixed overhead costs. If this is the case, higher margins are necessary for firms to stay in business over the longer run. Indeed, in the long run almost all fixed costs become variable. Perhaps the most obvious candidates for these costs are those related to “intangible capital.” Many types of capital are hard to measure (e.g., firm-specific hu-man capital from training and goodwill capital from advertising). Corrado, Hulten and Sichel (2009) describe the technological and managerial competencies discussed in Section II as scientific capital and organizational capital respectively. Since these investments are generally treated as current expenses in company and national ac-counts, this mismeasurement could help explain some of the pat-terns we observe. In terms of equation (3), the argument would be that true K has risen much faster than observed K, keeping the profit share constant. Certainly, the evidence in Corrado et al. (2018)

48 John Van Reenen
suggests that intangible capital is becoming an ever-larger share of total capital.
In one sense, intangible capital is simply a form of measurement error and it is always possible to rationalize any empirical pattern in this way. As is well known, the biases could just as easily lead to over-estimate of TFP as an underestimate.27 Karabarbounis and Neiman (2018) consider how an intangible capital model could generate the measured rise in the aggregate markup discussed above. They argue that it is hard to rationalize the trends in this way (intangible capital would have had to be particularly high in 1960-1980 for example).
Do the larger and more productive firms simply have more intan-gible capital than their smaller counterparts? Of course, one would need to discuss why larger firms were accumulating more intangible capital in this way. The Corrado et al. (2009) framework is a neoclas-sical representative firm approach and so is silent on this. As noted above, Bauer and Lashkari (2018) find that large firms are more IT intensive and De Loecker and Eeckhout (2017) argue that they are also more selling, general and administrative expense (SG&A) inten-sive (one measure of overhead or intangible capital). However, the latter find that the increase of SG&A as a fraction of sales is too low to rationalize the increase in markups over marginal costs.
One difficult issue is that there may be increases in expenditure on the sunk costs of entry. It is unclear how these are accounted for. If entry costs are reflected in R&D then in principle these should be picked up, but it is likely that not all R&D is measured espe-cially for new firms and, in any case, entry costs go beyond formal R&D expenditure.
Ultimately, the only way to adjudicate the role of intangible capital is to try to improve measurement and see how much of the increased variance in size, productivity and wages can be explained with these factors. There has been progress here. R&D and software are now capitalized in the national accounts of the United States. As noted in Section I, we have been able to better account for more of the cross-firm and country-sectional differences in measured TFP with better indicators of technology and management.

Increasing Differences Between Firms: Market Power and the Macroeconomy 49
Outsourcing/Offshoring
Firms are increasingly outsourcing and offshoring activities into global value chains. This may be related to some of the trends we observe. For example, Song et al. (2016) speculate that increased between-firm earnings dispersion might be due to high wage/skill firms increasingly outsourcing their low wage jobs such as cleaners to specialized service firms.28 As with intangible capital, however, to ac-count for increasing differences the story would have to be not only that these sourcing activities have become easier, but also that larger firms have a particular advantage in them. While this is likely for offshoring, it is not so clear for domestic outsourcing. Smaller firms are increasingly able to outsource online many activities such as pay-roll, accounting, hiring and marketing that would formerly have to be performed in-house.
In summary, although offshoring may account for some of the rise in markups, the fact that we also observe rises in markups for purely domestic firms and industries suggests that this mechanism this can-not fully explain the patterns we observe.
Slowing Technological Spillovers
Andrews et al. (2015) argue that the increasing TFP gap between leading and laggard firms is due to a slower rate of diffusion. We would expect that over time, small/low productivity firms catch up with large/high productivity leaders through imitation and adoption of the know-how of the leading firms. If this has become increasingly hard, inequality will increase between firms. So rather than a change in market environment this is more like a change in the ability to imitate. The problem with this story is that one would have thought that better ICT should lead to faster rather than slower technologi-cal diffusion. It is possible that there are other barriers (if erected by leading firms then we are closer to the diminishing competition hy-pothesis) such as stronger IP, lower interfirm mobility of skilled labor, etc. But there is no clear evidence so far that I know of that would corroborate this.
50 John Van Reenen
V. Some Policy Implications
I have focused more on positive than normative issues in this paper. But I speculate a little on policy issues in this section.29
V.i. Antitrust Policy
If the increase in concentration and markups reflects weakening an-titrust enforcement then an obvious policy solution is to strengthen it again. Similarly if overly onerous regulations or lobbying are the root causes then the policy implications are obvious.
Even if it is the case that the world is closer to the superstar firm model, however, this does not mean that antitrust should be weak-ened. If superstar firms attain their dominant positions on the mer-its, it does not mean that they will always use their market power for the good of consumers. They have incentives to entrench their posi-tion through lobbying, erecting entry barriers and buying up future rivals. In the technology sector, the main exit strategy of venture cap-ital-backed start-ups is now to be eventually acquired by a tech titan rather than aim for an IPO.30 The current merger guidelines focus on horizontal competition, but the risk may be that future competition is weakened by such acquisitions. The acquisitions by Facebook of Ins-tagram in 2012 and WhatsApp in 2014, for example, could be seen as problematic because these social media platforms may have become a major future rival to Facebook’s platform in the absence of the merger. This implies that antitrust policy needs to be re-thought in the era of superstar firms. There are many actions of dominant incumbents to maintain their market power not just through mergers and acquisi-tions but also through other strategies which can be used to strengthen incumbent advantage (such as the control of consumer data).
This leaves an important role for the modernization of competi-tion rules to reflect the changing nature of product market competi-tion.31 But what are the implications for monetary policy makers? We consider these next.

Increasing Differences Between Firms: Market Power and the Macroeconomy 51
V.ii. Monetary Policy in the Long Run and the Short Run
If the increase in concentration and markups reflects institutional changes such as weakening antitrust enforcement or poor regulations then, as discussed above, this will lead to inefficiently higher prices and a lower equilibrium real wage. This is a structural supply side problem that monetary policy authorities can do little to directly off-set in the long run. In the short run, things depend on how nominal wage setting changes. With some nominal wage rigidity, we would expect a central bank to have to tighten monetary policy in the face of a negative supply shock in order to induce a negative output gap and so bring inflation back to target. The degree to which it does so will depend on the slope of the Phillips curve and the central bank’s relative weight on output stabilization vs. departures from its infla-tion target.32 Eventually, the new constant inflation equilibrium will be characterized by lower real wages and lower employment. On the other hand, if nominal wages respond flexibly to the negative supply shock of increased market power, the real wage consistent with stable inflation will be reached more quickly, and the central bank may not need to tighten policy.
On the other hand, if the trends of increased concentration and markup levels reflect technological and globalization changes favor-ing superstar firms, the implications are not so malign. Rather than lower real wages, we may expect to eventually observe higher produc-tivity, lower prices and higher real wages.
Since the global financial crisis, inflation has been quite dormant despite the continuation of the trend toward rising markups and con-centration rates. At a crude level, this would suggest that the negative supply shock story is missing something. One reason could be that superstar firm models better explain the trends. Of course, there may be many alternatives such as offsetting shocks to worker bargaining power and secular weaknesses in investment.
The basic point, however, is that it matters for monetary policy whether one perceives the product market trends as a negative supply shock or something potentially more benign.

52 John Van Reenen
V.iii. Monetary Policy Effectiveness
Finally, consider a central bank seeking to stimulate investment in a downturn by reducing interest rates. To the extent that the mecha-nism works through (at least temporarily) lowering the cost of capital, the size of the markup could matter. In standard macro mod-els, markups are constant across firms and time so the level of the markup will not matter, because a 1 percent decrease in marginal cost is passed through to a 1 percent decrease in prices. But if mark-ups are variable (as is suggested by the trade evidence on incomplete markups and the firm heterogeneity literature) then a firm will gener-ally take some of a cost decrease in the form of higher profits rather than just increasing inputs.33 Thus, a firm with a high markup will increase investment less than a more competitive firm when interest rates fall. This will tend to make any given decrease in interest rates less effective in a high markup economy.34 Higher markups and in-complete pass-through also slow reallocation and so further reduce productivity growth (Decker et al. 2018).
VI. Conclusions
Analyzing the macroeconomy often requires getting “under the hood” and understanding the vast diversity of firm experience. We have shown that there are enormous differences in the productivity of firms within narrow sectors and that this is linked to their techno-logical and managerial capabilities. This fundamental heterogeneity helps explain differences in the wealth of nations across countries and also aggregate productivity growth over time.
In recent years, firm heterogeneity appears to have increased rather than narrowed. These increasing differences are most obvious in terms of size: sales concentration has mushroomed across most U.S. indus-tries, but it is also discernible in terms of wages and productivity.
Increased concentration brings with it the concern of market power and indeed, some have argued that many of the economic ills we face today in terms of sluggish productivity and real wage growth are due to rising monopoly power. My view is that this conclusion is premature. Rising aggregate markups and concentration may also reflect changes in the nature of competition where superstar firms are

Increasing Differences Between Firms: Market Power and the Macroeconomy 53
rewarded with greater market share in “winner take most” markets. I have offered some evidence more in line with the nuanced superstar firm model than a general fall in competition due to antitrust and regulation. But this is for sure not the final paper in this area, how-ever, and there are substantial uncertainties.
A final word of warning. Even if it was the case that the world is closer to the superstar firm model, this does not mean that antitrust policy should be relaxed. Even if superstar firms attain their currently dominant positions on their merits of out-competing rivals, it does not mean that they will always use their power for the good of con-sumers. They may well try to entrench their position through lob-bying, erecting entry barriers and buying up future rivals. As larger parts of the modern economy become winner take most/all, it is im-portant that competition authorities develop better tools for under-standing harm to innovation and future competition, rather than the traditional emphasis on the pricing decisions of current rivals.
Author’s Note: This paper was prepared for the 2018 Jackson Hole Symposium. It has benefitted from comments by my discussant, Valerie Ramey. The paper draws extensively on work with many co-authors, especially David Autor, Nick Bloom, David Dorn, Larry Katz, Christina Patterson and Raffaella Sadun. Particular thanks to Wendy Carlin, Chiara Criscuolo and Iwan Werning for discussions on earlier drafts.

54 John Van Reenen
Endnotes1See the survey in Van Reenen (2011a) for example.
2Development accounting (e.g., Caselli 2005) focuses on how to account for these large cross-sectional differences across countries. It is the cross-sectional analog of the Solow growth accounting approach. Gennaioli et al. (2013) perform develop-ment accounting using cross-sectional data from the regions within a large number of countries. They argue that an expanded view of human capital (which includes managerial/entrepreneurial skills) can account for most of the TFP differences.
3For example Hernández-Pérez et al. (2006), Axtell (2011) and Garicano et al. (2016).
4For simplicity I will use “firms” and “establishments” more or less interchange-ably for convenience. This abstracts from a growing literature looking at realloca-tion across plants within the same firms (e.g., Bloom et al. 2017).
5The OECD team of Berlingieri et al. (2017) describe similar large cross-firm dif-ferences using 15 OECD countries in their MULTIPROD database, using moments collected from censuses run by the National Statistical Agencies of many countries.
6Analysis of entrants has found that their measured productivity is surprisingly low, usually no better than incumbents. However, this appears to be due to an overestimation of their output price, because firm specific prices are usually unob-served and researchers use industrywide price deflator instead. Foster et al. (2008) show in industries where plant-specific prices are observed entrants typically price below the average incumbent, so revenues deflated by industry prices will lead to an underestimate of entrant output and therefore also their productivity.
7See, for example, Olley and Pakes (1996) and Melitz and Polanec (2015).
8Foster, Haltiwanger and Syverson (2008) study 11 seven-digit homogeneous goods (including block ice, white pan bread, cardboard boxes and carbon black) where they have access to plant specific output prices. They find that conven-tionally measured revenue based TFP (“TFPR”) numbers actually understate the degree of “true” quantity-based productivity dispersion (“TFPQ”) especially for newer firms as the more productive firms typically have lower prices and are rela-tively larger. Bartelsman et al. (2009) show that measured TFPR will generally be correlated with true TFPQ but also with the firm specific price shocks. In the Hsieh and Klenow (2009) model heterogeneous TFPQ produces no difference in TFPR because the more productive firms grow larger and have lower prices, thus equalizing TFPR. But this is a knife-edge case.
9Bartelsman and Dhrymes (1998, Table A.7) show that over a five-year period around one-third of plants stay in their productivity quintile. White et al. (2018) emphasize that the imputations the Census makes to deal with nonreporting of some items in the Economic Census causes TFP dispersion to be underestimated rather than overestimated.

Increasing Differences Between Firms: Market Power and the Macroeconomy 55
10Gutierrez and Philippon (2017, 2018) have argued the opposite—that con-centration has been falling in the EU since 2000. The reason for the difference is that Gutierrez and Philippon use BVD Orbis data to calculate concentration rather than the near-population data used by the OECD. Orbis does a reasonable job at tracking sales in the largest firms, but (especially in the late 1990s and early 2000s) has very incomplete coverage of small and medium-sized firms in many countries (Bajgar et al. 2018). Hence Orbis overestimates overall industry sales growth as it includes the increase in industry sales arising through expanding sample coverage. The OECD can reproduce Gutierrez and Philippon’s falling EU concentration when they use Orbis for both the numerator and denominator of concentration. But when they use the true industry size from population data in the denominator they reverse this result and find rising concentration as illustrated in Chart 4.
11See the surveys by Acemoglu and Autor (2011) on U.S. evidence and Van Re-enen (2011b) on the international evidence. Katz and Murphy (1992) and Machin and Van Reenen (1998) contain the early evidence on skill-biased technological change and inequality.
12Formally, equation (1) requires only cost minimization with respect to a vari-able factor (no adjustment costs) and a production function that is continuous and twice differentiable in its factor inputs.
13We discuss the measurement of intangible capital below. Karabarbounis and Neiman (2018) prefer the explanation of an increase in the user cost as the most plausible explanation. However, it is very unclear why the risk premium should have risen so much since 1980.
14This is the De Loecker and Warzynski (2012) method, which is an application of Hall (1988) to microdata.
15The other big operating expense apart from COGS is Sales and General and Administrative Expenses, SGA. Traina shows that SGA has increased substantially for firms over time.
16Unfortunately, his instrumental variables (categories of government defense spending) have no variation across industries and would be collinear with time dummies. Not including time dummies raises the concern of omitted variables violating the exclusion restriction. The change in markup is imprecisely estimated.
17Calligaris et al. (2018) use BVD data (firm accounts). De Loecker and Eeck-hout (2018) also use firm accounts (Worldscope data) from developing countries as well as OECD countries and claim that markups have risen in every continent. None of these sources is based on administrative data, so the sample selection problems are an issue again, especially for developing countries.
18Gutierrez and Philippon (2018) correctly point to various ways in which EU competition policy has been toughened and contrast this with the United States where they argue it has deteriorated. They then argue that there has been a fall

56 John Van Reenen
in concentration in the EU compared to a rise in the United States. As discussed above, however, OECD analysis of near population administrative datasets (as op-posed to their selected BVD subsamples) actually shows a rise in concentration in the EU as well as the United States. This casts doubt on a purely institutional explanation of the trends.
19In 2002-12 they show a (weak) positive relationship between increases in this measure of regulation and concentration in very broad industries (NAICS 3).
20The model is a generalization of Melitz and Ottaviano (2008) to allow for more general productivity distributions (rather than just Pareto) and any demand structure that satisfies “Marshall’s Second Law of Demand” that the absolute elas-ticity is falling in consumption (rather than just linear demand).
21The exception to this is if markups are the same across all firms because the elasticity of product demand is constant as in the Dixit-Stiglitz CES preferences case. Although a workhorse macro model, this is actually a knife-edge case. For any utility function consistent with “Marshall’s Second Law of Demand” (demand is more inelastic at lower prices), more productive firms will have higher markups be-cause they face a less elastic part of the demand curve. Autor et al. (2018) show that markups are higher (and labor shares lower) for establishments and firms within four-digit industries.
22The same conclusion on the importance of reallocation is in Kehrig and Vin-cent (2017), Hartman-Glaser et al. (2016) and De Loecker and Eeckhout (2017).
23Formally, they argue that the production function is nonhomothetic across different factor inputs. In particular, a proportionate increase in firm size has a larger proportional effect on the demand for IT capital than non-IT capital and labor. They test for this by estimating factor demand equations with size on the right-hand side instrumented by market size shocks (e.g., from foreign markets).
24This is consistent with the empirical evidence discussed earlier that product market power tends to generate lower productivity. The most compelling evidence from this body of work looks at natural experiments which exogenously shift com-petition rather than simple correlations with concentration in product markets (which as noted could come from decreases or increases in competition).
25A caveat to this conclusion is that the evidence of faster productivity growth in the concentrating sectors does not imply that the simple “tougher competition” is correct. We would expect to see stronger falls in prices in these sectors under this model. The fact that prices have not fallen more robustly could be interpreted to mean that leading firms are increasing productivity and market power together (al-though it may also mean that prices are being overestimated by failing to properly account for quality changes). This would push toward one of the other versions of the superstar firm model based on platform competition and/or ICT.

Increasing Differences Between Firms: Market Power and the Macroeconomy 57
26From 2005 through 2015, U.S. labor productivity growth averaged 1.3 per-cent per year, down from a trajectory of 2.8 percent average annual growth sus-tained over 1995-2004. It was 2.7 percent per year from 1947-1973, then fell to 1.5 percent per year over 1974-1994.
27Assume intangible capital is treated as an expense, such as an intermediate input. During a period when current intangible investment growth exceeds in-tangible capital stock growth this will cause measured TFP growth to be too low compared with real TFP growth (this is one explanation of the current productivity slowdown). However, when the stock growth is faster than the current flows, the opposite is true—we overestimate actual TFP growth (see Brynjolfsson and Syver-son 2017, for example).
28Domestic outsourcing cannot of course explain the fall in the aggregate labor share as these outsourced workers will still show up in other firms (unless these workers were earning some wage rents before—see Godschmidt et al. 2017).
29For a more formal treatment of the welfare effects of rising markups see Ed-mond, Midrigan and Xu (2018).
30Cunningham et al. (2018) show theoretical and empirical evidence that many acquirers kill off promising innovations in the acquired as these threaten their mo-nopoly rents from incumbent technologies.
31For some recent thoughts on how to do this see Tirole (2017) and the re-cent Chicago Stigler Center conference https://research.chicagobooth.edu/stigler/events/single-events/antitrust-competition-conference-digital-platforms-concen-tration. Tirole emphasizes that the burden of proof in U.S. cases must be shifted, as the authorities face a near impossible standard in proving that the dominant firm’s actions will very likely lead to the foreclosure of future markets.
32For simple expositions of this idea, see Carlin and Soskice (2015) or Carney (2017).
33Markups are the same across all firms in Dixit-Stiglitz models of preferences which is common in macro models with monopolistic competition models. But there is now much evidence that markups are different across firms (as with the evidence from Autor et al. 2018, discussed above). In particular they are greater for larger firms as is consistent with trade models such as Melitz and Ottaviano (2008). The extensive pass-through literature also suggests that costs are incom-pletely passed on to consumers, which is consistent with variable markups (Arkola-kis et al. 2018, De Loecker et al. 2016).
34Gutierrez and Philippon (2017) argue that the fall in investment as a share of GDP in the United States. despite increases in Tobin’s Q is a sign of weaker product market competition.

58 John Van Reenen
References
Acemoglu, Daron, and David Autor. 2011. “Skills, Tasks and Technologies: Im-plications for employment and earnings,” Handbook of Labor Economics Volume 4B, Orley Ashenfelter and David Card, eds, Chapter 12, 1043-1171.
Andrews, Dan, Chiara Criscuolo and Peter Gal. 2015. “Frontier Firms, Technology Diffusion and Public Policy,” OECD Future of Productivity Background Paper.
Antras, Pol, Theresa Fort and Felix Tintelnot. 2017. “The Margins of Global Sourcing: Theory and Evidence from U.S. Firms,” American Economic Review, vol. 107, no. 9, pp. 2514-2564.
Arkolakis, Costas, Arnaud Costinot, David Donaldson and Andreas Rodriguez-Clare. 2018. “The Elusive Pro-Competitive Effects of Trade,” Review of Eco-nomic Studies, forthcoming.
Autor, David, David Dorn, Lawrence F. Katz, Christina Patterson and John Van Reenen. 2018. “The Fall of the Labor Share and the Rise of Superstar Firms,” MIT mimeo updated from NBER Working Paper
_____, _____, _____, _____ and _____. 2017. “Concentrating on the Fall of the Labor Share,” American Economic Review Papers and Proceedings, vol. 107, no. 5, pp. 180-185.
Autor, David H., David Dorn and Gordon H. Hanson. 2013. “The China Syndrome: Local Labor Market Effects of Import Competition in the United States,” American Economic Review, vol. 103, no. 6, pp. 2121-2168.
Axtell, Robert. 2001. “Zipf Distribution of U.S. Firm Sizes,” Science, 293 (5536), 1818-1820.
Azar, José, Sahil Raina and Martin Schmalz. 2016. “Ultimate Ownership and Bank Competition,” mimeo, University of Michigan.
_____, Martin C. Schmalz and Isabel Tecu. 2015. “Anti-Competitive Effects of Common Ownership,” Ross School of Business Paper No. 1235.
Bailey, Martin, Charles Hulten and David Campbell. 1992. “Productivity Dynamics in Manufacturing Plants,” Brookings Papers on Economic Activity: Microeconomics, 187-267.
Bain, Joseph. 1951. “Relation of Profit Rate to Industry Concentration: Ameri-can Manufacturing 1936-1940,” Quarterly Journal of Economics, vol. 65, no. 3, pp. 293-324.
Bajgar, Matej, Giuseppe Berlingieri, Sara Calligaris, Chiara Criscuolo and Jona-than Timmis. 2018. “To Use or Not to Use (and How to Use): Coverage and Representativeness of ORBIS data,” Paris: OECD.

Increasing Differences Between Firms: Market Power and the Macroeconomy 59
Baqaee, David, and Emmanuel Fahri. 2017. “Productivity and Misallocation in General Equilibrium,” NBER Working Paper.
Barkai, Simcha. 2016. “Declining Labor and Capital Shares,” LBS mimeo.
Bartelsman, Eric, John Haltiwanger and Stefano Scarpetta. 2013. “Cross-Country Differences in Productivity: The Role of Allocation and Selection,” American Economic Review, vol. 103, no. 1, pp. 305-334
Bauer, Arthur, and Daniel Lashkari. 2018. “Information Technology and Returns to Scale,” Yale mimeo.
Berlingieri, Giuseppe, Patrick Blanchenay, Sara Calligaris and Chiara Criscuolo. 2017. “The Multiprod Project: A Comprehensive Overview,” OECD Science, Technology and Industry Working Papers 2017/04
Bessen, James. 2017. “Information Technology and Industry Concentration,” Boston University Law and Economics Paper No. 17-41.
Bils, Mark, Pete Klenow and Cian Ruane. 2017. “Misallocation or Mismeasure-ment?” SCID Discussion Paper 599.
Bloom, Nicholas, Raffaella Sadun and John Van Reenen. 2017. “Management as a Technology,” CEP Discussion Paper 1433.
_____, Mirko Draca and John Van Reenen. 2016. “Trade Induced Technical Change? The Impact of Chinese Imports on Innovation, IT and Productivity,” Review of Economic Studies, vol. 83, no. 1, pp. 87-117.
_____, Ben Eifert, Abrijit Mahajan, David McKenzie and John Roberts. 2013. “Does Management Matter? Evidence from India,” Quarterly Journal of Eco-nomics, vol. 128, no. 1, pp. 1-51.
_____, Raffaella Sadun and John Van Reenen. 2012a. “Americans Do Better: U.S. Multinationals and the Productivity Miracle,” American Economic Review, vol. 102, no. 1, pp. 167-201.
_____, and John Van Reenen. 2007. “Measuring and Explaining Management Practices Across Firms and Countries,” Quarterly Journal of Economics, vol. 122, no. 4, pp. 1351-1408.
Bloom, Nick, Erik Brynjolfsson, Lucia Foster, Ron Jarmin, Megha Patnaik, Itay Saporta-Eksten and John Van Reenen. 2017. “What Drives Differences in Management?” CEP Discussion Paper 1470.
Bresnahan, Timothy, Erik Brynjolfsson and Lorin Hitt. 2002. “Information Technology, Workplace Organization and the Demand for Skilled Labor: Firm-level Evidence,” Quarterly Journal of Economics, vol. 117, no. 1, pp. 339-376.

60 John Van Reenen
Bruhn, Miriam, Dean Karlan and Antoinette Schoar. 2017. “The Impact of Consulting Services on Small and Medium Enterprises: Evidence from a Ran-domized Trial in Mexico,” Journal of Political Economy, vol. 126, no. 2, pp. 635-687.
Brynjolfsson, Erik, and Chad Syverson. 2017. “Artificial Intelligence and the Modern Productivity Paradox: A Clash of Expectations and Statistics,” NBER Working Paper No. 24001.
_____, Andrew McAfee, Michael Sorell and Feng Zhu. 2008. “Scale without Mass: Business Process Replication and Industry Dynamics,” Harvard Busi-ness School Technology and Operations Management Unit Research Paper No 07-016.
Calligaris, Sara, Chiara Criscuolo and Luca Marcolin. 2018. “Markups in the Digital Era,” OECD STI Working Papers 2018/10.
Card, David, Ana Cardoso, Joerg Heining and Patrick Kline. 2018. “Firms and Labor Market Inequality: Evidence and Some Theory,” Journal of Labor Eco-nomics, vol. 36, S13-S70.
_____, Joerg Heining and Patrick Kline. 2013. “Workplace Heterogeneity and the Rise of West German Wage Inequality,” Quarterly Journal of Economics, vol. 128, pp. 967-1015.
Carlin, Wendy, and David Soskice. 2015. Macroeconomics: Institutions, Instability and the Financial System, Oxford: Oxford University Press.
Carney, Mark. 2017. “Lambda,” speech at London School of Economics, Jan. 16.
Caselli, Francesco. 2005. “Accounting for Cross Country Income Differences,” in Handbook of Economic Growth, Philippe Aghion and Stephen Durlauf, eds., North-Holland: Elsevier.
Corrado, Carol, Jonathan Haskel, Massimiliano Iommi, Cecilia Jona-Lasinio and Ana Rincon. 2018. “Productivity, Spillovers from Intangibles, and Unmeasured Investments in Artificial Intelligence: Evidence from the EU and U.S.,” Impe-rial mimeo.
_____, Charles Hulten and Daniel Sichel. 2009. “Intangible Capital and U.S. Economic Growth,” Review of Income and Wealth, vol. 55, no. 3, pp. 661-685
Council of Economic Advisers. 2016. Benefits of Competition and Indicators of Market Power, Washington D.C.: White House.
Crane, Daniel. 2012. “Has the Obama Justice Department Reinvigorated Anti-trust Enforcement?” Stanford Law Review Online, vol. 65, pp. 13-20.
Criscuolo, Chiara. 2018. “What’s Driving Changes in Concentration across the OECD?” Paris: OECD mimeo, June 7.

Increasing Differences Between Firms: Market Power and the Macroeconomy 61
Cunningham, Colleen, Florian Ederer and Song Ma. 2018. “Killer Acquisitions,” Yale University mimeo.
Davis, Steven, John Haltiwanger, Ron Jarmin and Javier Miranda. 2007. “Volatil-ity and Dispersion in Business Growth Rates: Publicly Traded versus Privately Held Firms,” in NBER Macroeconomics Annual Vol. 21, Daron Acemoglu, Ken-neth Rogoff and Michael Woodford eds., pp. 107-180.
_____, and _____. 1991. “Wage Dispersion Within and Between U.S. Manufac-turing Plants 1963-1986,” in Martin Baily and Clifford Winston, eds., Brook-ings Papers on Economic Activity, Microeconomics, 115-200.
Decker, Ryan, John Haltiwanger, Ron Jarmin and Javier Miranda. 2018. “Chang-ing Business Dynamism and Productivity: Shocks vs. Responsiveness,” NBER Working Paper 24236.
De Loecker, Jan, and Jan Eeckhout. 2018 “Global Market Power,” CEPR Discus-sion Paper 13009.
_____, and _____. 2017 “The Rise of Market Power,” Princeton mimeo.
_____, Pinelopi Goldberg, Amit Khandelwal and Nina Pavcnik. 2016. “Prices, Markups, and Trade Reform,” Econometrica, vol. 84, no. 2, pp. 445-510
_____, and F. Warzynski. 2012. “Markups and Firm Export Status,” American Economic Review, vol. 102, no. 6, pp. 2437-2471.
Demsetz, Harold. 1973. “Industry Structure, Market Rivalry and Public Policy,” Journal of Law and Economics, vol. 16, pp. 1-10.
Edmond, Chris, Virgiliu Midrigan and Daniel Xu. 2018. “How Costly Are Markups?” Duke mimeo.
Elsby, Mike, Bart Hobijn and Ayşegul Şahin. 2013. “The Decline of the U.S. La-bor Share,” Brookings Papers on Economic Activity Microeconomics, 1-42.
Faggio, Giulia, Kjell Salvanes and John Van Reenen. 2010. “The Evolution of Inequality in Productivity and Wages: Panel Data Evidence,” Industrial and Corporate Change, vol. 19, no. 6, pp. 1919-1951.
Foster, Lucia, John Haltiwanger and Chad Syverson. 2008. “Reallocation, Firm Turnover, and Efficiency: Selection on Productivity or Profitability?” American Economic Review, vol. 98, no. 1, pp. 394-425.
_____, _____ and C.J. Kirzon. 2006. “Market Selection, Reallocation, and Re-structuring in the U.S. Retail Trade Sector in the 1990s,” Review of Economics and Statistics, vol. 88, no. 4, pp. 748-758.
Furman, Jason, and Peter Orszag. 2015. “A Firm-Level Perspective on the Role of Rents in the Rise in Inequality,” paper prepared for “A Just Society.”

62 John Van Reenen
Ganapati, Sharat. 2018. “Oligopolies, Prices and Quantities: Has Industry Con-centration Increased Price and Restricted Output,” Dartmouth mimeo.
Garicano, Luis, Claire Lelarge and John Van Reenen. 2016. “Firm Size Distortions and the Productivity Distribution: Evidence from France,” American Economic Review, vol. 106, no. 11, pp. 3439-3479.
Gennaioli, Nicola, Rafael LaPorta, Florencio Lopez-de-Silanes and Andrei Shle-ifer. 2013. “Human Capital and Regional Development,” Quarterly Journal of Economics, vol. 128, no. 1, pp. 105-164.
Gibbons, Robert, and John Roberts. 2013. Handbook of the Economics of Organi-zation, Princeton: Princeton University Press.
Gibrat, Robert. 1931. Les Inegalites Economiques, Sirey, Paris.
Giorcelli, Michela. 2016. “The Long Term Effects of Management and Technol-ogy Transfer,” Stanford mimeo.
Godschmidt, Deborah, and Johannes F. Schmieder. 2017. “The Rise of Domes-tic Outsourcing and the Evolution of the German Wage Structure,” Quarterly Journal of Economics, vol. 132, no. 3, pp. 1165-1217.
Grullon, Gustavo, Yelena Larkin and Roni Michaely. 2017. “Are U.S. Industries Becoming More Concentrated,” Rice University mimeo.
Gutierrez, German, and Thomas Philippon. 2018. “How EU Markets Became More Competitive than U.S. markets,” NBER Working Paper 24700.
_____, and _____. 2016. “Investment-less Growth: An Empirical Investiga-tion,” NBER Working Paper 22897.
Hall, Robert. 2018. “New Evidence on the Markup of Prices over Marginal Costs and the Role of Mega-Firms in the U.S. Economy,” NBER Working Paper 24148.
Hartman-Glaser, B, H. Lustig and M. Zhang. 2016. “Capital-share Dynamics When Firms Insure Workers,” NBER Working Paper 22651.
Harty, Ronan, Howard Shelanski and Jesse Solomon. 2012. “Merger Enforcement Across Political Administrations in the United States,” Concurrences–Competi-tion Law Review, vol. 2, pp. 1-9.
Hernández-Pérez, R., F. Angulo-Browna and D. Tun. 2006. “Company Size Dis-tribution for Developing Countries,” Physica A, vol. 359, pp. 607-618.
Hopenhayn, Hugo. 2014. “Firms, Misallocation and Aggregate Productivity: A Review,” Annual Review of Economics, vol. 6, pp. 735-70.
Hsieh, Chang-Tai, and Peter J. Klenow. 2014. “The Lifecycle of Plants in India and Mexico,” Quarterly Journal of Economics, vol. 129, no. 3, pp. 1035-1084.
Increasing Differences Between Firms: Market Power and the Macroeconomy 63
_____, and _____. 2009. “Misallocation and Manufacturing TFP in China and India,” Quarterly Journal of Economics, vol. 124, pp. 1403-1448.
Jones, Charles, and Paul Romer. 2010. “The New Kaldor Facts: Ideas, Institu-tions, Population, and Human Capital,” American Economic Journal: Macroeco-nomics, vol. 2, no. 1, pp. 224-245.
Karabarbounis, Loukas, and Brent Neiman. 2018. “Accounting for Factorless Income,” NBER Working Paper 24404.
_____, and _____. 2013. “The Global Decline of the Labor Share,” Quarterly Journal of Economics, vol. 129, no. 1, pp. 61-103.
Katz, Lawrence, and Kevin Murphy. 1992. “Changes in Relative Wages: Supply and Demand Factors,” Quarterly Journal of Economics, CVII, 35-78.
Kehrig, Matthias, and Nicolas Vincent. 2017. “Growing Productivity without Growing Wages: The Micro-Level Anatomy of the Aggregate Labor Share Decline,” ERID Working Paper 244.
Kline, Patrick, Neviana Petkova, Heidi Williams and Owen Zidar. 2018. “Who Profits from Patents? Rent Sharing at Innovative Firms,” NBER Working Paper.
Kleiner, Morris, and Alan Krueger. 2013. “Analyzing the Extent and Influence of Occupational Licensing on the Labor Market,” Journal of Labor Economics, vol. 31, S173–S202.
Kwoka, John. 2017. “U.S. Antitrust and Competition Policy Amid the New Merger Wave,” Washington Center for Equitable Growth, July.
Machin, Stephen, and John Van Reenen. 1998. “Technology and Changes in the Skill Structure: Evidence from Seven OECD Countries,” Quarterly Journal of Economics, vol. 113, no. 4, pp. 1215-1244.
Melitz, Marc. 2003. “The Impact of Trade on Intra-Industry Reallocations and Aggregate Industry Productivity,” Econometrica, vol. 71, pp. 1695-1725.
____, and Saso Polanec. 2015. “Dynamic Olley-Pakes Productivity Decomposi-tion with Entry and Exit,” RAND Journal of Economics, vol. 46, no. 2, pp. 362-375.
_____, and Gianmarco Ottaviano. 2008. “Market Size, Trade, and Productivity,” Review of Economic Studies, vol. 75, pp. 295-316.
Nekarda, Christopher, and Valerie Ramey. 2013. “The Cyclical Behavior of the Price-Cost Markup,” NBER Working Paper 19099.
Olley, Steven, and Ariel Pakes. 1996. “The Dynamics of Productivity in the Telecommunications Equipment Industry,” Econometrica, vol. 64, no. 6, pp. 1263-1298.

64 John Van Reenen
Peltzman, Sam. 2018. “Productivity and Prices in Manufacturing During an Era of Rising Concentration,” University of Chicago mimeo.
Rivkin, Jan. 2000. “Imitation of Complex Strategies,” Science, vol. 46, no. 6, pp. 824-844.
Rognlie, Matthew. 2015. “Deciphering the Fall and Rise in the Net Capital Share: Accumulation or Scarcity?” Brookings Papers on Economic Activity, 1-69.
Schmalensee, Richard. 1987. “Collusion versus Differential Efficiency: Testing Alternative Hypotheses,” Journal of Industrial Economics, vol. 35, no. 4, 399-425.
Smith, Mathew, Daniel Yagan, Owen Zidar and Eric Zwick. 2017. “Capitalists in the Twenty-First Century,” Chicago mimeo.
Solow, Robert. 1957. “Technical Change and the Aggregate Production Func-tion,” Review of Economics and Statistics, vol. 39, no. 3, pp. 312-320.
Song, Jae, David J. Price, Fatih Guvenen, Nicholas Bloom and Till von Wachter. 2016. “Firming Up Inequality,” Quarterly Journal of Economics.
Syverson, Chad. 2017. “Challenges to Mismeasurement Explanations for the U.S. Productivity Slowdown,” Journal of Economic Perspectives, spring.
_____. 2011. “What Determines Productivity?” Journal of Economic Literature, vol. 49, no. 2, pp. 326-365.
_____. 2004. “Product Substitutability and Productivity Dispersion,” Review of Economics and Statistics, vol. 86, no. 2, pp. 534-550.
Tirole, Jean. 2017. Economics for the Common Good, Princeton University Press.
White, Kirk, Jerome Reiter and Amil Petrin. 2018. “Imputation in U.S. Manu-facturing Data and Its Implications for Productivity Dispersion,” forthcoming, Review of Economics and Statistics.
Wollman, Thomas. 2018. “Stealth Consolidation: Evidence from an Amend-ment to the Hart-Scott-Rodino Act,” forthcoming, American Economic Review: Insights.
Van Reenen, John. 2011a. “Does Competition Raise Productivity Through Improv-ing Management Practices?” International Journal of Industrial Organization, vol. 9, no. 3, pp. 306-317.
_____. 2011b. “Wage Inequality, Technology and Trade: 21st Century Evi-dence,” Labour Economics, vol. 18, no. 6, pp. 730-741.
_____. 1996. “The Creation and Capture of Economic Rents: Wages and In-novation in a Panel of UK Companies,” Quarterly Journal of Economics CXI, 443, 195-226.