increasing efficiencies in the data centre
TRANSCRIPT

Increasing Efficiencies in the Data Centre
Richard Blanford: Managing Director

Some Examples of who we have helped

The Case Study
Benefits:• Instrumental in reducing IT capital and operational costs
• Systems are better protected from potential downtime and data loss
• Cost-effective solution, ensuring that the maximum amount of profit is donated to global initiatives.
• Crucial in enabling adaptation to rapid business growth and change
• Create any size of virtual volume up front
• Add new storage capacity as and when they need it.
• Monitor capacity use through the advanced reporting tools
• Ensuring they are fully optimised at all times
A new virtualised server and storage solution has enabled Comic Relief to manage increasing amounts of data while significantly reducing capital and operational IT costs, ensuring the maximum amount of its income is spent on its charitable work.
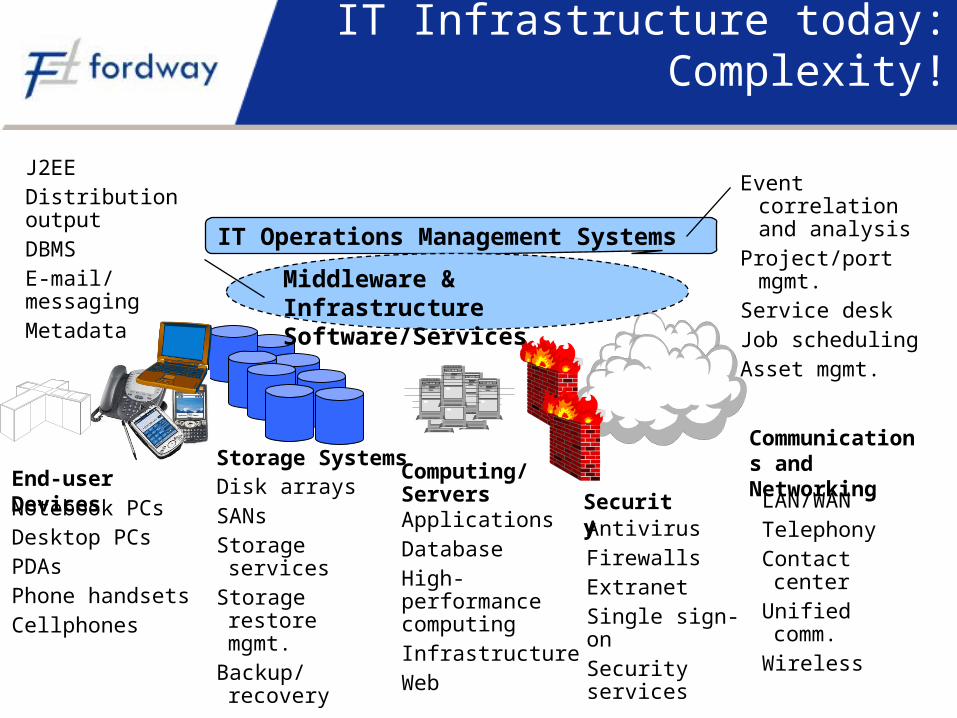
IT Infrastructure today: Complexity!
IT Operations Management Systems
Middleware & Infrastructure Software/Services
End-user DevicesStorage Systems
Computing/Servers Security
Communications and Networking
Notebook PCsDesktop PCsPDAs Phone handsetsCellphones
Disk arraysSANsStorage servicesStorage restore mgmt.
Backup/recovery
ApplicationsDatabaseHigh-performance computingInfrastructure Web
AntivirusFirewallsExtranetSingle sign-onSecurity services
LAN/WANTelephonyContact centerUnified comm.Wireless
Event correlation and analysis
Project/port mgmt.Service deskJob schedulingAsset mgmt.
J2EEDistribution output DBMSE-mail/ messaging Metadata

Your Challenges?
Increasing pressure to demonstrate business value
Increasingcomplexity
Increasing compliance
Increasing requirement for 24/7 availability
Increasing rate of change and pressure to move faster
Increasing pressure on costs
Increasing pressureto outsourceIncreasing pressure
on business and process alignment
Success increasingly based on integrating processes outside IT Operations
Increasing security requirements
Innovate: Design, Architect, Implement Technology for Business Advantage
Keep IT Running Competitive Cost Right Level of Risk Right Level of Quality With Flexibility and Speed

From Assets to Services
Ownership Was the Only Option
Pro
visi
onin
g
Optimization
Availability
Resources
Identities/Security
Workloads/Data
Policies IT service definitions Service agreements Business priorities
Services That meet
business requirements
Demand
Resources
Real-Time Infrastructure
Financial Abstraction
Service PortfolioManagement
Web Services
Other Services
Packaged Services, Wrapped Legacy
Bill
ing
Pric
e
Integration Platform
NewServices
Invo
ice

ITIL Fundamental

Infrastructure Maturity Model
Objective
Ability to Change
Pricing Scheme
Business Interface
Resource Utilization
Organization
IT Management
Processes
Basic
RationalizedVirtualized
Service-Based
Standardized
Reduce complexity
Economies of scale
Flexibility, reduce costs
Service-level delivery
React
Weeks Weeks to days
Days to minutes MinutesMonths to
weeks
Fixed costs Reduced, fixed costs
Fixed shared costs
Variable usage costsNone, ad hoc
Infrastructure resources pooled
Services managed holistically
Uncoordinated infrastructure
Standard resources, configurations
Consolidate to fewer
Policy/Value-Based
Business agility
Minutes to seconds
Variable business costs
Dynamic optimization to meet SLAs
Class-of-service SLAs
Class-of-service SLAs Flexible SLAs End-to-end
SLAsNo SLAs
Known Rationalized Shared poolsService-based poolsUnknown
Central control Consolidated Pooled ownership
Service-orientedNone
Business SLAsPolicy-based sharing
Business-oriented
Reactive — ProactiveLife cycle management
ProactiveMatureproblem management
ProactivePrediction, dynamic capacity
ServiceEnd-to-end service management
Chaotic — ReactiveAd hoc
ValuePolicy management

BUT: it’s not just technology
Process TechnologyPeople
Service-Based
Standardized
Rationalized
Virtualized
Real-Time
Infrastructure life cycle standards
Basic SLAs Event management
Holistic capacity management
Flexible chargeback
Measure, report, guarantee end-to-end services
End-to-end services are centrally managed and balanced
Mature and integrated systems management processes
IT owns assets Processes, tools are
shared
Organization aligned to pooled asset usage
IT organization aligned to service delivery
IT proactively influences use of technology to drive business
Organization structure and ownership rationalized across IT
Standard configurations
Tools to monitor assets
Servers, storage, network capacity is virtualized
Service management tools manage end-to-end
The business has direct interface to service prioritization
Integrated systems management tools
Consolidated assets

Fordway private cloud infrastructure
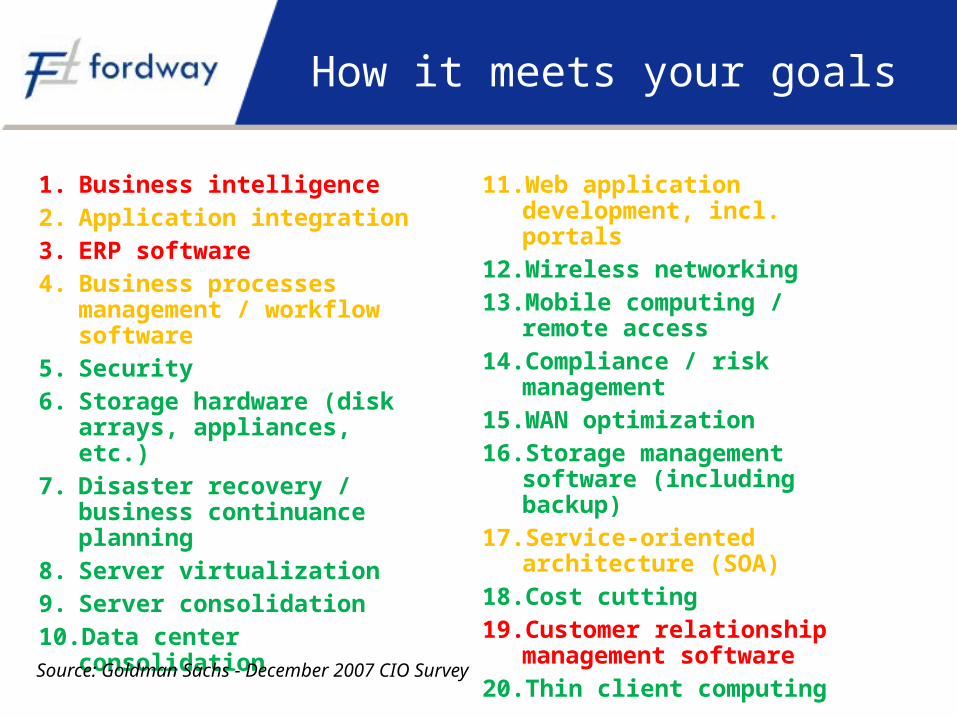
How it meets your goals
1. Business intelligence2. Application integration3. ERP software4. Business processes
management / workflow software
5. Security6. Storage hardware (disk
arrays, appliances, etc.)7. Disaster recovery /
business continuance planning
8. Server virtualization9. Server consolidation10.Data center
consolidation
11.Web application development, incl. portals
12.Wireless networking13.Mobile computing /
remote access14.Compliance / risk
management15.WAN optimization16.Storage management
software (including backup)
17.Service-oriented architecture (SOA)
18.Cost cutting19.Customer relationship
management software20.Thin client computing
Source: Goldman Sachs - December 2007 CIO Survey

And should the worst happen

DR comes as standard
• Achievable RPO for FOI DR is less than 15 minutes• Guaranteed RTO for FOI is less than 1 hour• These times are for FULL service restoration• Most of our current clients are aiming for < 2 hour
RPO and < 8 hour RTO• As VMware and Compellent gain new capabilities
these times can be further reduced• As all client desktops are streamed they can be
reinstated within minutes from any location• Very cost effective option is for clients to take one
platform and we provide DR off our platform

How Fordway can help you deliver this
We have the skills across all areas to help you enable this• Excellent skills and expertise across complete IT
infrastructure• ITIL process alignment• IT Governance using APAC• Relationships and accreditation with key vendors to
enable this
We are already doing this with many of our clients
We offer 3 methods of helping you achieve this1. Provide guidance, sell and integrate the components to
allow you to deliver this to your organisation2. Provide you a dedicated infrastructure plus the skills and
expertise and manage it for you which you can either rent or buy
3. Run it off our hosted platform for you to defined governance and operational SLAs

Some numbers
Our figures :• Local authority calculation (600 users) £2,240 per year • Commercial client 2007 budget was £2,484 for their call centre PCs
(220 seats)• County Council (8,500 users) 2008 internal estimate £1,750• Each client will be different but outline 3 year Fordway Optimised
Infrastructure cost:• 1000 user managed £1260 per user per year• 1000 user hosted £1115 per user per year• 5000 user managed £1085 per user per year• 5000 user hosted £980 per user per year
March 2008 Gartner stated annual cost of corporate desktop PC was between $3413 (£2007 – very tightly managed) and $5867 (£3451 – worst case) per year. Notebook was between $5403 (occasional homeworker) and $9900 (road warrior)

Your journey starts here
Column1 Column2 Column3 Column4 Column5 Column6 Column7 Column8Optimised infrastructure current client cost analsysis workbook
Current client environment Last year Current year 2009 2010 2011 2012
Number of users supportedNumber of supported locations with local serverNumber of supported locations without local server (including homeworkers)Percentage of staff who work flexibly (not fixed homeworkers)Amount of data stored/backed up across organisationPercentage of data stored created/last accessed over 6 months agoPercentage of data needing retention for regulatory complianceNumber of physical application serversNumber of physical database serversNumber of physical utility serversNumber of virtual server host serversNumber of virtual serversNumber of server OS in use and supportedSize of current datacentre (sq metres)
Support costs of current environment
Number of Service Desk calls per yearNumber of server outages per yearEstimated time to recover from each server outageEstimated percentage of users affected by server outageNumber of security breaches per yearRTO guaranteed under current disaster recovery contractRPO guaranteed under current disaster recovery contractPercentage of services restored under current DR contractNumber of DR tests performed annually
Number of change requests
Simple change (eg set up new user)Complex (e.g. new/upgrade application or service and roll out to users)Critical (ICT infrastructure upgrade involving system downtime)Overtime/additional staff costs for out of hours changes and support
Budgets/planned spend: capital
Planned IT Budget capital spend (£ if possible please)Percentage annual budget allocated to infrastructure upgrades/changesPlanned spend on business applicationsPlanned spend on desktop hardware and softwarePlanned spend on server hardware, OS and management softwarePlanned spend on data storage and management hardware and softwarePlanned spend on datacentre improvements and upgrades
Budget/planned spend: revenue
Current annual salaries for IT support staff Current annual hardware maintenance for infrastructure itemsCurrent annual software maintenance for infrastructure itemsAnnual cost of datacentre electricity & datacentre maintenance Annual cost of desktop hardware replacementAnnual cost of disaster recovery contract

Your Challenges?
Increasing pressure to demonstrate business value
Increasingcomplexity
Increasing compliance
Increasing requirement for 24/7 availability
Increasing rate of change and pressure to move faster
Increasing pressure on costs
Increasing pressureto outsourceIncreasing pressure
on business and process alignment
Success increasingly based on integrating processes outside IT Operations
Increasing security requirements
Innovate: Design, Architect, Implement Technology for Business Advantage
Keep IT Running Competitive Cost Right Level of Risk Right Level of Quality With Flexibility and Speed
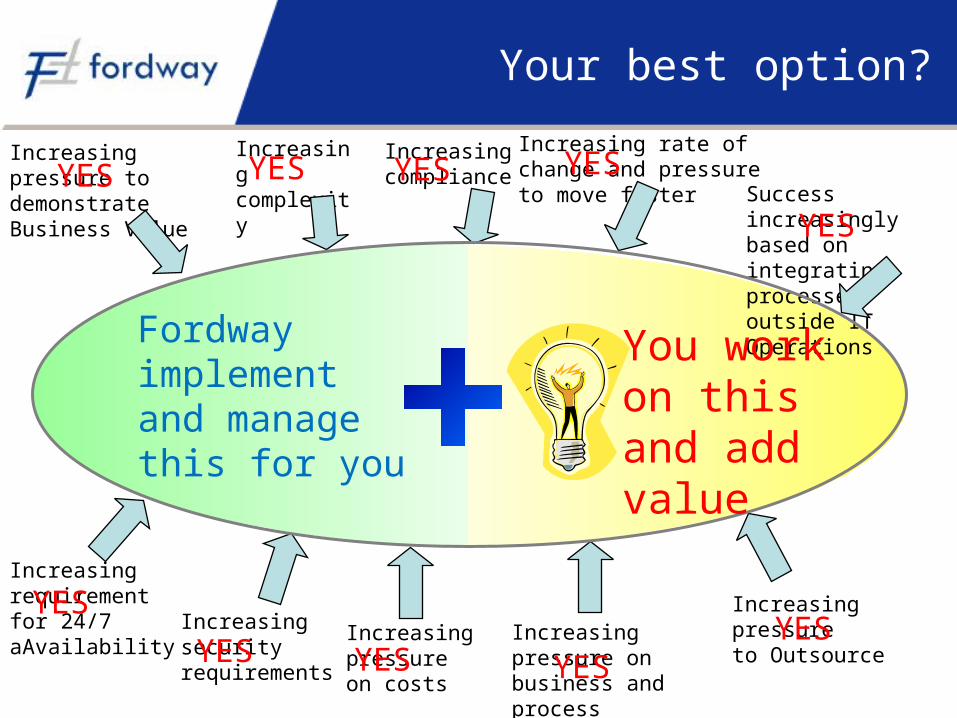
Increasing requirement for 24/7 aAvailability Increasing
security requirements
Increasingcomplexity
Increasing pressure to demonstrate Business Value
YES
YES
YESYES
Your best option?
Increasing compliance
Increasing rate of change and pressure to move faster
Increasing pressure on costs
Increasing pressureto OutsourceIncreasing pressure
on business and process alignment
Success increasingly based on integrating processes outside IT Operations
Fordway implement and manage this for you
You work on this and add value
YES
YES YES
YESYESYES

Discussion Forum
QUESTIONS?
Thank you for your time and attention