increasing fruit and vegetable consumption among …lynnibekwe.myefolio.com/uploads/sb821. 3ps in a...
TRANSCRIPT

1
3 P’s in a Pod Program:
Increasing Fruit and Vegetable Consumption Among Low Income Black/African American
Families living in Mattapan, MA
Emir Duhovic
Lynn Ibekwe
Ivory Sangah Kim
Thien H. Nguyen

2
Introduction
Obesity has become a national public health problem in America. Today, health
professionals are calling obesity in the United States a “crisis” and the number one health threat
facing our nation (Peeters et al., 2003). The number of American adults and children who are
either overweight or obese has dramatically increased over the past 30 years. In 1980, 46% of
the adult population was classified as either overweight or obese. Today, 68%, or 190 million
adults, are categorized as overweight or obese. In addition, nearly one-third of American
children and adolescents are currently at an unhealthy weight (Levi et al., 2010). Various
programs have been implemented to combat the obesity epidemic in the U.S; very few have
demonstrated a reduction in overweight and obesity prevalence (Odgen & Caroll, 2010).
Obesity is a multifactorial condition; genetic, environmental, social, and behavioral
factors play a role in determining body weight. In most cases, overweight and obesity result
from an energy imbalance, in which the intake of calories is greater than its expenditure. An
adult is considered overweight if his or her body mass index (BMI) is 25-29.9 and obese if his or
her BMI is 30 or higher. Overweight among children ages 2 to 19 years is defined as a BMI at or
above the 85th percentile and lower than the 95th percentile for children of the same age and
sex. Obesity among children is defined as a BMI at or above the 95th percentile (CDC, 2012).
Being overweight or obese increases the risk of many chronic health problems, including
heart disease, stroke, type 2 diabetes, and cancer (NIH, 1998; Bradbard, Michaels, Flemings, &
Campbell, 1997). Obesity is associated with a 7-year life decrease for women and a 6-year life
decrease for men (Peeters et al., 2003). An estimated 110,000 Americans die each year as a
result of being overweight or obese (Levi et al., 2011). Children who are too heavy also have
higher rates of high blood pressure, high cholesterol, type 2 diabetes, asthma, and joint
problems than normal-weight children (Biro & Wein, 2010). They are also more likely to suffer
from depression, low self-esteem, and poor social functioning (Hassink, 2007).

3
As the rate of obesity has increased, the related health care costs have also increased.
In 2008, medical costs associated with obesity were estimated at $147 billion, which exceeded
the costs spent on cigarette smoking and alcoholism combined (Finkelstein, Trogdon, Cohen &
Dietz, 2009). Compared to healthy-weight adults, obese adults spend 42% more on healthcare
(Bradbard et al., 1997). Decreased worker productivity, restricted activity, and increased work
absenteeism, have contributed indirectly to the high costs of obesity (Finkelstein et al., 2009;
Bradbard et al., 1997).
The purpose of the 3 P’s in a Pod intervention is to promote healthy eating behavior by
increasing the consumption of fruits and vegetables in low-income Black/African-American
families with children for the residents of Mattapan, Boston, Massachusetts. This will be
achieved by improving access to fruits and vegetables, understanding and decreasing meal
preparation time, cooking healthier meals, and understanding proper nutrition.
Unhealthy Eating in America
To promote health, a predominantly plant-based diet, rich in fruits and vegetables, is
recommended. Furthermore, total caloric intake should be controlled to achieve and maintain a
healthy body weight. Eating a diet abundant in fruits and vegetables throughout the lifespan
protects against a variety of chronic diseases, including heart disease, cancer, stroke, and
diabetes (WHO/FAO, 2003).
Reports have indicated that the majority of Americans do not eat a healthy diet. Very few
individuals meet the United States Department of Agriculture’s (USDA) recommended intake of
fruits and vegetables. The over-consumption of unhealthy fats and added sugars and under-
consumption of fruits and vegetables is common in the American population (Krebs-Smith,
Guenther, Subar, Kirkpatrick, & Dodd, 2010). Total daily energy intake for American adults has
increased by 570 calories over the past 30 years; increased portion size and frequency of eating
and drinking occasions have accounted for most of the rise in total caloric intake (Duffey &

4
Popkin, 2011). The lack of nutrient-rich foods in the diet and over-consumption of excess
calories have contributed to the current obesity epidemic and other high rates of diet-related
chronic diseases (Smith et al., 2010).
Similar to adults, the diet patterns of American children are not as healthy as they should
be. Children today are eating more saturated fat, sodium, and sugar and less calcium and fiber
than what is recommended for good health. Close to 40% of the calories consumed by
American children are in the form of “empty calories” (Reedy & Krebs-Smith, 2010). These
empty calories come from food such as cookies and beverages such as soda and fruit drinks.
While intake of processed foods and sugar-sweetened beverages among children is high, their
consumption of fruits and vegetables is low. Only one in five American children ages 2 to 19 eat
the recommended 5 or more servings of fruit and vegetables per day. French fries constitute
nearly 25% of all the vegetables consumed by children and adolescents (Krebs-Smith, Cook,
Subar, Cleveland, Friday, & Kahle, 1996). The low consumption of fruits and vegetables are
even more pronounced in low socioeconomic and minority groups (Perry et al., 1998).
Socioeconomic Status (SES) and Obesity
Many studies have found a strong association between obesity and SES, with low SES
groups suffering from higher rates of obesity compared to their higher SES counterparts
(Molarius et al., 2000; Health of Boston, 2011; Drewnowski & Darmon, 2005; Morland et al.,
2006). This association exists partly due to poor eating habits common across all
socioeconomic groups, but are most prevalent among individuals from low SES backgrounds
(Drewnowski & Darmon, 2005; Drewnowski & Spector, 2004). Individuals who have limited
economic resources tend to live in neighborhoods that have fewer supermarkets and decreased
access to healthy foods compared to those who live in more affluent neighborhoods (Horowitz,
2004). Diets consumed by individuals with a low SES are more likely to consist of high intakes
of fat and sugar, but very low intakes of fruits and vegetables (Drewnowski & Specter, 2004).

5
High Obesity Rates Among Low SES Families - Boston & Mattapan
Similar to the discrepancy of obesity rates in the U.S. as a whole, there is a disparity in
obesity rates between low SES and high SES neighborhoods in Boston. In 2007, the Boston
Collaborative for Food and Fitness (BCFF) conducted a food and fitness assessment of six
Boston neighborhoods of interest: Jamaica Plain, East Boston, Roxbury, North Dorchester,
South Dorchester, and Mattapan (Newby, 2010). Five of these six neighborhoods have the
highest rates of chronic diseases and obesity compared to the rates of all other Boston
neighborhoods and the overall rate in Boston. 37% of adults in Mattapan, 32% in North
Dorchester, 29% in Roxbury, 28% in South Dorchester, and 28% in East Boston are obese
compared to Boston’s overall percentage of 22%. Each of these neighborhoods have a median
household income between $25,000 and $45,000, with Mattapan (18%) among the highest
percentage of families with incomes below the poverty level compared to the Boston's overall
percentage of 17% (Health of Boston, 2011).
Mattapan has the highest rate of obesity compared to all other neighborhoods in Boston.
In Mattapan’s population of 18,317, 83% of residents identify as Black/African American and
10% identify as Latino. 32% of residents speak a language other than English at home; French
(19%) and Spanish (9%) are the two most common (Health of Boston, 2011). Family
households, which is defined as households that consist of a primary caregiver with at least one
child, make up 70% of all households in Mattapan (Health of Boston, 2011). Since the majority
of Mattapan residents identify themselves as non-Hispanic Black/African American, the 3 P’s in
a Pod program will be aimed at Black/African American families (Health of Boston, 2011).

6
Determinants of Unhealthy Eating Behavior Among Low SES Populations (See Table 1)
Accessibility
The characteristics of a neighborhood play an important role in its food environment and
ultimately to the development of obesity among its residents. Food security, defined as food
access and the ability to acquire nutritionally adequate options, can influence unhealthy eating
behaviors among individuals (Gross et al., 2012). Individuals who live in food insecure
neighborhoods are less likely to have a healthy diet compared to their counterparts (Anderson,
2007). Often times, low SES neighborhoods have an abundance of fast food restaurants and
convenience stores, which lack healthy food choices (Larson et al. 2009). Nationally, zip codes
of low SES neighborhoods have 30% more convenience stores and 25% fewer chain
supermarkets than zip codes of moderate SES neighborhoods (Treuhaft & Karpyn, 2010).
Many studies have found that the presence of supermarkets or full-line grocery stores
(e.g. Stop ‘n Shop, Shaws) is associated with a lower prevalence of obesity, while the presence
of convenience stores is associated with a higher prevalence (Morland et al., 2006). Large
supermarkets in the community can offer food at a lower price and more healthier food options
when compared to smaller grocery stores and convenience stores. The lack of supermarkets in
urban areas like Mattapan can contribute to higher food prices and unhealthy food options.
According to the 2009 Community Food Security Coalition report, there are no full-service
grocery stores within Mattapan’s boundaries (Figure 15).
Along with the high cost of healthy foods in low SES neighborhoods, long commutes and
lack of transportation to supermarkets are major barriers to residents. The Boston Collaborative
Food and Fitness Assessment found that a majority of individuals living in Boston
neighborhoods do not consume the recommended level of fruits and vegetables at home
(Newby, 2010). They found that residents in Mattapan were less likely to shop at their preferred
supermarkets compared to other Boston residents, due to accessibility issues such as long
commute time and high cost of healthy foods (Newby, 2010). This poses a challenge for urban

7
residents who lack reliable personal vehicle and to people who rely heavily on public
transportation.
All of these factors limit many residents to shop at corner stores or convenience stores
for their groceries. Thus, access in terms of distance and costs are barriers within the Mattapan
community and may play an important role in the low consumption of fruits and vegetables.
Food Preparation Behavior
Another factor relating to dietary quality is the food and meal preparation behavior within
the household. The USDA conducted 28 focus groups with food stamp participants across six
major cities to better understand the food choices made by low SES families (Bradbard et al.,
1997). Focus group participants were aware of the poor nutritional quality of their current eating
habits and the need to serve more low-fat, high fiber foods. However, these families were
uncertain how they would translate their understanding to specific food choices. Many
participants expressed difficulty in understanding nutritional food labels and translating the
information to prepare healthier meals (Bradbard et al., 1997).
In a qualitative study conducted by Luca, Barg, Karasx, Palmer, & Long (2011), urban,
low-income African Americans understood that foods from African American cooking traditions
were unhealthy, such as frying and flavoring foods with animal fats and salt. However, the
participants in the study had little knowledge in preparing healthy meals. Many believed that in
order for foods to be healthy, they had to be “bland” with “not too much seasoning.” Younger
individuals of the group seemed to have the least food preparation skills as they relied on
convenience foods and did less cooking in the kitchen. To increase consumption of healthy
foods, participants believed that they needed greater knowledge and skills of healthier
preparation methods. In addition, they believed that their consumption of fruits and vegetables
would increase if they were exposed to them in more “flavorful” ways (Luca et al., 2011).

8
Time Constraints
Bradbard et al. (1997) discussed that an important consideration for food and meal
preparation is the time it takes to prepare a meal. Families who receive food stamps often do
not have regular meals together at home, especially in households with one or more adults who
work long hours (Bradbard et al., 1997; Devine et al., 2009). In such households, family
members are expected to prepare food for themselves for breakfast and lunch (Bradbard et al.,
1997). In order to reduce time and effort in preparing meals, parents decrease their
expectations of food and eating quality (Devine et al., 2009). Parents often end up relying on
easy-to-prepare convenience foods for dinner which are usually high in calories, sodium, trans
fat, and cholesterol, which all have negative effects on health (Bradbard et al., 1997; Devine et
al., 2009).
Blake et al (2011) conducted a telephone survey of a random sample of 25 mothers and
25 fathers of different races (Black, White, and Hispanics) in New York city. Each participant
had low to moderate income (<$60,000), worked 20 or more hours a week, and had one or
more children age 16 or younger at home. Each participant’s diet quality was assessed using
the Healthy Eating Index 2005 (HEI). The investigators found that parents who typically worked
nonstandard hours (does not hold a 9am-5pm job), worked overtime, and had partners who also
worked irregular hours had the highest frequency of missing family meals. In addition, these
parents had low HEI scores for whole fruits, total fruits, dark green and orange vegetables,
whole grains, and milk consumption. On the other hand, parents who worked regular hours
reported the highest frequency of home-cooked family meals and the lowest frequency of
having meals away from home. Furthermore, these parents had substantially higher HEI scores
for dark green and orange vegetables, total grains, whole grains, and milk consumption. Non-
Hispanic Black parents who worked nonstandard hours or worked overtime were the most likely
to report having few home-cooked meals and a higher number of meals consumed away from
home.

9
In Mattapan, 41% of the residents work full time. 68% of the residents report regularly
eating meals away from home (Newby, 2010). It is predicted that parents who work long hours
would be more likely to prepare nutritious meals at home, if preparation time was reduced.
Food Purchasing Behavior
Food purchasing behavior is directly affected by a number of factors such as a person’s
knowledge of nutrition, financial constraints, availability of food options, cultural beliefs, and
one’s attitudes about food and health in general (Beto, Sheth, & Rewers, 1997). In addition to
increasing access and decreasing food preparation time, food purchasing behavior may help
explain the food choices that low SES families make (French, Wall & Mitchell, 2010; Ricciuto,
Tarasuk & Yatchew, 2006). Although there has been compelling evidence that identify physical
accessibility to grocery stores and financial constraints as the primary barriers in food choices
(Giskes et al., 2007; Horowitz, 2004; Newby, 2010; Sobal et al., 2006), researchers have
identified cultural factors to be a potential modifier of the families’ food purchasing behavior
(Sobal et al., 2006; Falk et al., 1996).
Cultural and ethnic traditions were shown to have a large impact in food purchasing and
preparation behaviors, especially among low-income Black/African American mothers (Devine,
Sobal, Bisogni & Connors, 1999; Sanjur, 1982). Primary caregivers of low SES families
discussed that their families enjoy traditional foods and tend to resist new recipes or changes to
their meals (Bradbard et al., 1997).
In BCFF’s report, 80% of Mattapan residents reported that taste had a great impact on
food purchasing behavior (Newby, 2010). On the other hand, only 53% of Mattapan residents
reported price to have a great impact on their buying behavior. In order to effectively change
their food purchasing behavior, it is critical to emphasize how cultural-specific meals can be
prepared in healthier ways while maintaining its flavors.

10
Methods, Applications and Strategies (Table 2) :
Table 2 demonstrates the methods, applications and strategies for the determinants of
unhealthy eating behaviors among low SES Black/African American families in Mattapan. The
proposed methods and strategies are based on a combination of social theories and
approaches to better serve the target population: Health Belief Model, Framing Theory, Social
Cognitive Theory, and Community-Based Delivery.
Applying Theory to Intervention
Health Belief Model emphasizes the importance of education as an effective tool to
change behavior. The proposed intervention will provide an educational component of nutrition
knowledge and cooking skills. The Framing Theory will also be utilized in order to reframe their
negative/barrier-oriented perceptions and attitudes about healthy eating to positive/opportunity-
oriented perceptions and attitudes by promoting self-efficacy through the the use of
communication of educational materials and motivational interviewing during home visits. The
Social Cognitive Theory’s concept of modeling will be introduced in the intervention by providing
cooking demonstrations. Through these demonstrations, families will learn how to cook quick
and healthy meals by observing and being asked to partake in the demonstrations. This will give
participants the practical skills needed to translate prior nutrition knowledge and newly gained
knowledge into healthy meals.
Lastly, a community-based delivery will be employed in an effort to strengthen
community buy-in, engagement, and empowerment. This approach is useful when working with
communities with limited economic resources and decision-making power due to constraints in
their social environment (Israel, Schulz, Parker, & Becker, 1998). Sampling from these multiple
theories results in a multi-factorial approach aimed at changing behavior for the intended
population.
11
Proposed Intervention (Table 4):
A multifactorial intervention will be implemented to increase fruit and vegetable
consumption among low-income Black/African American families living in Mattapan, called 3 P’s
in a Pod. This intervention will involve a community-based delivery consisting of group cooking
demonstrations and collaboration with local mobile produce vendors. Additionally, monthly
home visits will be conducted to provide individualized attention. The multifactorial approach will
help to promote healthy eating behaviors, and ultimately, decrease the prevalence of obesity-
related illnesses in the population. This plan also includes a proposed budget for the
implementation of the intervention (Figure 16).
Community-based Delivery with Mattapan Community Health Center:
The 3 P’s in a Pod intervention will be executed by a study team at the Mattapan
Community Health Center (MCHC). MCHC’s mission is to improve the quality of life for all
residents of Mattapan and surrounding communities by providing comprehensive, accessible,
affordable, and culturally appropriate community health care services, including primary and
preventative health services. In the past, the health center has launched initiatives that have
addressed some of the major health issues in the community, such as the high diabetes rate in
Mattapan (Kelley, 2010).
The intervention team will be comprised of a principal investigator (PI), a study
coordinator (SC), two research assistants (RAs), a community health worker (CHW), and a
nutritionist. The Principal Investigator will lead the study and make all the major decisions
related to the study. The PI will also be responsible for obtaining funding and completing all
steps required to launch the intervention. The Study Coordinator will assist the PI in developing
the necessary materials, hiring support staff, creating appropriate training materials for RAs and
the CHW, relaying relevant program guidelines to the nutritionist and volunteer chefs, managing
the budget for the study, and any other tasks delegated from the PI. The research assistants will

12
work with the study coordinator and will be responsible for promotion and advertising,
recruitment of recipient families, data collection, and any other tasks delegated from the study
coordinator. The nutritionist will work alongside the volunteer chefs to modify recipes to cater to
recipient population’s cultural tastes, maximize nutrient content and provide nutrition facts for
the recipes being demonstrated. The community health worker’s role will be to conduct monthly
home visits for the families that are enrolled in the study.
Collaborative partnerships will be intertwined within each component of the intervention.
For example, a partnership with Mattahunt Community Center, which is equipped with a full
service kitchen and open space for community events, provides a favorable setting for the
delivery of the nutrition education and cooking demonstration component of the intervention.
The intervention team within MCHC will also collaborate with existing mobile produce vendors to
address the issue of food access and purchasing in the Mattapan community. The study
research team will reach out to community centers, churches, and community leaders to
encourage participation of families in the 3 P’s in a Pod intervention. The goal of this strategy is
to strengthen community buy-in, engagement, and empowerment in turn encouraging family
participation.
Eligibility and Recruitment:
Recruitment will be executed through advertisements of the intervention program
throughout the community of Mattapan using flyers, word of mouth from community leaders and
members, and social networking. Eligible participants in the intervention are low-income
Mattapan families with children who identify themselves as Black and/or African American.
Potential participants will complete a questionnaire over the phone to see if they meet the study
eligibility criteria (Figure 1). For the purpose of this intervention, low-income families are based
on the size of a family defined by the Office of Postsecondary Education (Figure 2).

13
The study will recruit 20 families to participate in the intervention. It is expected that the
families attend the cooking demonstrations and allow community health workers to conduct
home visits. Participants will complete a self-administered pre-test questionnaire to assess their
current dietary habits and barriers to fruit and vegetable consumption (Figure 3). Parent/s or
caregiver/s will complete the pre-test questionnaire at the site of the first cooking demonstration
session before it begins. The same questionnaire will also be administered at the final home
visit to assess changes in their dietary habits and barriers to fruits and vegetables consumption.
A separate questionnaire will be administered at the 3-month and 6-month mark to assess
participants’ satisfaction with activities being delivered. This will be part of the process
evaluation to assess program’s objectives and success throughout the program.
To motivate eligible families to participate in the intervention and to decrease dropout
rates that previous cooking demonstration interventions have experienced (Cooking Matters,
2011), a coupon of $5 will be distributed each family who attend each demonstration session
that can be used to purchase produce from the mobile vendors at the site. Home visits will also
be incorporated in order to provide personalized nutrition education and address the unique
needs of each family in order to have high adherence, compliance and retention rates.
Cooking Demonstration & Nutrition Education:
Understanding the demographic of Mattapan, culturally sensitive cooking
demonstrations can change negative attitudes that many minority families have towards healthy
foods. In the span of 6 months, 12 one-hour cooking demonstration sessions will be led by
collaborating with chefs from local restaurants in the Boston area or other volunteer chefs.
Black/African American chefs are preferred due to cultural and community similarities. By
working with chefs from the community, this intervention will not only provide culturally sensitive
nutrition knowledge for families but will also empower the volunteer chefs to become leaders of
healthy eating behaviors within the community.

14
The cooking demonstrations will achieve the objective by introducing how to prepare
inexpensive, tasty and healthy meals, enhancing nutrition knowledge, decreasing cooking
preparation time, and changing food purchasing behavior. Both the nutritionist and volunteer
chefs will collaborate on the recipes being presented in order to highlight the ethnic and cultural
background of the participating families such as using familiar herbs, spices and/or methods of
cooking. The collaboration will also make sure that the recipes are low in calories and high in
essential vitamins, minerals, fiber, and other nutrients in fruits and vegetables. The recipes must
be approved by the research team before being demonstrated for the participants.
Each volunteer chef will demonstrate the modified recipe, emphasizing the affordability,
tastiness and short preparation time of each meal. Families will be encouraged to partake in the
preparation and cooking process such as chopping, stirring, and mixing, to enhance their
experience and understanding. The meals will incorporate the seasonal produce options that
the Bell Tower Foods or Mattapan Mobile Farmstand offers. With one of the mobile produce
vendors present at the site after each cooking session, the volunteer chefs and research team
will encourage the families to purchase produce items used during the session to replicate
presented meals at home. Families will also be able to redeem the coupon voucher at the
mobile produce vendors to purchase fruits and vegetables at affordable prices on the day of the
demonstration.
A recipe pamphlet containing the demonstrated recipe with its nutrition facts will be
distributed to each family per demonstration (Figure 4). These pamphlets will also include a
nutritional “fun fact” about the main healthy ingredient being used. This will help to introduce
new and practical nutrition knowledge. The recipes provided will factor in time constraints,
helping families to decrease their meal preparation time. It will also provide the estimated cost of
preparing each meal to change the perception that healthy eating is costly. In addition, providing
a small sample of the presented dish for participating families to taste will encourage them to

15
understand that healthy foods can be tasty, and consequently, to purchase more fruits and
vegetables.
Along with the pamphlet, families will also receive easy-to-read educational material that
reviews basic nutrition concepts. Topics that are covered in the material will include the
following: food groups, macronutrients, micronutrients, how to read food labels, tips to choose
the healthiest options in the supermarket, and nutrition myths (Figure 5). The educational
material will be reviewed one-on-one with parents during the home visits.
Collaboration with Bell Tower Foods & Mattapan Mobile Farmstand:
Mobile food vendors are a fairly new concept and are usually located in disadvantaged
or underserved neighborhoods to improve access and address the problem of “food deserts.”
For example, People’s Grocery Mobile Market in Oakland, California (founded in 2001) turned
an old postal truck into a grocery store with shelves, bulk bins, and refrigeration to serve low-
income neighborhoods in west Oakland. The mobile market accepted government food stamps
as a form of payment. In 2004, membership doubled to over 200 members in the Oakland area
serving about 3,500 customers per year (Suutari, 2006). Sales have doubled since its inception,
with 60% of respondents saying they had tried new types of healthy food. Additionally, 55% of
participants reported that they regularly ate more fruits and vegetables, and customers reported
they were eating healthier and trying more kinds of food (Suutari, 2006). The mobile market has
expanded across the United States with two currently serving the Boston area- Bell Tower
Foods and Mattapan Mobile Farmstand.
The collaboration with Bell Tower Foods Truck and Mattapan Mobile Farmstand will
provide participants with access to fresh produce. After each cooking demonstration session,
one of the mobile produce vendors will be present at the site for program participants to
purchase affordable fruits and vegetables. The participating families will be able to use their
SNAP benefits, other food assistance program benefits, and coupon vouchers (obtained at the

16
cooking demonstrations) to pay. Convenient access to fresh and affordable produce will help to
change the food purchasing behavior of the participating families, as it encourages families to
eat more fruits and vegetable and to apply knowledge obtained at cooking demonstrations when
purchasing food items for their family.
Personalized Nutrition Education Through Home Visits:
Home visits will be another component of the intervention for the families enrolled in the
program. Previous studies have shown that home visiting programs can improve the health and
wellbeing of families. They have been promoted as a way to prevent a range of health problems
in children from vulnerable and disadvantaged families (Wen, Baur, Rissel, & Wardel, 2007).
In recent years, home visits have expanded to include obesity prevention efforts. Home-
based interventions through home visits have been shown to be beneficial in addressing some
of the risk factors linked to obesity, such as poor diet and sedentary lifestyle (Wen, Domenico,
Elliott, Bindon, & Rissell, 2009). Participants in interventions that have incorporated home visits
have expressed positive attitudes toward the home visits; the participants described home visits
as “enjoyable and something that they looked forward to”. Having the same health coach for
each home visit was welcomed by parents, helping to foster “mutual rapport, trust, and
confidence” (Wen et al., 2009, p. 579). Parents reported that they felt more comfortable asking
questions and felt that they and their children were being cared for. There was a 95% retention
rate for mothers participating in a home visit intervention that addressed risk factors for
childhood obesity (Wen et al., 2009). By integrating home visits as a part of the program, it will
decrease the dropout rate of the cooking demonstration classes. In addition to making a positive
impact on eating and physical activity behaviors among families, home-based interventions
have also been effective in reducing mean BMI for young children. Home visits have beneficial
effects as they provide one-on-one attention and can be tailor to the unique needs of each
family (Wen, Baur, Simpson, Rissel, Wardle, & Flood, 2012).

17
The home visits will be adapted and modified from an intervention done by Taveras et al.
(2012). In Taveras et al.’s study (2012), the researchers developed a home-based program for
low SES minority parents in Boston. Health educators visited each family and used motivational
interviewing to encourage healthy household routines, such as eating healthy meals regularly as
a family. The intervention was specifically tailored to the needs of each family; researchers
conducted a baseline assessment of the home environment and the social supports, barriers,
and facilitators to behavior change (Taveras et al., 2012).
While the cooking demonstration sessions in 3 P’s in a Pod provide general tips on
healthy cooking, the home visits will provide personalized nutrition education for each family.
There are three purposes of home visits in this intervention. First, they help each family to make
and achieve monthly dietary goals. Second, they serve to increase parents’ knowledge about
nutrition and healthy eating. This increased knowledge will help families make healthier food
choices. Finally, home visits will help increase parents’ self-efficacy of purchasing and
preparing healthy foods through motivational interview.
In the span of the 6-month 3 P’s in a Pod program, six one-hour home visits will be
conducted by a community health worker (Figure 6). At the first home visit, the community
health worker will review the pre-test questionnaire with the parent/s to better understand the
strengths and weaknesses of the family’s current diet. The CHW will emphasize the strengths
and positive assets that each family has and reframe their unique barriers as an opportunity to
make the necessary dietary changes. At this visit, the CHW and family will work together to
develop healthy dietary goals and behavioral changes that can be achieved throughout the
course of the intervention. The specific goal for increasing fruit and vegetable consumption will
be realistic, measurable, and attainable for each family. The family will be instructed to keep a
monthly log that tracks the number of fruits and vegetables consumed each day (Figure 6).
After the first home visit, the remaining monthly home visits will serve as a check-in to
review progress and monitor possible setbacks to the family’s healthy eating behavior. Dietary

18
and behavior change goals that were made the previous month will be reviewed. The CHW will
discuss the family’s eating habits since the previous home visit. He or she will ask how fruits
and vegetables have been incorporated into the family’s diet. The CHW will try to address and
help the family overcome any barriers that prevented them from meeting their diet goals. For
example, the CHW will give advice on how barriers, such as time or financial constraints, can be
surpassed. They will use motivational interviewing to enhance the family’s motivation to
overcome any setback and help to support the positive diet changes already made (Taveras et
al., 2012).
At these home visits, the parent/s and the CHW will also discuss the nutrition information
learned from the educational material provided at the cooking demonstrations. An activity, such
as reading the nutrition label on the packaged food in the kitchen, will help parents to
understand how to make healthier choices. Suggestions to plan, purchase and prepare healthier
foods will be made.
Adoption, Implementation, & Sustainability of Program (Table 3):
Adoption of Program:
Every year, Mattapan Community Health Center (CHC) assesses the health status of
Mattapan and its neighborhoods by looking at the annual health report produced by the Boston
Public Health Commission. This report provides a review of selected health conditions, risk
behaviors, and social determinants of health. In recent reports, obesity was found to be the
biggest problem for the community of Mattapan (Newby, 2010). Mattapan CHC will choose a
program to address with the obesity problem in their community.
Previous interventions have demonstrated the efficacy of cooking demonstrations when
combined with nutrition education to increase the intake of healthier food options. Other
interventions have provided mobile product vendors to solely address access as a determinant
for increasing the intake of produce. However, no intervention has combined all the components

19
together to address all barriers to increase the intake of fruits and vegetables. Therefore,
Mattapan CHC will adopt a program that combines both nutrition education and the availability
and accessibility of mobile produce vendors with cooking demonstrations, the 3 P’s in a Pod
Program. To effectively address the obesity problem in Mattapan, Mattapan CHC must
understand the advantages of the proposed program and how it will meet the needs of
Mattapan’s dominant demographic groups compared to other available programs. Mattapan
CHC must also see the value and importance of the program and expect it to meet the needs of
the Mattapan community by improving health outcomes of residents. This will help accomplish
Mattapan CHC’s goal to decrease the prevalence of obesity in Mattapan in order to improve the
overall health outcomes of its residents.
In order to execute the program, Mattapan CHC will first develop a research team
responsible for implementing the program. They will select a principal investigator (PI), study
coordinator (SC), two research assistants (RAs), a nutritionist, and a community health worker
(CHW) who possess the necessary skills to successfully implement the 3 P’s in a Pod program.
Mattapan CHC will also partner with Mattahunt Community Center (CC) to utilize the local
center as the venue of the cooking demonstrations. Understanding the importance of the
cooking demonstration, Mattahunt CC will agree that the goals of the cooking demonstrations
are valuable to the community and will make their community space available for program use.
As a result of Mattahunt CC’s importance to many Mattapan residents and its ties to the
community, it is expected that this partnership will encourage the community to participate in the
program.
An additional partnership with Bell Tower mobile produce vendor and Mattapan Mobile
Farmstand will help to increase the availability of affordable produce in Mattapan. Recognizing
the food desert situation in Mattapan, the mobile produce vendors will expect that their presence
in Mattapan and collaboration with MCHC will increase residents’ access to produce. Hence, the

20
mobile produce vendors will react favorably to the objectives of the program due to its alignment
with their mission.
As a final step needed for Mattapan CHC to successfully adopt the program, the
research team will recruit local chefs willing to volunteer their time to be cooking leaders for the
cooking demonstrations. To ensure that the volunteer chefs will be effective, they will
understand and respond favorably to the importance of the cooking demonstrations. It is also
important that they feel confident in their ability to conduct the cooking demonstrations and
effectively communicate the importance of healthy food preparation to participating families.
Implementation of Program:
After the program is successfully adopted, the PI and SC at Mattapan CHC will create an
implementation plan that will outline the details of the program. In order for the implementation
to be effective, both the PI and SC will understand and express confidence in their ability to
organize and execute the program before teaching others. The PI and SC will orient the
implementation plan with the rest of the research team and the volunteer chefs. To ensure
fidelity and complete understanding of the program, the research team and the volunteer chefs
will describe the implementation plan and its objectives to the PI and SC to demonstrate the
knowledge gained. To implement successfully, it is also important that the research team and
volunteer chefs react favorably towards the program and its outcome. The SC will provide
guidelines of pertinent nutritional knowledge that the nutritionist needs to pass on to the
volunteer chefs and the community health worker. The SC will discuss the barriers that the
community has and provide demographic information about Mattapan residents and other
necessary information to the nutritionist in order for the nutritionist to have a better
understanding of the target population. This will help the nutritionist to work with the chef and
the other members of the research team to create the appropriate recipes for the cooking
demonstrations.

21
After the nutritionist understands the demographics of Mattapan and the barriers its
residents may face, the volunteer chefs and the research team will be oriented in nutrition
education by the nutritionist. They will learn the key components of a healthy diet and
understand nutrition facts regarding the recipes in the recipe pamphlets. Furthermore, they will
learn the skills needed to educate participants and convey nutrition information in an easy way
for participants to understand.
For the cooking demonstrations, volunteer chefs will be responsible for teaching each
session. By working with the nutritionist, the chefs will develop many easy, low cost, tasty,
healthy recipes that will be appropriate for the Mattapan community. They will also be able to
substitute unhealthy ingredients in the recipes with healthier ingredients. For example, low fat or
no fat milk will be used instead of whole milk in recipes. When cooking healthier versions of their
recipes, the volunteer chefs will understand the need to use inexpensive ingredients that are
available to purchase either in Mattapan or at the mobile vendors.
In order for the volunteer chefs to cook the healthy meals at the cooking classes, the
mobile vendors, such as Bell Tower Foods, will provide the fresh and affordable produce for the
program. These vendors will expect that over the span of 6 months, participants will attend the
one-hour cooking demonstration sessions and purchase their produce. Mobile produce vendors
will have positive attitudes toward the program and understand that their service is improving
food access in the community.
Another important component of 3 P’s in a Pod is the home visits conducted by the
community health worker. The community health worker will be able to and express confidence
in conducting motivational interviews to increase participants’ self-efficacy and encourage
dietary behavior changes.
Throughout the implementation of the program, the research team will ensure that each
component is completed and executed properly and as intended. Every member of the research

22
team will express confidence in their ability to carry out their component of the program
successfully and as intended and expect the program to run smoothly and according to the plan.
Sustainability of Program:
After the 6-month program is completed, Mattapan CHC will draft a proposal for Robert
Woods Johnson Foundation (RWJF) for a grant to sustain the program. The proposal will
describe the objectives of the program and how it aligns with the objectives of RWJF. Taking
into account RWJF’s previous efforts to minimize health disparities in the US, the proposal will
describe the importance of the 3 P’s in a Pod program and its impact on the health of residents
in Mattapan.
When funding is secured from RWJF, the Mattapan CHC coordinator will incorporate the
3 P’s in a Pod program to the Mattapan CHC as a part of the center’s obesity prevention effort.
In order to successfully incorporate the program to the Mattapan CHC, the CHC coordinator will
recognize the importance of integrating the program into center events/projects and feel
confident in being able to execute the program without the research team. The CHC coordinator
will also describe how to integrate the program into the center’s events/projects.
To sustain and maintain the program as part of the curriculum at Mattapan CHC, the
appointed program associate’s job description will entail overseeing and executing the 3 P’s in a
Pod program to clarify the program champion. The Mattapan CHC will outline the basic
knowledge and skills needed of the program associate. In addition, the Mattapan CHC will
expect that the program associate is qualified and will lead the program successfully.
3 P’s in a Pod will continue to collaborate with the chefs and mobile vendors that have
volunteered in the past by building rapport and a relationship with the chefs and mobile vendors.
Additionally, all recipes and pamphlets used in the program will be kept for future use. The
community health worker will help to train lay health workers from the community to conduct
effective home visits. The lay workers will learn with the skills and techniques that are necessary

23
to effectively execute motivational interviewing and feel confident in their ability to successfully
conduct a home visit. Figure 14 explains the transition of leaders and interaction of all
stakeholders from adoption to implementation to sustainability of the program.
Evaluation:
Process evaluation will be used to determine the elements and processes that are
presented both within and around program adoption and implementation to ensure fidelity of the
program. First, to ensure that the program was implemented as intended, a checklist will be
conducted at the demonstration and at home visits (Figure 6; Figure 9).
Additionally, sales of produce from the mobile produce vendors will collected after each
night of sales to make sure that the produce trucks are being utilized as intended.
In order to ensure that the program reached the intended target population, only families that fit
the inclusion criteria (i.e. race, residence, income) are eligible to enroll in the program attend the
cooking demonstrations, and receive discounted coupons to purchase produce from the mobile
truck at the time of the demonstration. A program schedule will be created and reminders (via
email, telephone) will be sent to the mobile produce vendors and volunteer chefs (Figure 10).
Given the study design and procedure, the following areas will be examined to ensure
program quality and success through process and outcome evaluation.
Process Evaluation:
A schedule will be made in order for volunteer chefs and mobile produce vendors to
make sure they adhere and comply with the set dates of the demonstrations (Figure 10).
To ensure that people in the program received the services that they are supposed to
receive, there will be a cooking demonstration sign-in sheet at every demonstration; keeping
track of the number of attendees at each cooking class will help to assess the dose-response
relationship (Figure 11). There will also be a checklist for each demonstration to make sure

24
everyone follows protocol and everything is in place. Additionally, a member of the research
team will collect the coupons, used by participants, from the mobile produce vendors to observe
the effectiveness of reinforcement vouchers in purchasing healthy produce. Furthermore, CHW
will track the number of visits each family receives during the 6-month period. The CHW will
have an itemized list of topics to discuss with the families at each home visits to ensure that all
families are receiving the same message (Figure 7; Figure 9).
Lastly, to evaluate participants’ satisfaction with the program’s services, a post survey
will be given to the participants. The satisfaction survey, modified from the Body and Soul
intervention and the Cooking Matters intervention, will be given to participants at the 3-month
and 6-month mark (National Cancer Institute, 2004; Cooking Matters, 2011) (Figure 12). This
will ensure that the program is being delivered as intended. Additionally, volunteer chefs and
mobile vendors will be asked to complete a satisfaction survey to assess their attitude with the
program (Figure 13).
The average cost of each person will be documented by keeping track of the number of
cooking lessons attended and the number of home visits for each family. The SC will oversee
the budget to ensure the program is within the budget.
Outcome Evaluation:
The outcome evaluation will assess the impact of the program, addressing several
impact questions regarding outcomes of interest (Figure 17). The 3 P’s in a Pod program’s
overarching goal is to reduce the risk of obesity and diet-related illnesses among Black/African
American families living in Mattapan, MA. The logic behind this program is that improving food
planning behavior, reducing meal preparation time, and modifying food purchasing behavior
towards healthier food options (by directly influencing participants’ knowledge, attitudes,
expectations, and self-efficacy) helps to achieve the program’s overarching goal. To assess
these changes, a survey will be administered to participants at baseline and at the end of the

25
program (Figure 3). It will assess the changes that relate to intermediate, long-term, and health
and quality of life outcomes of interest.
The program also aims to facilitate participants’ behavior change by collaborating with
mobile produce vendors to increase the availability of fruits and vegetables for participants.
Having a produce vendor present at the site is intended to address the barriers that families
experience in accessing healthy food options in Mattapan. To assess the effectiveness of the
environmental component, a modified satisfaction survey will be administered to participants at
the 3-month and 6-month mark; this survey will assess families satisfaction with program
services, including access to mobile produce vendors (Figure 12).
These assessment tools, in combination, will test the program’s overall impact on the
family’s targeted behavior (Figure 3). Changes in all of the individual level and environmental
level determinants are intermediate outcomes that will lead to long-term outcome changes, such
as increased fruit and vegetable consumption and increased availability of fruit and vegetables
in Mattapan residents. By targeting and achieving changes in the proposed outcomes, it is
hypothesized that participants will have a reduced risk of obesity and diet-related illnesses over
time.

26
Appendix

27
Figure 1:
Eligibility Questionnaire
What is your household income level? (Please check one option below)
_______ less than $20,000
_______$20,000 - $24,999
_______$25,000 – $29,999
_______$30,000 – $34,999
_______$35,000 - $39,999
_______$40,000 - $44,999
_______$44,000 - $49,999
_______$50,000 - $54,999
_______$55,000 - $59,999
_______$60,000 or above
Including yourself, how many people are in your household? ______________________
What is your gender?
Male_______ Female_______
What do you identify yourself as?
_______White
_______African-American/Black
_______Asian
_______Other
If other, please specify: _________________________________________________
Are you a resident of Mattapan?
Yes_______ No_______

28
Figure 2:
Definition of Low-Income According to Family Size
Size of Family
Unit
48 Contiguous States, D.C., and Outlying Jurisdictions
1 $16,755
2 $22,695
3 $28,635
4 $34,575
5 $40,515
6 $46,455
7 $52,395
8 $58,335

29
Figure 3:
Pretest and Posttest Questionnaire
Nutrition and Eating Habits Questionnaire
Who prepares meals in your home?
How many minutes, on average, does it take you to prepare 1 meal at home?
How many meals do you eat away from home on weekdays?
Breakfast?_____________ Lunches?____________________ Dinner?__________________
How many meals does your child(ren) eat away from home on weekdays?
Breakfast?_____________ Lunches?_____________________Dinner?__________________
How many meals do you eat away from home on weekends?
Breakfast?_____________ Lunches?____________________ Dinner?__________________
How many meals does your child(ren) eat away from home on weekends?
Breakfast?_____________ Lunches?____________________ Dinner?__________________

30
List restaurants where your family often eats:
Think about your eating habits in the past 6 months about how often do you eat each of the
following groups. Remember breakfast, lunch, dinner, snacks and eating out. Check one box for
each food.
Fruits and
vegetables
Less than
1x WEEK
Once a
WEEK
2-3 times a
WEEK
4-6 times a
WEEK
Once a DAY 2+ a DAY
Fruit juice
(e.g.
orange,
apple,grape,
fresh, frozen
or canned
and NOT
sodas or
other drinks)
Fruit (fresh,
frozen
canned
without
syrup)
Potatoes,
any kind,
including
baked,
mashed or
fried.
Vegetable
juice (tomato
juice, V-8,
carrot)
Green salad
Vegetables
(including
string beans,
peas, corn,
broccoli)

31
*Adapted from NutritionQuest, 2009. http://www.nutritionquest.com/wellness/free-assessment-tools-for-
individuals/fruit-vegetable-fiber-screener/
How often do you eat at home?
_______ Never
_______ Less than one time/week
_______ Once a week
_______ 2-4 times/week
_______ 5-6 times/week
_______ Daily
How often does your child(ren) eat at home?
_______ Never
_______ Less than one time/week
_______ Once a week
_______ 2-4 times/week
_______ 5-6 times/week
_______ Daily
What kinds of fat do you use for frying and sautéing at home?
_______Butter
_______Margarine
_______Olive Oil
_______Cooking Spray (e.g.PAM)
_______Shortening or lard
How many hours do you work per week?
How many hours does your spouse work per week? (If applicable)
Where does your family do most of the grocery shopping (name the supermarket, grocery store,
convenience store, farmer’s market, etc.)?
How long does it take you to commute to the grocery store where you most frequent at?
Do you receive any food assistance program (SNAP, WIC, etc.)?
Yes____________ No_______________
If so, what kind?
Do you think that fruits are too expensive to purchase?
Yes_____________No _______________
Do you think that vegetables are too expensive to purchase?
Yes_____________No_________________

32
Please indicate your level of agreement with each of the following statements circle the
appropriate number):
I am confident in cooking with healthy ingredients.
1 2 3 4 5
Strongly
Disagree
Disagree Neutral Agree Strongly
Agree
Based on my current purchasing behavior, I feel I can prepare healthy meals for my family.
1 2 3 4 5
Strongly
Disagree
Disagree Neutral Agree Strongly
Agree
I am comfortable in using the nutrition knowledge to prepare my meals.
1 2 3 4 5
Strongly
Disagree
Disagree Neutral Agree Strongly
Agree
I feel confident in substituting unhealthy ingredients with healthier options when preparing a meal
for my family.
1 2 3 4 5
Strongly
Disagree
Disagree Neutral Agree Strongly
Agree
I feel confident in my ability to prepare quick and nutrition meals
1 2 3 4 5
Strongly
Disagree
Disagree Neutral Agree Strongly
Agree
I believe that healthy foods are tasty.
1 2 3 4 5
Strongly
Disagree
Disagree neutral Agree Strongly
Agree

33
How many servings of fruit and vegetables a day do you think experts are advising people to eat?
(One serving could be, for example, an apple or a handful of chopped carrots)
A glass of unsweetened fruit juice counts as a serving of one fruit (a medium-sized apple, a small
banana).
_______ Agree
_______ Disagree
_______ Not sure
Are you aware of any major health problems or diseases that are related to a low intake of fruit
and vegetables?
_______ Yes
_______ No
_______ Not sure
If yes, what diseases or health problems do you think are related to a low intake of fruit and
vegetables?
____________________________________________________________________________________
____________________________________________________________________________________
___________________________________________________________________________________

34
Figure 4:
Sample Recipe Pamphlet
Spicy Jimaca and Mandarin Orange Salad
Fun Fact: Jicama is a good source of Vitamin C and very low in calories.
Total Time: 25 minutes
Prep Time: 15 minutes
Cost Per Serving: $1.50
All fruits and vegetables can be purchased after the demonstration outside at the mobile produce vendor.
Ingredients:
● 1 Jicama Peeled and Cut
into 1/4 by 1 inch
● Juice of One Orange
● Juice of One Lime
● Juice of 1/2 Grapefruit
● 1/4 Teaspoon Salt
● 1/4 Cup Olive Oil
● 1 Red Apple, Corned and
Julienned
● 1 (15 ounce) Can
Mandarin Oranges,
drained
● 2 Tablespoons Cilantro
Finely Chopped
● 1/2 Teaspoon Chili Powder
● 6 Leaves of Romaine
Lettuce
Procedure:
1 In a large glass bowl,
combine the jicama with
the orange lime and
grapefruit juices and salt.
2 Toss to mix and let sit,
covered at room
temperature for 1 hour.
3 About 15 minutes before
serving add the olive oil,
apple, mandarin oranges
and cilantro to the bowl
and toss thoroughly.
4 Season with the chili
powder taste for seasoning
and toss again. scoop
salad evenly into lettuce
leaves and serve
Nutritional Info:
Calories-190, Fat-9g,
Protein-2g, Fiber-6g, Calcium-
30mg, Iron-1mg
Prepping Advice:
Cut fruits and vegetables ahead for
easy access the next day. This
goes the same for meat – marinate
a day ahead to cut down on
preparation time the next day.
Marinating meat ahead of time
gives the meat more flavors and
makes it more tender.
Source:
Let's Cook/Vamos a Cocinar
(Klarin, Katie and Knizewki,
Ritamaria).

35
Figure 5:
Educational Material
*Will be given after the cooking demonstrations and reviewed at the home visits
Example 1:
Reading the nutrition label can be confusing. Here are some simple pointers for the next time you pick up
a packaged food item at the supermarket. Remember: the more practice you get reading the labels, the
better you will become in using them as a tool to improve your child's health!
● Always look at the serving size. Nutrition information provided on a label is based on only one
serving. The nutrition label below shows that there are 2 servings per container. If you or you
child ate the whole container you would have consumed a total of 520 calories (260 x 2).
● Eat less fat, especially saturated fat. Avoid trans fat. Limit total cholesterol. The product below is
high in saturated fat because a single serving provides 25% of the daily value for saturated fat.
Look for foods that have less than 20% of the daily value for saturated fat per serving.
● Reduce the amount of sodium eaten during the day; most of our sodium comes from processed
foods, so be on the lookout for high sodium levels.
● Eat foods high in complex carbohydrates and dietary fiber. You will need to look at the ingredient
label to see if the product is whole grain. Look for words such as "100 % whole grain," "whole
wheat," or "brown rice."
● Decrease the amount of sugar in your child's diet. Read the ingredient label to identify added
sugars. A couple of names for added sugar include high fructose corn syrup, cane juice, fruit juice
concentrate, and honey.

36
Figure 5:
Educational Material Example 2
*given after the cooking demonstrations and reviewed at the home visits
http://www.choosemyplate.gov/healthy-eating-tips/ten-tips.html

37
Figure 6:
Specific Goals for Home Visits
1st month home visit:
● CHW meets all the families in the program
● CHW review’s pre-test questionnaire with the parent/s in detail
○ Discussion with parent(s) regarding the strengths and weakness of their diet
○ Assets and barriers to making dietary changes
● CHW and parent(s) make healthy diet goals
● CHW provides monthly log for parents to track intake of fruits and vegetables
2nd-6th Home Visit:
● Discussion about past month dietary habits
● Review of past month fruit and vegetable log
● Have any diet changes been made?
○ If family did not achieve monthly goal, what were some barriers that family
experienced?
○ How can barriers be overcome for the next month?
● Detailed review of nutrition educational material
● CHW and parent(s) make diet goals for the next month.
○ What needs to be changed?
○ Is goal realistic and attainable for the next month?
○ What steps can family make to sure that their goal is achieved?

38
Figure 6:
Sample Family Monthly Log of Goals and Accomplishments
Smith Family:
Visit Date Accomplishment Task/Discussion Goals for next visit CHW comments
February 16 - Review pre-test questionnaire
- Discuss diet goals
- Discuss assets and barriers
- Log fruit and vegetable
intake for the month.
- Meeting went great.
- No concern.
- Next meeting will be on
March 23 at 6pm.
March 20 - Diet goal 1 met. - Review last month’s fruit and
vegetable intake log
- Review barrier #1
- Discuss purchasing
healthy foods on a
budget
April 20 - Diet goal 2 met - Discuss barrier #2
- Review fruit and vegetable logs
- Discuss preparing
healthy meals

39
Figure 7:
Sample Overall Home Visit Goals for Family
In the space provided, write the number of servings of fruit and vegetables you ate during each day. Specify which fruits and
vegetables you ate
My personal goals: I will eat ____servings of fruit and ____servings of vegetables every day during the month.

40
Figure 8:
Checklist of ‘3 P’s in a Pod’ cooking demonstration
Checklist for ‘3 P’s in a Pod’ Lesson
Date/time: ____________________ Session # _______________
Sign-in attendance sheet for parents and their children
Mobile vendors on site?
Nutritionist on site?
Volunteer chef on site?
Name of volunteer chef: ____________________________________
Ingredients (fruits, vegetables, oil, spices, etc)
Utensils (knives, pots, pans, plates, cutting board, spoons, forks, etc)
Recipes pamphlets ready to be distributed
Recipe being prepared: ______________________________________
Venue is clean and prepared
First aid available
Signatures:
Nutritionist Mobile produce vendor Volunteer chef
41
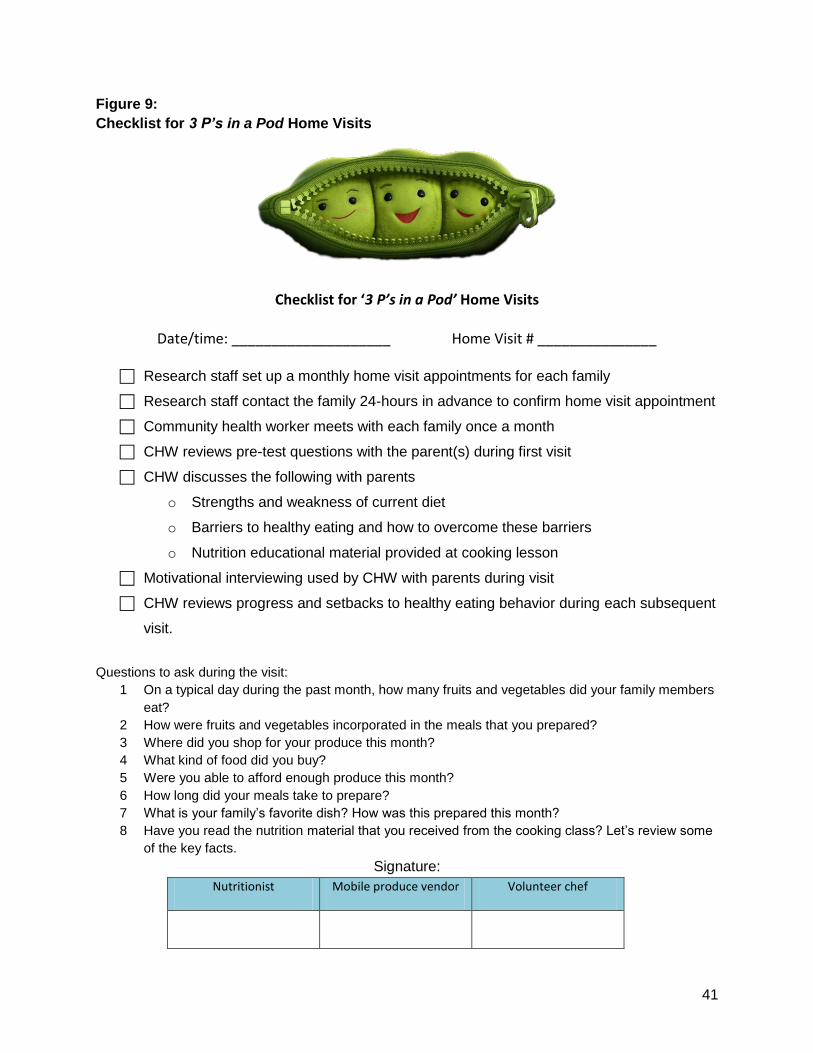
Figure 9:
Checklist for 3 P’s in a Pod Home Visits
Checklist for ‘3 P’s in a Pod’ Home Visits
Date/time: ____________________ Home Visit # _______________
Research staff set up a monthly home visit appointments for each family
Research staff contact the family 24-hours in advance to confirm home visit appointment
Community health worker meets with each family once a month
CHW reviews pre-test questions with the parent(s) during first visit
CHW discusses the following with parents
o Strengths and weakness of current diet
o Barriers to healthy eating and how to overcome these barriers
o Nutrition educational material provided at cooking lesson
Motivational interviewing used by CHW with parents during visit
CHW reviews progress and setbacks to healthy eating behavior during each subsequent
visit.
Questions to ask during the visit:
1 On a typical day during the past month, how many fruits and vegetables did your family members
eat?
2 How were fruits and vegetables incorporated in the meals that you prepared?
3 Where did you shop for your produce this month?
4 What kind of food did you buy?
5 Were you able to afford enough produce this month?
6 How long did your meals take to prepare?
7 What is your family’s favorite dish? How was this prepared this month?
8 Have you read the nutrition material that you received from the cooking class? Let’s review some
of the key facts.
Signature:
Nutritionist Mobile produce vendor Volunteer chef

42
Figure 10:
3 P’s in a Pod Demonstration, Truck , & Home Visit Calendar

43
Figure 11: 3P’s in a Pod Cooking Demonstration Attendance Sheet
February 2013 March 2013 April 2013 May 2013 June 2013 July 2013
ID Family 1 (Feb 9)
2 (Feb 23)
3 (Mar 2)
4 (Mar 16)
5 (Apr 13)
6 (Apr 27)
7 (May 11)
8 (May 25)
9 (Jun 8)
10 (Jun 22)
11 (Jul 6)
12 (Jul 20)
1 Johnson family (2 adults, 1 child) X X
2 Smith family (2 adults, 2 children) X X
3 Patterson family (2 adults, 1 child) X X
4 Wilson family (2 adults, 4 children) X X
5 Holmes family (2 adults, 3 children) X X
6 Bosworth family (2 adults, 2 children) X X
7 Bradley family (2 adults, 3 children) X X
8 Anderson family (2 adults, 2 children) X X
9 Thompson family (2 adults, 5 children) X X
10 Walker family (2 adults, 4 children X
11 Farley family (2 adults, 2 children) X X
12 Hawks family (2 adults, 2 children) X X
13 Bryant family (2 adults, 1 child) X X
14 Joseph family (2 adults, 4 children) X X
15 Kennedy family (2 adults, 3 children) X X
16 Welker family (2 adults, 3 children) X X
17 Ross family (2 adults, 2 children) X X
18 Fredrick family (2 adults, 5 children) X X
19 McDonald family (2 adults, 2 children) X X
20 Hightower family (2 adults, 2 children) X X

44
Figure 12:
3 P’s in a Pod Participant Satisfaction Survey
Please take a few moments to answer the following questions. Your responses are completely
confidential and voluntary.
1. What is your overall rating of the 3 P’s in a Pod Program? Circle your response.
Excellent Good Fair Poor
Additional Comments?
____________________________________________________________________________________
2. What did you like best about the 3 P’s in a Pod Program?
____________________________________________________________________________________
3. What did you like least about the 3 P’s in a Pod Program?
____________________________________________________________________________________
4. What is your overall rating of the cooking demonstration sessions? Circle your response.
Excellent Good Fair Poor
Additional Comments?
____________________________________________________________________________________
5. What did you like best about the cooking demonstration sessions?
____________________________________________________________________________________
6. What did you like least about the cooking demonstration sessions?
____________________________________________________________________________________
7. What is your overall rating of the home visits? Circle your response.
Excellent Good Fair Poor
Additional Comments?
____________________________________________________________________________________

45
8. What did you like best about the home visits?
9. What did you like least about the home visits?
____________________________________________________________________________________
10. What is your overall rating of the presence of mobile food vendors after each cooking
demonstration? Circle your response.
Excellent Good Fair Poor
Additional Comments?
______________________________________________________________________________
11. What did you like best about the presence of mobile food vendors after each cooking
demonstration?
____________________________________________________________________________________
12. What did you like least about the presence of mobile food vendors after each cooking
demonstration?
____________________________________________________________________________________
13. Please give the cooking leaders an overall rating. Circle your response.
Excellent Good Fair Poor
Additional Comments?
____________________________________________________________________________________
14. Please give the nutritionist an overall rating. Circle your response.
Excellent Good Fair Poor
Additional Comments?
____________________________________________________________________________________
15. Please give the community health worker an overall rating. Circle your response.
Excellent Good Fair Poor
Additional Comments?
____________________________________________________________________________________

46
16. Please give the mobile food vendors an overall rating? Circle your response.
Excellent Good Fair Poor
Additional Comments?
____________________________________________________________________________________
17. Do you have any additional comments/suggestions/criticisms about the 3 P’s in a Pod
program?
____________________________________________________________________________________
____________________________________________________________________________________
____________________________________________________________________________________

47
Figure 13:
3 P’s in a Pod Partner Satisfaction Survey
Please take a few moments to answer the following questions. Your responses are completely
confidential and voluntary.
1. What is your role in the 3 P’s in a Pod Program? Circle your response.
Bell Tower Foods Vendor Mattapan Mobile Farm Stand Vendor Cooking Leader
2. What is your overall rating of the 3 P’s in a Pod Program? Circle your response.
Excellent Good Fair Poor
Additional Comments?
____________________________________________________________________________________
3. How would you rate your satisfaction with your contribution to the 3 P’s in a Pod Program?
Circle your response.
Excellent Good Fair Poor
Additional Comments?
____________________________________________________________________________________
4. What do you like best about your contribution to the 3 P’s in a Pod Program?
____________________________________________________________________________________
5. What do you like least about your contribution to the 3 P’s in a Pod Program?
6. Is there anything you would change about your contribution?
____________________________________________________________________________________
7. Do you have any additional comments/suggestions/criticisms about the 3 P’s in a Pod program
and/or your contribution?
____________________________________________________________________________________
____________________________________________________________________________________
____________________________________________________________________________________

48
Figure 14:
Organogram of Adoption/Implementation and Sustainability

49
Figure 15:
Map of Mattapan’s Retail Food Establishments

50
Figure 16:
3 P’s in a Pod Budget

51
Figure 17: Outcomes Evaluation Measures INTERMEDIATE OUTCOMES (Measure: Pre-Post Survey and Modified 3-month and 6-month Mark Survey)
Understanding nutrition facts o Knowledge
Is there an increase in the understanding of nutrition facts? Improved food planning behavior
o Knowledge Have participants demonstrated improved food planning behavior?
o Attitudes Have participants’ attitudes towards preparing healthy meals improved?
o Self-Efficacy Do participants feel competent in their ability to substitute unhealthy
ingredients with healthy ingredients in the meals they prepare for themselves? Their families?
Reduction in meal preparation time o Attitudes and Self-Efficacy
Do participants feel they have the appropriate knowledge needed to reduce meal preparation time?
o Knowledge and Outcome Expectations Have participants meal preparation time improved?
Modification of food purchasing behavior towards healthier foods o Knowledge
Can participants translate nutrition facts into practical food preparation behavior?
o Attitudes Increased belief that fruits and vegetables are affordable? Increased belief that healthy food options can be tasty?
o Self-efficacy Do participants feel confident in their ability to translate nutrition facts into
practical food preparation behavior? o Outcome Expectations
Is there a change in participants purchasing behavior? o Barriers
Do participants believe the mobile food vendors helped overcome barriers to purchasing fruits and vegetables?
Do participants believe the distribution of coupons for use at mobile food vendors helped overcome barriers to purchasing fruits and vegetables?
Do participants believe that using their SNAP benefits and other government assistance at mobile produce vendors helped overcome barriers to purchasing fruits and vegetables?
LONG-TERM OUTCOMES (Measure: Pre-Post Survey Questions)
Increase in fruit and vegetable consumption o Have participants increased their consumption of fruits and vegetables?
Increase in fruit and vegetable availability in Mattapan

52
o Do participants perceive the availability of fruits and vegetables has increased, as a result of the program?
HEALTH AND QUALITY OF LIFE (Measure: Pre-Post Survey Questions & Conclusions Based on Intermediate and Long-term Outcomes)
Reduce risk of obesity and diet-related illnesses o Based on measures from intermediate outcomes and long-term outcomes, have
participants reduced their risk of obesity? Diet-related illnesses?

53
Table 1: Performance Objectives & Determinants
Behavior: Low fruit and vegetable consumption among low-income families in Mattapan, MA.
Performance Objectives
Knowledge Attitudes Self-Efficacy Outcome Expectation Barriers
Individual level
Families will prepare healthier meals
Families will describe how to prepare foods in healthy ways
Express positive attitudes toward healthy meals
Confidence in the ability to prepare foods in a healthier way
Families will plan and prepare meals ahead of time to decrease time in the kitchen.
Families will know how to prepare quick and nutritious meals
Express positive attitudes towards cooking and eating meals at home
Families will have confidence to plan and prepare quick and nutritious meals at home
Families will expect that planning and preparing ahead will help with time constraints at home.
Families will purchase healthy food options
Know how to read nutritional labels and translate it practical food preparation behaviors
Believe that the fruits and veggies are affordable
Believe that healthy food options can be tasty.
Confidence to translate the knowledge gained (reading nutritional label) to actual food preparation behavior
Families will expect to be able to prepare healthier meals.
Families belief that if they overcome food access barriers, they will be more likely to purchase healthy food options
Environmental Level
Mobile produce vendors will provide low-cost produce.
Produce vendors will know when to be present at the site.
Produce vendors will express favorable attitude towards providing low-cost produce to Mattapan
Produce vendors expect that families will purchase produce from them.
Expect their presence will increase access
Produce vendors will provide access.

54
Table 2: Methods & Applications/Strategies of Determinants
Determinants Methods Applications/Strategies
Individual Attitudes:
Families will express positive attitudes toward healthy
meals
Families will express positive attitudes towards cooking
and eating meals at home.
Families will believe that the fruits and veggies are
affordable
Modeling
Education
Framing
Culture-specific cooking lessons
Teach nutritional value of their current traditional meals.
Teaching healthier alternatives or substituting ingredients. Modifying
preferred meals to healthier ingredients
Environmental Attitudes:
Produce vendors will express favorable attitude towards
providing low-cost produce to Mattapan
Education
Describing the need for increased availability of fruits and vegetables
to mobile produce vendors.
Individual Knowledge:
Families will describe how to prepare foods in healthy ways
Families will be able to articulate locations where they can
purchase inexpensive, healthy food options locally.
Families will be able to understand that meal preparation
doesn’t have to be time consuming - know quick and
nutritious meals.
Families will know how to read nutritional labels and
translate it practical food preparation behaviors
Education
Modeling
Providing knowledge of quick meals through cooking demonstrations
and lessons.
Provide recipe booklet with nutritional facts.
Food access map are posted around the community and given during
lessons.
Weekly circular of produce specials/sales.
CHW will provide tailored nutrition education during home visits.
Environmental Knowledge: ● Produce vendors will know when to be present at the
site
Technical
Assistance
Creating a schedule for when the produce vendors need to be present.
Reminders to produce vendors (emails, telephone calls)
Individual Self-Efficacy: ● Families will express confidence in the ability to
prepare foods in a healthier way
● Families will believe that they have the ability to
overcome barriers to accessing low-cost, healthy
foods.
● Families will express confidence in translating the
knowledge gained (reading nutritional label) to actual
food preparation behavior
Modeling
Education
Motivational
interviewing
Cooking demonstrations
Recipe booklet with nutritional facts.
Motivational interviewing.

55
Individual Outcome Expectation: ● Families will expect to be able to prepare healthier
meals.
● Families will expect that planning and preparing ahead
will help with time constraints at home.
Education
Framing
Provide immediate low-cost access to ingredients and food options
discussed in cooking sessions via mobile vendors.
Cooking demonstrations
Home visits - motivational interviews
Environmental Outcome Expectations:
● Produce vendors expect that families will purchase
produce from them.
● Produce vendors will expect their presence will
increase availability
Technical
Assistance
Creating a schedule for when the produce vendors need to be present.
Reminders to produce vendors (emails, telephone calls)
Individual Barriers: ● Families believe that if they can overcome food access
barriers, they will be more likely to purchase healthier
food options.
Providing
access
Reinforcement
of availability
Providing coupons at every demonstration.
Ability to purchase with SNAP and other food assistance program
benefits.
Environmental Barriers: ● Produce vendors will provide low-cost produce.
Providing
access
Food truck will be present after cooking demonstration so families can
purchase produce introduced in the demonstration.

56
Table 3: Adoption, Implementation, & Sustainability Matrix
Performance Objectives Knowledge Skills & Self-Efficacy Outcome Expectations Attitudes
ADOPTION
PO 1: Mattapan CHC will evaluate the need for a program in Mattapan
Summarize needs
Prioritize needs
MCHC finds need in
Mattapan
PO 2: Mattapan CHC will find and adopt program that meets the needs of Mattapan
Mattapan CHC will
describe how this
program compares to
other available
programs
Mattapan CHC will
describe how it meets
the needs of the
dominant demographic
groups of Mattapan
Mattapan CHC expects
that the program will
meet the needs of
Mattapan community
and improve health
outcomes of Mattapan
residents
Mattapan CHC will
express favorably
towards the value and
importance of the
program.
PO 3: Mattapan CHC will identify research team.
Mattapan CHC will list
characteristics of a
good research team.
PO 4: Mattapan CHC will partner with Mattahunt CC as the cooking venue.
Mattapan CHC will
explain the importance
of cooking
demonstration to
Mattahunt CC.
Mattapan CHC expects
participation from the
community in the
program.
PO 5: Mobile produce vendors will partner with Mattapan CHC to increase availability.
Mobile produce
vendors will
understand the
Mobile produce
vendors expect
increased availability to
Mobile produce
vendors express
favorably towards

57
importance of food
availability in low-SES
neighborhoods.
affordable produce in
the low-income
community of
Mattapan.
objectives of the
program.
PO 6: Volunteer local chefs are identified by Mattapan CHC to conduct cooking demonstrations.
Volunteer chefs will
understand the
importance of cooking
demonstrations to the
community.
Volunteer chefs will
express confidence in
conducting cooking
classes to a large
group of people.
Volunteer chefs will
react favorably towards
the importance of the
cooking
demonstrations
Performance Objectives Knowledge Skills & self-efficacy Outcome expectation Attitudes
IMPLEMENTATAION
PO 1: Principal Investigator and Study Coordinator at MCHC will create implementation plan
PI and SC will describe
the components of the
implementation plan.
PI and SC express
confidence in being
able to organize and
develop a plan with
research team.
PO 2: The research team and volunteer chefs will be oriented in the implementation plan by the PI and SC.
The research team and
volunteer chefs will
describe the
implementation plan
and its objectives.
The research team and
volunteer chefs will
have the confidence to
implement the program
successfully.
The research team and
volunteer chefs will
react favorably towards
the program and its
outcome.
PO 3: SC will provide guidelines of pertinent nutrition knowledge that the nutritionist needs to pass on to the chef and CHWs.
PI/SC will provide
demographic
information about
target population to
nutritionist.
PI/SC describe the
barriers specific to
Mattapan in terms of

58
their nutrition needs.
PO 4: Volunteer chefs, community health workers, and research team will be oriented in nutrition education from the nutritionist.
Volunteer chefs,
community health
workers and research
team will know the
components of a
healthy diet.
They will understand
nutrition facts regarding
recipes that will be
provided.
Volunteer chefs,
community health
workers and research
team will have the
skills needed to
educate participants
and convey the
message in layman
term.
Volunteer chefs,
community health
workers and research
team will express
enthusiasm to learn
from the nutritionist.
PO 5: Volunteer chefs will teach the cooking classes.
Volunteer chefs will
understand the
parameters of
Mattapan community
(financial constraints,
demographics, food
preference,
availability, etc)
Volunteer chefs will
have the skills need to
cook the recipe.
Volunteer chefs will
express confidence in
their ability to develop
easy, low cost, tasty,
healthy recipes that will
be appropriate for the
Mattapan community
PO 6: Mobile Vendors will provide produce at cooking demonstrations.
Mobile vendors will
expect participation
from the community.
Mobile vendors will react favorably towards the importance of access in healthy eating.
PO 7: CHW will conduct home visits.
CHW will describe how
to conduct motivational
interviewing with
participants.
CHW will express confidence in being able to execute motivational coaching.

59
PO 8: Research Team will make sure each component of the intervention is completed properly and as intended.
Research team has
confidence to be able
to carry out
implementation plan.
Research team expects
program to run
smoothly according to
plan.
Performance Objectives Knowledge Skills & self-efficacy Outcome expectation Attitudes
SUSTAINABILITY
PO 1: Mattapan CHC will draft the proposal for Robert Woods Johnson Foundation (RWJF) grant.
Mattapan CHC will
describe objectives of
the program and how
they align with the
objectives of RWJF.
Mattapan CHC will
describe the
importance of the
program and need for
Mattapan residents.
Mattapan CHC will
expect that the RWJF
will support by funding
the program
PO 2: Mattapan CHC will implement the “3 P’s in a Pod” program as part of the community’s events.
CHC coordinator will
recognize the
importance of
integrating the
curriculum into center
events/projects.
CHC coordinator will
describe how to
integrate curriculum
into training - which will
contribute to its
continued use.
CHC coordinator will
feel confident in being
able to execute the
curriculum without the
research team.
CHC coordinator
expects positive
curriculum outcome.
CHC coordinator will
react favorably towards
the results of the
curriculum.
PO 3: Mattapan CHC will adopt curriculum as part of program
Mattapan CHC will
outline basic
Mattapan CHC expects
that the program

60
associate’s job description.
knowledge and skills
needed of the program
associate.
associate is qualified
and will lead the
curriculum
successfully.
PO 4: CHW will train the lay workers to conduct effective home visits.
CHW will describe
skills and techniques
necessary to conduct
motivational
interviewing to the lay
workers
CHW will express
confidence in their
ability to train the lay
workers effectively.

61
Table 4:
Logic Model of Intervention

62
References
Anderson, M. (2007). Making healthy food more accessible for low-income people. Farm
and Food Policy Project.
Bandura, A. (1977). Self-efficacy: Toward a unifying theory of behavioral change.
Psychological Review, 84(2), 191-215.
Bandura, A. (2004). Health promotion by social cognitive means. Health Education &
Behavior, 31(2), 143-164.
Beto, J.A., Sheth, G., & Rewers, P. (1997) Assessing food purchase behavior among
low-income Black and Hispanic clients using a self-reported shelf inventory. Journal of
American Dietetic Association, 97(1), 69-70.
Beydoun, M.A., Powell, L.M., & Wang Y. (2009). Reduced away-from-home food expenditure
and better nutrition knowledge and belief can improve quality of dietary intake among US
adults, Public Health Nutrition, 12(3), 369-81.
Biro, F.M., & Wien M. (2010). Childhood obesity and adult morbidities. American Journal of
Clinical Nutrition, 91(5), 1499S-1505S.
Blake, C., Wethington, E., Farrell, T., Bisogni,C., & Devine,C. (2011). Behavioral contexts,
food-choice coping strategies, and dietary quality of a multiethnic sample of employed
parents. Journal of American Dietetic Association, 222,401-407.
Bradbard, S., Michaels, E., Flemings, K., Campbell, M. (1997). Understanding the food
choices of low income families: Summary of findings. US Department of Agriculture
Food and Consumer Service Office. Retrieved September 15, 2012 from
www.fns.usda.gov/Ora/menu/Published/.../Files/NUTRI.PDF.
Caspi, C. E., Kawachi, I., Subramanian, S. V., Adamkiewicz, G., & Sorensen, G. (2012). The
relationship between diet and perceived and objective access to supermarkets among
low-income housing residents. Social Science & Medicine, 75(7), 1254–1262.
Center for Disease Control and Prevention (2012). Defining overweight and obesity. National
Center for Chronic Disease Prevention and Health Promotion. Retrieved October 5
from http://www.cdc.gov/obesity/adult/defining.html.
Chong, D. & Druckman, J.N. (2007). Framing Theory. Annual Review of Political Science, 10,
103-126. doi:10.11146/annurev.polisci.10.072805.103054.
Community Food Service Coalition. (2009). Growing Food Security in Mattapan. Retrieved from
http://www.slideshare.net/cfsc/growing-food-security-in-mattapan#btnNext.

63
Cooking Matters 2011 Annual Review (2011). Retrieved from
http://cookingmatters.org/Cooking%20Matters%202011%20Annual%20Review.pdf.
Cooking Matters 2011 Cooking Demo Tool Kit (2011). Retrieved from
http://nokidhungry2.org/files/cooking-demo-toolkit.pdf.
Devine, C.M., Sobal, J., Bisogni, C.A., Connors, M. (1999). Food choices in three ethnic
groups: Interactions of ideals, identities, and roles. Journal of Nutrition Education,
31(2),86–93.
Devine, C.M., Farrell, T., Blake, C.E., Jastran, M., Wethington, E., Bisogni, C.A. (2009). Work
Conditions and the Food Choice Coping Strategies of Employed Parents. Journal of
Nutrition Education and Behavior, 41(5), 365–370.
Drayton-Brooks, S., & White N. (2004). Health promoting behaviors among African American
women with faith-based support. Journal of Association of Black Nursing Faculty,
15(5):84-90.
Drewnowski, A., & Darmon, N. (2005). The economics of obesity: dietary energy density and
energy cost. The American Journal of Clinical Nutrition, 82(1), 265S–273S.
Drewnowski, A., & Specter, S.E. (2004). Poverty and obesity: the role of energy density and
energy costs. American Journal of Clinical Nutrition, 79: 6–16.
Duffey, K.J. &. Popkin, B.M. (2011). Energy density, portion Size, and eating occasions:
Contributions to increased energy intake in the United States, 1977–2006. PLoS
Medicine, 8(6): 1-7.
Falk, L.W., Bisogni, C.A., Sobal, J. (1996). Food choice processes of older adults. Journal of
Nutrition Education. 28: 257–265.
Figueroa, L.R., Davis, B., Baker, S., & Bunch, J.B. (2006). The influence of spirituality on health
care-seeking behaviors among African Americans. Journal of African Black Nursing
Faculty, 17(2):82-8.
Finkelstein, E.A., Trogdon, J.G., Cohen, J.W. & Dietz, W. (2009) Annual Medical Spending
Attributable To Obesity: Payer-And Service-Specific Estimates. Health Affairs, 28
(5),w822-w831.
Fisher, A. (1999). Hot Peppers and Parking Lot Peaches: Evaluating Farmers’ Markets in
Low Income Communities. Community Food Security Coalition. Retrieved from
http://www.foodsecurity.org/HotPeppersPeaches.pdf.

64
Flegal, K.M., Graubard, B.I., Williamson D.F., Gail, M.H. (2007). Cause-Specific Excess
Deaths Associated With Underweight, Overweight, and Obesity. Journal of the
American Medical Association, 298(17), 2028–2037.
French, S., Wall, M., Mitchell, N.R. (2010). Household income differences in food sources and
food items purchased. International Journal of Behavioral Nutrition & Physical
Sciences, 7, 77-85.
Furst, T., Connors, M., Bisogni, C.A., Sobal, J., Falk, L. (1996). Food choice: A conceptual
model of the process. Appetite, 26(3), 247–65.
Giskes, K., Van Lenthe, F. J., Brug, J., Mackenbach, J. P., & Turrell, G. (2007).
Socioeconomic inequalities in food purchasing: The contribution of respondent-
perceived and actual (objectively measured) price and availability of foods. Preventive
Medicine, 45(1), 41–48.
Glanz, K., Rimer, B.K., & Lewis, F.M. (Eds.) (2008). Health Behavior and Health Education
(4th ed.). San Francisco: Jossey-Bass. Retrieved from
http://www.sanjeshp.ir/phd_91/Pages/Refrences/health%20education%20and%20promo
tion/[Karen_Glanz,_Barbara_K._Rimer,_K._Viswanath]_Heal(BookFi.or.pdf.
Gradziel, P., Matthews, J.R., Punia, M. (2003). Low-income California food-shopping habits: A
study based on Hispanic WIC Preventative Surveys. Journal of Food Distribution
Research, 34(1), 17-23.
Gross, R.S., Mendelsohn, A.L., Fierman, A.H., Racine, A.D., & Messito, M.J (2012).
Food insecurity and obesogenic maternal infant feeding styles and practices in low-
income families. Journal of the American Academy of Pediatrics, 130(2), 254-261.
Guthrie J.F., Lin B.H., & Frazao, E. (2002). Role of food prepared away from home in
the American diet, 1977-78 versus 1994-96: changes and consequences. Journal of
Nutrition Education Behavior, 34(3), 140-50. Retrieved from
Hassink. S.G. (2007). A clinical guide to pediatric weight management and obesity. New
York: Lippincott Williams & Wilkins.
Hayden, J.A. (2009). Introduction to Health Behavior Theory. Sudbury, MA: Jones and
Bartlett Publishers.
Health of Boston (2011). Health of Boston 2011. Boston Public Health Commission Research
and Evaluation Office, Boston, Massachusetts. Retrieved from September 20,2012,
from
http://www.bphc.org/about/research/hob2010/Forms%20%20Documents/Health%20of
%20Boston%202011_Final_Print_Revised_30Nov11.pdf.

65
Hochbaum, G.M. (1958). Public Participation in Medical Screen Programs: A
Socio-psychological Study (Public Health Service Publication No. 572). Washington,
DC: Government Printing Office. Retrieved September 20, 2012 from
http://128.121.13.244:8080/awweb/main.jsp?flag=browse&smd=1&awdid=1.
Horowitz, C.R.C. (2004). Barriers to Buying Healthy Foods for People With Diabetes:
Evidence of Environmental Disparities. American Journal of Public Health, 94(9),
1549–1554.
Hubert, H. B. (1986). The importance of obesity in the development of coronary risk factors
and disease: the epidemiological evidence. Annual Review of Public Health, 7,
493–502.
Israel, B.A., Schulz, A.J., Parker, E.A., & Becker, A.B. (1998). Review of
Community-Based Research: Assessing Partnership Approaches to Improve Public
Health. Annual Review of Public Health, 19:173-202
Jastran, M., Bisogni, C.A., Sobal, J., Blake, C., Devine, C.M. (2009). Eating routines:
Embedded, value based, modifiable, and reflective. Appetite, 52(1), 127–136.
Kelley, J. (2010). Mattapan Community Health Center. Retrieved November 2, 2012 from
http://www.mattapanchc.org/index.html.
Krebs-Smith,S.M., Guenther,P.M., Subar,A.F., Kirkpatrick,S.I., & Dodd, K.W. (2010).
Americans do not meet federal dietary recommendations. American Society for
Nutrition,140,1832–1838,
Larson, N., Story, M., Eisenber, M., & Neumakr-Sztainer, D. (2006). Food preparation and
purchasing roles among adolescents: Association with sociodemographic
characteristics and diet quality. Journal of the American Dietetic Association, 106,
2011-218.
Leibtag, E.S. & Kaufman, P.R. (2003) Exploring food purchase behavior of low-income
households How do they economize? Economic Research Services. USDA. Agriculture
Information Bulletin No. 747-07. Retrieved from
http://www.ers.usda.gov/media/306711/aib74707_1_.pdf
Levi, J., Segal, L., Laurent, R., & Kohn, D. (2011). F as in fat: How obesity threatens
America’s future. Issue report from the Trust for America’s Health (TFAH) and
the Robert Wood Johnson Foundation (RWJF). Retrieved September 30, 2012,
from http://healthyamericans.org/assets/files/TFAH2011FasInFat10.pdf.
Lightner, R. (2011). Healthy Food Accessibility in Underserved Boston Neighborhoods: The
Affordability and Viability of Farmers’ Markets. The Food Project/Amherst College.

66
Retrieved September 20, 2012 from
http://thefoodproject.org/sites/default/files/healthy_foodaccess_boston.pdf
Lucan, S.C., Barg, F.K., Karasz,A., Palmer, C.S., & Long, J.A. (2012). Concepts of healthy
diet among urban, low-income, African Americans. Journal of Community Health,
37,754-762.
McClelland, J.W., Demark-Wahnefried, W., Mustian, R.D., Cowan, A.T., & Campbell, M.K.
(1998). Fruit and vegetable consumption of rural African Americans: baseline survey
results of the Black Churches United for Better Health 5 A Day Project. Nutrition Cancer,
30(2), 148-157.
Molarius, A., Seidell, J. C., Sans, S., Tuomilehto, J., & Kuulasmaa, K. (2000). Educational
level, relative body weight, and changes in their association over 10 years: an
international perspective from the WHO MONICA Project. American Journal of Public
Health, 90(8), 1260–1268.
Morland K., Roux, D. A. V., & Wing, S. (2006). Supermarkets, Other Food Stores,
and Obesity: The Atherosclerosis Risk in Communities Study. American Journal of
Preventive Medicine, 30(4), 333–339.
National Cancer Institute (2004). Body & Soul: A Celebration of Healthy
Eating & Living, A Guide for Running the Program in Your Church. (NIH Publication
No.). Bethesda, MD. Retrieved from
http://www.cancer.org/acs/groups/content/@greatlakes/documents/webcontent/acspc-
030808.pdf
National Cancer Institute. (2005) Theory at a glance: A guide for health promotion practice.
Part 2. Retrieved October 5, 2012 from
www.cancer.gov/pdf/481f5d53-63df-41bc-bfaf.../taag3.pdf.
Newby, P.K. (2010). Boston Collaborative for Food & Fitness Community Assessment -
Compiled Data, Final Report. Boston Collaborative for Food & Fitness. Retrieved
September 15, 2012 from http://www.bcff-online.org/Learn/Pages/default.aspx.
Ogden, C. & Carroll, M. (2010) “Prevalence of Obesity Among Children and Adolescents:
United States, Trends 1963-1965 Through 2007-2008.” National Center for Health
Statistics.
Peeter, A. et al. (2003). Obesity in Adulthood and its consequences for life expectancy: A life-
table analysis. Annals of Internal Medicine, 138 (1), 24-33
PrimeCare of Novi, LLP (2012). Nutrition and eating habit questionnaire. Retrieved from
http://www.primecareofmi.com/documents/eatinghabits.pdf on November 2012.

67
Reedy, J., & Krebs-Smith, S. M. (2010). Dietary sources of energy, solid fats, and added
sugars among children and adolescents in the United States. Journal of the American
Dietetics Association, 110(10), 1477–1484.
Resnicow, K., Wallace, D.C., Jackson, A., Digirolamo, A., Odom, E., Wang, T., Dudley, W.N.,
Davis, M., Mitchell, D., & Baranowski, T. (2000). Dietary change through African
American churches: baseline results and program description of the eat for life trial.
Journal of Cancer Education, 15(3), 156-63.
Ricciuto, L., Tarasuk, V., Yatchew, A. (2006). Socio-demographic influences on food
purchasing among Canadian households. European Journal Clinical Nutrition, 60(6),
778-790.
Rothman, A.J., Bartels, R.D., Wlaschin, J., & Salovey, P. (2006). The Strategic Use of Gain-
and Loss-Framed Messages to Promote Healthy Behavior: How Theory Can Inform
Practice. Journal of Communication, 56, S202-S220.
Sanjur, D. (1982). Ethnicity and food habits. In D. Sanjur (Ed.), Social and Cultural
Perspectives in Nutrition (pp.233-285). Englewood Cliffs, NJ: Prentice-Hall.
Smolin, L.A., & Grosvenor, M.B. (2010). Nutrition: Science & Applications. New York: John
Wiley & Sons.
Sobal J., Bisogni C.A., Devine CM., & Jastran, M. (2006). A conceptual model of the food
choice process over the life course. In: R. Shepherd & M. Raats (Eds.), The Psychology
of Food Choice (pp.1-18). Cambridge: CABI Publishing.
Sobal, J., & Nelson, M.K. (2003). Commensal eating patterns: A community study. Appetite,
41, 181–190.
Suutair, Amanda (2006). The people’s grocery: Bringing healthy foods to low-income
neighborhood. Retrieved from http://www.ecotippingpoints.org/our-stories/indepth/usa-
california-oakland-people-grocery-healthy-food.html on November 2012.
Taveras, E.M., et al. (2012). Healthy Habits, Happy Homes: Methods and baseline data of a
randomized controlled trial to improve household routines for obesity prevention.
Preventive Medicine, 55 (5), 418-426.
Tester, J., Yen, I., & Laraia, B. (2012). Using Mobile Fruit Vendors to Increase Access to Fresh
Fruit and Vegetables for Schoolchildren. Preventing Chronic Disease, 9:110222.
Treuhaft, S. & Karpyn, A. (2010). The grocery gap: Who has access to healthy food
and why it matters. PolicyLink. Retrieved September 25, 2012 from

68
www.policylink.org/atf/cf/%7B97C6D565-BB43-406D-A6D5-ECA3BBF35AF0%7D/FIN
ALGroceryGap.pdf.
Wen. L.M., Baur, L.A., Risell, C., Wardle, K., Alperstein, G., Simpson, J.M. (2007).Early
intervention of multiple home visits to prevent childhood obesity in a disadvantaged
population: a home-based randomised controlled trial (Healthy Beginnings Trial). BMC
Public Health, 7(76), 1-8.
Wen. L.M., Baur, L.A., Simpson, J.M., Risell, C., Wardle, K., Flood, V.M. (2012). Effectiveness
of home based early intervention on children’s BMI at age 2: randomised controlled
trial. BMJ, 344 (3732), 1-11.
Wen, L.M., Domenico, M., Eliott, D. Bindon, J., & Rissel, C. (2009). Evaluation of a feasibility
study addressing risk factors for childhood obesity through home visits. Journal of
Paediatrics and Child Health, 45, 577–581
Winch, R.(2008). Nutrition Incentives at Farmers’ Markets: Bringing Fresh, Healthy, Local
Foods Within Reach. Farmland Information Center. Retrieved October 1, 2012 from
http://www.farmlandinfo.org/documents/37781/ebt_matching_programs_rachel_winch.
pdf.
Winne, M. (2008). Closing the Food Gap: Resetting the Table in the Land of Plenty. Boston:
Beacon Press.
WHO/ FAO (2003). Diet, nutrition, and prevention of chronic diseases: report of a joint
WHO/FAO expert consultation. Retrieved October 5, 2012 from
http://www.who.int/dietphysicalactivity/publications/trs916/kit/en/index.html.