increasing inductor lifetime by predicting coil copper temperatures presentation
TRANSCRIPT
Increasing Inductor Lifetime by
Predicting Coil Copper
Temperatures
Robert Goldstein
www.fluxtrol.com
September 2007, Detroit

Overview
• Demand for Improved Inductor Life
• Failure Modes of Induction Coils
• Extending Inductor Lifetime
• Method for Optimal Inductor Design including Copper Temperature Prediction
• Case Story – Seam Annealing of Large Diameter Pipe
• Conclusions

Demand for Improved Inductor Life
• Increased competition has led to
increased pressure to maximize
manufacturing efficiency and equipment
utilization
• Machine downtime is extremely costly,
especially if it is unplanned
• Inductor failure is one of the leading
causes of machine downtime

Common Failure Modes of
Induction Coils
• Mechanical Damage
• Electrical Break
• Thermal Degradation
Mechanical Damage
• Coil to part impact
– Inaccurate coil set-up
– Improper part installation
– Incoming part defect
• Electrodynamic forces
– Distortion of winding shape
– Elongation of winding (copper creep)
Electrical Break
• Insufficient insulation between turns
– Poor design
– Insulation displaced during shipping/installation
– Wearing of insulation over time
• Process Debris
– Scale from the part
– Magnetic chips from prior machining
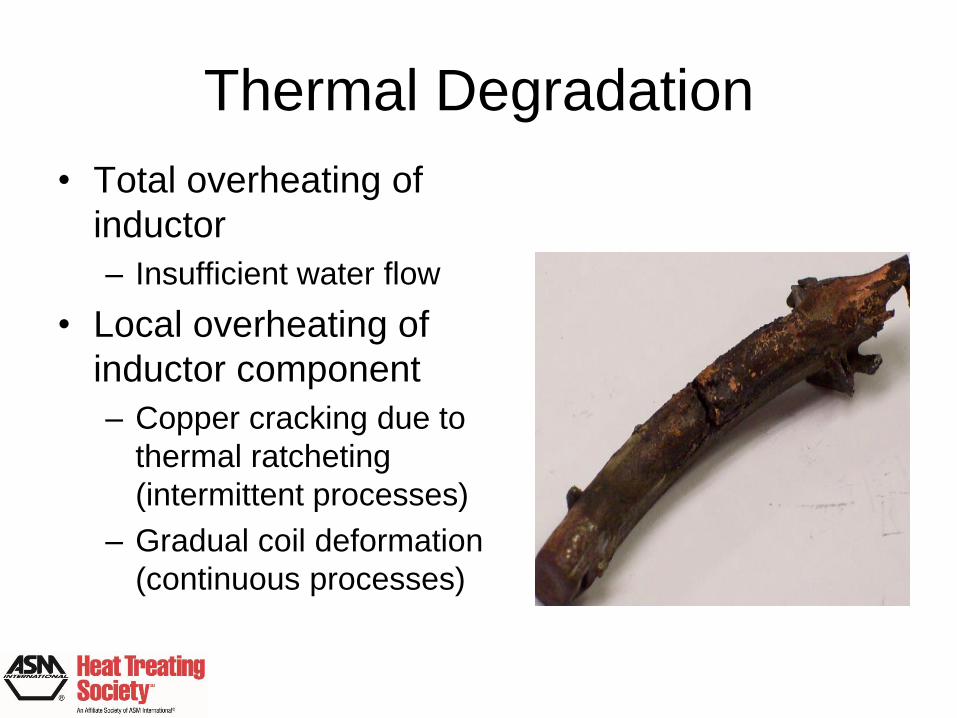
Thermal Degradation
• Total overheating of
inductor
– Insufficient water flow
• Local overheating of
inductor component
– Copper cracking due to
thermal ratcheting
(intermittent processes)
– Gradual coil deformation
(continuous processes)
Extending Inductor Lifetime
• Failures due to mechanical damage and
electrical break can be prevented
– Good machine design
– Proper coil manufacturing procedures
– Proper maintenance
• Failures due to thermal degradation more
complicated
Thermal Degradation Prevention
Methods
• Primarily done in response to failures based upon experience
– Increase water flow
– Add booster pumps
– Change water pockets in windings
– Split concentrator into multiple sections
– Change winding design
• Changes made on trial and error basis, no scientific method

Optimal Design Method 1. CS to optimize coil based upon part heating
2. Coil engineering using CAD
3. Hydraulic calculations for cooling circuit
4. Calculation of heat transfer coefficients
5. CS of coil component heating
6. If elevated T exist, return to step 2 to improve cooling circuit
7. If elevated T exists, return to step 1 and change coil design to find compromise between part heating and inductor T
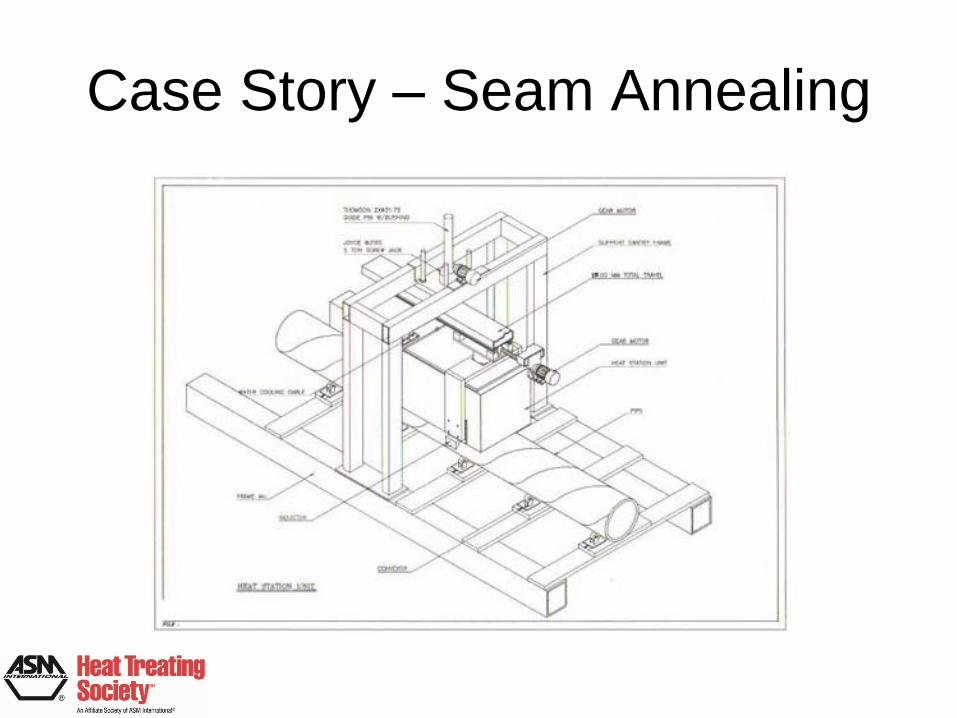
Case Story – Seam Annealing
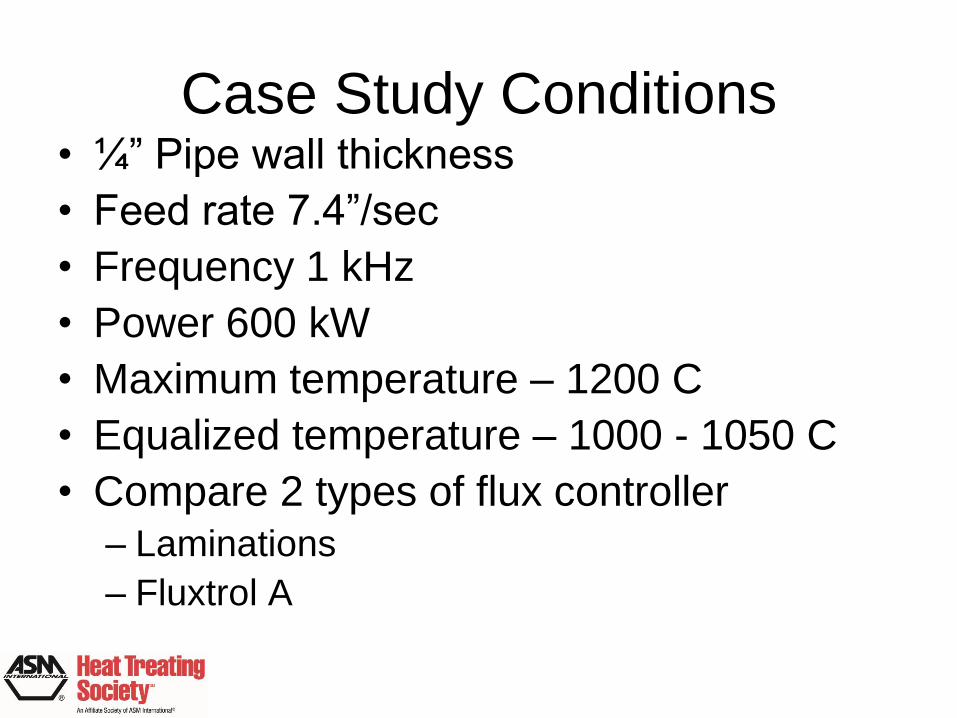
Case Study Conditions • ¼” Pipe wall thickness
• Feed rate 7.4”/sec
• Frequency 1 kHz
• Power 600 kW
• Maximum temperature – 1200 C
• Equalized temperature – 1000 - 1050 C
• Compare 2 types of flux controller
– Laminations
– Fluxtrol A
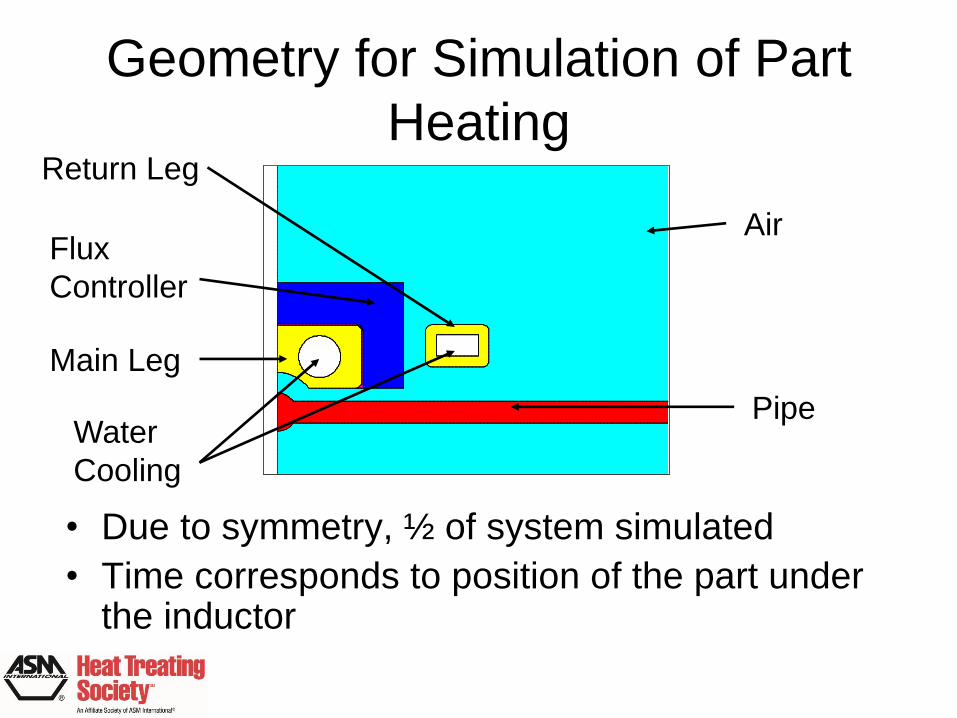
Geometry for Simulation of Part
Heating
• Due to symmetry, ½ of system simulated
• Time corresponds to position of the part under the inductor
Pipe
Air
Return Leg
Main Leg
Flux
Controller
Water
Cooling

Part Heating, Laminations Color Shade Results
Quantity : Temperature Deg. Celsius Time (s.) : 4.4 Phase (Deg): 0Scale / Color42.3855 / 115.03716115.03716 / 187.6888187.6888 / 260.34045260.34045 / 332.99213332.99213 / 405.6438405.6438 / 478.29541478.29541 / 550.94708550.94708 / 623.59875623.59875 / 696.25043696.25043 / 768.90204768.90204 / 841.55371841.55371 / 914.20538914.20538 / 986.85699986.85699 / 1.05951E31.05951E3 / 1.13216E31.13216E3 / 1.20481E3
Color Shade ResultsQuantity : Temperature Deg. Celsius Time (s.) : 7.599999 Phase (Deg): 0Scale / Color45.1254 / 108.46457108.46457 / 171.80374171.80374 / 235.14291235.14291 / 298.48209298.48209 / 361.82126361.82126 / 425.16043425.16043 / 488.49957488.49957 / 551.83881551.83881 / 615.17792615.17792 / 678.51715678.51715 / 741.85626741.85626 / 805.1955805.1955 / 868.53461868.53461 / 931.87384931.87384 / 995.21295995.21295 / 1.05855E3
Temperature Exiting Coil Equalized Temperature
Total Coil Current 18,800 A, Total Power 600 KW

Part Heating, Fluxtrol A
Color Shade ResultsQuantity : Temperature Deg. Celsius Time (s.) : 4.4 Phase (Deg): 0Scale / Color41.60269 / 113.62705113.62705 / 185.65143185.65143 / 257.67578257.67578 / 329.70013329.70013 / 401.72449401.72449 / 473.74884473.74884 / 545.77325545.77325 / 617.79761617.79761 / 689.82196689.82196 / 761.84631761.84631 / 833.87067833.87067 / 905.89502905.89502 / 977.91937977.91937 / 1.04994E31.04994E3 / 1.12197E31.12197E3 / 1.19399E3
Color Shade ResultsQuantity : Temperature Deg. Celsius Time (s.) : 7.599999 Phase (Deg): 0Scale / Color44.25912 / 106.98604106.98604 / 169.71295169.71295 / 232.43987232.43987 / 295.16675295.16675 / 357.89368357.89368 / 420.62061420.62061 / 483.34753483.34753 / 546.0744546.0744 / 608.80133608.80133 / 671.52826671.52826 / 734.25513734.25513 / 796.98206796.98206 / 859.70898859.70898 / 922.43591922.43591 / 985.16284985.16284 / 1.04789E3
Temperature Exiting Coil Equalized Temperature
Total Coil Current 20,000 A, Total Power 600 kW
Summary of Heating Simulation
• Temperature distributions produced with Laminations and Fluxtrol A nearly identical
• Power required for both coils the same – 600 kW
• Coil current used in simulation higher for Fluxtrol A than Laminations (20 and 18.8 kA)
– Does not take into account copper keepers and unusable sections near crossovers

Inductor Drawing
Hydraulic Calculations
• Coil has 4 separate water circuits, all identical
• Make calculations for flow rate based upon ΔP from the cooling pump
– Hoses
– Tubing
– Directional/Diameter Changes
• Calculate local water velocities in different sections of the inductor
Heat Transfer Coefficients
• Input losses in different sections of the
water circuit to update water T in different
zones
• Calculate Reynolds and Prandtl numbers
• Calculate Nusselt numbers
• Calculate heat transfer coefficients

Coil Temperature Calculations
• Recalculate currents from heating simulation
to take into account copper keepers and
distance from end loops – 19.9 kA for
laminations, 20.1 kA for Fluxtrol A
• Input losses in concentrator based upon flux
densities in EM simulation
• Install heat transfer coefficients – 14,000 W/m2K main leg, 22,500 W/m2K return leg

Steady State Temperature in Coil
with Laminations Color Shade Results
Quantity : Temperature Deg. Celsius Time (s.) : 0.002E6 Phase (Deg): 0Scale / Color20 / 34.37534.375 / 48.7548.75 / 63.12563.125 / 77.577.5 / 91.87591.875 / 106.25106.25 / 120.625120.625 / 135135 / 149.375149.375 / 163.75163.75 / 178.125178.125 / 192.5192.5 / 206.875206.875 / 221.25221.25 / 235.625235.625 / 250
Temperature scale 20 – 250 C

Steady State Temperature in Coil
with Fluxtrol A
Temperature scale 20 – 250 C
Color Shade ResultsQuantity : Temperature Deg. Celsius Time (s.) : 0.002E6 Phase (Deg): 0Scale / Color20 / 34.37534.375 / 48.7548.75 / 63.12563.125 / 77.577.5 / 91.87591.875 / 106.25106.25 / 120.625120.625 / 135135 / 149.375149.375 / 163.75163.75 / 178.125178.125 / 192.5192.5 / 206.875206.875 / 221.25221.25 / 235.625235.625 / 250

Evaluation of Temperatures • Temperatures in inductor with laminations
higher than those on the inductor with Fluxtrol A
• Maximum temperature in both cases in the corner of the copper
• In general, temperatures are all in the safe level and inductor should have good lifetime
• For the sake of study, we’ll increase power 50% for both laminations and Fluxtrol A to see higher temperature dynamics

Steady State Temperature in Coil
with Laminations (50% higher P)
Temperature scale 20 – 250 C
Color Shade ResultsQuantity : Temperature Deg. Celsius Time (s.) : 0.002E6 Phase (Deg): 0Scale / Color20 / 34.37534.375 / 48.7548.75 / 63.12563.125 / 77.577.5 / 91.87591.875 / 106.25106.25 / 120.625120.625 / 135135 / 149.375149.375 / 163.75163.75 / 178.125178.125 / 192.5192.5 / 206.875206.875 / 221.25221.25 / 235.625235.625 / 250

Steady State Temperature in Coil
with Fluxtrol A (50% higher P)
Temperature scale 20 – 250 C
Color Shade ResultsQuantity : Temperature Deg. Celsius Time (s.) : 0.002E6 Phase (Deg): 0Scale / Color20 / 34.37534.375 / 48.7548.75 / 63.12563.125 / 77.577.5 / 91.87591.875 / 106.25106.25 / 120.625120.625 / 135135 / 149.375149.375 / 163.75163.75 / 178.125178.125 / 192.5192.5 / 206.875206.875 / 221.25221.25 / 235.625235.625 / 250
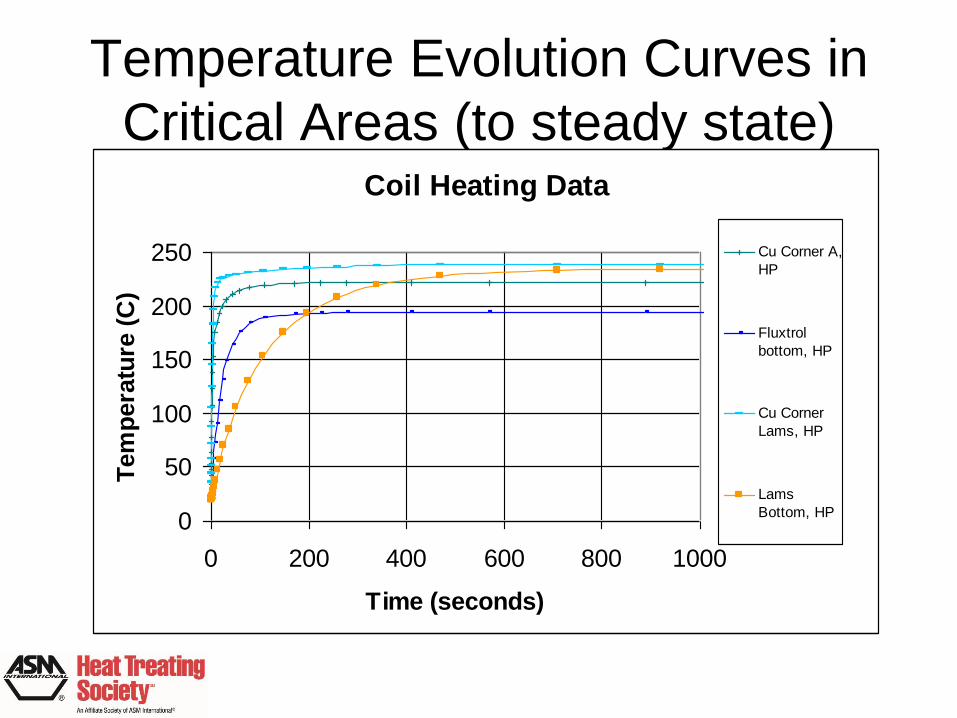
Temperature Evolution Curves in
Critical Areas (to steady state) Coil Heating Data
0
50
100
150
200
250
0 200 400 600 800 1000
Time (seconds)
Tem
pera
ture
(C
)
Cu Corner A,
HP
Fluxtrol
bottom, HP
Cu Corner
Lams, HP
Lams
Bottom, HP
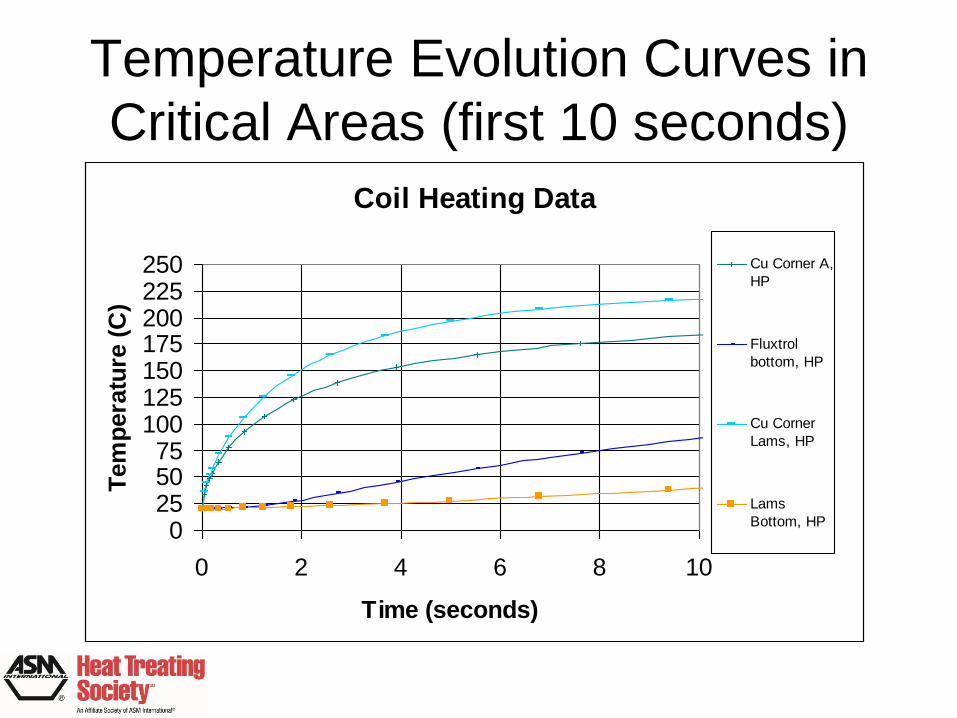
Temperature Evolution Curves in
Critical Areas (first 10 seconds)
Coil Heating Data
0255075
100125150175200225250
0 2 4 6 8 10
Time (seconds)
Tem
pera
ture
(C
)
Cu Corner A,
HP
Fluxtrol
bottom, HP
Cu Corner
Lams, HP
Lams
Bottom, HP
Evaluation of Temperatures
• Temperatures in coil copper are higher with laminations than with Fluxtrol A
• Overall temperature of laminations significantly higher than for Fluxtrol A
• For laminations, maximum in temperature occurs both in the corner of the copper and the edge of the laminations
• In general, temperatures are no longer in the safe level, especially in the laminations
• From the snapshot of the first 10 seconds, it is clear that the heat in the Fluxtrol A is mainly due to conduction from the hot corner of the copper
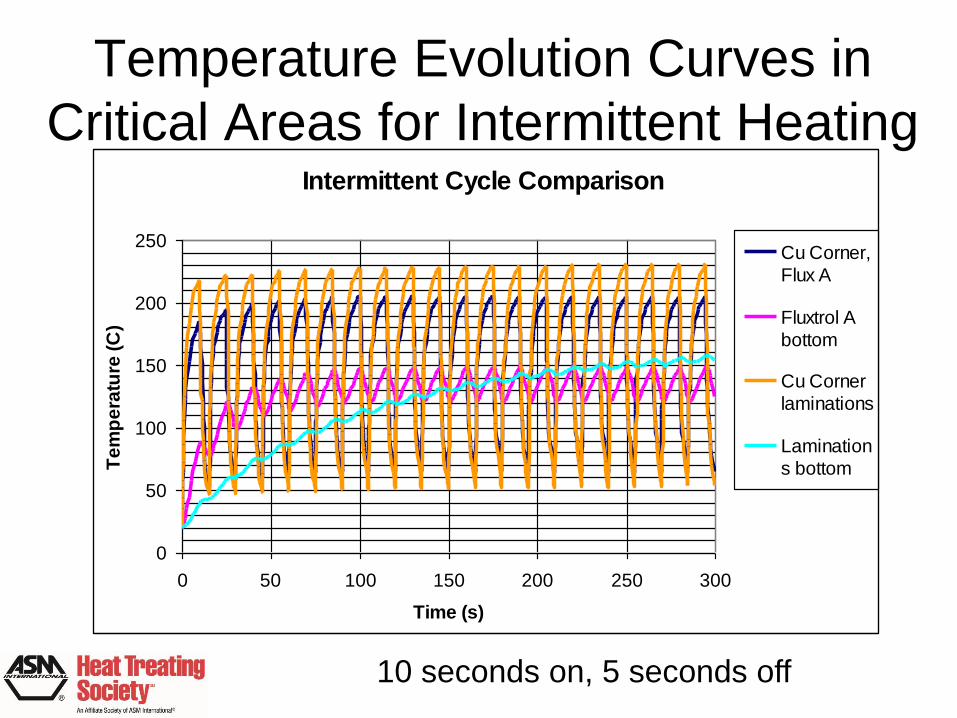
Temperature Evolution Curves in
Critical Areas for Intermittent Heating Intermittent Cycle Comparison
0
50
100
150
200
250
0 50 100 150 200 250 300
Time (s)
Te
mp
era
ture
(C
)
Cu Corner,
Flux A
Fluxtrol A
bottom
Cu Corner
laminations
Lamination
s bottom
10 seconds on, 5 seconds off
Conclusions • Inductor lifetime is an increasingly important
factor in induction heat treating applications
• One of the main failure modes of induction
coils is thermal degradation
• A method for predicting coil temperatures
and optimizing them in terms of lifetime is
presented
• A case story for seam annealing of heavy
walled pipe was presented to demonstrate it

Conclusions Ctd. • The copper temperature on the seam
annealing coil with Fluxtrol A was lower than
with laminations and this effect grew with
higher power levels (6º C regular, 18º C
high power, 40º C smaller ΔT intermittent)
• The overall temperature of Fluxtrol A was
significantly lower than laminations
• Further study should be done with different
coil styles and duty cycles