increasing speed of service: basics of lean application
TRANSCRIPT

1 © alpha2infinity
Stand
Increasing Speed of Serviceusing Lean Principles
2 © alpha2infinity
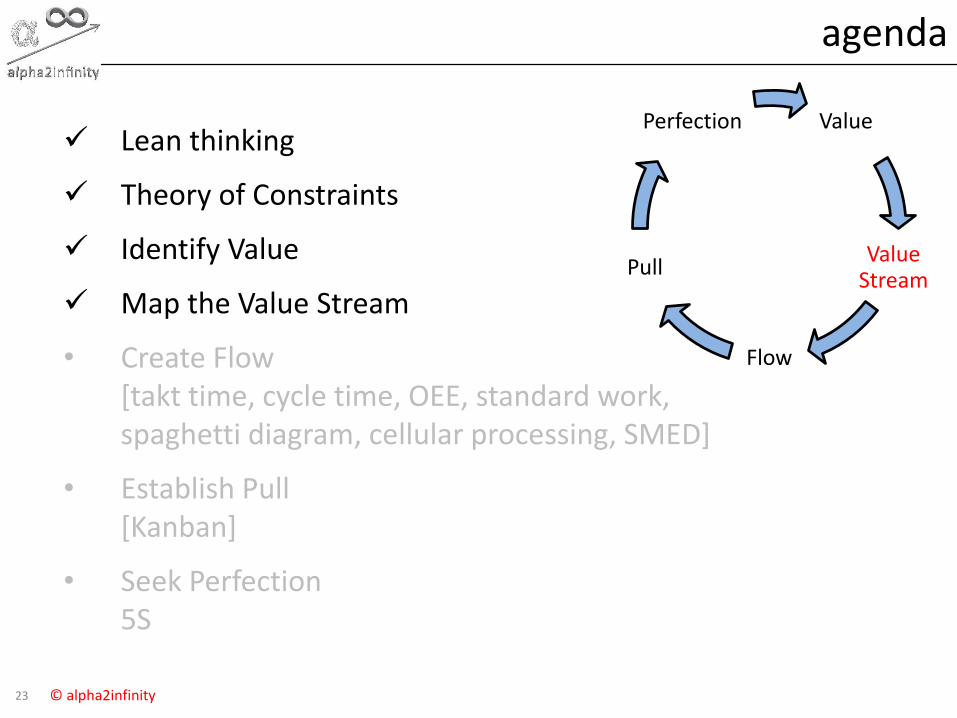
agenda
Lean thinking
• Theory of Constraints
• Identify Value
• Map the Value Stream
• Create Flow[takt time, cycle time, OEE, standard work, spaghetti diagram, cellular processing, SMED]
• Establish Pull [Kanban]
• Seek Perfection5S

3 © alpha2infinity
history of Lean
Sold patents on automatic power loom to Platt Bros• concept of Jidoka• 5-why problem solving
Founded Toyota Motors
Taiichi Ohno
‘Father’ of TPS (aka Lean)• concept of muda (waste)• concept of Kanban
Eiji Toyoda
Kiichiro ToyodaSakichi Toyoda
Toured Ford Rouge plant in early 1950s (after WW II)
4 © alpha2infinity
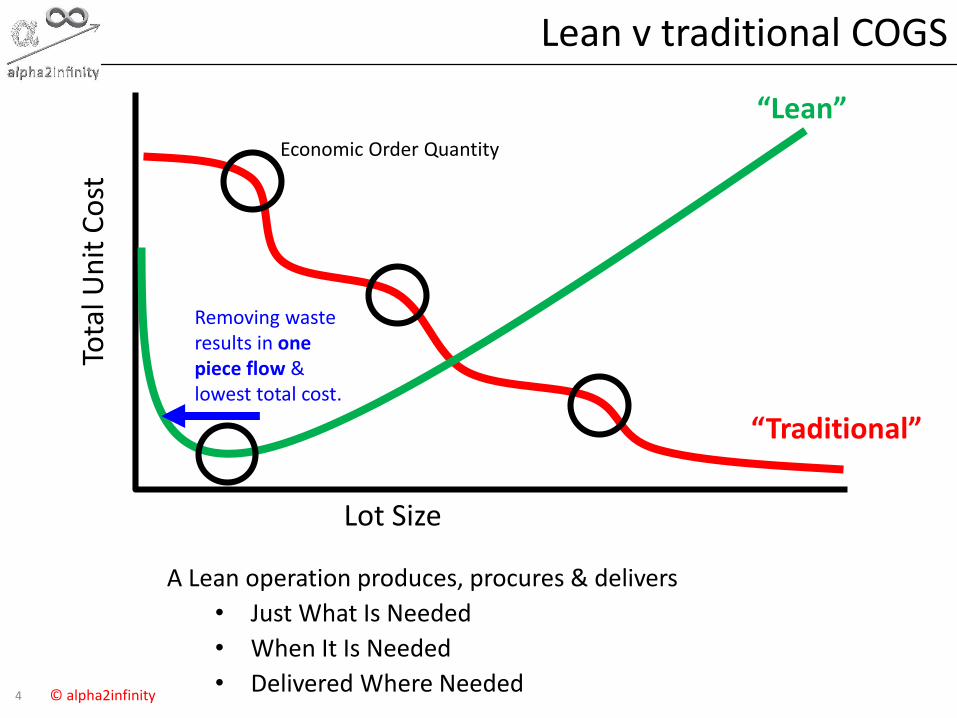
Lean v traditional COGS
A Lean operation produces, procures & delivers
• Just What Is Needed
• When It Is Needed
• Delivered Where Needed
“Traditional”
“Lean”
Removing waste results in one piece flow & lowest total cost.
Tota
l Un
it C
ost
Lot Size
Economic Order Quantity
5 © alpha2infinity
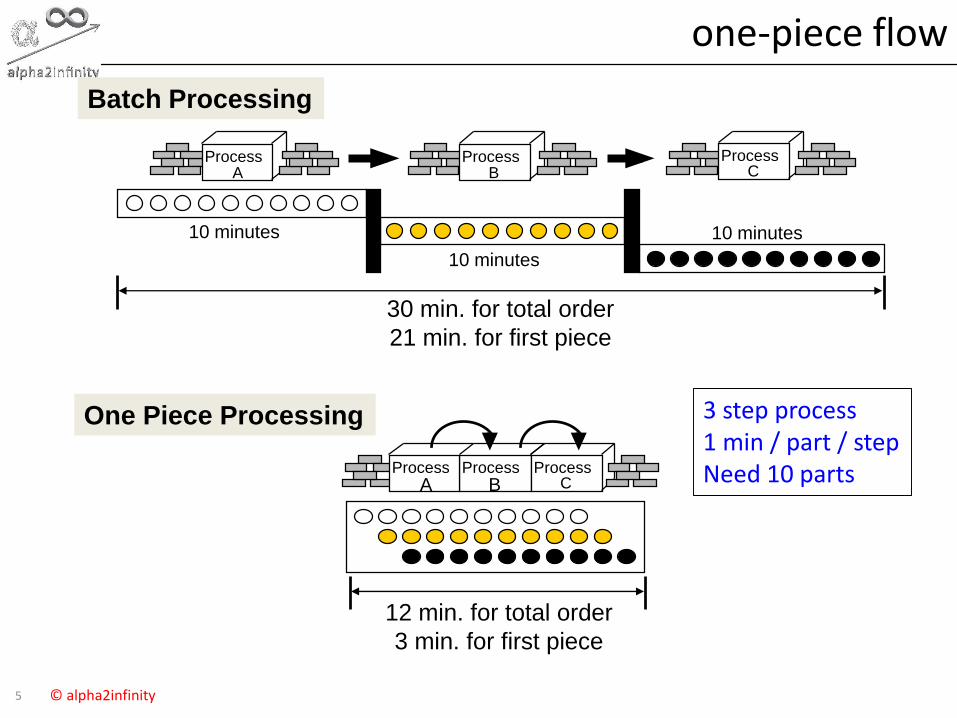
one-piece flow
10 minutes
10 minutes
Batch Processing
30 min. for total order
21 min. for first piece
10 minutes
ProcessA
ProcessB
ProcessC
12 min. for total order
3 min. for first piece
ProcessB
ProcessA
ProcessC
One Piece Processing 3 step process1 min / part / stepNeed 10 parts

6 © alpha2infinity
benefits of one-piece flow
• Reduced cycle time
• Immediate identification of quality problems (not buried in piles of WIP)
• Reduced inventories
• Reduced variation in delivery performance – improved ability to plan and schedule
7 © alpha2infinity
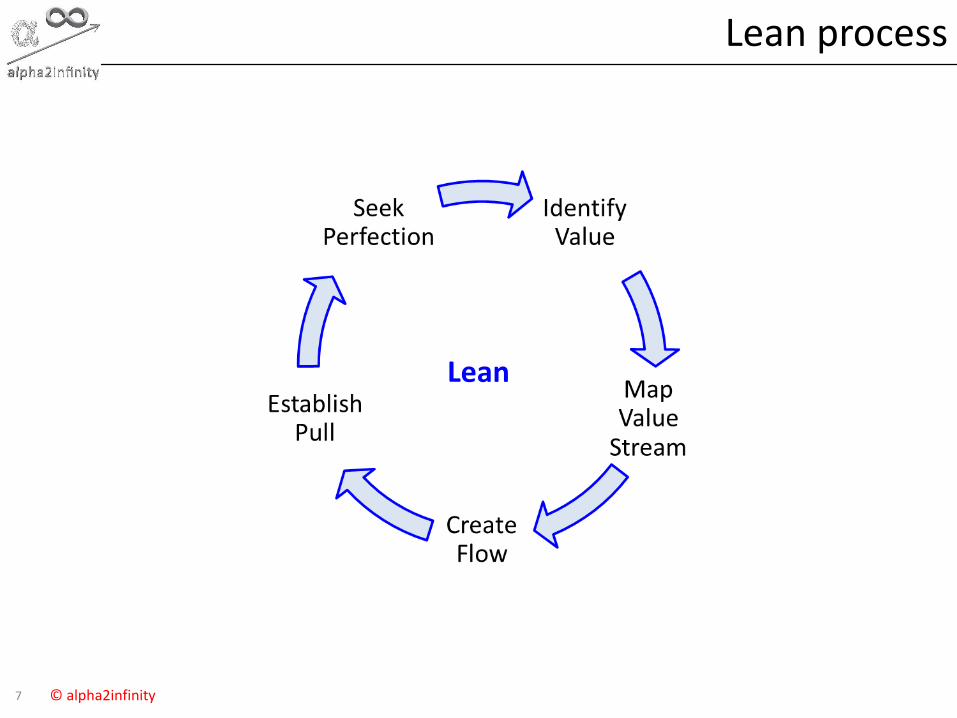
Lean process
Lean

8 © alpha2infinity
holistic OpEx deployment
+
Leverage Six Sigma as needed to minimize variation that causes
waste
Deploy Lean to increase speed of
service, by focusing on waste elimination
As speed increases, waste is visible
9 © alpha2infinity
agenda
Lean thinking
Theory of Constraints
• Identify Value
• Map the Value Stream
• Create Flow[takt time, cycle time, OEE, standard work, spaghetti diagram, cellular processing, SMED]
• Establish Pull [Kanban]
• Seek Perfection5S
10 © alpha2infinity
what is theory of constraints?
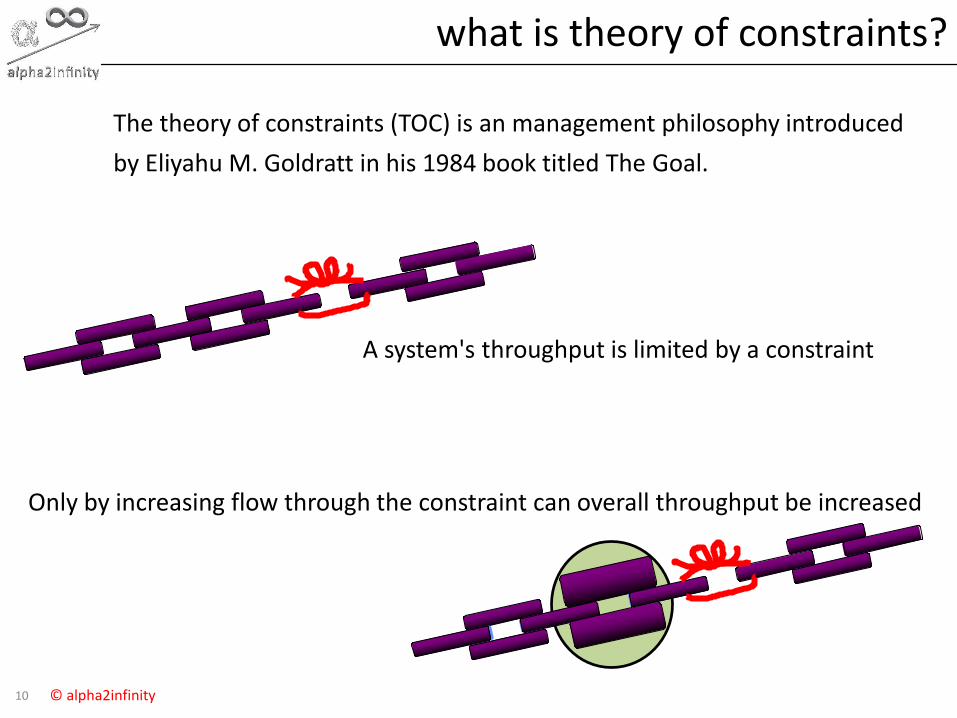
The theory of constraints (TOC) is an management philosophy introduced
by Eliyahu M. Goldratt in his 1984 book titled The Goal.
A system's throughput is limited by a constraint
Only by increasing flow through the constraint can overall throughput be increased

11 © alpha2infinity
TOC process
1. Identify the system's constraint(s).
2. Exploit the system's constraint(s).
3. Subordinate everything else to the above decision(s).
4. Elevate the system's constraint(s).
5. Repeat for next constraint in system.
Do not allow inertia become the system constraint
12 © alpha2infinity
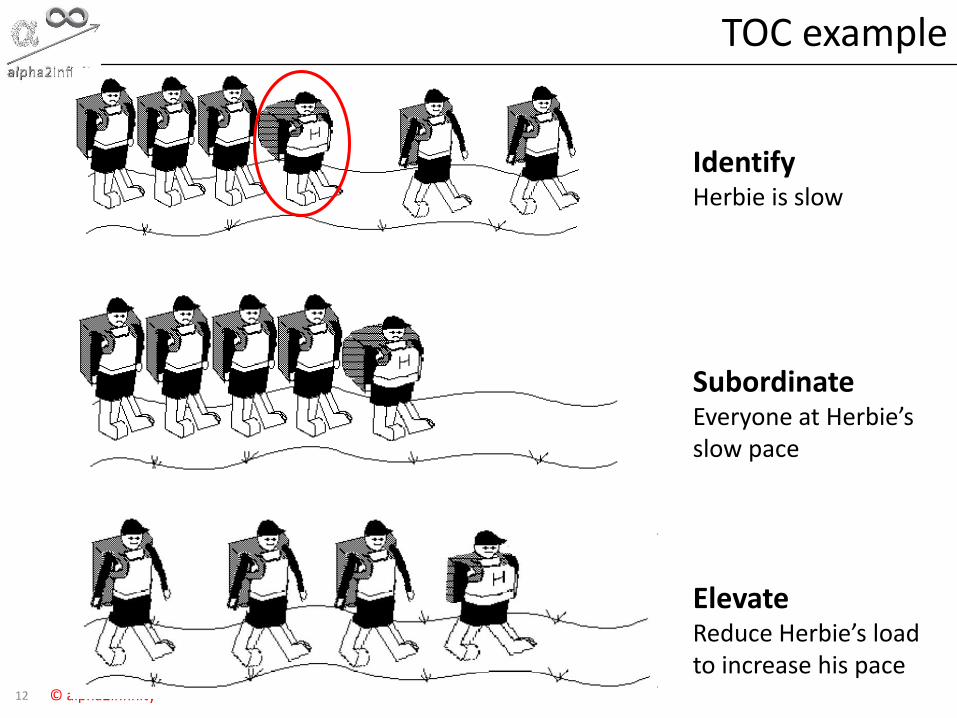
TOC example
IdentifyHerbie is slow
SubordinateEveryone at Herbie’s slow pace
ElevateReduce Herbie’s loadto increase his pace
13 © alpha2infinity
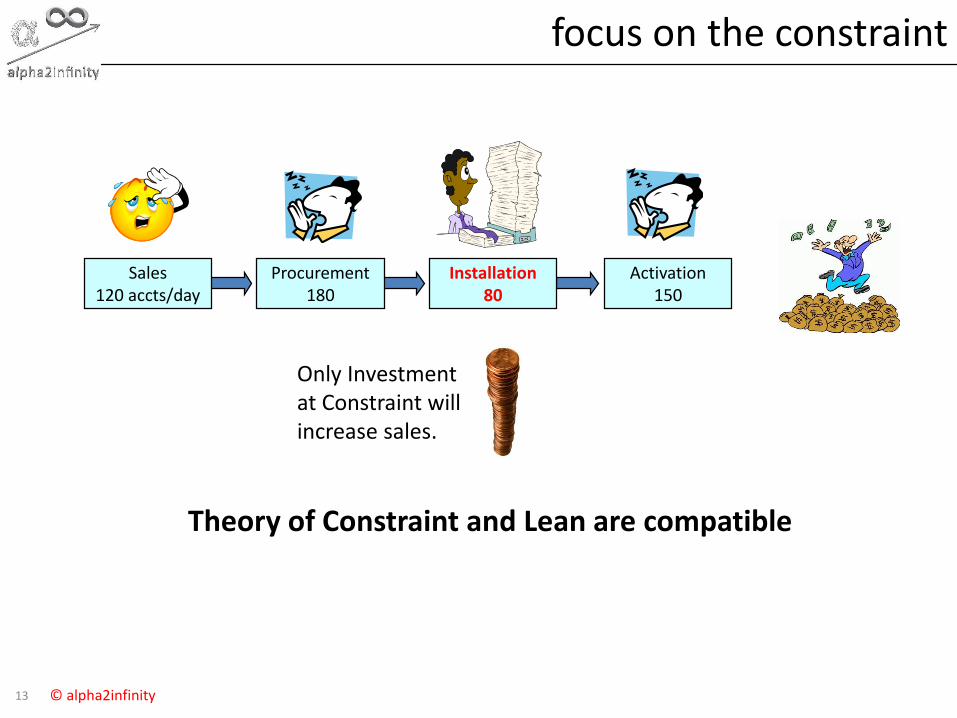
focus on the constraint
Sales120 accts/day
Procurement180
Installation80
Activation150
Only Investmentat Constraint will increase sales.
Theory of Constraint and Lean are compatible

14 © alpha2infinity
agenda
Lean thinking
Theory of Constraints
Identify Value
• Map the Value Stream
• Create Flow[takt time, cycle time, OEE, standard work, spaghetti diagram, cellular processing, SMED]
• Establish Pull [Kanban]
• Seek Perfection5S
Value
Value Stream
Flow
Pull
Perfection

15 © alpha2infinity
Defining Value
Start by clearly defining value for a product/service from the customer
perspective…..
Value = activities that a customer will pay for
…..all other activities are non-value added or
waste and can be targeted for removal; step by step.
16 © alpha2infinity
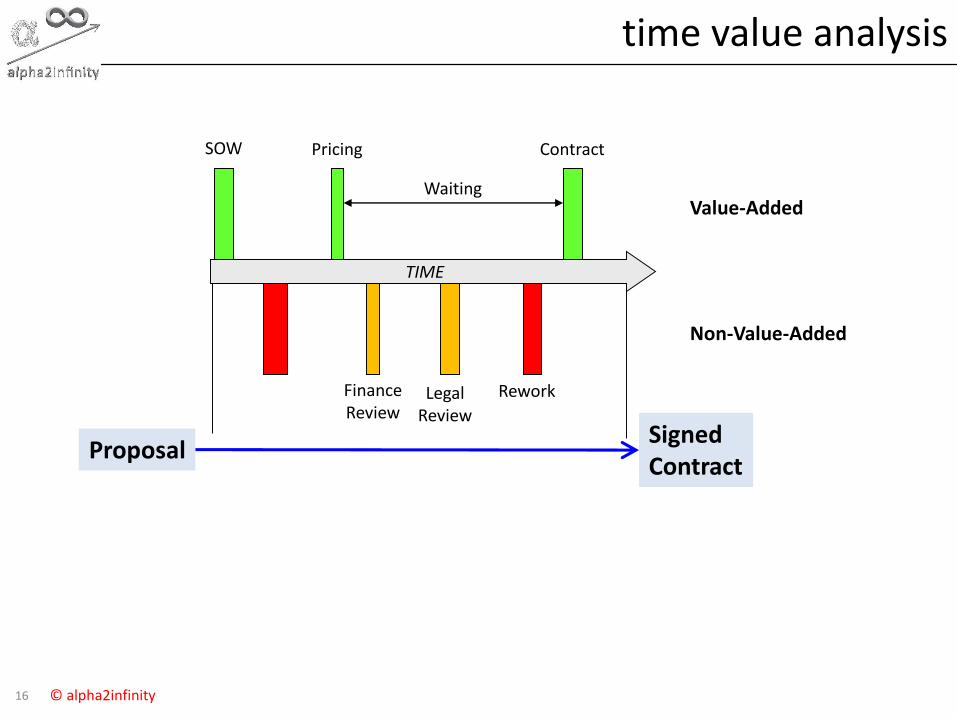
time value analysis
SOW Contract
FinanceReview
Rework
Waiting
ProposalSigned Contract
Value-Added
Non-Value-Added
Pricing
LegalReview
TIME
17 © alpha2infinity
types of activities
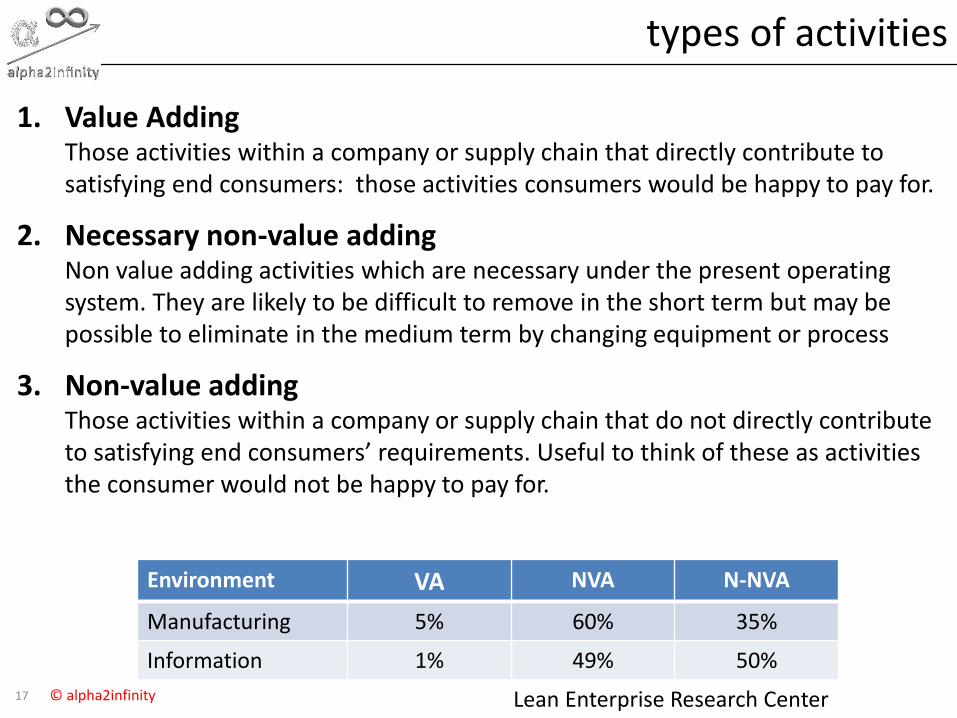
1. Value Adding Those activities within a company or supply chain that directly contribute to satisfying end consumers: those activities consumers would be happy to pay for.
2. Necessary non-value addingNon value adding activities which are necessary under the present operating system. They are likely to be difficult to remove in the short term but may be possible to eliminate in the medium term by changing equipment or process
3. Non-value addingThose activities within a company or supply chain that do not directly contribute to satisfying end consumers’ requirements. Useful to think of these as activities the consumer would not be happy to pay for.
Environment VA NVA N-NVA
Manufacturing 5% 60% 35%
Information 1% 49% 50%
Lean Enterprise Research Center
18 © alpha2infinity
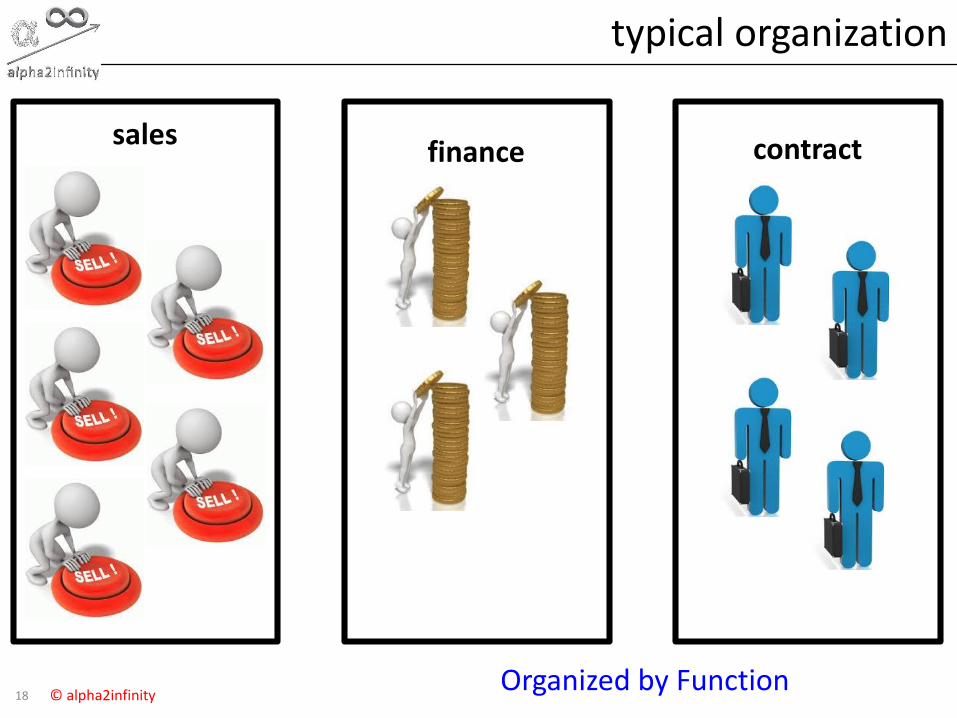
typical organization
salesfinance contract
Organized by Function
19 © alpha2infinity
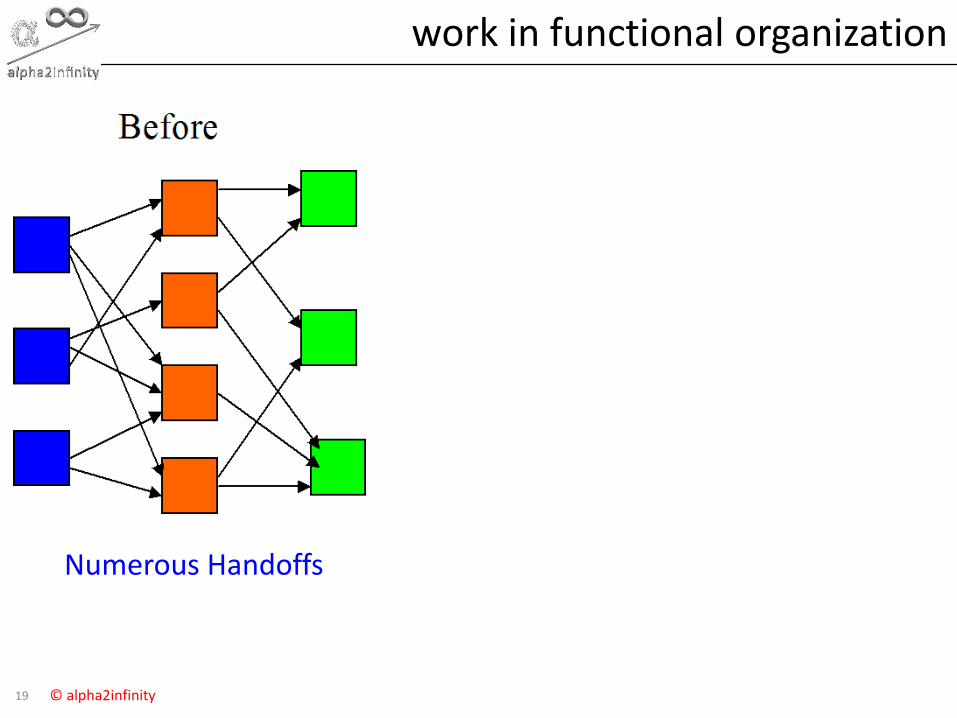
work in functional organization
Numerous Handoffs

20 © alpha2infinity
identifying value stream(s)
Group into products using similar processesThere are 3 possible value streams (focus factories)
A B C D E F G H I
1 X X X X X X
2 X X X X X X X X X
3 X X X X X X X
4 X X X X
5 X X X X X X
6 X X X X X X X X
7 X X X X X X X
8 X X
9
PRODUCTS
PR
OC
ES
S S
TE
PS

21 © alpha2infinity
Lean organizationsales finance contract
Value Stream is the set of all the actions required to deliver product to the customer

22 © alpha2infinity
work in a Lean organization
Numerous Handoffs Reduced Handoffs
23 © alpha2infinity
agenda
Lean thinking
Theory of Constraints
Identify Value
Map the Value Stream
• Create Flow[takt time, cycle time, OEE, standard work, spaghetti diagram, cellular processing, SMED]
• Establish Pull [Kanban]
• Seek Perfection5S
Value
Value Stream
Flow
Pull
Perfection
24 © alpha2infinity
why value stream map?
Benefit
• It visualizes the flow
• Identifies sources of waste
• Make decisions about flow obvious
• Links material flow to information flow
• Establish the foundation for improvement activities
DefinitionValue stream mapping is a method of creating a “one page picture” of high-level processes + information flow + material flow that occur from the time a customer places an order for a product, until the customer has received that product.

25 © alpha2infinity
value stream map v process map
Value Stream Map(similar to SIPOC)
Process Map 3Process Map 2Process Map 1
Process Step AProcess Step B
Macro ViewStrategicLeadership led
Detailed ViewTacticalFrontline led
26 © alpha2infinity
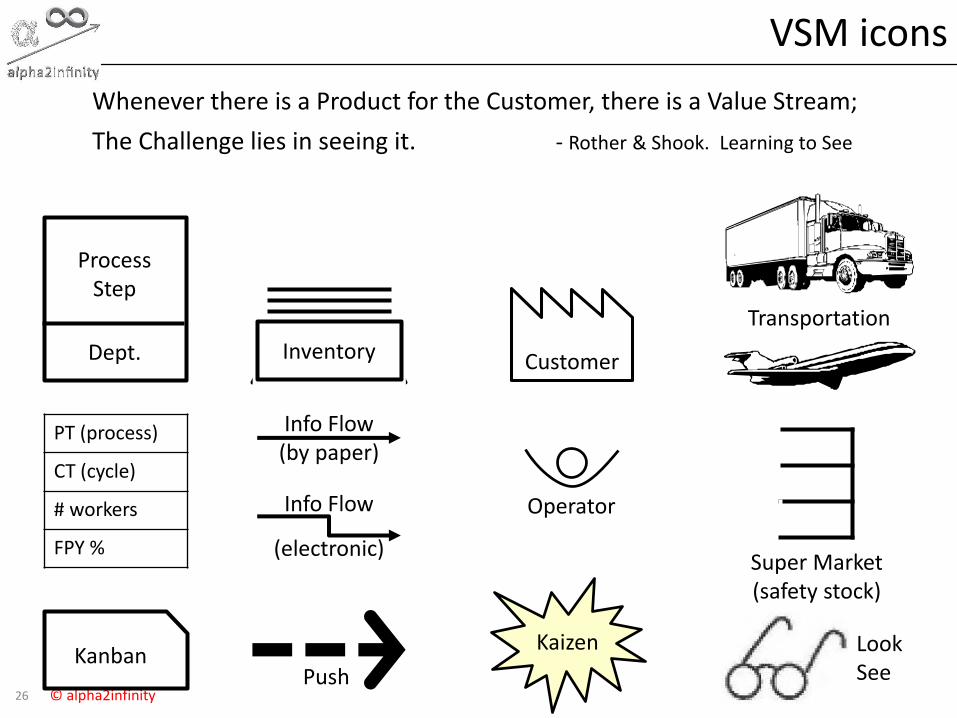
VSM icons
Process Step
Dept.
PT (process)
CT (cycle)
# workers
FPY %
Info Flow(by paper)
Info Flow
(electronic)
Customer
Transportation
Kaizen
Operator
KanbanPush
Super Market(safety stock)
Whenever there is a Product for the Customer, there is a Value Stream;
The Challenge lies in seeing it. - Rother & Shook. Learning to See
LookSee
Inventory
Inventory

27 © alpha2infinity
before beginning VSM-1
VSM is Art + Science
Don’t Strive for Perfection80% is Good Enough
28 © alpha2infinity
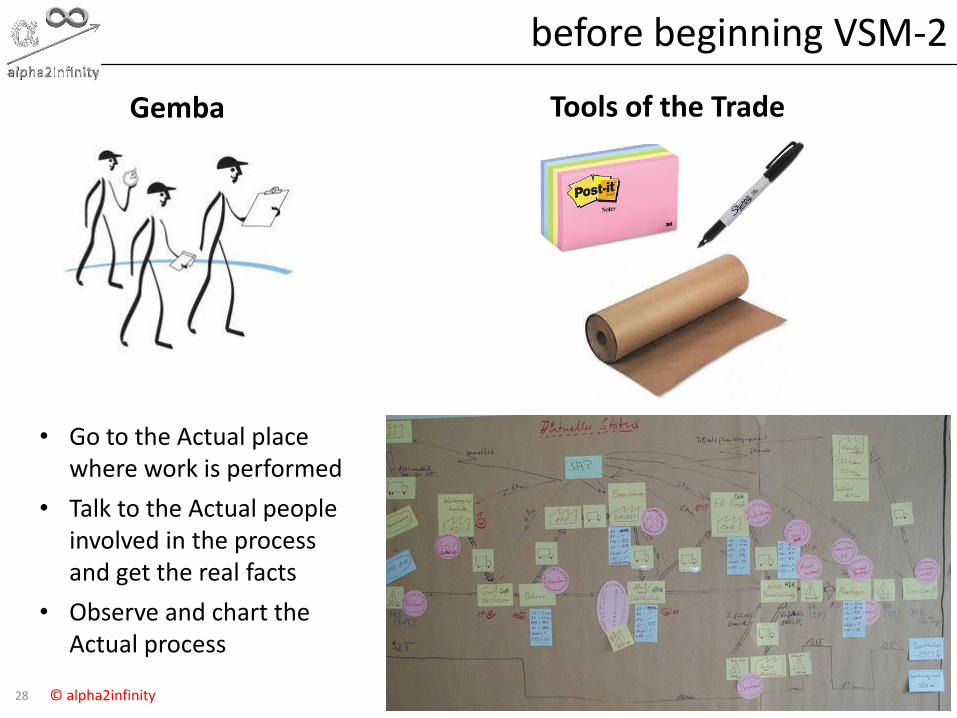
before beginning VSM-2
Tools of the TradeGemba
• Go to the Actual place where work is performed
• Talk to the Actual people involved in the process and get the real facts
• Observe and chart the Actual process
29 © alpha2infinity
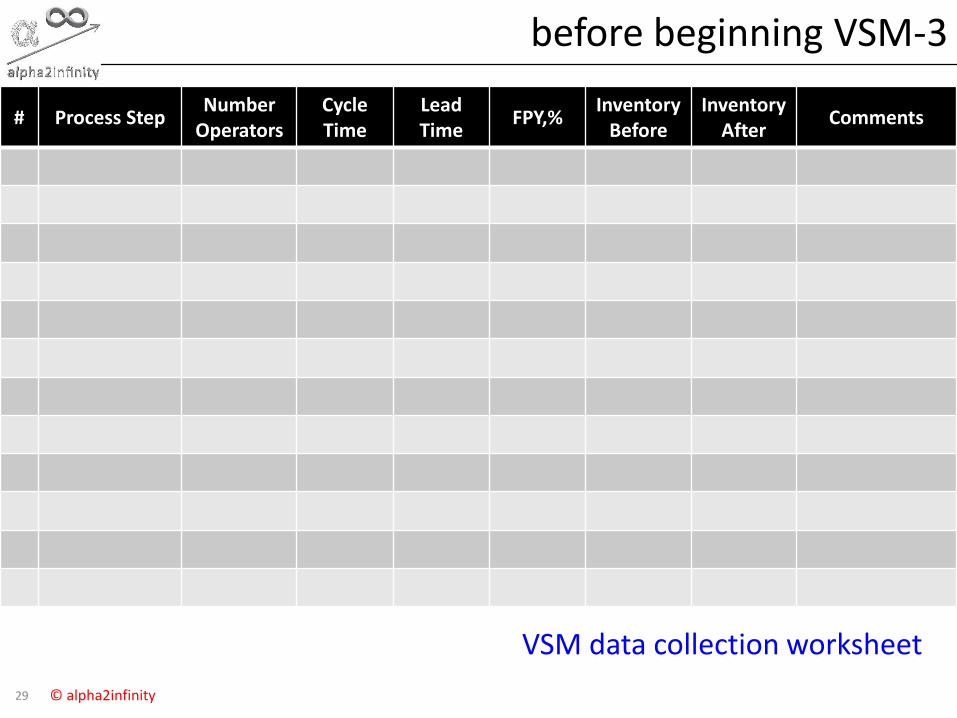
before beginning VSM-3
# Process StepNumber
OperatorsCycleTime
Lead Time
FPY,%Inventory
BeforeInventory
AfterComments
VSM data collection worksheet

30 © alpha2infinity
VSM step 1
Customer
Process 1
Dept. A
Process 2
Dept. A
Process 3
Dept. B
Limit number of process steps to < 10Use Verb + Noun format. What happens to WhatAdd Material & Data Flow
31 © alpha2infinity
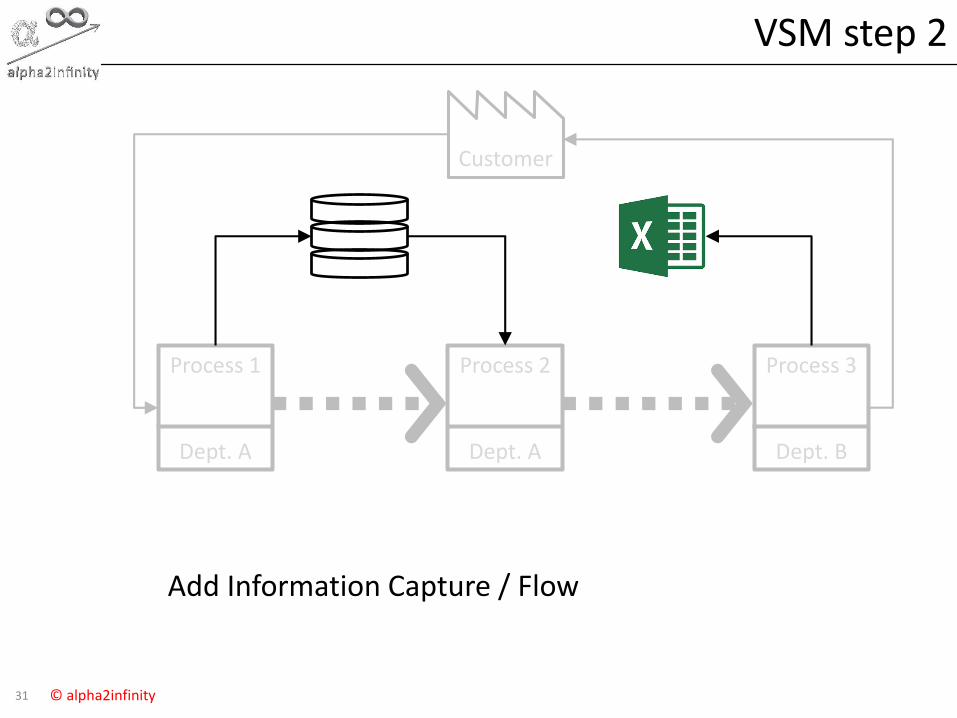
VSM step 2
Customer
Process 1
Dept. A
Process 2
Dept. A
Process 3
Dept. B
Add Information Capture / Flow
32 © alpha2infinity
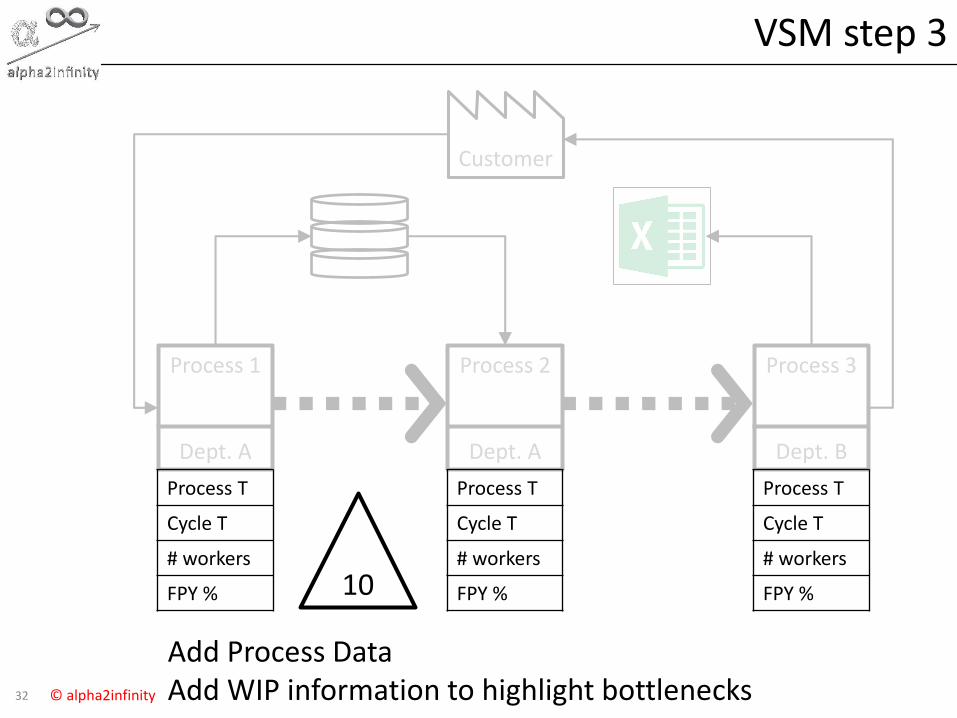
VSM step 3
Customer
Process 1
Dept. A
Process T
Cycle T
# workers
FPY %
Process 2
Dept. A
Process T
Cycle T
# workers
FPY %
Process 3
Dept. B
Process T
Cycle T
# workers
FPY %
Add Process DataAdd WIP information to highlight bottlenecks
10
33 © alpha2infinity
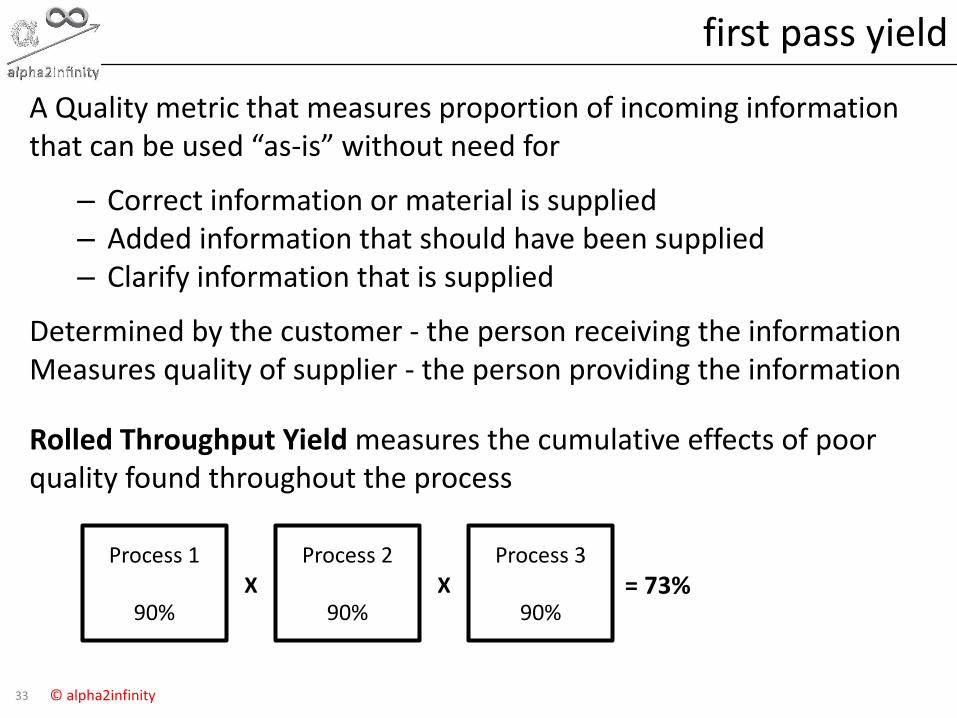
first pass yield
A Quality metric that measures proportion of incoming information that can be used “as-is” without need for
– Correct information or material is supplied– Added information that should have been supplied– Clarify information that is supplied
Determined by the customer - the person receiving the informationMeasures quality of supplier - the person providing the information
Process 1
90%
Process 2
90%
Process 3
90%= 73%
Rolled Throughput Yield measures the cumulative effects of poor quality found throughout the process
X X
34 © alpha2infinity
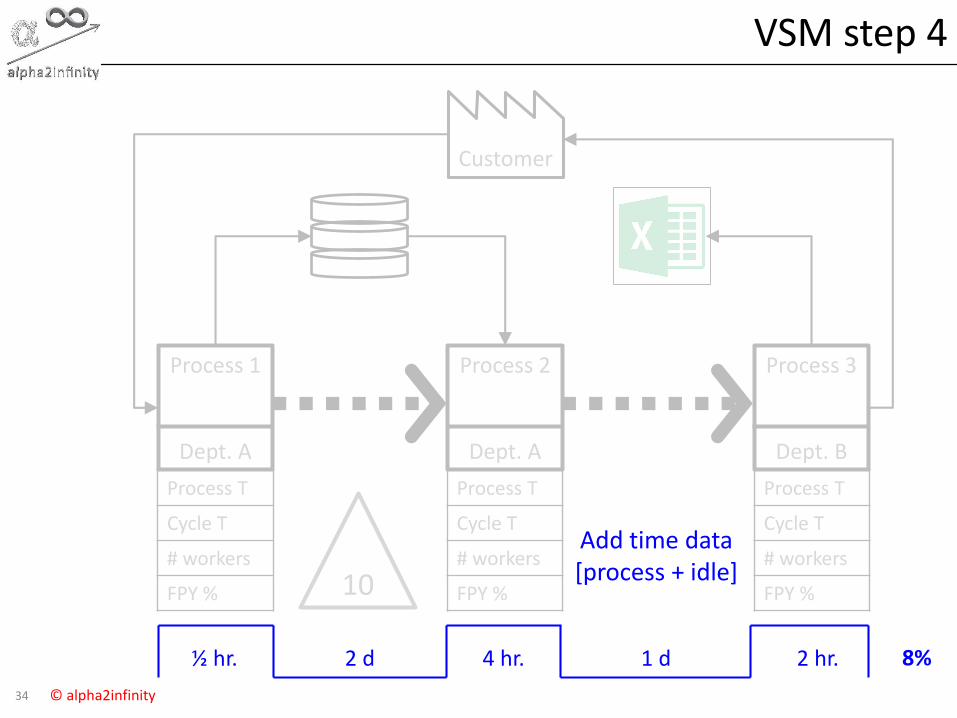
VSM step 4
Customer
Process 1
Dept. A
Process T
Cycle T
# workers
FPY %
Process 2
Dept. A
Process T
Cycle T
# workers
FPY %
Process 3
Dept. B
Process T
Cycle T
# workers
FPY %
Add time data [process + idle]
½ hr. 4 hr. 2 hr.2 d 1 d 8%
10
35 © alpha2infinity
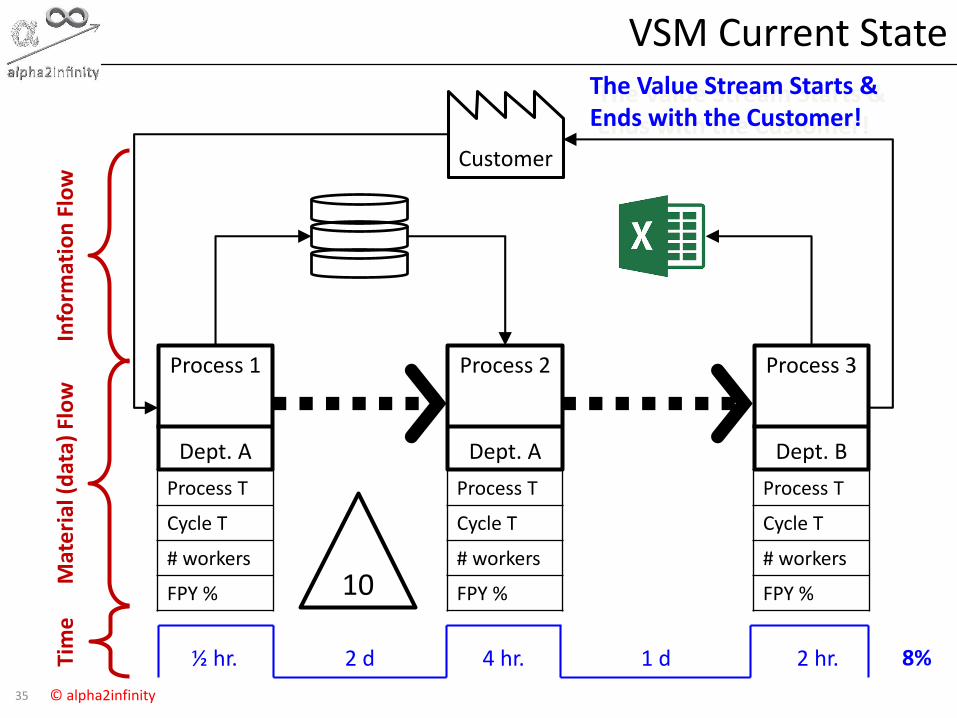
VSM Current State
Customer
Process 1
Dept. A
Process T
Cycle T
# workers
FPY %
Process 2
Dept. A
Process T
Cycle T
# workers
FPY %
Process 3
Dept. B
Process T
Cycle T
# workers
FPY %
½ hr. 4 hr. 2 hr.2 d 1 d 8%
Info
rmat
ion
Flo
wM
ate
rial
(d
ata)
Flo
wTi
me
10
The Value Stream Starts & Ends with the Customer!
36 © alpha2infinity
Waste

37 © alpha2infinity
waste in manufacturing
1. Transportmoving material unnecessarily, resulting in damage, loss and increased cost
2. Inventorytoo much stock of raw materials, work-in-progress (WIP), or finished goods
3. Motionexcessive & unnecessary walking or movement of people or equipment
4. Waitingpeople or equipment waiting for material to process
5. Over Processingperforming more work on a piece than required by the customer
6. Over Productionproducing more product than required at that time by customer (large batch)
7. Defectscreation of defects resulting in extra costs for rework, rescheduling
8. Waste of human talentunder-utilizing capabilities of the employees

38 © alpha2infinity
waste in service
1. Duplicationhaving to re-enter data, answer same queries from the same organization
2. Incorrect inventorybeing out-of-stock, unable to get exactly what is required (make-do)
3. Unnecessary Movementqueuing at different departments to get service
4. Delayin providing the customers with information, product or a service (on hold)
5. Unclear communicationunclear instructions creating confusion over product or service use
6. Lost opportunity to retain or win customers being rude or unfriendly. lacking basic knowledge to help customer
7. Defectsnot receiving expected service. errors in service received
8. Waste of human talentunder-utilizing capabilities of the employees

39 © alpha2infinity
waste walk worksheet
DATE: OBSERVER NAME:
List two observations of each type of waste observed
T1. abc
2. abc
I1. abc
2. abc
M1. abc
2. abc
W1. abc
2. abc
O1. abc
2. abc
O1. abc
2. abc
D1. abc
2. abc

40 © alpha2infinity
agenda
Lean thinking
Theory of Constraints
Identify Value
Map the Value Stream
Create Flow[takt time, cycle time, OEE, standard work, spaghetti diagram, cellular processing, SMED]
• Establish Pull [Kanban]
• Seek Perfection5S
Value
Value Stream
Flow
Pull
Perfection
41 © alpha2infinity
Takt & Cycle Time

42 © alpha2infinity
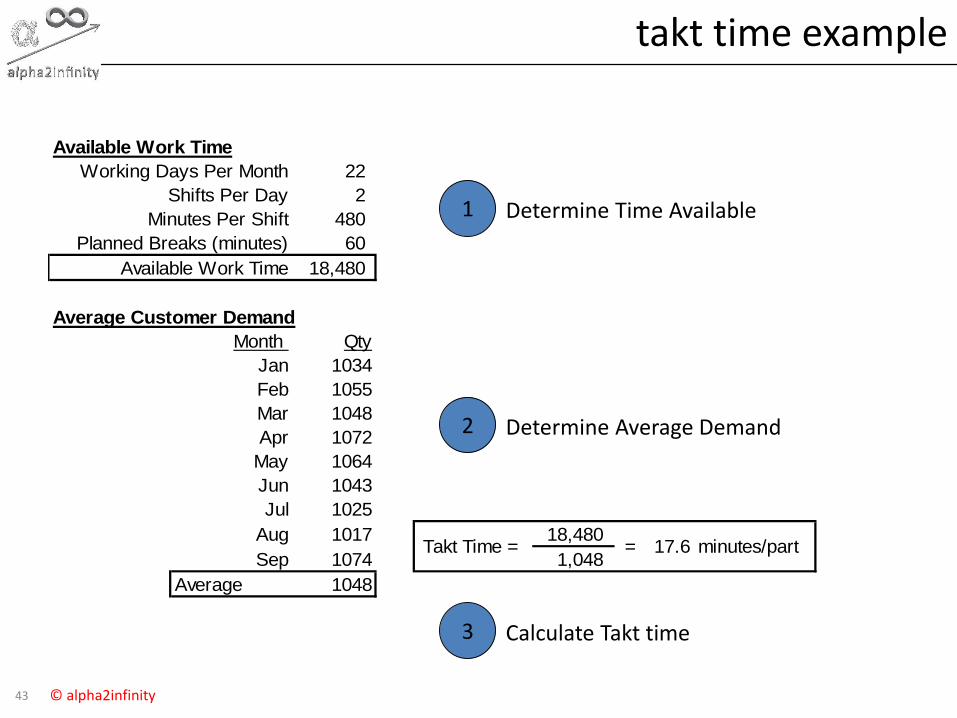
what is takt time?
If Customer Value describes what the customer wants, then
takt time describes how often they want it.
Takt German word for meter
1Takt
Takt Time =Available Work Time
Average Customer Demand
In Lean, Takt time is the DRUM BEAT of Production
43 © alpha2infinity
takt time example
Available Work Time
Working Days Per Month 22
Shifts Per Day 2
Minutes Per Shift 480
Planned Breaks (minutes) 60
Available Work Time 18,480
Average Customer Demand
Month Qty
Jan 1034
Feb 1055
Mar 1048
Apr 1072
May 1064
Jun 1043
Jul 1025
Aug 1017 18,480
Sep 1074 1,048
Average 1048
Takt Time = 17.6 minutes/part=
1 Determine Time Available
2 Determine Average Demand
3 Calculate Takt time

44 © alpha2infinity
@ Process Level
At the individual process level, 3 metrics are used to identify issues.
1. Takt time (How often does customer want product)
2. Cycle Time (How fast can we make product)
3. OEE (Overall Equipment Effectiveness)
SOW Contract
Review FinanceReview
Rework
Waiting
StartProposal
Signed ContractCycle Time
Pricing
LegalReview
TIME
45 © alpha2infinity
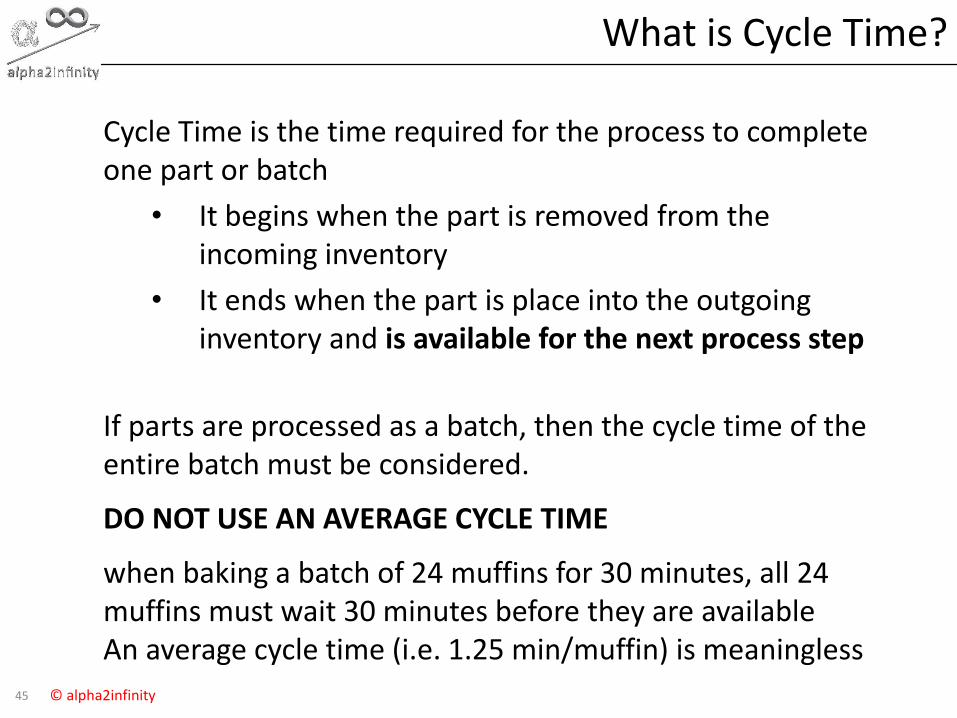
What is Cycle Time?
Cycle Time is the time required for the process to complete one part or batch
• It begins when the part is removed from the incoming inventory
• It ends when the part is place into the outgoing inventory and is available for the next process step
If parts are processed as a batch, then the cycle time of the entire batch must be considered.
DO NOT USE AN AVERAGE CYCLE TIME
when baking a batch of 24 muffins for 30 minutes, all 24 muffins must wait 30 minutes before they are availableAn average cycle time (i.e. 1.25 min/muffin) is meaningless
46 © alpha2infinity
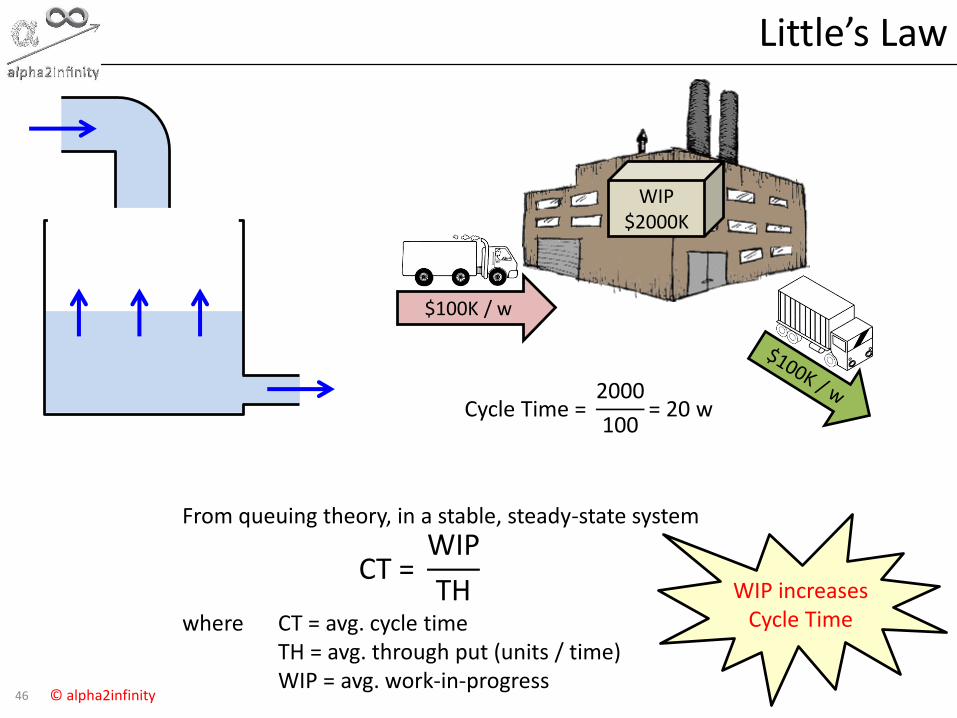
Little’s Law
$100K / w
WIP$2000K
Cycle Time =2000
100= 20 w
From queuing theory, in a stable, steady-state system
CT =WIP
THwhere CT = avg. cycle time
TH = avg. through put (units / time)WIP = avg. work-in-progress
WIP increases Cycle Time

47 © alpha2infinity
OEE

48 © alpha2infinity
what is OEE?
Expected Output
Actual Output Slow Speed
a
b
c
d
e
f OEE = (b/a) x (d/c) x (f/e)
Expected Production Time
Actual Production Time Down Time
Actual Output
ReworkAccepted Output
OEE (Operational Equipment Effectiveness)is a ‘loss measurement’ metric that allows us to assess and compare the efficiency of the various process steps
OEE = Availability X Performance X Quality
49 © alpha2infinity
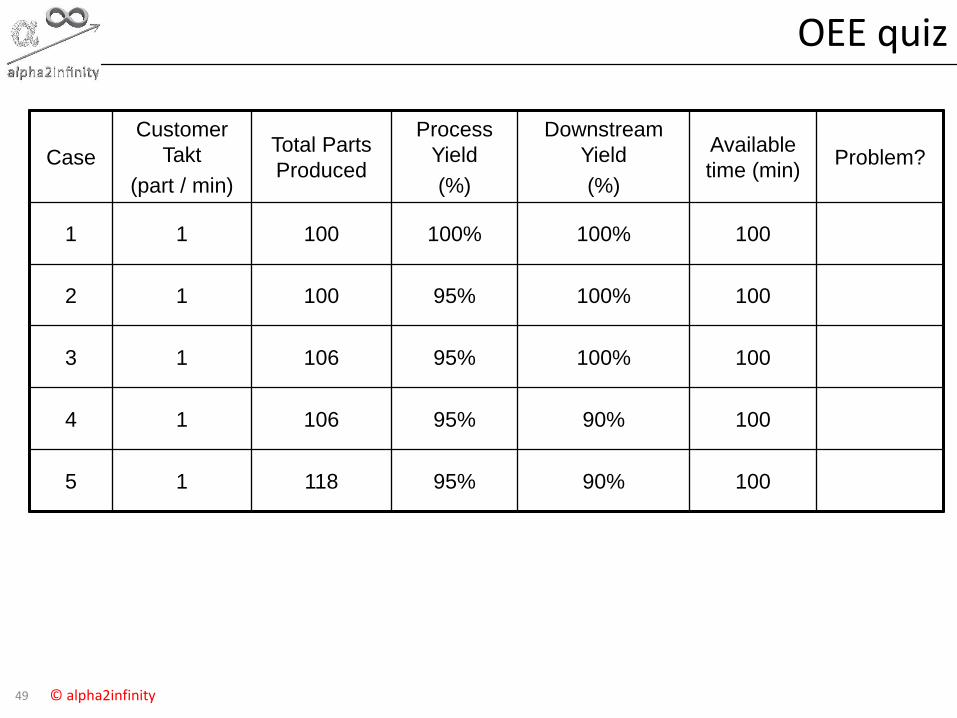
OEE quiz
Case
Customer
Takt
(part / min)
Total Parts
Produced
Process
Yield
(%)
Downstream
Yield
(%)
Available
time (min)Problem?
1 1 100 100% 100% 100
2 1 100 95% 100% 100
3 1 106 95% 100% 100
4 1 106 95% 90% 100
5 1 118 95% 90% 100

50 © alpha2infinity
balance & flow
Flow will only occur when [cycle time*OEE] for ALL process steps are “under” Takt time
0
10
20
30
40
50
60
70
80
90
1 2 3 4
Tim
e
Work Station
Cycle
Takt
0
10
20
30
40
50
60
70
80
90
1 2 3 4
Tim
e
Work Station
Cycle
Takt

51 © alpha2infinity
Standard Work
52 © alpha2infinity
what is standard work?
It is the documented best practice that results in the least amount of variation from workers & equipment
Benefits
• Documents the process
• Provides training aid
• Reduces variation in the process
• Creates flexibility among the work force
• Allows balance of work across all processes
• Minimizes waste
53 © alpha2infinity
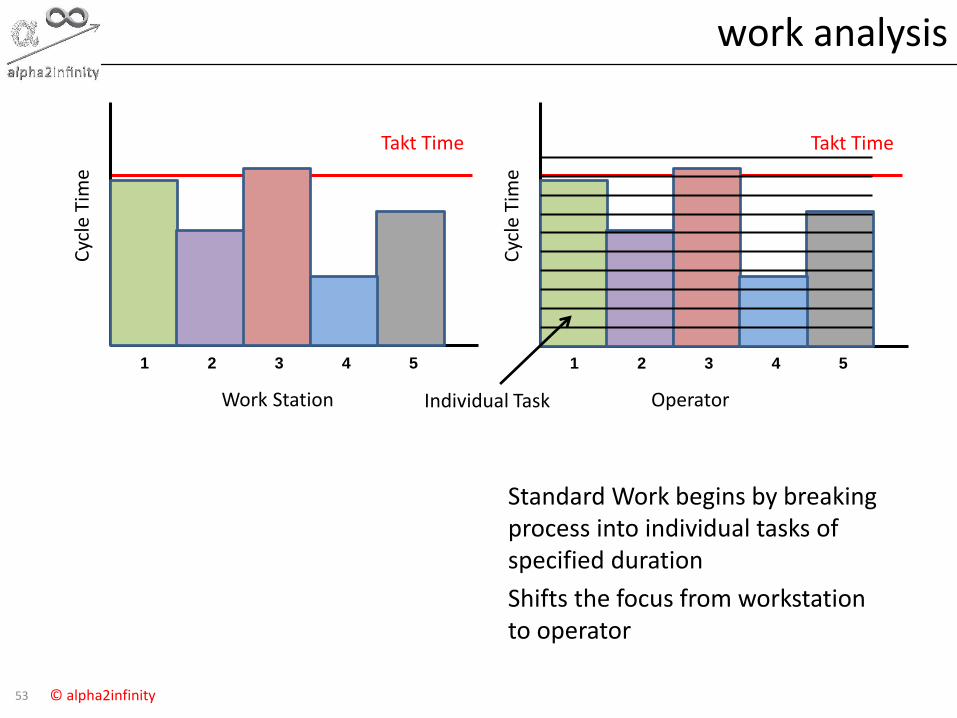
work analysis
Takt Time
1 2 3 4 5
Cyc
le T
ime
Work Station
Takt Time
1 2 3 4 5
Cyc
le T
ime
OperatorIndividual Task
Standard Work begins by breaking process into individual tasks of specified duration
Shifts the focus from workstation to operator
54 © alpha2infinity
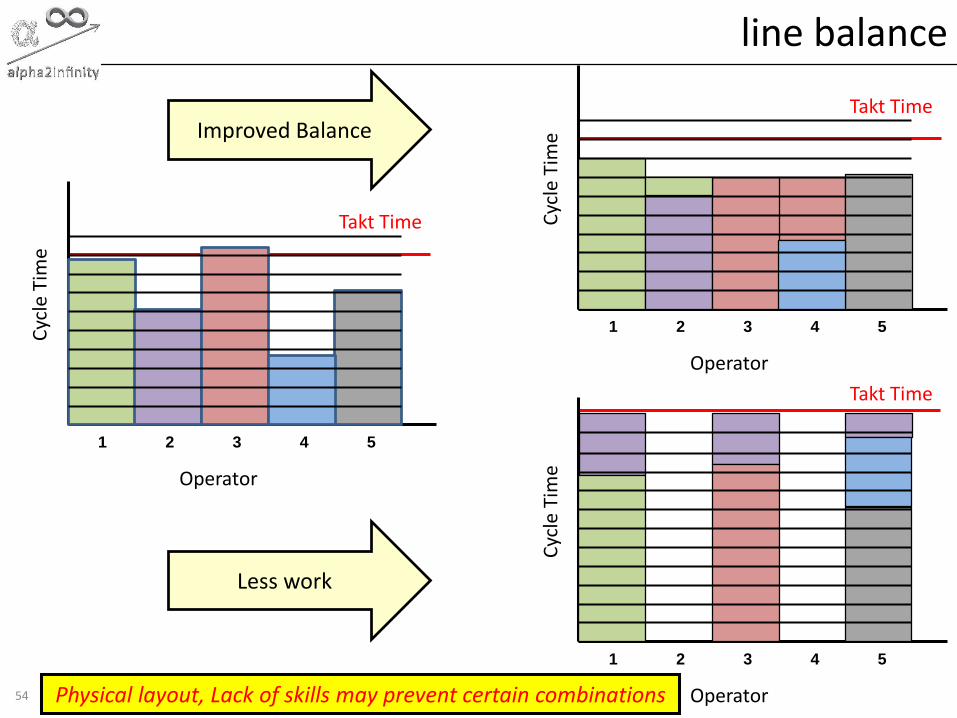
line balance
Takt Time
1 2 3 4 5
Cyc
le T
ime
Operator
Takt Time
1 2 3 4 5
Cyc
le T
ime
Operator
Improved Balance
Less work
Takt Time
1 2 3 4 5
Cyc
le T
ime
OperatorPhysical layout, Lack of skills may prevent certain combinations
55 © alpha2infinity
Time
Step Time 5 10 15 20 25 30 35 40 45 50 55 60 65 70 75 80 85 90 95
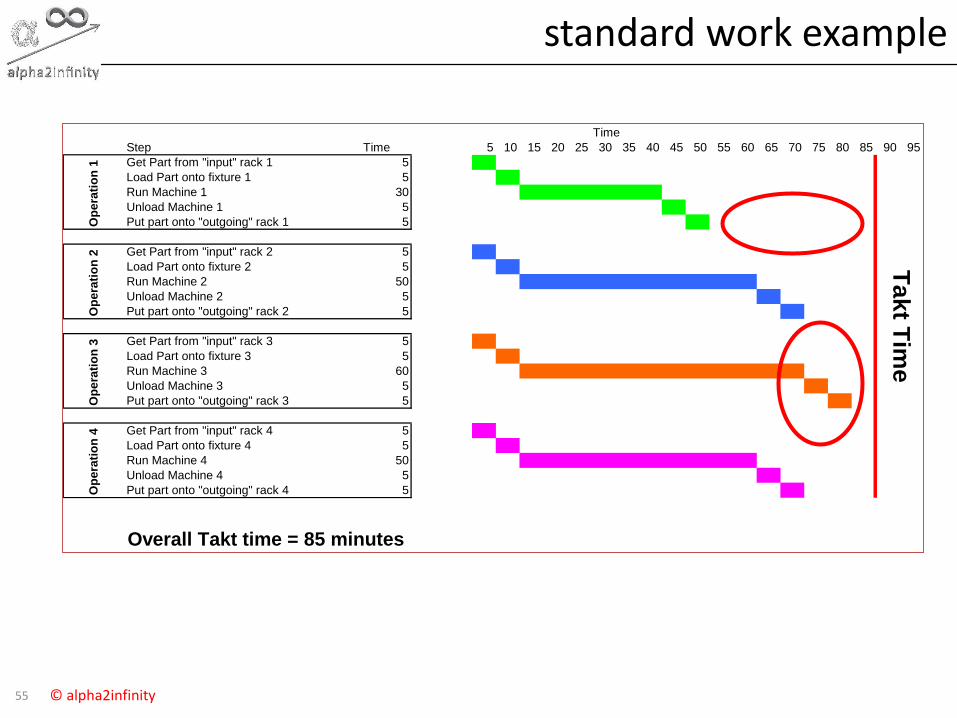
Get Part from "input" rack 1 5
Load Part onto fixture 1 5
Run Machine 1 30
Unload Machine 1 5
Put part onto "outgoing" rack 1 5
Get Part from "input" rack 2 5
Load Part onto fixture 2 5
Run Machine 2 50
Unload Machine 2 5
Put part onto "outgoing" rack 2 5
Get Part from "input" rack 3 5
Load Part onto fixture 3 5
Run Machine 3 60
Unload Machine 3 5
Put part onto "outgoing" rack 3 5
Get Part from "input" rack 4 5
Load Part onto fixture 4 5
Run Machine 4 50
Unload Machine 4 5
Put part onto "outgoing" rack 4 5
Overall Takt time = 85 minutes
Op
era
tio
n 1
Op
era
tio
n 2
Op
era
tio
n 3
Op
era
tio
n 4
Takt T
ime
standard work example

56 © alpha2infinity
standard work example
Time
Step Time 5 10 15 20 25 30 35 40 45 50 55 60 65 70 75 80 85 90
Put part onto "outgoing" rack 3 5
Get Part from "input" rack 1 5
Load Part onto fixture 1 5
Run Machine 1 30
Unload Machine 1 5
Put part onto "outgoing" rack 1 5
Get Part from "input" rack 3 5
Get Part from "input" rack 2 5
Load Part onto fixture 2 5
Run Machine 2 50
Unload Machine 2 5
Put part onto "outgoing" rack 2 5
Get Part from "input" rack 3 5
Load Part onto fixture 3 5
Run Machine 3 70
Unload Machine 3 5
Put part onto "outgoing" rack 3 5
Get Part from "input" rack 4 5
Load Part onto fixture 4 5
Run Machine 4 50
Unload Machine 4 5
Put part onto "outgoing" rack 4 5
Op
era
tio
n 1
Op
era
tio
n 2
Op
era
tio
n 3
Op
era
tio
n 4
Takt T
ime
Preps for next cycle
previously preped by Op#1
Part from Previous cycle

57 © alpha2infinity
Spaghetti Diagram

58 © alpha2infinity
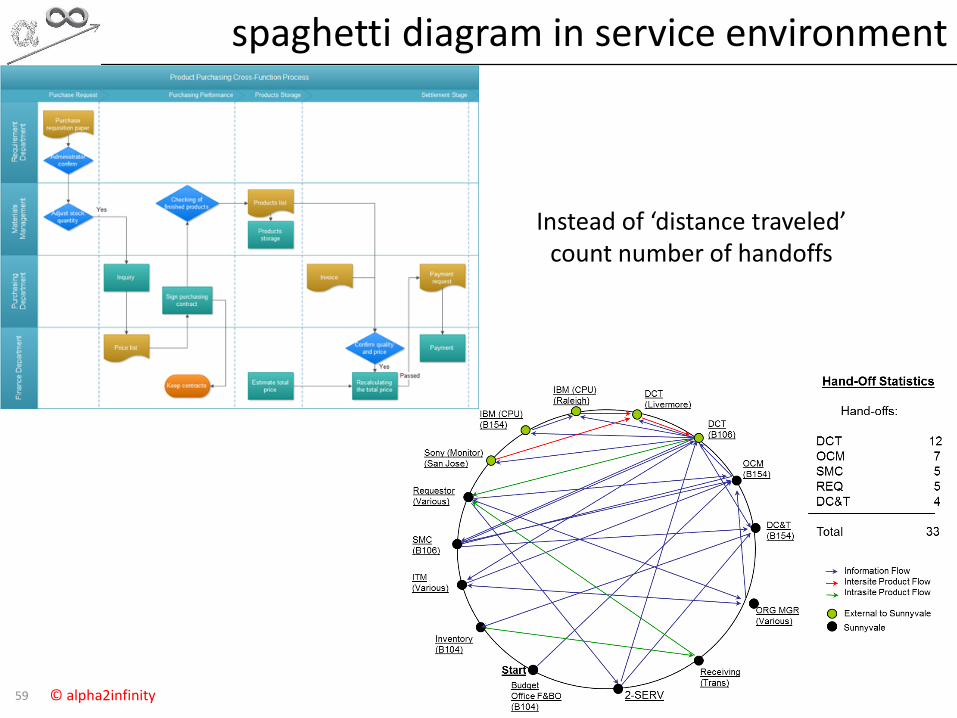
what is a spaghetti diagram?
A method of documenting actual flow of people and material through the factory
Helps visualize distances travelled and the number of stations that work has travelled.
Illustrates waste within the process
1. Become the Product2. Walk the process to construct
a Spaghetti Diagram3. Draw a line for every trip4. Color code to distinguish
different people / products5. Look for differences – by time
of day, person, etc.
59 © alpha2infinity
spaghetti diagram in service environment
Instead of ‘distance traveled’ count number of handoffs
60 © alpha2infinity
Cell Layout

61 © alpha2infinity
what is cell manufacturing?
Cellular configuration is a lean strategy used for building a variety of products with as little waste as possible
Benefits
• Produce high mix of products
• Produce in smaller lot sizes
• Increase utilization of labor
• Reduce waste (travel, defects, etc.)
• Reduced lead-time
• Self-managing teams of cross-trained employees
62 © alpha2infinity
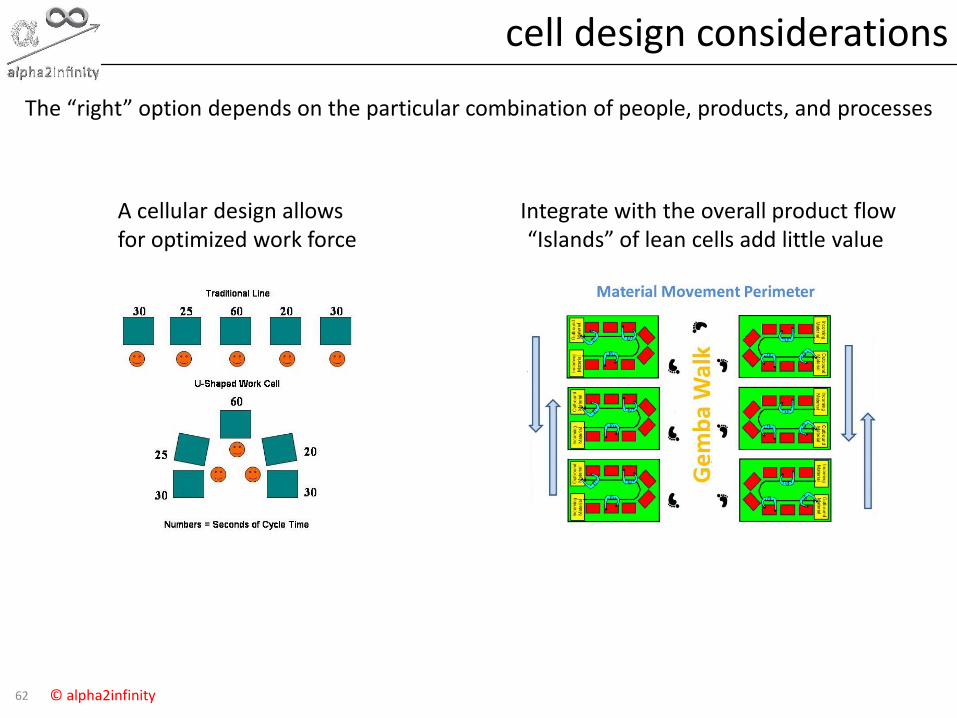
cell design considerations
The “right” option depends on the particular combination of people, products, and processes
Integrate with the overall product flow“Islands” of lean cells add little value
A cellular design allows for optimized work force

63 © alpha2infinity
cell design considerations
Can be applied to the ‘office’ environmentMost effective if ‘diversity’ is included
64 © alpha2infinity
SMED
65 © alpha2infinity
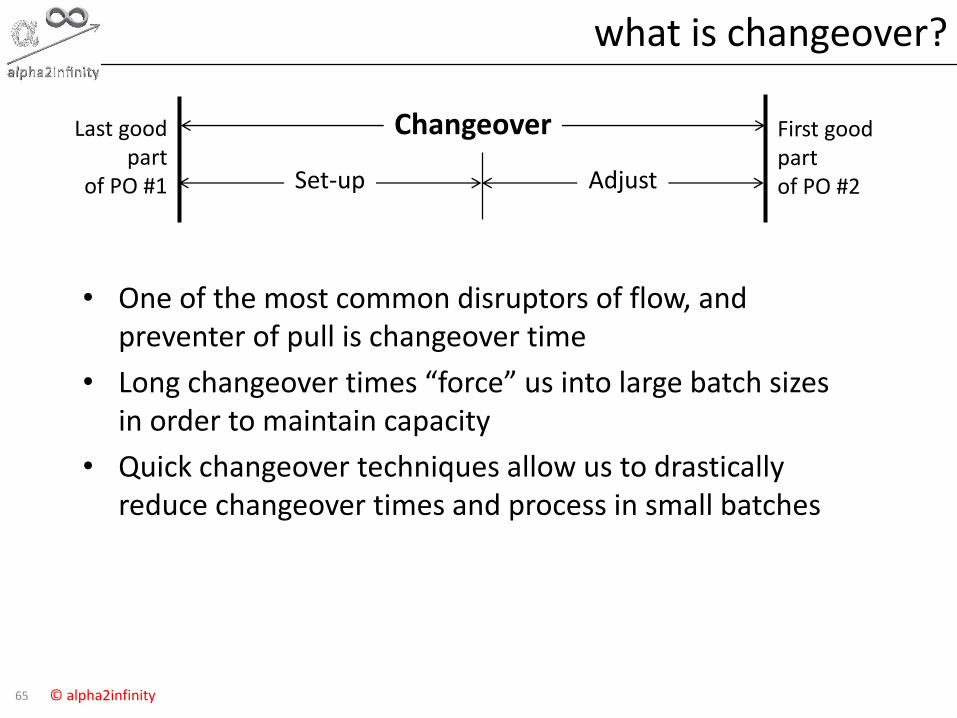
what is changeover?
• One of the most common disruptors of flow, and preventer of pull is changeover time
• Long changeover times “force” us into large batch sizes in order to maintain capacity
• Quick changeover techniques allow us to drastically reduce changeover times and process in small batches
Changeover
AdjustSet-up
Last good part
of PO #1
First good part of PO #2
66 © alpha2infinity
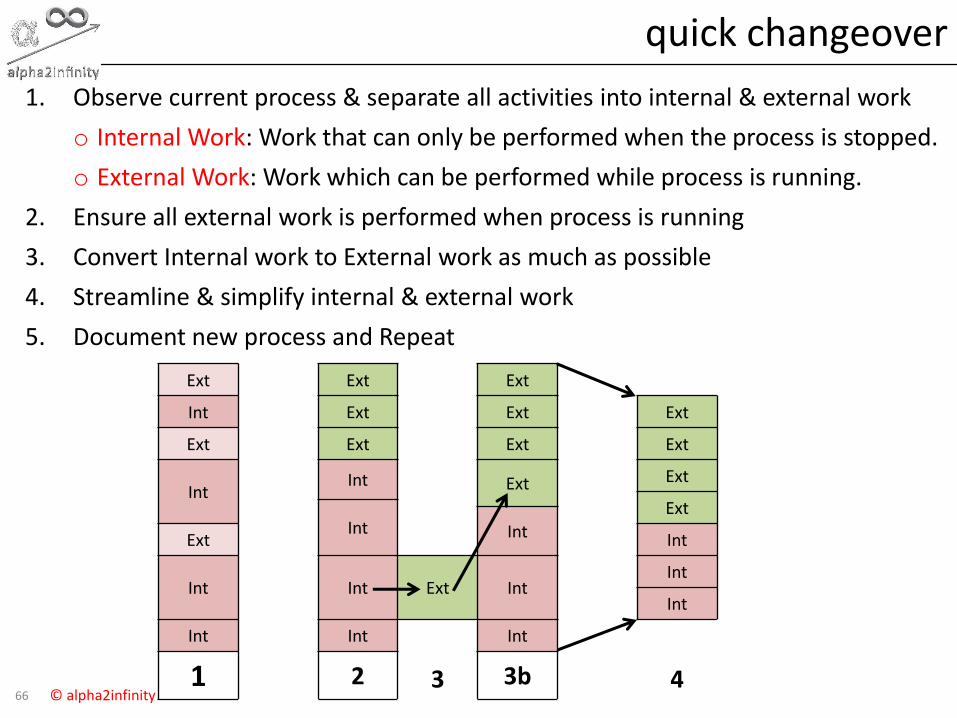
quick changeover
1. Observe current process & separate all activities into internal & external work
o Internal Work: Work that can only be performed when the process is stopped.
o External Work: Work which can be performed while process is running.
2. Ensure all external work is performed when process is running
3. Convert Internal work to External work as much as possible
4. Streamline & simplify internal & external work
5. Document new process and Repeat
Ext Ext Ext
Int Ext Ext Ext
Ext Ext Ext Ext
IntInt Ext Ext
ExtInt IntExt Int
Int Int Ext IntInt
Int
Int Int
3
Int
41 2 3b
67 © alpha2infinity
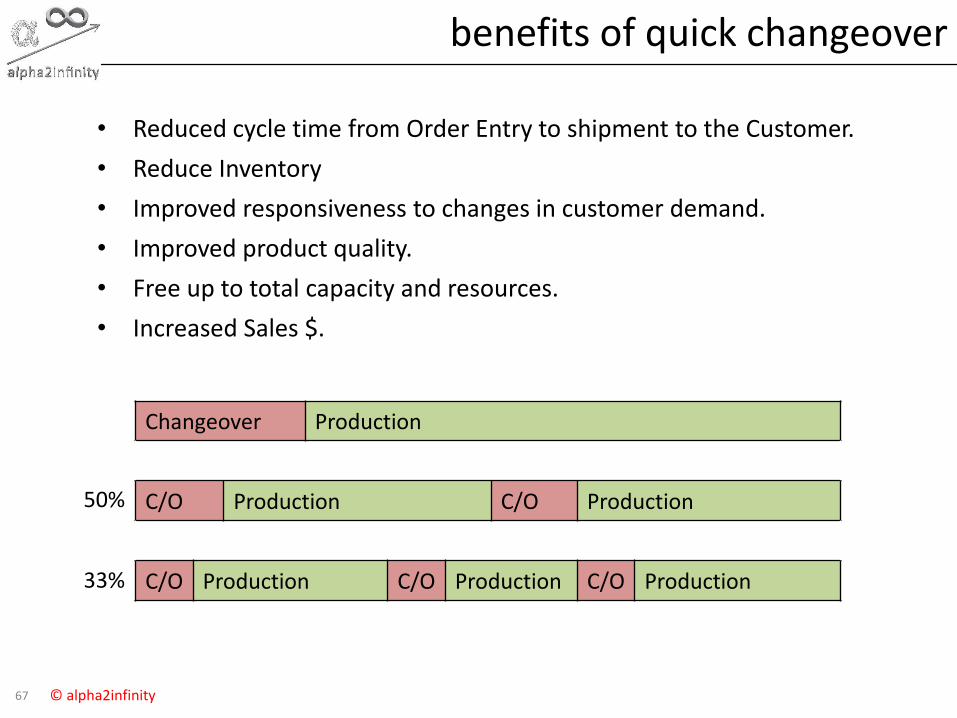
benefits of quick changeover
• Reduced cycle time from Order Entry to shipment to the Customer.
• Reduce Inventory
• Improved responsiveness to changes in customer demand.
• Improved product quality.
• Free up to total capacity and resources.
• Increased Sales $.
Changeover Production
C/O Production C/O Production
C/O Production C/O Production C/O Production
50%
33%
68 © alpha2infinity
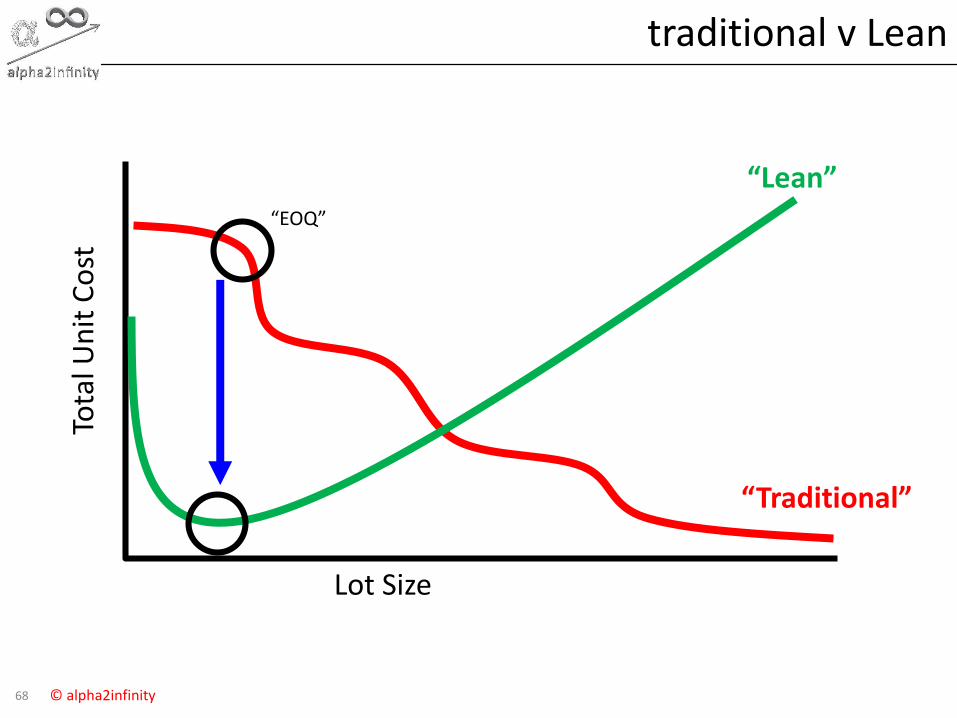
traditional v Lean
“Traditional”
“Lean”
Tota
l Un
it C
ost
Lot Size
“EOQ”
69 © alpha2infinity
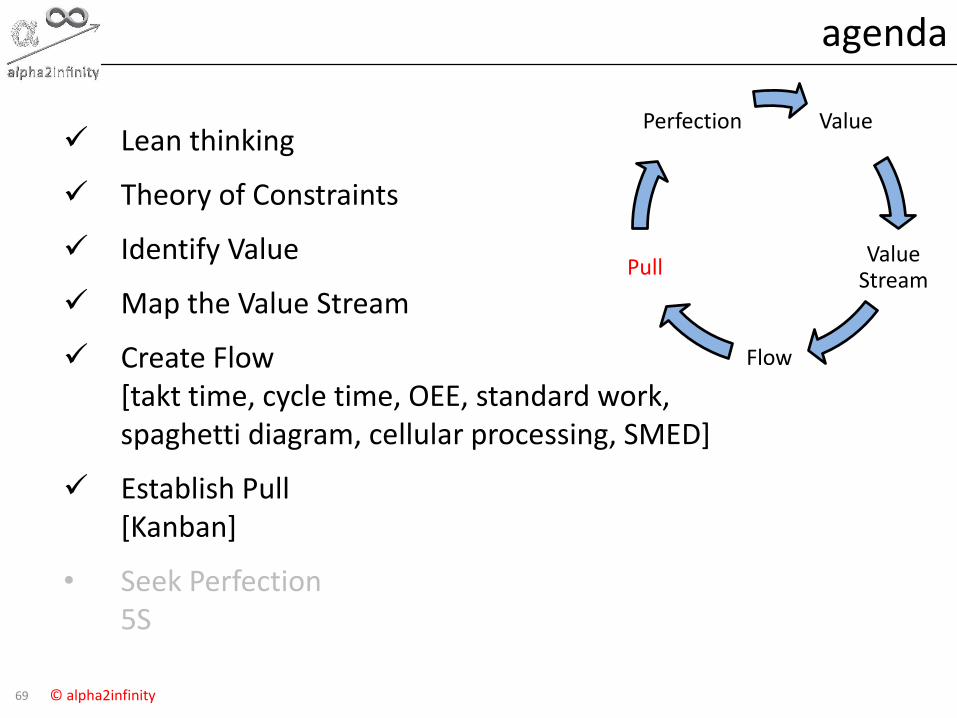
agenda
Lean thinking
Theory of Constraints
Identify Value
Map the Value Stream
Create Flow[takt time, cycle time, OEE, standard work, spaghetti diagram, cellular processing, SMED]
Establish Pull [Kanban]
• Seek Perfection5S
Value
Value Stream
Flow
Pull
Perfection
70 © alpha2infinity
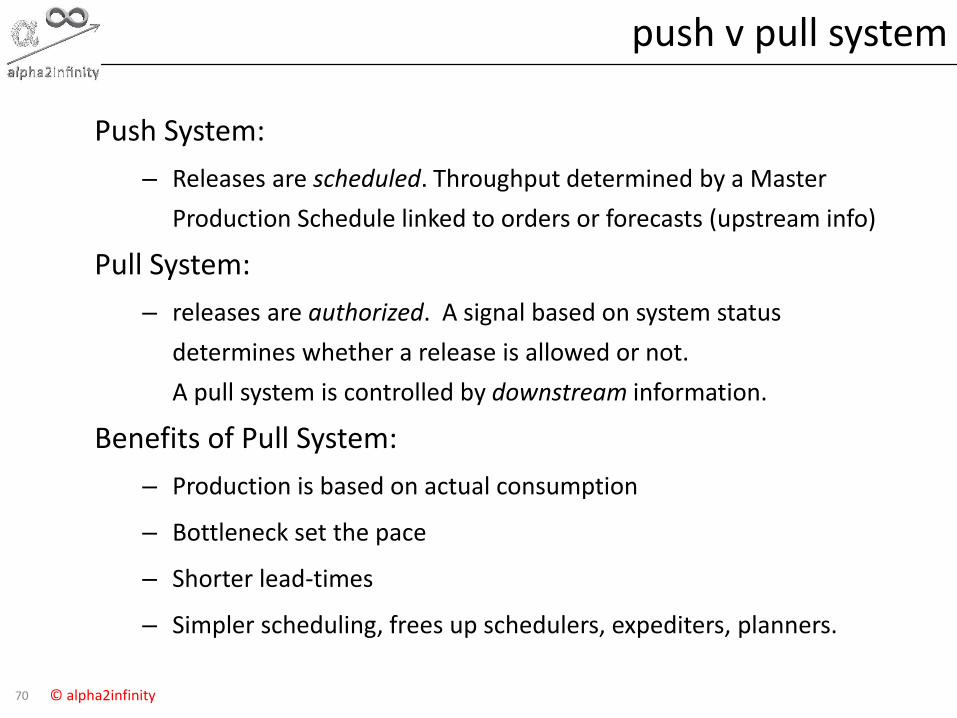
push v pull system
Push System:
– Releases are scheduled. Throughput determined by a Master
Production Schedule linked to orders or forecasts (upstream info)
Pull System:
– releases are authorized. A signal based on system status
determines whether a release is allowed or not.
A pull system is controlled by downstream information.
Benefits of Pull System:
– Production is based on actual consumption
– Bottleneck set the pace
– Shorter lead-times
– Simpler scheduling, frees up schedulers, expediters, planners.
71 © alpha2infinity
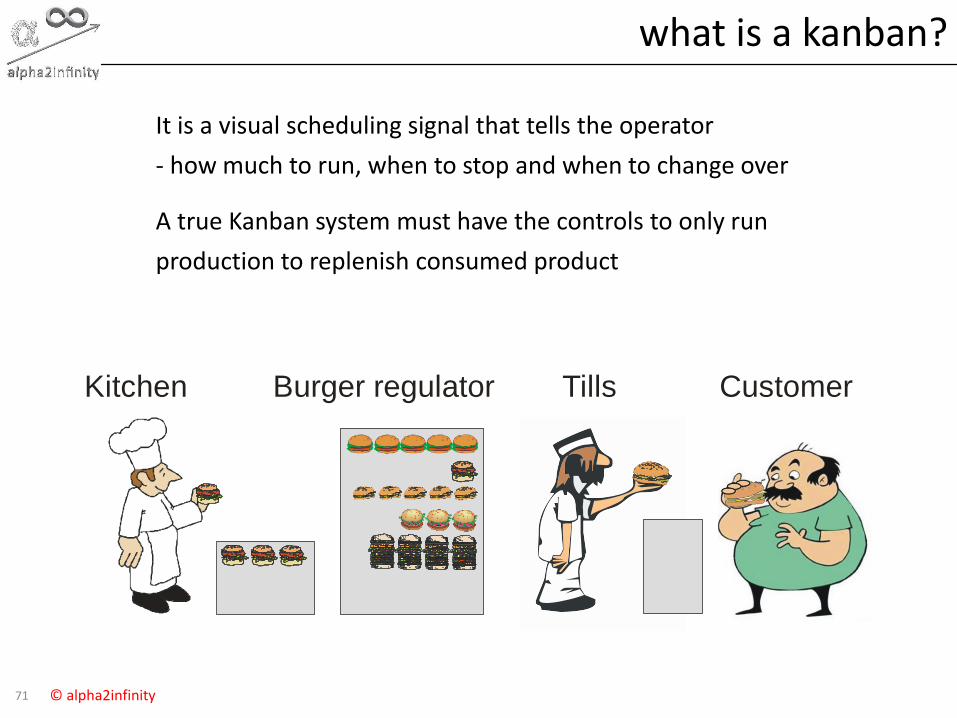
what is a kanban?
It is a visual scheduling signal that tells the operator
- how much to run, when to stop and when to change over
A true Kanban system must have the controls to only run
production to replenish consumed product
Kitchen Burger regulator Tills Customer
72 © alpha2infinity
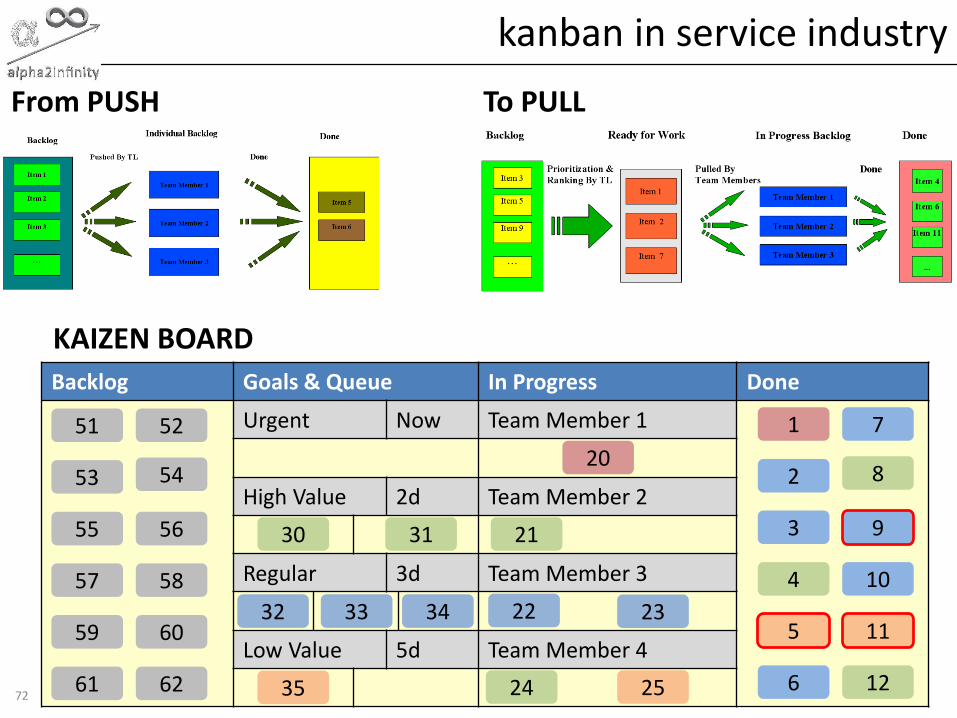
kanban in service industry
Backlog Goals & Queue In Progress Done
Urgent Now Team Member 1
High Value 2d Team Member 2
Regular 3d Team Member 3
Low Value 5d Team Member 4
30
51 52
53 54
55 56
57 58
59 60
61 62
20
31
35
1 7
2 8
3 9
4 10
5 11
6 12
32 33 34
21
22
24
23
25
KAIZEN BOARD
From PUSH To PULL

73 © alpha2infinity
VSM Current State
Customer
Process 1
Dept. A
Process T
Cycle T
# workers
FPY %
Process 2
Dept. A
Process T
Cycle T
# workers
FPY %
Process 3
Dept. B
Process T
Cycle T
# workers
FPY %
½ hr. 4 hr. 2 hr.2 d 1 d 8%
Info
rmat
ion
Flo
wM
ate
rial
(d
ata)
Flo
wTi
me
10
74 © alpha2infinity
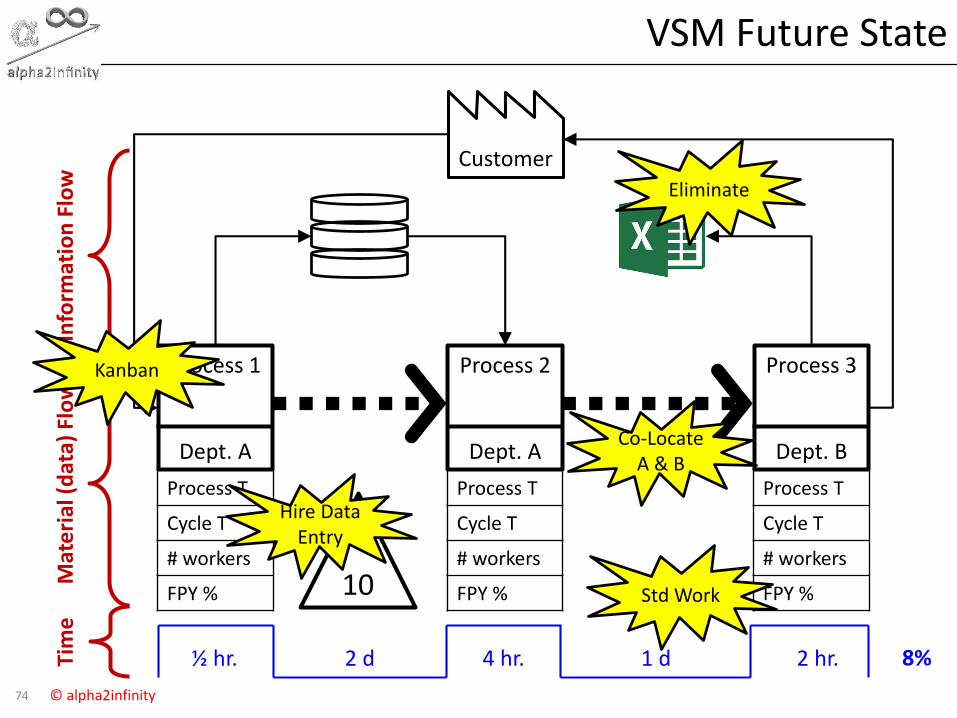
VSM Future State
Customer
Process 1
Dept. A
Process T
Cycle T
# workers
FPY %
Process 2
Dept. A
Process T
Cycle T
# workers
FPY %
Process 3
Dept. B
Process T
Cycle T
# workers
FPY %
½ hr. 4 hr. 2 hr.2 d 1 d 8%
Info
rmat
ion
Flo
wM
ate
rial
(d
ata)
Flo
wTi
me
Eliminate
Kanban
Std Work
Co-Locate A & B
10
Hire Data Entry
75 © alpha2infinity
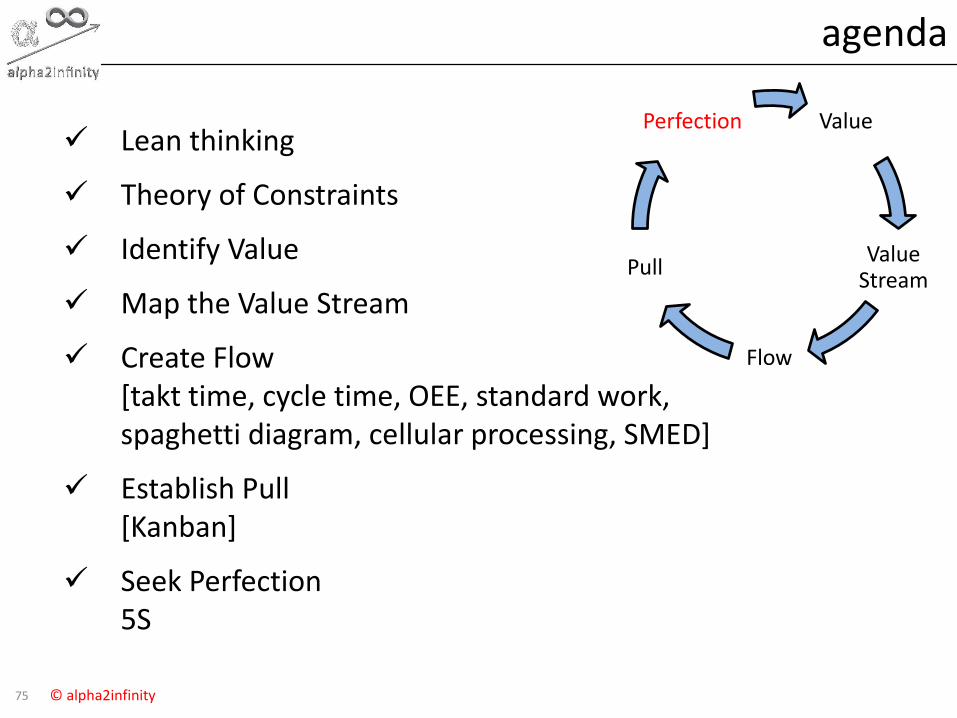
agenda
Lean thinking
Theory of Constraints
Identify Value
Map the Value Stream
Create Flow[takt time, cycle time, OEE, standard work, spaghetti diagram, cellular processing, SMED]
Establish Pull [Kanban]
Seek Perfection5S
Value
Value Stream
Flow
Pull
Perfection
76 © alpha2infinity
what is 5S?
Originally a Japanese methodology that describes how to organize a work space for efficiency and effectiveness by
identifying and storing the items, maintaining the area and items, and sustaining the new order.
Translated from Japanese as
"sort“, “set-in-order", "shine", "standardize" and "sustain“
Today “safety” & “security” are often added to this list
77 © alpha2infinity
5S benefits
1. Scrap Reduction
2. Productivity increases
3. Reduced set-up and change-over times
4. Lower maintenance costs, higher up-time
5. Less work-in-process and fewer supplies
6. Improved employee safety
7. Improved customer perception
78 © alpha2infinity
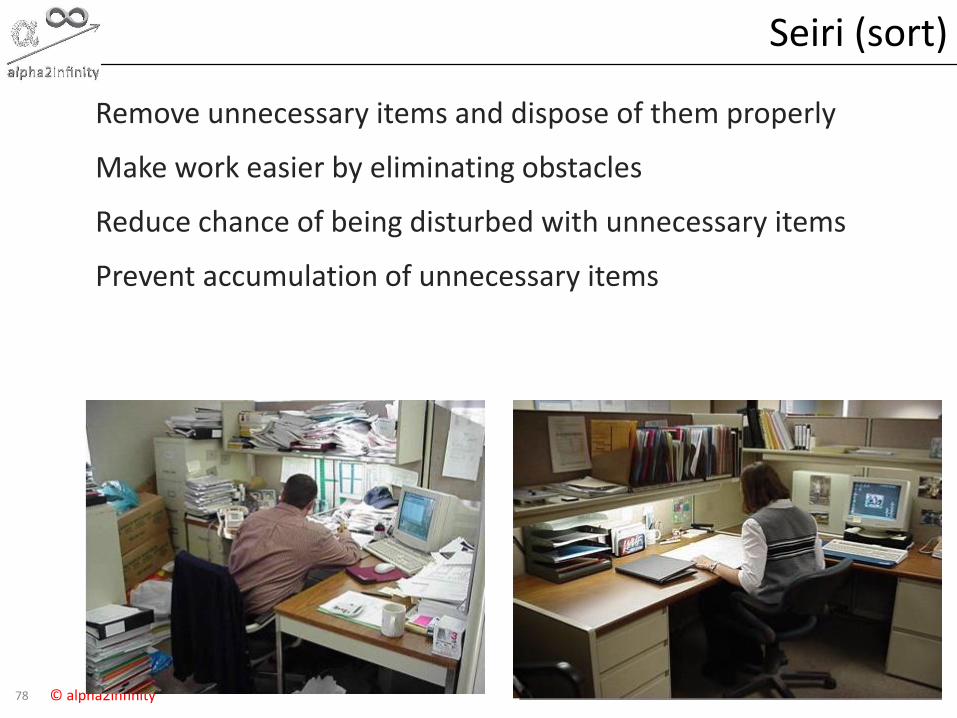
Seiri (sort)
Remove unnecessary items and dispose of them properly
Make work easier by eliminating obstacles
Reduce chance of being disturbed with unnecessary items
Prevent accumulation of unnecessary items

79 © alpha2infinity
Seiton (set in order)
Includes everything to get the work done
A place for everything & everything in its place
Make it easy to find and pick up necessary items
Things are marked so it is easy to know where they belong
Improves safety, cost, quality and working conditions

80 © alpha2infinity
something we can ALL 5S
81 © alpha2infinity
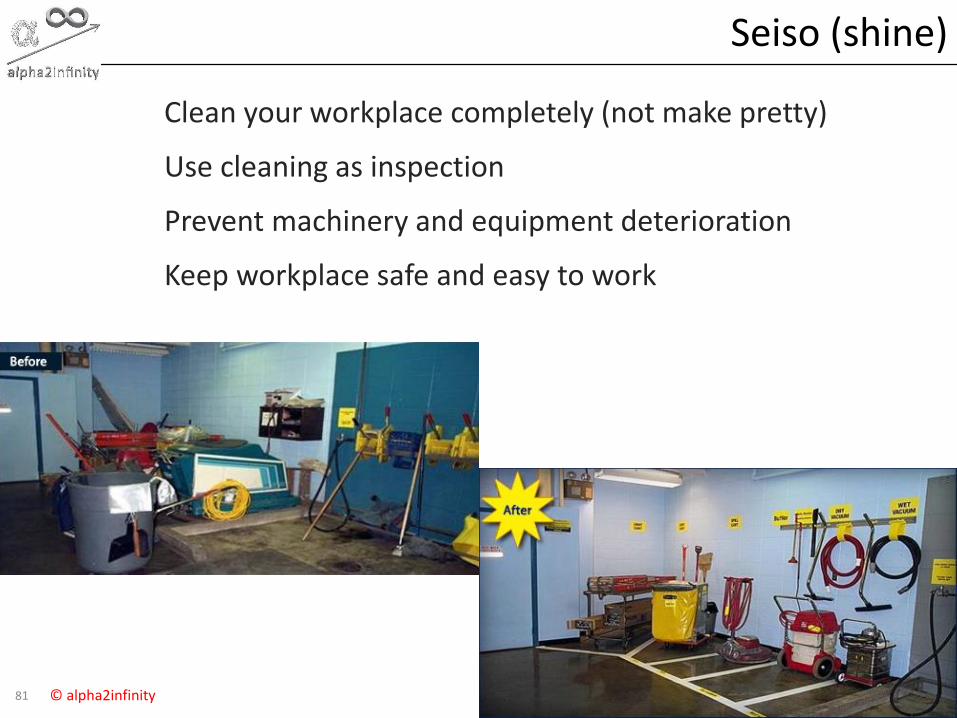
Seiso (shine)
Clean your workplace completely (not make pretty)
Use cleaning as inspection
Prevent machinery and equipment deterioration
Keep workplace safe and easy to work
82 © alpha2infinity
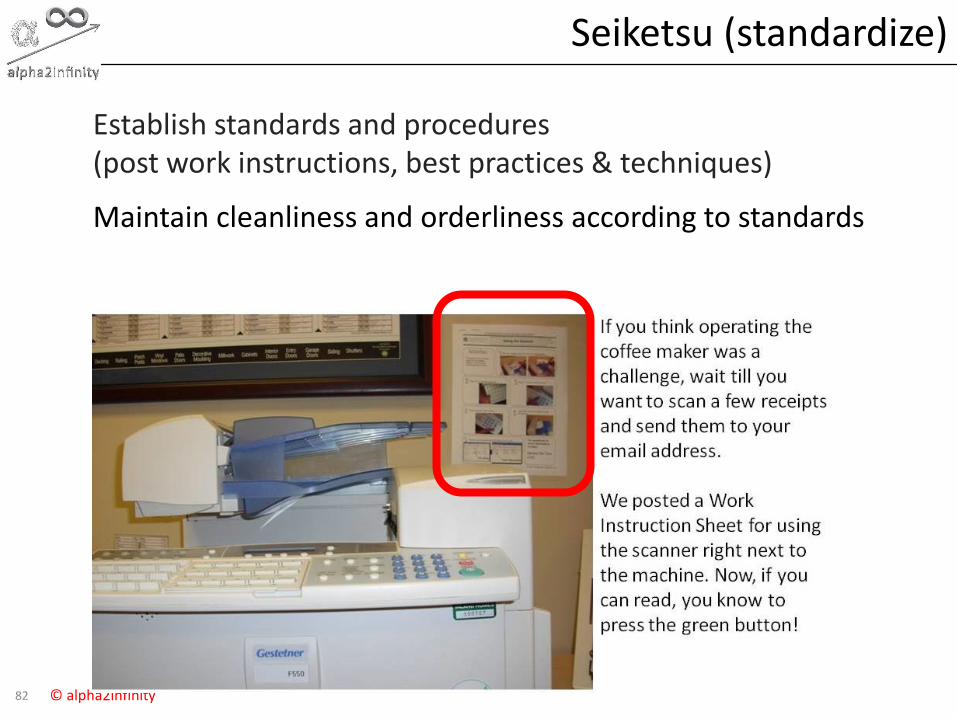
Seiketsu (standardize)
Establish standards and procedures (post work instructions, best practices & techniques)
Maintain cleanliness and orderliness according to standards
83 © alpha2infinity
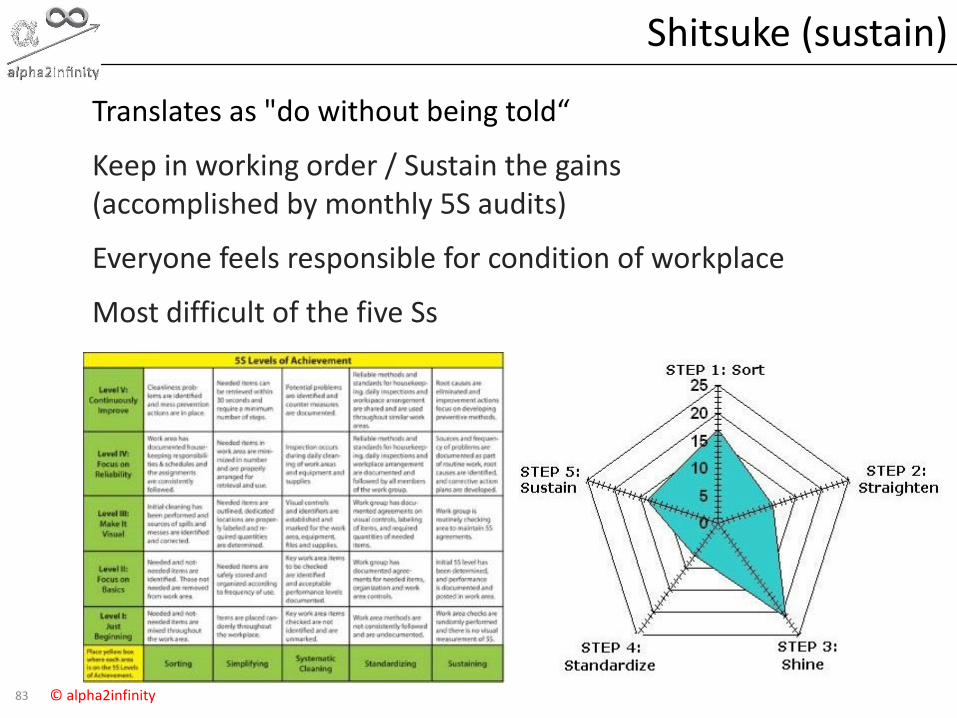
Shitsuke (sustain)
Translates as "do without being told“
Keep in working order / Sustain the gains(accomplished by monthly 5S audits)
Everyone feels responsible for condition of workplace
Most difficult of the five Ss