increasing the proportion and quality of land under agri
TRANSCRIPT

Contents lists available at ScienceDirect
Biological Conservation
journal homepage: www.elsevier.com/locate/biocon
Increasing the proportion and quality of land under agri-environmentschemes promotes birds and butterflies at the landscape scaleSilvia Zingga,b,⁎, Eva Ritscharda, Raphaël Arlettaza,c, Jean-Yves Humbertaa Division of Conservation Biology, Institute of Ecology and Evolution, University of Bern, 3012 Bern, Switzerlandb School of Agriculture, Forest and Food Sciences, Bern University of Applied Sciences, 3052 Zollikofen, Switzerlandc Swiss Ornithological Institute, Valais Field Station, 1950 Sion, Switzerland
A R T I C L E I N F O
Keywords:AgricultureAgricultural policyBiodiversity conservationFarmlandHabitat qualityLandscape compositionRestoration
A B S T R A C T
The intensification of agricultural practices that Western nations have experienced after World War II has led toan alarming decline in farmland biodiversity. With the aim of stopping and even reversing this decline, agri-environment schemes (AES) have been implemented in many European countries since the 1990s. InSwitzerland, farmers are required to manage at least 7% of their land in the form of biodiversity promotion areas(BPA), which are extensively managed, wildlife-friendly farmland habitats such as hay meadows and traditionalorchards. We investigated how the occurrence and characteristics of these BPA influence birds and butterflies inthe Swiss lowlands. Butterfly species richness and abundance increased by 22% and 60%, respectively, when theproportion of BPA in the landscape increased from 5% to 15%. Likewise, bird species richness increased, but to alesser extent, with the proportion of BPA in the landscape. For birds, the proportion of BPA characterized by ahigh ecological quality played a role in promoting both priority-farmland and red-listed species. For bothtaxonomic groups, the amount and quality of BPA habitats contributed more to species richness than their spatialconfiguration, connectivity included. This study shows that AES measures implemented at the field scale havepositive effects on mobile species that are noticeable at the landscape scale, and that the fraction of AES in thecultivated landscape matters more than their spatial configuration, which has strong implications for designingmulti-functional agro-ecosystems.
1. Introduction
Since the second half of the 20th century, agricultural practiceshave been considerably intensified, particularly in the Western Worldlowlands (Robinson and Sutherland, 2002). Agricultural intensificationincludes not only the increase of fertilizer and agrochemicals, but alsothe removal of natural structural landscape elements such as hedgesand waterbodies (Stoate et al., 2001). Consequently, the amount ofsemi-natural habitats has dramatically decreased over time, with a widerange of species typical of extensively-managed farmland being on thebrink of extinction in today's agroecosystems (Donald et al., 2006;Sutcliffe et al., 2015). As early as the 1990s, the European Union startedto implement agri-environment schemes (AES) with the objective tostop and reverse this decline of farmland biodiversity. AES financiallysupport farmers to adopt more environment-friendly managementpractices (e.g. organic farming) and to maintain or restore semi-naturalhabitats, such as hedgerows, field margins and traditionally managedgrasslands. Biodiversity promotion areas (BPA; formerly called
ecological compensation areas) are a major component of the Swiss AESpolicy. They have been introduced in 1993 by the Swiss government.Habitats typically falling under these BPA schemes are wildflowerstrips, hedges, high-stem orchards and extensively managed grasslands(i.e. with no fertilizer and pesticide application, see Table 1). BPAmeasures have to cover at least 7% of the land managed by a farmer andmust stay in place for a minimum of eight consecutive years (Bundesrat,2013). Despite high efforts and considerable flow of money into theseschemes, farmland biodiversity is still in a deep crisis in Switzerland, asit is throughout Western Europe (Fischer et al., 2015). The reasons ofthe low effectiveness of these schemes are manifold, for example: lackof spatial connectivity between AES measures (Arponen et al., 2013;Birrer et al., 2007), poor ecological quality of the measures and in-sufficient fraction of farmland under AES (Birrer et al., 2007; Kleijnet al., 2011). AES effectiveness has been mostly evaluated at a fieldscale, usually focusing on only one type of AES measure at a time(Batáry et al., 2015; but see Bright et al., 2015; Davey et al., 2010). Incontrast, wider-scale assessments of the effects of various types of
https://doi.org/10.1016/j.biocon.2018.12.022Received 7 June 2018; Received in revised form 7 December 2018; Accepted 16 December 2018
⁎ Corresponding author at: School of Agriculture, Forest and Food Sciences, Bern University of Applied Sciences, 3052 Zollikofen, Switzerland.E-mail address: [email protected] (S. Zingg).
Biological Conservation 231 (2019) 39–48
0006-3207/ © 2018 Elsevier Ltd. All rights reserved.
T

measures simultaneously implemented are still lacking although dis-tribution and population dynamics of many taxonomic groups are ruledby landscape processes rather than mere field-site conditions, notablydue to the habitat complementarity that organisms require to completetheir life cycle (e.g. Concepción and Díaz, 2011; Westphal et al., 2006).If the availability of digital maps of land use and AES measures has sofar represented a serious impediment to such landscape-scale analyses,recent technology developments opened new avenues for research onthe effects of AES at the landscape scale.
The main goal of this study was to investigate the influence of SwissAES (BPA) on bird and butterfly species richness and abundance at thelandscape scale. These two taxa were selected as model groups becausetheir life cycles mostly require habitat complementarity, thus operatingat a landscape scale (e.g. Concepción and Díaz, 2011). Seven differentlandscape-scale BPA properties were analysed: the proportion of BPA,the proportion of BPA with ecological quality according to Swiss agri-environmental policy standards (see Table 1), the BPA mean size, themean minimal distance between individual BPA, the diversity and theconfiguration of BPA. Besides these BPA-related variables, the widerlandscape composition, such as the proportion of forests and water-bodies in the landscape, was also considered. As former evaluationstudies, carried out at the field scale, have demonstrated enhancementof farmland biodiversity in response to AES measures (Batáry et al.,2015), we predicted, firstly, that positive effects of the proportion ofBPA on birds and butterflies should also be noticeable at the landscapescale (Henderson et al., 2012). Secondly, we predicted that BPA habitatquality, assessed through botanical diversity, promotes the two studytaxa (Aviron et al., 2011; Birrer et al., 2007). Our third prediction wasthat habitat fragmentation and distance between BPA can negativelyinfluence their effectiveness (Bailey et al., 2010; Knop et al., 2011) andcould play a role even in mobile species such as birds and butterflies(Krauss et al., 2003). Fourthly, the spatial association between differenttypes of BPA (e.g. hedges and extensively managed meadows) mayprovide complementary resources, meaning that BPA diversity mayhave a favourable effect that should be detectable at the landscape scale(Haynes et al., 2007). Beside these various and direct potential effectsof BPA, we also expected that the wider non-agricultural landscapeimpacts biodiversity. In particular, forests, hedges and water bodies arenatural features, among agroecosystems, known to promote biodi-versity (e.g. Diacon-Bolli et al., 2012; Zingg et al., 2018). Actually, theyprovide birds and butterflies with the necessary habitat com-plementarity, notably shelter, food supply and corridors for movement(e.g. Coulthard et al., 2016; Siriwardena et al., 2012). As our studyfocuses on the intensively-cultivated Swiss lowlands, its outcomes bearrelevance for other highly productive agricultural regions in Europeand may thus assist them in refining future agricultural policy.
2. Material and methods
2.1. Landscape selection
This study was conducted on the Swiss Plateau, a lowland regionsituated between the Alps and the Jura mountain ranges. It is the mostdensely populated region of Switzerland and characterized by high-intensity agriculture. The Biodiversity Monitoring Switzerland (BDM)conducts repeated biodiversity surveys, using a systematic samplinggrid with 520 landscapes of 1 km2 across Switzerland (BDMCoordination Office, 2014). For this study, 46 such 1 km2 squares wereselected in the Swiss lowlands (average elevation of 560m a.s.l., range:320–780m). Termed “landscapes”, the selected 1 km2 squares allstemmed from cantons for which digitalised maps of the BPA wereavailable. All selected landscapes had<25% cover of water bodies andimpervious areas, and at least 40% of utilized agricultural area (UAA).These study landscapes were at least 12 km apart and scattered acrossthe Swiss lowlands (Fig. 1).
2.2. Biodiversity
Data on species richness and abundance of birds and butterflies wasprovided by the Swiss Biodiversity Monitoring (BDM – Z7 indicator)and the Swiss Ornithological Institute (SOI – Monitoring programme forcommon breeding birds). All selected landscapes were surveyed once inthe years 2010–2014. Most bird surveys were carried out in 2014 (33out of 46), whereas butterfly counts were equally distributed over allfive sampling years. Surveys consisted of within-year repeated countsalong transects of 2.5 km, with 7 and 3 surveys a year for butterflies andbirds, respectively (BDM Coordination Office, 2014). Ornithologistsestimated number of breeding bird territories based on their field ob-servations, while butterfly specialists counted numbers of individuals,at the species or species-complex level. Note that for large groups ofbutterflies (> 20 individuals), abundance was estimated in a semi-quantitative way (21–40, 41–100 and>100).
Butterfly and bird species were classified into four main groups:total, farmland, AEO priority and red listed species (see Table S1 andS2). The so-called AEO priority species include the target and indicatorspecies defined within the framework of the agriculture-related en-vironmental objectives by the federal offices of environment and agri-culture (Walter et al., 2013). These species are currently the focus ofnational farmland conservation programmes. Our red-listed speciesbelong to the categories near threatened, vulnerable, or critically en-dangered sensu IUCN criteria (Keller et al., 2010; Wermeille et al.,2014).
In an attempt to gain information on the effect of AES on ecosystem
Table 1Description and occurrence of the biodiversity promotion areas (BPA) present in the 46 study landscapes. BPA remain in general for eight consecutive years on thesame field. Exceptions are BPA on arable land (e.g. wildflower strips) where the farmer can change the location every 1 or 2 years.
BPA type Management requirements and quality criteria Mean area (± SD) perUAA [%]
Extensively managed meadows At least one cut per year, first cut not before 15 June. No fertilizer and pesticide use (except single plantapplication). Quality: At least six indicator plant species.
6.3 (± 4.7)
Orchards Fruit, walnut and chestnut trees, with a minimal stem height of 1.20/1.60m. Quality: 30–100 trees/ha,> 0.2 ha with > 10 trees, in combination with another BPA within 50m.
1.9 (± 2.2)
Less intensively managed meadows At least one cut per year, first cut not before 15 June. Fertilization with 30 kg N/ha/year in form of solidmanure is allowed, no pesticide use (except single plant application). Quality: At least six indicator plantspecies.
0.7 (± 1.5)
Extensively managed pastures At least one use per year. No fertilizer and pesticide use (except single plant application) allowed. Quality: Atleast six indicator plant species and/or structural elements.
0.6 (± 1.3)
Litter meadows First cut not before 1 September. No fertilizer and pesticide use allowed. Quality: At least six indicator plantspecies.
0.5 (± 1.9)
Hedges Hedges with vegetated buffer strips of 3–6m width. Quality: Only native species, > 2m width, > 5 tree/shrub species per 10m length, > 20% of thorny shrubs or one native tree every 30m.
0.4 (± 0.5)
Wildflower strips Sown wildflower strips on arable land without pesticide and fertilizer. 0.4 (± 1.6)Field margins Extensively managed field margins from arable crops without pesticide and fertilizer. 0.1 (± 0.2)
S. Zingg et al. Biological Conservation 231 (2019) 39–48
40

functionality (beyond species richness), we first classified butterfliesinto specialists or generalists, with specialists being resident specieswith a mono- or oligophagous diet (caterpillars feeding on a single plantspecies, genus or family) and a maximum of two generations per year(see also Bruppacher et al., 2016). We derived life-history traits forbutterfly species from (Settele et al., 1999). Second, we grouped birdsinto functional groups, or guilds, according to their foraging andnesting characteristics: granivorous, insectivorous, carnivorous (i.e.raptors preying mostly on small mammals and birds) and omnivorousspecies; building breeders, cavity breeders (nesting in artificial or nat-ural cavities), ground breeders, hedge/tree breeders (nesting above-ground in wooden structures, i.e. outside tree cavities) and reed bree-ders (Tables S1 and S2).
2.3. BPA and land-use
Land-use maps were obtained from the Swiss cadastral survey of2014 (Swisstopo). We derived the proportions of utilized agriculturalarea (UAA), forests, hedges, waterbodies, impervious surfaces, vege-tated and non-vegetated areas per landscape. Maps of BPA were pro-vided by the cantonal agricultural offices for 2013 and 2014. Fromthem, we could extirpate seven BPA properties for every study land-scape: 1) total area of BPA within the 1 km2; 2) proportion of BPA perUAA; 3) mean BPA size; 4) proportion of BPA with ecological qualityper UAA; 5) mean distance between BPA; 6) BPA diversity and 7) meanBPA perimeter area ratio (PAR). We used the two-dimensional pro-jected areas to calculate properties 1–3. Property 4 refers to the eco-logical quality criteria as defined by the Swiss Ordinance on DirectPayments, which comprise both the presence of particular indicatorplant species and a diversified vegetation structure (see Table 1). Meandistance between BPA (property 5) was defined as the mean minimaldistance to the nearest BPA. Property 6 corresponds to a Shannon di-versity index calculated from the various types of BPA found within a 1-km2 landscape square:
= ×=
BPA diversity p pln( )i
N
i i1
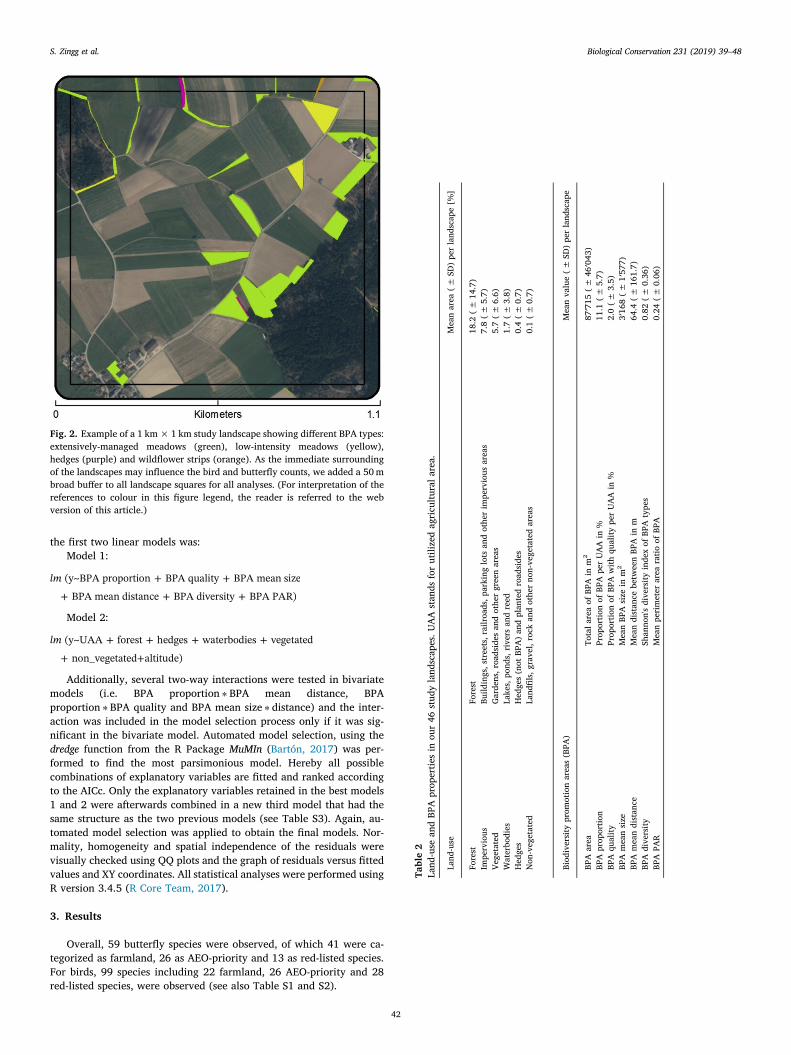
where N is the total number of BPA types and pi the proportion of theBPA type i in the landscape square. Property 7 was calculated as themean perimeter area ratio (PAR) of the BPAs and is a measure for theconfigurational heterogeneity of the BPAs within a landscape (Perovićet al., 2015). All spatial analyses were conducted in ArcGIS (Version10.2.2) with a buffer of 50m added to each landscape square of 1 km2
(Fig. 2). Detailed information on all BPA types can be found in Table 1(see also Caillet-Bois et al., 2018).
2.4. Data analysis
Species richness and abundance of all, farmland, AEO priority andRed List birds and butterflies and different functional groups and guildswere used as response variables in the models. Functional bird groupswere only analysed if they included at least 20 species. To meet modelassumptions regarding normal distribution of residuals, abundance offarmland (only birds), AEO priority and red-listed birds and butterflieshad to be log-transformed. Correlations between all explanatory vari-ables were assessed using Pearson's correlation coefficient (rs). Strongpositive correlations (rs≥ 0.7) were found between the total area ofBPA and the proportion of BPA per UAA (rs= 0.91), total area of BPAwith ecological quality and BPA with quality per UAA (rs= 0.99) and,finally, the proportion of impervious (e.g. settlements, roads) and ve-getated areas (e.g. gardens, vegetated roadsides). Therefore, total areaof BPA, total area of BPA with ecological quality and impervious areaswere excluded from the modelling process (Table 2). A three-step modelselection approach adapted from Potts et al. (2009) was then applied.Three different model sets were fitted using linear models: Model 1included all BPA-related variables and Model 2 included all land-userelated variables and altitude. Altitude was added to account for cli-matic differences between the landscapes, potentially influencing thebiodiversity indicators (Mac Nally et al., 2003). The general formula of
Fig. 1. Map of Switzerland with the 46 1-km2 selected study landscapes.
S. Zingg et al. Biological Conservation 231 (2019) 39–48
41
the first two linear models was:Model 1:
+ ++ + +
lm (y~BPA proportion BPA quality BPA mean sizeBPA mean distance BPA diversity BPA PAR)
Model 2:
+ + + ++ +
lm (y~UAA forest hedges waterbodies vegetatednon_vegetated altitude)
Additionally, several two-way interactions were tested in bivariatemodels (i.e. BPA proportion ∗ BPA mean distance, BPAproportion ∗ BPA quality and BPA mean size ∗ distance) and the inter-action was included in the model selection process only if it was sig-nificant in the bivariate model. Automated model selection, using thedredge function from the R Package MuMIn (Bartón, 2017) was per-formed to find the most parsimonious model. Hereby all possiblecombinations of explanatory variables are fitted and ranked accordingto the AICc. Only the explanatory variables retained in the best models1 and 2 were afterwards combined in a new third model that had thesame structure as the two previous models (see Table S3). Again, au-tomated model selection was applied to obtain the final models. Nor-mality, homogeneity and spatial independence of the residuals werevisually checked using QQ plots and the graph of residuals versus fittedvalues and XY coordinates. All statistical analyses were performed usingR version 3.4.5 (R Core Team, 2017).
3. Results
Overall, 59 butterfly species were observed, of which 41 were ca-tegorized as farmland, 26 as AEO-priority and 13 as red-listed species.For birds, 99 species including 22 farmland, 26 AEO-priority and 28red-listed species, were observed (see also Table S1 and S2).
Fig. 2. Example of a 1 km×1 km study landscape showing different BPA types:extensively-managed meadows (green), low-intensity meadows (yellow),hedges (purple) and wildflower strips (orange). As the immediate surroundingof the landscapes may influence the bird and butterfly counts, we added a 50mbroad buffer to all landscape squares for all analyses. (For interpretation of thereferences to colour in this figure legend, the reader is referred to the webversion of this article.)
Table2
Land-useandBPApropertiesinour46
studylandscapes.U
AAstandsforutilizedagriculturalarea.
Land-use
Meanarea
(±SD)perlandscape[%]
Forest
Forest
18.2(±
14.7)
Impervious
Buildings,streets,railroads,parking
lotsandotherimpervious
areas
7.8(±
5.7)
Vegetated
Gardens,roadsidesandothergreenareas
5.7(±
6.6)
Waterbodies
Lakes,ponds,riversandreed
1.7(±
3.8)
Hedges
Hedges(notBPA)andplantedroadsides
0.4(±
0.7)
Non-vegetated
Landfils,gravel,rockandothernon-vegetatedareas
0.1(±
0.7)
Biodiversityprom
otionareas(BPA)
Meanvalue(±
SD)perlandscape
BPAarea
TotalareaofBPAinm2
87′715
(±46′043)
BPAproportion
ProportionofBPAperUAAin%
11.1(±
5.7)
BPAquality
ProportionofBPAwith
quality
perUAAin%
2.0(±
3.5)
BPAmeansize
MeanBPAsizeinm2
3′168(±
1′577)
BPAmeandistance
MeandistancebetweenBPAinm
64.4(±
161.7)
BPAdiversity
Shannon'sdiversity
indexofBPAtypes
0.82
(±0.36)
BPAPAR
Meanperimeterarea
ratio
ofBPA
0.24
(±0.06)
S. Zingg et al. Biological Conservation 231 (2019) 39–48
42
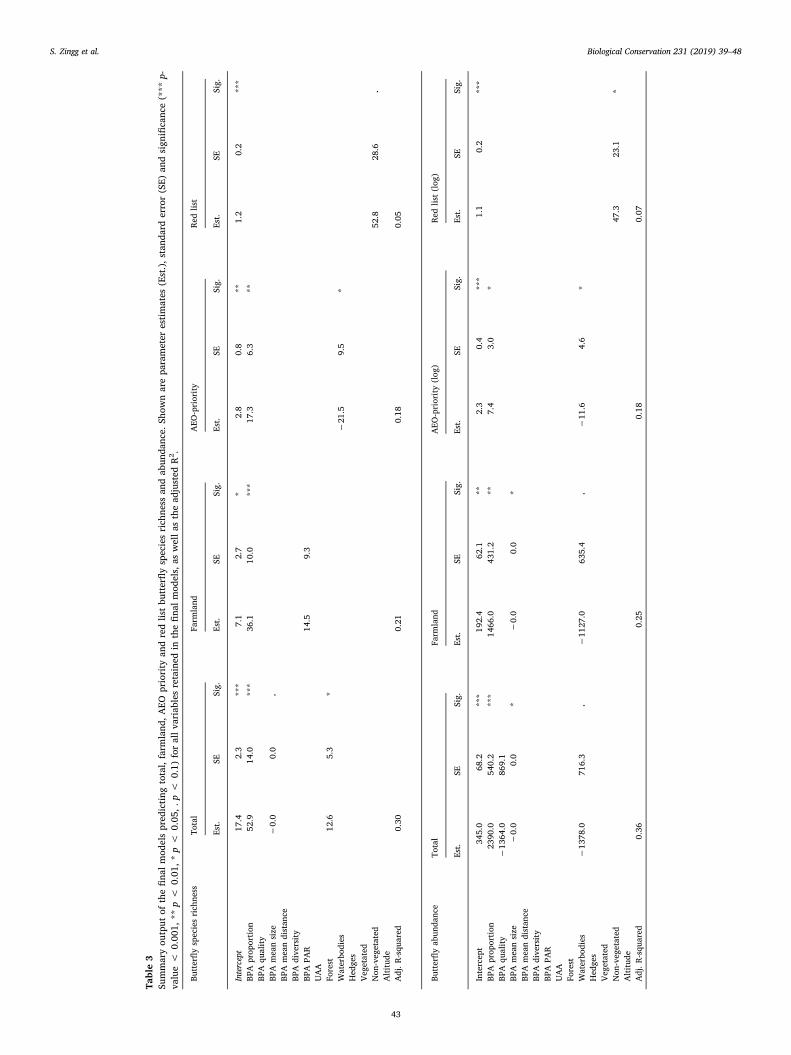
Table3
Summaryoutputofthefinalmodelspredictingtotal,farmland,A
EOpriorityandredlistbutterfly
speciesrichnessandabundance.Show
nareparameterestim
ates(Est.),standard
error(SE)
andsignificance(***p-
value<
0.001,**p<
0.01,*
p<
0.05,.p<
0.1)forallvariablesretained
inthefinalmodels,aswellastheadjusted
R2.
Butterfly
speciesrichness
Total
Farmland
AEO
-priority
Redlist
Est.
SESig.
Est.
SESig.
Est.
SESig.
Est.
SESig.
Intercept
17.4
2.3
***
7.1
2.7
*2.8
0.8
**1.2
0.2
***
BPAproportion
52.9
14.0
***
36.1
10.0
***
17.3
6.3
**BPAquality
BPAmeansize
−0.0
0.0
.BPAmeandistance
BPAdiversity
BPAPAR
14.5
9.3
UAA
Forest
12.6
5.3
*Waterbodies
−21.5
9.5
*Hedges
Vegetated
Non-vegetated
52.8
28.6
.Altitude
Adj.R-squared
0.30
0.21
0.18
0.05
Butterfly
abundance
Total
Farmland
AEO
-priority
(log)
Redlist(log)
Est.
SESig.
Est.
SESig.
Est.
SESig.
Est.
SESig.
Intercept
345.0
68.2
***
192.4
62.1
**2.3
0.4
***
1.1
0.2
***
BPAproportion
2390.0
540.2
***
1466.0
431.2
**7.4
3.0
*BPAquality
−1364.0
869.1
BPAmeansize
−0.0
0.0
*−0.0
0.0
*BPAmeandistance
BPAdiversity
BPAPAR
UAA
Forest
Waterbodies
−1378.0
716.3
.−1127.0
635.4
.−11.6
4.6
*Hedges
Vegetated
Non-vegetated
47.3
23.1
*Altitude
Adj.R-squared
0.36
0.25
0.18
0.07
S. Zingg et al. Biological Conservation 231 (2019) 39–48
43

The main land-use types in the landscapes were farmland and forest(Table 2). On average (mean ± SD), 11% (±6) of the farmland (UAA)was managed as BPA, which equates to 8.8 ha (± 4.6) per landscapesquare. The most common BPA types were extensively-managed mea-dows and traditional high-stem orchards (Table 1). The proportion ofBPA with ecological quality was very low and accounted for only 2%(±4%) of the UAA. Two landscapes were outstanding, with BPA ex-hibiting ecological quality covering 16% and 18% of the farmland area,respectively.
3.1. Effects of BPA and land-use on butterflies
The best models predicting total, farmland and AEO-priority but-terfly species richness and abundance always included the proportion ofBPA per UAA, which had a significant positive effect (Table 3 andFig. 3). An increase of the BPA fraction of UAA from 5% to 15% wasaccompanied, on average, by an additional 5 butterfly species (+22%,from an average of 23 species per landscape) and by an increase of 242individuals (+60%, from an average abundance of 409 individuals perlandscape). The same trends were found for generalist butterflies (45
Fig. 3. Relationships between species richness and abundance of different butterfly (a-d) and bird groups (e-f) vs the proportion of BPA per UAA. The so-called AEO-priority species include the target and indicator species defined within the framework of the agriculture-related environmental objectives. Partial residuals andpredictions with 95% confidence intervals from the final model are shown.
S. Zingg et al. Biological Conservation 231 (2019) 39–48
44

Table4
Summaryoutput
ofthefinalmodelspredictingtotal,farmland,AEO
priorityandredlistbird
speciesrichnessandabundance.Show
nareparameterestim
ates
(Est.),
standard
error(SE)
andsignificance(***
p-value<
0.001,**
p<
0.01,*
p<
0.05,p
<0.1),forallvariablesretained
inthefinalmodels,aswellastheadjusted
R2.
Birdspeciesrichness
Total
Farmland
AEO
-priority
Redlist
Est.
SESig.
Est.
SESig.
Est.
SESig.
Est.
SESig.
Intercept
29.2
2.0
***
3.7
1.0
***
4.6
0.6
***
−0.6
1.2
BPAproportion
37.3
13.7
**12.7
5.3
*BPAquality
19.0
5.6
**17.8
8.8
*17.1
6.7
*BPAmeansize
BPAmeandistance
BPAdiversity
BPAPAR
UAA
5.6
1.4
***
4.1
1.7
*Forest
19.7
5.4
***
Waterbodies
55.6
21.3
*26.4
7.2
***
28.9
6.2
***
Hedges
349.8
115.1
**90.6
27.6
**103.2
38.9
*159.2
33.1
***
Vegetated
Non-vegetated
54.0
27.4
.Altitude
Adj.R-squared
0.44
0.40
0.54
0.61
Birdabundance
Total
Farmland
(log)
AEO
-priority
(log)
Redlist(log)
Est.
SESig.
Est.
SESig.
Est.
SESig.
Est.
SESig.
Intercept
564.8
73.4
***
3.9
0.2
***
3.9
0.4
***
3.0
0.5
***
BPAproportion
−0.04
1.2
BPAquality
−16.8
7.5
*4.4
2.1
*5.4
3.5
BPAmeansize
BPAmeandistance
BPAdiversity
BPAPAR
−4.0
1.9
*BPAprop.∗BPAquality
87.3
33.4
*UAA
−417.6
106.5
***
Forest
−0.8
0.4
*Waterbodies
7.4
3.1
*Hedges
4572.2
2026.3
*Vegetated
−2.2
1.1
.Non-vegetated
Altitude
−0.0
0.0
*Adj.R-squared
0.32
0.20
0.21
0.19
S. Zingg et al. Biological Conservation 231 (2019) 39–48
45

species), but regarding specialist butterflies (14 species) only abun-dance responded positively to the fraction of BPA in the landscape(Table S4). Other BPA properties (ecological quality, size, distance,diversity or spatial BPA configuration) showed no significant effects. Asfor land-use variables, the only significant (positive) correlation wasbetween total butterfly species richness and the area of forest.
3.2. Effects of BPA and land-use on birds
Total bird species richness showed a positive correlation with theproportion of BPA, whereas farmland, AEO-priority and red-listedspecies richness increased also with the proportion of BPA with ecolo-gical quality (Table 4 and Fig. 3). An increase in the proportion of BPAfrom 5% to 15% led to a predicted increase of 4 bird species (or 10%),from an average of 39 per landscape. Similarly, an increase in theproportion of BPA with ecological quality from 0% to 5% led to apredicted increase of farmland species richness by 1 species (or 13%)from an average of 8. There was a significant interaction between theeffect of BPA proportion and BPA quality on farmland bird abundance;the higher the proportion of BPA with quality, the stronger the positiveeffect of increasing BPA proportion was. However, the positive effect ofBPA with ecological quality was strongly influenced by the two out-standing study landscapes harbouring high proportions of BPA withquality (Fig. 3f). When these two landscapes were excluded from theanalyses, the proportion of BPA with quality had no significant effect onbird species richness anymore.
The analysis furthermore revealed that species richness of hedge/tree and cavity breeders were positively correlated with the proportionof BPA. The abundance of the different functional groups and guilds didnot significantly change with respect to BPA-related variables, but onlywith some land-use variables: the abundance of insectivorous birdsincreased with the proportion of forest, while the abundance of omni-vorous birds increased with the proportion of UAA within the landscape(Table S5).
4. Discussion
Biodiversity promotion areas (BPA) are wildlife-friendly managedfarmland habitats such as semi-natural grasslands, high-stem orchardsand wildflower strips that form part of the Swiss AES. This study con-ducted in 46 1-km2 landscapes across the Swiss lowlands is one of thefirst carried out at the landscape scale that disentangles the effects oflandscape composition (e.g. proportion of forests or farmland) and BPAavailability on biodiversity. It shows that BPA have broad-scale positiveeffects on birds and butterflies. As bird and butterfly surveys wereconducted along transects that were not specifically located to recordthe fauna of the BPA areas themselves, these findings are likely tomirror the general biodiversity response to BPA in the wider modernSwiss lowland landscape, and not just local aggregations around BPAmeasures. We therefore conclude that the increased number of speciesand individuals were not due to concentration effects (attraction ofindividuals) but due to population level responses (see Le Féon et al.,2013).
4.1. Effects of BPA and land-use on butterflies
The proportion of BPA in the landscape proved to be the most im-portant property of this Swiss AES measure for butterfly species rich-ness and abundance. This was regardless of BPA quality, size, distance,diversity, configuration, and landscape composition. Total, farmlandand AEO-priority butterfly species were all positively correlated withthe proportion of BPA. Most butterflies depend on grassland habitats,especially flower-rich meadows that offer variegated plant hosts andnectar sources. They are therefore favoured by low-input managementpractices (Ekroos and Kuussaari, 2012) as typically encountered amongBPA meadows. Extensively-managed and low-intensity BPA meadows
account for 63% of all BPA fields in our study landscapes. It is thus notsurprising that butterflies showed such a strong response to the im-plementation of BPA at the landscape scale. If a positive effect of ex-tensively-managed grasslands and wildflower strips was already de-monstrated at the field scale (e.g. Aviron et al., 2011), the present studyis the first to establish clear effects at the wider landscape scale. Inaddition, we found that increasing the proportion of BPA promotesexisting population of butterfly specialists by increasing their abun-dance. Specialist species are known to be strongly affected by agri-culture intensification, such as landscape simplification and habitatfragmentation (Ekroos et al., 2010), it is therefore important that agri-environment schemes support this group (see also Bruppacher et al.,2016; Krauss et al., 2003). In contrast, red-listed butterflies were almostabsent (on average only 1 ± 1 species) in our study landscapes andthus don't seem to benefit from BPA, probably because most needspecies-specific habitat restoration measures (Kleijn et al., 2006).
4.2. Effects of BPA and land-use on birds
The proportion of BPA in the landscape as well as their ecologicalquality were the two main drivers of bird species richness in theotherwise fairly intensively-cultivated Swiss lowlands, which is in linewith previous findings (Baker et al., 2012; Prince and Jiguet, 2013).Birds in general and hedge/tree, or cavity breeding species particularlyprofit from AES-BPA measures such as extensively managed meadowsor hedges (see also Bright et al., 2015; Zellweger-Fischer et al., 2018).BPA and natural areas increase the functional heterogeneity of thecultivated landscape, which is likely to provide a better habitat com-plementarity for accomplishing the different phases of bird life cycle(Fahrig et al., 2011). For example, extensively-managed grasslandsprovide invertebrate prey supplies for insectivores while hedges andhigh-stem orchards provide nesting sites. The benefits of farmland ha-bitat heterogeneity for enriching bird communities became evidentwhen land-use properties beyond AES-BPA measures were accountedfor, as formerly stated by Siriwardena et al. (2012) and Vickery andArlettaz (2012). Yet, birds of conservation concern (farmland, priorityand red-list species) were mainly positively correlated with the pro-portion of BPA with ecological quality. Notwithstanding the fact thattwo outstanding landscape squares with a high fraction of BPA withquality (16% and 18%) are behind the significance of the observedpattern (Fig. 3f), our findings corroborate the view that commonlyimplemented AES have only moderate effects if any upon red list andfarmland birds. More demanding AES or specific action plans that gobeyond the standard AES measures are necessary to maintain and re-store farmland bird communities (Breeuwer et al., 2009; Meichtry-Stieret al., 2014).
4.3. BPA properties and effectiveness
It is an ongoing debate under which agricultural intensities andlandscape compositions and configurations AES work best (Batáryet al., 2015). We show here that the Swiss AES can effectively promotebiodiversity in Central European lowland regions characterized by ahigh-intensity but small-scaled farming system. In our study area fieldshave a relatively small size (mean ± SD: 1.25 ± 0.4 ha), while arablecrop diversity is high (7 ± 3 per 1 km2) and patches of natural habitatsoften present. This setting corresponds to an agricultural landscape ofintermediate complexity, where AES measures are likely to provide thebest biodiversity benefits (Concepción et al., 2012; Tscharntke et al.,2012). In contrast to our hypothesis, BPA effectiveness was not influ-enced by distance, diversity, spatial configuration, or by size of in-dividual BPAs. However, it is important to note that connectivity (orfragmentation) is inherently linked to the proportion of available ha-bitat (Fahrig, 2003). If habitat cover reaches a certain threshold, dis-tance between patches becomes fairly irrelevant (Thomas et al., 2001).In our landscapes, BPA covered, on average, 11% of farmed area while
S. Zingg et al. Biological Conservation 231 (2019) 39–48
46

mean distance between BPA patches was 64m. This probably providedsufficient habitat continuum for our two mobile taxa. In support of it,Brückmann et al. (2010) showed that connectivity was an importantpredictor for butterflies and plants typical of calcareous grasslandswhere this habitat covered only 0.01–2.2% of the farmed landscape.However, for less mobile species or bad dispersers, connectivity be-tween BPA may still be of importance (Knop et al., 2011). Despite theknown positive species-area relationship from island biogeographytheory (see also Bender et al., 1998), we could not evidence any effectof BPA size or perimeter-area ratio on species richness and abundance.Again, this could be due to the study of highly mobile taxa in theheterogeneous cultivated landscapes typical of the Swiss lowlands(Helzer and Jelinski, 1999; Öckinger and Smith, 2006; Perović et al.,2015).
4.4. Conclusions and management recommendations
Our results provide strong evidence for the beneficial effects ofSwiss AES (BPA) on bird and butterfly communities and populations atthe landscape scale. As BPA proportion and quality were by far the mostimportant properties for efficient BPA, farmland biodiversity could befurther promoted by, firstly, increasing the proportion of BPA in thecultivated landscape and, secondly, further improving the ecologicalquality of the BPA. Methods to enhance BPA quality already exist: thefloral diversity of low-quality hay meadows can for example be boostedthrough reseeding (Kiehl et al., 2010). In addition, delaying the firstmowing date or maintaining uncut grass refuges has been shown tobenefit invertebrate biodiversity (Bruppacher et al., 2016; Buri et al.,2016; Humbert et al., 2010; Schmiede et al., 2011). Yet, we have torecognize, that biodiversity in the Swiss lowlands is generally de-pauperated. Any slight enhancement of ecological conditions mightthus have had positive effects on it, which is probably why we couldevidence so clear positive effects of BPA. Our findings on the effec-tiveness of the Swiss BPA system bear relevance beyond Switzerland,notably for improving the often criticized ecological focus areas, whichare part of the greening measures of the current EU Common Agri-cultural Policy (Pe'er et al., 2016).
Acknowledgments
We thank the Swiss Ornithological Institute, the Swiss BiodiversityMonitoring, Hintermann & Weber and the cantonal offices of Argovia,Basel-Land, Bern, Fribourg, Lucerne, St. Gallen and Thurgovia for dataprovision. We also thank Jérôme Pellet and Yannick Chittaro for an-swering questions on butterfly guilds and Tobias Roth for feedback onthe manuscript. We thank the foundations Sur-la-Croix and Temperatioas well as the Canton of Argovia for their financial support. Specialthank goes to all the Swiss farmers who manage biodiversity promotionareas and indirectly took part in our study.
Role of the funding sources
The study was realized with financial support from the foundationsSur-la-Croix and Temperatio as well as the Canton of Argovia, whichtook no part in the analyses and interpretation of our results.
Appendix A. Supplementary data
Supplementary data to this article can be found online at https://doi.org/10.1016/j.biocon.2018.12.022.
References
Arponen, A., Heikkinen, R.K., Paloniemi, R., Pöyry, J., Similä, J., Kuussaari, M., 2013.Improving conservation planning for semi-natural grasslands: integrating con-nectivity into agri-environment schemes. Biol. Conserv. 160, 234–241.
Aviron, S., Herzog, F., Klaus, I., Schupbach, B., Jeanneret, P., 2011. Effects of wildflowerstrip quality, quantity, and connectivity on butterfly diversity in a Swiss arablelandscape. Restor. Ecol. 19, 500–508.
Bailey, D., Schmidt-Entling, M.H., Eberhart, P., Herrmann, J.D., Hofer, G., Kormann, U.,Herzog, F., 2010. Effects of habitat amount and isolation on biodiversity in frag-mented traditional orchards. J. Appl. Ecol. 47, 1003–1013.
Baker, D.J., Freeman, S.N., Grice, P.V., Siriwardena, G.M., 2012. Landscape-scale re-sponses of birds to agri-environment management: a test of the English environ-mental stewardship scheme. J. Appl. Ecol. 49, 871–882.
Bartón, K., 2017. Package MuMIn: multi-model inference. In: R Package.Batáry, P., Dicks, L.V., Kleijn, D., Sutherland, W.J., 2015. The role of agri-environment
schemes in conservation and environmental management. Conserv. Biol. 29,1006–1016.
BDM Coordination Office, 2014. Swiss biodiversity monitoring BDM. Description ofmethods and indicators. In: Environmental Studies. BDM Coordination Office, Bern,pp. 103.
Bender, D.J., Contreras, T.A., Fahrig, L., 1998. Habitat loss and population decline: ameta-analysis of the patch size effect. Ecology 79, 517–533.
Birrer, S., Spiess, M., Herzog, F., Jenny, M., Kohli, L., Lugrin, B., 2007. The Swiss agri-environment scheme promotes farmland birds: but only moderately. J. Ornithol. 148,295–S303.
Breeuwer, A., Berendse, F., Willems, F., Foppen, R., Teunissen, W., Schekkerman, H.,Goedhart, P., 2009. Do meadow birds profit from agri-environment schemes in Dutchagricultural landscapes? Biol. Conserv. 142, 2949–2953.
Bright, J.A., Morris, A.J., Field, R.H., Cooke, A.I., Grice, P.V., Walker, L.K., Fern, J.,Peach, W.J., 2015. Higher-tier agri-environment scheme enhances breeding densitiesof some priority farmland birds in England. Agric. Ecosyst. Environ. 203, 69–79.
Brückmann, S.V., Krauss, J., Steffan-Dewenter, I., 2010. Butterfly and plant specialistssuffer from reduced connectivity in fragmented landscapes. J. Appl. Ecol. 47,799–809.
Bruppacher, L., Pellet, J., Arlettaz, R., Humbert, J.-Y., 2016. Simple modifications ofmowing regime promote butterflies in extensively managed meadows: evidence fromfield-scale experiments. Biol. Conserv. 196, 196–202.
Bundesrat, 2013. Verordnung über die Direkzahlungen an die Landwirtschaft (DZV). DerSchweizerische Bundesrat.
Buri, P., Humbert, J.-Y., Stańska, M., Hajdamowicz, I., Tran, E., Entling, M.H., Arlettaz,R., 2016. Delayed mowing promotes planthoppers, leafhoppers and spiders in ex-tensively managed meadows. Insect Conserv. Divers. 9, 536–545.
Caillet-Bois, D., Weiss, B., Benz, R., Stäheli, B., 2018. Biodiversitätsförderung auf demLandwirtschaftsbetrieb - Wegleitung. AGRIDEA.
Concepción, E.D., Díaz, M., 2011. Field, landscape and regional effects of farmlandmanagement on specialist open-land birds: does body size matter? Agric. Ecosyst.Environ. 142, 303–310.
Concepción, E.D., Diaz, M., Kleijn, D., Baldi, A., Batáry, P., Clough, Y., Gabriel, D.,Herzog, F., Holzschuh, A., Knop, E., Marshall, E.J.P., Tscharntke, T., Verhulst, J.,2012. Interactive effects of landscape context constrain the effectiveness of local agri-environmental management. J. Appl. Ecol. 49, 695–705.
Coulthard, E., McCollin, D., Littlemore, J., 2016. The use of hedgerows as flight paths bymoths in intensive farmland landscapes. J. Insect Conserv. 20, 345–350.
Davey, C.M., Vickery, J., Boatman, N.D., Chamberlain, D.E., Parry, H.R., Siriwardena,G.M., 2010. Assessing the impact of entry level stewardship on lowland farmlandbirds in England. Ibis 152, 459–474.
Diacon-Bolli, J., Dalang, T., Holderegger, R., Bürgi, M., 2012. Heterogeneity fostersbiodiversity: linking history and ecology of dry calcareous grasslands. Basic Appl.Ecol. 13, 641–653.
Donald, P.F., Sanderson, F.J., Burfield, I.J., van Bommel, F.P.J., 2006. Further evidence ofcontinent-wide impacts of agricultural intensification on European farmland birds,1990–2000. Agric. Ecosyst. Environ. 116, 189–196.
Ekroos, J., Kuussaari, M., 2012. Landscape context affects the relationship between localand landscape species richness of butterflies in semi-natural habitats. Ecography 35,232–238.
Ekroos, J., Heliölä, J., Kuussaari, M., 2010. Homogenization of lepidopteran communitiesin intensively cultivated agricultural landscapes. J. Appl. Ecol. 47, 459–467.
Fahrig, L., 2003. Effects of habitat fragmentation on biodiversity. Annu. Rev. Ecol. Syst.34, 487–515.
Fahrig, L., Baudry, J., Brotons, L., Burel, F.G., Crist, T.O., Fuller, R.J., Sirami, C.,Siriwardena, G.M., Martin, J.-L., 2011. Functional landscape heterogeneity and an-imal biodiversity in agricultural landscapes. Ecol. Lett. 14, 101–112.
Fischer, M., Altermatt, F., Arlettaz, R., Bartha, B., Baur, B., Bergamini, A., Bersier, L.-F.,Birrer, S., Braunisch, V., Dollinger, P., Eggenberg, S., Gonseth, Y., Guisan, A.,Guntern, J., Gutscher, H., Herzog, F., Humbert, J.-Y., Jenny, M., Klaus, G., Körner, C.,Krättli, H., Küchler, M., Lachat, T., Lambelet-Haueter, C., Leuzinger, Y., Linder, P.,Mitchell, E., Moeschler, P., Pasinelli, G., Pauli, D., Pfiffner, L., Praz, C., Rixen, C.,Rübel, A., Schaffner, U., Scheidegger, C., Schmid, H., Schnyder, N., Senn-Irlet, B.,Stöcklin, J., Stofer, S., Walter, T., Zumbach, S., 2015. Zustand der Biodiversität in derSchweiz 2014. In: Forum Biodiversität Schweiz et al., Bern.
Haynes, K.J., Diekötter, T., Crist, T.O., 2007. Resource complementation and the responseof an insect herbivore to habitat area and fragmentation. Popul. Ecol. 153, 511–520.
Helzer, C.J., Jelinski, D.E., 1999. The relative importance of patch area and perimeter-area ratio to grassland breeding birds. Ecol. Appl. 9, 1448–1458.
Henderson, I.G., Holland, J.M., Storkey, J., Lutman, P., Orson, J., Simper, J., 2012. Effectsof the proportion and spatial arrangement of un-cropped land on breeding birdabundance in arable rotations. J. Appl. Ecol. 49, 883–891.
Humbert, J.-Y., Ghazoul, J., Sauter, G.J., Walter, T., 2010. Impact of different meadowmowing techniques on field invertebrates. J. Appl. Entomol. 134, 592–599.
Keller, V., Gerber, A., Schmid, H., Volet, B., Zbinden, N., 2010. Rote Liste Brutvögel.
S. Zingg et al. Biological Conservation 231 (2019) 39–48
47

Gefährdete Arten der Schweiz, Stand 2010. Umwelt-Vollzug 53 Bundesamt fürUmwelt, Bern, und Schweizerische Vogelwarte, Sempach.
Kiehl, K., Kirmer, A., Donath, T.W., Rasran, L., Hölzel, N., 2010. Species introduction inrestoration projects–evaluation of different techniques for the establishment of semi-natural grasslands in central and northwestern Europe. Basic Appl. Ecol. 11,285–299.
Kleijn, D., Baquero, R.A., Clough, Y., Diaz, M., De Esteban, J., Fernandez, F., Gabriel, D.,Herzog, F., Holzschuh, A., Johl, R., Knop, E., Kruess, A., Marshall, E.J.P., Steffan-Dewenter, I., Tscharntke, T., Verhulst, J., West, T.M., Yela, J.L., 2006. Mixed biodi-versity benefits of agri-environment schemes in five European countries. Ecol. Lett. 9,243–254.
Kleijn, D., Rundlof, M., Scheper, J., Smith, H.G., Tscharntke, T., 2011. Does conservationon farmland contribute to halting the biodiversity decline? Trends Ecol. Evol. 26,474–481.
Knop, E., Herzog, F., Schmid, B., 2011. Effect of connectivity between restoration mea-dows on invertebrates with contrasting dispersal abilities. Restor. Ecol. 19, 151–159.
Krauss, J., Steffan-Dewenter, I., Tscharntke, T., 2003. How does landscape context con-tribute to effects of habitat fragmentation on diversity and population density ofbutterflies? J. Biogeogr. 30, 889–900.
Le Féon, V., Burel, F., Chifflet, R., Henry, M., Ricroch, A., Vaissière, B.E., Baudry, J., 2013.Solitary bee abundance and species richness in dynamic agricultural landscapes.Agric. Ecosyst. Environ. 166, 94–101.
Mac Nally, R., Fleishmann, E., Fay, J.P., Murphy, D.D., 2003. Modelling butterfly speciesrichness using mesoscale environmental variables: model construction and validationfor mountain ranges in the Great Basin of western North America. Biol. Conserv. 110,21–31.
Meichtry-Stier, K.S., Jenny, M., Zellweger-Fischer, J., Birrer, S., 2014. Impact of land-scape improvement by agri-environment scheme options on densities of character-istic farmland bird species and brown hare (Lepus europaeus). Agric. Ecosyst. Environ.189, 101–109.
Öckinger, E., Smith, H.G., 2006. Landscape composition and habitat area affects butterflyspecies richness in semi-natural grasslands. Oecologia 149, 526–534.
Pe'er, G., Zinngrebe, Y., Hauck, J., Schindler, S., Dittrich, A., Zingg, S., Tscharntke, T.,Oppermann, R., Sutcliffe, L.M.E., Sirami, C., Schmidt, J., Hoyer, C., Schleyer, C.,Lakner, S., 2016. Adding some green to the greening: improving the EU's ecologicalfocus areas for biodiversity and farmers. Conserv. Lett. 10, 517–530.
Perović, D., Gámez-Virués, S., Börschig, C., Klein, A.-M., Krauss, J., Steckel, J.,Rothenwöhrer, C., Erasmi, S., Tscharntke, T., Westphal, C., Kleijn, D., 2015.Configurational landscape heterogeneity shapes functional community compositionof grassland butterflies. J. Appl. Ecol. 52, 505–513.
Potts, S.G., Woodcock, B.A., Roberts, S.P.M., Tscheulin, T., Pilgrim, E.S., Brown, V.K.,Tallowin, J.R., 2009. Enhancing pollinator biodiversity in intensive grasslands. J.Appl. Ecol. 46, 369–379.
Prince, K., Jiguet, F., 2013. Ecological effectiveness of French grassland agri-environmentschemes for farmland bird communities. J. Environ. Manag. 121, 110–116.
R Core Team, 2017. R: A Language and Environment for Statistical Computing. RFoundation for Statistical Computing, Vienna, Austria.
Robinson, R.A., Sutherland, W.J., 2002. Post-war changes in arable farming and biodi-versity in Great Britain. J. Appl. Ecol. 39, 157–176.
Schmiede, R., Otte, A., Donath, T.W., 2011. Enhancing plant biodiversity in species-poorgrassland through plant material transfer – the impact of sward disturbance. Appl.Veg. Sci. 15, 290–298.
Settele, J., Feldman, R., Reinhardt, R., 1999. Die Tagfalter Deutschlands. Ulmer, Stuttgart.Siriwardena, G.M., Cooke, I.R., Sutherland, W.J., 2012. Landscape, cropping and field
boundary influences on bird abundance. Ecography 35, 162–173.Stoate, C., Boatman, N.D., Borralho, R.J., Carvalho, C.R., de Snoo, G.R., Eden, P., 2001.
Ecological impacts of arable intensification in Europe. J. Environ. Manag. 63,337–365.
Sutcliffe, L.M.E., Batary, P., Kormann, U., Baldi, A., Dicks, L.V., Herzon, I., Kleijn, D.,Tryjanowski, P., Apostolova, I., Arlettaz, R., Aunins, A., Aviron, S., Balezentiene, L.,Fischer, C., Halada, L., Hartel, T., Helm, A., Hristov, I., Jelaska, S.D., Kaligaric, M.,Kamp, J., Klimek, S., Koorberg, P., Kostiukova, J., Kovacs-Hostyanszki, A.,Kuemmerle, T., Leuschner, C., Lindborg, R., Loos, J., Maccherini, S., Marja, R., Mathe,O., Paulini, I., Proenca, V., Rey-Benayas, J., Sans, F.X., Seifert, C., Stalenga, J.,Timaeus, J., Torok, P., van Swaay, C., Viik, E., Tscharntke, T., 2015. Harnessing thebiodiversity value of central and eastern European farmland. Divers. Distrib. 21,722–730.
Thomas, J.A., Bourn, N.A.D., Clarke, R.T., Stewart, K.E., Simcox, D.J., Pearman, G.S.,Curtis, R., Goodger, B., 2001. The quality and isolation of habitat patches both de-termine where butterflies persist in fragmented landscapes. Proc. R. Soc. B Biol. Sci.268, 1791–1796.
Tscharntke, T., Tylianakis, J.M., Rand, T.A., Didham, R.K., Fahrig, L., Batary, P.,Bengtsson, J., Clough, Y., Crist, T.O., Dormann, C.F., Ewers, R.M., Frund, J., Holt,R.D., Holzschuh, A., Klein, A.M., Kleijn, D., Kremen, C., Landis, D.A., Laurance, W.,Lindenmayer, D., Scherber, C., Sodhi, N., Steffan-Dewenter, I., Thies, C., van derPutten, W.H., Westphal, C., 2012. Landscape moderation of biodiversity patterns andprocesses - eight hypotheses. Biol. Rev. 87, 661–685.
Vickery, J., Arlettaz, R., 2012. The importance of habitat heterogeneity at multiple scalesfor birds in European agricultural landscapes. In: Fuller, R.J. (Ed.), Birds and Habitat:Relationships in Changing Landscapes. Cambridge University Press, Cambridge, pp.177–204.
Walter, T., Eggenberg, S., Gonseth, Y., Fivaz, F., Hedinger, C., Hofer, G., Klieber-Kühne,A., Richer, N., Schneider, K., Szerencsits, E., Wolf, S., 2013. Operationalisierung derUmweltziele Landwirtschaft - Bereich Ziel- und Leitarten, Lebensräume (OPAL).Forschungsanstalt Agroscope Reckenholz-Tänikon ART, Ettenhausen.
Wermeille, E., Chittaro, Y., Gonseth, Y., 2014. Rote Liste Tagfalter und Widderchen.Gefährdete Arten der Schweiz, Stand 2012. Umwelt-Vollzug 1403. Bundesamt fürUmwelt, Bern und Schweizer Zentrum für die Kartografie der Fauna, Neuenburg,pp. 97.
Westphal, C., Steffan-Dewenter, I., Tscharntke, T., 2006. Bumblebees experience land-scapes at different spatial scales: possible implications for coexistence. Oecologia149, 289–300.
Zellweger-Fischer, J., Hoffmann, J., Korner-Nievergelt, P., Pfiffner, L., Stoeckli, S., Birrer,S., 2018. Identifying factors that influence bird richness and abundance on farms.Bird Stud. 65, 161–173.
Zingg, S., Grenz, J., Humbert, J.-Y., 2018. Landscape-scale effects of land use intensity onbirds and butterflies. Agric. Ecosyst. Environ. 267, 119–128.
S. Zingg et al. Biological Conservation 231 (2019) 39–48
48