increasing the specificity and the sensitivity in peptide ... · academic year 2009-2010...
TRANSCRIPT

Increasing the specificity and the sensitivity in peptide centric proteomics
2010
Kenny Helsens

Academic Year 2009-2010
Increasing the specificity and the sensitivity in peptide centric proteomics
Thesis submitted in partial fulfillment to obtain the degree of
D!"#!$ !% B&!'()&"*+ S"&(,"(-
Kenny HELSENS
Promotor:Prof. Dr. Kris Gevaert
Department of Biochemistry and VIB Department of Medical Protein Research
Faculty of Medicine and Health Sciences, Ghent University, Belgium
Copromotor:Prof. Dr. Lennart Martens
Department of Biochemistry and VIB Department of Medical Protein Research
Faculty of Medicine and Health Sciences, Ghent University, Belgium


iiiAcknowledgements
Acknowledgements
De eerste woorden in deze thesis worden pas toegevoegd als laatste. Een
woord van dank wordt hier voor een deel gericht aan zij die hielpen om deze thesis
inhoud te geven, maar ook aan hen die inhoud gaven aan de mens die ik intussen
ben geworden. De trend is gezet; ik zal naar vertrouwde gewoonte mijn eigen stijl
aanhouden in de volgende paragrafen van dank.
Op de eerste plaats wil ik mijn ouders bedanken. Gedurende mijn doctoraatsjaren
werd ik behoorlijk zelfstandig, op de was na, maar de overige 80% van mijn jonge
leven gaven jullie me een zorgeloze thuis alwaar de fundamenten van mijn karakter
werden gegoten. Met een veelvoud aan vrijheid gaven jullie me daarbij een grootse
kans voor een kind: gaandeweg creatief worden, zichzelf ontdekken en een weg
aanleggen naar een blije mens die ik eigenlijk al sinds lang ben.
Dank!
Meme, Pepe, Meter, Peter, Neven en Nichtje, Broertje en al jullie dierbaarsten. De
regelmaat van contact is niet altijd optimaal doordat ik er een druk en rijk jong leven
op nahoud. Desondanks kon ik steevast rusten en genieten van de soep de wijsheid,
de lach de schoonheid, de hulp de realiteit, de mop de speeltijd; vaste waarden in
Familie.
Dank!

iv Improving the sensitivy and the specificity in peptide centric proteomics
Vervolgens zou ik mijn dank willen richten aan de vakgroepvoorzitter, mijn
promotor en mijn co-promotor: Joël, Kris en Lennart. Een geducht verhaal, een
brouwerij van kennis en een bron van unieke kansen; jullie gaven me vertrouwen en
daarmee ook een opstap naar de toekomst. Jullie voorzagen me van een inspirerende
werkomgeving in een Rocket Science labo, en gaven me ook de opportuniteit om
mijn werk te tonen aan de buitenwereld op de vele congressen.
Dank!
Een extra woord voor Lennart is hier ook op zijn plaats. Je leerde me in de eerste
zomer eigenhandig hoe ik een computer voor mijn kar kan spannen waardoor ik een
letterlijke ‘hello world’ ervaring had; een nieuwe wereld openbaarde zich aan me. Ik
kan en kon je niet altijd even goed volgen, en heb misschien wel bijgedragen tot een
maagzweer, maar ik ben oprecht dankbaar dat ik heb kunnen meerijden in het zog
van je kennis: de ene keer verlichtend met wetenschappelijke visie, de andere keer
verhalend over Japanse levenswijsheid.
Dank! (dewelke ik enkel kan tonen door de kennis die je me reeds gaf aan minstens
twee mensen door te geven in werk en dagelijks leven)
Dan zijn er ook de dagdagelijkse collega’s. Ik heb het later in deze thesis over
expert kennis, en dan heb ik het over jullie kennis. An, Evy, PJ, Hans, Marc en Jose.
Vanachter de computer lijkt het soms alsof er een cruise-control knop zou bestaan,
maar niets is minder waar. De drijvende kracht achter een vlotte datastroom is jullie
expertise en spitsvondigheid.
Dank!
Met een computer kan je schijnbare muren neerhalen gedurende de
dataverwerking. De vibrante werkomgeving inspireerde tot vele samenwerkingen met
dichte en verre collega’s. Deze vertoonden vaak gretig enthousiasme bij de start van
de werken, en werden soms gevolgd door een procrastinerende fase waardoor de
muur al eens te lang bleef staan. Erg veel dank en respect voor Francis, Petra, Bart en
Niklaas die immer mee de zaak rond brachten. Ook recentere collega’s als Bart, Sven
en Sven, Veronique, Jolien, Liana, Mattias en Kim; en vroegere collega’s als Franky,
Kristian en Koen droegen hun steentje bij aan de inspirerende werkomgeving.
Dank!

vAcknowledgements
Mijn drie collega Musketiers, Bart, Francis en Niklaas, zijn speciale gevallen die ik
hiernaast reeds heb vermeld als collegae, maar met een extra woord ook de ideale
brug vormen naar mijn vrienden. Bart, Jezus, een ferme rakker ben je toch. Wanneer
er een blauwtje werd opgelopen, stond er gauw een blauwe Chimay klaar. Als echte
roddelnonkels gingen we tot bij zware vriestemperaturen joggen na het werk, en
ons beider EQ hield ons pratend tot laat in de nacht - niet zelden over wetenschap.
Francis, een heldere e!ciente geest perfect gebalanceerd met een plezante portie
pret. Altijd inspirerend om in je buurt te vertoeven. Niklaas. Tja. Jij hoort hier echt wel
meer thuis dan bij de collega’s. Intussen ga ik volstrekt akkoord dat we elkaar beter
weten te vinden als vrienden dan als collega’s. Je nam me mee naar jouw boomstraat,
jij was een beest op mijn Champagnefeest. En, waarom moet dat ontbijt zo uitgebreid
als we slechts wat grijstpap willen? Ik heb al veel gekregen, en blijf schoonheid bij en
rond je vinden, het moet iets met je graura zijn.
Dank!
Energie en inspiratie kreeg ik in grote getalle van veel dierbare vrienden. Bende van
Zelzate. Jullie gaan al langst mee en ik hou van de geur van nostalgie als we elkaar
weer een keer tre"en. Bende van de Marimain. Jullie namen me sinds enkele jaren
op gedurende menig warme avonden, en zo haal ik me direct een moment voor de
geest, alwaar ik na een drukke thesis-schrijven-dag binnen slofte voor pint en woord.
De Samovar en hun wijsheid over de goede keuken. De Portugezen. Zij kunnen
deze woorden niet lezen, maar met een meu deus van tijd tot tijd ben ik blij voor die
boeiende tijd met hen. Vrienden van de Sanderusstraat, Eline en Anja, samenwonen
met twee zulke Deernes, op de looksoep na was het een droom! Jullie brachten me
eveneens een wereld in en rond Bottelare, alwaar ik vrienden, liefde en plezier trof en
weer een stap verder groeide in het leven. De Anciens: Christophe, David en Niki, bij
jullie tref ik rust als in een rotstuintje.
Dank!
Ik ben mezelf gaan kennen als een emo-oriented wezen, waardoor ook het
dankwoord langer wordt dan verwacht. Tijd voor een bondige conclusie: mijn dank
aan allen die me energie en kansen gaven, en daarbij het beste uit me wisten te halen.


viiTable of contents
Table of contents
Acknowledgements . . . . . . . . . . . . . . . . . . . . . . . . . . . . . . . . . . . . . . . . . . . . . . . . . . . . . . . . iii
List of publications . . . . . . . . . . . . . . . . . . . . . . . . . . . . . . . . . . . . . . . . . . . . . . . . . . . . . . . . . ix
List of abbreviations. . . . . . . . . . . . . . . . . . . . . . . . . . . . . . . . . . . . . . . . . . . . . . . . . . . . . . . . xi
Section 1. Introduction 1
1. From classic protein chemistry to high-throughput proteomics . . . . . . . . . . . . . 1
2. Technological requirements . . . . . . . . . . . . . . . . . . . . . . . . . . . . . . . . . . . . . . . . . . . . . .4
2.1 Peptide separation . . . . . . . . . . . . . . . . . . . . . . . . . . . . . . . . . . . . . . . . . . . . . . . . . . .4
2.2 Mass spectrometry . . . . . . . . . . . . . . . . . . . . . . . . . . . . . . . . . . . . . . . . . . . . . . . . . . 5
2.2.1 Ionization of peptides. . . . . . . . . . . . . . . . . . . . . . . . . . . . . . . . . . . . . . . . . . . . . . . . 5
2.2.2 Mass analysis of ions. . . . . . . . . . . . . . . . . . . . . . . . . . . . . . . . . . . . . . . . . . . . . . . . .7
2.2.3 Detection. . . . . . . . . . . . . . . . . . . . . . . . . . . . . . . . . . . . . . . . . . . . . . . . . . . . . . . . . .8
2.3 Mass spectrometry methodologies . . . . . . . . . . . . . . . . . . . . . . . . . . . . . . . . . . . 9
2.3.1 Peptide fragmentation . . . . . . . . . . . . . . . . . . . . . . . . . . . . . . . . . . . . . . . . . . . . . . 9
2.3.2 Selected reaction monitoring . . . . . . . . . . . . . . . . . . . . . . . . . . . . . . . . . . . . . . . .10
3. Proteomic strategies . . . . . . . . . . . . . . . . . . . . . . . . . . . . . . . . . . . . . . . . . . . . . . . . . . .10
3.1 Qualitative proteomics . . . . . . . . . . . . . . . . . . . . . . . . . . . . . . . . . . . . . . . . . . . . . . 11
3.1.1 Proteome coverage . . . . . . . . . . . . . . . . . . . . . . . . . . . . . . . . . . . . . . . . . . . . . . . . 11
3.1.2 Shotgun proteomics . . . . . . . . . . . . . . . . . . . . . . . . . . . . . . . . . . . . . . . . . . . . . . . . 12
3.1.3 Targeted proteomics . . . . . . . . . . . . . . . . . . . . . . . . . . . . . . . . . . . . . . . . . . . . . . . 13
3.1.4 Sample complexity reduction . . . . . . . . . . . . . . . . . . . . . . . . . . . . . . . . . . . . . . . . 13
3.1.5 Selection of post-translationally modified peptides . . . . . . . . . . . . . . . . . . . . . . 15
3.2 Quantitative proteomics . . . . . . . . . . . . . . . . . . . . . . . . . . . . . . . . . . . . . . . . . . . . 17
3.2.1 Metabolic labeling . . . . . . . . . . . . . . . . . . . . . . . . . . . . . . . . . . . . . . . . . . . . . . . . . 18
3.2.2 Non-metabolic labeling . . . . . . . . . . . . . . . . . . . . . . . . . . . . . . . . . . . . . . . . . . . . . 19
3.2.3 Label-free methods . . . . . . . . . . . . . . . . . . . . . . . . . . . . . . . . . . . . . . . . . . . . . . . . 21
4. Working with proteomics data. . . . . . . . . . . . . . . . . . . . . . . . . . . . . . . . . . . . . . . . . . .22
4.1 Data processing . . . . . . . . . . . . . . . . . . . . . . . . . . . . . . . . . . . . . . . . . . . . . . . . . . . .22
4.2 Peptide identification . . . . . . . . . . . . . . . . . . . . . . . . . . . . . . . . . . . . . . . . . . . . . . . 23

viii Improving the sensitivy and the specificity in peptide centric proteomics
4.2.1 Sequence assignment . . . . . . . . . . . . . . . . . . . . . . . . . . . . . . . . . . . . . . . . . . . . . . 23
4.2.2 Error estimation . . . . . . . . . . . . . . . . . . . . . . . . . . . . . . . . . . . . . . . . . . . . . . . . . . .24
4.2.3 Quality validation . . . . . . . . . . . . . . . . . . . . . . . . . . . . . . . . . . . . . . . . . . . . . . . . . . 25
4.3 Protein inference . . . . . . . . . . . . . . . . . . . . . . . . . . . . . . . . . . . . . . . . . . . . . . . . . . .26
4.4 Functional analyses . . . . . . . . . . . . . . . . . . . . . . . . . . . . . . . . . . . . . . . . . . . . . . . . .28
4.5 Data management . . . . . . . . . . . . . . . . . . . . . . . . . . . . . . . . . . . . . . . . . . . . . . . . . .29
Section 2. Results 31
1. Processing and managing MS/MS results . . . . . . . . . . . . . . . . . . . . . . . . . . . . . . . . . 33
1.1 MascotDatfile: An open-source library to fully parse and
analyse MASCOT MS/MS search results . . . . . . . . . . . . . . . . . . . . . . . . . . . . . . . 33
1.2 Ms_lims: an open-source laboratory information management
system for mass spectrometry-driven proteomics . . . . . . . . . . . . . . . . . . . . . 41
2. Employing expert knowledge for post-identification validation
in peptide centric proteomics . . . . . . . . . . . . . . . . . . . . . . . . . . . . . . . . . . . . . . . . . . . 55
2.1 The concept of Peptizer . . . . . . . . . . . . . . . . . . . . . . . . . . . . . . . . . . . . . . . . . . . . . 55
2.2 Increasing the specificity of peptide identifications . . . . . . . . . . . . . . . . . . . .68
2.3 Increasing the sensitivity of peptide identifications. . . . . . . . . . . . . . . . . . . . .72
2.3.1 Employing Peptizer. . . . . . . . . . . . . . . . . . . . . . . . . . . . . . . . . . . . . . . . . . . . . . . . .72
2.3.2 Modification tolerant searches as a strategy to study unanticipated PTM’s . . . 75
3. Case study: a yeast N-terminal proteome . . . . . . . . . . . . . . . . . . . . . . . . . . . . . . . .79
3.1 Background . . . . . . . . . . . . . . . . . . . . . . . . . . . . . . . . . . . . . . . . . . . . . . . . . . . . . . . .79
3.2 In silico analysis of database annotated protein N-termini reveals
non-random usage of amino acids in yeast . . . . . . . . . . . . . . . . . . . . . . . . . . . 81
3.3 Identification of known and alterative N-termini
by positional proteomics . . . . . . . . . . . . . . . . . . . . . . . . . . . . . . . . . . . . . . . . . . . .82
3.4 Heterogeneous translation initiation . . . . . . . . . . . . . . . . . . . . . . . . . . . . . . . . .88
3.5 Mapping of signal and transit sites annotated by UniProtKB. . . . . . . . . . . . .92

ixTable of contents
Section 3. Discussion 95
1. Data processing and management . . . . . . . . . . . . . . . . . . . . . . . . . . . . . . . . . . . . . . .95
2. The specificity of an experiment . . . . . . . . . . . . . . . . . . . . . . . . . . . . . . . . . . . . . . . . .97
3. The sensitivity of an experiment . . . . . . . . . . . . . . . . . . . . . . . . . . . . . . . . . . . . . . . .100
Section 4. Nederlandstalige samenvatting. 105
Section 5. References 109
Addendum 1 Additional papers . . . . . . . . . . . . . . . . . . . . . . . . . . . . . . . . . . . . . . . . . . . . 121
Addendum 2 Curriculum Vitae . . . . . . . . . . . . . . . . . . . . . . . . . . . . . . . . . . . . . . . . . . . . 135

x Improving the sensitivy and the specificity in peptide centric proteomics

xiList of publications
List of publications
Publications represented in this work
Ghesquière, B., N. Colaert, K. Helsens, L. Dejager, C. Vanhaute, K. Verleysen, K. Kas, E. Timmerman, M. Goethals, C. Libert, J. Vandekerckhove and K. Gevaert (2009). “In vitro and in vivo protein-bound tyrosine nitration characterized by diagonal chromatography.” Mol Cell Proteomics 8(12): 2642-52.
Helsens, K., L. Martens, J. Vandekerckhove and K. Gevaert (2007). “MascotDatfile: an open-source library to fully parse and analyse MASCOT MS/MS search results.” Proteomics 7(3): 364-6.
Helsens, K., E. Timmerman, J. Vandekerckhove, K. Gevaert and L. Martens (2008). “Peptizer: A tool for assessing false positive peptide identifications and manually validating selected results.” Mol Cell Proteomics 7(12): 2363-72.
Helsens, K., N. Colaert, H. Barsnes, T. Muth, K. Flikka, A. Staes, E. Timmerman, S. Wortelkamp, A. Sickmann, J. Vandekerckhove, K. Gevaert and L. Martens (2010). “ms_lims, a simple yet powerful open source LIMS for mass spectrometry-driven proteomics.” Proteomics 10(6): 1261-4.
Helsens, K., L. Martens, J. Vandekerckhove and K. Gevaert (2010). “Mass spectrometry-driven proteomics: an introduction.” Methods Mol Biol: accepted.
Other publications
Arnesen, T., P. Van Damme, B. Polevoda, K. Helsens, R. Evjenth, N. Colaert, J. E. Varhaug, J. Vandekerckhove, J. R. Lillehaug, F. Sherman and K. Gevaert (2009). “Proteomics analyses reveal the evolutionary conservation and divergence of N-terminal acetyltransferases from yeast and humans.” Proc Natl Acad Sci USA 106(20): 8157-8162.
Colaert, N., K. Helsens, F. Impens, J. Vandekerckhove and K. Gevaert (2010). “Rover: a tool to visualize and validate quantitative proteomics data from di.erent sources.” Proteomics 10(6): 1226-9.
Colaert, N., K. Helsens, L. Martens, J. Vandekerckhove and K. Gevaert (2009). “Improved visualization of protein consensus sequences by iceLogo.” Nat Methods 6(11): 786-7.
Demon, D., P. Van Damme, T. Vanden Berghe, A. Deceuninck, J. Van Durme, J. Verspurten, K. Helsens, F. Impens, M. Wejda, J. Schymkowitz, F. Rousseau, A. Madder, J. Vandekerckhove, W. Declercq, K. Gevaert and P. Vandenabeele (2009). “Proteome-wide substrate analysis indicates substrate exclusion as a mechanism to generate caspase-7 versus caspase-3 specificity.” Mol Cell Proteomics 8(12): 2700-14.
Eisenacher, M., L. Martens, T. Hardt, M. Kohl, H. Barsnes, K. Helsens, J. Häkkinen, F. Levander, R. Aebersold, J. Vandekerckhove, M. J. Dunn, F. Lisacek, J. A. Siepen, S. J. Hubbard, P.-A. Binz, M. Blüggel, H. Thiele, J. Cottrell, H. E. Meyer, R. Apweiler and C. Stephan (2009). “Getting a grip on proteomics data - Proteomics Data Collection (ProDaC).” Proteomics 9(15): 3928-33.
Flikka, K., J. Meukens, K. Helsens, J. Vandekerckhove, I. Eidhammer, K. Gevaert and L. Martens (2007). “Implementation and application of a versatile clustering tool for tandem mass spectrometry data.” Proteomics 7(18): 3245-58.
Gevaert, K., P. Van Damme, B. Ghesquière, F. Impens, L. Martens, K. Helsens and J. Vandekerckhove (2007). “A la carte proteomics with an emphasis on gel-free techniques.” Proteomics 7(16): 2698-718.

xii Improving the sensitivy and the specificity in peptide centric proteomics
Impens, F., N. Colaert, K. Helsens, B. Ghesquière, E. Timmerman, P. D. Bock, B. M. Chain, J. Vandekerckhove and K. Gevaert (2010). “Systematic identifciation of protease cleavage events.” Molecular and Cellular Proteomics: submitted.
Impens, F., N. Colaert, K. Helsens, K. Plasman, P. Van Damme, J. Vandekerckhove and K. Gevaert (2010). “Mass spectrometry-driven protease substrate degradomics.” Proteomics: Proteomics 10(6): 1284-96.
Impens, F., K. Helsens, N. Colaert, L. Martens, J. Vandekerckhove and K. Gevaert (2010). “A non-gel study of the human platelet proteome by N-terminal COFRADIC points to calpain-1 as the major proteolytic component in platelets.” Platelet Proteomics: Principles, Analysis and Applications: Accepted.
Mathivanan, S et al. (2008). “Human Proteinpedia enables sharing of human protein data.” Nat Biotechnol 26(2): 164-7.
Staes, A., E. Timmerman, J. Van Damme, K. Helsens, J. Vandekerckhove, M. Vollmer and K. Gevaert (2007). “Assessing a novel microfluidic interface for shotgun proteome analyses.” Journal Sep Sci 30(10): 1468-76.
Staes, A., P. Van Damme, K. Helsens, H. Demol, J. Vandekerckhove and K. Gevaert (2008). “Improved recovery of proteome-informative, protein N-terminal peptides by combined fractional diagonal chromatography (COFRADIC).” Proteomics 8(7): 1362-70.

xiiiList of abbreviations
List of abbreviations
AABINGO
COFRADICDAVID
ESIESTCID
ECDETDETSFDR
FT-ICRGFP
GPMDBGUI
HCDHILICHMMICAT
IEFIEX
IMACIT
ITRAQLCLIT
LIMSm/Z
MALDIMCPMGF
MSMS/MS
MUDPITOMSSA
PAGEPANDORA
PCRPMF
PRIDEPTM
QRF
RP-HPLCSAXSCXSDS
SILACSNPSQLSRMSVMTAPTIS
TNBSTOF
amino acidbiological network gene ontology toolcombined fractional diagonal chromatographydatabase for annotation, visualization and integrated discoveryelectrospray ionization expressed sequence tag collision induced dissociationelectron capture dissociationelectron transfer dissociationerror tolerant searchfalse discovery ratefourier tansform ion cyclotron resonancegreen fluorescent proteinglobal proteome machine databasegraphical user interfacehigher-energy collisional dissociation cellhydrophilic interaction chromatographyhidden Markov modelisotope coded affinity tagisoelectric focusingion exchange chromatographyimmobilized metal ion chromatographyion trapisobaric tags for relative and absolute quantitationliquid chromatographylinear ion traplaboratory information management systemmass over chargematrix assisted laser desorption ionizationmicro channel platemascot generic filemass spectrometrytandem mass spectrometrymultidimensional protein identification technologyopen mass spectrometry search algorithmpolyacrylamide gel electrophoresisprotein annotation diagram oriented analysispolymerase chain reactionpeptide mass fingerprintingproteomics identifications databasepost-translational modificationquadrupoleradio frequentreversed-phase high performance liquid chromatographystrong anion exchangestrong cation exchange sodium dodecyl sulfatestable isotope labeling of amino acids in cell culturesingle nucleotide polymorphismstructured query languageselected reaction monitoringsupport vector machinetandem affinity purificationtranslation initiation site2,4,6-trinitrobenzene sulfonic acidtime-of-flight

1
Introduction

1Introduction
Section 1. Introduction
Proteins are reckoned to be the key actors in a living organism. By studying proteins, one
engages into deciphering a complex series of events occurring during a protein’s lifespan. This
starts at the creation of a protein, which is tightly controlled on both a transcriptional (Williams
and Tyler, 2007) and a translational level (Van Der Kelen et al., 2009). During translation,
a primary strand of amino acids undergoes a complex folding process in order to obtain a
native three-dimensional protein structure (Gross et al., 2003). Proteins take on a plethora
of functions, such as complex formation, receptor activity, and signal transduction, which
ultimately adds up to a cellular phenotype. Consequently, protein analysis is of major interest
in molecular biology and involves annotating their presence and localization, as well as their
modification state and biochemical context. To accomplish this, many methods have been
developed over the last decades, and their general principles and important recent advances in
large-scale protein analysis or proteomics are discussed in this introduction chapter.
1. From classic protein chemistry to high-throughput proteomics
Primary information about a protein is obtained through its amino acid sequence. Published
in the 1950s, the Edman sequencing methodology presented a milestone for protein analysis by
enabling amino acid sequencing for the first time (Edman, 1950). The method first requires the
protein to be purified before applying a series of modification steps. First, the amino-terminal
residue is modified into a phenylthiocarbamoyl, which can subsequently be released from the
protein under acidic conditions as a thiazolinone amino acid derivative. This modified amino
acid is then converted to a phenylthiohydantoin (PTH) amino acid, which can then be identified
by chromatographic separation as each PTH amino acid has a slightly di.erent elution time. By
iterating this process, amino acid after amino acid is released, forming a sequence ladder that
starts from the protein N-terminus. The main technical drawbacks of Edman sequencing are
that N-terminally blocked proteins (e.g., by acetylation) are not compatible with the protocol,
and that generally only up to 30 amino acids can be sequenced due to incomplete reactions.

2 Improving the sensitivy and the specificity in peptide centric proteomics
Moreover, since genome sequencing was still many years in the future, a sequence obtained by
Edman sequencing could very often not yet be placed in an appropriate context. The evolution
towards automated Edman sequencing in the 1970s dramatically increased the throughput of
the method and thereby gave the means to sequence multiple proteins in a single study (Niall,
1973). Yet even automated Edman sequencing proved insu/cient and insensitive when applied
to a complete proteome consisting of thousands of proteins, spanning multiple orders of
magnitude in abundance (de Godoy et al., 2006).
Prior to MS-driven proteomics, studying a proteome required proteins to be separated prior
to sequence analysis, and di.erent gel-based methods have therefore been described over the
years to separate proteins by their physicochemical properties. In isoelectric focusing (IEF),
proteins are separated by their isoelectric point, which corresponds to the pH where proteins
carry a net charge of zero, and thereby no longer feel the force that the electrical field applied
to the gel exerts on charge-carrying molecules (Svensson, 1961). In SDS-PAGE, proteins are
denatured by sodium dodecyl sulfate (SDS) and subsequently separated by their apparent
molecular weight in a gel with a controllable pore size (gradient) (Laemmli, 1970). Di.erent
separation methods can also be combined in a multi-dimensional setup. The most commonly
used setup is 2D-PAGE, in which proteins are separated by IEF in the first dimension and by
SDS-PAGE in the second dimension (Klose, 1975; O’Farrell, 1975).
After separation, the proteins can be visualized on the gel by di.erent means including
Coomassie Brilliant blue, silver or immuno-staining methods (Lauber et al., 2001). The resulting
spots indicate proteins which can then be analyzed by Edman sequencing after electroblotting
(Vandekerckhove et al., 1985). However, in addition to the limitations of Edman sequencing
described above, the method also requires a large amount of protein material, typically in the
order of micrograms. This impaired sensitivity of the method allows only abundant proteins to
fall within the scope of the method.
When the much more sensitive technique of mass spectrometry became applicable to
proteins through the advent of new ionization methodologies, far less material was needed for

3Introduction
protein detection and analysis. Instead of reading amino acids by chromatography however,
mass spectrometry completely relies on accurate mass measurements of charged analytes like
(poly)peptides and their fragments, which necessitates the use of an existing sequence database
against which the recorded masses can be matched. After gel-based separation, a protein spot is
subjected to in-gel digestion, the resulting peptides are typically extracted (e.g., in acetonitrile-
water) and their masses are finally determined by mass spectrometry. The list of peptide masses,
resulting from a single gel spot, is then utilized as a fingerprint to identify the parent protein
using a protein sequence database and a specialized software program called a search engine.
This technique is known as Peptide Mass Fingerprinting (PMF) and was the most commonly
used proteome analysis method during the 1990s (Pappin et al., 1993). The major drawbacks of
this method are that the primary amino acid sequence cannot be directly determined by PMF,
and similar to Edman sequencing, proteins must be purified prior to digestion.
A new standard of proteome analysis was introduced by peptide-centric proteomics,
where the focus is transferred from the separation of proteins to the separation of peptides.
Peptides can be separated by chromatography, which can be in-line coupled to tandem mass
spectrometry (MS/MS). The resulting MS/MS spectra allow determination of peptide sequences,
which can then be used to infer the parent proteins. As a consequence of this paradigm shift in
favor of analyzing peptides, the probability for a protein to be identified increases since multiple
peptides can be utilized to identify the parent protein. Moreover, peptides are less extreme
in size and other physicochemical parameters than proteins; this in turn also dramatically
increases the sensitivity of peptide-centric proteome analysis.
The technologies involved in peptide centric proteomics are described in detail in the next
section.

4 Improving the sensitivy and the specificity in peptide centric proteomics
2. Technological requirements
2.1 Peptide separation
All peptide-centric proteomics methods need to consider the complexity of the peptide
mixture. Let us for instance assume that half of the 20,334 proteins annotated in the human
subset of UniProtKB/Swiss-Prot1 are present at any one time in a cell. Subjecting these to a
tryptic digest generates on average about fifty peptides per protein, yielding roughly 500,000
di.erent peptide molecules. If we then (conservatively) allow for a doubling of this complexity
due to alternative splicing and again for di.erent modification states, then a complex peptide
mixture will easily contain a few million distinct peptides. Even using the latest generation of
mass spectrometry, capable of analyzing up to 10 peptides per second (MS/MS mode), such a
complex peptide mixture requires extensive separation prior to mass spectrometry analysis.
This was achieved by applying both existing and new chromatographic methods.
In liquid chromatography (LC) methods (Felinger, 2008), peptides dissolved in a mobile
phase flow through a column containing a synthetic resin. Peptides interact with and bind
to this stationary phase, and can be gradually eluted by varying the mixture ratio (water/
organic solvent) of the mobile phase to increasingly resemble the properties of the stationary
phase. A number of stationary and mobile phases had already proven their value in separating
peptides and were furthermore compatible with mass spectrometry and therefore ready to
use in peptide-centric proteomics. One of the most common methods, Reversed-Phase High
Performance Liquid Chromatography (RP-HPLC), employs a highly hydrophobic stationary
phase (typically, a column packed with C-18 coated beads) (Imoto and Yamada, 1983). Peptides
bind to these beads through hydrophobic interactions, and by increasing the concentration
of the organic solvent (typically acetonitrile) in the mobile phase, increasingly hydrophobic
peptides are released and therefore eluted over time. Another widely used method is Ion
Exchange chromatography (IEX), where the resin is coated with either negative (Strong Anion
Exchange, SAX) or positive (Strong Cation Exchange, SCX) ionic groups, attracting molecules
of opposite charge. An increasing concentration of counter ions (with charges opposite to the
resin) in the mobile phase or changes in the bu.er solution’s pH will then increasingly displace
peptides of ever higher charge states from the resin, eluting them from the column.
1 UniProtKB/Swiss-Prot release 57.9.

5Introduction
2.2 Mass spectrometry
Mass spectrometry was first conceptualized in 1906 by Thomson, who described mass
separation as canal rays, and the importance of mass spectrometry has grown ever since,
illustrated by the five Nobel Prizes that were awarded over the years to research performed
in the field of mass spectrometry: Joseph John Johnson for his work on the conduction
of electricity by gas in 1906, Francis William Aston for the discovery of isotopes in 1922,
Ernest Orlando Lawrence for the development of the cyclotron in 1939, Wolfgang Paul for
the development of the ion trap in 1989, and John Bennett Fenn and Koichi Tanaka for the
development of soft ionization methods in 2002.
All mass spectrometers systematically employ an identical series of components. The
first component is the ion source, which serves to charge the analytes that will be measured.
These charged analytes then enter the second component, the mass analyzer, wherein their
trajectories are directly a.ected by the force of an electrical or magnetic field leading to
selection or separation of ions with di.erent mass to charge (m/z) ratios. The third component,
the detection device, accurately captures ions and reads out their specific m/z ratios. These
three components are described in the following subsections.
2.2.1 Ionization of peptides
It lasted until the late 1980s before intact peptides could be ionized and measured by mass
spectrometry. Earlier ionization methods (e.g, Electron Ionization, Chemical Ionization, Fast
Atom Bombardment) disrupted the molecular structures and thus failed measuring intact
peptides, and were further practically limited by low upper mass limits. The advent of two soft
ionization methods enabled the ionization of intact peptides (plus other biomolecules), and
their e.orts were recognized by two Nobel Prize awardees in 2002.
In Matrix Assisted Laser Desorption Ionization (MALDI), simultaneously described by
Tanaka (Tanaka et al., 1988) and Karas (Karas and Hillenkamp, 1988), the peptides are co-
crystallized with an acidic organic matrix (e.g., alpha-cyano). Here, a solution of peptides with

6 Improving the sensitivy and the specificity in peptide centric proteomics
excess of such a matrix is spotted on a metallic plate and dried upon which crystallization
occurs. These samples are then inserted into the ion source region of the mass spectrometer
– which is held under very high vacuum – and pulsed laser light, typically a N2-laser emitting
light of 337 nm, is directed to the crystallized sample. Upon absorption of this light, the energy
is converted into collision energy and heat, leading to desorption of matrix molecules and
peptides. Somewhere along this process, peptides are ionized but the exact mechanism driving
ionization is still debated (e.g., see (Zenobi and Knochenmuss, 1998)).
Electrospray Ionization (ESI) was the second soft ionization method (Fenn et al., 1989). Here,
peptides eluting from a RP-HPLC column are sprayed through a tiny-orifice needle upon which
a voltage is applied. At the needle tip, the spray forms a cone, the “Taylor cone” (Taylor, 1964),
and the tip of this cone releases charged solvent droplets containing peptides. These charged
droplets further move to the mass analyzer using an electrical field and a stream of drying gas
(e.g., heated nitrogen) is used to further evaporate solvent from the droplets until the Coulomb
repulsion on alike charged ions overcomes the droplet’s surface tension, known as the Rayleigh
limit (Rayleigh, 1882), and finally shatters the droplet into yet smaller droplets. This cycle of
solvent evaporation and droplet fission continues until the charges are transferred onto the
peptides which thereby become volatile.
The coupling with liquid chromatography methods is on-line in ESI and o.-line in MALDI.
As such, the peptides can be reanalyzed over time in MALDI, which can be useful for biomarker
discovery. Then again, the continuous flow of analytes in ESI will measure the mass more
accurately then repeated desorption of inhomogeneous peptide crystallization in MALDI
eventually (Rietschel et al., 2009) .

7Introduction
2.2.2 Mass analysis of ions
The ionized analytes formed in the ion source are transported to the mass analyzer, wherein
their trajectories are controlled and analyzed in various ways, finally enabling accurate m/z-
measurements. Ion trajectories can be controlled by two general methods: either by applying
a dynamic electrical field (e.g., Quadrupole Ion Trap, Linear Ion Trap, Orbitrap, Quadrupole,
Time-of-Flight) or by applying a magnetic field (e.g., Fourier Transform Ion Cyclotron
Resonance).
The very popular quadrupole (Q) mass analyzer is a m/z-filter by applying a radio frequent
(RF) voltage between two pairs of rods (Paul and Steinwedel, 1953). The stability of the ion’s
trajectory in the quadrupole is balanced by its m/z value and the applied RF field, such that by
adjusting the parameters of the RF field, only ions with a specific m/z-value are selected and
reach the end of the quadrupole where they are detected or transferred to a second analyzer.
Similar to the quadrupole is the Quadrupole Ion Trap (QIT) as it also generates a 3D RF field,
though here ions are first trapped and then sequentially ejected from the QIT (March, 2009).
The Linear Ion Trap (LIT) in turn is similar to the QIT but now ions are trapped and ejected in
a 2D RF field, which results in higher ion injection e/ciencies and ion storage capacities, thus,
increasing the overall sensitivity (Makarov et al., 2006). The Time-of-Flight analyzer again uses
an electrical field to accelerate ions in a vacuum tube. The kinetic energy acquired by the ions
correlates with their mass, charge and applied voltage, and measurement of the flight time
finally allows calculation of their m/z-value.
The Orbitrap mass analyzer was introduced about a decade ago and surpassed the accuracy
of other mass analyzers by 1 to 2 orders of magnitude (Makarov, 2000). An Orbitrap uses an
inner and outer electrode, shaped to create an electrostatic field. When ions enter the Orbitrap,
they are trapped in an orbit around the inner electrode and the frequency of their rotation is
related to their m/z-value. An image current of this rotating ion is then Fourier transformed
into a frequency spectrum and in its turn converted into a mass spectrum. In the Fourier
Transform Ion Cyclotron Resonance (FT-ICR) mass analyzer, the ions are subjected to an

8 Improving the sensitivy and the specificity in peptide centric proteomics
oscillating electrical field combined with the perpendicular force of a magnetic field, together
bringing ions into rotation and, similar to the Orbitrap, a mass spectrum can be inferred
by measuring the frequency of this rotation (Mcla.erty, 1994). Each of the mass analyzers
described above can be placed in tandem with another (compatible) mass analyzer (Pappin et al.,
1993), thus enabling tandem mass spectrometry. Now, the first mass analyzer measures intact
ions (the precursor ions) and precursor ions with a given m/z-value are selected and fragmented
in the same (tandem-in-time) or a di.erent (tandem-in-space) mass analyzer. The resulting
fragments of the precursor ion are finally measured and lead to MS/MS spectra. Both the QIT
and the LIT are able to perform tandem MS by trapping, measuring, selecting and fragmenting
ions within one analyzer. Their main drawbacks are their low mass accuracy and their inability
of measuring small mass fragment ions such as immonium ions. Clearly, their main advantage
is their ability to perform MSn, during which fragment ions are isolated and further fragmented
and this was proven valuable for studying post-translationally modified peptides (Kameyama,
2006; Villén et al., 2008). ToF-ToF setups o.er both good mass accuracy (20-50 ppm) ion
sensitivity, and are very often coupled to a MALDI ion source. The Q-ToF yields similar quality,
but is preferentially coupled to an ESI source. Despite that the FT-ICR remains the most
accurate mass analyzer to date; its requirement of a magnetic field makes the instrument far
more cumbersome then the LTQ-Orbitrap. The LTQ-Orbitrap also provides highly accurate
mass measurement of precursors and su.ers from low fragment ion mass cuto., and fragment
ion mass errors typical to Ion Traps. However, the recently introduced LTQ-Orbitrap velos
overcomes these problems by introducing a Higher-Energy Collisional Dissociation cell (HCD)
(Olsen et al., 2009).
2.2.3 Detection
The third element required by a mass spectrometer is the detector and most often this is a
micro channel plate detector (MCP) (Wiza, 1979) consisting of an array of electron multipliers
(the channels) (Farnsworth, 1934). When a charged analyte exits the mass analyzer and collides
into the metallic coated surface (e.g., PbO) of an electron multiplier, an electron emitting
torrent is initiated through the channel. The resulting electron flow is measured and is
proportional to the number of charged analytes that started the electron emitting cascade.

9Introduction
2.3 Mass spectrometry methodologies
In peptide-centric proteomics, tandem MS is generally used to identify peptides (MS/MS
analysis) or to specifically detect and quantify peptides by selected reaction monitoring (SRM).
We will here describe the di.erent methods that are mainly applied to generate fragment ions.
The fragment ion nomenclature suggested by Roepstor. and Fohlman is here used (Roepstor.
and Fohlman, 1984) and illustrated in figure 1.
Figure 1. This figure shows the di"erent types of fragment ions that are generated upon
peptide dissociation. The figure that is shown here follows the nomenclature as suggested in
(Roepstor" and Fohlman, 1984).
2.3.1 Peptide fragmentation
Collision Induced Dissociation (CID) is the most commonly used method for peptide
fragmentation (Wells and McLuckey, 2005). In CID, precursor ions collide with inert gas atoms
(e.g., He and Ar) in a collision cell upon which mainly b- and y-fragment ions are created.
CID also produces immonium ions specific for individual amino acids (Falick et al., 1993) and
further readily dissociates labile peptide bonds (e.g., Xxx-Pro, Asp-Xxx) and unstable modified
residues (e.g., O-phosphates and glycans) (DeGnore and Qin, 1998; Huang et al., 2008).
Electron Transfer Dissociation (ETD) (Syka et al., 2004) and Electron Capture Dissociation
(ECD) (Zubarev et al., 1998) rely on an electron-based dissociation process and dominantly
produce c- and z-ions along the peptide backbone in a sequence-independent manner,
di.erent from CID which prefers labile peptide bonds. ECD is limited to be used in the FT-ICR

10 Improving the sensitivy and the specificity in peptide centric proteomics
cells and not widely implemented due to the cost of this analyzer. ETD on the other hand is
readily used in less expensive ion traps and thus more applied (e.g., for phosphoproteomics (Chi
et al., 2007; Molina et al., 2007)). Since ETD and ECD incorporate negatively charged electrons
in the positively charged peptides, these peptides need to be highly charged (e.g., 3+, 4+) or else
the signal of the fragment ions will be too weak resulting in less informative fragmentation
spectra.
2.3.2 Selected reaction monitoring
Selected reaction monitoring was introduced three decades ago (Kondrat et al., 1978), but
only recently got a fair amount of attention by the proteomics community (Picotti et al.,
2009; Stahl-Zeng et al., 2007). Triple quadrupoles are best suited for SRM, in which the first
quadrupole accurately filters a targeted precursor, the second quadrupole fragments this
precursor ion and the third quadrupole accurately filters for (a) specified fragment ion(s). Thus,
a peptide ion is transferred from the first to the last quadrupole and a fragment ion is recorded,
and such transitions are monitored through time. A few transitions per peptide (2 to 5) are often
exceptionally specific and monitoring them surpasses other methods in terms of sensitivity.
SRM is clearly predisposed for validation and quantification of previously identified peptides
(Lange et al., 2008).
3. Proteomic strategies
Two types of peptide-centric proteomics experiments are generally distinguished: qualitative
proteomics aiming at comprehensively mapping the presence of all proteins in a sample
and quantitative proteomics to quantify changes in protein abundance between samples.
Representative methods were here selected and include those that had most impact on peptide-
centric proteomics.

11Introduction
3.1 Qualitative proteomics
3.1.1 Proteome coverage
Inherent to proteomics is the absence of an amplification method (e.g., PCR in genomics)
prior to identification of an analyte. Consequently, when a low abundant, or in fact any given
protein is not identified, no conclusion can be drawn on whether it is absent from the sample
or falls outside the detection limits of the mass spectrometer. Throughout the years, this
has driven qualitative peptide-centric proteomics to produce ever growing lists of identified
peptides (from 100s to 1,000s and recently 10,000s), continuously increasing proteome
coverage.
Proteome coverage is mainly influenced by three factors (de Godoy et al., 2006). The first
factor is the sensitivity of the mass spectrometer, which defines the lowest amount of analyte
that can be detected. The latest generation instruments typically allow measurements in the
order of femtomoles or even attomoles (Olsen et al., 2009). The second factor is the dynamic
range of the instrument, that is the signal intensity range in which two distinct analytes can
be detected, which typically spans two to three orders of magnitude. The third determining
factor for proteome coverage is the duty cycle of the mass spectrometer, being the number
of fragmentation spectra (with a fair amount of quality) the mass spectrometer can produce
within a given timeframe. This varies from 1 spectrum per second for slower instruments, to
10 spectra per second for the last generation instruments (Olsen et al., 2009). Combined with
chromatographic resolution, this parameter also influences the number of peptides that will be
identified. Now given the high complexity of proteome samples, it is clear that even with the
fastest mass spectrometers not all peptides will be identified, a phenomenon known as random
sampling (Liu et al., 2004).
To tackle this random sampling issue, both technological and methodological proteomics
developments were made. Technological developments are mainly driven by vendors of mass
spectrometers, who release better performing and more specialized instruments. Such steady
developments enhance sensitivity, increase sequencing speed and enlarge dynamic range.

12 Improving the sensitivy and the specificity in peptide centric proteomics
Methodological developments are mainly driven by academic researchers and include inventive
strategies to reduce complexity of a peptide mixture resulting from proteome digestion. In this
respect, two main approaches can be distinguished: the peptide mixture is either extensively
fractionated prior to LC-MS/MS analysis, or only a targeted set of peptides related to the
proteomics experiment is selected and analyzed. The former is metaphorically termed “shotgun
proteomics”, while the latter is often referred to as “targeted proteomics”, but both diminish
the problems associated with dynamic range and sequencing speed and thereby increase the
probability for a peptide to be sequenced upon random sampling by mass spectrometers.
3.1.2 Shotgun proteomics
MUltiDimensional Protein Identification Technology (MUDPIT) was the first method that
employed extensive fractionation of a complex peptide mixture (Link et al., 1999; Washburn
et al., 2001). In their 2001 publication, the group of John Yates first separated a yeast tryptic
proteome digest by SCX in 15 fractions. These were then individually analyzed by LC-MS/MS.
By increasing the number of SCX fractions to 80, a further increase in proteome coverage was
achieved (Peng et al., 2003a).
Another popular method for shotgun proteomics is GeLC-MS/MS (de Godoy et al., 2006).
Here, intact proteins are separated by SDS-PAGE, the gel is then cut into multiple slices and
proteins are in-gel digested and the resulting peptides are analyzed by LC-MS/MS. Compared
to MUDPIT, GeLC-Ms/MS requires an order of magnitude less protein material. Furthermore,
abundant proteins will concentrate in distinct gel slices, such that peptides produced from these
proteins are not smeared over LC-MS/MS runs thereby increasing the chance of identifying
less abundant proteins. This combined protein-peptide separation was also exploited to detect
protein processing events (Dix et al., 2008). Yet another method is peptide IEF-LC-MS/MS, in
which a peptide mixture is fractionated by IEF prior to LC-MS/MS (de Godoy et al., 2008).
3.1.2.1. Drawbacks of shotgun proteomics
The strength of shotgun proteomics is that by random sampling a peptide mixture, an
overview of the proteome composition is readily generated in which many proteins are

13Introduction
identified by multiple peptides, which increases the reliability of such identifications. For
instance, in the initial MUDPIT study (Washburn et al., 2001), 5,530 distinct peptides were
identified in 1,484 yeast proteins, yielding an average of 3.72 peptides per protein. A similar
sample was studied with newer instruments using the GeLC-MS/MS method (de Godoy et
al., 2006), and provided a fourfold of identified peptides (20,893) in 2,003 yeast proteins, thus
yielding an average of 10.4 peptides per protein. While this increases confidence in protein
identifications, the moderate increase in protein identifications illustrates that a high number of
proteins remained subject to under-sampling. A follow-up study was published in 2008 in which
Orbitrap mass spectrometry resulted in 4,399 protein identifications (de Godoy et al., 2008), a
number similar to previously published Tandem A/nity Purification and Green Fluorescent
Protein tagged benchmark proteomes (Ghaemmaghami et al., 2003; Huh et al., 2003). However,
a considerably more complex proteome such as that from human cells remains challenging for
receiving full coverage with shotgun proteomics.
3.1.3 Targeted proteomics
Targeted proteomics uses strategies to extract a selected set of peptides from a whole
proteome digest and only analyzes these by LC-MS/MS. This selection is such that it is
representative for the analyzed proteome or pertinent to the goal of the proteome study.
Moreover, since a selection of peptides always yields a less dense peptide mixture, random
sampling tends to be reduced.
3.1.4 Sample complexity reduction
On average, tryptic digestion of a protein generates 50 peptides (see section 2.1), a large
number given that typically only a few are required for protein inference (Nesvizhskii and
Aebersold, 2005). This in turn o.ers an opportunity to lower sample complexity by lowering the
amount of peptides per protein.
Selection of cysteinyl peptides by Isotope Coded A/nity Tag (ICAT) labeling (Gygi et al.,
1999) probably is the hallmark of targeted proteomics. The ICAT molecule binds covalently to

14 Improving the sensitivy and the specificity in peptide centric proteomics
the free thiol group of cysteine and carries a biotin group which enables enrichment of ICAT-
modified cysteinyl peptides by avidin a/nity chromatography. Moreover, isotopic variants of
the ICAT molecule are introduced in the linker region, and these enable quantitative proteome
studies (see section 3.2).
Another e.ort to reduce sample complexity was introduced by the versatile COmbined
FRActional DIagonal Chromatography (COFRADIC) methodology, capable of, amongst
others, selecting cysteinyl and methionyl peptides (Gevaert et al., 2002; Gevaert et al., 2007).
COFRADIC’s core is the separation of a complex peptide mixture by two identical and
consecutive RP-HPLC separations. Between both separations, a modification reaction is
performed that alters the physicochemical properties of a targeted group of peptides. As a
result, altered peptides obtain a di.erent elution profile during the second RP-HPLC separation
by which they are distinguished from non-altered peptides. Clearly, by changing the actual
modification reaction, di.erent sets of peptides can be targeted and thus isolated. Table 1 lists
the various sorting protocols employed so far with the COFRADIC methodology.
The highest reduction in sample complexity comes from selecting only a single, though
representative peptide per protein. This can be accomplished by selecting either its N- or
C-terminal peptide and was in fact the motivation for developing N-terminal COFRADIC
(Gevaert et al., 2003). The actual modification reaction uses 2,4,6-Trinitrobenzene sulfonic acid
that renders the non-N-terminal peptides more hydrophobic such that N-terminal peptides are
readily isolated (see also (Staes et al., 2008)).

15Introduction
Table 1. This overview table shows the di!erent published COFRADIC strategies. The first column
defines the type of peptide that is targeted by the analysis, while the handle column describes
which action is used to trigger the shift, and the original research is referenced in the third
column.
3.1.5 Selection of post-translationally modified peptides
Post translational modifications (PTMs) are considered as a “cellular language” and therefore
obtain plenty of interest as they are key to understanding cellular phenotypes (Jensen, 2006).
PTMs either e.ect amino acid side-chains or peptide bonds (protein processing). Both are (in)
directly detectable by MS, yet, since modified peptides are hard to distinguish in a complex
mixture, various methods were developed to select or enrich particular modified peptides.
3.1.5.1. Proteolytic cleavage
Several targeted proteomic methodologies are readily applied for studying protein processing
events by selecting (neo-)N-terminal peptides (Doucet and Overall, 2008; Enoksson et al.,
2007; Gevaert et al., 2003; Mahrus et al., 2008; Timmer et al., 2007). The identified N-terminal
peptides either align at protein N-termini or at internal regions and, if the latter also match
criteria imposed by the applied selection strategy (e.g., modification state), the location of “neo-
N-terminal peptides” points to the actual protein processing events.

16 Improving the sensitivy and the specificity in peptide centric proteomics
3.1.5.2. Phosphorylation
Protein phosphorylation sites have been mapped in detail by targeting phosphorylated
peptides in a complex peptide mixture. Various methods have been described to achieve
this including immobilized metal ion chromatography (IMAC) (Andersson and Porath,
1986; Bonenfant et al., 2003), titanium dioxide chromatography (TiO2) (Pinkse et al., 2004),
hydrophilic interaction chromatography (HILIC) (Mcnulty and Annan, 2008) and SCX at low
pH (Beausoleil et al., 2004), all exploiting the unique physicochemical properties of the polar
phosphate group to separate phosphorylated peptides from non-phosphorylated peptides prior
to mass spectrometry analysis.
3.1.5.3. Glycosylation
Lectin a/nity chromatography has been extensively employed to enrich, depending on
the lectin(s) used, N-glycosylated or O-glycosylated peptides or proteins (Geng et al., 2001).
A di.erent approach is to chemically trap N-glycosylated peptides by hydrazide chemistry,
followed by PNGaseF-driven release (Zhang et al., 2004). Yet another approach enriches
O-GlcNAc modified peptides via a chemo-enzymatic strategy (Khidekel et al., 2007).
Clearly, more protein modifications are studied by targeted proteomics, including lysine
acetylation (Choudhary et al., 2009) and ubiquitination (Peng et al., 2003b), but the plethora
of possible protein modifications remains a formidable challenge in current proteomics. In
that respect, MS-driven targeted proteomics will prove indispensable for generating maps of
PTM prevalence. Yet, an additional step is required before PTMs can even be considered in
the perspective of systems biology and this is measurement of their abundance in a variety of
conditions (Aebersold and Mann, 2003). This is enabled by quantitative proteomics, which is the
topic of the next section.

17Introduction
3.2 Quantitative proteomics
Whereas qualitative proteomics aims to generate a compositional map of proteins,
quantitative proteomics extend this map with relative or absolute abundance information.
Quantitative proteomics is performed on samples di.ering in cellular phenotype (e.g., benign
versus malignant cancer), subjected to di.erent stimuli (e.g., control versus growth factor),
followed over time (e.g., cell cycle checkpoints), or on many other cellular states in which a
di.erential proteome composition might be expected by hypothesis-driven research (Jensen,
2006).
Various methods have been applied to carry out quantitative proteomics and initially
two groups can be distinguished. The first group of methods introduce mass tags that allow
di.erentiation between peptides from distinct samples during MS analysis. The second group
of label-free methods integrate aligned intensity profiles from LC-MS or MS/MS analyses to find
di.erences between samples.
Quantification methods that use mass tags can further be distinguished based on the step in
the protocol during which they introduce isotopic labels. Each protocol step introduces its own
variation, thus the sooner the labels are introduced, the sooner samples can be mixed together
and the less variation is introduced as illustrated in figure 2.

18 Improving the sensitivy and the specificity in peptide centric proteomics
Figure 2. This figure shows di"erent quantitation methodologies related to the time they are
introduced in a protocol. The gradient shape in the left illustrates how variation in between
samples increases as the introduction of quantitation is postponed throughout the protocol.
3.2.1 Metabolic labeling
Metabolic labeling of living cells or organisms was first achieved by culturing cells in
carbon-13 and/or nitrogen-15 containing nutrients, eventually rendering most carbon and/or
nitrogen containing molecules in a heavy form (Lahm and Langen, 2000), but, for proteome
analysis, metabolic labeling proved more e/cient by using essential amino acids.

19Introduction
3.2.1.1. SILAC (cell culture to organism)
Stable Isotope Labeling of Amino Acids in Cell Culture (SILAC) was introduced in 2002 by
the group of Matthias Mann and has been widely adopted ever since (Mann, 2006; Ong et al.,
2002). In SILAC an isotopic label is introduced metabolically by growing cell cultures in natural
medium or in SILAC medium in which one or more essential amino acids (e.g. Arg, Lys and
Met for mammalian cells) are only present in their “heavy form” (e.g. deuterated, carbon-13 and
nitrogen-15). Following a number of cell population doublings, all proteins derived from SILAC-
grown cell cultures are isotopically labeled. Normally, a control (light) peptide and one (or more)
SILAC-labeled (heavy) peptide(s) elute identical in a chromatographic setup but segregate in MS-
spectra by the SILAC-introduced mass di.erence(s). The MS intensity profile of the di.erently
labeled peptides is finally used for quantification.
The strength of SILAC-driven quantification lies in its early introduction in the experimental
protocol as this is expected to minimize variation in ratio measurements, thus finally yielding
more reproducible and accurate results. The main drawback is that an adequate protein
turnover is required and that the method is limited to systems that use essential amino acids.
Consequently, plants, bacteria, body fluids (e.g., urine, blood plasma) or other patient samples
cannot be studied by SILAC. For some model organisms, these limitations were overcome
by breeding them on a metabolic labeled diet until the organism was completely labeled for
subsequent quantitative experiments (Krijgsveld et al., 2003; Krueger et al., 2008).
3.2.2 Non-metabolic labeling
3.2.2.1. ICAT
The ICAT methodology enables both sample complexity reduction by selecting cysteinyl
peptides (see section 3.1.3) and protein quantification by introducing a mass tag via the ICAT
label (Han et al., 2001). Therefore, a control sample is post-metabolically labeled with one type
of ICAT label, while a second sample is labeled with another type of ICAT label. After avidin
purification of ICAT-tagged cysteinyl peptides, quantification of heavy and light peptides is
done in MS-spectra.

20 Improving the sensitivy and the specificity in peptide centric proteomics
3.2.2.2. Enzymatic peptide labeling with oxygen-18
Oxygen-18 labeling is an enzymatic labeling strategy for relative quantification of peptides
and proteins typically during or following tryptic digestion of proteomes (Staes et al., 2004).
Tryptic digestion is either conducted in light (H216O) or a heavy (H2
18O) water and, when
performed adequately, the resulting peptides are mass tagged by a 4 Da di.erence.
3.2.2.3. ITRAQ™
Isobaric Tags for Relative and Absolute Quantification (ITRAQ™) bind covalently to primary
amines (the alpha-amine at a protein’s N-terminus and the epsilon-amine at lysine side-chains)
(Ross et al., 2004). ITRAQ molecules are bivalent and built from a small reporter group and
a balancer group together forming an isobaric combination (same nominal mass), and joined
through a linker region that readily fragments in MS/MS mode. The isobaric nature of the
tags implies that the mass of peptides tagged with di.erent ITRAQ molecules (thus di.erent
samples) is identical during MS survey, yet the ITRAQ label renders reporter ions specific to
each sample in MS/MS mode. As such, samples are compared using the intensities of the ITRAQ
reporter ions in the peptide fragmentation spectra. Clearly, the main advantage of ITRAQ is
that its multiplexed nature enables to compare up to 8 samples in a single MS/MS spectrum, yet
statistical variation in ratio measurement is expected to be enlarged due to late introduction in
the overall protocol.
3.2.2.4. Internal standard peptides
By adding a known amount internal standard peptides, into a peptide mixture the further
determined heavy-to-light peptide intensity ratio can be utilized to estimate the absolute
amount of peptides present in the sample (Gerber et al., 2003; Lange et al., 2008). Therefore,
heavy labeled peptides (e.g., 13-carbon or 15-nitrogen) are typically used to be monitored by SRM
(section 2.3.3). One drawback is that only a limited number of internal standard peptides can
be monitored simultaneously, yet, Malmström et al. recently showed how only a few absolute
protein quantifications are su/cient to extrapolate proteome-wide absolute quantification
numbers with a moderate error rate (Malmström et al., 2009).

21Introduction
3.2.3 Label-free methods
Quantitative proteomics can also be achieved without employing stable isotopes and such
methods are accordingly referred to as label-free quantitative proteomics.
3.2.3.1. Spectral counting
Spectral counting starts with the assumption that more abundant peptides are more
likely to get selected for fragmentation than less abundant peptides (Choi et al., 2008). Thus,
since a peptide can be expected to ionize equally well in di.erent samples, the number
of fragmentation events should be fairly alike too, and can therefore be used as a relative
quantification measure between multiple samples. The simplicity of the method is its main
strength, and although it is by far the least accurate method to employ quantitative proteomics,
it can still be useful for monitoring large quantitative proteomic perturbations of a system.
3.2.3.2. Intensity-based quantification
Intensity-based quantification considers a peptide as a feature with two coordinates; its
retention time and its m/z value and records an MS-derived intensity value for each feature
(Wiener et al., 2004). Separate LC-MS analyses from distinct samples can then be aligned and
normalized by these coordinates, while the intensity values provide quantitative information
for the aligned features across distinct samples. When an interesting (deviating) feature is
observed, a MS/MS sequencing attempt is made to identify the origin of the feature, which is
not necessarily successful. Since the samples are subjected to mass spectrometry more than
once, o.-line LC-MALDI-MS(/MS) is the platform-of-choice for this type of quantification.
The strength of this method is that it readily scales with the number of samples, thereby being
the only quantitative method providing appropriate statistical analysis, which makes label-free
intensity based quantification a good candidate for biomarker discovery.

22 Improving the sensitivy and the specificity in peptide centric proteomics
4. Working with proteomics data
From a reductionist viewpoint, a proteomics study has a typical structure of subsequent
steps: breaking the cells, extracting the proteins, digesting the proteins into peptides, separating
the peptides, and finally analyzing the peptides by mass spectrometry. The output of the
mass spectrometer marks a drastic change, as it is purely numerical. For the remainder of the
protocol, these data are then employed to reconstruct information about the studied sample,
which is the domain of (bio-) informatics.
4.1 Data processing
The raw MS and MS/MS mass spectrometry data is typically first processed by instrument
dependent or independent signal processing software (e.g, Excalibur from Thermo Fisher,
Masslynx from Waters, Mascot Distiller from Matrix Science, OpenMS (Sturm et al., 2008),
MaxQuant (Cox and Mann, 2008)). The processing actions typically involve peak picking,
smoothing, noise removal, mass calibration by internal standard, isotope correction, charge
deconvolution etc (Katajamaa and Oresic, 2007). Some of these processing actions are optional
and others are user customizable, yet since the impact of each of these processing actions
on the raw data persists to the level of peptide and protein identification and quantitation,
manipulation of these actions should be well understood by the user. Furthermore, it is critical
that the applied processing steps are preserved in the data format. There is also an orthogonal
aspect, requiring the raw (or processed) data from di.erent instruments to be rendered in a
common, readily consumable and open standardized data format[RAW]. The mzML standard
has been developed and released by the HUPO Proteomics Standards Initiative (PSI)2 for these
purposes (maintaining data processing history, and providing a common, open representation
of mass spectrometry data), and has been widely implemented in mass spectrometry software.
2 !e HUPO Proteomics Standards Initiative (PSI) de"nes community standards for data representation in proteomics to facilitate data comparison, exchange and veri"cation. http://www.psidev.info/

23Introduction
4.2 Peptide identification
4.2.1 Sequence assignment
In order to determine the identity of a peptide based on its MS/MS spectrum, the
fragmentation data can be interpreted by various software methods, all exploiting the (partial)
sequence information inherent in a fragmentation spectrum. Because the fragmentation
process is at least partially sequence dependent, di.erent fragment ions do not have equal
chances of occurring when a given ion is fragmented. As a consequence, a fragmentation
spectrum consists of a heterogeneous combination of high and low intensity ion signals,
along with noise peaks. Certain fragment ions will furthermore be altogether absent from the
spectrum. Still, such a complicated and incomplete fragmentation spectrum can capture enough
information about the peptide sequence that an attempt can be made to identify the peptide.
The first method to identify peptides from MS/MS spectra, described by Mann and Wilm,
was based on so-called peptide sequence tags in which a peptide sequence tag is formed by
several consecutive ion signals in the fragmentation spectrum (Mann and Wilm, 1994). The
approach extracts a small stretch of sequence information directly from the spectrum, and
appends the remaining terminal mass at either end. In the next step, this sequence tag is
searched against the peptides resulting from an in-silico digested protein sequence database
(Reisinger and Martens, 2009). Any peptide that contains the small sequence along with the
correct flanking masses is then a candidate for identification.
A second, and currently most popular, method is implemented in database search algorithms,
which also make use of sequence databases (Nesvizhskii et al., 2007). These algorithms first
constrain all possible peptides by checking their theoretical mass against a mass interval around
the experimental precursor mass. The matching peptides are then in silico fragmented, and
these computationally derived fragmentation spectra are then matched to the experimental
fragmentation spectrum. The best ranked match is finally hypothesized as the peptide sequence
that led to the experimental fragmentation spectrum. This best match is not necessarily correct
however, as the best match can still be a very poor match indeed. Many search algorithms

24 Improving the sensitivy and the specificity in peptide centric proteomics
therefore calculate some kind of score (typically probability based) that allows the distinction
between reliable and spurious peptide hits. The first published search algorithm was SEQUEST
(Yates et al., 1995), but several other commercial as well as free algorithms exist today, including
Mascot (Perkins et al., 1999), X!Tandem (Fenyo and Beavis, 2003), Phenyx (Colinge et al., 2003),
OMSSA (Geer et al., 2004).
A third method to assign a peptide sequence to a fragmentation spectrum is through de
novo sequencing, in which no a priori information from a sequence database is used. In de
novo sequencing, a peptide sequence is computationally derived purely from the information
captured within a fragmentation spectrum (Frank and Pevzner, 2005; Johnson and Taylor,
2002). The methodology performs rather well when fragmentation is fairly complete, such
that a signal is found for most theoretically expected fragment ions in a series. But larger gaps
have a detrimental impact on the performance of de novo sequencing algorithms, introducing
substantial ambiguity in the possible sequence. De novo sequencing is therefore usually
restricted to specialized applications, for instance when no protein sequence database is
available for the organism under study.
4.2.2 Error estimation
To provide adequate quality within a proteomics experiment, the peptide identifications
are further evaluated mainly by estimating the rate of false positive peptide identifications in
results. This is mostly done by employing a target-decoy database searching strategy (Elias and
Gygi, 2007). This approach performs the spectrum to peptide matching process in duplicate.
The first search employs the normal (or ‘target’) sequence database that contains sequences
relevant to the sample, while the second search relies on a decoy sequence database which
contains only nonsense sequences that should not be present in the sample. This type of
database is commonly created by reversing or shu0ing the protein sequences from the target
database. Each peptide identified in this decoy sequence database search can thus be considered
a false positive (or rather: random) peptide identification. Assuming that this error rate in the
decoy database is reflected in the target database, a false discovery rate can be estimated for the
experimental results obtained from the target sequence database. Note that this approach does

25Introduction
not point out the actual false positive peptide identifications themselves; it merely estimates the
overall level of false positive peptides identified in the obtained results.
The use and value of employing decoy sequence databases to verify whether the required
quality is achieved within a results set, has been a topic of debate ever since the onset of peptide
centric proteomics (see (Nesvizhskii et al., 2007) for an excellent review).
Another database search algorithm parameter that can be evaluated is the false negative
rate within the obtained results. An example of high false negative rate can be obtained by
attempting to identify a set of fragmentation spectra generated from human liver tissue in
a yeast protein sequence database. While some fragmentation spectra will be identified to
peptides from highly conserved proteins, most fragmentation spectra remain unidentified
simply because the appropriate sequence information is lacking. The amount of highly
informative (or high quality) spectra that remain unassigned in a given dataset can be assessed
by spectrum quality methods, which rate a fragmentation spectrum by its information content
(e.g., number of ions, ion intensities, signal to noise ratio) (Bern et al., 2004; Flikka et al., 2006;
Hoopmann et al., 2007; Nesvizhskii et al., 2006; Xu et al., 2005). When a large amount of highly
informative fragmentation spectra remain unidentified, then the means for interpreting those
fragmentation spectra should be scrutinized, as the results seemingly comprise a large amount
of false negatives.
4.2.3 Quality validation
After fragmentation spectra have been identified by a database search algorithm, the
identifications can be subjected to validation methodologies. These approaches tend to employ
information complementary to the database search algorithm to remove a maximum of false
positive peptide identifications while incurring a minimal loss in sensitivity (i.e., removing as
few true positives as possible).
Historically, a peptide centric proteomic analysis generated only a few hundreds of peptide
identifications per analysis, thus manually validating these was a feasible endeavor for a

26 Improving the sensitivy and the specificity in peptide centric proteomics
mass spectrometry expert. However, as the number of peptide identifications grew to tens
of thousands during the last decade, manual validation became unworkable and automated
validation methods were introduced. These typically implement statistical methods (e.g., Linear
Discriminant Analysis (Keller et al., 2002, Support Vector Machines (Kall et al., 2007), Hidden
Markov Models (Wan et al., 2006)) utilizing various parameters related to the quality of the
peptide identification (e.g., precursor mass error, ion coverage, max sequence tag length) to
further improve the separation between correct and incorrect peptide identifications. Although
these standard parameters perform well for standard analyses, they often struggle to cope with
novel types of information relevant to new protocols. A possible solution is to build tools for
the semi-automatic validation of peptide identifications where the mass spectrometry expert
interactively defines a set of applicable rules for a particular experiment, reflecting the expert’s
knowledge about the experiment (Helsens et al., 2008). Once established, these rule sets can be
used to automate the peptide identification evaluation, separating suspicious from trustworthy
peptide identifications.
4.3 Protein inference
After the peptides have been successfully identified from the acquired MS/MS spectra, they
are mapped to their parent proteins. This mapping is again performed using the information in
a protein sequence database and ideally results in a one-to-one mapping, in which a particular
peptide sequence is uniquely mapped onto a single protein. For the specific case of the human
complement of the UniProtKB/SwissProt database, Figure 3 shows that more than 90% of the
tryptic peptides can be mapped one-to-one. Other databases tend to fare much worse, with only
45 to 25% of the tryptic peptides uniquely mapped, depending on the exact database used. The
overall challenge of inferring proteins from a list of peptides is known as the protein inference
problem, and the relevant issues are clearly and comprehensively described in (Nesvizhskii and
Aebersold, 2005). Even though no method to this problem can be absolutely conclusive (Martens
and Hermjakob, 2007), several approaches have been suggested to tackle this problem. The most
optimistic approach includes all possible protein mappings, such that if peptide ‘A’ maps both to
protein ‘1’ and protein ‘2’, then both are included in the protein results list. A more pessimistic
approach assumes that only one of both proteins truly occurs within the sample, and attempts

27Introduction
to scrutinize the best option by utilizing additional information. The Protein Prophet and
IDPicker software implementations for instance, first generate all possible peptide to protein
mappings, and then employ algorithms that gravitate towards a minimal protein set identified
by the largest number of (unique) peptides (Nesvizhskii et al., 2003; Zhang et al., 2007). A third
approach relies on using the amount of annotation provided for a protein, postulating that
highly annotated proteins are most likely to be detected than hypothetical protein entries for
which no evidence has yet been encountered (Martens and Hermjakob, 2007). Interestingly,
quantitative information of peptides could potentially also be used to attribute peptides to
proteins, as suggested by (Nesvizhskii and Aebersold, 2005).
Figure 3. This figure shows lines for the total number of pepvtides (content) and the number
of unique peptides (information) generated by an in-silico trypsin digestion of popular
protein sequence databases (right axis). The information to content ratio is further shown by
a bar chart (left axis), where the bar height shows the proportion of unique peptides in each
database.

28 Improving the sensitivy and the specificity in peptide centric proteomics
4.4 Functional analyses
The resulting list of peptides and proteins is most often not yet meaningful in terms of the
underlying biology (Mueller et al., 2007). In order to facilitate the step from the experimental
results to biological insight, several free software tools for functional analysis have been
developed over the past few years.
The Cytoscape tool visualizes proteins and their interactions in dynamic networks that
can be highly customized with biological annotations (Shannon et al., 2003). By using publicly
known protein-protein interaction data for example, regulation of protein complexes or
signaling cascades is easily analyzed. Moreover, the BINGO plugin to Cytoscape enables Gene
Ontology driven analyses from parts of the network (Maere et al., 2005). Other tools such as
DAVID (Dennis et al., 2003), PANDORA (Kaplan et al., 2003) and Ingenuity Pathway Analysis
(Ingenuity® Systems, http://www.ingenuity.com) also attempt to classify protein results lists
into functional groups.
But beyond the annotation and contextualizing of the identified proteins, other analyses
can be useful as well. A nice example is provided by tools that analyze sequence conservation in
aligned nucleic or amino acid sequences, such as the sequence logos that were first described
two decades ago, and have recently been refined for protein sequence analysis (Colaert et al.,
2009; Schneider and Stephens, 1990).
Obviously, bioinformatic approaches to functional analysis are inherently limited.
Various wet-lab methodologies exist however, that can be used to further investigate
proteins of interest. At the molecular level, these can range from Western blot analysis, over
immunohistochemical approaches, down to in vivo fluorescence and interaction screening. Yet
the e.ect of protein changes can also be assessed at the level of the whole cell or organism, by
performing knock-out or knock-down experiments and observing the altered state of the cell or
organism, possibly in light of a certain environmental stimulus.

29Introduction
4.5 Data management
The data workflow described in previous sections, from generating fragmentation spectra
to identifying peptides and inferring proteins, has to be adequately managed at several
levels. The first level of data management is typically established by a laboratory information
management system (LIMS) implementation (Hakkinen et al., 2009; Hartler et al., 2007;
Helsens et al., 2010; Matthiesen et al., 2005; Rauch et al., 2006). These systems track and register
data actions (e.g., storing newly generated fragmentation spectra, identifying fragmentation
spectra into peptides) in order to create a queryable, historical log for the experimental results.
Such a log enables monitoring of who performed which action at what time, essential for data
provenance. Moreover, a convenient access point is thereby created for the retrieval of data and
results. Furthermore, adequate data management greatly facilitates the implementation and
adoption of standardized data processing workflows, which in turn result in a net increase in
productivity. Finally, organizing data from di.erent experiments in an identical manner enables
inspiring meta-analyses between distinct experiments.
The second level of data management is maintained by public data repositories such as
PRIDE (Martens et al., 2005), NCBI Peptidome (Slotta et al., 2009), PeptideAtlas (Desiere et
al., 2006) or GPMDB (Craig et al., 2004). Proteomic journal guidelines typically recommend
or require storage of results in public data repositories to enable community driven quality
control for both peer-reviewers and motivated readers. Furthermore, this also enables results
aggregation of independent laboratories, which proves useful for genome annotating endeavors,
meta analyses discovering general proteomic result biases (Klie et al., 2008), and overall
methodological evaluations (Mueller et al., 2008).

2
Results

31Results
Section 2. Results
The main objective of the thesis was to improve both the sensitivity and the specificity of
peptide centric proteome analysis.
More specifically, we aimed to achieve this at the level of the assignment of MS/MS spectra to
peptides. Improving sensitivity is important for increasing the proteome coverage, as well as the
reproducibility of the measurements. Improving the specificity on the other hand, will decrease
the number of incorrect peptide identifications reported. Improving these two parameters will
allow a more comprehensive and more reliable analysis of the proteome, directly improving the
usability of proteomics as a foundation for subsequent analysis and validation, for instance in
the case of biomarker discovery.
First of all, we developed the necessary infrastructure to process Mascot search results into a
dynamic object model: the MascotDatfile Java library. Second, managing the obtained details of
the peptide identifications required additions to the ms_lims data management system. Third,
in order to use these data to improve both specificity and sensitivity, we developed the highly
adaptable Peptizer platform. Fourth, to further increase sensitivity, a spectrum quality workflow
was implemented, and peptides carrying unanticipated modifications were identified. Finally,
these approaches were applied in a study of the yeast N-terminal proteome to verify known, and
discover new and alternative translation initiation sites.


33Results MascotDatfile
1. Processing and managing MS/MS results
1.1 MascotDatfile: An open-source library to fully parse and analyse MASCOT
MS/MS search results
The MascotDatfile library was built to provide programmatic access to Mascot search results.
It consists of a series of classes representing distinct archetypes for peptides, proteins, MS/MS
spectra and search parameters, all present within a Mascot search result file. Moreover, each
of these classes implements methods to work with the information they contain. For example,
the class representing a peptide (PeptideHit) can calculate the theoretical fragment ions for its
sequence. These can then in turn be matched to an MS/MS spectrum (Query).
MascotDatfile has been continuously updated over time from the initial release at version
1.0 up to version 2.3.3 at the time of writing. The most significant addition to the library was
the indexing strategy introduced in version 2.0. This approach overcomes memory issues
encountered when reading very large Mascot result files by first indexing the binary o.sets
of relevant sections of information within a file, and then only fetching appropriate sections
on-the-fly when required. As such, the indexing strategy now readily allows parsing of Mascot
results files containing peptide identifications of at least 500,000 MS/MS spectra (~1 gigabyte
file size). Other relevant additions to the MascotDatfile library are the implementation of
Mascot error tolerant search and Mascot decoy database searches into the object model of the
library. Furthermore, we created a simple PDF export functionality to facilitate compliance
with publishing guidelines of major proteomic journals (e.g., Molecular and Cellular Proteomics
(Bradshaw et al., 2006)). The theoretical fragmentation model has also been updated to mirror
the fragment ion types that can be expected based upon the employed dissociation method;
for example, upon applying ECD, MascotDatfile will automatically attempt to match c- and z-
fragment ions as well.

34 Improving the sensitivy and the specificity in peptide centric proteomics
MascotDatfile is available as an open-source project, allowing anyone interested to alter,
update or scrutinize the code. Furthermore, the library follows a standardized Apache Maven
1 project structure, which dramatically lowers the bar for an external Java developer to start
working with the library, and facilitates proper version control following bug fixes or feature
introductions, hence facilitating project management and release cycles of the MascotDatfile
project.
The third-party interest in the MascotDatfile library is demonstrated by the access statistics
of the MascotDatfile project website, tracing visitors on a daily basis over the last two years
(Figure 4).
The MascotDatfile library thus provided an essential piece of infrastructure, and was used
throughout all subsequent work presented in this thesis.

35Results MascotDatfile
Figure 4. This figure shows the quarterly MascotDatfile website statistics, illustrating the
popularity of the library. The page load displays the number of times any page on the site
has been visited. The number of unique visitors corresponds to the number of unique IP
addresses that have visited the site, while the first time visitors list the number of IP addresses
that have visited the site for the first time. Finally, the number of returning visitors shows the
number of IP addresses that have accessed the site more than once, for instance to retrieve
newer versions over time.

MascotDatfile manuscript

37Results MascotDatfile
TECHNICAL BRIEF
MascotDatfile: An open-source library to fully parse andanalyse MASCOT MS/MS search results
Kenny Helsens1*, Lennart Martens1, 2*, Joël Vandekerckhove1 and Kris Gevaert1
1 Department of Biochemistry and Medical Protein Research, Faculty of Medicine andHealth Sciences, Flanders Interuniversity Institute for Biotechnology, Ghent University, Ghent, Belgium
2 EMBL Outstation, European Bioinformatics Institute, Wellcome Trust Genome Campus, Hinxton,Cambridge, UK
MS-based protein identification is an important part of both gel-based and gel-free proteomestudies. The MASCOT search engine (http://www.matrixscience.com) provides one of the mostpopular automated algorithms for this task. Here we present an open-source software librarywritten in Java that parses raw MASCOT results into an easily accessible and fully functionalobject model (http://genesis.ugent.be/MascotDatfile). Several scripts based on this library areprovided as examples, allowing direct automation of important routine tasks involved in proces-sing peptide identifications.
Received: September 8, 2006Revised: November 6, 2006
Accepted: November 7, 2006
Keywords:Bioinformatics / Protein identification
Proteomics 2006, 6, 0000–0000 1
MS is the method of choice for protein identification inproteome studies. The identification typically follows thebottom-up approach wherein isolated proteins or proteinmixtures are first subjected to a proteolytic digest and theresulting peptides are subsequently analysed by the massspectrometer after chromatographic separation. This analy-sis usually consists of recording the intact mass of the pep-tide as well as the masses of its fragment ions after inducedor metastable fragmentation. The resulting peptide frag-mentation or MS/MS spectrum is then forwarded to a spe-cialised search algorithm which matches the obtained ionsagainst theoretical fragmentation spectra of peptidesobtained from an in silico digest of proteins in a sequencedatabase. The result of this matching procedure is reportedto the user, often accompanied by an expectancy value orscore threshold that allows the user to distinguish betweentrue and false positives [1]. Several free and commercial
search algorithms are available for protein identification,including SEQUEST [2], MASCOT [3], OMSSA [4] andX!Tandem [5].
The results reported by these programs are often sub-jected to further analysis by man or machine in order toincrease the overall quality of the identifications [6–8]. Thiscomprehensive evaluation of the identifications necessarilyrelies on the ability to quickly read and process the output ofthe search engine in question for display and analysis. Inorder to achieve this for the results of the popular MASCOTsearch engine when using MS/MS spectra as data input, wedeveloped the MascotDatfile software library presented here.It is an easy-to-use and fully documented Java library thatparses one or more MASCOT MS/MS search results files(datfiles) into a convenient and detailed object model, deliv-ering far more power than the format conversion providedby tools such as mres2x [9] and MASCOT2XML (http://sashimi.sourceforge.net/software_tpp.html). The libraryretains all information present in the datfile and auto-matically extracts modification information, fragment ionsand accurate identification thresholds for individual spectra.MASCOT versions from 1.8 to 2.1 (the current release) aresupported.
Correspondence: Dr. Lennart Martens, EMBL Outstation, Europe-an Bioinformatics Institute, Wellcome Trust Genome Campus,Hinxton, Cambridge, UKE-mail: [email protected]: 144-1223-494-484
Abbreviation: UML, unified modeling language * Both these authors contributed equally to this work.
DOI 10.1002/pmic.200600682
! 2006 WILEY-VCH Verlag GmbH & Co. KGaA, Weinheim www.proteomics-journal.com

38 Improving the sensitivy and the specificity in peptide centric proteomics
2 K. Helsens et al. Proteomics 2006, 6, 0000–0000
Figure 1. UML class diagram of the MascotDatfile component. This diagram shows all MascotDatfile objects and their relations.
! 2006 WILEY-VCH Verlag GmbH & Co. KGaA, Weinheim www.proteomics-journal.com

39Results MascotDatfile
Proteomics 2006, 6, 0000–0000 Bioinformatics 3
The Unified Modeling Language (UML) class diagramfor the library is depicted in Fig. 1 and is centered on theMascotDatfile object, which represents the contents of a sin-gle datfile. The full list of submitted fragmentation spectracan be retrieved as a collection of Query objects, each ofwhich can be easily mapped to all matching peptide sequen-ces and their scores using the QueryToPeptideHit map.Inversely, the PeptideToQueryMap will return a collection ofQuery objects that led to the identification of a given modifiedsequence.
Each PeptideHit instance can, amongst others, report onthe matching sequence, its ion score, the accurate identitythreshold and any fixed and variable modifications it carries.A PeptideHit also has the ability to annotate its sequence insingle-letter code with these modifications and modifiedresidues or peptide termini are thus readily identified at theirexact locations – a substantial improvement over the stand-ard HTML output given by MASCOT. It is of note that bothfixed and variable modifications are highlighted, and thatthey can be differentiated by the presence of an asterisk forfixed modifications. Correspondingly, the UML class dia-gram shows both FixedModification and VariableModificationobjects, which are both instances of the parent Modificationobject. Furthermore, a PeptideHit can produce a PeptideHit-Annotation object that calculates all theoretical fragment ionsfor that peptide sequence. These fragment ions can then bematched to an MS/MS spectrum. Thus, by sending a Queryobject to a PeptideHitAnnotation instance, a collection ofmatched fragment ions for that Query will be returned. Thisfeature may suit many different purposes including visuali-sation of matched fragment ions on MS/MS spectra, calcu-lating the sequence coverage of an identified peptide by aparticular set of fragment ions and assessing the fragmenta-tion behaviour of peptides in particular mass spectrometers.Since the datfile advertises the contributions made by thedifferent fragment ion types to the final ion score, this infor-mation is also available. Indeed, knowing which ions weredeemed important by the algorithm in assigning the identi-fication is a crucial piece of information that is currentlywidely disregarded in the manual or automatic validation ofsuggested identifications.
The MascotDatfile software also comes with a number ofstand-alone applications that allow users to immediatelyapply the power of the library to existing datfiles. The Spec-trumViewer application can load a datfile from a disc drive ora MASCOT server URL and can visualise the user’s choice ofspectrum and peptide identification from that datfile in anannotated and fully interactive graphical display. Also dis-played are the m/z and charge (if known) of the originalprecursor, the identified peptide sequence with annotatedmodifications and the contributions of each fragment ion tothe final score. The SequenceCoverage application will write
all best-scoring PeptideHits from a datfile into a comma-separated values (CSV) file, reporting on the peptidesequences (both with and without annotated modifications),the peptide lengths, the ion scores and the detailed fragmention coverage for each peptide. The latter is especially impor-tant for automated analysis and is presented as b-ion, y-ionand total-ion coverage. These can be calculated using multi-ple matching methods, including the one used by the MAS-COT engine to score the identification as well as a morecomprehensive one for exploration purposes. The Modified-PeptideHits application performs essentially the same task,but retains only those identifications that contain one ormore specified modifications.
Apart from their immediate use as processing and vali-dation tools, these applications are also ideally suited asexamples of how to make use of the MascotDatfile library inone’s own code. The library is quite fast – parsing a datfileconsisting of a thousand queries and their peptidehits takesroughly 3 s on a laptop computer. Additionally, wheneversearch results are spread over multiple datfiles, the softwareallows various forms of data consolidation across these resultfiles to fit the objectives of the programmer.
The MascotDatfile library is open source under theApache 2 license and the documentation, scripts and exam-ples, crossplatform binaries and source files can be down-loaded from http://genesis.UGent.be/MascotDatfile.
K. G. is a Postdoctoral Fellow and L. M. is a Research Assis-tant of the Fund for Scientific Research-Flanders (Belgium)(F.W.O. Vlaanderen).
References
[1] Aebersold, R., Mann, M., Nature 2003, 422, 198–207.
[2] Eng, J., McCormack, A. L., Yates, J. R., III, J. Am. Soc. MassSpectrom. 1994, 5, 976–989.
[3] Perkins, D. N., Pappin, D. J., Creasy, D. M., Cottrell, J. S.,Electrophoresis 1999, 20, 3551–3567.
[4] Geer, L. Y., Markey, S. P., Kowalak, J. A., Wagner, L. et al., J.Proteome Res. 2004, 3, 958–964.
[5] Fenyo, D., Beavis, R. C., Anal. Chem. 2003, 75, 768–774.
[6] Keller, A., Nesvizhskii, A. I., Kolker, E., Aebersold, R., Anal.Chem. 2002, 74, 5383–5392.
[7] Moore, R. E., Young, M. K., Lee, T. D., J. Am. Soc. Mass Spec-trom. 2002, 13, 378–386.
[8] Li, F., Sun, W., Gao, Y., Wang, J., Rapid Commun. MassSpectrom. 2004, 18, 1655–1659.
[9] Grosse-Coosmann, F., Boehm, A. M., Sickmann, A., BMCBioinformatics 2005, 6, 290.
! 2006 WILEY-VCH Verlag GmbH & Co. KGaA, Weinheim www.proteomics-journal.com

“A relational model provides a basis for a high
level data language which will yield maximal
independence between user programs on the
one hand, and machine representation and
organization of data on the other.”
-- Codd EF

41Results Ms_lims
1.2 Ms_lims: an open-source laboratory information management system for
mass spectrometry-driven proteomics
The concepts underlying relational database management systems for the management
of large amounts of data were described by Codd in 1970, and have formed the basis for
computational data management for over four decades in disciplines ranging from finance to
government and science. Relational modeling of data implies the grouping of closely associated
attributes into so-called relations. Moreover, since a single attribute is allowed to occur in
di.erent relations, attributes can be used to tie up one or more relations. As such, a relational
model o.ers a competent structure for treating redundancy and consistency of relations within
data.
A basic relational system for storing data associated with peptide centric proteomics called
ms_lims was initially developed by Prof. Dr. Lennart Martens in 2003. In essence, this system
defines relations for an MS/MS spectrum, a mass spectrometric analysis run, an identified
peptide, and a project. Each of these relations contain their specific attributes such as the total
ion intensity for an MS/MS spectrum, or the amino acid sequence for a peptide. Furthermore,
ms_lims provides user-oriented client tools that can insert data into, and extract data out of
the system. The user remains unaware of the underlying data organization throughout these
operations.
In the course of the work performed for this thesis, it became necessary to extend ms_lims
with novel applications as well as data structures. These extensions deal with four important
aspects: (i) usability of the system, (ii) incorporation of quantitative data, (iii) integration of
post-identification quality control, and (iv) coupling of automated quality control of spectra in
order to obtain high-quality, but unidentified MS/MS spectra.

42 Improving the sensitivy and the specificity in peptide centric proteomics
The usability of the system was improved by creating a configuration tool to facilitate the
installation and maintenance of ms_lims, enabling the automatic deployment of the relational
model into an existing SQL database. Furthermore, this tool can also be used to manage users,
protocols, and instruments, and can readily execute structural updates on the relational model
through ‘.cdf’ files when required (e.g., for new major versions of the software).
For the inclusion of quantitative information, we extended the ms_lims relational model to
capture quantitative relations, as well as appropriate attribute links between quantitative data
and the corresponding peptide identifications.
As an example, figure 5 provides a triple SILAC labeling scenario, where the expression
level of a single protein (peptide) is relatively quantified across three conditions by the
intensity profile of the three corresponding peptide envelopes. Do note that the example
follows a realistic scenario in which the light-labeled peptide was identified two times, the
medium-labeled peptide only once, and the heavy-labeled peptide was not identified at all.
But the isotope envelope of the heavy peptide can be identified through inference from the
identification of the light and medium peptides, and the corresponding MS intensity profile
retains valuable quantitative information. To manage such a scenario, we have introduced the
identification_to_quantation and quantitation_group relations in the ms_lims database model.
The identification_to_quantitation relation ties one or more peptide identifications to the
corresponding label type (e.g., light, medium, heavy) on the one hand, and to a quantitation_
group on the other hand. At the same time, quantitation entries are also cross-linked through
this quantitation_group, thus providing an easily traversable path from the identifications to a
quantitative ratio (e.g., Heavy to Light ratio) and vice versa. This seemingly contrived structure
allows ms_lims to store quantitative information on ‘medium to heavy’ and ‘light to heavy’
ratios, even though the heavy peptide was never identified via MS/MS.

43Results Ms_lims
Figure 5. This figure illustrates how quantitative information is managed by ms_lims. The
example shows the intensity profile of a light, medium and heavy peptide captured in an
MS spectrum from a triplexed SILAC experiment. In the example, the light and the medium
peptides were identified, while the heavy peptide was not. The MS intensity profile of the
heavy peptide does capture relevant quantitative information however. To manage this, ms_
lims uses the identification_to_quantitation and the quantitation_group relations to connect
the peptide identification to quantitations, that each hold an actual peptide intensity ratio.

44 Improving the sensitivy and the specificity in peptide centric proteomics
The quantitation extension to the relational model of ms_lims was introduced in 2008, and
has since been applied to several distinct quantitation methodologies such as SILAC and iTRAQ.
Post-identification quality control of peptide identifications has been introduced in
ms_lims by means of the Peptizer application, which is described in detail in section 2 of the
results. While the native Peptizer application already provided functions to export validation
results into a variety of distinct file formats, it was also important to persist manual validation
in the relational model of ms_lims. As such, a validation table was introduced into the
relational model of ms_lims, tied to the peptide identification table. In addition, Peptizer
has been made directly accessible from within ms_lims, thereby enabling the validation of
peptide identifications of specific interest (e.g., only phosphorylated peptides) or all peptide
identifications from a user-defined ms_lims project.
Finally, work was carried out to couple automated spectrum quality classification with
ms_lims. The usefulness of such quality assessment of MS/MS spectra has been thoroughly
described in the literature (Bern et al., 2004; Flikka et al., 2006; Hoopmann et al., 2007;
Nesvizhskii et al., 2006; Wu et al., 2008; Xu et al., 2005). In the course of Jolien Hollebeke’s
Master thesis, we have therefore created a graphical user interface that links ms_lims and
the spectrum quality algorithm developed previously by the group (Flikka et al., 2006). The
algorithm is available as an open-source Java library named SpectrumQuality and provides
methods to isolate an array of quality-related features for each MS/MS spectrum. When a
quality label (e.g., identification status) is assigned to each MS/MS spectrum, these features
can be analyzed by a machine learning algorithm, training it to classify spectra as good quality
(identifiable) or bad quality (unidentifiable) spectra. The SpectrumQualityGUI we developed,
links this functionality to the information stored in the ms_lims database.

45Results Ms_lims
In a typical workflow, ms_lims users can now select a relevant project to train a spectrum
quality classification model, and can then apply this model to classify MS/MS spectra from
another project, ideally one employing a similar protocol and instrument (Figures 6, 7, 8).
Furthermore, the application provides a simple export function of the resulting classification,
thereby enabling further investigation of the high quality, unidentified MS/MS spectra and their
attributes.
ms_lims was developed in Java and the system has been made available as a Maven 1
structured open-source project under the Apache 2 license.
Figure 6. The input tab of SpectrumQualityGUI, showing the available classification models
at the top. If none are available, a new model can be created using the MS/MS spectra inside
an ms_lims project (see figure 7). Such a model can then be saved and loaded for future
usage. When a model has been selected, an ms_lims project to apply the classifier to can be
selected. Classification is started by clicking the ‘Classify’ button.

46 Improving the sensitivy and the specificity in peptide centric proteomics
Figure 7. Construction of a new classification model in SpectrumQualityGUI. An ms_lims
project can be selected at the top, and additional information can be retrieved for this project
by clicking the info button. When an appropriate ms_lims project has been selected, a
machine learning algorithm can be chosen in the middle panel, along with a misclassification
cost assigned upon training of the classification model. This cost can be configured to tweak
the algorithm for sensitivity or specificity. The training finally starts by pressing the ‘build
model’ button. Once training is complete, feedback on the performance of a cross-validation
experiment is displayed in the text in the bottom panel.
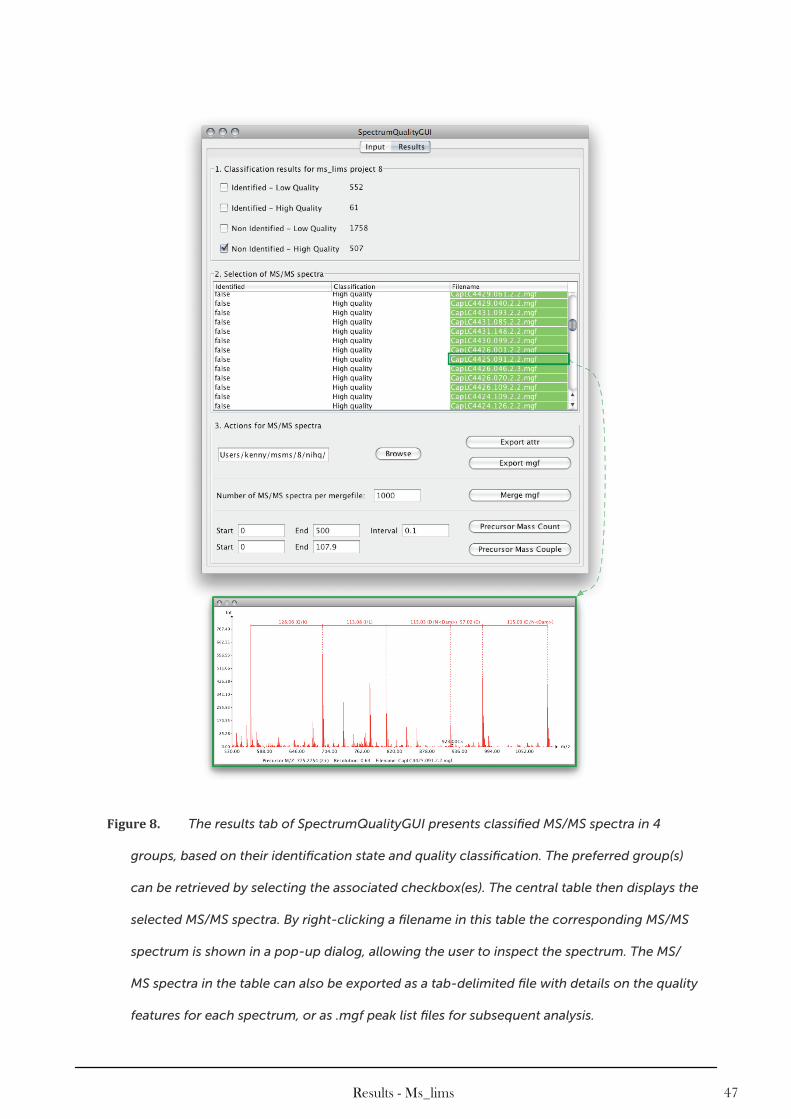
47Results Ms_lims
Figure 8. The results tab of SpectrumQualityGUI presents classified MS/MS spectra in 4
groups, based on their identification state and quality classification. The preferred group(s)
can be retrieved by selecting the associated checkbox(es). The central table then displays the
selected MS/MS spectra. By right-clicking a filename in this table the corresponding MS/MS
spectrum is shown in a pop-up dialog, allowing the user to inspect the spectrum. The MS/
MS spectra in the table can also be exported as a tab-delimited file with details on the quality
features for each spectrum, or as .mgf peak list files for subsequent analysis.

Ms_lims manuscript

49Results Ms_lims
TECHNICAL BRIEF
ms_lims, a simple yet powerful open source laboratoryinformation management system for MS-drivenproteomics
Kenny Helsens1,2!, Niklaas Colaert1,2!, Harald Barsnes3, Thilo Muth4,5, Kristian Flikka3,An Staes1,2, Evy Timmerman1,2, Steffi Wortelkamp4, Albert Sickmann4,Joel Vandekerckhove1,2, Kris Gevaert1,2 and Lennart Martens6
1Department of Medical Protein Research, Ghent, Belgium2Department of Biochemistry, Ghent University, Ghent, Belgium3Department of Informatics, University of Bergen, Norway4 ISAS – Institute for Analytical Sciences, Dortmund, Germany5 Lehrstuhl fuer Bioinformatik, Institut fuer Informatik, Friedrich-Schiller-Universitaet Jena, Jena, Germany6 European Molecular Biology Laboratory Outstation, European Bioinformatics Institute, Hinxton, Cambridge, UK
Received: June 12, 2009Revised: August 11, 2009
Accepted: September 29, 2009
MS-based proteomics produces large amounts of mass spectra that require processing,identification and possibly quantification before interpretation can be undertaken. High-throughput studies require automation of these various steps, and management of the data inassociation with the results obtained. We here present ms_lims (http://genesis.UGent.be/ms_lims), a freely available, open-source system based on a central database to automate datamanagement and processing in MS-driven proteomics analyses.
Keywords:Bioinformatics / Data management / Laboratory information managementsystem / Mascot / MS
Proteomics labs nowadays often acquire hundreds of thou-sands to millions of MS/MS spectra per proteome analysis tomake large-scale (comprehensive) proteome maps [1]. Theyrely on contemporary mass spectrometers with rapid dutycycles that increase the amount of produced data by a fullorder of magnitude compared to older instruments [2].Automating the processing of these data, and managing theirprovenance has correspondingly become an important post-analysis task. The automation of these tasks requires theimplementation of a start-to-end workflow around a centraldatabase management system that is designed for proteomics
experiments, with some of the most prominent commercialand academic systems recently reviewed in [3]. Typical actionsinclude collecting and warehousing MS/MS peak lists (oftenacquired on multiple, different instruments), assigning theaccumulated MS/MS data to peptide identifications, quanti-fying peptides and proteins from MS or MS/MS data, andorganizing both data and analysis results in a navigableproject structure. In most high-throughput environments,these diverse actions are typically undertaken by differentindividuals, which further necessitates a role-based imple-mentation of the software interfaces [4].
To tackle and manage these problems associated with MS-driven proteomics, we developed ms_lims, an open sourceand instrument vendor-independent system for proteomicsdata management. In contrast to existing web-based toolssuch as MASPECTRAS [4] or CPAS [5], ms_lims embraces aclient-server architecture, which allows for more dynamicinteraction. Additionally, ms_lims also differs from libraries
Abbreviations: LIMS, laboratory information managementsystem; MGF, Mascot generic file; SQL, Structured QueryLanguage !These authors contributed equally to this work.
Correspondence: Dr. Lennart Martens, European MolecularBiology Laboratory Outstation, European Bioinformatics Insti-tute, Wellcome Trust Genome Campus, Hinxton, CambridgeCB10 1SD, UKE-mail: [email protected]:1441223-494-468
& 2010 WILEY-VCH Verlag GmbH & Co. KGaA, Weinheim www.proteomics-journal.com
Proteomics 2010, 10, 1261–1264 1261DOI 10.1002/pmic.200900409

50 Improving the sensitivy and the specificity in peptide centric proteomics
such as OpenMS [6] in that the main focus lies on automationand data storage, rather than on data processing algorithms.Originally designed to support high-throughput, gel-freeproteomics analyses, ms_lims uses identified peptides (‘iden-tification’) as the core of its information structure. The peptide-centric focus of ms_lims results in the reporting of one ormore matching proteins per peptide, based on the number ofproteins the peptide was found in. A representative protein isselected as the primary protein hit (according to the algorithmpublished in [7]) but all other possible progenitor proteins aremaintained in the database structure as well. ms_lims thusprovides essentially a maximal explanatory list rather than oneof the possible minimal lists that are typically reported byprotein inference algorithms [8]. This strategy ensures thecapture of all relevant data regarding peptide identification.The core database schema of ms_lims, which is shownschematically in the grayed box in Fig. 1, is built around thesepeptide identifications, linking them to their spectra, as well
as to quantitative information, if available. Spectra aregrouped by LC runs, and these in turn are collated in projects.All actual spectra, as well as all original search engine outputfiles, are stored in the relational database as gzipped files forarchiving purposes. As a result, the ms_lims database is fullyself-contained, requiring no third-party tools to be read andanalyzed.
The relational database schema used by ms_lims can beeasily installed on a relational database management systemsuch as MySQL, PostgreSQL, or Oracle. The actual firstinstallation of the ms_lims schema can be easily performedusing the database configuration application that is includedin ms_lims.
As Fig. 1 shows, the database takes up a central positionin the overall workflow. Different types of input informationproduced by various external applications can be importedthrough a range of built-in adaptors. In a typical workflow,MS/MS raw data are first processed by instrument vendor-
Figure 1. The ms_lims system. The central part of the figure shows the core of ms_lims as a simplified version of the database schema.This database is accessed by a variety of Java tools all operating on the database. In the left, there is the database configuration tool tosetup ms_lims. The top of the figure shows how three separate input data types (MS/MS peak lists, peptide identifications and peptidequantitations) can be persisted into the database by corresponding storage tools. The bottom of the figure shows for each of these datatypes different output and analysis tools along with the Pride Converter compatibility.
1262 K. Helsens et al. Proteomics 2010, 10, 1261–1264
& 2010 WILEY-VCH Verlag GmbH & Co. KGaA, Weinheim www.proteomics-journal.com

51Results Ms_lims
specific or neutral software into a variety of MS/MS peak listformats. Upon import in ms_lims, these different formatsare all converted into the commonly used Mascot GenericFile (MGF) format, and these MGF files are then stored inthe database by the SpectrumStorage application. Importingof files in standard formats such as the mzML format willalso be added to ms_lims in the near future. This step istypically carried out by the mass spectrometrist. At a laterpoint in time, these peak lists can be retrieved from thedatabase through the SpectrumExport application, and theobtained files can then be submitted to the database searchalgorithm for identification. The output from the searchengine comprises a second type of input data, and these areread and stored in the database by the IdentificationStorageapplication. The current version of ms_lims only supportsthe Mascot Server database search algorithm [9], but theintegration of other search engines is planned. In anoptional third step, these peptide identifications can beassociated with quantitative information from differentialproteomics studies and this third type of input data is storedthrough the QuantitationStorage application, whichcurrently supports Mascot Server (iTRAQ) and MascotDistiller-based quantification. These three separate storageapplications effectively take care of automatically linking thethree data types (spectra, identifications, and quantitation)together in the central database, even when generated atdifferent time points by different users.
The populated ms_lims database functions as a laboratory-wide data backup, and provides a stable and centralizedstarting point for further data analysis. To this end, ms_limscontains several built-in tools that allow users to interrogateand explore the acquired data in convenient graphical userinterfaces. The most versatile of these is the Project Analyzer,an easily extensible application that loads a series of pluggabletools from the database, each of which performs a specificdata analysis task, such as providing filtered peptide or proteinlists, and descriptive statistics for a given project. For moreadvanced users, the Generic Query application provides directStructured Query Language (SQL) access to the ms_limsdatabase, providing full control over information retrieval.Another useful addition to ms_lims is the seamless integra-tion with the Peptizer application for detailed post-identifica-tion validation of the reported peptides [10].
In addition, since scientific journals in the field oftenrequest the submission of proteomics data used in publi-cations to public data repositories such as PRIDE [11], thems_lims database is also coupled directly to the PrideConverter tool [12], greatly facilitating the submissionprocess of data to PRIDE. Finally, the manual validation ofpeptide quantification results can be carried out via the in-house developed Rover application (http://genesis.ugent.be/rover) that is developed to streamline this process. Roveraccepts quantitative data from different sources (e.g. MascotDistiller and MaxQuant [13]) and provides convenientvisualizations of these data to allow the user to efficientlyvalidate suggested regulated proteins [14].
ms_lims is freely available as open source under thepermissive Apache2 license, and cross-platform binaries,source code and user documentation can be obtained fromthe project website at http://genesis.ugent.be/ms_lims.ms_lims requires Java version 1.5 or higher to run. Theopen source nature of ms_lims as well as its overall designallows that extensions are easily added to the core system.ms_lims has been developed and used already over manyyears, and has benefited greatly from constant end-userfeedback. As a result, ms_lims is a mature and production-grade system that has a proven track record in the lab.
Compared to commercial laboratory informationmanagement system (LIMS) systems, which might havemore features, ms_lims should suit many environmentsthat simply require user-oriented workflow automation, dataarchiving and data retrieval. In practice, ms_lims has proventhat it is ideally suited to automate tasks that tend to betedious and error-prone when executed manually, conveyingan important productivity gain as researchers can focus ondata interpretation rather than processing. Althoughms_lims is currently tailored to work with the widely usedMatrix Science software like Mascot Server, Mascot Daemonand Mascot Distiller, the generic structure of ms_limsallows input from multiple search engines and we plan toimplement such multi-search engine support in the nearfuture using freely available components (e.g. [15, 16]).
The authors wish to thank the many ms_lims users for testingand using ms_lims over the last 6 years and for their usefulsuggestions. K. H. is supported by a Ph.D. grant from theInstitute for the Promotion of Innovation through Science andTechnology in Flanders (IWT-Vlaanderen). The Ghent labfurther acknowledges support by research grants from the Fundfor Scientific Research – Flanders (Belgium) (project numbersG.0077.06 and G.0042.07), the Concerted Research Actions(project BOF07/GOA/012) from the Ghent University and theInter University Attraction Poles (IUAP06). L. M. wishes tothank Henning Hermjakob and Rolf Apweiler for their support.
The authors have declared no conflict of interest.
References
[1] de Godoy, L. M., Olsen, J. V., Cox, J., Nielsen, M. L. et al.,
Comprehensive mass-spectrometry-based proteome quan-
tification of haploid versus diploid yeast. Nature 2008, 455,
1251–1254.
[2] Olsen, J. V., de Godoy, L. M., Li, G., Macek, B. et al., Parts
per million mass accuracy on an Orbitrap mass spectro-
meter via lock mass injection into a C-trap. Mol. Cell
Proteomics 2005, 4, 2010–2021.
[3] Piggee, C., LIMS and the art of MS proteomics. Anal. Chem.
2008, 80, 4801–4806.
[4] Hartler, J., Thallinger, G. G., Stocker, G., Sturn, A.
et al., MASPECTRAS: a platform for management and
Proteomics 2010, 10, 1261–1264 1263
& 2010 WILEY-VCH Verlag GmbH & Co. KGaA, Weinheim www.proteomics-journal.com

52 Improving the sensitivy and the specificity in peptide centric proteomics
analysis of proteomics LC-MS/MS data. BMC Bioinform.
2007, 8, 197.
[5] Rauch, A., Bellew, M., Eng, J., Fitzgibbon, M. et al.,
Computational Proteomics Analysis System (CPAS): an
extensible, open-source analytic system for evaluating and
publishing proteomic data and high throughput biological
experiments. J. Proteome Res. 2006, 5, 112–121.
[6] Sturm, M., Bertsch, A., Gropl, C., Hildebrandt, A. et al.,
OpenMS – an open-source software framework for mass
spectrometry. BMC Bioinform. 2008, 9, 163.
[7] Mueller, M., Martens, L., Reidegeld, K. A., Hamacher, M.
et al., Functional annotation of proteins identified in human
brain during the HUPO Brain Proteome Project pilot study.
Proteomics 2006, 6, 5059–5075.
[8] Nesvizhskii, A. I., Aebersold, R., Interpretation of shotgun
proteomic data: the protein inference problem. Mol. Cell
Proteomics 2005, 4, 1419–1440.
[9] Perkins, D. N., Pappin, D. J., Creasy, D. M., Cottrell, J. S.,
Probability-based protein identification by searching
sequence databases using mass spectrometry data. Elec-
trophoresis 1999, 20, 3551–3567.
[10] Helsens, K., Timmerman, E., Vandekerckhove, J., Gevaert,
K., Martens, L., Peptizer: a tool for assessing false positive
peptide identifications and manually validating selected
results. Mol. Cell Proteomics 2008, 2363–2372.
[11] Martens, L., Hermjakob, H., Jones, P., Adamski, M. et al.,
PRIDE: the proteomics identifications database. Proteomics
2005, 5, 3537–3545.
[12] Barsnes, H., Vizcaıno, J. A., Eidhammer, I., Martens, L.,
PRIDE converter: making proteomics data sharing easy.
Nat. Biotechnol. 2009, 27, 598–599.
[13] Cox, J., Mann, M., MaxQuant enables high peptide identi-
fication rates, individualized ppb-range mass accuracies
and proteome-wide protein quantification. Nat. Biotechnol.
2008, 26, 1367–1372.
[14] Colaert, N., Helsens, K., Vandekerckhove, J., Martens, L.,
Gevaert, K., Rover: a tool to visualize and validate quanti-
tative proteomics data from different sources. Proteomics
2010, 10, 1226–1229.
[15] Tharakan, R., Martens, L., Van Eyk, J. E., Graham, D. R.,
OMSSAGUI: an open-source user interface component to
configure and run the OMSSA search engine. Proteomics
2008, 8, 2376–2378.
[16] Barsnes, H., Huber, S., Sickmann, A., Eidhammer, I.,
Martens, L., OMSSA Parser: an open-source library to parse
and extract data from OMSSA MS/MS search results.
Proteomics 2009, 9, 3772–3774.
& 2010 WILEY-VCH Verlag GmbH & Co. KGaA, Weinheim www.proteomics-journal.com
1264 K. Helsens et al. Proteomics 2010, 10, 1261–1264

53Results Ms_lims

“In the beginner’s mind there are many possibilities.
In the expert’s mind there are few.”
-- Shunryu Suzuki

55Results Peptizer
2. Employing expert knowledge for post-identification validation in
peptide centric proteomics
2.1 The concept of Peptizer
Mass spectrometry and protein chemistry have been developed over many years, and they
have resulted in a large amount of readily available expertise on such topics as cell lysis, protein
extraction, protein and peptide separation and protein digestion. A typical proteomic analysis
relies on a large body of such expertise, with the relevant information transmitted via protocols.
Obviously, protocols are adapted and tailored to the study at hand, thus introducing protocol-
specific nuances in the data obtained. These nuances are in turn understood by the expert
evaluating the data, and can aid him/her to interpret the results more accurately.
In order to pursue the main objective of this thesis, improving both sensitivity and specificity
of peptide identifications from MS/MS spectra, the Peptizer platform was conceived as a way to
complement the evaluation of peptide identifications using existing computational strategies
with automated expert knowledge.
The basic premise of Peptizer is that it makes use of expert rules in the form of ‘Agent’
instances which each inspect peptide identifications for a specific property or metric. For
instance, an Agent might inspect a peptide identification for the presence of deamidation motifs
(a property of the identified peptide), and will disfavor deamidations that occur outside of
allowed motifs. Another Agent might simultaneously inspect the score di.erence between the
first and second ranked peptide identification (a metric for the identified peptide), disfavouring
peptides where the di.erence is smaller than a preset threshold. These Agents are pluggable as
well as configurable, making it very easy to add novel Agents, to construct specialized panels
of Agents, and to fine-tune the behavior of an individual Agent. This built-in versatility allows
Peptizer to adapt its expert knowledge to suit any of the various proteomic methodologies.
Since Agents are highly focused on a particular property or metric, it is fairly easy to develop
a new Agent to fit a new protocol. Each Agent employs its encoded expert knowledge (along
with any fine-tuning configuration settings) to grade peptide identifications as suspicious,
trustworthy, or indi.erent. Multiple Agents are typically employed together, and these are

56 Improving the sensitivy and the specificity in peptide centric proteomics
organized in a user-configurable Agent panel. The individual Agent votes for a peptide are
subsequently aggregated and collated into a global outcome that classifies the identification as
suspicious or trustworthy. Similar to the flexibility provided for Agents, di.erent methods of
vote aggregation can be plugged into Peptizer, and each method can be fine-tuned through user
configuration.
Rather than relying exclusively on built-in or configured expert knowledge however, Peptizer
also comes with a full-featured and e/cient manual validation environment. This interface
provides the user with the full information obtained by the Agents (i.e., not only the vote cast,
but the actual data on which the vote was based), as well as several intuitive visualizations of the
correspondence between spectrum and modified peptide sequence. The environment is thus
tailored to communicate the details of an intricate expert analysis e/ciently and clearly to an
expert user, who can then pass final judgment on the reliability of the identification.
Depending on the required speed of analysis, and the amount of desired user control,
Peptizer can either be run in fully automatic mode, where suspicious identifications are simply
deemed incorrect, or in the semi-automatic, user interactive mode which allows the user to
decide on the fate of suspicious identifications.
Peptizer is described in the following research article, which also includes results obtained by
applying Peptizer to improve the specificity of peptide identifications. Further examples of the
usefulness of Peptizer to improve both sensitivity and specificity of peptide identifications are
given in the next subsections.

57Results Peptizer

Peptizer manuscript

59Results Peptizer
Peptizer, a Tool for Assessing False PositivePeptide Identifications and Manually ValidatingSelected Results*!S
Kenny Helsens‡§¶, Evy Timmerman‡§, Joel Vandekerckhove‡§, Kris Gevaert‡§!,and Lennart Martens‡§**‡‡
False positive peptide identifications are a major concernin the field of peptidecentric, mass spectrometry-drivengel-free proteomics. They occur in regions where thescore distributions of true positives and true negativesoverlap. Removal of these false positive identificationsnecessarily involves a trade-off between sensitivity andspecificity. Existing postprocessing tools typically rely ona fixed or semifixed set of assumptions in their attemptsto optimize both the sensitivity and the specificity of pep-tide and protein identification using MS/MS spectra. Be-cause of the expanding diversity in available proteomicstechnologies, however, these postprocessing tools oftenstruggle to adapt to emerging technology-specific pecu-liarity. Here we present a novel tool named Peptizer thatsolves this adaptability issue by making use of pluggableassumptions. This research-oriented postprocessing toolalso includes a graphical user interface to perform effi-cient manual validation of suspect identifications for op-timal sensitivity recovery. Peptizer is open source softwareunder the Apache2 license and is written inJava. Molecular & Cellular Proteomics 7:2364–2372, 2008.
The protein set of a biological system is the topic ofresearch in proteomics with bottom-up proteomics ap-proaches relying on peptides as the fundamental analyticalunit. Typically proteins are extracted prior to being digestedinto peptides, generally by a specific protease such astrypsin. In most work flows, the highly complex peptidesample obtained after digestion is then separated in one ormore chromatographic dimensions before being analyzedby a mass spectrometer. Peptides are ionized and frag-mented in this instrument, yielding fragment ion spectra asthe final experimental output (1). Data interpretation algo-rithms are then used to identify the peptide of origin fromthe fragment ion spectrum. The final step in the identifica-
tion procedure consists of assembling a protein list from theidentified peptides (2).
As a first and crucial step of data interpretation, coupling ofa fragment ion spectrum to a peptide sequence has attractedmuch effort aimed at optimizing this process. A review of thevariety of methods and tools available for this purpose waspublished recently (3). The most commonly applied method isbased on sequence database searching by database searchengines such as SEQUEST (4), Mascot (5), X!Tandem (6),Virtual Expert Mass Spectrometrist (7), or Open Mass Spec-trometry Search Algorithm (8). The overall concept behindthese algorithms is similar and consists of the generation oftheoretical fragment ion spectra from sequence databaseentries against which experimental fragment ion spectra arematched. The difference between the algorithms is usuallyfound in the spectral comparison method and scoring scheme(9). The most difficult part of this analysis is not necessarilyfinding the best match from the sequence database but find-ing out whether this best match is actually valid. Indeed anexperimental spectrum cannot always be compared with theactual theoretical spectrum of its original precursor becausethis precursor may be absent from the database or becausethe precursor peptide carried one or more unanticipated mod-ifications. Even so, this experimental spectrum may still bematched with a considerable score to a theoretical fragmen-tation spectrum derived from an unrelated precursor. To filterout such background matches, several search engines in-clude probability-based scoring algorithms (9) in which thescore of a proposed peptide identification can be comparedagainst a threshold score for a given confidence level. Inaddition, postprocessing tools have been developed that an-alyze the detailed output of a search engine to obtain arevised score that should further optimize sensitivity andspecificity (10–13). Typically such algorithms rely on certainassumptions about the identifications to model true positiveand true negative score distributions. PeptideProphet (13) forexample relies on a mixture model approach that modelsSEQUEST score distributions according to fixed assumptionssuch as tryptic correctness of the identified peptides. Ulti-mately a revised probabilistic score is calculated that shouldallow discrimination between true and false positives withincreased accuracy.
From the ‡Department of Medical Protein Research, VIB, B-9000Ghent, Belgium, §Department of Biochemistry, Ghent University,B-9000 Ghent, Belgium, and **European Molecular Biology Labora-tory Outstation, European Bioinformatics Institute, Wellcome TrustGenome Campus, Hinxton, Cambridge CB10 1SD, United Kingdom
Received, February 22, 2008, and in revised form, July 25, 2008Published, MCP Papers in Press, July 30, 2008, DOI 10.1074/
mcp.M800082-MCP200
Research
© 2008 by The American Society for Biochemistry and Molecular Biology, Inc.2364 Molecular & Cellular Proteomics 7.12This paper is available on line at http://www.mcponline.org
by on January 27, 2010 w
ww
.mcponline.org
Dow
nloaded from
/DC1http://www.mcponline.org/cgi/content/full/M800082-MCP200Supplemental Material can be found at:

60 Improving the sensitivy and the specificity in peptide centric proteomics
In certain cases, however, only a subset of all peptideidentifications obtained are of relevance to the biological sys-tem under study. In these cases, expert manual validation ofthe identifications is a more commonplace strategy for qualitycontrol. Protein modification studies for example often findbiological relevance in a small subset of all experimentallyobtained data (14, 15). In addition, the so-called “single hitwonders”, which often populate the majority of identified pep-tides or proteins in gel-free proteomics, should not be simplydiscarded but must be treated intelligently as they potentiallycontain valuable biological information (16, 17). The manualvalidation required to assure the reliability of the biological con-clusions drawn from such peptide identifications can be per-formed by using the visualization tools included with the searchengine or by specialized applications such as CHOMPER (18),DTASelect (19), or myProMS (20). These tools present a specificset of details on a peptide identification and its associatedspectrum for user validation. Finally a semimanual option wasrecently added to PeptideProphet by allowing the user toenable or disable certain of the modeling assumptions fromwhich the overall score is derived (21).
An important side effect of the evolution of proteomicstechnologies toward more specialized and targeted ap-proaches (22, 23), however, relates to the correspondingchanges in the actual assumptions that can be made aboutthe identifications. These changes effectively introduce newparameters that can be used to further enhance the separa-tion of false and true positives, yet are necessarily largelyignored by tools built upon fixed, generalized assumptions. Toallow this expanding array of technologies and associated iden-tification parameters to be used effectively in the postprocess-ing and validation of proteomics data, here we present thePeptizer tool. Built upon a dynamic profiling framework thatoperates on pluggable assumptions, Peptizer can be quicklyand efficiently configured with any a priori knowledge that isavailable to the user. Each assumption or parameter is coded inan autonomous agent, which is allowed to cast a vote on eachpeptide identification. In a second layer, the votes of theseagents are aggregated using a pluggable algorithm, which out-puts a final score that is used to judge whether an identificationrepresents a potential false positive. We show that elimination ofthese suspicious identifications increases specificity albeit atthe cost of a noticeable loss in sensitivity through removal ofcertain true positives. A sophisticated and highly efficient man-ual validation interface is also included that can be used tocompensate in part for this loss in sensitivity.
EXPERIMENTAL PROCEDURES
MS/MS Data—The MS/MS spectra used in this study have beenpublished previously (24). Full experimental details are provided in thesupplemental information. Briefly human K562 cells were lysed bycycles of freeze-thawing followed by reduction and alkylation of cys-teines. Primary free amines were then trideuteroacetylated by N-hydroxysuccinimide trideuteroacetate. Alkylated and acetylated pro-teins were digested by trypsin, and the generated peptide mixture
was separated by strong cation exchange at pH ! 3 to enrich for!-amino-blocked peptides in the strong cation exchange non-bindingfraction. The sample was then acidified to oxidize methionines beforethe primary N-terminal COFRADIC1 separation (25). Fractions of 4 minwide were collected and treated with 2,4,6-trinitrobenzenesulfonicacid. Such modified primary fractions were then loaded for the sec-ondary COFRADIC run wherein the !-amino-blocked peptides, whichshow no altered chromatographic properties, are collected. The sec-ondary fractions were analyzed by LC-MS/MS using a microfluidicinterface (Agilent Chip Cube) on an Agilent XCT-Ultra ion trap massspectrometer operated as described previously (26).
Peptide Identification, False Positive Estimations, and Peptizer De-velopment—The MS/MS spectra were searched by Mascot version2.2 against the human subset of the UniProtKB/Swiss-Prot sequencedatabase, release 53.2 (June 26, 2007), concatenated with a shuffledversion of this database generated by DBToolkit (27). The followingparameters were used in the Mascot searches: peptide mass toler-ance and peptide fragment tolerance were set at "0.5 Da, andallowed precursor charges were set to 1#, 2#, and 3#. Fixed mod-ifications were oxidation of methionine to its sulfoxide derivative,trideuteroacetylation of lysine and carbamidomethylation of cysteine.Pyroglutamate formation (N-terminal Gln), pyrocarbamidomethylcys-teine formation (N-terminal carbamidomethylated cysteines), acetyla-tion and trideuteroacetylation of the !-N terminus, and deamidation(Gln and Asn) were considered as variable modifications. Endopro-teinase Arg-C/P was set as the proteolytic enzyme, and at most onemissed cleavage was allowed. The Mascot instrument setting param-eter was set to ESI-TRAP. Only MS/MS spectra receiving an ion scoreequal to or exceeding the Mascot identity threshold score at the 95%confidence level were withheld for further inspection by Peptizer. Allexperimental fragmentation spectra (32,403), peptide identifications(2,739) made in the “forward” protein database, and correspondingexperimental details will be made publicly available via the proteom-ics identifications (PRIDE) database (28) under experiment accessionnumber 3261. All experimental fragmentation spectra (32,430), pep-tide identifications (2,739) made in the “forward” protein database,and corresponding experimental details are publicly available via theproteomics identifications (PRIDE) database (28) under experimentaccession number 3,261. To estimate the false positive distributionwe performed Mascot searches against a concatenated decoy data-base as described previously (29).
Peptizer was developed as an open source project under theApache2 license in Java 1.5. Peptizer relies on Mascotdatfile (30) toprocess Mascot result files and can also interface with the ms_limssoftware package (31).
Manual Validation—Manual validation was performed by an expe-rienced mass spectrometrist. The scientist was blinded to the originof the peptide identifications (i.e. from the decoy or target set pro-teins). The scientist was told to apply stringent criteria during thevalidation. The net effect of the manual validation was obtained byinspecting the unblinded results after completion of the validation.
Peptizer Configuration—Peptizer was configured to use the agentslisted in Table I for detecting potential false positive identifications inthis data set. The agent configuration text file, which can be loaded inPeptizer, can be found at the project Website. The “best hit” agentaggregator was used to combine the individual agent votes. Theaggregator used simply summed all votes together and marked thepeptide identification as suspicious if the result was equal to orgreater than 2 (or when an agent with veto rights declines).
1 The abbreviations used are: COFRADIC, combined fractionaldiagonal chromatography; GUI, graphical user interface.
Peptizer
Molecular & Cellular Proteomics 7.12 2365
by on January 27, 2010 w
ww
.mcponline.org
Dow
nloaded from

61Results Peptizer
RESULTS
Peptizer was developed as a postprocessing tool aimed atseparating true and false positive peptide identifications in ahighly configurable manner without relying on any built-inassumptions. Indeed considerable variations in expected out-put are often found between distinct research methodologiesthat all convey some form of a priori knowledge that canultimately be used to separate identification candidates at thepostprocessing level. Because existing tools commonly relyon fixed assumptions that are derived from generalized oridealized research methods, they are limited in the amount ofa priori experimental information they can take into account.In contrast, Peptizer is inherently designed with the necessaryflexibility to integrate any available a priori knowledge.
Construction of a Peptizer Profile—The peptide identifica-tions are tested by evaluating a series of user-selectable andextensible properties. The result of this evaluation can be todecline, reserve, or recommend the identification based onthat property. The results across all considered properties arethen combined in an overall score for identification reliabilitythat can ultimately be used as a filter.
In Peptizer, a property is inspected by an Agent, and thecombination of multiple Agent scores is performed by anAggregator. These two components are shown in Fig. 1 andare discussed in detail in the following sections.
Agents for the Inspection of Identification Properties—AnAgent in Peptizer typically inspects a single property of apeptide identification and reports a score (or “vote”) to indi-cate whether it declines, reserves, or recommends the iden-tification (score of !1, 0, or "1, respectively). An individualAgent can be given veto privilege, which means that a deci-
sion to decline an identification by such an Agent will directlyresult in declining the identification irrespective of the votes ofthe other Agents. Examples of properties that an Agent caninspect include the following: the peptide sequence coverageby fragment ions, the length of a peptide, the peptide modi-fication status, the difference between peptide ion score andidentity threshold, and the difference between best scoring hitand second best hit among many others.
Furthermore apart from being readily included in or ex-cluded from a profile, each Agent can be parameterized aswell. The Agent that inspects peptide length, for instance, canbe provided with a cutoff length below which to decline anidentification. Another example is the Agent that inspects forsequence coverage by b-ions, which also takes a thresholdlevel of coverage below which identifications are declined bythe Agent. As a final example, consider the Agent that in-spects identifications for missed cleavages; in this case, boththe cleavage specificity of the protease as well as the numberof tolerated missed cleavages are Agent parameters. Cleav-age specificity is therefore easily adapted when evaluatingdata from an experimental protocol that uses a differentprotease.
Aggregators for Combining Agent Votes into an OverallScore—As outlined above, all peptide identifications are in-spected by a voting panel composed of user-selected Agentsthat each decline, reserve, or recommend an identification bycasting a vote. These individual votes must then be aggre-gated into an overall score for the identification on whichrecommendation or rejection is ultimately based (see Fig. 1). Afirst method in which Agent votes can be combined is bysimple summation of the Agent scores. If the end result isabove a preset threshold (e.g. 0), the identification is rejected.A more pessimistic approach counts only the number ofAgents that decline the peptide identification. If that number ishigher than a preset cutoff, the peptide identification is con-sidered bad. Obviously an Aggregator can also be much moresophisticated than these simple examples, utilizing a supportvector machine, neural network, or other learning algorithmfor instance. Interestingly Peptizer also supports pluggableAggregators, thus allowing complete flexibility at both theAgent and Aggregator level. It is worth noting that the Peptizerframework can therefore provide an extremely convenientinfrastructure basis for the development and implementationof novel computational strategies for discovering false posi-tive identification profiles.
Availability of Peptizer and Providing Extensions to theFramework—Peptizer is released as open source under theApache2 software license, and binaries as well as source codecan be downloaded. Although it is made freely available undera permissive license, the source code is not required to buildextensions to Peptizer, nor is a recompilation of the applicationnecessary to include novel Agents or Aggregators. A typicalAgent is only about 20 lines of code, whereas a typical, simpleAggregator is about twice that size. Peptizer loads its Agents
FIG. 1. The voting mechanism of Peptizer. Peptide identificationsare judged by a voting panel that consists of a series of Agents. EachAgent individually inspects a peptide identification and casts a votethat reflects whether or not the Agent requirements were fulfilled. Thevotes are all aggregated in a final score that is used to classify thepeptide identification as either good or suspicious. The latter categoryis significantly enriched for false positives. Aggregation here is per-formed by simple summation of individual Agent scores.
Peptizer
2366 Molecular & Cellular Proteomics 7.12
by on January 27, 2010 w
ww
.mcponline.org
Dow
nloaded from

62 Improving the sensitivy and the specificity in peptide centric proteomics
and Aggregators from a simple eXtensible Markup Language(XML)-based configuration file upon application start-up, sosimply adding a newly developed Agent into this configurationfile will make it available for inclusion in the voting panel of theapplication, and the same holds true for Aggregators. Theeffort required to provide Peptizer with new Agents or Aggre-gators is thus minimized by design, allowing rapid adoption ofnovel experimental methodologies and their corresponding apriori information through custom-developed Agents andAggregators.
Although Peptizer currently only accepts Mascot “.dat” re-sult files as input, the source of peptide identifications canalso be modified. However, to extend the reach of Peptizer toother search engine output files, a basic understanding ofprogramming in Java is required as parsing of these morecomplex files can be more involved. All these extensions toPeptizer can be achieved by implementing well documentedinterfaces, thus providing a clean and efficient develop-by-contract approach.
Operation Modes of Peptizer and the Manual ValidationInterface—Peptizer can be used in one of two modes: fullyautomatic command line execution, or semiautomatic opera-tion by means of a user-friendly graphical user interface (GUI).Both modes address a distinct group of users: although theaverage user will work most comfortably in GUI mode, moreexperienced users will benefit from the automated and script-able command line execution. An important difference be-tween the two modes is that, in automatic mode, all suspi-cious identifications will be considered incorrect, whereas theGUI mode will simply flag these for further manual validation.The GUI mode thus effectively uses the user as the finalarbiter, whereas the command line mode does not includethis final evaluation step.
The Peptizer GUI is designed for optimal efficiency as itguides the user through the process of choosing a datasource, creating an Agent profile, and choosing an Aggregatoras shown in Fig. 2. The top panel takes the source of thepeptide identifications, and the center panel is subsequentlyused to construct the voting panel. Note that Agent parame-terization as well as assignment of veto privileges is also takencare of at this stage. The lower panel presents the availableAggregators to the user, and the bottom panel can be used todefine the confidence level below which identifications will noteven be considered. When the profile configuration is com-plete, a new task can be started by clicking the appropriatebutton.
Both user-friendliness and efficiency were optimized byadding extra features in this dialog: tool tips describe thevoting logic of an agent, and information on the combinationmethods of the Aggregators can be retrieved. More impor-tantly, individual voting panels as well as overall task config-urations can be saved for later use. Simple reloading such aconfiguration file will reconstruct the exact settings, thus sav-ing the user time while strongly enhancing consistency. These
saved configuration files are also readily archived if neces-sary, can be shared with other researchers, or may serve aspreset configurations for command line execution of Peptizer.
Upon submitting a task, the software starts to analyze eachproposed identification using the user-configured Agent pro-file and Aggregator and then forwards the results to the man-ual validation application shown in Fig. 3. The screen is di-vided into three major parts: a tree with spectra andidentifications on the left, the identification detail view on theright and in the center, and a status panel at the very bottom.Each of these parts can be resized or even collapsed accord-ing to the needs of the user. The tree structure fulfills severalfunctions. First, it provides an overview of the work done bycolor-coding identifications based on their status (unresolved,user-declined, or user-accepted). Second, it also allows theuser to quickly browse the entire set of suspect identifica-tions. Third, it can be filtered to reveal specific subsets ofthese suspect identifications. Each tree node holds a singlefragmentation spectrum with all of its suggested confidentpeptide identifications, the number of which is indicated be-tween parentheses after the spectrum number. Unfolding thetree node shows these confidently assigned peptide se-quences. Applying filters to the tree enhances navigationthrough the peptide identifications, for example by hiding allidentifications that have already been validated. By doubleclicking a node, a new tab is opened in the detailed view onthe right. In this view, three different perspectives are given forthe user to explore. Topmost is the annotated modifiedpeptide sequence, consisting of all identified b- and y-ionsannotated as bars on the sequence. The height of the barsindicates the intensity of the corresponding peaks in the spec-trum relative to the most intense identified fragment ion. Themiddle section of the detailed view sports an interactive dis-play of the annotated fragmentation spectrum, whereas thebottom of the view is taken up by a table. The columns in thistable correspond to the significant peptide hits obtained forthis spectrum (three in the example given in Fig. 3) apart fromthe leftmost column that always serves as a legend. By de-fault, the most confident peptide identification is selectedwhen a new tab is opened, but the user can modify thisselection by clicking on another column in the table (columnselection is indicated by a darker color tone). When the se-lection changes, the experimental fragmentation spectrumshown in the center of the screen is updated with the frag-ment ion annotations of the selected peptide. Additionally theannotated sequence in the top panel of the detailed view isalso adapted to the newly selected peptide.
Each row in the data table describes a distinct type ofgeneral or Agent-derived information. Examples of generalinformation, which is always available regardless of profilecomposition, include the peptide sequence, Mascot ionscore, Mascot identity threshold, b- and y-ion coverage, pre-cursor mass error, etc. The Agent-derived information obvi-ously depends on the selected Agents in the profile. Typeset-
Peptizer
Molecular & Cellular Proteomics 7.12 2367
by on January 27, 2010 w
ww
.mcponline.org
Dow
nloaded from

63Results Peptizer
ting of the individual Agent reports is dependent on the actualvote cast by that Agent for that peptide. For instance, when anAgent that requires the peptide length to be longer than 8amino acids declines a 7-amino acid-long peptide, that rowwill display “7” in a bold typeface, highlighting the fact thatthis property failed Agent scrutiny. The report is shown initalics when the peptide identification is recommended by theAgent. The table therefore functions as a very compact andeasily interpretable source of information on the different pep-tide identifications.
After careful inspection of a spectrum and its peptide iden-tifications, the user may either choose to accept or to reject anidentification by clicking on the corresponding buttons in thelower right corner (see Fig. 3). The red “STOP” icon rejects anidentification, whereas the green “OK” icon accepts an iden-tification. Note that accepting one peptide candidate when
multiple peptide candidates are given for a spectrum auto-matically rejects these other possibilities. For each of theseicons, an alternative is given that takes a validation commentto go with the decision (see dialog on Fig. 3). Once thedecision is communicated by a click on the appropriate but-ton, the application will automatically close the freshly vali-dated tab and open up the next available, unresolvedidentification.
The set of peptide identifications can be saved to the harddrive at any time and can be reloaded in another session,enabling discontinuous manual validation. Validation data inthis form can also be distributed to other users or archived astraining material.
The end result of the manual validation can be saved intodelimited text files, allowing the user to choose the table datathat are included as well as optionally including the confident
FIG. 2. Peptizer configuration using the graphical user interface. The top panel is used to select the source for the identifications, andthe central table serves to configure the Agents. Each Agent can be selected for inclusion in the voting panel and given veto rights, and ifapplicable, its parameters can be set. Hovering over an Agent will pop up a tool tip explaining its workings. The panel below this table allowsthe selection of the aggregation method. The buttons to the right side of the central table can be used to save the current Agent configurationor to load an existing one. The buttons at the bottom allow the complete configuration to be saved or loaded and contains the button to startthe task.
Peptizer
2368 Molecular & Cellular Proteomics 7.12
by on January 27, 2010 w
ww
.mcponline.org
Dow
nloaded from

64 Improving the sensitivy and the specificity in peptide centric proteomics
peptide identifications that were recommended by the votingpanel (and therefore automatically catalogued as good).Moreover Peptizer can also output its data to a file format thatis directly readable by the open source Weka machine learn-ing library (32) for further analysis.
Comparison between Fully Automatic and Manual PeptizerValidation—Peptizer is a postprocessing tool aimed at iden-tifying false positive peptide identifications. False positiveshave been shown to be simulated by performing decoysearches with experimental spectra (29). By integratingproperties of such decoy-derived false positive matches aswell as experimental knowledge of mass spectrometry sci-entists, a Peptizer voting panel was configured to selectpotential false positive identifications (see Table I, whichdetails the agents extracted from the N-terminal COFRADICdata set reported in Ref. 24). A pessimistic Aggregator waschosen and configured to label a peptide identification as
suspicious if two or more agents declined the peptideidentification.
Because the assignment of an MS/MS spectrum to apeptide sequence is the first and most important step in theidentification of proteins and because the interference fromprotein inference has not yet been introduced at this level(2), we decided to evaluate Peptizer on results obtained atthe level of peptide identification. Improving the quality ofpeptide identifications will in turn affect protein identifica-tion because more reliable peptides are instrumental inobtaining reliable protein identifications (33).
We assessed the efficacy of the above Peptizer profile inlabeling suspicious peptide identifications by applying it toa blinded set of 2,795 peptide identifications obtained bysearching a concatenated normal/decoy database. 56 pep-tide identifications were derived from the decoy database,thus predicting that the whole set of 2,795 peptide identifi-
FIG. 3. The Peptizer manual validation environment. The tree structure on the left serves to navigate through the selected peptideidentifications. Each tree node holds a spectrum with its confident peptide identifications. Unfolding the tree node shows the peptidesequences that were confidently assigned. By double clicking a node, a new tab is opened on the right that shows a detailed view composedof an annotated sequence, an interactive spectrum viewer, and a data table. Each row in this data table shows a distinct type of general orAgent-derived information, and each column represents a distinct confident peptide that was identified from the spectrum. The observedfragment ions for the selected peptide are annotated on the spectrum viewer and on the annotated modified sequence.
Peptizer
Molecular & Cellular Proteomics 7.12 2369
by on January 27, 2010 w
ww
.mcponline.org
Dow
nloaded from

65Results Peptizer
cations is composed of 112 false positives (about 4%) and2,683 true positive identifications (calculations based on thework of Elias and Gygi (29)). The detailed results of applyingthe Peptizer profile to this data set are shown in Table II. Intotal, 193 peptide identifications were labeled suspicious byPeptizer. Among these, 47 peptide identifications originatedfrom decoy sequences, and we therefore estimate that thisselection contains 83.9% of all false positives (or 94 of theexpected 112) in this data set, a very considerableenrichment.
This set of 193 suspect identifications can then be pro-cessed according to two different scenarios. First full auto-
matic mode can be applied that simply discards all the sus-pect identifications. This results in the removal ofapproximately 83.9% of all false positive identifications (94identifications) but at the cost of removing approximately3.7% true positives (99 of 2,683 identifications) as well. It isworth noting that although the original data set contained anestimated 4% false positives it only retained 0.7% false pos-itives (18 of 2,602 remaining identifications) after applying thePeptizer profile in fully automatic mode.
The loss in sensitivity (removal of 3.7% true positives) in fullautomatic mode can be partially offset by performing manualvalidation. Indeed in this semiautomatic mode the user dis-
TABLE IAgent configuration
The listed agents and their parameters represent the voting panel that was configured to select suspicious peptide identifications from theexample data set. NA, not applicable.
Agent Veto Parameter Vote
Deamidation True Count: 2 Declines if 2 or more deamidationsa
Suspect residue True Sites: Arg; His Declines if a His or internal Arg residue is presentb
Delta threshold False Delta: 10 Declines if score delta between ion score and identity threshold is more then 10Free NH2 False NA Declines if N terminus is unmodifiedHomology False NA Declines if ion score or identity threshold is beyond the homology thresholdLength False Length: 9 Declines if the peptides has less then 9 amino acidsMore confident hits False Delta: 20 Declines if there is more than one confident identificationN term acetylation False NA Recommends if the N terminus is acetylatedc
Proline peak False Intensity: 0.4 Declines if absence of intense fragment ion N-terminal to an internal proline residueb-ion coverage False Percentage: 0.10 Declines if b-ion coverage is less then 10%y-ion coverage False Percentage: 0.25 Declines if y-ion coverage is less then 25%Start site False Low: 2; high: 200 Recommends if the peptide starts at protein position 1 or 2,
declines if above protein position 200, and reserves in betweenc
a When using MS/MS spectra obtained with low resolution mass spectrometers we typically enable deamidation as a variable modificationto recover peptide identifications when the second isotope (not the monoisotopic ion) was selected for fragmentation. This modification tendsto occur more frequently in false positive peptide identifications creating isobaric amino acid combinations amongst others.
b Peptides that contain an internal basic residue were suspicious here because they should have been retained on the strong cationexchange column during sample preparation (24).
c The N-terminal COFRADIC procedure includes an amino acetylation step prior to digestion, and about 95% of all identified peptidesisolated by this procedure are !-N-acetylated. Such acetylated peptides are less likely to be false positives because they are simply more likelyto occur. For the same reason, peptides that start in protein position 1 or 2 (methionine removal) are more likely to occur in the “true data set.”
TABLE IISummary of experimental Peptizer usage
At the top of the table, by applying Peptizer the peptide identifications are separated into a good and a suspicious set. This suspicious setis either completely discarded in full automatic validation mode or is further examined by the user in the semiautomatic, manual validationmode. In the latter, identifications from the suspicious set will be either accepted or rejected by the user. The results of the manual validationare shown at the bottom of the table.
False positives incomplete data set
False positives inaccepted subset
False positives indiscarded subset
Percentage of falsepositives removed
Percentage of truepositives removed
% % % % %
Full automatic validation 4.0 0.7 48.7 83.9 3.7Semiautomatic manual
validation4.0 0.8 57.0 80.4 2.5
Identifications to validateas selected by Peptizer
False positivesaccepted by user
False positivesrejected by user
True positivesaccepted by user
True positivesrejected by user
Estimated manualvalidation results
193 4 90 31 68
Peptizer
2370 Molecular & Cellular Proteomics 7.12
by on January 27, 2010 w
ww
.mcponline.org
Dow
nloaded from

66 Improving the sensitivy and the specificity in peptide centric proteomics
carded 158 peptide identifications containing 45 of the iden-tifications made in the decoy database. It is thus estimatedthat this rejected set of identifications contained 90 falsepositives and 68 true positives. Because the user also ac-cepted two decoy peptide identifications, we could estimatethat a total of 31 predicted true positive identifications wereaccepted by the user, indicating that about 30% of the truepositive identifications rejected by Peptizer in full automaticmode were now “rescued” by the user (Table II). However, theuser also made mistakes albeit of minor influence: two of the47 decoy peptide identifications detected by Peptizer slippedthrough the user’s scrutiny, representing a negligible increasein total false positives in the final data set. The time cost forvalidating these 193 peptide identifications by an experienceduser was 2 working days. Despite all efforts at making themanual validation process as efficient as possible, it doesincur a certain time cost. The choice between full automatic orsemiautomatic mode must therefore be made based on theimportance of sensitivity in the actual experiment. Overall,however, usage of Peptizer resulted in a major increase ofspecificity at a reasonable cost in sensitivity.
DISCUSSION
Database search algorithms must ultimately rely on fixedassumptions because of their general applicability. Analogousto pathogens that present endogenous material by molecularmimicry, the confluent transition of the scores of true nega-tives and true positives shows that a database search algo-rithm sometimes faces a problem similar to that of the im-mune system: the good and the bad look very much alikewhen evaluated by limited, generalized means. The variousproteomics approaches, however, each contribute new pro-tocol-specific knowledge or assumptions that can be used inthe peptide identification sorting process. Because thesemethod-specific validation criteria are not generally applica-ble, implementation in database search algorithms would in-tervene with the robustness of that algorithm on top of beingvery cumbersome to implement. To efficiently make use ofthis heterogeneous and changing methodology-related infor-mation, here we describe the implementation and applicationof Peptizer, a fully configurable postprocessing tool that relieson an extremely versatile pluggable voting mechanism.
Ultimately decisions on sensitivity and specificity typicallymade by bioinformaticians should match requirements set byexperimentalists. As such, the quality of the peptide identifi-cations usually is the highest priority, although specific en-deavors such as biomarker discovery will also benefit frommaximum sensitivity. The extremely configurable nature ofPeptizer readily accommodates these varying circumstancesthrough a custom aggregation of voting results.
It is also important to note that this extreme customizabilityof Peptizer at various levels is what sets it apart from any otherexisting tool. A statistical evaluation of the validation effi-ciency of Peptizer compared with other tools was omitted
here because determination of the variance specific to thetools was impractical. However, compared with other semi-manual postprocessing applications such as CHOMPER (18),DTASelect (19), or myProMS (20), Peptizer stands out bybeing fully configurable. Although these existing tools mayallow the configuration of a fixed set of criteria, Peptizer hasno fixed set of criteria. Indeed Peptizer allows any combina-tion of criteria to be used through its fully configurable andextensible Agent profile. Obviously as with the existing appli-cations, once an Agent profile is created in Peptizer, eachAgent can be configured in detail through parameters. Theconfigurability of Peptizer goes even further, however, be-cause even the actual score calculation module can be fullyconfigured by the user through pluggable Aggregators. Im-portantly the versatility of Peptizer is functionally connected toboth the full automatic and manual modes of operation. In-deed the information table in the GUI is directly fed by infor-mation from the Agents that were selected in the profile, andthe nature of each Agent’s vote is indicated in the typeface ofits detailed report. The manual validation interface thus seam-lessly adapts to any user-configured Agent profile even whenit includes custom-written Agents contributed by the user. Fullautomatic mode supports plugging in advanced, custom-builtAggregators that can connect to machine learning libraries (32).
The agents presented in Table I are mainly based on proteinchemistry and peptide identification principles. Even if more orother agents were created, e.g. based on peptide fragmentationpatterns and rules extracted from large scale studies on MS/MSspectra (34, 35), the results presented here show that falsepositive identifications are already highly enriched in the identi-fications selected by applying an appropriate Peptizer profile,thus ensuring substantially increased stringency at only limitedcost in sensitivity. Furthermore careful manual validation of theselected subset of peptides using the Peptizer validation GUIhas been shown to maintain specificity while providing a largesensitivity bonus compared with full automatic processing.
To our knowledge, we also present the first experimentaldata on the cost of manual validation that is often only hintedupon in reports. In the rich and user-oriented manual valida-tion environment that Peptizer presents, peptide identifica-tions were validated at a rate of about 100 a day. Additionallyinstead of having to validate all 2,795 original peptide identi-fications, only a Peptizer-selected subset of 193 suspiciouspeptide identifications needed validation. The total costamounted to 2 working days validation time, and 80% of thefalse positives were successfully removed with only 2.5% truepositives lost. In the context of a complete proteomics experi-ment, 2 days of validation time should be well within acceptablebounds when optimal identification stringency at high sensitivityis desired. Finally because Peptizer is an open source projectand because Agents, Aggregators, and profile configurationscan be easily shared and implemented, we hope to establish anactive user community at our purpose-built community portalthat will continue to enhance the reach and power of the tool by
Peptizer
Molecular & Cellular Proteomics 7.12 2371
by on January 27, 2010 w
ww
.mcponline.org
Dow
nloaded from

67Results Peptizer
adding Agents and progressively refined Aggregators as well asby expanding its applicable scope to the output of many othersearch engines available today.
Acknowledgments—L. M. thanks Rolf Apweiler and Henning Her-mjakob for support.
* The work in the laboratory in Ghent was supported by researchgrants from the Fund for Scientific Research-Flanders (Belgium)(Projects G.0156.05, G.0077.06, and G.0042.07), the Concerted Re-search Actions (Project BOF07/GOA/012) from the Ghent University,the Interuniversity Attraction Poles (IAP-Phase VI, Research ProjectP6/28), and the European Union Interaction Proteome (6th Frame-work Program). The costs of publication of this article were defrayedin part by the payment of page charges. This article must therefore behereby marked “advertisement” in accordance with 18 U.S.C. Section1734 solely to indicate this fact.
!S The on-line version of this article (available at http://www.mcponline.org) contains supplemental material.
¶ Supported by a Ph.D. grant from the Institute for the Promotionof Innovation through Science and Technology in Flanders(IWT-Vlaanderen).
! To whom correspondence should be addressed: Dept. of Bio-chemistry, Faculty of Medicine and Health Sciences, Ghent Univer-sity, A. Baertsoenkaai 3, B-9000 Ghent, Belgium. Tel.: 32-92649274;Fax: 32-92649496; E-mail: [email protected].
‡‡ Supported by “ProDaC” Grant LSHG-CT-2006-036814 from theEuropean Union.
REFERENCES
1. Domon, B., and Aebersold, R. (2006) Mass spectrometry and protein anal-ysis. Science 312, 212–217
2. Martens, L., and Hermjakob, H. (2007) Proteomics data validation: why allmust provide data. Mol. Biosyst. 3, 518–522
3. Matthiesen, R. (2007) Methods, algorithms and tools in computationalproteomics: a practical point of view. Proteomics 7, 2815–2832
4. Eng, J. K., McCormack, A. L., and Yates, J. R. (1994) An approach tocorrelate tandem mass spectral data of peptides with amino acid se-quences in a protein database. J. Am. Soc. Mass Spectrom. 5, 976–989
5. Perkins, D. N., Pappin, D. J., Creasy, D. M., and Cottrell, J. S. (1999)Probability-based protein identification by searching sequence data-bases using mass spectrometry data. Electrophoresis 20, 3551–3567
6. Craig, R., Cortens, J. P., and Beavis, R. C. (2004) Open source system foranalyzing, validating, and storing protein identification data. J. ProteomeRes. 3, 1234–1242
7. Matthiesen, R., Trelle, M. B., Hojrup, P., Bunkenborg, J., and Jensen, O. N.(2005) VEMS 3.0: algorithms and computational tools for tandem massspectrometry based identification of post-translational modifications inproteins. J. Proteome Res. 4, 2338–2347
8. Geer, L. Y., Markey, S. P., Kowalak, J. A., Wagner, L., Xu, M., Maynard,D. M., Yang, X., Shi, W., and Bryant, S. H. (2004) Open mass spectrom-etry search algorithm. J. Proteome Res. 3, 958–964
9. Sadygov, R. G., Cociorva, D., and Yates, J. R., III (2004) Large-scaledatabase searching using tandem mass spectra: looking up the answerin the back of the book. Nat. Methods 1, 195–202
10. Brosch, M., Swamy, S., Hubbard, T., and Choudhary, J. (2008) Comparisonof mascot and X!Tandem performance for low and high accuracy massspectrometry and the development of an adjusted mascot threshold.Mol. Cell. Proteomics 7, 962–970
11. Li, F., Sun, W., Gao, Y., and Wang, J. (2004) RScore: a peptide randomicityscore for evaluating tandem mass spectra. Rapid Commun. Mass Spec-trom. 18, 1655–1659
12. Savitski, M. M., Nielsen, M. L., and Zubarev, R. A. (2005) New data base-independent, sequence tag-based scoring of peptide MS/MS data vali-dates Mowse scores, recovers below threshold data, singles out modi-fied peptides, and assesses the quality of MS/MS techniques. Mol. Cell.Proteomics 4, 1180–1188
13. Keller, A., Nesvizhskii, A. I., Kolker, E., and Aebersold, R. (2002) Empiricalstatistical model to estimate the accuracy of peptide identifications madeby MS/MS and database search. Anal. Chem. 74, 5383–5392
14. Zhan, X., and Desiderio, D. M. (2006) Nitroproteins from a human pituitaryadenoma tissue discovered with a nitrotyrosine affinity column and tan-dem mass spectrometry. Anal. Biochem. 354, 279–289
15. Zhan, X., Du, Y., Crabb, J. S., Gu, X., Kern, T. S., and Crabb, J. W. (2008)Targets of tyrosine nitration in diabetic rat retina. Mol. Cell. Proteomics 7,864–874
16. Hardwidge, P. R., Rodriguez-Escudero, I., Goode, D., Donohoe, S., Eng, J.,Goodlett, D. R., Aebersold, R., and Finlay, B. B. (2004) Proteomic anal-ysis of the intestinal epithelial cell response to enteropathogenic Esch-erichia coli. J. Biol. Chem. 279, 20127–20136
17. Veenstra, T. D., Conrads, T. P., and Issaq, H. J. (2004) What to do with“one-hit wonders”? Electrophoresis 25, 1278–1279
18. Eddes, J. S., Kapp, E. A., Frecklington, D. F., Connolly, L. M., Layton, M. J.,Moritz, R. L., and Simpson, R. J. (2002) CHOMPER: a bioinformatic tool forrapid validation of tandem mass spectrometry search results associatedwith high-throughput proteomic strategies. Proteomics 2, 1097–1103
19. Tabb, D. L., McDonald, W. H., and Yates, J. R., III (2002) DTASelect andContrast: tools for assembling and comparing protein identificationsfrom shotgun proteomics. J. Proteome Res. 1, 21–26
20. Poullet, P., Carpentier, S., and Barillot, E. (2007) myProMS, a web server formanagement and validation of mass spectrometry-based proteomicdata. Proteomics 7, 2553–2556
21. Choi, H., and Nesvizhskii, A. I. (2008) Semisupervised model-based vali-dation of peptide identifications in mass spectrometry-based proteom-ics. J. Proteome Res. 7, 254–265
22. Gevaert, K., Van Damme, P., Ghesquiere, B., Impens, F., Martens, L.,Helsens, K., and Vandekerckhove, J. (2007) A la carte proteomics with anemphasis on gel-free techniques. Proteomics 7, 2698–2718
23. Stahl-Zeng, J., Lange, V., Ossola, R., Eckhardt, K., Krek, W., Aebersold, R.,and Domon, B. (2007) High sensitivity detection of plasma proteins bymultiple reaction monitoring of N-glycosites. Mol. Cell. Proteomics 6,1809–1817
24. Staes, A., Van Damme, P., Helsens, K., Demol, H., Vandekerckhove, J., andGevaert, K. (2008) Improved recovery of proteome-informative, proteinN-terminal peptides by combined fractional diagonal chromatography(COFRADIC). Proteomics 8, 1362–1370
25. Gevaert, K., Van Damme, P., Martens, L., and Vandekerckhove, J. (2005)Diagonal reverse-phase chromatography applications in peptide-centricproteomics: ahead of catalogue-omics? Anal. Biochem. 345, 18–29
26. Staes, A., Timmerman, E., Van Damme, J., Helsens, K., Vandekerckhove,J., Vollmer, M., and Gevaert, K. (2007) Assessing a novel microfluidicinterface for shotgun proteome analyses. J. Sep. Sci. 30, 1468–1476
27. Martens, L., Vandekerckhove, J., and Gevaert, K. (2005) DBToolkit: proc-essing protein databases for peptide-centric proteomics. Bioinformatics(Oxf.) 21, 3584–3585
28. Martens, L., Hermjakob, H., Jones, P., Adamski, M., Taylor, C., States, D.,Gevaert, K., Vandekerckhove, J., and Apweiler, R. (2005) PRIDE: theproteomics identifications database. Proteomics 5, 3537–3545
29. Elias, J. E., and Gygi, S. P. (2007) Target-decoy search strategy for in-creased confidence in large-scale protein identifications by mass spec-trometry. Nat. Methods 4, 207–214
30. Helsens, K., Martens, L., Vandekerckhove, J., and Gevaert, K. (2007) Mas-cotDatfile: an open-source library to fully parse and analyse MASCOTMS/MS search results. Proteomics 7, 364–366
31. Piggee, C. (2008) LIMS and the art of MS proteomics. Anal. Chem. 80,4801–4806
32. Ian, H. W., and Eibe, F. (2005) Data Mining: Practical Machine LearningTools and Techniques, 2nd Ed., Morgan Kaufmann, San Francisco
33. Nesvizhskii, A. I., and Aebersold, R. (2005) Interpretation of shotgun pro-teomic data: the protein inference problem. Mol. Cell. Proteomics 4,1419–1440
34. Kapp, E. A., Schutz, F., Reid, G. E., Eddes, J. S., Moritz, R. L., O’Hair, R. A.,Speed, T. P., and Simpson, R. J. (2003) Mining a tandem mass spec-trometry database to determine the trends and global factors influencingpeptide fragmentation. Anal. Chem. 75, 6251–6264
35. Tabb, D. L., Friedman, D. B., and Ham, A. J. (2006) Verification of auto-mated peptide identifications from proteomic tandem mass spectra. Nat.Protoc. 1, 2213–2222
Peptizer
2372 Molecular & Cellular Proteomics 7.12
by on January 27, 2010 w
ww
.mcponline.org
Dow
nloaded from


69Results Peptizer
2.2 Increasing the specificity of peptide identifications
The Peptizer paper illustrates improved specificity of peptide identifications using an expert
rule set tailored to the N-terminal COFRADIC protocol.
Additionally, Peptizer played an important role in assuring the quality of identifications
of peptides carrying 3-nitrotyrosine. Nitration of tyrosines during oxidative stress is
considered highly interesting because it possibly interferes with cellular signaling by tyrosine
phosphorylation, a.o. identifying such nitrated peptides by MS/MS was however found to
be di/cult and error-prone (Stevens et al., 2008). Ghesquiere et al. elaborated a specific
COFRADIC methodology to study this modification, and Peptizer was employed to assess the
resulting identifications (Ghesquiere et al., 2009).
Obviously, the nitrated tyrosine is the site of interest in this study. Therefore, a modification
coverage Agent in Peptizer was created to assert flanking ion coverage by b- or y-ions for the
nitrated tyrosine (Figure 9). By demanding the presence of such flanking ions, each nitration site
reported in this study is specifically delineated by fragment ions.
Figure 9. Two nitrated peptides are shown here annotated by their b- and y-ion coverage
(blue and red lines, respectively). Furthermore, the proposed site of nitration is annotated in
green. While the fragment ions in (a) do not provide direct evidence for the nitrated tyrosine
residue, the fragment ions in (b) do delineate the modified residue. In the analysis described
in the main text, the peptide identified in (a) will not be included in the final results list.

70 Improving the sensitivy and the specificity in peptide centric proteomics
Furthermore, the COFRADIC protocol relies on a reduction of the nitrated tyrosines with
sodium dithionite, which was shown to produce either the 3-amino-tyrosine derivative, or the
sulfated 3-amino-tyrosine derivative. Each form conveys specific information in the MS/MS
spectrum, which can be exploited by the Peptizer expert system. A sulfated 3-amino-tyrosine
peptide on the one hand displays a neutral loss ion of the precursor ion of 80 Da in the MS/
MS spectrum. The presence of this ion can thus be used to strengthen the identification of
the original nitration modification (figure 10). An amino modified peptide on the other hand,
more easily acquires additional charges through the extra alkaline group, and therefore yields
abundant doubly-charged fragment ions. If such ions are often found in a spectrum, they imply
the original presence of the nitration modification.
Similar to the MascotDatfile library and ms_lims, the Peptizer platform was developed in
Java and is maintained as a Maven 1 project. Third-party interest in the application is illustrated
through the site statistics of the Peptizer website (Figure 11).

71Results Peptizer
Figure 10. This figure shows two box plots of the relative intensity of the 80 Da precursor
neutral loss ion for 3-amino-tyrosine sulfated and non-sulfated peptides isolated by
COFRADIC. The relative intensity value is calculated compared to the highest peak in the
spectrum. 75% of the MS/MS spectra of the sulfated peptides contain a clearly discernible
precursor neutral loss ion (relative intensity >15%), while non-sulfated peptides only show
infrequent random matches to this peak. This precursor neutral loss ion was therefore used
as an expert criterion to improve the trustworthiness of 3-amino-tyrosine sulfated peptide
identifications.

72 Improving the sensitivy and the specificity in peptide centric proteomics
Figure 11. This figure shows the quarterly Peptizer website statistics to illustrate the interest in
the tool. The page load displays the number of times any page on the site has been visited.
The number of unique visitors corresponds to the number of unique IP addresses that have
visited the site, while the first time visitors list the number of IP addresses that have visited
the site for the first time. Finally, the number of returning visitors shows the number of IP
addresses that have accessed the site more than once, for instance to retrieve newer versions
over time.

73Results Peptizer
2.3 Increasing the sensitivity of peptide identifications
2.3.1 Employing Peptizer
Although not emphasized in the Peptizer paper, the application of expert knowledge can
also serve to increase the sensitivity. This can be achieved by lowering the search algorithm
threshold for false positive identifications, while compensating for this additional leeway using
Peptizer. The additional expert knowledge in Peptizer should allow the tool to select reliable
identifications more sensitively, while stringently refusing incorrect identifications. Using the
same data set used in the original Peptizer paper, Peptizer identified additional peptides while
avoiding an increase of false positive peptide identifications when the database search algorithm
threshold score was lowered (Table 2).
Furthermore, figure 12 shows how most of the false positive peptide identifications within
the [95% : 99.5%] probability interval fail to pass the expert rules set used by Peptizer while more
than 70% of the true positive identifications within that interval do pass the rules set. In other
words, upon lowering the probability threshold by one order of magnitude from 99.5% to 95%,
the false discovery rate could be stabilized by Peptizer, while the number of genuine peptide
identifications increased, thus substantially improving sensitivity.

74 Improving the sensitivy and the specificity in peptide centric proteomics
Table 2. This table compares three strategies to accept peptide identifications, using
di"erent probability thresholds, and by applying Peptizer. After lowering the probability
threshold from 99.5% to 95%, 494 MS/MS spectra are additionally identified including an
eight-fold increase in false positive peptides that were identified from the decoy part of
the concatenated target-decoy database. Yet, if Peptizer is further applied to the peptide
identifications that emerge when lowering the probability threshold, 301 additionally MS/MS
spectra remain retained as correct identifications while the number of additional decoy hits is
decreased. The last column further illustrates the more controlled increase in FPR after applying
Peptizer as compared to simply lowering the probability threshold.

75Results Peptizer
Figure 12. This figure demonstrates how the sensitivity can be increased by lowering the
probability threshold from 99.5% to 95%, while minimizing the loss in specificity by applying
Peptizer. All identified MS/MS spectra that score between the 95% and the 99.5% probability
threshold have been inspected by Peptizer, and the left and the right panels show the
identifications that were accepted and rejected by Peptizer, respectively. Both panels
show bars for the number of spectra that were identified in the target or the decoy part of
the concatenated target-decoy database. The identifications derived from the decoy part
are considered false positive peptide identifications (red), and an equal amount of false
positives is correspondingly inferred for the target part of the database (fading red within
the green bars) . The remaining peptide identifications are considered true positive peptide
identifications (green). It is clear that Peptizer succeeded in rejecting the majority of false
positives in the 95% to 99.5% interval while accepting most true positives.

76 Improving the sensitivy and the specificity in peptide centric proteomics
2.3.2 Modification tolerant searches as a strategy to study unanticipated PTM’s
Finally, we tried to lower the number of unidentified spectra by using Mascot error tolerant
searches (ETS). These searches are free of user-selected modification constraints since they
allow a peptide to carry one tolerated modification from all the modifications listed in
Unimod (Creasy and Cottrell, 2004). Note that an ETS is designed to follow a standard search,
considering only protein entries that were already identified in this search. The obtained results
therefore likely underestimate the total number of modified peptides present in the unidentified
spectra.
We have therefore again employed the data generated by the 3-nitrotyrosine COFRADIC
experiment published earlier (Ghesquière et al., 2009). We have first repeated the database
search as described in this manuscript, as this standard search was performed with settings that
reflected the elements considered by the experimentalists based on the protocol employed.
Subsequently, we compared this to the ETS search which identified a series of modified peptides
that were not found in the initial search (Figure 13).
The deamidation modification was found to be highly abundant, and in retrospect this
should have been expected since the peptides were incubated overnight at high pH, which is
known to promote deamidation (Krokhin et al., 2006). Furthermore, 431 MS/MS spectra were
identified carrying single amino acid mutations in a known peptide sequence, but the majority
of these boiled down to isobaric combinations between modifications and amino acids. Other,
less prominent modifications such as dioxidation and iodation could also have been anticipated
by the specific COFRADIC protocol as peptides were initially treated with hydrogen peroxide to
uniformly oxidize methionine residues, and iodoacetamide, probably contains iodine remnants,
was used to alkylate protein cysteine residues.

77Results Peptizer
Figure 13. This figure shows the most frequent, unanticipated modifications occurring in a
3-nitrotyrosine COFRADIC dataset that were identified by a Mascot error tolerant search of
the dataset.
We thus conclude that a modification tolerant strategy like ETS should become standard
practice for newly developed protocols; not so much aimed at increasing the number of
identified MS/MS spectra, but rather to investigate the (unexpected) artificial modifications
caused by the protocol.

“Visual representations of evidence should be governed by principles of reasoning,
clear and precise seeing becomes as one with clear and precise thinking.”
-- Edward Tufte

79Results Case study
3. Case study: a yeast N-terminal proteome
As an application of the work performed in this thesis, we have attempted to improve the
sensitivity and the specificity on an analysis of S. cerevisiae N-terminal peptide isolated by
the COFRADIC technology. First, in order to improve sensitivity, we have searched the MS/
MS spectra against a yeast protein sequence database extended by in-frame translations of
the 5’ UTR. Second, in order to increase the specificity, we have applied specific Peptizer rules
to ensure the selection of in vivo alpha-N-acetylated peptides. Since alpha-N-acetylation of
proteins occurs co-translationally – thus on nascent polypeptide chains –, we are thus provided
with further evidence that the identified peptides are derived from actual translation initiation
sites. The obtained results were then used to validate existing translation initiation sites and
annotate previously unknown translation initiation sites.
3.1 Background
The mechanism of protein translation has been documented extensively. Following
transcription and processing, the resulting mature mRNA encodes an amino acid sequence
that can be decoded by the cell’s translation machinery via three subsequent steps: initiation,
elongation and termination (Thornton et al., 2003). Eukaryotic translation initiation starts
when the ternary complex (Met-tRNA, GTP and eIF2) combines with the 40S ribosomal subunit
and other eukaryotic translation initiation factors (eIFs) to form the 43S pre-initiation complex.
This subsequently interacts with the eIF4 complex, which also functions as a sca.old for the
5’ capped mRNA, together forming the 48S initiation complex. Following this, the complex
starts scanning the mRNA until the appropriate initiation codon is located, recruiting the 60S
ribosomal subunit, and ultimately leading to the formation of the 80S ribosome which initiates
protein translation. For further details on this mechanism, we refer to an excellent recent review
(Van Der Kelen et al., 2009).

80 Improving the sensitivy and the specificity in peptide centric proteomics
The numerous factors involved in translation initiation suggest a complex regulatory
mechanism, yet the determination of the initiation codon is considered fairly straightforward:
the first start codon encountered when scanning the processed transcript, is the most probable
translation initiation site (Kozak, 1986). This is further strengthened by the presence of nucleic
acid context features like the Kozak motif (Kozak, 1987a) or preceding adenine stretches in AT
rich genomes such as yeast (Nakagawa et al., 2008).
E.ective recognition of the initiation codon is of crucial importance because distinct
initiation codons result in protein variants or multivalent translation. Moreover, an
uncontrolled extension or reduction of a protein’s N-terminal sequence could interfere with
protein localization by altering signal or transit sequences. Yet, alternative translations occur
and some principal causative mechanisms are known. Leaky scanning is one of these in which
the first initiation codon is circumvented in favour of starting translation at the second (or
third) initiation codon (Kozak, 1991). Ribosome shunting is another situation where the first
initiation codon is localized within a structured mRNA region and therefore bypassed (Fütterer
et al., 1993). The occurrence of re-initiation is yet another mechanism, which might occur when
the 40S ribosomal subunit remains attached to the mRNA and recommences scanning until
a secondary initiator codon is encountered and restarts translation (Gaba et al., 2001; Kozak,
1987b).
After translation initiation, the translation machinery recruits elongation factors that further
translate the protein sequence, and as soon as 30 N-terminal residues have been translated, the
protein can become the target of co-translational modifications. The amino acid composition
of a protein’s N-terminal part determines whether a protein is subjected to methionine removal
by methionine aminopeptidases (MAPs) (Li and Chang, 1995) and to N-terminal acetylation
by N-terminal acetyltransferases (NATs) (Driessen et al., 1985; Polevoda and Sherman, 2003).
Since these modifications exclusively take place during translation (Kendall et al., 1990), the
identification of N-terminal in vivo acetylated peptides must be considered as direct lead to
genuine translation initiation sites (TIS).

81Results Case study
3.2 In silico analysis of database annotated protein N-termini reveals non-
random usage of amino acids in yeast
Before studying experimentally identified N-terminal peptides, we evaluated the theoretical
amino acid composition of the baker’s yeast proteome. Therefore, we used the iceLogo
application to compare amino acid frequencies at yeast protein N-termini as compared to
random amino acid frequencies in yeast (Colaert et al., 2009).
We observed that the random frequency of serine residues is 9%, but that this increases
up to 23% for the position directly following the initiator methionine, which is more than a
two-fold change (figure 14). Moreover, this increased occurrence of serines continues further
downstream in yeast protein N-termini. This significant increase notwithstanding, we failed
to find an acceptable explanation for these observations. Interestingly, methionine residues
are significantly underrepresented at protein N-terminal parts, which might well be a safety
mechanism to avoid alternative TIS.
We observed a similar trend in an in silico analysis of the human proteome. There we
encountered an increased preference for alanine residues of 23% compared to the random
frequency of 7%. Consequently, we presume that this non-random amino acid usage at protein
N-termini might be a yet to be determined evolutionary trait of specific organisms.

82 Improving the sensitivy and the specificity in peptide centric proteomics
Figure 14. This iceLogo shows the percentage di"erence of amino acid frequencies between
protein N-termini and random positions in S. cerevisiae. Percentage di"erences are only
shown if they are more than 99.9% significant based on Monte Carlo sampling. Serine occurs
with a frequency of 23 % on the first position following the initiator methionine, which is 14%
more than the random serine frequency of 9%. Additionally, this increased frequency is also
observed further down the protein N-termini. Interestingly, methionine residues occur less
frequently along N-termini than expected at random, which could be a safety mechanism to
avoid alternative translation initiation by leaky scanning.
3.3 Identification of known and alterative N-termini by positional
proteomics
If protein translation initiates upstream of current annotations, then the N-terminal peptide
would be absent from the existing protein sequence databases. Thus we have constructed a
proteogenomics approach for S. cerevisiae similar to other endeavors aimed at validating and
correcting existing TIS annotations in two Mycobacterium species (Gallien et al., 2009) and in
D. melanogaster (Goetze et al., 2009). We here constructed a 5’ UTR extended protein sequence
database to search the MS/MS spectra from the yeast N-terminal COFRADIC proteome.
We first collected the yeast protein entries encompassed in UniProtKB/Swiss-Prot, and then

83Results Case study
obtained the corresponding 5’UTR in-frame sequences from the yeast genome sequence in the
S.cerevisiae genome database (SGD) by making use of the PICR service (Côté et al., 2007). The
concise algorithm used to extract peptides from these 5’ UTR derived sequences is illustrated
in Figure 15. First, the algorithm locates in-frame upstream start codons that could potentially
lead to alternative upstream TIS. Then, starting from these sites, the algorithm locates the
first downstream arginine codon and creates a 5’ UTR peptide between these two residues.
When applied to all yeast UniProt entries, the algorithm constructs a peptide centric database
encompassing all potential 5’ UTR alternative TIS derived from Arg-C cleavage (which is
expected from an N-terminal COFRADIC analysis (Gevaert et al., 2003)).
The Mascot database searches performed on this extended sequence database identified
10,466 MS/MS spectra at 99% probability; decoy searches estimated the peptide false discovery
rate to be very low at 0.64%. The resulting forward peptide identifications were subsequently
grouped by their N-terminal modification state, yielding 831 in vivo acetylated peptide
sequences and 3,701 in vivo unmodified peptide sequences. Only the peptides in the first group
were used throughout the rest of the analysis since the identification of in vivo N-acetylation
provided us with extra evidence that they were genuine TIS (Arnesen et al., 2009).
These 831 N-acetylated peptides were again divided into three categories: group A
(n=701) includes all N-terminal peptides from known, database annotated TIS (starting at
protein position one or two), group B contains all N-terminal peptides that initiate from 5’
and 3’ alternative TIS and start with or follow a methionine residue (n=62), while group C
encompasses all N-terminal peptides that initiate from 5’ and 3’ alternative TIS but do not start
with or follow a methionine residue (n=68).

84 Improving the sensitivy and the specificity in peptide centric proteomics
Figure 15. Creation of the 5’ UTR in-frame peptide centric database. First (A), each UniProtKB/
SwissProt entry was linked to its S. cerevisiae genome database identifier (SGD) using the
PICR service, such that the N-terminal peptide of the protein could be aligned on the
corresponding nucleic acid sequence. Second (B), the algorithm extracts 1000 bp upstream
of the annotated TIS, and subsequently maps in-frame start and stop codons within the
coding sequence. Third, (C) potential alternative TIS are translated, and the algorithm
subsequently maps the closest downstream arginine residue to mimic ArgC specificity
(expected in an N-terminal COFRADIC analysis). Fourth, (D) the potential alternative TIS sites
are stored in the 5’ UTR in-frame peptide centric database along with a distance index to the
annotated TIS. This database is subsequently concatenated to the UniProtKB/SwissProt yeast
fraction for the actual sequence database searches.

85Results Case study
To ensure the quality of the peptide identifications, we made use of Peptizer to
automatically inspect the identifications. We created Agents that specifically inspected the in
vivo N-acetylation state essential to determine a TIS. The first Agent inspected the peptide
identifications for adequate fragment ion coverage. This is further complemented by a second
Agent that inspects the peptide bond most proximal to the N-terminus for which either b- or
y-ions were detected. The result of these inspections is shown in figure 16, and demonstrates
how the peptide identifications presented here are filtered for quality. Another Agent inspected
MS/MS spectra for the presence of secondary (or tertiary) confident peptide hypotheses; and
each such ambiguously identified MS/MS spectrum was discarded from the results. Taken
together, 729 acetylated peptide sequences passed these quality checks (nA = 617, nB = 57, nC =
55).

86 Improving the sensitivy and the specificity in peptide centric proteomics
Figure 16. The figure splits the identified peptides in three groups: N-termini, alternative
N-termini that start with or follow a methionine residue and alternative N-termini that do not
start with or follow a methionine residue. The matrix plot shows sequence coverage values
as observed by Peptizer. First, the coverage of the N-terminus is calculated as the percentage
of single and/or double charged fragmentation ions found for its three first peptide bonds
(b1, b2, b3, yn-1, yn-2, yn-3), and this metric is set along the vertical axis. The three major vertical
categories reflect the distance to the N-terminus, given as the location of the fragment ion
closest to the N-terminus (position 1, 2, or 3). Within these three vertical categories, the
peptides are binned by total fragment ion coverage (minor horizontal axis). The size of each
data point reflects the percentage of peptides found at that location. Well-substantiated
peptides are thus located to the lower right on each row, indicating the presence of many
fragment ions, including those that cover the N-terminus.
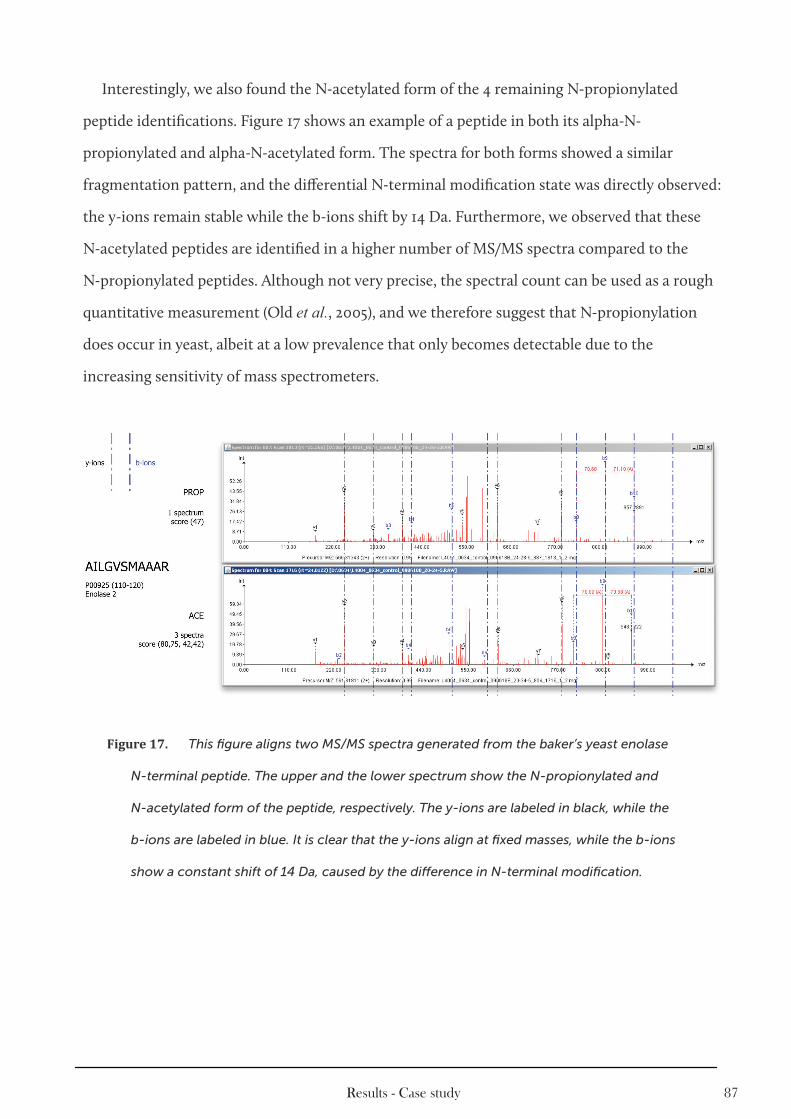
87Results Case study
Interestingly, we also found the N-acetylated form of the 4 remaining N-propionylated
peptide identifications. Figure 17 shows an example of a peptide in both its alpha-N-
propionylated and alpha-N-acetylated form. The spectra for both forms showed a similar
fragmentation pattern, and the di.erential N-terminal modification state was directly observed:
the y-ions remain stable while the b-ions shift by 14 Da. Furthermore, we observed that these
N-acetylated peptides are identified in a higher number of MS/MS spectra compared to the
N-propionylated peptides. Although not very precise, the spectral count can be used as a rough
quantitative measurement (Old et al., 2005), and we therefore suggest that N-propionylation
does occur in yeast, albeit at a low prevalence that only becomes detectable due to the
increasing sensitivity of mass spectrometers.
Figure 17. This figure aligns two MS/MS spectra generated from the baker’s yeast enolase
N-terminal peptide. The upper and the lower spectrum show the N-propionylated and
N-acetylated form of the peptide, respectively. The y-ions are labeled in black, while the
b-ions are labeled in blue. It is clear that the y-ions align at fixed masses, while the b-ions
show a constant shift of 14 Da, caused by the di"erence in N-terminal modification.

88 Improving the sensitivy and the specificity in peptide centric proteomics
3.4 Heterogeneous translation initiation
Altogether, we identified 57 unique in vivo N-acetylated peptides that started with or were
followed by a methionine residue but that did not map to a known TIS at protein position 1 or 2
(Figure 18). In order to determine whether these constitute possible erroneous TIS annotations
for the identified gene products, or whether they are cases of alternative TIS, we have gathered
further information on these proteins. First, we have mapped all peptides identified in our
analysis that start on annotated positions one or two. Additionally, we also mapped all peptides
identified in the most comprehensive yeast proteome analysis to date (de Godoy et al., 2008)
onto our data set. Furthermore, we used the BIOMART service to extract all peptides that
were identified in S. cerevisiae and stored into the PRIDE database to date (January 21, 2010).
This allowed us to verify whether any peptides were identified that preceded the N-acetylated
“internal peptides” identified in our analysis. If such preceding peptides were found, they
indicated alternative TIS. When no preceding sequence evidence was found, we further
calculated whether the current annotated TIS would generate a detectable (mass between 600
Da to 4000 Da) ArgC peptide in our analysis, or a detectable LysC/P peptide with 2 allowed
missed cleavages in the analysis by de Godoy et al.
This analysis allowed us to separate the 57 unique in vivo N-acetylated peptides in three
groups. The first group consists of 39 N-acetylated peptides for which either our experiment,
the PRIDE database or the experiment by de Godoy et al. found preceding peptide sequence
evidence, thus providing examples of alternative TIS (Figure 18a). This group also encompasses
the only two peptides that were identified in the 5’ UTR translations since we found the
annotated N-terminus of the protein as well. This rather low number of upstream TIS indicates
that TIS annotations in yeast are generally reliable, even though the number of alternative
TIS is higher than expected. Some of these alternative TIS are located close to the known TIS,
and therefore probably result from leaky scanning. Other alternative initiation sites however,
are located several residues downstream of the annotated TIS and could provide interesting
candidates for regulatory mechanisms. The second group consists of 17 N-acetylated peptides
for which we have not found preceding sequence evidence, although we have calculated that
the annotated N-terminal peptide (Arg-C and trypsin specificity in our analysis and the analysis

89Results Case study
by de Godoy et al., respectively) was detectable by mass spectrometry in the [600Da : 4000Da]
mass interval (Figure 18b). As such, we presume that these alternative N-termini are in fact the
real TIS and that they could be used to correct current database annotations. It is of course
important to realize that a missing signal from the proteomic analyses performed here or by de
Godoy et al. cannot be used to rule out the actual presence of the peptide in the experimental
sample. As a result, the potential TIS corrections we have found here require further validation
by wet-lab experiments. Finally, the third group encompasses one remaining alternative
N-acetylated peptide for which the annotated TIS peptide could not have been detected in
either analysis, and no further conclusions could therefore be made for this peptide (Figure 18c).
Even though we provide ample in silico evidence to assure the quality of these peptide
identifications, it is important to stress that further (biological) validation will be necessary to
ascertain our findings. Such a validation study falls outside the scope of this thesis however.
These new TIS should therefore primarily be considered as pointers for further study on the
corresponding transcripts and gene products and their regulated mechanisms of expression,
similar to the studies undertaken by (Antúnez de Mayolo et al., 2006; Outten and Culotta, 2004;
Welch and Jacobson, 1999).

90 Improving the sensitivy and the specificity in peptide centric proteomics

91Results Case study
Figure 18. This figure shows the in vivo N-acetylated alternative N-terminal peptides that
were identified in the analysis as orange bars, aligned on the X-axis by their start site in
the parent protein. Furthermore, the figure highlights annotated N-acetylated N-terminal
peptides identified in this experiment in blue, peptides identified in (de Godoy et al., 2008)
in gray, and all peptides stored in PRIDE for S. cerevisiae in green. Panel A displays the
alternative N-acetylated peptides for which we have found preceding peptide sequence
evidence, and we therefore suggest that these are potential examples of alternative TIS. Panel
B subsequently displays all alternative N-acetylated peptides for which we not have found
preceding peptide sequence evidence, yet we have calculated that the annotated TIS peptide
should be detectable by mass spectrometry in the [600Da : 4000Da] mass interval. Therefore,
we suggest that these are potential corrections of current TIS annotations. Finally, panel C
displays the alternative N-acetylated peptides that could not have been detected in either
analysis based on the mass interval applied in panel B.

92 Improving the sensitivy and the specificity in peptide centric proteomics
3.5 Mapping of signal and transit sites annotated by UniProtKB
Among the 54 identified proteins bearing an alternative TIS, 3 proteins are annotated
in UniProtKB/Swiss-Prot with a signal or transit site. The first protein, the FAS1 domain-
containing protein YDR262W (Q12331), has a predicted signal peptide from position 1 to 26,
and we have identified an alternative translation initiation site on position 19. The alternative
TIS thus presumably interferes with the function of the signal peptide. The second protein,
DNA ligase 1 (P04819), has a potential mitochondrial transit sequence from position 1 to 44,
which is most likely disturbed when translation initiation starts at position 25 as identified in
this analysis. The third protein, 54S ribosomal protein L36 (MrpL36p, (P36531), is an essential
nuclear encoded protein residing in mitochondria. Its transit peptide is located from position 1
to 14 (Grohmann et al., 1991). MrpL36p can be split into three parts by evolutionary traits: a non-
conserved N-terminal domain, and a conserved central and C-terminal domain. MrpL36p is part
of the large mitochondrial ribosome subunit and it has been linked to mRNA recognition and
translation initiation (Williams et al., 2004). Interestingly, we have identified an alternative TIS
at position 49 which likely interferes with the localization of MrpL36p to the mitochondria, thus
potentially allowing it to exert its functions in an as yet unexpected context. There is therefore
clearly a need to experimentally localize and confirm these alternative TIS, and to examine
the quantitative balance between the possible TIS sites for a given protein under di.erent
conditions.

93Results Case study

3
Discussion

95Discussion
Section 3. Discussion
1. Data processing and management
Evolutions in mass spectrometry and peptide separation have enabled comprehensive
proteome analysis. This doctoral thesis started o. with the development of the MascotDatfile
library which enabled us to adequately process the information that comes with such large
scale e.orts. From the outset, we have developed the project as a well-structured open source
library, and this has resulted in a solid production grade product that could continuously evolve
throughout the course of the doctoral project. Following the lead of the MascotDatfile library,
similar data processing libraries for other search engine output formats have been developed
as well, notably for OMSSA (Barsnes et al., 2009) and X!Tandem (Muth et al., 2010). These
developments will doubtlessly be very useful for future automated integration of MS/MS search
results obtained by these three search engines.
Furthermore, throughout the thesis, we have maintained and extended the data automation
and storage tools of ms_lims. As a result, the system now provides a solid and automated data
flow from MS/MS spectra over peptide identifications to peptide quantitation, in addition
to its original functions. Unanimously adopted and understood by the researchers in the
proteomics group, ms_lims guides all data resulting from their proteomic experiments into
a standardized and unified relational storage system. This in turn is crucial to assure the
availability of data, both as a historical log of experimental results and as a source for future
integrative experiments. Since ms_lims has been proven to boost the productivity of its users,
we recommend that any proficient peptide-centric proteomics laboratory should implement an
ms_lims like workflow automation and data storage engine.
The choice for Java as the programming language for this bioinformatics-oriented thesis
has been justified in terms of performance and ease of maintenance. The indexing strategy
used in MascotDatfile for instance, enabled the processing of Mascot result files containing

96 Improving the sensitivy and the specificity in peptide centric proteomics
peptide identifications of hundreds of thousands MS/MS spectra with manageable memory
footprints, while the cross-platform nature of Java allowed the seamless use of MascotDatfile
on a UNIX cluster. Additionally, the creation of user-friendly GUI’s for each of these tools was
greatly facilitated by the equally platform-independent Swing libraries included with the Java
programming language.
Most results presented in this thesis relied on the availability of underlying software
platforms such as the Java programming language or the MySQL relational database
management system. Likewise, the main results of this PhD thesis - MascotDatfile, ms_lims
and Peptizer – in turn serve as platforms for discovery; while these tools may not hold new
knowledge of themselves, they become indispensable instruments to gather new knowledge.
Given the strong influence exerted by available computational technology, it will be
interesting to see current computational advances such as virtualization, cloud computing
and knowledge engineering play out in the field of peptide centric proteomics. Indeed, these
technologies make it possible to configure ms_lims once in a virtual machine image that can be
distributed in the cloud, altogether lowering the implementation e.ort and further improving
the performance-to-cost ratio of the system. The increasing number of users that store their
results in a centralized system will also yield an increasing amount of publically available data
through repositories such as PRIDE and PeptideAtlas, that can in turn continuously empower
knowledge systems to suggest optimal targets for future experiments. There are surely
interesting times ahead with regards to our ability to store and analyze data.

97Discussion
2. The specificity of an experiment
In general, a research project attempts to gather high quality data leading to strong
conclusions. Yet in order to achieve this goal, it is essential to define a priori what hypothesis
needs to be resolved. If for example, the experiment attempts to profile a system where a
uniform signal is expected as outcome (e.g., protease cleavage specificity), then a 5% false
discovery rate among the peptide identifications should not obscure the resulting signal. But
if each peptide identification might be employed to infer biological knowledge via subsequent
validation studies, then even a 0.5% false discovery rate may well be too much. In the latter case,
it pays to ensure the quality of each peptide identification through relevant expert knowledge
before embarking on further validation experiments.
The urge for individualized quality inspection outlined above especially applies to so-called
one-hit-wonders. If such single-peptide protein hits are simply discarded, one must necessarily
give up on targeted approaches like phosphoproteomics or positional proteomics since these
methodologies intrinsically yield and rely on single hit peptide identifications. Yet in order to
retain them, the quality of each individual peptide identification should be asserted exhaustively
to ensure high quality results.
While the case for subjecting crucial peptide identifications to manual validation may be
widely accepted, such endeavors have become far too labor intensive in practice due to the
overwhelming number of peptide identifications that have to be considered, even in a single
experiment. The Peptizer platform we developed therefore supplies the necessary tools to
automate and facilitate semi-manual validation.

98 Improving the sensitivy and the specificity in peptide centric proteomics
Translation of expert rules into Peptizer Agents requires knowledge of the Java programming
platform, and although the implementation procedure is fairly straightforward and well-
documented, we recognize this programming requirement as a limiting factor for the wide
adoption of the Peptizer platform. And while we have created an online support platform to
share custom-built Agents, and to handle additional Agent requests, we believe this system has
to evolve in the near future towards an automated online Agent retrieval system that is closely
integrated with the application itself. As such, all publicly available Agents can simply show up
in the accustomed user interface without requiring additional actions from the user.
As a final consideration on specificity, we want to discuss the compatibility between the
Peptizer platform and an established database search algorithm. An algorithm like Mascot
can only rely on the universal features of an identification to distinguish false positives from
true positives as it must support a wide variety of di.erent scenarios and applications. But
when a specific set of peptides is targeted by the experimental protocol, new features become
available that are only shared by the targeted peptides. More generally, when an experimental
protocol becomes more specialized, its parameters become less universal, thus becoming
more informative for expert driven quality validation (Figure 19). Consequently, we learned
to separate these parameters into general information that is shared among each peptide
identification and therefore particularly useful for search engines, and experiment-specific
information related to the protocol, which is ideally suited to complement the database search
engine.
This does imply however, that the Peptizer platform will prove more e/cient when applied
to a targeted proteomics experiment than when applied to a shotgun proteomics experiment,
since the latter carries less discriminating information then the former.

99Discussion
Figure 19. This figure illustrates the respective strengths of database search algorithms and
expert driven quality validation. Widely applied, generic protocols provide few protocol-
specific attributes and are adequately analyzed using traditional search engines. Targeted
proteomic experiments on the other hand are more specialized and thereby capture
di"erentiating protocol specific attributes that can give expert driven quality validation a
considerable advantage.

100 Improving the sensitivy and the specificity in peptide centric proteomics
3. The sensitivity of an experiment
The sensitivity of a peptide-centric proteomics analysis can be formulated as the extent to
which the identified peptides reflect the composition of the underlying protein mixture. We
believe that sensitivity is impaired by computational and by instrumental barriers, and that both
need to be assessed to improve the sensitivity of a proteomics experiment.
On the computational side, the sensitivity deficit can be expressed as the amount of MS/
MS spectra that hold relevant (peptide-derived) information, but remain unidentified. MS/
MS spectrum quality classification can be used to estimate this fraction of unidentified, yet
high-quality MS/MS spectra, and we have introduced such functionality into ms_lims via the
SpectrumQualityGUI. As such, users can now analyze the magnitude of this metric in the
context of their experiment, and can evaluate whether to undertake further actions to find and
fix underlying causes if the number of unidentified but promising spectra is high.
Unanticipated modifications are a main contributing factor to these unidentified MS/MS
spectra. To assess the prevalence of such unexpected modifications, modification tolerant
searches have proven valuable as illustrated in the results. Ideally, such a modification tolerant
search strategy should be plugged into ms_lims as a monitoring service that runs in the
background when a relevant collection of new MS/MS spectra is first stored in the database. The
results of these automatic searches should not be used as actual peptide identifications, but will
rather serve as an automated reporting service that informs the users on the content of their
project in a standardized format, and will assist the users to run the actual database searches
with an optimal parameter set.
Another sensitivity issue on the computational side is the limiting factor of incomplete
protein sequence databases. If the amino acid sequence of the protein in the sample is not
as such inside the protein sequence database, then not all corresponding MS/MS spectra can
be identified correctly either. We expected this to be the case for N-terminal COFRADIC
experiments due to incorrect TIS annotations in S. cerevisiae, yet we were unable to identify
many novel TIS in the 5’ UTR region, showing that TIS annotation in yeast is actually quite

101Discussion
reliable. Another cause of incomplete sequence databases might be related to individual genetic
variability. Small genetic variations such as a serine to threonine mutation are considered
acceptable through evolution, yet such changes result in completely distinct entities when
measured by mass spectrometry. We presume that the ready availability of next-generation
sequencing technologies will soon shed light on this question via individualized nucleic acid
sequence analysis. To that extent, we are currently preparing a future research project that,
amongst other objectives, aims to study the consequences of individual genetic variation on the
sensitivity of peptide centric proteomics, particularly with regards to targeted selected reaction
monitoring experiments.
The sensitivity of a peptide-centric analysis is also impaired by instrumental barriers. In
general, peptide separation strategies and mass spectrometry analysis cannot (yet) cope with the
complexity of a peptide mixture produced by shotgun proteomics. As a result, many peptides
present in the peptide mixture are not selected for fragmentation during mass spectrometry
analysis, and the sensitivity of an analysis is correspondingly reduced. Overcoming this obstacle
was one of the motives behind the development of the original COFRADIC methodologies. By
selecting only a few representative peptides per protein, the complexity of the peptide mixture
is reduced in a controlled way, rendering the remaining peptides more likely to be fragmented,
which in turn increases the sensitivity of the conducted proteome analysis.
During the course of this thesis however, mass spectrometry advances at least partially
overcame this issue of unfragmented peptides. By increasing the sequencing speed of the mass
spectrometers, more peptides could be analyzed within the same time frame. This resulted in a
remarkable increase of the amount of peptides that could be identified in a single analysis, from
thousands to tens of thousands, thereby greatly improving the sensitivity of an experiment.
This trend is set to continue, as next generation mass spectrometers already promise to further
increase the sensitivity of proteomics analyses in the upcoming years.

102 Improving the sensitivy and the specificity in peptide centric proteomics
Finally, note that the sensitivity constraints outlined above need to be assessed individually.
For instance, the availability of ‘complete’ (individualized) protein sequence databases will
not by itself solve the sensitivity problem if the mass spectrometer cannot fragment su/cient
peptides during the analysis; alternatively, even if instruments are able to analyze a complex
peptide mixture in its entirety, unanticipated peptide modifications or sequence variations
can still cause peptides to remain unidentified. It is therefore the synergy of computational
and methodological advances that will allow the overall sensitivity of a mass spectrometry-
driven proteomics experiment to increase towards a complete view on the proteome in an
experimental sample.

103Discussion

4
Nederlandstalige
Samenvatting

105Nederlandstalige samenvatting
Section 4. Nederlandstalige samenvatting.
Het centrale dogma in de moleculaire biologie stelt hoe informatie in een biologisch systeem
sequentieel vloeit via drie niveaus: van genoom naar transcriptoom tot proteoom. Deze laatste
omvat de populatie eiwitten die met een veelvoud aan functies de eigenlijke actoren vormen
in een biologisch systeem. Sommige eiwitten zijn betrokken in de structurele vorming van
eiwitcomplexen, andere zijn betrokken bij de signaalpropagatie van een externe stimulus,
terwijl nog andere de metabolische organisatie in een cel onderhouden. Het samenspel tussen
al deze functies bepaalt uiteindelijk het fenotype van een cel. Daarom is het relevant om de
aanwezigheid en lokalisatie van eiwitten te analyseren op grote schaal, en hun modificaties in
een specifieke context te annoteren. Dit zijn allemaal toepassingen voor de proteoomanalyse,
waarin eiwitten op een grootschalige manier worden geanalyseerd.
Een hedendaagse proteoomanalyse start typisch met een proteolytische digestie
(bijvoorbeeld met trypsine), waarna het gegenereerde peptidenmengsel chromatografisch
gescheiden wordt vooraleer het geanalyseerd wordt met tandem massaspectrometers. De
gegevens die hierbij gegenereerd worden kunnen vervolgens computationeel geïnterpreteerd
worden door databank zoekalgoritmen zoals Mascot of OMSSA, die vervolgens de meest
waarschijnlijke aminozuursequentie van het gefragmenteerde peptide voorstellen. Dit proces
van peptidenidentificatie stond centraal in dit doctoraatsproject, en de voornaamste doelstelling
was om de gevoeligheid en de specificiteit ervan te verbeteren en dus te streven naar een
completere en preciezere proteoomanalyse.
Om dit te bewerkstelligen, werd initieel de nodige infrastructuur gecreëerd.
De MascotDatfile bibliotheek werd in het begin van het project ontwikkeld om de
peptidenidentificaties omvat in de resultaten van het Mascot databank zoekalgoritme om
te zetten in een dynamisch objectenmodel. Doorheen het project werden steeds grotere
hoeveelheden data verwerkt en daarom werd de MascotDatfile bibliotheek uitgebreid
naar een indexatiestrategie waardoor de resultaten van gekoppeld aan honderdduizenden
fragmentatiespectra nu moeiteloos verwerkt kunnen worden.

106 Improving the sensitivy and the specificity in peptide centric proteomics
Daarnaast werd een relationeel databanksysteem voor peptidengecentreerde
proteoomanalyse, ms_lims, onderhouden en verder ontwikkeld doorheen het verloop van de
thesis. Het systeem wordt als zeer gebruiksvriendelijk ondervonden door zijn gebruikers en
voorziet opslag en organisatorische functies voor de gegevensstroom van fragmentatiespectra
naar peptidenidentificaties tot peptidenkwantificering. De ontwikkeling van zulke
infrastructuur is een doorlopende opgave en stelde ons gaandeweg in staat om de hoofddoelen
van deze thesis te realiseren.
Om de specificiteit van een proteoomanalyse te verbeteren, werd vooral getracht om
bestaande expertkennis te gebruiken. Expertkennis is typisch ter beschikking in een labo
als menselijke ervaring of als protocol specifieke informatie en wordt vooral gebruikt bij
manuele validatie van kritische peptidenidentificaties. Omdat het aantal peptidenidentificaties
echter te groot wordt bij hedendaagse grootschalige studies, wordt manuele validatie te
omslachtig. Om deze reden hebben we het Peptizer platform ontwikkeld waarin expertkennis
op een automatische manier toegepast wordt op een grote groep peptidenidentificaties.
Peptizer gebruikt daarvoor Agents die elk een bepaalde regel inspecteren gerelateerd aan
kwaliteitsassumpties. Door meerdere Agents in te schakelen wordt een peptidenidentificatie
danig getest voor een reeks verschillende kwaliteitsassumpties, en op het volgende niveau wordt
dan bepaald hoe de resultaten van elke individuele Agent gecombineerd worden om een oordeel
te vellen over de kwaliteit van een peptidenidentificatie.
Het Peptizer platform werd in de eerste plaats toegepast op de peptidenidentificaties van
een N-terminale proteoomanalyse. Daarin werd aangetoond hoe een eenvoudige combinatie
van kwaliteitsgerelateerde regels zeer e/ciënt was om vals positieve peptidenidentificaties
te weerhouden als verdachte peptiden. Verder werd in de resultaten van deze thesis ook
beschreven hoe de kwaliteit van de identificatie van potentiële 3-nitrotyrosine bevattende
peptiden verbeterd kan worden door gebruik te maken van parameters eigen aan het gebruikte
analyseprotocol. Hiermee werd tevens geïllustreerd hoe de e/ciëntie van het Peptizer platform
evenredig groeit met de hoeveelheid protocol specifieke informatie, zoals bijvoorbeeld kan
voorkomen in gerichte proteoomanalyse.

107Nederlandstalige samenvatting
De toepassing van expertkennis via Peptizer werd eveneens gebruikt om de gevoeligheid
van een proteoomanalyse te verbeteren. Elk peptide dat geïdentificeerd wordt uit een
fragmentatiespectrum, wordt getoetst aan een gegeven probabiliteit, en wanneer we deze
waarde verlagen van 99,5% naar 95%, dan worden meer peptiden geïdentificeerd waaronder ook
een fractie vals positieve peptiden identificaties. Toegepast op dezelfde N-terminale COFRADIC
analyse als beschreven in het manuscript over Peptizer, werden daarbij 491 additionele peptiden
geïdentificeerd, maar ook het aantal valse positieve identificaties steeg met een factor tien.
Wanneer we echter Peptizer toepasten op deze verlaagde betrouwbaarheid van 95%, dan
werd de toename in valse positieven sterk beperkt tot een factor twee, terwijl nog steeds 301
additionele peptiden werden geïdentificeerd. Hieruit concludeerden we dat ook de gevoeligheid
aanzienlijk verhoogd kan worden door implementatie van expertkennis.
Gemiddeld wordt meer dan de helft van de fragmentatiespectra die resulteren uit
een proteoomanalyse nooit geïdentificeerd, ondanks een groot deel daarvan duidelijk
peptidengerelateerde informatie bevat. Het labo publiceerde in 2006 in samenwerking met
Dr. Kristian Flikka van de Universiteit van Bergen (Noorwegen) een manuscript omtrent de
evaluatie van de kwaliteit van fragmentatiespectra door een classificatiealgoritme. In deze
thesis hebben we deze methode uitgebreid en eveneens een grafische interface gebouwd van
het classificatiealgoritme voor toepassing in ms_lims. De gebruikers van ms_lims kunnen
het classificatiealgoritme nu eenvoudig aanwenden op basis van een project dat in ms_lims
gestockeerd is en finaal het aandeel ongebruikte, doch informatieve fragmentatiespectra in hun
project analyseren.
Op het einde van het project werd een uitvoerige studie gedaan van een N-terminale
COFRADIC proteoomanalyse in S. cerevisiae. Omdat proteoomanalyses sterk beïnvloed
worden door bestaande databankannotaties van translatie initiatie, werd ten eerste een
5’UTR uitbreiding gemaakt voor alle gisteiwitten in UniProtKB/Swiss-Prot zodanig dat
incorrecte translatie initiatie annotaties niet langer of veel minder kunnen zorgen voor het
ongeïdentificeerd blijven van kwalitatieve fragmentatiespectra. Ten tweede gebruikten we
Peptizer om de kwaliteit van N-terminale peptiden te bekrachtigen. Finaal leidde deze studie tot
een lijst van 56 hoog kwalitatieve ongekende translatie initiatie sites.

5
References

109References
Section 5. References
Aebersold, R., and Mann, M. (2003). Mass spectrometry-based proteomics. Nature, 198-207.
Andersson, L., and Porath, J. (1986). Isolation of phosphoproteins by immobilized metal (Fe-3+) a/nity chromatography. Anal Biochem 154, 250-254.
Antúnez de Mayolo, A., Lisby, M., Erdeniz, N., Thybo, T., Mortensen, U.H., and Rothstein, R. (2006). Multiple start codons and phosphorylation result in discrete Rad52 protein species. Nucleic Acids Res 34, 2587-2597.
Arnesen, T., Van Damme, P., Polevoda, B., Helsens, K., Evjenth, R., Colaert, N., Varhaug, J., Vandekerckhove, J., Lillehaug, J., Sherman, F., and Gevaert, K. (2009). Proteomics analyses reveal the evolutionary conservation and divergence of N-terminal acetyltransferases from yeast and humans. Proc Natl Acad Sci USA 106, 8157-8162.
Barsnes, H., Huber, S., Sickmann, A., Eidhammer, I., and Martens, L. (2009). OMSSA Parser: An open-source library to parse and extract data from OMSSA MS/MS search results. Proteomics 9, 3772-3774.
Beausoleil, S., Jedrychowski, M., Schwartz, D., Elias, J., Villen, J., Li, J., Cohn, M., Cantley, L., and Gygi, S. (2004). Large-scale characterization of HeLa cell nuclear phosphoproteins. Proc Natl Acad Sci USA 101, 12130-12135.
Bern, M., Goldberg, D., McDonald, W.H., and Yates, J.R. (2004). Automatic quality assessment of peptide tandem mass spectra. Bioinformatics 20 Suppl 1, i49-54.
Bonenfant, D., Schmelzle, T., Jacinto, E., Crespo, J., Mini, T., Hall, M., and Jenoe, P. (2003). Quantitation of changes in protein phosphorylation: A simple method based on stable isotope labeling and mass spectrometry. Proc Natl Acad Sci USA 100, 880-885.
Bradshaw, R.A., Burlingame, A.L., Carr, S., and Aebersold, R. (2006). Reporting protein identification data: the next generation of guidelines. Mol Cell Proteomics 5, 787-788.
Chi, A., Huttenhower, C., Geer, L.Y., Coon, J.J., Syka, J.E.P., Bai, D.L., Shabanowitz, J., Burke, D.J., Troyanskaya, O.G., and Hunt, D.F. (2007). Analysis of phosphorylation sites on proteins from Saccharomyces cerevisiae by electron transfer dissociation (ETD) mass spectrometry. Proc Natl Acad Sci USA 104, 2193-2198.
Choi, H., Fermin, D., and Nesvizhskii, A. (2008). Significance Analysis of Spectral Count Data in Label-free Shotgun Proteomics. Molecular & Cellular Proteomics 7, 2373.
Choudhary, C., Kumar, C., Gnad, F., Nielsen, M.L., Rehman, M., Walther, T.C., Olsen, J.V., and Mann, M. (2009). Lysine acetylation targets protein complexes and co-regulates major cellular functions. Science 325, 834-840.
Colaert, N., Helsens, K., Martens, L., Vandekerckhove, J., and Gevaert, K. (2009). Improved visualization of protein consensus sequences by iceLogo. Nat Methods 6, 786-787.
Colinge, J., Masselot, A., Giron, M., Dessingy, T., and Magnin, J. (2003). OLAV: Towards high-throughput tandem mass spectrometry data identification. Proteomics 3, 1454-1463.
Côté, R.G., Jones, P., Martens, L., Kerrien, S., Reisinger, F., Lin, Q., Leinonen, R., Apweiler, R., and Hermjakob, H. (2007). The Protein Identifier Cross-Referencing (PICR) service: reconciling protein identifiers across multiple source databases. BMC Bioinformatics 8, 401.
Cox, J., and Mann, M. (2008). MaxQuant enables high peptide identification rates, individualized p.p.b.-range mass accuracies and proteome-wide protein quantification. Nat Biotechnol 26, 1367-1372.

110 Improving the sensitivy and the specificity in peptide centric proteomics
Craig, R., Cortens, J.P., and Beavis, R.C. (2004). Open source system for analyzing, validating, and storing protein identification data. J Proteome Res 3, 1234-1242.
Creasy, D., and Cottrell, J. (2004). Unimod: Protein modifications for mass spectrometry. Proteomics 4, 1534-1536.
de Godoy, L.M.F., Olsen, J.V., Cox, J., Nielsen, M.L., Hubner, N.C., Fröhlich, F., Walther, T.C., and Mann, M. (2008). Comprehensive mass-spectrometry-based proteome quantification of haploid versus diploid yeast. Nature 455, 1251-1254.
de Godoy, L.M.F., Olsen, J.V., de Souza, G.A., Li, G., Mortensen, P., and Mann, M. (2006). Status of complete proteome analysis by mass spectrometry: SILAC labeled yeast as a model system. Genome Biol 7, R50.
DeGnore, J., and Qin, J. (1998). Fragmentation of phosphopeptides in an ion trap mass spectrometer. Journal of the American Society for Mass Spectrometry.
Dennis, G., Sherman, B., Hosack, D., Yang, J., Gao, W., Lane, H., and Lempicki, R. (2003). DAVID: Database for annotation, visualization, and integrated discovery. Genome Biol 4, R60.
Desiere, F., Deutsch, E.W., King, N.L., Nesvizhskii, A.I., Mallick, P., Eng, J., Chen, S., Eddes, J., Loevenich, S.N., and Aebersold, R. (2006). The PeptideAtlas project. Nucleic Acids Res 34, D655-D658.
Dix, M.M., Simon, G.M., and Cravatt, B.F. (2008). Global mapping of the topography and magnitude of proteolytic events in apoptosis. Cell 134, 679-691.
Doucet, A., and Overall, C.M. (2008). Protease proteomics: Revealing protease in vivo functions using systems biology approaches. Mol Aspects Med 29, 339-358.
Driessen, H.P., de Jong, W.W., Tesser, G.I., and Bloemendal, H. (1985). The mechanism of N-terminal acetylation of proteins. CRC Crit Rev Biochem 18, 281-325.
Edman, P. (1950). Method for determination of the amino acid sequence in peptides. Acta chem. scand.
Elias, J.E., and Gygi, S.P. (2007). Target-decoy search strategy for increased confidence in large-scale protein identifications by mass spectrometry. Nat Methods 4, 207-214.
Enoksson, M., Li, J., Ivancic, M.M., Timmer, J.C., Wildfang, E., Eroshkin, A., Salvesen, G.S., and Tao, W.A. (2007). Identification of proteolytic cleavage sites by quantitative proteomics. J Proteome Res 6, 2850-2858.
Falick, A., Hines, W., Medzihradszky, K., Baldwin, M., and Gibson, B. (1993). Low-mass ions produced from peptides by high-energy collision-induced dissociation in tandem mass spectrometry. Journal of the American Society for Mass Spectrometry 4, 882-893.
Farnsworth, P. (1934). Electron multiplier. US Patent 1,969,399.
Felinger, A. (2008). Molecular dynamic theories in chromatography. J Chromatogr A 1184, 20-41.
Fenn, J.B., Mann, M., Meng, C.K., Wong, S.F., and Whitehouse, C.M. (1989). Electrospray ionization for mass spectrometry of large biomolecules. Science 246, 64-71.
Fenyo, D., and Beavis, R. (2003). A method for assessing the statistical significance of mass spectrometry-based protein identifications using general scoring schemes. Anal Chem 75, 768-774.
Flikka, K., Martens, L., Vandekerckhoe, J., Gevaert, K., and Eidhammer, I. (2006). Improving the reliability and throughput of mass spectrometry-based proteomics by spectrum quality filtering. Proteomics 6, 2086-2094.

111References
Frank, A., and Pevzner, P. (2005). PepNovo: De novo peptide sequencing via probabilistic network modeling. Anal Chem 77, 964-973.
Fütterer, J., Kiss-László, Z., and Hohn, T. (1993). Nonlinear ribosome migration on cauliflower mosaic virus 35S RNA. Cell 73, 789-802.
Gaba, A., Wang, Z., Krishnamoorthy, T., Hinnebusch, A.G., and Sachs, M.S. (2001). Physical evidence for distinct mechanisms of translational control by upstream open reading frames. EMBO J 20, 6453-6463.
Gallien, S., Perrodou, E., Carapito, C., Deshayes, C., Reyrat, J.-M., Van Dorsselaer, A., Poch, O., Schae.er, C., and Lecompte, O. (2009). Ortho-proteogenomics: multiple proteomes investigation through orthology and a new MS-based protocol. Genome Res 19, 128-135.
Geer, L., Markey, S., Kowalak, J., Wagner, L., Xu, M., Maynard, D., Yang, X., Shi, W., and Bryant, S. (2004). Open mass spectrometry search algorithm. J Proteome Res 3, 958-964.
Geng, M., Zhang, X., Bina, M., and Regnier, F. (2001). Proteomics of glycoproteins based on a/nity selection of glycopeptides from tryptic digests. J Chromatogr B 752, 293-306.
Gerber, S., Rush, J., Stemman, O., Kirschner, M., and Gygi, S. (2003). Absolute quantification of proteins and phosphoproteins from cell lysates by tandem MS. Proc Natl Acad Sci USA 100, 6940-6945.
Gevaert, K., Goethals, M., Martens, L., Van Damme, J., Staes, A., Thomas, G.R., and Vandekerckhove, J. (2003). Exploring proteomes and analyzing protein processing by mass spectrometric identification of sorted N-terminal peptides. Nat Biotechnol 21, 566-569.
Gevaert, K., Van Damme, J., Goethals, M., Thomas, G.R., Hoorelbeke, B., Demol, H., Martens, L., Puype, M., Staes, A., and Vandekerckhove, J. (2002). Chromatographic isolation of methionine-containing peptides for gel-free proteome analysis: identification of more than 800 Escherichia coli proteins. Mol Cell Proteomics 1, 896-903.
Gevaert, K., Van Damme, P., Ghesquière, B., Impens, F., Martens, L., Helsens, K., and Vandekerckhove, J. (2007). A la carte proteomics with an emphasis on gel-free techniques. Proteomics 7, 2698-2718.
Ghaemmaghami, S., Huh, W.-K., Bower, K., Howson, R.W., Belle, A., Dephoure, N., O’Shea, E.K., and Weissman, J.S. (2003). Global analysis of protein expression in yeast. Nature 425, 737-741.
Ghesquiere, B., Colaert, N., Helsens, K., Dejager, L., Vanhaute, C., Verleysen, K., Kas, K., Timmerman, E., Goethals, M., Libert, C., et al. (2009). In vitro and in vivo protein-bound tyrosine nitration characterized by diagonal chromatography. Mol Cell Proteomics 8, 2642-2652.
Ghesquière, B., Colaert, N., Helsens, K., Dejager, L., Vanhaute, C., Verleysen, K., Kas, K., Timmerman, E., Goethals, M., Libert, C., et al. (2009). In vitro and in vivo protein-bound tyrosine nitration characterized by diagonal chromatography. Mol Cell Proteomics.
Goetze, S., Qeli, E., Mosimann, C., Staes, A., Gerrits, B., Roschitzki, B., Mohanty, S., Niederer, E.M., Laczko, E., Timmerman, E., et al. (2009). Identification and functional characterization of N-terminally acetylated proteins in Drosophila melanogaster. PLoS Biol 7, e1000236.
Grohmann, L., Graack, H.R., Kruft, V., Choli, T., Goldschmidt-Reisin, S., and Kitakawa, M. (1991). Extended N-terminal sequencing of proteins of the large ribosomal subunit from yeast mitochondria. FEBS Lett 284, 51-56.
Gross, J.D., Moerke, N.J., von der Haar, T., Lugovskoy, A.A., Sachs, A.B., McCarthy, J.E.G., and Wagner, G. (2003). Ribosome loading onto the mRNA cap is driven by conformational coupling between eIF4G and eIF4E. Cell 115, 739-750.

112 Improving the sensitivy and the specificity in peptide centric proteomics
Gygi, S.P., Rist, B., Gerber, S.A., Turecek, F., Gelb, M.H., and Aebersold, R. (1999). Quantitative analysis of complex protein mixtures using isotope-coded a/nity tags. Nat Biotechnol 17, 994-999.
Hakkinen, J., Vincic, G., Mansson, O., Warell, K., and Levander, F. (2009). The Proteios Software Environment: An Extensible Multiuser Platform for Management and Analysis of Proteomics Data. J Proteome Res 8, 3037-3043.
Han, D.K., Eng, J., Zhou, H., and Aebersold, R. (2001). Quantitative profiling of di.erentiation-induced microsomal proteins using isotope-coded a/nity tags and mass spectrometry. Nat Biotechnol 19, 946-951.
Hartler, J., Thallinger, G.G., Stocker, G., Sturn, A., Burkard, T.R., Koerner, E., Rader, R., Schmidt, A., Mechtler, K., and Trajanoski, Z. (2007). MASPECTRAS: a platform for management and analysis of proteomics LC-MS/MS data. BMC Bioinformatics 8, 197.
Helsens, K., Colaert, N., Barsnes, H., Muth, T., Flikka, K., Staes, A., Timmerman, E., Wortelkamp, S., Sickmann, A., Vandekerckhove, J., et al. (2010). ms_lims, a simple yet powerful open source LIMS for mass spectrometry-driven proteomics. Proteomics in press.
Helsens, K., Timmerman, E., Vandekerckhove, J., Gevaert, K., and Martens, L. (2008). Peptizer: A tool for assessing false positive peptide identifications and manually validating selected results. Mol Cell Proteomics, 2363-2372.
Hoopmann, M.R., Finney, G.L., and MacCoss, M.J. (2007). High-speed data reduction, feature detection and MS/MS spectrum quality assessment of shotgun proteomics data sets using high-resolution mass Spectrometry. Anal Chem 79, 5620-5632.
Huang, Y., Tseng, G.C., Yuan, S., Pasa-Tolic, L., Lipton, M.S., Smith, R.D., and Wysocki, V.H. (2008). A data-mining scheme for identifying peptide structural motifs responsible for di.erent MS/MS fragmentation intensity patterns. J Proteome Res 7, 70-79.
Huh, W.-K., Falvo, J.V., Gerke, L.C., Carroll, A.S., Howson, R.W., Weissman, J.S., and O’Shea, E.K. (2003). Global analysis of protein localization in budding yeast. Nature 425, 686-691.
Imoto, T., and Yamada, H. (1983). Peptide separation by reversed-phase high-performance liquid chromatography. Mol Cell Biochem 51, 111-121.
Jensen, O. (2006). Interpreting the protein language using proteomics. Nat Rev Mol Cell Biol, 391-403.
Johnson, R., and Taylor, J. (2002). Searching sequence databases via de novo peptide sequencing by tandem mass spectrometry. Mol Biotechnol 22, 301-315.
Kall, L., Canterbury, J.D., Weston, J., Noble, W.S., and MacCoss, M.J. (2007). Semi-supervised learning for peptide identification from shotgun proteomics datasets. Nat Methods 4, 923-925.
Kameyama, A. (2006). Glycomics Using Mass Spectrometry. Trends in Glycoscience and Glycotechnology 18, 323-341.
Kaplan, N., Vaaknin, A., and Linial, M. (2003). PANDORA: keyword-based analysis of protein sets by integration of annotation sources. Nucleic Acids Res 31, 5617-5626.
Karas, M., and Hillenkamp, F. (1988). Laser desorption ionization of proteins with molecular masses exceeding 10,000 daltons. Anal Chem 60, 2299-2301.
Katajamaa, M., and Oresic, M. (2007). Data processing for mass spectrometry-based metabolomics. J Chromatogr A 1158, 318-328.

113References
Keller, A., Nesvizhskii, A., Kolker, E., and Aebersold, R. (2002). Empirical statistical model to estimate the accuracy of peptide identifications made by MS/MS and database search. Anal Chem 74, 5383-5392.
Kendall, R.L., Yamada, R., and Bradshaw, R.A. (1990). Cotranslational amino-terminal processing. Methods in enzymology 185, 398-407.
Khidekel, N., Ficarro, S.B., Clark, P.M., Bryan, M.C., Swaney, D.L., Rexach, J.E., Sun, Y.E., Coon, J.J., Peters, E.C., and Hsieh-Wilson, L.C. (2007). Probing the dynamics of O-GlcNAc glycosylation in the brain using quantitative proteomics. Nat Chem Biol 3, 339-348.
Klie, S., Martens, L., Vizcaino, J.A., Cote, R., Jones, P., Apweiler, R., Hinneburg, A., and Hermjakob, H. (2008). Analyzing large-scale proteomics projects with latent semantic indexing. J Proteome Res 7, 182-191.
Klose, J. (1975). Protein mapping by combined isoelectric focusing and electrophoresis of mouse tissues. Human Genetics 26, 231-243.
Kondrat, R.W., Mcclusky, G.A., and Cooks, R.G. (1978). Multiple reaction monitoring in mass spectrometry/mass spectrometry for direct analysis of complex mixtures. Anal Chem 50, 2017-2021.
Kozak, M. (1986). Point mutations define a sequence flanking the AUG initiator codon that modulates translation by eukaryotic ribosomes. Cell 44, 283-292.
Kozak, M. (1987a). At least six nucleotides preceding the AUG initiator codon enhance translation in mammalian cells. J Mol Biol 196, 947-950.
Kozak, M. (1987b). E.ects of intercistronic length on the e/ciency of reinitiation by eucaryotic ribosomes. Mol Cell Biol 7, 3438-3445.
Kozak, M. (1991). Structural features in eukaryotic mRNAs that modulate the initiation of translation. J Biol Chem 266, 19867-19870.
Krijgsveld, J., Ketting, R.F., Mahmoudi, T., Johansen, J., Artal-Sanz, M., Verrijzer, C.P., Plasterk, R.H.A., and Heck, A.J.R. (2003). Metabolic labeling of C. elegans and D. melanogaster for quantitative proteomics. Nat Biotechnol 21, 927-931.
Krokhin, O.V., Antonovici, M., Ens, W., Wilkins, J.A., and Standing, K.G. (2006). Deamidation of -Asn-Gly- sequences during sample preparation for proteomics: Consequences for MALDI and HPLC-MALDI analysis. Anal Chem 78, 6645-6650.
Krueger, M., Moser, M., Ussar, S., Thievessen, I., Luber, C.A., Forner, F., Schmidt, S., Zanivan, S., Faessler, R., and Mann, M. (2008). SILAC mouse for quantitative proteomics uncovers kindlin-3 as an essential factor for red blood cell function. Cell 134, 353-364.
Laemmli, U.K. (1970). Cleavage of structural proteins during the assembly of the head of bacteriophage T4. Nature 227, 680-685.
Lahm, H., and Langen, H. (2000). Mass spectrometry: A tool for the identification of proteins separated by gels. Electrophoresis 21, 2105-2114.
Lange, V., Picotti, P., Domon, B., and Aebersold, R. (2008). Selected reaction monitoring for quantitative proteomics: a tutorial. Mol Syst Biol 4, 222.
Lauber, W.M., Carroll, J.A., Dufield, D.R., Kiesel, J.R., Radabaugh, M.R., and Malone, J.P. (2001). Mass spectrometry compatibility of two-dimensional gel protein stains. Electrophoresis 22, 906-918.

114 Improving the sensitivy and the specificity in peptide centric proteomics
Li, X., and Chang, Y.H. (1995). Amino-terminal protein processing in Saccharomyces cerevisiae is an essential function that requires two distinct methionine aminopeptidases. Proc Natl Acad Sci USA 92, 12357-12361.
Link, A., Eng, J., Schieltz, D., Carmack, E., Mize, G., Morris, D., Garvik, B., and Yates, J. (1999). Direct analysis of protein complexes using mass spectrometry. Nat Biotechnol 17, 676-682.
Liu, H., Sadygov, R.G., and Yates, J.R. (2004). A model for random sampling and estimation of relative protein abundance in shotgun proteomics. Anal Chem 76, 4193-4201.
Maere, S., Heymans, K., and Kuiper, M. (2005). BiNGO: a Cytoscape plugin to assess overrepresentation of Gene Ontology categories in Biological Networks. Bioinformatics 21, 3448-3449.
Mahrus, S., Trinidad, J.C., Barkan, D.T., Sali, A., Burlingame, A.L., and Wells, J.A. (2008). Global sequencing of proteolytic cleavage sites in apoptosis by specific labeling of protein N termini. Cell 134, 866-876.
Makarov, A. (2000). Electrostatic axially harmonic orbital trapping: a high-performance technique of mass analysis. Anal Chem 72, 1156-1162.
Makarov, A., Denisov, E., Kholomeev, A., Baischun, W., Lange, O., Strupat, K., and Horning, S. (2006). Performance evaluation of a hybrid linear ion trap/orbitrap mass spectrometer. Anal Chem 78, 2113-2120.
Malmström, J., Beck, M., Schmidt, A., Lange, V., Deutsch, E.W., and Aebersold, R. (2009). Proteome-wide cellular protein concentrations of the human pathogen Leptospira interrogans. Nature 460, 762-765.
Mann, M. (2006). Functional and quantitative proteomics using SILAC. Nat Rev Mol Cell Biol 7, 952-958.
Mann, M., and Wilm, M. (1994). Error-tolerant identification of peptides in sequence databases by peptide sequence tags. Anal Chem 66, 4390-4399.
March, R. (2009). Quadrupole ion traps. Mass Spectrom Rev, 961-989.
Martens, L., and Hermjakob, H. (2007). Proteomics data validation: why all must provide data. Mol Biosyst 3, 518-522.
Martens, L., Hermjakob, H., Jones, P., Adamski, M., Taylor, C., States, D., Gevaert, K., Vandekerckhove, J., and Apweiler, R. (2005). PRIDE: the proteomics identifications database. Proteomics 5, 3537-3545.
Matthiesen, R., Trelle, M., Hojrup, P., Bunkenborg, J., and Jensen, O. (2005). VEMS 3.0: Algorithms and computational tools for tandem mass spectrometry based identification of post-translational modifications in proteins. J Proteome Res 4, 2338-2347.
Mcla.erty, F.W. (1994). High-resolution tandem FT mass spectrometry above 10 kDa. Accounts of Chemical Research.
Mcnulty, D., and Annan, R. (2008). Hydrophilic Interaction Chromatography Reduces the Complexity of the Phosphoproteome and Improves Global Phosphopeptide Isolation and Detection. Molecular & Cellular Proteomics 7, 971.
Molina, H., Horn, D.M., Tang, N., Mathivanan, S., and Pandey, A. (2007). Global proteomic profiling of phosphopeptides using electron transfer dissociation tandem mass spectrometry. Proc Natl Acad Sci USA 104, 2199-2204.
Mueller, M., Martens, L., and Apweiler, R. (2007). Annotating the human proteome: beyond establishing a parts list. Biochim Biophys Acta 1774, 175-191.

115References
Mueller, M., Vizcaíno, J.A., Jones, P., Côté, R., Thorneycroft, D., Apweiler, R., Hermjakob, H., and Martens, L. (2008). Analysis of the experimental detection of central nervous system-related genes in human brain and cerebrospinal fluid datasets. Proteomics 8, 1138-1148.
Muth, T., Vaudel, M., Barsnes, H., Martens, L., and Sickmann, A. (2010). XTandem Parser: An open-source library to parse and analyse X!Tandem MS/MS search results. Proteomics, in press.
Nakagawa, S., Niimura, Y., Gojobori, T., Tanaka, H., and Miura, K.-i. (2008). Diversity of preferred nucleotide sequences around the translation initiation codon in eukaryote genomes. Nucleic Acids Res 36, 861-871.
Nesvizhskii, A., Keller, A., Kolker, E., and Aebersold, R. (2003). A statistical model for identifying proteins by tandem mass spectrometry. Anal Chem 75, 4646-4658.
Nesvizhskii, A., Roos, F., Grossmann, J., Vogelzang, M., Eddes, J., Gruissem, W., Baginsky, S., and Aebersold, R. (2006). Dynamic spectrum quality assessment and iterative computational analysis of shotgun proteomic data - Toward more e/cient identification of post-translational modifications, sequence polymorphisms, and novel peptides. Molecular & Cellular Proteomics 5, 652-670.
Nesvizhskii, A.I., and Aebersold, R. (2005). Interpretation of shotgun proteomic data: the protein inference problem. Mol Cell Proteomics 4, 1419-1440.
Nesvizhskii, A.I., Vitek, O., and Aebersold, R. (2007). Analysis and validation of proteomic data generated by tandem mass spectrometry. Nat Methods 4, 787-797.
Niall, H. (1973). Automated Edman degradation: the protein sequenator. Methods in enzymology 27, 942-1010.
O’Farrell, P.H. (1975). High resolution two-dimensional electrophoresis of proteins. J Biol Chem 250, 4007-4021.
Old, W.M., Meyer-Arendt, K., Aveline-Wolf, L., Pierce, K.G., Mendoza, A., Sevinsky, J.R., Resing, K.A., and Ahn, N.G. (2005). Comparison of label-free methods for quantifying human proteins by shotgun proteomics. Mol Cell Proteomics 4, 1487-1502.
Olsen, J., Schwartz, J., Griep-Raming, J., Nielsen, M., Damoc, E., Denisov, E., Lange, O., Remes, P., Taylor, D., Splendore, M., et al. (2009). A dual pressure linear ion trap - Orbitrap instrument with very high sequencing speed. Mol Cell Proteomics in press.
Ong, S., Blagoev, B., Kratchmarova, I., Kristensen, D., Steen, H., Pandey, A., and Mann, M. (2002). Stable isotope labeling by amino acids in cell culture, SILAC, as a simple and accurate approach to expression proteomics. Mol Cell Proteomics 1, 376-386.
Outten, C.E., and Culotta, V.C. (2004). Alternative start sites in the Saccharomyces cerevisiae GLR1 gene are responsible for mitochondrial and cytosolic isoforms of glutathione reductase. J Biol Chem 279, 7785-7791.
Pappin, D.J., Hojrup, P., and Bleasby, A.J. (1993). Rapid identification of proteins by peptide-mass fingerprinting. Curr Biol 3, 327-332.
Paul, W., and Steinwedel, H. (1953). Ein neues Massenspektrometer ohne Magnetfeld. Zeitschrift Naturforschung Teil A 8, 448-448.
Peng, J., Elias, J., Thoreen, C., Licklider, L., and Gygi, S. (2003a). Evaluation of multidimensional chromatography coupled with tandem mass spectrometry (LC/LC-MS/MS) for large-scale protein analysis: The yeast proteome. J Proteome Res 2, 43-50.

116 Improving the sensitivy and the specificity in peptide centric proteomics
Peng, J., Schwartz, D., Elias, J., Thoreen, C., Cheng, D., Marsischky, G., Roelofs, J., Finley, D., and Gygi, S. (2003b). A proteomics approach to understanding protein ubiquitination. Nat Biotechnol 21, 921-926.
Perkins, D., Pappin, D., Creasy, D., and Cottrell, J. (1999). Probability-based protein identification by searching sequence databases using mass spectrometry data. Electrophoresis 20, 3551-3567.
Picotti, P., Bodenmiller, B., Mueller, L.N., Domon, B., and Aebersold, R. (2009). Full dynamic range proteome analysis of S. cerevisiae by targeted proteomics. Cell 138, 795-806.
Pinkse, M., Uitto, P., Hilhorst, M., Ooms, B., and Heck, A. (2004). Selective isolation at the femtomole level of phosphopeptides from proteolytic digests using 2D-nanoLC-ESI-MS/MS and titanium oxide precolumns. Anal Chem 76, 3935-3943.
Polevoda, B., and Sherman, F. (2003). N-terminal acetyltransferases and sequence requirements for N-terminal acetylation of eukaryotic proteins. J Mol Biol 325, 595-622.
Rauch, A., Bellew, M., Eng, J., Fitzgibbon, M., Holzman, T., Hussey, P., Igra, M., Maclean, B., Lin, C., Detter, A., et al. (2006). Computational Proteomics Analysis System (CPAS): An extensible, open-source analytic system for evaluating and publishing proteomic data and high throughput biological experiments. J Proteome Res 5, 112-121.
Rayleigh, L. (1882). Further Observations upon Liquid Jets. Proceedings of the Royal Society of London.
Reisinger, F., and Martens, L. (2009). Database on Demand - An online tool for the custom generation of FASTA-formatted sequence databases. Proteomics 9, 4421-4424.
Rietschel, B., Baeumlisberger, D., Arrey, T.N., Bornemann, S., Rohmer, M., Schuerken, M., Karas, M., and Meyer, B. (2009). The Benefit of Combining nLC-MALDI-Orbitrap MS Data with nLC-MALDI-TOF/TOF Data for Proteomic Analyses Employing Elastase. Journal of proteome research 8, 5317-5324.
Roepstor., P., and Fohlman, J. (1984). Letter to the editors. Biological Mass Spectrometry 11, 601.
Ross, P., Huang, Y., Marchese, J., Williamson, B., Parker, K., Hattan, S., Khainovski, N., Pillai, S., Dey, S., Daniels, S., et al. (2004). Multiplexed protein quantitation in Saccharomyces cerevisiae using amine-reactive isobaric tagging reagents. Mol Cell Proteomics 3, 1154-1169.
Schneider, T.D., and Stephens, R.M. (1990). Sequence logos: a new way to display consensus sequences. Nucleic Acids Res 18, 6097-6100.
Shannon, P., Markiel, A., Ozier, O., Baliga, N.S., Wang, J.T., Ramage, D., Amin, N., Schwikowski, B., and Ideker, T. (2003). Cytoscape: a software environment for integrated models of biomolecular interaction networks. Genome Res 13, 2498-2504.
Slotta, D.J., Barrett, T., and Edgar, R. (2009). NCBI Peptidome: a new public repository for mass spectrometry peptide identifications. Nat Biotechnol 27, 600-601.
Staes, A., Demol, H., Van Damme, J., Martens, L., Vandekerckhove, J., and Gevaert, K. (2004). Global di.erential non-gel proteomics by quantitative and stable labeling of tryptic peptides with oxygen-18. J Proteome Res 3, 786-791.
Staes, A., Van Damme, P., Helsens, K., Demol, H., Vandekerckhove, J., and Gevaert, K. (2008). Improved recovery of proteome-informative, protein N-terminal peptides by combined fractional diagonal chromatography (COFRADIC). Proteomics 8, 1362-1370.
Stahl-Zeng, J., Lange, V., Ossola, R., Eckhardt, K., Krek, W., Aebersold, R., and Domon, B. (2007). High sensitivity detection of plasma proteins by multiple reaction monitoring of N-glycosites. Mol Cell Proteomics 6, 1809-1817.

117References
Stevens, S.M., Prokai-Tatrai, K., and Prokai, L. (2008). Factors that contribute to the misidentification of tyrosine nitration by shotgun proteomics. Mol Cell Proteomics 7, 2442-2451.
Sturm, M., Bertsch, A., Groepl, C., Hildebrandt, A., Hussong, R., Lange, E., Pfeifer, N., Schulz-Triegla., O., Zerck, A., Reinert, K., and Kohlbacher, O. (2008). OpenMS-An open-source software framework for mass spectrometry. BMC Bioinformatics 9, 163.
Svensson, H. (1961). Isoelectric fractionation, analysis, and characterization of ampholytes in natural pH gradients. Acta Chem Scand 15, 325.
Syka, J., Coon, J., and Schroeder, M. (2004). Peptide and protein sequence analysis by electron transfer dissociation mass spectrometry. Proceedings of the National Academy of Sciences 101, 9528-9533.
Tanaka, K., Waki, H., Ido, Y., Akita, S., and Yoshida, Y. (1988). Protein and polymer analyses up to m/z 100,000 by laser ionization time-of-flight mass spectrometry. Rapid Commun. Mass Spectrom 2, 151-153.
Taylor, G. (1964). Disintegration of water drops in an electric field. Proceedings of the Royal Society of London. Series A 280, 383-397.
Thornton, S., Anand, N., Purcell, D., and Lee, J. (2003). Not just for housekeeping: protein initiation and elongation factors in cell growth and tumorigenesis. J Mol Med-Jmm 81, 536-548.
Timmer, J.C., Enoksson, M., Wildfang, E., Zhu, W., Igarashi, Y., Denault, J.-B., Ma, Y., Dummitt, B., Chang, Y.-H., Mast, A.E., et al. (2007). Profiling constitutive proteolytic events in vivo. Biochemical Journal 407, 41-48.
Van Der Kelen, K., Beyaert, R., Inzé, D., and De Veylder, L. (2009). Translational control of eukaryotic gene expression. Crit Rev Biochem Mol Biol 44, 143-168.
Vandekerckhove, J., Bauw, G., Puype, M., Van Damme, J., and Van Montagu, M. (1985). Protein-blotting on Polybrene-coated glass-fiber sheets. A basis for acid hydrolysis and gas-phase sequencing of picomole quantities of protein previously separated on sodium dodecyl sulfate/polyacrylamide gel. Eur J Biochem 152, 9-19.
Villén, J., Beausoleil, S.A., and Gygi, S.P. (2008). Evaluation of the utility of neutral-loss-dependent MS3 strategies in large-scale phosphorylation analysis. Proteomics 8, 4444.
Wan, Y., Yang, A., and Chen, T. (2006). PepHMM: a hidden Markov model based scoring function for mass spectrometry database search. Anal Chem 78, 432-437.
Washburn, M., Wolters, D., and Yates, J. (2001). Large-scale analysis of the yeast proteome by multidimensional protein identification technology. Nat Biotechnol 19, 242-247.
Welch, E.M., and Jacobson, A. (1999). An internal open reading frame triggers nonsense-mediated decay of the yeast SPT10 mRNA. EMBO J 18, 6134-6145.
Wells, J., and McLuckey, S. (2005). Collision-induced dissociation (CID) of peptides and proteins. Methods in enzymology 402, 148-185.
Wiener, M., Sachs, J., Deyanova, E., and Yates, N. (2004). Di.erential mass spectrometry: A label-free LC-MS method for finding significant di.erences in complex peptide and protein mixtures. Anal Chem 76, 6085-6096.
Williams, E.H., Perez-Martinez, X., and Fox, T.D. (2004). MrpL36p, a highly diverged L31 ribosomal protein homolog with additional functional domains in Saccharomyces cerevisiae mitochondria. Genetics 167, 65-75.

118 Improving the sensitivy and the specificity in peptide centric proteomics
Williams, S.K., and Tyler, J.K. (2007). Transcriptional regulation by chromatin disassembly and reassembly. Curr Opin Genet Dev 17, 88-93.
Wiza, J. (1979). Microchannel Plate Detectors. Nucl Instrum Methods 162, 587-601.
Wu, F.-X., Gagne, P., Droit, A., and Poirier, G.G. (2008). Quality assessment of peptide tandem mass spectra. BMC Bioinformatics 9, S13.
Xu, M., Geer, L.Y., Bryant, S.H., Roth, J.S., Kowalak, J.A., Maynard, D.M., and Markey, S.P. (2005). Assessing data quality of peptide mass spectra obtained by quadrupole ion trap mass spectrometry. J Proteome Res 4, 300-305.
Yates, J.R., Eng, J.K., McCormack, A.L., and Schieltz, D. (1995). Method to correlate tandem mass spectra of modified peptides to amino acid sequences in the protein database. Anal Chem 67, 1426-1436.
Zenobi, R., and Knochenmuss, R. (1998). Ion formation in MALDI mass spectrometry. Mass Spectrom Rev 17, 337-366.
Zhang, B., Chambers, M.C., and Tabb, D.L. (2007). Proteomic parsimony through bipartite graph analysis improves accuracy and transparency. J Proteome Res 6, 3549-3557.
Zhang, H., Yan, W., and Aebersold, R. (2004). Chemical probes and tandem mass spectrometry: a strategy for the quantitative analysis of proteomes and subproteomes. Curr Opin Chem Biol 8, 66-75.
Zubarev, R., Kelleher, N., and McLa.erty, F. (1998). Electron capture dissociation of multiply charged protein cations. A nonergodic process. Journal of the American Chemical Society 120, 3265-3266.

119References

Addenda

121Addendum 1 Additional papers
Addendum 1 Additional papers
Arnesen, T., P. Van Damme, B. Polevoda, K. Helsens, R. Evjenth, N. Colaert, J. E. Varhaug, J. Vandekerckhove, J. R. Lillehaug, F. Sherman and K. Gevaert (2009). “Proteomics analyses reveal the evolutionary conservation and divergence of N-terminal acetyltransferases from yeast and humans.” Proc Natl Acad Sci USA 106(20): 8157-8162.
Colaert, N., K. Helsens, F. Impens, J. Vandekerckhove and K. Gevaert (2010). “Rover: a tool to visualize and validate quantitative proteomics data from di.erent sources.” Proteomics 10(6): 1261-4.
Colaert, N., K. Helsens, L. Martens, J. Vandekerckhove and K. Gevaert (2009). “Improved visualization of protein consensus sequences by iceLogo.” Nat Methods 6(11): 786-7.
Demon, D., P. Van Damme, T. Vanden Berghe, A. Deceuninck, J. Van Durme, J. Verspurten, K. Helsens, F. Impens, M. Wejda, J. Schymkowitz, F. Rousseau, A. Madder, J. Vandekerckhove, W. Declercq, K. Gevaert and P. Vandenabeele (2009). “Proteome-wide substrate analysis indicates substrate exclusion as a mechanism to generate caspase-7 versus caspase-3 specificity.” Mol Cell Proteomics 8(12): 2700-14.
Eisenacher, M., L. Martens, T. Hardt, M. Kohl, H. Barsnes, K. Helsens, J. Häkkinen, F. Levander, R. Aebersold, J. Vandekerckhove, M. J. Dunn, F. Lisacek, J. A. Siepen, S. J. Hubbard, P.-A. Binz, M. Blüggel, H. Thiele, J. Cottrell, H. E. Meyer, R. Apweiler and C. Stephan (2009). “Getting a grip on proteomics data - Proteomics Data Collection (ProDaC).” Proteomics 9(15): 3928-33.
Flikka, K., J. Meukens, K. Helsens, J. Vandekerckhove, I. Eidhammer, K. Gevaert and L. Martens (2007). “Implementation and application of a versatile clustering tool for tandem mass spectrometry data.” Proteomics 7(18): 3245-58.
Gevaert, K., P. Van Damme, B. Ghesquière, F. Impens, L. Martens, K. Helsens and J. Vandekerckhove (2007). “A la carte proteomics with an emphasis on gel-free techniques.” Proteomics 7(16): 2698-718.
Impens, F., N. Colaert, K. Helsens, K. Plasman, P. Van Damme, J. Vandekerckhove and K. Gevaert (2010). “Mass spectrometry-driven protease substrate degradomics.” Proteomics: Proteomics 10(6): 1284-96.
Mathivanan, S et al. (2008). “Human Proteinpedia enables sharing of human protein data.” Nat Biotechnol 26(2): 164-7.
Staes, A., E. Timmerman, J. Van Damme, K. Helsens, J. Vandekerckhove, M. Vollmer and K. Gevaert (2007). “Assessing a novel microfluidic interface for shotgun proteome analyses.” Journal Sep Sci 30(10): 1468-76.
Staes, A., P. Van Damme, K. Helsens, H. Demol, J. Vandekerckhove and K. Gevaert (2008). “Improved recovery of proteome-informative, protein N-terminal peptides by combined fractional diagonal chromatography (COFRADIC).” Proteomics 8(7): 1362-70.

122 Improving the sensitivy and the specificity in peptide centric proteomics
Proteomics analyses reveal the evolutionaryconservation and divergence of N-terminalacetyltransferases from yeast and humansThomas Arnesena,b,c,1, Petra Van Dammed,e,1, Bogdan Polevodaf, Kenny Helsensd,e, Rune Evjentha, Niklaas Colaertd,e,Jan Erik Varhaugb,c, Joel Vandekerckhoved,e, Johan R. Lillehauga, Fred Shermanf,2, and Kris Gevaertd,e
aDepartment of Molecular Biology, and bDepartment of Surgical Sciences, University of Bergen, N-5020 Bergen, Norway; cDepartment of Surgery,Haukeland University Hospital, N-5021 Bergen, Norway; dDepartment of Medical Protein Research, VIB, and eDepartment of Biochemistry, GhentUniversity, B-9000 Ghent, Belgium; and fDepartment of Biochemistry and Biophysics, University of Rochester Medical Center, Rochester, NY 14642
Contributed by Fred Sherman, March 1, 2009 (sent for review October 19, 2008)
N!-terminal acetylation is one of the most common protein mod-ifications in eukaryotes. The COmbined FRActional DIagonal Chro-matography (COFRADIC) proteomics technology that can be spe-cifically used to isolate N-terminal peptides was used to determinethe N-terminal acetylation status of 742 human and 379 yeastprotein N termini, representing the largest eukaryotic dataset ofN-terminal acetylation. The major N-terminal acetyltransferase(NAT), NatA, acts on subclasses of proteins with Ser-, Ala-, Thr-,Gly-, Cys- and Val- N termini. NatA is composed of subunitsencoded by yARD1 and yNAT1 in yeast and hARD1 and hNAT1 inhumans. A yeast ard1-" nat1-" strain was phenotypically comple-mented by hARD1 hNAT1, suggesting that yNatA and hNatA aresimilar. However, heterologous combinations, hARD1 yNAT1 andyARD1 hNAT1, were not functional in yeast, suggesting significantstructural subunit differences between the species. Proteomics ofa yeast ard1-" nat1-" strain expressing hNatA demonstrated thathNatA acts on nearly the same set of yeast proteins as yNatA,further revealing that NatA from humans and yeast have identicalor nearly identical specificities. Nevertheless, all NatA substrates inyeast were only partially N-acetylated, whereas the correspondingNatA substrates in HeLa cells were mainly completely N-acetylated.Overall, we observed a higher proportion of N-terminally acety-lated proteins in humans (84%) as compared with yeast (57%).N-acetylation occurred on approximately one-half of the humanproteins with Met-Lys- termini, but did not occur on yeast proteinswith such termini. Thus, although we revealed different N-acety-lation patterns in yeast and humans, the major NAT, NatA, acety-lates the same substrates in both species.
Ard1 ! COFRADIC ! N-terminal acetylation ! Nat1 ! NatA
Protein N!-terminal acetylation (here referred to as N-acetylation) is one of the most common covalent modifica-
tions of eukaryotic proteins, in which an acetyl group is trans-ferred from acetyl-CoA to the !-amino group of proteinN-terminal residues. N-acetylation occurs cotranslationally onnascent polypeptide chains and almost all N-acetylations inSaccharomyces cerevisiae are catalyzed by 1 of 3 major N-terminal acetyltransferase (NAT) complexes, NatA, NatB orNatC, consisting of catalytic subunits Ard1p, Nat3p, and Mak3p,respectively, and 1 or more auxiliary subunits (1). Yeast NatA,the major and best studied NAT, is composed of the catalyticsubunit Ard1p in complex with Nat1p (2). Nat1p is responsiblefor anchoring Ard1p to the ribosome, thus facilitating cotrans-lational N-acetylation (3). Both subunits are required for opti-mal acetyltransferase activity and yeast strains lacking either oneof the subunits display the same phenotypes, indicating that bothgenes are also functionally linked (4). The yeast NatA, NatB andNatC complexes differ in their substrate specificities. NatAsubstrates represent by far the largest group and contain proteinswith Ser-, Ala-, Gly-, Val-, Cys- or Thr- N termini, whereas NatBand NatC act on different protein subclasses with Met- N termini
(1, 5). Higher eukaryotes and yeast have homologous NATgenes, and both have similar patterns of N-acetylated proteins,suggesting that a similar cotranslational N-acetylation system isshared by all eukaryotes (1).
Like the yeast enzyme, the human Nat1p (also denotedNATH) and hArd1p interact, associate with ribosomes andexpress NAT activity in vitro (6). RNAi mediated knock-downof hNAT1 or hARD1 in different human cell lines demonstratedthat these proteins play an important role: the decrease in cellproliferation or increase of apoptosis observed when hARD1 orhNAT1 are knocked down indicate that these defects may becaused by insufficient levels of N-acetylation of as yet uniden-tified critical substrate proteins (7, 8). Studies using 2D-PAGE,HPLC separations, and mass spectrometry revealed that !50%of all cytosolic yeast proteins are N-acetylated (1). For mam-malian proteins, early studies and database searches revealedthat 80% to 90% are N-acetylated (9–11). However, more recentstudies, including small-scale experiments with several mamma-lian proteins, indicated that this number may be closer to 30%(12). The major questions addressed in this communication arethe following: Are the types and proportion of N-acetylatedproteins in yeast and mammals different, and if so, what is thecause of these differences?
To gain better insight in the degree of N-acetylation by theNATs in 2 different model systems, S. cerevisiae and humanHeLa cells, we initiated a global qualitative and quantitativeanalysis of protein N-acetylation, using the N-terminal combinedfractional diagonal chromatography (COFRADIC) technology(13), which allows targeted analysis of N-terminal peptides inhighly complex mixtures, whereas all internal peptides aredisregarded. This COFRADIC procedure, along with stableisotope labeling by amino acids in cell culture (SILAC) (14), andin combination with stable isotope tagging N-terminal chemis-tries (15), allowed us to generate quantitative data on themodification status of the N termini of the proteins present in themixture. We thus obtained a general profile of the activities andsubstrates of NatA and other NATs in yeast and humans. Inaddition, the used strategy allowed detection and estimation ofpartially N-acetylated proteins.
Author contributions: T.A., P.V.D., B.P., and K.G. designed research; T.A., P.V.D., B.P., K.H.,R.E., and N.C. performed research; T.A., P.V.D., B.P., K.H., R.E., N.C., J.E.V., J.V., J.R.L., andK.G. analyzed data; and T.A., P.V.D., B.P., J.E.V., J.V., J.R.L., F.S., and K.G. wrote the paper.
The authors declare no conflict of interest.
Data deposition: The mass spectrometry data reported in this paper have been depositedin the PRIDE database, www.ebi.ac.uk/pride (accession nos. 8636, 8637, and 8638).1T.A. and P.V.D. contributed equally to this work.2To whom correspondence should be addressed. E-mail: [email protected].
This article contains supporting information online at www.pnas.org/cgi/content/full/0901931106/DCSupplemental.
www.pnas.org"cgi"doi"10.1073"pnas.0901931106 PNAS ! May 19, 2009 ! vol. 106 ! no. 20 ! 8157–8162
BIO
CHEM
ISTR
Y

123Addendum 1 Additional papers
TECHNICAL BRIEF
Rover: A tool to visualize and validate quantitativeproteomics data from different sources
Niklaas Colaert1,2, Kenny Helsens1,2, Francis Impens1,2, Joel Vandekerckhove1,2
and Kris Gevaert1,2
1Department of Medical Protein Research, VIB, Ghent, Belgium2Department of Biochemistry, Ghent University, Ghent, Belgium
Received: June 1, 2009Revised: August 12, 2009
Accepted: August 14, 2009
Manual validation of regulated proteins found in MS-driven quantitative proteome studies istedious. Here we present Rover (http://genesis.ugent.be/rover), a tool that facilitates thisprocess. Rover accepts quantitative data from different sources such as MASCOT Distillerand MaxQuant and, in an intuitive environment, Rover visualizes these data such that theuser can select and validate algorithm-suggested regulated proteins in the frame of the wholeexperiment and in the context of the protein inference problem.
Keywords:Bioinformatics / Manual validation / MASCOT Distiller / MaxQuant / Protein inference /Quantitative proteomics
Several analytical techniques were developed to tackle theproblems of sample complexity and protein inference in MS-driven proteome studies [1–3]. The newest generation ofmass analyzers found in the Orbitrap and Fourier transformmass spectrometers, not only increase the accuracy of massmeasurements, but also the number of MS/MS spectra. Thisultimately results in a raise of peptide and protein identifi-cations and thus in higher proteome coverage. In addition,several relative and absolute quantitative proteomics techni-ques were also developed (e.g. recently reviewed in [4]) andused to quantify hundreds if not thousands of peptides andproteins. In such quantitative proteome analyses, a peptideratio is typically calculated by comparing the peptideprecursor ion intensities of the differently labeled peptides inMS survey scans. Formerly, these peptide ratios weremanually calculated by retrieving the ion intensities from theraw MS data using the instrument or vendor software [4, 5].However, due to the raise in peptide identifications, thismanual calculation becomes impossible. New algorithmswere thus recently developed that automatically calculatepeptide and protein ratios in quantitative proteomic experi-ments [6–8]. Manual validation is, however, often desired to
remove possible errors in peptide and protein quantificationssuggested by these algorithms. Indeed, some problems existwith the interpretation of peptide ratios and their conversionin protein ratios: for instance, should the ratios of allpeptides, unique peptides or Occam’s razor peptides(ambiguous peptides that are linked to one protein with thehighest coverage in order to generate a minimal proteincatalogue) be used in the calculation of protein ratios [9]?Also, how does one define a ‘‘regulated protein’’? In ouropinion, the ratio of such a regulated protein must beanalyzed within the background of the whole experiment andin the context of the protein inference problem. Additionally,there are problems with the structure of the output files of thepeptide quantification software packages and with the generalintegration of these files. The MASCOT Distiller Quantitationtoolbox for example creates by default a .rov file for each LC-MS(/MS) run analyzed (http://www.matrixscience.com/distiller.html). Only one .rov file can be opened and analyzedby MASCOT Distiller at a time, making it difficult to obtain aholistic, proteomic view on protein quantification data sincevery often several .rov files need to be analyzed separately.The recently published MaxQuant and Census algorithmscreate text files as output [7, 8]. Microsoft Excel can openthese tab-separated spreadsheets files, but analysis of resultsare generally difficult since no protein-specific visualizationcan be created and no complete view on the data can begenerated in Excel.
For these reasons, we built the Rover tool to visualize,analyze and validate quantitative proteomics data from
Correspondence: Professor Kris Gevaert, Department of MedicalProtein Research and Biochemistry, VIB and Faculty of Medicineand Health Sciences, Ghent University, A. Baertsoenkaai 3,B-9000 Ghent, BelgiumE-mail: [email protected]: 132-92649496
& 2010 WILEY-VCH Verlag GmbH & Co. KGaA, Weinheim www.proteomics-journal.com
1226 Proteomics 2010, 10, 1226–1229DOI 10.1002/pmic.200900379

124 Improving the sensitivy and the specificity in peptide centric proteomics
786 | VOL.6 NO.11 | NOVEMBER 2009 | NATURE METHODS
CORRESPONDENCE
Improved visualization of protein consensus sequences by iceLogoTo the Editor: Large sequence-based datasets are often scanned for conserved sequence patterns to extract useful biological informa-tion1. Sequence logos2 have been developed to visualize conserved patterns in oligonucleotide and protein sequences and rely on
enabled us to combine the advantages of in-gel and in-solution digestion workflows. It has been commonly held that SDS, once introduced into the sample, will make subsequent mass spectro-metric analysis impossible. Manza et al.3 explicitly state in their paper that they could not completely remove SDS and that its pres-ence reduced the number of identified BSA peptides. Indeed, after multidimensional separation Manza et al.3 identified 75 soluble cytosolic and 142 nuclear proteins. In contrast, our FASP approach allowed us to identify more than 7,000 proteins, about one-third of which were membrane or membrane-associated proteins2. In FASP, SDS is dissociated from proteins using urea. This presumably sequesters them into small micelles, which can pass through the filter pores, thus separating protein and detergent. The method of Manza et al.3 does not use such a step and is therefore not effective at removing SDS or other detergents.
FASP achieves essentially complete protein unfolding during the whole process of detergent removal, which allows use of large-molecular-weight cut-off filters without a loss of small proteins. In contrast, Manza et al.3 reported that it was necessary to limit filter size to the 3–5 kDa range. The ability of FASP to work with larger pore filters substantially reduces sample preparation time.
Liebler and Ham1 also state that the method is not “universal” because it disproportionately loses protein at low sample loads. We did not specifically develop the FASP protocol for high-sensitivity work. However, we demonstrated identification of 1,700 proteins from HeLa cell material corresponding to only 1,250 cells (750 ng total protein)2. We have now tested FASP with tenfold lower amounts and did not observe a disproportionate reduction in pep-tide ion current, peptide or protein identifications (Supplementary Note). Current commercial spin filters are not optimized for FASP, and they are not optimal for working with very small protein amounts (<100 ng). Miniaturization of the filter units should reduce proteins losses proportionally. In any case, in describing FASP method as “universal,” we were specifically referring to its ability to represent the proteome in an unbiased way, which we demonstrated by comparison to the transcriptome.
Note: Supplementary information is available on the Nature Methods website.
Jacek R Wi!niewski & Matthias Mann
Department of Proteomics and Signal Transduction, Max-Planck Institute for Biochemistry, Martinsried, Germany. e-mail: [email protected]
1. Liebler, D.C. & Ham, A.-J.L. Nat. Methods 6, 785 (2009).2. Wi!niewski, J.R., Zougman, A., Nagaraj, N. & Mann, M. Nat. Methods 6, 359–362
(2009).3. Manza, L.L., Stamer, S.L., Ham, A.J., Codreanu, S.G. & Liebler, D.C. Proteomics
5, 1742–1745, (2005).4. Ethier, M., Hou, W., Duewel, H.S. & Figeys, D. J. Proteome Res. 5, 2754–2759
(2006).5. Nagaraj, N., Lu, A., Mann, M. & Wi!niewski, J.R. J. Proteome Res. 7, 5028–5032
(2008).
Shannon’s information theory to calculate conservation among all positions in a multiple-sequence alignment. A sequence logo, such as that created by the popular WebLogo tool3, is a histogram-like presentation in which bars are vertical stacks of symbols; the stack height reflects the extent of conservation, and the height of individual symbols reflects their relative frequency at a given posi-tion. However, to our knowledge, no existing tool can compare, in a statistically sound manner, an experimental peptide or protein sequence set to (i) the background of species-specific natural occur-rences of amino acids, (ii) a position-specific background set or (iii) a background set that is influenced by the experimental protocol. In addition, underrepresented elements nontolerated amino acids or nucleotides are generally not or not statistically well presented (Supplementary Note 1).
Here we introduce iceLogo, a free, open-source Java application for the analysis and visualization of consensus patterns in aligned peptide sequences (http://icelogo.googlecode.com/; a description of methods used by iceLogo and a user manual are available in Supplementary Note 2). Instead of relying on information theory, iceLogo builds on probability theory. The user first defines an appro-priate reference set, tailoring it to ideally approximate the expected background distribution. These reference set distributions and associated standard deviations are then used to test the experimen-tal set, which results in a probability value (Z score) that indicates whether or not the reference set and the experimental set are equal (null hypothesis) or are different (alternative hypothesis). This probability value implicitly takes into account sample size, avoid-ing misinterpretation of sequence logos from small experimental sequence sets. The reference set can be derived from a multiple-sequence alignment, from the natural amino acid composition or from Monte Carlo sampling a FASTA format database. The experi-mental sequence set is generally a multiple sequence alignment of peptides that are expected to share sequence features. Finally, the result of the probability analysis can be displayed in complementary illustrations such as position-specific bar charts, heatmaps and so-called iceLogos, which we developed to aid analysis, visualization and understanding of consensus sequences intuitively.
We illustrate the use of iceLogo and its visualization methods with two recent analyses4,5 done in our laboratory. In an analysis of the substrate specificity of human granzyme B (ref. 4), we generated both a WebLogo (Supplementary Fig. 1) and an iceLogo (Fig. 1a) for 452 identified human granzyme B cleavage sites. The extended specificity of granzyme B for acidic residues surrounding the cleav-age site4 was very clear in the iceLogo, which compared the exper-imental set to the human proteome as reference set. However, in the WebLogo, this acidic stretch was hidden in the noise. iceLogo also generated amino acid parameter graphs for over 500 physi-cochemical and biochemical amino acid properties6; using the net charge amino acid parameter, this preferred acidic region was again clearly visualized by iceLogo (Supplementary Fig. 2). In a second study, we determined the substrate profile of the yeast N-terminal acetyltransferase A (NatA) complex5, responsible for the major-ity of co-translational acetylation of nascent yeast protein N ter-mini. We observed a strong preference for -acetylation of proteins starting with serine and an elevated average frequency of serine (23%) at this position in the theoretical yeast proteome. Thus, any random set of yeast protein N termini would yield a significant (P < 0.05) sequence logo with serine at position 2 (when counting the initiating methionine), independent of NatA specificity consid-
©20
09 N
atur
e A
mer
ica,
Inc.
All
righ
ts r
eser
ved.

125Addendum 1 Additional papers
Proteome-wide Substrate Analysis IndicatesSubstrate Exclusion as a Mechanism toGenerate Caspase-7 Versus Caspase-3Specificity*!S
Dieter Demon,a,b,c,d Petra Van Damme,c,e,f,g Tom Vanden Berghe,a,b,g
Annelies Deceuninck,h,i Joost Van Durme,g,j Jelle Verspurten,a,b,k Kenny Helsens,e,f,l
Francis Impens,e,f,m Magdalena Wejda,a,b Joost Schymkowitz,j Frederic Rousseau,j
Annemieke Madder,h,n Joel Vandekerckhove,e,f Wim Declercq,a,b Kris Gevaert,e,f
and Peter Vandenabeelea,b,o
Caspase-3 and -7 are considered functionally redundantproteases with similar proteolytic specificities. We per-formed a proteome-wide screen on a mouse macrophagelysate using the N-terminal combined fractional diagonalchromatography technology and identified 46 shared,three caspase-3-specific, and six caspase-7-specificcleavage sites. Further analysis of these cleavage sitesand substitution mutation experiments revealed that forcertain cleavage sites a lysine at the P5 position contrib-utes to the discrimination between caspase-7 and -3specificity. One of the caspase-7-specific substrates, the40 S ribosomal protein S18, was studied in detail. TheRPS18-derived P6–P5" undecapeptide retained completespecificity for caspase-7. The corresponding P6–P1hexapeptide still displayed caspase-7 preference but loststrict specificity, suggesting that P" residues are addition-ally required for caspase-7-specific cleavage. Analysis oftruncated peptide mutants revealed that in the case ofRPS18 the P4–P1 residues constitute the core cleavagesite but that P6, P5, P2", and P3" residues critically con-tribute to caspase-7 specificity. Interestingly, specificcleavage by caspase-7 relies on excluding recognitionby caspase-3 and not on increasing binding forcaspase-7. Molecular & Cellular Proteomics 8:2700–2714, 2009.
Caspases, a family of evolutionarily conserved proteases,mediate apoptosis, inflammation, proliferation, and differenti-
ation by cleaving many cellular substrates (1–3). The apopto-tic initiator caspases (caspase-8, -9, and -10) are activated inlarge signaling platforms and propagate the death signal bycleavage-induced activation of executioner caspase-3 and -7(4, 5). Most of the cleavage events occurring during apoptosishave been attributed to the proteolytic activity of these twoexecutioner caspases, which can act on several hundreds ofproteins (2, 3, 6, 7). The substrate degradomes of the twomain executioner caspases have not been determined buttheir identification is important to gaining greater insight intheir cleavage specificity and biological functions.
The specificity of caspases was rigorously profiled by usingcombinatorial tetrapeptide libraries (8), proteome-derivedpeptide libraries (9), and sets of individual peptide substrates(10, 11). The results of these studies indicate that specificitymotifs for caspase-3 and -7 are nearly indistinguishable withthe canonical peptide substrate, DEVD, used to monitor theenzymatic activity of both caspase-3 and -7 in biologicalsamples. This overlap in cleavage specificity is manifested intheir generation of similar cleavage fragments from a variety ofapoptosis-related substrates such as inhibitor of caspase-activated DNase, keratin 18, PARP,1 protein-disulfide isomer-ase, and Rho kinase I (for reviews, see Refs. 2, 3, and 7). Thispropagated the view that these two caspases have com-pletely redundant functions during apoptosis. Surprisingly,mice deficient in one of these caspases (as well as micedeficient in both) have distinct phenotypes. Depending on the
From the aDepartment for Molecular Biomedical Research,Flanders Institute for Biotechnology (VIB), Ghent 9052, Belgium, bDe-partment of Biomedical Molecular Biology, Ghent University, Ghent9052, Belgium, eDepartment for Medical Protein Research, VIB, Gh-ent 9000, Belgium, Departments of fBiochemistry and hOrganicChemistry, Ghent University, Ghent 9000, Belgium, and jSwitch Lab-oratory, Flemish Institute for Biotechnology (VIB), Vrije UniversiteitBrussel, Brussels 1050, Belgium
Received, July 7, 2009, and in revised form, September 14, 2009Published, MCP Papers in Press, September 16, 2009, DOI
10.1074/mcp.M900310-MCP200
1 The abbreviations used are: PARP, poly(ADP-ribose) polymerase;amc, 7-amino-4-methylcoumarine; Abz, 2-amino-benzoic acid; CFS,cell-free system; COFRADIC, combined fractional diagonal chroma-tography; IAA, iodoacetamide; kcat, catalytic constant; Km, Michaelis-Menten constant; Y(NO2), 3-nitrotyrosine; RP, reverse phase; SILAC,stable isotope labeling by amino acids in cell culture; zVAD-fmk,benzyloxycarbonyl-valine-alanine-aspartic acid(OMe)fluoromethylketone; pNA, p-nitroanilide; Fmoc, N-(9-fluorenyl)methoxycarbonyl;wt, wild type; C3, caspase-3; C7, caspase-7; HDGF, hepatoma-derived growth factor; OtBu, tert-butyl ester.
Research
© 2009 by The American Society for Biochemistry and Molecular Biology, Inc.2700 Molecular & Cellular Proteomics 8.12This paper is available on line at http://www.mcponline.org
by J
oel V
andekerc
khove o
n J
anuary
29, 2
010
ww
w.m
cponlin
e.o
rgD
ow
nlo
aded fro
m
/DC1http://www.mcponline.org/cgi/content/full/M900310-MCP200Supplemental Material can be found at:

126 Improving the sensitivy and the specificity in peptide centric proteomics
RAPID COMMUNICATION
Getting a grip on proteomics data – Proteomics DataCollection (ProDaC)
Martin Eisenacher1!, Lennart Martens2!, Tanja Hardt1, Michael Kohl1, Harald Barsnes3,4,Kenny Helsens5, Jari H .akkinen6, Fredrik Levander7, Ruedi Aebersold8,9,10,Joel Vandekerckhove5, Michael J. Dunn11, Frederique Lisacek12, Jennifer A. Siepen13
Simon J. Hubbard13, Pierre-Alain Binz14, Martin Bl .uggel15, Herbert Thiele16, John Cottrell17,Helmut E. Meyer1, Rolf Apweiler2 and Christian Stephan1
1Medizinisches Proteom-Center (MPC), Ruhr-Universitaet Bochum, Germany2 European Bioinformatics Institute, Hinxton, Cambridge, UK3Department of Informatics, University of Bergen, Norway4 The Bergen Center for Computational Science (BCCS), Norway5Department of Medical Protein Research, University of Ghent, Belgium6Department of Theoretical Physics and Department of Oncology, Clinical Sciences, Lund University,Lund, Sweden
7Department of Immunotechnology, Lund University, Lund, Sweden8 Federal Institute of Technology, ETH Zurich, Switzerland9 Faculty of Science, University of Zurich, Switzerland
10 Institute for Systems Biology, Seattle, WA, USA11Conway Institute of Biomolecular and Biomedical Research, University College Dublin, Ireland12 Swiss Institute of Bioinformatics, Geneva, Switzerland13 Faculty of Life Sciences, Manchester University, UK14GeneBio, Geneva, Switzerland15 Protagen AG, Dortmund, Germany16 Bruker Daltonik GmbH, Bremen, Germany17Matrix Science, London, UK
Received: April 17, 2009Revised: May 11, 2009
Accepted: May 11, 2009
In proteomics, rapid developments in instrumentation led to the acquisition of increasinglylarge data sets. Correspondingly, ProDaC was founded in 2006 as a Coordination Actionproject within the 6th European Union Framework Programme to support data sharing andcommunity-wide data collection. The objectives of ProDaC were the development of docu-mentation and storage standards, setup of a standardized data submission pipeline andcollection of data. Ending in March 2009, ProDaC has delivered a comprehensive toolbox ofstandards and computer programs to achieve these goals.
Keywords:Bioinformatics / European Union / ProDaC / Proteomics Data Collection / Standards
Rapid developments in mass spectrometry instrumenta-tion have enabled the acquisition of large data volumes inshort time ranges. Unfortunately, each vendor uses adifferent, proprietary format to present the data, leading torestrictions on both data (re-)use and data storage [1].
To solve this problem, volunteers from science andindustry joined forces in 2002 and founded the Proteomics
Abbreviations: CV, controlled vocabularies; EU, EuropeanUnion; MIAPE, Minimum Information About a ProteomicsExperiment; PRIDE, Proteomics Identifications Database;ProDaC, Proteomics Data Collection; PSI, Proteomics StandardsInitiative; XML, eXtensible Markup Language !
These authors contributed equally to this work.
Correspondence: Dr. Christian Stephan, Medizinisches Proteom-Center, Ruhr-Universitaet Bochum, ZKF E.143, Universitaetsstr.150, D-44801 Bochum, GermanyE-mail: [email protected]: 149-234-32-14554
& 2009 WILEY-VCH Verlag GmbH & Co. KGaA, Weinheim www.proteomics-journal.com
3928 Proteomics 2009, 9, 3928–3933DOI 10.1002/pmic.200900247

127Addendum 1 Additional papers
RESEARCH ARTICLE
Implementation and application of a versatile clusteringtool for tandem mass spectrometry data
Kristian Flikka1, 2, 3, Jeroen Meukens4, 5, Kenny Helsens4, 5, Joël Vandekerckhove4, 5,Ingvar Eidhammer3, Kris Gevaert4, 5 and Lennart Martens4, 5*
1 Computational Biology Unit, Bergen Center for Computational Science, University of Bergen,Bergen, Norway
2 Proteomics Unit at University of Bergen (PROBE), Bergen, Norway3 Department of Informatics, University of Bergen, Bergen, Norway4 Department of Medical Protein Research, VIB, Ghent, Belgium5 Department of Biochemistry, Ghent University, Ghent, Belgium
High-throughput proteomics experiments typically generate large amounts of peptide fragmen-tation mass spectra during a single experiment. There is often a substantial amount of redundantfragmentation of the same precursors among these spectra, which is usually considered a nui-sance. We here discuss the potential of clustering and merging redundant spectra to turn thisredundancy into a useful property of the dataset. To this end, we have created the first general-purpose, freely available open-source software application for clustering and merging MS/MSspectra. The application also introduces a novel approach to calculating the similarity of frag-mentation mass spectra that takes into account the increased precision of modern mass spec-trometers, and we suggest a simple but effective improvement to single-linkage clustering. Theapplication and the novel algorithms are applied to several real-life proteomic datasets and theresults are discussed. An analysis of the influence of the different algorithms available and theirparameters is given, as well as a number of important applications of the overall approach.
Received: February 13, 2007Revised: May 9, 2007
Accepted: June 11, 2007
Keywords:Bioinformatics / Mass spectrometry / Spectrum clustering
Proteomics 2007, 7, 3245–3258 3245
1 Introduction
Recent proteomics projects have successfully identifiedthousands of different peptides and proteins using high-throughput LC-MS/MS methods [1–4]. It has, however,become evident that there is significant redundancy in thespectral data produced by such peptide-based LC-MS/MSproteomics workflows [5–10]. This redundancy is caused byvarious underlying instrument-related factors – both from
the chromatographic setup and the mass spectrometer – allresulting in recurring MS/MS-fragmentation of the samepeptide over a given proteome analysis.
Mass spectral data outputs from proteome-wide experi-ments are generally quite complex [11], and the redundantgeneration of MS/MS spectra often unnecessarily increasesthis complexity. Having several MS/MS spectra representingone peptide increases the challenges of data-analysis, both interms of the computational processing time required and thetime spent on human validation of the suggested peptidesequences. Through appropriate handling of redundantspectra however, this previously inconvenient spectrumCorrespondence: Kristian Flikka, Computational Biology Unit,
Bergen Center for Computational Science, University of Bergen,Hoeyteknologisenteret, Thormoehlensgate 55, N-5008 Bergen,NorwayE-mail: [email protected]: 147-55584295
* Current address: EMBL Outstation, The European Bioinfor-matics Institute, Wellcome Trust Genome Campus, CambridgeCB10 1SD, UK
DOI 10.1002/pmic.200700160
! 2007 WILEY-VCH Verlag GmbH & Co. KGaA, Weinheim www.proteomics-journal.com

128 Improving the sensitivy and the specificity in peptide centric proteomics
REVIEW
A la carte proteomics with an emphasis on gel-freetechniques
Kris Gevaert1, 2, Petra Van Damme1, 2, Bart Ghesquière1, 2, Francis Impens1, 2,Lennart Martens3, Kenny Helsens1, 2 and Joël Vandekerckhove1, 2
1 Department of Medical Protein Research, VIB, Ghent, Belgium2 Department of Biochemistry, Ghent University, Ghent, Belgium3 EMBL Outstation, European Bioinformatics Institute, Wellcome Trust Genome Campus,
Hinxton, Cambridge, UK
Since the introduction of the proteome term somewhat more than a decade ago the field of pro-teomics witnessed a rapid growth mainly fueled by instrumental analytical improvements. Ofparticular notice is the advent of a diverse set of gel-free proteomics techniques. In this review, wediscuss several of these gel-free techniques both for monitoring protein concentration changesand protein modifications, in particular protein phosphorylation, glycosylation, and proteinprocessing. Furthermore, different approaches for (multiplexed) gel-free proteome analysis arediscussed.
Received: February 2, 2007Revised: April 2, 2007
Accepted: April 2, 2007
Keywords:Gel-free proteomics / Peptide-centric proteomics / Post-translational modifications /Protein processing
2698 Proteomics 2007, 7, 2698–2718
1 Introduction
2D-PAGE [1–3] is still the sole technology able to visualizeand quantify as many individual protein forms in a proteomeas possible. It has been around for more than 30 years andwas successfully used for biomarker discovery studies (e.g.,[4, 5]). One of the most notable improvements of the 2D-PAGE technique was the introduction of IPG gels [6] that
overcame the cathodic drift problem [7] and have led tostandardized procedures for 2-DE, which in turn paved theway for interlab comparisons of 2-DE results [8, 9]. A morerecent enhancement was the introduction of DIGE [10]which reduced most of the reproducibility issues when com-paring analogous 2-D gel patterns of similar samples.Nevertheless, and like any other analytical technique, someproteins often remain unseen by the 2D-PAGE approach.Often this “dark side of the proteome” is reported to consistsof hydrophobic, integral membrane proteins that are notreadily extracted from their lipidic background [11] and lowcopy number proteins (typically less than about 1000 copiesper cell) of which, without any preenrichment step (e.g., byfractionating cells into organelles), insufficient numbers canbe loaded on a 2D-gel [12, 13].
Over the past decade the overall sensitivity, accuracy, anddynamic range of mass spectrometers have improved drasti-cally [14]. In combination with the ever increasing publicavailability of completely sequenced genomes (e.g., theEntrez Genome Project [15]) this has led to a new researcharea in proteomics: gel-free, nongel, shotgun or rather pep-tide-centric proteomics. Here, instead of analyzing the pro-
Correspondence: Professor Dr. Kris Gevaert, Department of Bio-chemistry, Faculty of Medicine and Health Sciences, Ghent Uni-versity, A. Baertsoenkaai 3, B-9000 Ghent, BelgiumE-mail: [email protected]: 132-92649496
Abbreviations: AMT, accurate mass tag; CDG, congenital disor-ders of glycosylation; COFRADIC, combined fractional diagonalchromatography; ICAT, isotope-coded affinity tag; IMAC, immo-bilized metal ion affinity chromatography; iTRAQ!, isobaric tagsfor relative and absolute quantification; MudPIT, multidimen-sional protein identification technology; O-GlcNAc, O-linkedbeta N-acetylglucosamine; SCX, strong cation exchange; SILAC,stable isotope labeling by amino acids in cell culture; TNBS,2,4,6-trinitrobenzenesulfonic acid
DOI 10.1002/pmic.200700114
" 2007 WILEY-VCH Verlag GmbH & Co. KGaA, Weinheim www.proteomics-journal.com

129Addendum 1 Additional papers
REVIEW
MS-driven protease substrate degradomics
Francis Impens1,2, Niklaas Colaert1,2, Kenny Helsens1,2, Kim Plasman1,2, Petra Van Damme1,2,Joel Vandekerckhove1,2 and Kris Gevaert1,2
1Department of Medical Protein Research, Ghent, Belgium2Department of Biochemistry, Ghent University, Ghent, Belgium
Received: June 16, 2009Revised: August 12, 2009
Accepted: August 13, 2009
Proteolytic processing has recently received increased attention in the field of signal propa-gation and cellular differentiation. Because of its irreversible nature, protein cleavage hasbeen associated with committed steps in cell function. One aspect of protease biology thatboomed the past few years is the detailed characterization of protease substrates by bothshotgun as well as targeted MS-driven proteomics techniques. The most promising techni-ques are discussed in this review and we further elaborate on the bioinformatics challengesthat accompany mainly qualitative, MS-driven protease substrate degradome studies.
Keywords:Bioinformatics / Combined fractional diagonal chromatography / MS / Neo-N-termini /Protease substrate degradomics / Technology
1 Introduction
Substrate processing by proteases controls many physiolo-gical processes ranging from food processing to tightlycontrolled processes such as blood clotting. Proteases act byhydrolyzing peptide bonds in their target substrates either atprotein termini (exoproteases) or inside the proteinsequence (endoproteases). In vivo, interactions with naturalprotease inhibitors, post-translational modifications andsubcellular trans-localization are important regulatorymechanisms for protease activity. The outcome of a proteaseacting on a substrate can be quite diverse as substrateprocessing may lead to activation or inactivation of asubstrate, creation of alternative functionalities of theresulting protein fragment(s), altered localization of
substrates (or fragments), etc. Disproportioned distributionsof proteases, protease inhibitors and protease substrates arefound associated with many human diseases includingcancer [1, 2], which obviously means that proteolytic activityneeds to be well-controlled. Control mechanisms involveamongst others protease/substrate compartmentalizationand protease activation by pH, fluxes in ion concentrationsand zymogen activation by the removal of propeptides.
In the human genome, 570 genes are predicted to encodefor proteases and only a minority of these proteases hasbeen characterized [2]. If we ever want to fully understandprotease functions in physiology and pathology, amongstothers we need to comprehensively create protease substrateinventories and further re-build the pathways by whichactive protease propagate signals through the web ofprotein–protein interactions in the studied system ororganism. Contemporary MS-driven proteomics is wellpositioned since the level of sensitivity that is within reach toidentify proteins and thus protease substrates enable highlydetailed analyses. In the following sections, we present anoverview of MS-driven proteomics technologies that enablelarge-scale characterization of protease substrates and/orlead to detailed profiling of the general substrate specificityof proteases. We further elaborate on the bioinformaticschallenges that came along with these new high-throughputprotease substrate screening methods and discuss issues ondata quality, data storage and data interpretation. Itshould be noted that this review will not focus on protein
Abbreviations: COFRADIC, combined fractional diagonal chro-matography; MMP, matrix metalloproteinase; PICS, proteomicidentification of protease cleavage sites; SCX, strong cationexchangeaphy; SILAC, stable isotope labeling with amino acidsin cell culture; TAILS, terminal amine isotope labeling ofsubstrates; TNBS, 2,4,6-trinitrobenzenesulfonic acid
Correspondence: Professor Kris Gevaert, Department of MedicalProtein Research and Biochemistry, VIB and Faculty of Medicineand Health Sciences, Ghent University, A. Baertsoenkaai 3,B-9000 Ghent, BelgiumE-mail: [email protected]:132-92649496
& 2010 WILEY-VCH Verlag GmbH & Co. KGaA, Weinheim www.proteomics-journal.com
1284 Proteomics 2010, 10, 1284–1296DOI 10.1002/pmic.200900418

130 Improving the sensitivy and the specificity in peptide centric proteomics
©2
008
Na
ture
Pu
bli
sh
ing
Gro
up
h
ttp
://w
ww
.na
ture
.co
m/n
atu
reb
iote
ch
no
log
y

131Addendum 1 Additional papers
An Staes1, 2
Evy Timmerman1, 2
Jozef Van Damme1, 2
Kenny Helsens1, 2
Jo!l Vandekerckhove1, 2
Martin Vollmer3Kris Gevaert1, 2
1Department of Medical ProteinResearch, VIB, Ghent, Belgium
2Department of Biochemistry,Ghent University, Ghent,Belgium
3Agilent Technologies R&D andMarketing GmbH and CoKG,Waldbronn, Germany
Original Paper
Assessing a novel microfluidic interface forshotgun proteome analyses
Microfluidic interfaces coupled to ESI mass spectrometers hold great potential forproteomics as they have been shown to augment the overall sensitivity of measure-ments and require only a minimum of operator manipulations as compared to con-ventional nano-LC interfaces. Here, we evaluated a new type of HPLC-Chips holdinglarger enrichment columns (thus an increased sample loading capacity) for gel-freeproteome studies. A tryptic digest of a human T-cell proteome was fractionated bystrong cation exchange chromatography and selected fractions were analyzed byMS/MS on an IT mass spectrometer using both the new HPLC-Chip as well as a con-ventional nano-LC-MS/MS interface. Our results indicate that the HPLC-Chip is capa-ble of handling very complex peptide mixtures and, in fact, leads to the identifica-tion of more peptides and proteins as compared to when a conventional interfacewas used. The HPLC-Chip preferentially produced doubly charged tryptic peptides.We further show that MS/MS spectra of doubly charged tryptic peptide ions aremore readily identified by MASCOT as compared to those from triply charged pre-cursors and thus argue that besides the improved chromatographic conditions pro-vided by the HPLC-Chip, its peptide charging profile might be a secondary factorleading to an increased proteome coverage.
Keywords: Gel-free proteomics / HPLC-Chip / Mass spectrometry / Peptides / Protein identification/
Received: January 10, 2007; revised: March 14, 2007; accepted: March 15, 2007
DOI 10.1002/jssc.200700012
1 Introduction
Proteome analysis has traditionally relied on 2-D PAGE[1]. However, miniaturization of liquid chromatographictechniques, maturation of biological MS, and nonstopgenomic sequencing and hereof derived bioinformatictools gave birth to so-called gel-free proteomics tech-niques (amongst others reviewed in ref. [2–5]). In thesetechniques, a proteome is broken down to peptideswhich are generally more soluble than their precursorproteins and readily analyzable by mass spectrometers.By analyzing peptides instead of intact proteins, most ofthe inherent drawbacks of 2-D PAGE are conquered. Forexample, integral membrane proteins are often only
poorly extracted from their hydrophobic background [6]and tend to precipitate near their pI in the first dimen-sion (IEF). Recently, gel-free approaches were shown toalleviate this setback releasing this important class ofproteins for high coverage proteomics [7].
The analytical method of choice in gel-free proteomestudies combines (multidimensional) liquid chromato-graphic peptide separation to ESI MS [8]. Nanoelectro-spray sources [9] have proven to be useful interfacesbetween 2-D gels and mass spectrometers, only requiringnanogram amounts of protein material for successfulprotein identification [10]. These sources reach such highsensitivities by lowering the dimensions of both the Tay-lor cone and the sputtered droplets; smaller dropletshave a relatively higher surface from which more ana-lytes emerge thereby increasing the overall efficiency ofthe ESI process [9]. The introduction of solvent pumpingand mixing HPLC systems reproducibly delivering nL/min flow rates further allowed largely automated pep-tide separations on nanobore RP columns in-line con-nected to mass spectrometers [11]. Nano-LC-MS/MS tech-nologies have matured over the past few years and arenow routinely used for protein or proteome studies feed-
Correspondence: Professor Dr. Kris Gevaert, Department ofMedical Protein Research and Biochemistry, Flanders Interuni-versity Institute for Biotechnology and Faculty of Medicine andHealth Sciences, Ghent University, A. Baertsoenkaai 3, B-9000Ghent, BelgiumE-mail: [email protected]: +32-92649496
Abbreviations: mgf, MASCOT generic files; MudPIT, multidi-mensional protein identification technology
i 2007WILEY-VCH Verlag GmbH &Co. KGaA,Weinheim www.jss-journal.com
1468 A. Staes et al. J. Sep. Sci. 2007, 30, 1468–1476

132 Improving the sensitivy and the specificity in peptide centric proteomics
RESEARCH ARTICLE
Improved recovery of proteome-informative,protein N-terminal peptides by combined fractionaldiagonal chromatography (COFRADIC)
An Staes1, 2*, Petra Van Damme1, 2*, Kenny Helsens1, 2, Hans Demol1, 2,Joël Vandekerckhove1, 2 and Kris Gevaert1, 2
1 Department of Medical Protein Research, VIB, Ghent, Belgium2 Department of Biochemistry, Ghent University, Ghent, Belgium
We previously described a proteome-wide, peptide-centric procedure for sorting protein N-termi-nal peptides and used these peptides as readouts for protease degradome and xenoproteomestudies. This procedure is part of a repertoire of gel-free techniques known as COmbined FRAc-tional DIagonal Chromatography (COFRADIC) and highly enriches for a-amino-blocked pep-tides, including a-amino-acetylated protein N-terminal peptides. Here, we introduce two addi-tional steps that significantly increase the fraction of such proteome-informative, N-terminalpeptides: strong cation exchange (SCX) segregation ofa-amino-blocked anda-amino-free peptidesand an enzymatic step liberating pyroglutamyl peptides for 2,4,6-trinitrobenzenesulphonic acid(TNBS) modification and thus COFRADIC sorting. The SCX step reduces the complexity of theanalyte mixture by enriching N-terminal peptides and depleting a-amino-free internal peptides aswell as proline-starting peptides prior to COFRADIC. The action of pyroglutamyl aminopepti-dases prior to the first COFRADIC peptide separation results in greatly diminishing numbers ofcontaminating pyroglutamyl peptides in peptide maps. We further show that now close to 95% ofall COFRADIC-sorted peptides are a-amino-acetylated and, using the same amount of startingmaterial, our novel procedure leads to an increased number of protein identifications.
Received: October 8, 2007Revised: November 29, 2007Accepted: December 6, 2007
Keywords:COFRADIC / Gel-free proteomics / N-terminal peptides / SCX
1362 Proteomics 2008, 8, 1362–1370
1 Introduction
Shotgun proteomics, in which proteomes are typicallydigested with trypsin, faces highly complex peptide mixturesin which individual components are often present in con-
centrations ranging several orders of magnitude. This con-stitutes a real challenge for analytical systems. Indeed, eventhough current mass spectrometers cycle more than oneMS/MS spectrum per second, in a single analysis only afraction of the whole proteome is sampled [1]. This hinderssystematic proteomics such as biomarker discovery whererepetitive high proteome coverage is necessary. Several strat-egies have been developed to increase the overall proteomecoverage including the classical examples of multi-dimensional protein identification technology (MudPIT) [2]and isotope-coded affinity tag (ICAT) [3]. More recently,Aebersold and coworkers [4, 5] recommended using proteo-typic peptides as easily detectable representatives for theirparent proteins.
Correspondence: Professor Kris Gevaert, Department of MedicalProtein Research and Biochemistry, VIB and Faculty of Medicineand Health Sciences, Ghent University, A. Baertsoenkaai 3, B-9000 Ghent, BelgiumE-mail: [email protected]: 132-92649496
Abbreviations: COFRADIC, combined fractional diagonal chro-matography; pGAPase, pyroglutamyl aminopeptidase; Qcyclase,glutamine cyclotransferase; SCX, strong cation exchange; TNBS,2,4,6-trinitrobenzenesulphonic acid * Both these authors contributed equally.
DOI 10.1002/pmic.200700950
! 2008 WILEY-VCH Verlag GmbH & Co. KGaA, Weinheim www.proteomics-journal.com

133Addendum 1 Additional papers

134 Improving the sensitivy and the specificity in peptide centric proteomics

135Addendum 2 Curriculum Vitae
Addendum 2 Curriculum Vitae

136 Improving the sensitivy and the specificity in peptide centric proteomics

137Addendum 2 Curriculum Vitae
Kenny HelsensCurriculum Vitae
NAMEFIRST NAME
PLACE OF BIRTHDATE OF BIRTH
NATIONALITY MARITAL STATUS HOME ADDRESS
PROFESSIONAL ADDRESS
ACADEMIC CARREER
HELSENS Kenny, Mark NinaGhent (Belgium)30th of November 1984BelgianUnmarriedPantserschipstraat 149B-9000 GentBelgium Tel.: +32 486 06 80 32
Department of BiochemistryFaculty of Medicine and Health SciencesGhent UniversityA. Baertsoenkaai 3B-9000 GhentBelgium Tel.: +32 9 264 93 58e-mail: [email protected]
Bachelor in Biomedical Sciences, July 2004, distinction Ghent University Master in Biomedical Sciences, July 2006, distinction Ghent University
Kenny Helsens, Lic.CURRICULUM VITAE

138 Improving the sensitivy and the specificity in peptide centric proteomicsKenny HelsensCurriculum Vitae Kenny HelsensCurriculum Vitae
1. Helsens et al. MascotDatfile: an open-source library to fully parse and analyse MASCOT MS/MS search results. Proteomics (2007) vol. 7 (3) pp. 364-6
2. Staes et al. Assessing a novel microfluidic interface for shotgun proteome analyses. Journal of separation science (2007) vol. 30 (10) pp. 1468-76
3. Gevaert et al. A la carte proteomics with an emphasis on gel-free techniques. Proteomics (2007) vol. 7 (16) pp. 2698-718
4. Flikka et al. Implementation and application of a versatile clustering tool for tandem mass spectrometry data. Proteomics (2007) vol. 7 (18) pp. 3245-58
5. Mathivanan et al. Human Proteinpedia enables sharing of human protein data. Nature biotechnology (2008) vol. 26 (2) pp. 164-7
6. Staes et al. Improved recovery of proteome-informative, protein N-terminal peptides by combined fractional diagonal chromatography (COFRADIC). Proteomics (2008) vol. 8 (7) pp. 1362-70
7. Helsens et al. Peptizer: A tool for assessing false positive peptide identifications and manually validating selected results. Molecular & cellular proteomics : MCP (2008) vol. 7(12) pp. 2363-72
8. Arnesen et al. Proteomics analyses reveal the evolutionary conservation and divergence of N-terminal acetyltransferases from yeast and humans. Proceedings of the National Academy of Sciences of the United States of America (2009) vol. 106 (20) pp. 8157-8162
9. Eisenacher et al. Getting a grip on proteomics data - Proteomics Data Collection (ProDaC). Proteomics (2009) vol. 9 (15) pp. 3928-33
10. Colaert and Helsens et al. Improved visualization of protein consensus sequences by iceLogo. Nature methods (2009) vol. 6 (11) pp. 786-7
11. Ghesquière et al. In vitro and in vivo protein-bound tyrosine nitration characterized by diagonal chromatography. Molecular & cellular proteomics : MCP (2009) vol. 8 (12) pp. 2642-52
12. Demon et al. Proteome-wide substrate analysis indicates substrate exclusion as a mechanism to generate caspase-7 versus caspase-3 specificity. Molecular & cellular proteomics : MCP (2009) vol. 8 (12) pp. 2700-14
13. Impens et al. Mass spectrometry-driven protease substrate degradomics. Proteomics (2010) epub.
14. Colaert et al. Rover: a tool to visualize and validate quantitative proteomics data from di!erent sources. Proteomics (2010) vol. 10(6) pp. 1226-9.
15. Helsens and Colaert et al. ms_lims, a simple yet powerful open source LIMS for mass spectrometry-driven proteomics. Proteomics (2010) vol. 10(6) pp. 1261-4.
16. Van Damme et al. Complementary positional proteomics for screening substrates of endo- and exoproteases. Nature methods (2010) accepted.
17. Impens et al. Systematic identification of protease cleavage events. submitted.
18. Helsens et al. Bioinformatics analysis of a yeast N-terminal proteome yields various subjects of alternative translation initiation. in preparation.
Pu
bli
cati
on
s in
sci
enti
fic
jou
rnal
s

139Addendum 2 Curriculum VitaeKenny HelsensCurriculum Vitae Kenny HelsensCurriculum Vitae
1. VIB Annual Congres, Blankenberghe, March 2007 (as speaker)
2. HUPO 2008 7th World Congress, Amsterdam, Netherlands, August 2008
3. Interaction Proteome Summer School, Spetses, Greece, September 2008
4. Proteomic Forum, Berlin, Germany, March 2009
5. Interuniversity Attraction Pole (IAP) annual meeting, Ghent, Belgium, May 2009
6. VIB Science Club, Leuven, Belgium, September 2009
7. Signal Transduction and Disease, Aachen, Germany, September 2009
1. BSMS Annual Meeting, Leuven, Belgium, February 2007
2. VIB Annual Congres, Blankenberghe, March 2007
3. 3rd ProDaC workshop- Standards for proteomics data representation, Toledo, Spain, April 2008
4. 3rd Symposium on proteome analysis, Antwerp, Belgium, December 2008
5. 1st ms_lims user meeting, Dortmund, Germany, January 2010
6. Proteored bioinformatics analysis from proteomics data workshop, Salamanca, Spain, March 2010
1. IBM biotech event” discover how IT can advance biotech, Brussels, Belgium, June 2006
2. MLSB 2007: International Workshop on Machine Learning in Systems Biology, Evry, France, September 2007
3. Industry Workshop: Computational Identification of Peptides, EMBL- EBI, Hinxton, Cambridge, UK, June 2007.
4. HUPO Proteomics Standards Initiative (PSI) Spring Workshop, Toledo, Spain, April 2008
Scie
nti
fic
mee
tin
gs Speaker
Poster
Participant

140 Improving the sensitivy and the specificity in peptide centric proteomics
Kenny HelsensCurriculum Vitae Kenny HelsensCurriculum Vitae
1. Impens et al. A non-gel study of the human platelet proteome by N-terminal COFRADIC points to calpain-1 as the major proteolytic component in platelets. Platelet Proteomics: Principles, Analysis and Applications (2010) in press.
2. Helsens et al. Mass spectrometry-driven proteomics: an introduction. Methods in molecular biology (2010) in press.
Bo
ok
ch
apte
rs
Teach
ing
1. Bioinformatics II for Master in biomedical sciences 2006-2007, Ghent University, Ghent, Belgium (as course assistant)
2. Bioinformatics II for Master in biomedical sciences 2007-2008, Ghent University, Ghent, Belgium (as course assistant)
3. Proteomics Data Analysis course 2008, Cape Town, South Africa, March 2008 (as course assistant)
4. Bioinformatics II for Master in biomedical sWciences 2008-2009, Ghent University, Ghent, Belgium (guest lecture on data integration, course assistant)
5. Bioinformatics II for Master in biomedical sciences 2009-2010, Ghent University Ghent, Belgium (guest lecture on data integration, course assistant)
Kenny HelsensCurriculum Vitae Kenny HelsensCurriculum Vitae
Jolien Hollebeke Master in Biomedical Sciences
2009, University Of Ghent
Mas
ter
stu
den
ts “On the value and origin of high quality yet unidentified MS/MS spectra in proteomics.”

141Addendum 2 Curriculum Vitae
Kenny HelsensCurriculum Vitae Kenny HelsensCurriculum Vitae
1. Impens et al. A non-gel study of the human platelet proteome by N-terminal COFRADIC points to calpain-1 as the major proteolytic component in platelets. Platelet Proteomics: Principles, Analysis and Applications (2010) in press.
2. Helsens et al. Mass spectrometry-driven proteomics: an introduction. Methods in molecular biology (2010) in press.
Bo
ok
ch
apte
rs
Teach
ing
1. Bioinformatics II for Master in biomedical sciences 2006-2007, Ghent University, Ghent, Belgium (as course assistant)
2. Bioinformatics II for Master in biomedical sciences 2007-2008, Ghent University, Ghent, Belgium (as course assistant)
3. Proteomics Data Analysis course 2008, Cape Town, South Africa, March 2008 (as course assistant)
4. Bioinformatics II for Master in biomedical sWciences 2008-2009, Ghent University, Ghent, Belgium (guest lecture on data integration, course assistant)
5. Bioinformatics II for Master in biomedical sciences 2009-2010, Ghent University Ghent, Belgium (guest lecture on data integration, course assistant)
Kenny HelsensCurriculum Vitae Kenny HelsensCurriculum Vitae
Jolien Hollebeke Master in Biomedical Sciences
2009, University Of Ghent
Mas
ter
stu
den
ts “On the value and origin of high quality yet unidentified MS/MS spectra in proteomics.”

142 Improving the sensitivy and the specificity in peptide centric proteomics
Kenny HelsensCurriculum Vitae Kenny HelsensCurriculum Vitae
Driven by personal interest in biological and computational science, I did my master thesis project in 2005 - 2006 in the bioinformatics division of the proteomics lab of Prof. Dr. Kris Gevaert and Prof. Dr. Joël Vandekerckhove. Combining informatics and proteomics was very attractive to me such that I focussed my ambition in this direction. In October 2006 I received funding for 4 years from the Institute for promoting Science and Innovation to work on a PhD project that aims to improve both the sensitivity and the specificity in peptide-centric proteomics experiments.
In the everyday lab environment, this means a challenge in both organizing and understanding mass spectrometry and biological data. In the first part of my project, I have developed the Peptizer platform which assists to employ expert knowledge to increase the specificity of the proteomics results. The tool inspects rule sets similar to the critical thinking of a mass spectrometry expert performing manual validation. Besides this project, I am challenged to perform data analysis for a variety of other projects in the lab.
I strongly believe that new insights arise by working on the edge of di!erent information fields. By graduating as a master in biomedical sciences, I have a solid understanding of human biology and basic sciences. In addition, I am also skilled in developing and publishing software in Java and performing data mining. Combining these skills empowered the research I have done so far; yet, I am continuously searching to expand into other research fields to continue integrating information and yielding new knowledge.
Maj
or
rese
arch
inte
rest
s

Thesis submitted in partial fulfillment to obtain the degree of Doctor of Biomedical Sciences
Cover image created by the Wordle.net web application