increasing wine sales via the wine- food pairingessay.utwente.nl/65497/1/huttenhuis hans -s...
TRANSCRIPT

INCREASING WINE SALES VIA THE WINE-
FOOD PAIRING
Does visual or textual representation of the wine-food
pairing and congruency of the information influence wine
sales?
Student H. Huttenhuis s1028561 Communication Studies Supervisors First supervisor S. E. Bialkova, PhD Second supervisor M. Galetzka, PhD

1
Content Abstract ................................................................................................................................................... 3
Introduction ............................................................................................................................................. 4
Theoretical framework ............................................................................................................................ 6
Consumers’ decision making process for buying wine ........................................................................ 6
The influence of shelf tags: Information presentation ........................................................................ 7
The influence of shelf tags: congruency vs. Incongruency .................................................................. 9
Research Model ..................................................................................................................................... 11
Explorative marketing research ............................................................................................................ 13
Empirical section ................................................................................................................................... 14
Selection of dishes (pre-test 1) .......................................................................................................... 14
Food and wine pairing (pre-test 2) .................................................................................................... 15
Main experiment ................................................................................................................................... 19
Design ................................................................................................................................................ 19
Stimuli ................................................................................................................................................ 19
Shelf tags (Visual condition) .......................................................................................................... 20
Recipes (Textual and visual combination) ..................................................................................... 21
Wine selection ............................................................................................................................... 22
Procedure .......................................................................................................................................... 23
Results ................................................................................................................................................... 25
Information presentation .................................................................................................................. 26
Effect for each wine individually ........................................................................................................ 27
Red wine ........................................................................................................................................ 27
White wine ..................................................................................................................................... 28
Rose wine ....................................................................................................................................... 29
Discussion .............................................................................................................................................. 30
Information presentation: textual vs. textual/visual combination................................................ 30
Congruency .................................................................................................................................... 31
Marketing implications...................................................................................................................... 32
Future research .................................................................................................................................. 33
Limitations ......................................................................................................................................... 33
Conclusions ............................................................................................................................................ 35
References ............................................................................................................................................. 36
Appendix ................................................................................................................................................ 40
2
A: Images used in pre-test 1 .......................................................................................................... 40
B: Images used in pre-test 2 .......................................................................................................... 43
C: Sample question pre test 2 ........................................................................................................ 46
D: Shelf tags used in the experiment ............................................................................................. 47
E: Main experiment execution scheme .......................................................................................... 48
F: Analyses of general sales variation during the experiment ....................................................... 49
G: Analyses of sales variation during congruent and incongruent test days ................................ 50

3
Abstract
Several studies have found that labels, label design, and product information delivered via
the label or shelf tag (being grape, brand name, and price) are among the most important cues
consumers use in the wine choice decision. Currently wine-food pairing suggestions in supermarkets
are offered in a textual manner. However scientific literature provides useful suggestions how to
improve the effectiveness of such wine-food pairings. These suggestions include using visual
messages instead of textual messages, combining textual and visual messages and making use of
congruency. Therefore this study aimed to explore whether and how visual or textual representation
of the wine-food pairing and congruency of the information influences wine sales. The main
experiment used a 2 (visual information vs. textual and visual information) x 2 (congruent vs.
incongruent) x 3 (red wine vs. white wine vs. rose wine) design with a textual control group. The
results showed that red wine sales in the congruent textual/visual condition increased 43%
compared to the textual control condition. Furthermore the results indicated that white wine in the
incongruent visual condition sold 62% better than in the congruent visual condition. These results are
inconclusive as the red wine result supports current literature while the white wine results
contradicts previous research. Therefore it is recommended for future studies to further investigate
the effectiveness of visualising wine-food pairings and the role of congruency in these pairings.

4
Introduction
Consumers face many choices when they are shopping at the supermarket. For example,
shall they buy meat or fish for dinner? Shall they buy Pepsi or Coca Cola? These choices may be
especially daunting when having friends over. Researchers argue that choosing between different
brands in the same product category is very difficult (Atkin, Nowa & Garcia, 2007; Becker, van
Rompay, Schifferstein & Galetzka, 2011; Clement, Kristensen & Grønhaug, 2013; Rasmussen &
Lockshin, 1999). This seems to be especially the case for choosing a specific wine (Barber & Almanza,
2006; Lockshin, 2003). After examining the considerable amount of research, it can be concluded
that there are at least three reasons why choosing wine is a difficult choice for consumers, compared
to other products. First, Sherman and Tuten (2011) note that there are far more wine brands than
there are brands in most other product categories. Second, Rauber (2004 states that wine brands
advertise less compared to other brands (as cited in Sherman & Tuten, 2011, p. 222). Third, Barber
and Almanza (2006) argue that buying wine is considered to be a risky decision, because the quality
of the product can only be tested after the product is bought, that is, during consumption. Fourth,
according to Barber and Almanza (2006), making a wrong decision can be an expensive mistake, as
some wines in the supermarket can cost up to € 15 per bottle. Because of these reasons consumers
can be extremely intimidated by the abundance of choice and even doubt their ability to choose the
right wine, because they fear social rejection if the wrong wine is selected (Olsen, Thompson, &
Clark, 2003; Barber & Almanza, 2006). In order to cope with risks of buying wine consumers use
different risk reducing strategies. One of these strategies that is commonly used involves acquiring
more information using the information at hand (Atkin, Nowa & Garcia, 2007; Becker et all., 2011;
Clement, Kristensen & Grønhaug, 2013; Rasmussen & Lockshin, 1999). For instance, consumers may
gain more information by reading the wine label (Barber and Almanza, 2006; Lockshin & Rhodus,
1993; Olsen et al., 2003). However, Barber and Almanza (2006) say that most consumers believe that
wine labels are intimidating. Another source of information that consumers can consult are the
product tags on the shelf. Product tags contain the price of the wine, the origin, type of grape,
5
flavour and sometimes even a food pairing suggestion. Together with taste, the pairing with food is
the most important motivating factor for drinking wine (Charters & Pettigrew, 2008). One may argue
that the wine-food pairing suggestions on the shelf may influence the wine sales. Indeed, Corsi,
Mueller and Lockshin (2012) acknowledge that pairing with food can influence consumers to buy
more expensive alternatives. In the Netherlands, the majority of the supermarkets have use wine
food pairing suggestions. These wine-food pairing suggestions consists of textual notes that are
added to the wine shelf. However, it is curious that these suggestions are offered in a textual
manner, as literature shows that visual messages are more effective than textual messages.
Furthermore, Townsend and Kahn (2014) state that images are processed by consumers in a manner
that is faster, less deliberate and easier, compared to texts. Besides, consumer prefer visual
information over textual information.
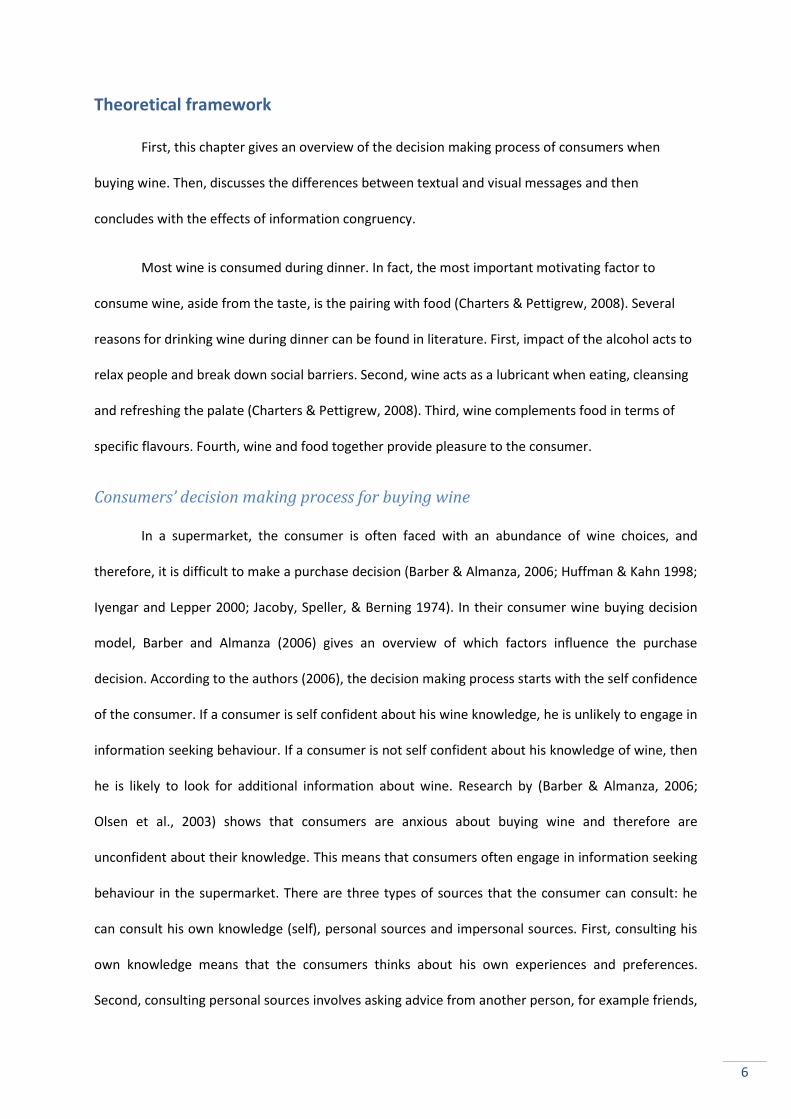
Therefore, this study aims to investigate the extent to which changing textual wine
suggestions to visual wine suggestions would increase wine sales. Therefore the following main
research question has been formulated; Whether and how does visual or textual representation of
the wine-food pairing and congruency of the information influence wine sales?
6
Theoretical framework
First, this chapter gives an overview of the decision making process of consumers when
buying wine. Then, discusses the differences between textual and visual messages and then
concludes with the effects of information congruency.
Most wine is consumed during dinner. In fact, the most important motivating factor to
consume wine, aside from the taste, is the pairing with food (Charters & Pettigrew, 2008). Several
reasons for drinking wine during dinner can be found in literature. First, impact of the alcohol acts to
relax people and break down social barriers. Second, wine acts as a lubricant when eating, cleansing
and refreshing the palate (Charters & Pettigrew, 2008). Third, wine complements food in terms of
specific flavours. Fourth, wine and food together provide pleasure to the consumer.
Consumers’ decision making process for buying wine
In a supermarket, the consumer is often faced with an abundance of wine choices, and
therefore, it is difficult to make a purchase decision (Barber & Almanza, 2006; Huffman & Kahn 1998;
Iyengar and Lepper 2000; Jacoby, Speller, & Berning 1974). In their consumer wine buying decision
model, Barber and Almanza (2006) gives an overview of which factors influence the purchase
decision. According to the authors (2006), the decision making process starts with the self confidence
of the consumer. If a consumer is self confident about his wine knowledge, he is unlikely to engage in
information seeking behaviour. If a consumer is not self confident about his knowledge of wine, then
he is likely to look for additional information about wine. Research by (Barber & Almanza, 2006;
Olsen et al., 2003) shows that consumers are anxious about buying wine and therefore are
unconfident about their knowledge. This means that consumers often engage in information seeking
behaviour in the supermarket. There are three types of sources that the consumer can consult: he
can consult his own knowledge (self), personal sources and impersonal sources. First, consulting his
own knowledge means that the consumers thinks about his own experiences and preferences.
Second, consulting personal sources involves asking advice from another person, for example friends,

7
family or even unfamiliar people like sales personnel. Third, consulting impersonal sources involves
gathering information from non human sources, such as wine guides, advertisements and television
programs. This last category, impersonal sources, are considered to be most influential in the wine
information seeking process (Barber & Almanza, 2006; Olsen et al., 2003). Among the impersonal
sources, research has shown that labels, label design, and product information delivered via the label
or shelf tag (being grape, brand name, and price) are among the most important cues consumers use
in the wine choice decision (Barber and Almanza, 2006; Lockshin & Rhodus, 1993; Olsen et al., 2003;
Sherman & Tuten, 2011; Thomas, 2000; Thomas & Pickering, 2003).
For supermarkets this means that, if they want to influence consumers' decision making
process for buying wine, it is advisable to focus on the impersonal sources. Thus, if they want to help
consumers in their decision making process, they should provide (additional) information through
impersonal sources, for example the wine label or shelf tag. For supermarkets, it is difficult to make
changes to the content of the label, while they can create any shelf tag they like. Therefore, this
framework will further investigate the potential of the shelf tag.
The influence of shelf tags: Information presentation
The wine tags on the supermarket shelf often contains a large amount of information about
the product. For example, it indicates the price, origin, type of grape used, flavour and often also a
food pairing suggestion. As mentioned earlier on, these wine-food pairing suggestions are presented
in a textual form, while research has shown that messages in visual form are more effective than the
same messages in textual form (Mitchell, 1986). There are several reasons that explain why visual
messages are more effective than textual messages. First of all, previous research has found that
images are processed in a way that is faster and less deliberate than texts, and therefore feels easier
to process for consumers (Townsend & Kahn, 2014). Furthermore, Townsend and Kahn (2014) state
that images are often processed automatically. Second, the connection between an image and its
meaning is more direct that the connection between a word and its meaning (Townsend & Kahn,
8
2014). Third, research studies have shown that visual messages are easier to remember than textual
messages (Mitchell, 1986). Fourth, Sharafi and others (2013) argue that consumer prefer information
to be presented in a visual form over a textual form. Townsend and Kahn (2014) found that even
when participants perform better in a condition with a textual description they were likely to say the
task would have been easier if the task was performed with information in a visual format. Fifth, a
study by Pieters and Warlop (1999) shows that consumers under high time pressure tend to skip
more textual elements than visual elements. Also Silayoi and Speece (2004) acknowledge that visual
elements are especially important in the decision making process when consumers are under time
pressure, because consumers who spend less time contemplating on each product, have reduced
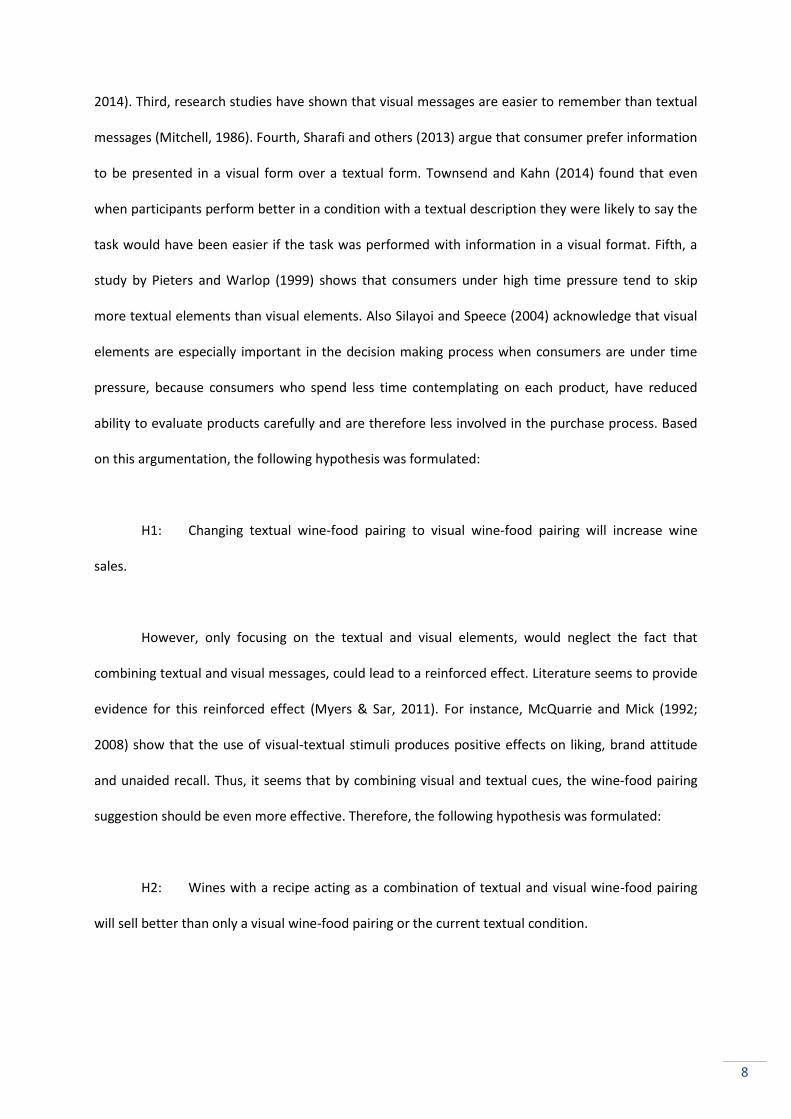
ability to evaluate products carefully and are therefore less involved in the purchase process. Based
on this argumentation, the following hypothesis was formulated:
H1: Changing textual wine-food pairing to visual wine-food pairing will increase wine
sales.
However, only focusing on the textual and visual elements, would neglect the fact that
combining textual and visual messages, could lead to a reinforced effect. Literature seems to provide
evidence for this reinforced effect (Myers & Sar, 2011). For instance, McQuarrie and Mick (1992;
2008) show that the use of visual-textual stimuli produces positive effects on liking, brand attitude
and unaided recall. Thus, it seems that by combining visual and textual cues, the wine-food pairing
suggestion should be even more effective. Therefore, the following hypothesis was formulated:
H2: Wines with a recipe acting as a combination of textual and visual wine-food pairing
will sell better than only a visual wine-food pairing or the current textual condition.
9
The influence of shelf tags: congruency vs. Incongruency
When investigating the influence of wine food pairings on sales, another factor that should
be taken into account is the extent to which a food suggestion ‘fits’ the wine, that is, the congruency
of the food wine pairing. Congruency can be explained as a stimulus that fits (congruent) or does not
fit (incongruent) the product (Jae et al., 2008). This might be an important factor to take into
consideration, because research studies have shown that congruency of products can lead to an
increase in sales (North, Hargreaves and McKendrick; 1999, Yeoh and North 2010; 2011). For
instance, North et al. (1999) show that French wine sells better than German wine when the music in
the background is French, while German wine sells better than French wine if the background music
is German. Therefore, the researchers (1999) conclude that wine with congruent music in the
background sells better than other wines. By the same vein, Yeoh and North (2010) use Malaysian
and Indian music in the background as a prime to influence the choice of consumers on two
competing foods. When Malaysian music played, participants mostly choose for Malaysian food and
when Indian music is played, participants mostly choose for Indian food. However, the authors
(2010) also note that this result was only found when participants had no pre-existing preference for
one of the two foods. Further, in a later study with petrol, Yeoh and North (2011) found that brand
preferences were not affected by the advertisements among participants who were regular users of
one of the brands. However, participants who were not regular users of one or both brands, showed
a preference for the brand advertised with music that fitted the brand attributes. Lastly study by
Myers and Sar (2011) shows that combining visual and textual cues can lead to an enhanced effect of
the advertising effort if the visual and textual message were congruent with the product, thereby
increasing the influence on sales. To conclude, previous research shows that congruency should lead
to increased sales (North, Hargreaves and McKendrick; 1999, Yeoh and North 2010; 2011). For a
wine-food pairing this means that a wine should sell better if the dish in the pairing is congruent, in
other words, the dish should fit the wine. Therefore, the following hypothesis was formulated:
10
H3: Wine in conditions in which the textual and visuals stimuli are congruent with the
type of wine will sell better than wine in which these stimuli are incongruent.

11
Research Model
As mentioned earlier on, current literature states that most consumers are not self confident
about their wine knowledge, and therefore want to gain more information about the wine (Barber &
Almanza, 2006; Olsen et al., 2003). In order to gather more information, they prefer to consult
impersonal sources, such as reading the wine labels or shelf tags (Barber & Almanza, 2006; Olsen et
al., 2003). Information on the labels and shelf tags are therefore considered to be the most
important cues when buying a wine (Barber and Almanza, 2006; Lockshin & Rhodus, 1993; Olsen et
al., 2003; Sherman & Tuten, 2011; Thomas, 2000; Thomas & Pickering, 2003).
From a perspective of a supermarket, it is difficult to influence the content of a label on a
wine bottle. On the other hand, the shelf tag is easier to alter for a supermarket. The information on
a shelf tag can therefore be manipulated by supermarkets.
Wine food pairings on the shelf tag can be presented in visual or textual form, although
supermarkets currently only use textual shelf tags. However, research has shown that visual
information in advertising is more effective than textual information (Mitchell, 1986). Therefore, it is
likely that visual wine-food pairings have a greater influence on sales than textual wine-food pairings.
Furthermore, Myers and Sar (2011) state that combining textual and visual information in a message
can lead to an enhanced effect of the advertising effort, thereby increasing the influence on sales.
Therefore, it is expected that combining textual and visual wine-food pairings, will have a greater
influence on sales, than only a textual wine-food pairing or only a visual wine-food pairing.
Next, several studies have shown that congruency has a great impact on the effectiveness of
a stimulus (North et al., 1999; Yeoh & North 2010; 2011). Furthermore, concerning the congruency of
the wine-food pairings, it is likely that if a wine-food pairing is congruent with the wine, it will lead to
a greater influence on sales than if the wine-food pairing is incongruent with the wine.
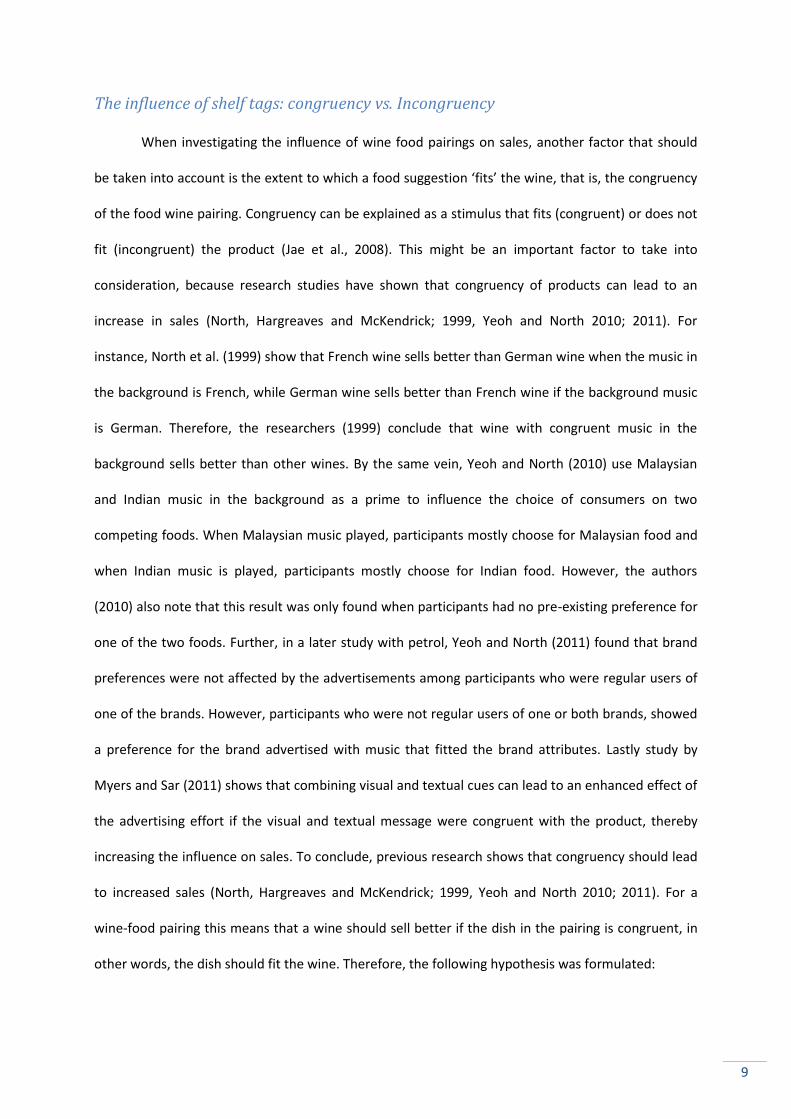
Based this literature, a research model can be created, which can be found in Figure 1. As can
be seen in the model, both textual and visual information influence sales, although visual information
has a greater effect than textual information. However, when these two types of information are
12
combined, this effect is even stronger. Furthermore, congruency of information and wine also
influences sales, in the sense that congruent wine-food pairings lead to higher sales than incongruent
wine-food pairings.
Figure 1. Impact of textual and visual information on purchases decision model.
13
Explorative marketing research
Before the empirical research could start, it was important to first investigate the current
situation by exploring how supermarkets currently use shelf tags. In order to do so, the researcher
visited all A-brand supermarkets in Enschede. It was not necessary to visit the same supermarkets in
other cities, because these supermarkets use standard formulas, implying that all supermarkets in
the Netherlands use the same shelf tags. Four supermarkets were visited (Albert Heijn, Coop, Emté
and Jumbo). Based on these visits, it can be concluded that all A-brand supermarkets use shelf tags of
wine to provide wine-food pairing suggestions. Furthermore, all these wine-food pairings were
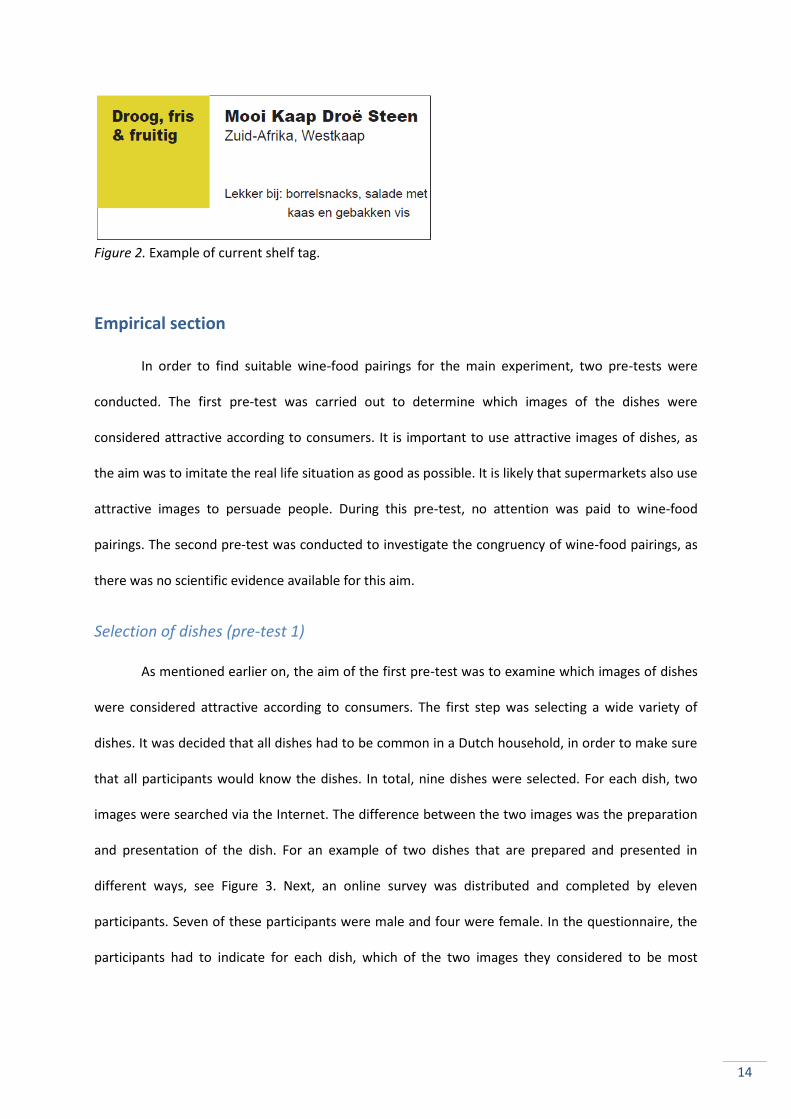
presented in a textual form. An example of a shelf tag with a food-pairing suggestion can be found in
Figure 2.
However, this study also wants to investigate whether congruency has an effect on sales
rates. Therefore, it was necessary to explore examples of congruent and incongruent wine-food
pairings. A large amount of information on this subject can be found in popular media, such as food-
related websites, culinary magazines, and published sommeliers. However, scientific, peer reviewed
studies, which have examined the ideal or preferred combination of certain foods and wines, have
hardly been performed (Harrington & Hammond, 2005, 2006; King & Cliff, 2005).Thus, although all A-
brand supermarkets use wine shelf tags to provide wine-food pairings, it is not scientifically
investigated whether these pairings are congruent or incongruent. Because this study did not want
to rely on media sources, two pre-tests were performed, to explore congruent and incongruent wine-
food pairings. These pre-tests will be discussed in the next section.
14
Figure 2. Example of current shelf tag.
Empirical section
In order to find suitable wine-food pairings for the main experiment, two pre-tests were
conducted. The first pre-test was carried out to determine which images of the dishes were
considered attractive according to consumers. It is important to use attractive images of dishes, as
the aim was to imitate the real life situation as good as possible. It is likely that supermarkets also use
attractive images to persuade people. During this pre-test, no attention was paid to wine-food
pairings. The second pre-test was conducted to investigate the congruency of wine-food pairings, as
there was no scientific evidence available for this aim.
Selection of dishes (pre-test 1)
As mentioned earlier on, the aim of the first pre-test was to examine which images of dishes
were considered attractive according to consumers. The first step was selecting a wide variety of
dishes. It was decided that all dishes had to be common in a Dutch household, in order to make sure
that all participants would know the dishes. In total, nine dishes were selected. For each dish, two
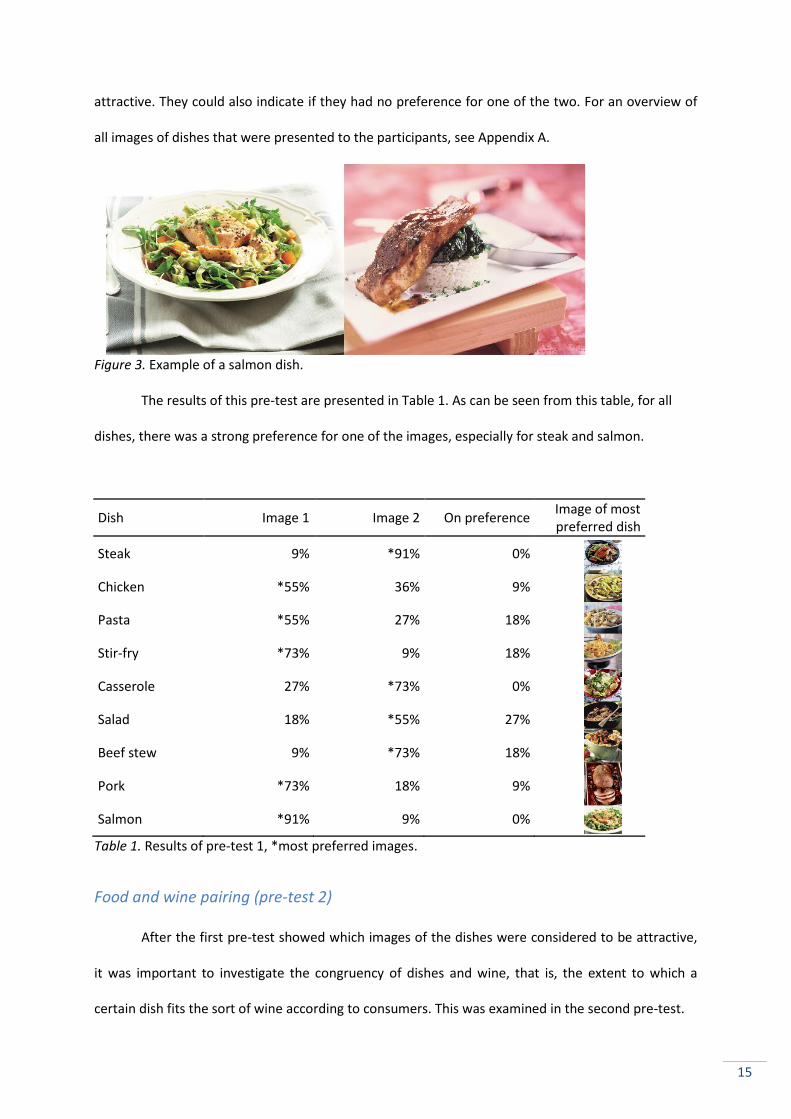
images were searched via the Internet. The difference between the two images was the preparation
and presentation of the dish. For an example of two dishes that are prepared and presented in
different ways, see Figure 3. Next, an online survey was distributed and completed by eleven
participants. Seven of these participants were male and four were female. In the questionnaire, the
participants had to indicate for each dish, which of the two images they considered to be most
15
attractive. They could also indicate if they had no preference for one of the two. For an overview of
all images of dishes that were presented to the participants, see Appendix A.
Figure 3. Example of a salmon dish.
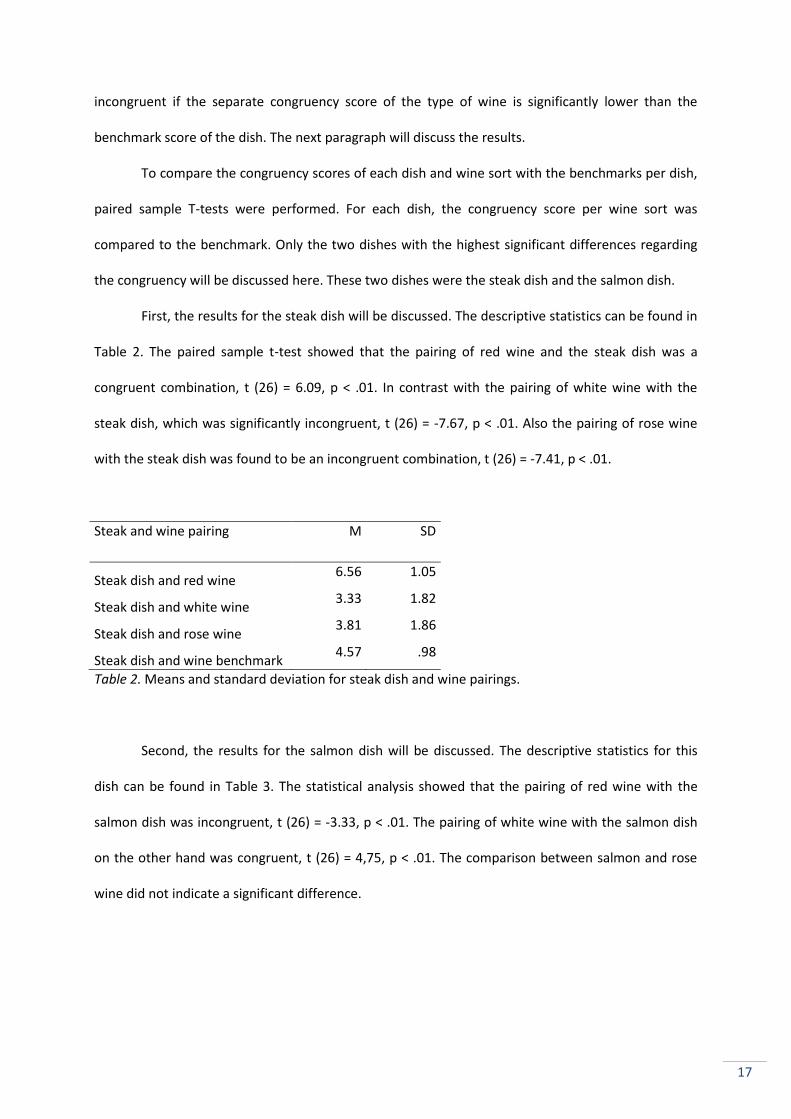
The results of this pre-test are presented in Table 1. As can be seen from this table, for all
dishes, there was a strong preference for one of the images, especially for steak and salmon.
Dish Image 1 Image 2 On preference Image of most preferred dish
Steak 9% *91% 0%
Chicken *55% 36% 9%
Pasta *55% 27% 18%
Stir-fry *73% 9% 18%
Casserole 27% *73% 0%
Salad 18% *55% 27%
Beef stew 9% *73% 18%
Pork *73% 18% 9%
Salmon *91% 9% 0%
Table 1. Results of pre-test 1, *most preferred images.
Food and wine pairing (pre-test 2)
After the first pre-test showed which images of the dishes were considered to be attractive,
it was important to investigate the congruency of dishes and wine, that is, the extent to which a
certain dish fits the sort of wine according to consumers. This was examined in the second pre-test.

16
Again an online survey was conducted. In total, 27 participants completed the questionnaire,
of which 16 were male and 11 were female. The mean age of the participants was 29.7 (SD = 13.4). In
order to examine the congruency of dishes and wine, the respondents were asked to indicate the
extent to which they thought a certain dish matched a certain type of wine. The most attractive
images of the dishes, as was found in the first pre-test, were used. The types of wine were red, white
and rose. Respondents had to indicate the congruency of the dish on a 7 point Likert scale, 1 being
very incompatible and 7 being very compatible. Furthermore, for each dish, a few control variables
were taken into account, namely the attractiveness and the perceived ease of preparation of the
dish. Participants were asked to rate the attractiveness of each dish on a 7 point Likert scale, 1 being
very unattractive, 7 being very attractive. Measuring the attractiveness of each dish allowed the
researcher to compare the attractiveness of the dishes, which could not be measured by the first
pre-test. This was important to make sure that there was no significant difference in attractiveness
between the dishes, because this could influence the results of the main experiment. This also counts
for perceived ease of preparation, which was measured on a 7 point Likert scale, 1 being very easy to
prepare and 7 being very hard to prepare. It was also important that there was no difference in
perceived ease of preparation, because this could also influence the results. For an overview of all
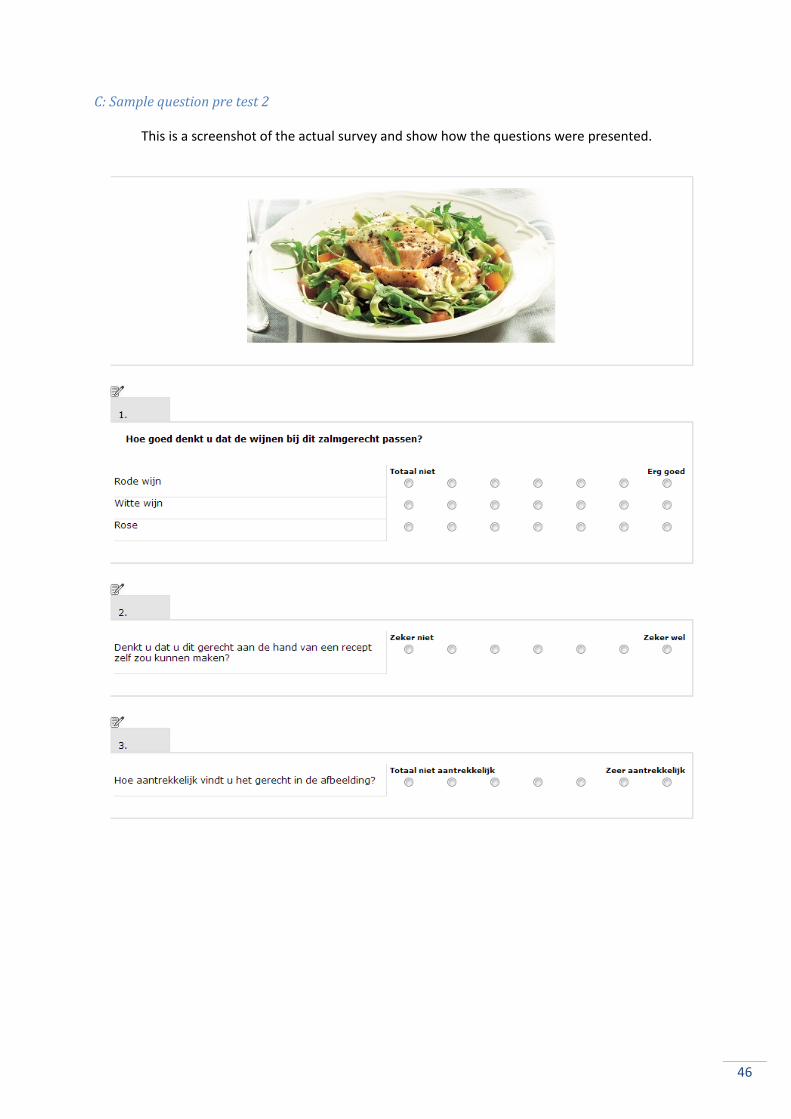
images of dishes that were used, see Appendix B. For an example of one dish with the accompanying
questions, see Appendix C. Of course, for all dishes, the same questions were asked.
To determine which wine-food pairings are congruent and which ones are incongruent, a few
steps had to be taken. First, for each dish an average congruency score was calculated, the so called
benchmark score. This score indicates the degree to which a certain type of dish fits with wine in
general. The second step was to calculate average congruency scores of each dish per type of wine.
For each dish a score was calculated per red, white and rose wine. The third step was comparing
these separate congruency scores with the benchmark scores. A dish and a wine sort were
considered to be congruent if the separate congruency score of that type of wine is significantly
higher than the benchmark score of that dish. Similarly, a dish and a wine sort were considered to be
17
incongruent if the separate congruency score of the type of wine is significantly lower than the
benchmark score of the dish. The next paragraph will discuss the results.
To compare the congruency scores of each dish and wine sort with the benchmarks per dish,
paired sample T-tests were performed. For each dish, the congruency score per wine sort was
compared to the benchmark. Only the two dishes with the highest significant differences regarding
the congruency will be discussed here. These two dishes were the steak dish and the salmon dish.
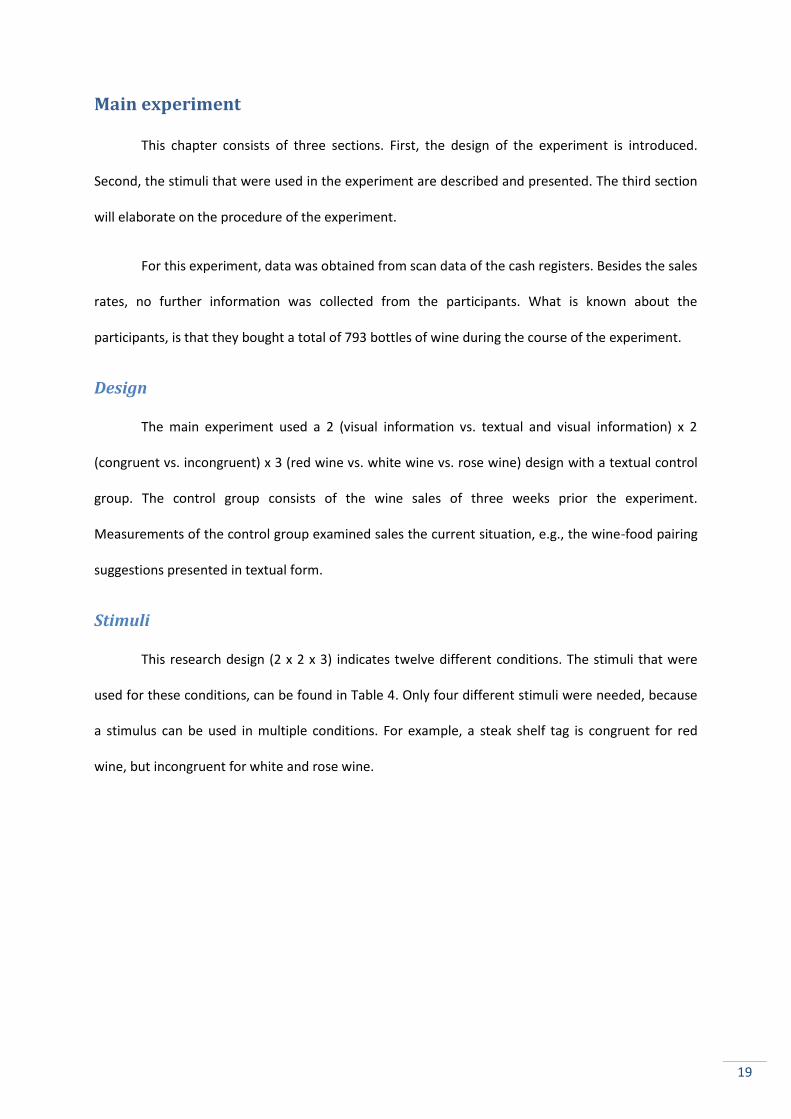
First, the results for the steak dish will be discussed. The descriptive statistics can be found in
Table 2. The paired sample t-test showed that the pairing of red wine and the steak dish was a
congruent combination, t (26) = 6.09, p < .01. In contrast with the pairing of white wine with the
steak dish, which was significantly incongruent, t (26) = -7.67, p < .01. Also the pairing of rose wine
with the steak dish was found to be an incongruent combination, t (26) = -7.41, p < .01.
Steak and wine pairing M SD
Steak dish and red wine 6.56 1.05
Steak dish and white wine 3.33 1.82
Steak dish and rose wine 3.81 1.86
Steak dish and wine benchmark 4.57 .98
Table 2. Means and standard deviation for steak dish and wine pairings.
Second, the results for the salmon dish will be discussed. The descriptive statistics for this
dish can be found in Table 3. The statistical analysis showed that the pairing of red wine with the
salmon dish was incongruent, t (26) = -3.33, p < .01. The pairing of white wine with the salmon dish
on the other hand was congruent, t (26) = 4,75, p < .01. The comparison between salmon and rose
wine did not indicate a significant difference.

18
Salmon and wine pairing M SD
Salmon dish and red wine 3.30 1.94
Salmon dish and white wine 5.81 1.44
Salmon dish and rose wine 4.33 1.71
Salmon dish and benchmark 4.48 .70
Table 3. Means and standard deviation for salmon dish and wine pairings.
A notable result is that there was no wine-food pairing in which rose wine was found to be
congruent with the dish. Therefore Popular media source were advised to find a congruent food for
rose wine. Popular media view the pairing of rose with a salmon dish as a good combination, for this
reason the salmon dish will also be used as the preferred dish for rose wine.
Furthermore, the control questions were analysed. For measuring if there was a statistical
difference of the attractiveness of the dishes, also paired sample t-tests were performed. No
significant difference was found in attractiveness of the steak dish (M = 5.78 SD = 1.22) compared to
the salmon dish (M = 5.22 SD = 1.25). Also for measuring if there was a statistical difference in the
perceived ease of preparation, paired sample t-tests were used. The results showed that there was
no significant difference between the steak dish (M = 6.15 SD = 1.59) and the salmon dish (M = 5.81
SD = 1.47). Therefore it can be concluded that there are no significant differences of the
attractiveness and ease of preparation of the two dishes and that it is unlikely that this may influence
the results of the main experiment.
19
Main experiment
This chapter consists of three sections. First, the design of the experiment is introduced.
Second, the stimuli that were used in the experiment are described and presented. The third section
will elaborate on the procedure of the experiment.
For this experiment, data was obtained from scan data of the cash registers. Besides the sales
rates, no further information was collected from the participants. What is known about the
participants, is that they bought a total of 793 bottles of wine during the course of the experiment.
Design
The main experiment used a 2 (visual information vs. textual and visual information) x 2
(congruent vs. incongruent) x 3 (red wine vs. white wine vs. rose wine) design with a textual control
group. The control group consists of the wine sales of three weeks prior the experiment.
Measurements of the control group examined sales the current situation, e.g., the wine-food pairing
suggestions presented in textual form.
Stimuli
This research design (2 x 2 x 3) indicates twelve different conditions. The stimuli that were
used for these conditions, can be found in Table 4. Only four different stimuli were needed, because
a stimulus can be used in multiple conditions. For example, a steak shelf tag is congruent for red
wine, but incongruent for white and rose wine.

20
Type of wine Congruent Visual or textual/visual Stimulus
Red Yes Visual Steak shelf tag
Yes Textual/visual Steak recipe
No Visual Salmon shelf tag
No Textual/visual Salmon recipe
White Yes Visual Salmon shelf tag
Yes Textual/visual Salmon recipe
No Visual Steak shelf tag
No Textual/visual Steak recipe
Rose Yes Visual Salmon shelf tag
Yes Textual/visual Salmon recipe
No Visual Steak shelf tag
No Textual/visual Steak recipe
Table 4,The 12 research conditions with matching stimuli.
The first stimulus is a steak shelf tag, the second one is a salmon shelf tag, the third one is a
steak recipe and the fourth one is a salmon recipe. All these stimuli will be further described in the
following sections.
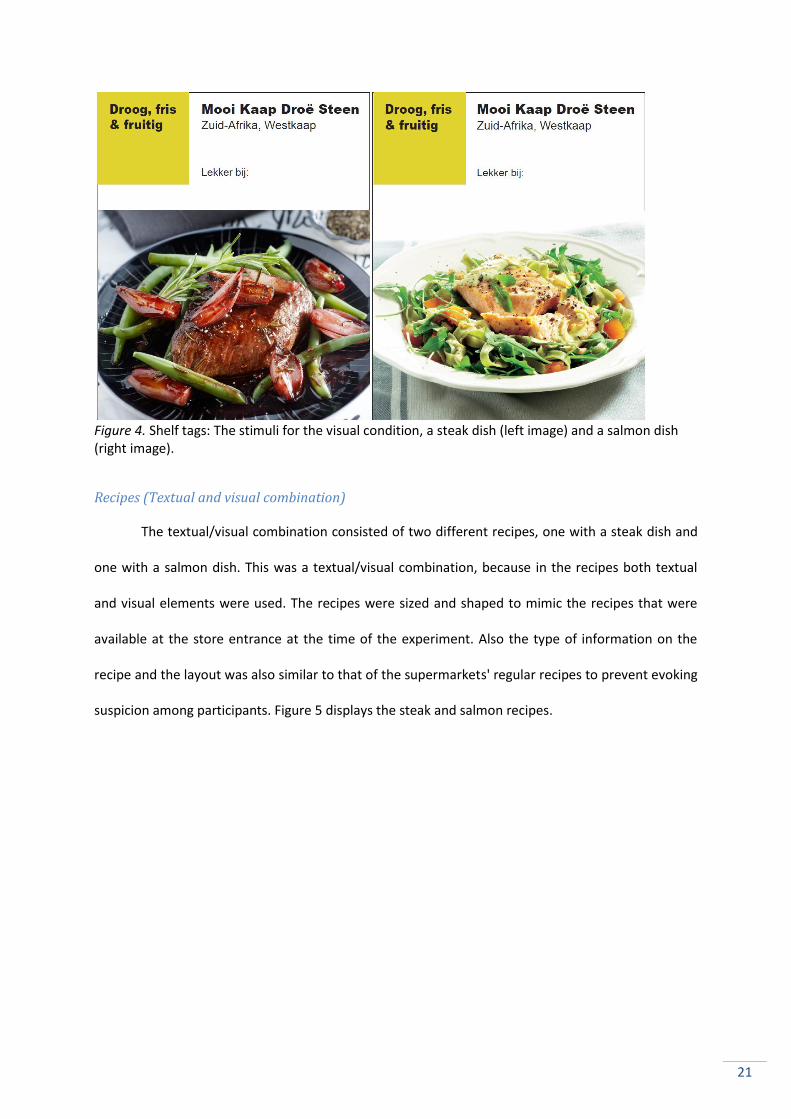
Shelf tags (Visual condition)
The visual stimuli consisted of two different shelf tags, one with a steak dish and one with a
salmon dish. The shelf tags that were created were twice the size of the original to allow consumers
to clearly see the image. Figure 4 displays the steak and salmon shelf tags (Appendix D shows the
steak and salmon shelf tag adjusted for all three wines).
21
Figure 4. Shelf tags: The stimuli for the visual condition, a steak dish (left image) and a salmon dish (right image).
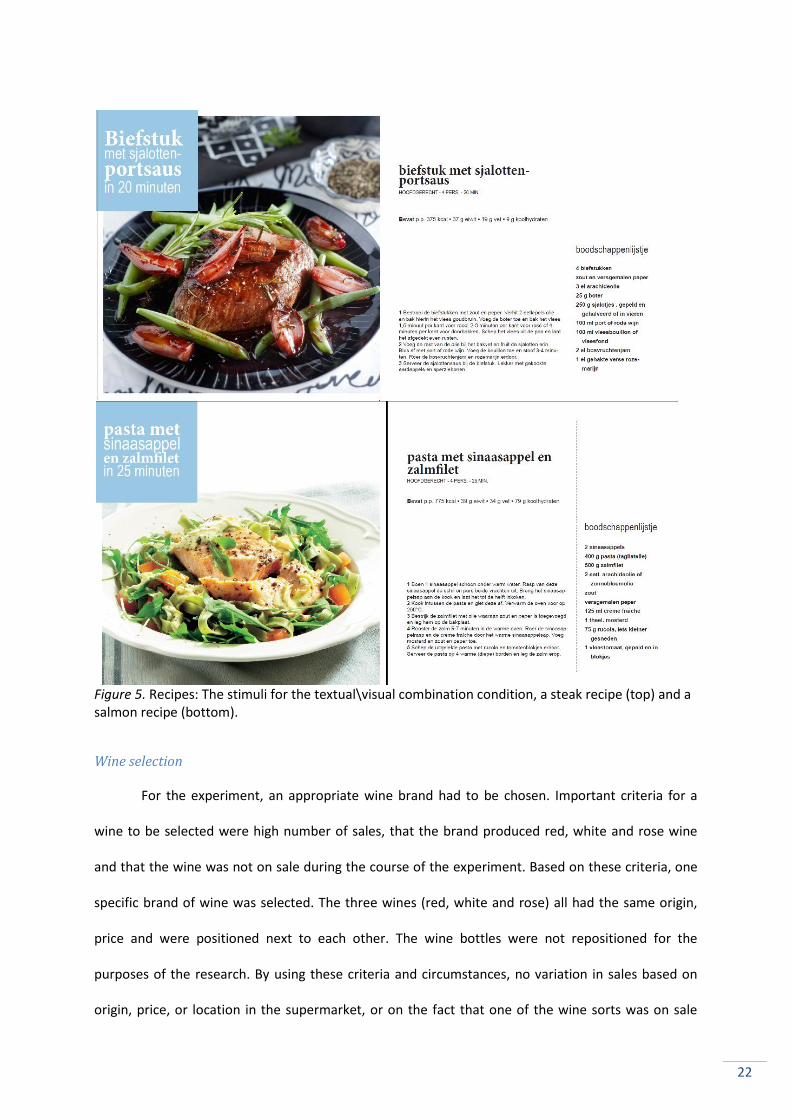
Recipes (Textual and visual combination)
The textual/visual combination consisted of two different recipes, one with a steak dish and
one with a salmon dish. This was a textual/visual combination, because in the recipes both textual
and visual elements were used. The recipes were sized and shaped to mimic the recipes that were
available at the store entrance at the time of the experiment. Also the type of information on the
recipe and the layout was also similar to that of the supermarkets' regular recipes to prevent evoking
suspicion among participants. Figure 5 displays the steak and salmon recipes.
22
Figure 5. Recipes: The stimuli for the textual\visual combination condition, a steak recipe (top) and a salmon recipe (bottom).
Wine selection
For the experiment, an appropriate wine brand had to be chosen. Important criteria for a
wine to be selected were high number of sales, that the brand produced red, white and rose wine
and that the wine was not on sale during the course of the experiment. Based on these criteria, one
specific brand of wine was selected. The three wines (red, white and rose) all had the same origin,
price and were positioned next to each other. The wine bottles were not repositioned for the
purposes of the research. By using these criteria and circumstances, no variation in sales based on
origin, price, or location in the supermarket, or on the fact that one of the wine sorts was on sale
23
could occur. The price of the selected wine was € 2.69 per bottle, which is considered as relatively
cheap, as most wines cost around € 6.00 per bottle, while some can cost € 15.00 per bottle.
Procedure
The main experiment was executed in an A-brand supermarket in the city suburbs of
Enschede in the Netherlands. The course of the experiment lasted four weeks. During these weeks,
each day a single condition was tested. Every four days, all conditions were tested once. For all three
wine sorts, the same condition was tested, on one day. The experiment ran all day during weekdays
and on Saturday. Opening hours of the store were 8:00 a.m. till 8:00 p.m. on Monday through
Thursday and on Saturday 8:00 a.m. till 9:00 p.m. on Friday. On Sunday the experiment was halted
due to the limited opening hours in comparison to the other days (16:00 p.m. till 19.00 p.m.).
Conditions were adjusted every day, within 10 minutes after the store opened. See Appendix E for
the full experiment execution scheme.
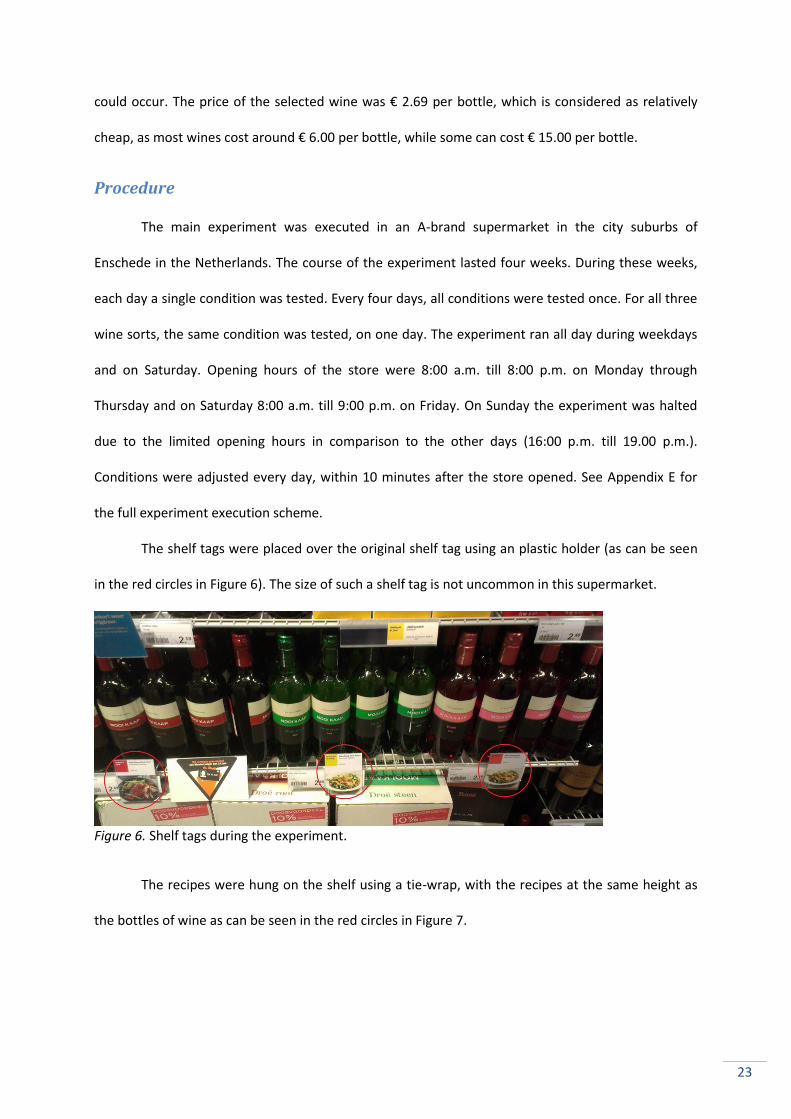
The shelf tags were placed over the original shelf tag using an plastic holder (as can be seen
in the red circles in Figure 6). The size of such a shelf tag is not uncommon in this supermarket.
Figure 6. Shelf tags during the experiment.
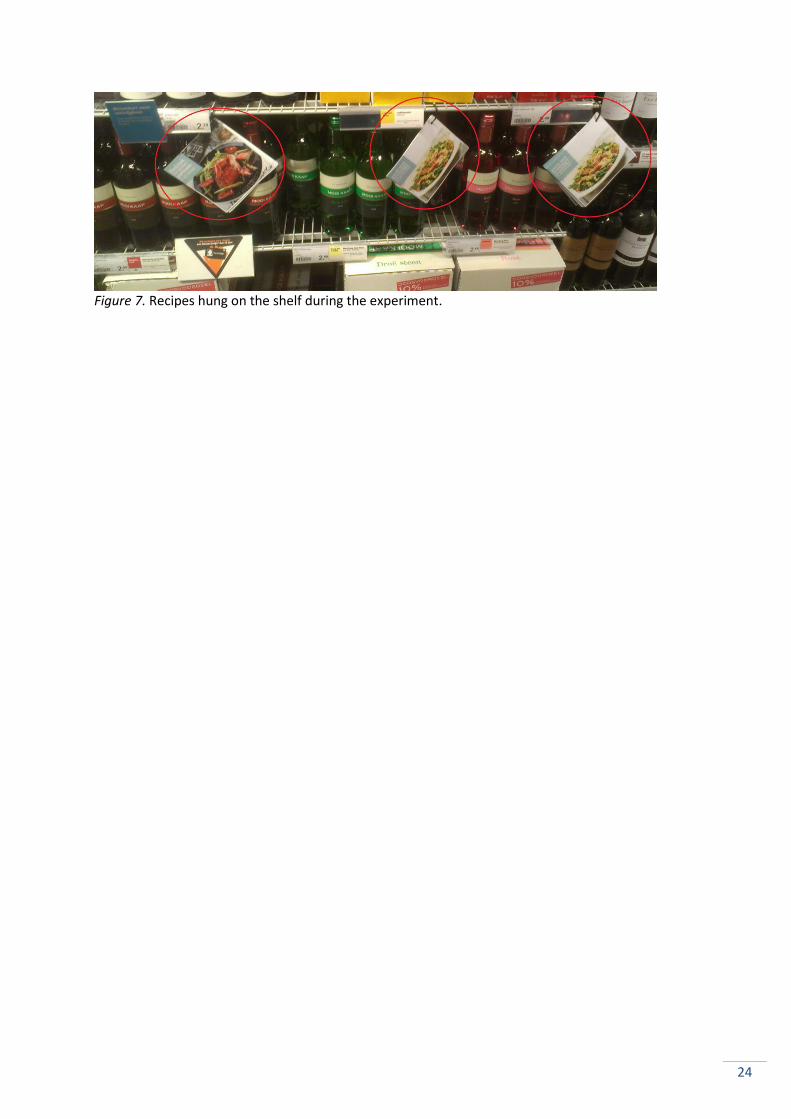
The recipes were hung on the shelf using a tie-wrap, with the recipes at the same height as
the bottles of wine as can be seen in the red circles in Figure 7.
24
Figure 7. Recipes hung on the shelf during the experiment.
25
Results
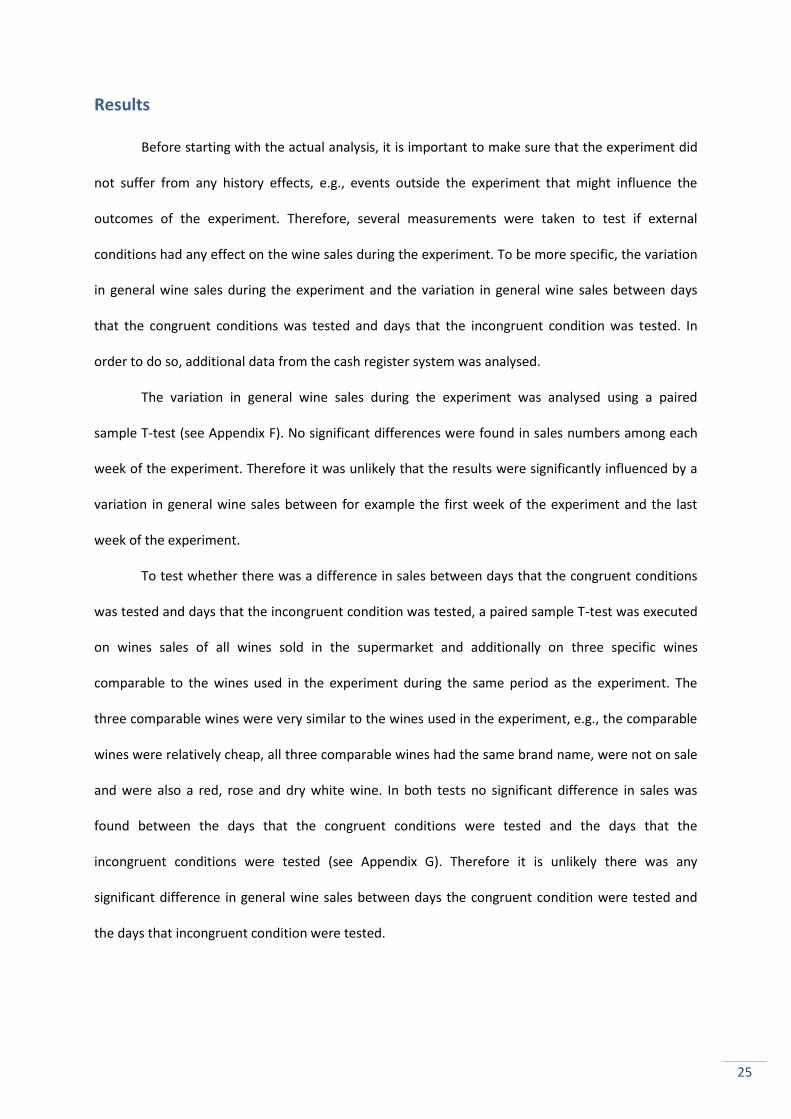
Before starting with the actual analysis, it is important to make sure that the experiment did
not suffer from any history effects, e.g., events outside the experiment that might influence the
outcomes of the experiment. Therefore, several measurements were taken to test if external
conditions had any effect on the wine sales during the experiment. To be more specific, the variation
in general wine sales during the experiment and the variation in general wine sales between days
that the congruent conditions was tested and days that the incongruent condition was tested. In
order to do so, additional data from the cash register system was analysed.
The variation in general wine sales during the experiment was analysed using a paired
sample T-test (see Appendix F). No significant differences were found in sales numbers among each
week of the experiment. Therefore it was unlikely that the results were significantly influenced by a
variation in general wine sales between for example the first week of the experiment and the last
week of the experiment.
To test whether there was a difference in sales between days that the congruent conditions
was tested and days that the incongruent condition was tested, a paired sample T-test was executed
on wines sales of all wines sold in the supermarket and additionally on three specific wines
comparable to the wines used in the experiment during the same period as the experiment. The
three comparable wines were very similar to the wines used in the experiment, e.g., the comparable
wines were relatively cheap, all three comparable wines had the same brand name, were not on sale
and were also a red, rose and dry white wine. In both tests no significant difference in sales was
found between the days that the congruent conditions were tested and the days that the
incongruent conditions were tested (see Appendix G). Therefore it is unlikely there was any
significant difference in general wine sales between days the congruent condition were tested and
the days that incongruent condition were tested.

26
A Kolmogorov-Smirnov was used to assess the normality of the distribution of the sample. A
non-significant result indicates normality. All items in the sample are non-significant which suggests
the sample is normally distributed.
The data from the experiment was analysed in 2 stages. First, a general analyses for the way
the wine-food pairing is presented. Second, analysing the data for each wine individually.
Information presentation
To analyse whether changing the wine-food pairing suggestion from textual to visual
increased the general wine sales, a paired sample T-test has been performed. There was no
significant difference found between the mean sales of the original textual (or control) condition (M
= 6.75, SD = 4.30) and visual (M = 7.61, SD = 5.72) condition. There was also no difference found in
sales of the textual (M = 6.75, SD = 4.30) and the textual/visual combination condition (M = 7.67, SD
= 4.13). An overview of the data can be seen in Figure 8.
Figure 8. Mean wine sales per information presentation condition.
5
5,5
6
6,5
7
7,5
8
Bottles of wine sold per day
Type of information
Textual (control)
Visual
Textual/visual
27
Effect for each wine individually
The effects of visual vs. textual/visual combination wine-food pairing in combined with the
effects of congruency of information on wine sales were tested for each of the tree wines individually
using a two-way ANOVA. Analyses between the four conditions and the textual control have been
done using a paired sample T-test.
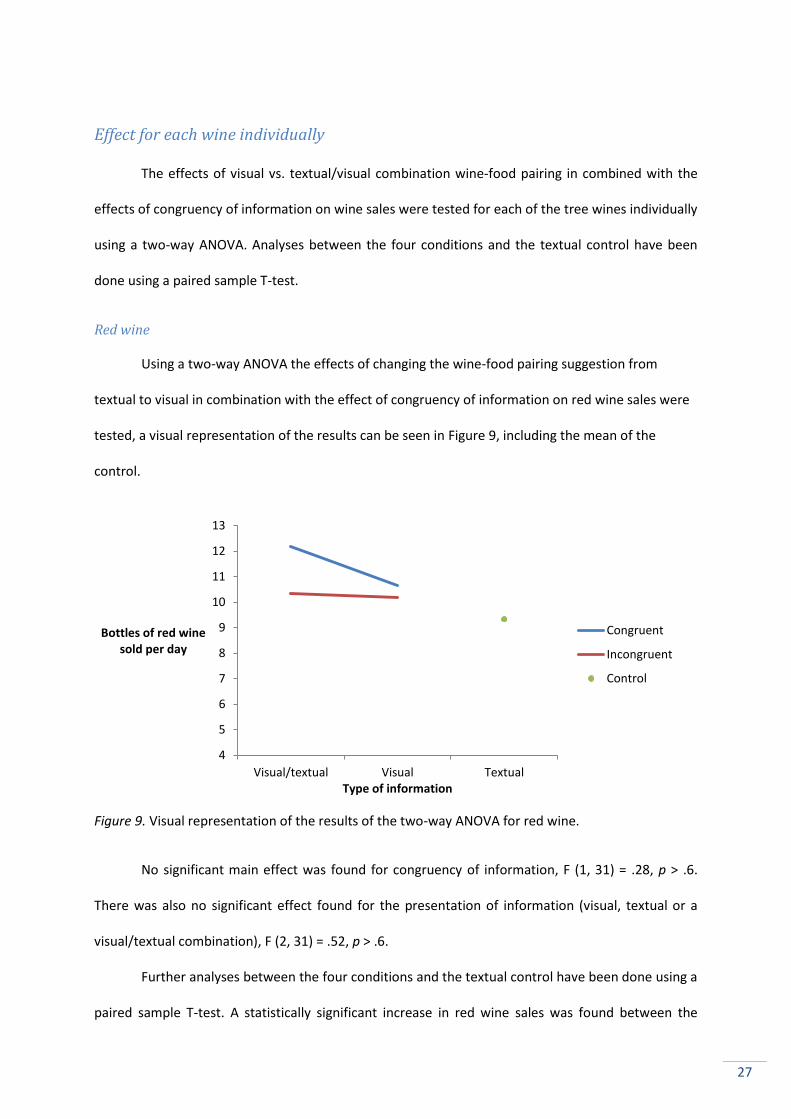
Red wine
Using a two-way ANOVA the effects of changing the wine-food pairing suggestion from
textual to visual in combination with the effect of congruency of information on red wine sales were
tested, a visual representation of the results can be seen in Figure 9, including the mean of the
control.
Figure 9. Visual representation of the results of the two-way ANOVA for red wine.
No significant main effect was found for congruency of information, F (1, 31) = .28, p > .6.
There was also no significant effect found for the presentation of information (visual, textual or a
visual/textual combination), F (2, 31) = .52, p > .6.
Further analyses between the four conditions and the textual control have been done using a
paired sample T-test. A statistically significant increase in red wine sales was found between the
4
5
6
7
8
9
10
11
12
13
Visual/textual Visual Textual
Bottles of red wine sold per day
Type of information
Congruent
Incongruent
Control
28
congruent textual/visual combination condition (M = 12.17, SD = 1.47) and the textual control
condition (M = 8.50, SD = 2.88), t (5) = 2.98, P = .03. The increase in mean wine sales was 43% or 3.67
bottles per day. No significant difference was found between other conditions and the textual
control group.
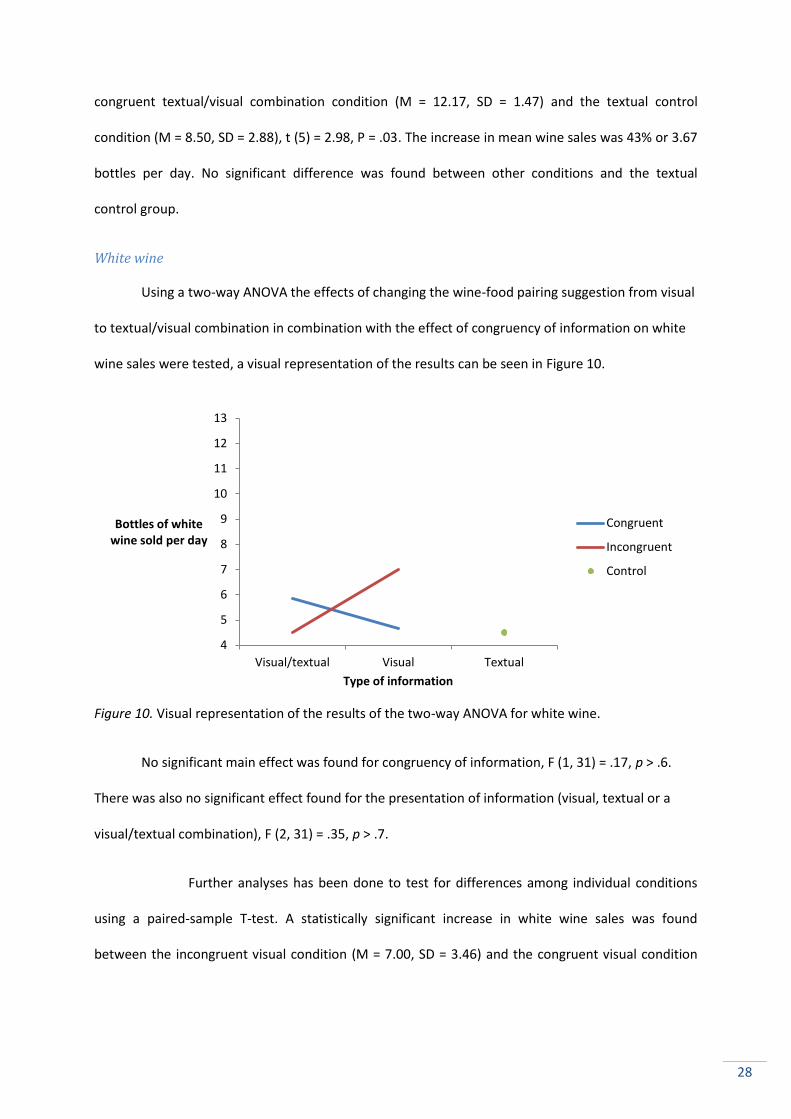
White wine
Using a two-way ANOVA the effects of changing the wine-food pairing suggestion from visual
to textual/visual combination in combination with the effect of congruency of information on white
wine sales were tested, a visual representation of the results can be seen in Figure 10.
Figure 10. Visual representation of the results of the two-way ANOVA for white wine.
No significant main effect was found for congruency of information, F (1, 31) = .17, p > .6.
There was also no significant effect found for the presentation of information (visual, textual or a
visual/textual combination), F (2, 31) = .35, p > .7.
Further analyses has been done to test for differences among individual conditions
using a paired-sample T-test. A statistically significant increase in white wine sales was found
between the incongruent visual condition (M = 7.00, SD = 3.46) and the congruent visual condition
4
5
6
7
8
9
10
11
12
13
Visual/textual Visual Textual
Bottles of white wine sold per day
Type of information
Congruent
Incongruent
Control
29
(M = 4.67, SD = 2.66) , t (5) = -2.91, P = .03. The increase in mean wine sales was 62% or 2.67 bottles
per day. No significant difference was found between other conditions and the textual control group.
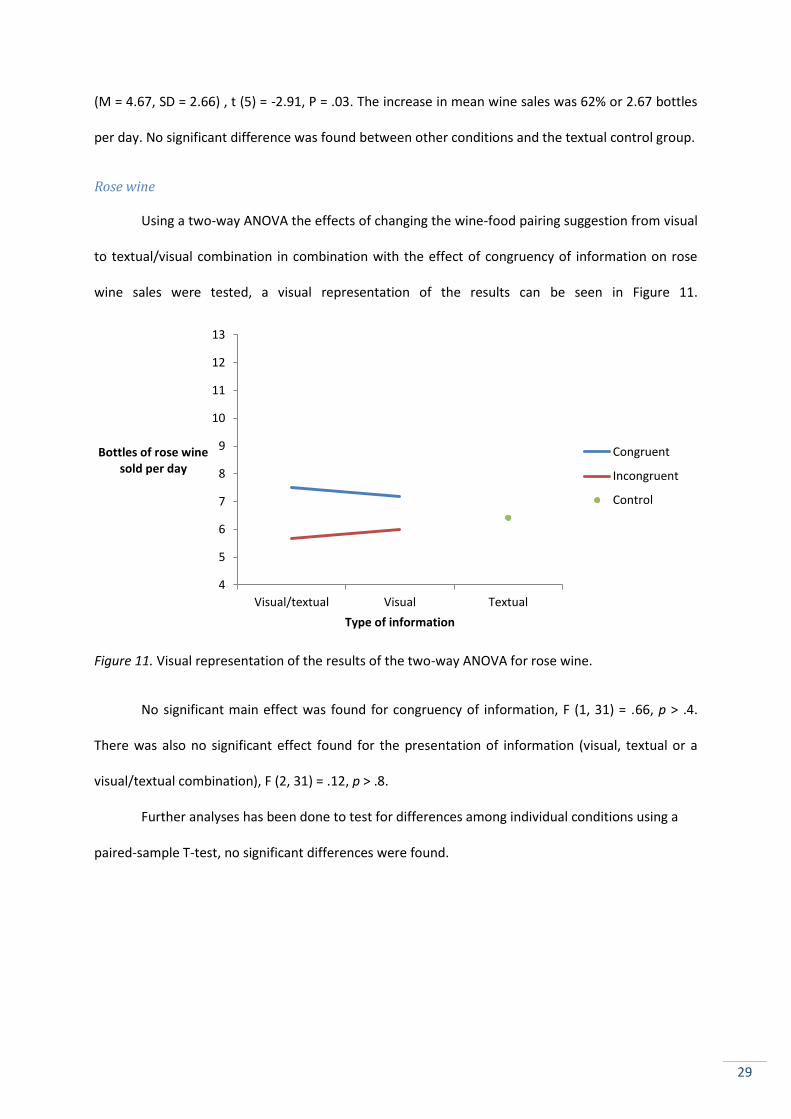
Rose wine
Using a two-way ANOVA the effects of changing the wine-food pairing suggestion from visual
to textual/visual combination in combination with the effect of congruency of information on rose
wine sales were tested, a visual representation of the results can be seen in Figure 11.
Figure 11. Visual representation of the results of the two-way ANOVA for rose wine.
No significant main effect was found for congruency of information, F (1, 31) = .66, p > .4.
There was also no significant effect found for the presentation of information (visual, textual or a
visual/textual combination), F (2, 31) = .12, p > .8.
Further analyses has been done to test for differences among individual conditions using a
paired-sample T-test, no significant differences were found.
4
5
6
7
8
9
10
11
12
13
Visual/textual Visual Textual
Bottles of rose wine sold per day
Type of information
Congruent
Incongruent
Control
30
Discussion
This chapter consists of four sections. First, the results of the experiment are discussed.
Second, the marketing implications of these findings are discussed. Third, some further research
suggestions are provided. Fourth, the limitations of the current study are discussed.
Information presentation: textual vs. visual
The results of this study show no main effect for type of information presentation and no
significant evidence to support the first hypothesis that changing textual food-pairing to visual food-
pairing will increase wine sales. Which means that wines with textual, visual or a combination of
textual and visual wine-food pairing did not differ in sales during this experiment. This contradicts
current literature which found that visual messages are more effective than textual messages in a
supermarket environment (Pieters & Warlop, 1999; Silayoi & Speece, 2004). There is no significant
result from this study to support the first hypothesis that suggested that changing textual food-
pairing to visual food-pairing will increase wine sales, but the mean sales the visual and textual/visual
combination condition was greater than the mean sales of the textual control condition for all wines.
Due to the nature of the experiment each condition was tested six days while wine sales varied
greatly. This variation in sales caused a large standard deviation in the sample, making it difficult for
differences between conditions to reach a significant level. Given that sales of the visual condition
was greater than the sales of the textual control condition for all three wines it is likely that a study
with more test days will have significant differences between the textual control condition and the
visual condition.
Information presentation: textual vs. textual/visual combination
The second hypothesis, wines with a recipe acting as a combination of textual and visual
wine-food pairing will sell better than only a visual wine-food pairing or the current textual condition,
was supported with a significant positive result in wine sales by red wine in the congruent
textual/visual combination condition in comparison to the textual control condition. One of the three
conditions support the findings of previous studies which found that combining visual and textual
31
cues can lead to an enhanced effect of the advertising effort over the use of only visual or textual
cues (Myers & Sar, 2011). The fact that one of the three conditions support the current literature and
the second hypothesis might seem limited, but due to the high variance in the sample it was difficult
for the other conditions to reach a significant level and the increase in sales between the congruent
textual/visual combination condition and the textual control condition was 43%. Therefore, it is likely
that a study with more test days will find significant results to support this hypothesis and also
current literature on this subject.
Congruency
The last hypothesis predicted that wine in congruent conditions would sell better than wine
in incongruent conditions, as supported by a study of North et al. (1999) that found that French wine
sold better than German wine when the music in the background was French and German wine sold
better than French wine if the music is German. The results of this study do not support the findings
of North et al. (1999). White wine in the incongruent visual condition sold significantly better than
white wine in the congruent visual condition which contradicts the effects of congruency as found by
North et al. (1999). In the other five conditions the mean sales of congruent conditions were higher
than that of the incongruent conditions, although not significant.
A possible explanation why white wine in the incongruent visual condition sold better than in
the congruent visual condition is a difference in participants of the pre-tests and the actual
experiment. A majority of the participants in the pre-tests were men, while 70% of wine buying
decisions in supermarkets are made by women while doing daily or weekly shopping (Barber &
Almanza, 2006). Furthermore Atkin et al. (2007) found that men showed a significantly stronger
tendency of searching for information away from the point of purchase compared to women,
therefore being less susceptible to information on the point of purchases such as a shelf tag. Women
also showed a significantly stronger tendency to make a decision based upon secondary criteria such
as medals won, price, buying the usual brand, buying based upon artwork and information on the
shelf tag (Atkin et al., 2007). Lastly, women show a trend (0.07) towards buying cheaper wine then

32
men, like the cheap wine used in the experiment (Atkin et al., 2007). Although the incongruent visual
condition for rose wine did not sell better. Therefore making it unlikely that a difference in
participants between the pre-tests and the experiment could have caused this effect. Further studies
most be performed to provide an explanation for this unexpected result.
Marketing implications
The results of this study can have a huge impact on the way in which supermarkets present
their wine. In this study the average sales of red wine increased with 43% from 8.50 bottles a day
with the textual wine-food paring up to 12.17 bottles a day with the congruent textual/visual
combination. For a large supermarket concern, with a large number of stores and franchises,
implementing textual/visual wine-food pairing suggestions on wines with a high margin could lead to
a substantial increase in profit, compared to the investments that are needed. Aside increasing sales
of certain wines the visual wine-food pairing also offers a service to the consumer. Consumers
struggle with the wine buying decision and prefer to form their own impression of a wine by reading
the labels instead of seeking guidance through journals and specialized shops (Barber & Almanza,
2006; Lockshin, 2003, Olsen et al., 2003), adding wine-food pairing suggestions makes it easier for
consumers to choose the right wine for a dinner.
Furthermore, other studies on wine found other effective ways of increasing wine sales in
supermarkets, so perhaps combining the findings from the other studies and the current study could
lead to enhanced effect in sales. First Parsons and Thompson (2009) found that peer-group
recommendation can be used to improve supermarket sales. Second wine awards and bestseller
recommendations improve wines sales in supermarket and wine stores (Parsons & Thompson, 2009).
Several supermarket products in the Netherlands are already using this strategy with the best tested
and best deal recommendations of the "Consumentenbond" (Consumers Union), products as; Calve
pindakaas (peanut butter), Bertolli pastasaus (pasta sauce) and Kaapse pracht (red wine). Third the
music played in supermarkets can have a great influence on wine sales (Areni & Kim, 1993; North et
33
al., 1999). Research found that consumers spent more money in a wine store when classical rather
than Top-Forty music was played in the background (Areni & Kim, 1993). Another study found that
wine from a country congruent with music played in the background sold significantly better than
wine from another country (North et al., 1999).
Future research
This study is a first step in the research on the effect of wine-food pairing on wine sales in the
Netherlands. Although limited significant results were found the current study does show the
potential of visualising the wine-food pairing. To examine this effect more thoroughly it is suggested
to conduct additional studies in which the conditions are tested for a longer period of time to
increase significance, since the analyses of the general wine showed that more data can create
significance. When considering a study by Corsi, et al. (2012), who found that wine-food pairing can
lead to the selection of more expensive wine choice, the effectiveness of visualising the wine-food
pairing has to be tested for wine of different price classes. This could result in a more understanding
of changing wine-food suggestions from textual into visual and for what price classes this method is
effective. Large supermarket chains often have different formulas for stores in various locations to
best cater the costumers of each type of store. Before implementing visual food-pairing suggestions
a supermarket concern should consider a study to test the effectiveness of the method for the
different formulas. The current study has focused solely on supermarkets, wine is also sold in liquor
and speciality stores. Suggesting a wine-food combination in such an environment would most likely
have a different result to that of a supermarket since the ingredients for the mean are not available
at the liquor and speciality stores.
Limitations
Several limitations should be acknowledged. First, there were six days of testing per
condition and the control lasted twelve days, analyses of the general wines sales of the store showed
that more observations can yield a significant result even with a high variance. If the experiment
34
would have lasted longer it would have been likely that more significant result would have been
found. Second, the wine used in the experiment was selected on sales numbers and exclusion of sale
actions. This led to the choice of a relatively cheap wine costing €2.69, while other wines can go up to
€15. A study by Corsi, et al. (2012) found that pairing wine with food can lead toward the selection of
more expensive wine choice, therefore this sales improving strategy would have been more effective
if used on an expensive wine instead of a cheap wine. By using the sales figures from the cash
register there is no information about the consumer who bought the wine. It was not asked whether
the consumer was aware of the manipulation and how he reacted to it. Third, it is not fully known
how many bottles where bought at a time. Data from the cash register showed that several times
consumers bought more than six bottle at a time, thereby having a great impact on the total sales of
that day. A more expensive wine is less likely to be bought in large quantities and wholesale has less
influence on the results. Fourth, the study was performed in a single supermarket in the suburbs of
Enschede, performing the experiment in multiple supermarkets in different city areas might lead to
different results. Fifth, existing research on judgmental biases (Krueger & Rothbart, 1988) suggests
that the influence of the visual food-pairing can mediate behaviour only when there is an element of
uncertainty in product choice or when customers are in a state of low involvement with the decision
process (Pieters & Warlop, 1999; Silayoi & Speece, 2004). When motivation is high consumers skip
less of the brand names and more of the pictorial elements (Pieters & Warlop, 1999).
35
Conclusions
The purpose of this study was to find whether and how visual or textual representation of
the wine-food pairing and congruency of the information influence wine sales. For red wine in the
congruent textual/visual condition the increase in mean wine sales of 43% was found, this supports
the current literature. White wine in the incongruent visual condition sold 62% better than in the
congruent visual condition, this contradicts current literature. Among other conditions there were no
significant differences. Furthermore, due to high variance in the sample and the few test days little
significant results were found. The results of this study are inconclusive as the red wine results
supports current literature while the white wine results contradicts previous research. Therefore it is
recommended to perform an additional study which further investigates the effects of visual or
textual representation of the wine-food pairing and congruency of the information on wine sales.
Because for a large supermarket concern, with numerous stores and franchises, implementing
textual/visual wine-food pairing suggestions on wines with a high margin could lead to a substantial
increase in profit.

36
References
Areni, C. S., & Kim, D. (1993). The influence of background music on shopping behavior: classical
versus top-forty music in a wine store. Advances in consumer research, 20(1), 336-340.
Atkin, T., Nowak, L., & Garcia, R. (2007). Women wine consumers: information search and
retailing implications. International Journal of Wine Business Research, 19(4), 327-339.
Barber, N. & Almanza, B, A., (2006). Influence of wine packaging on consumers' decision to purchase,
Journal of foodservice business research, 9(4), 83-98.
Becker, L., van Rompay, T, J, L., Schifferstein, H, N, J,. & Galetzka, M. (2011). Tough package, strong
taste: The influence of packaging design on taste impressions and product evaluations, Food
Quality and Preference, 22, 17–23.
Charters, S., & Pettigrew, S. (2008) Why Do People Drink Wine? A Consumer-Focused Exploration,
Journal of Food Products Marketing, 14(3), 13-32.
Clement, J., Kristensen, T., & Grønhaug, K. (2013). Understanding consumers’ in-store visual
perception: The influence of package design features on visual attention. Journal of Retailing
and Consumer Services, 20, 234–239.
Corsi, A, M., Mueller, S., & Lockshin, L. (2012) Let’s see what they have . . . : What consumers look for
in a restaurant wine list. Cornell Hospitality Quarterly, 53(2), 110–121.
Harrington, R. J., & Hammond, R. (2006). The direct effects of wine and cheese characteristics on
perceived match. Journal of Foodservice Business Research, 8(4), 37-54.
Harrington, R. J., & Hammond, R. (2006). Body deviation-from-match: The Yin and Yang of wine and
food pairing? Journal of Culinary Science and Technology, 5(1), 51–69.
Huffman, C., & Kahn, B. E. (1998). Variety for sale: mass customization or mass confusion? Journal of
retailing, 74(4), 491-513.
37
Iyengar, S. S., & Lepper, M. R. (2000). When choice is demotivating: Can one desire too much of a
good thing? Journal of personality and social psychology, 79(6), 995-1006.
Jacoby, J., Speller, D. E., & Berning, C. K. (1974). Brand choice behavior as a function of information
load: Replication and extension. Journal of consumer research, 1, 33-42.
Jae, H., Delvecchio, D., & Cowles, D. (2008). Picture-text incongruency in print advertisements among
low- and high-literacy consumers. Journal of Consumer Affairs 42 (3), 439–51.
King, M., & Cliff, M. (2005). Evaluation of ideal wine and cheese pairs using a deviation-from-ideal
scale with food and wine experts. Journal of Food Quality,28(3), 245–256.
Krueger, J., & Rothbart, M. (1988). Use of categorical and individuating information in making
inferences about personality. Journal of Personality and Social Psychology, 55, 187-195.
Lockshin, L. & Rhodus, W. (1993), The effect of price and oak flavor on perceived wine quality,
International Journal of Wine Marketing, 5(2), 13-25.
McQuarrie, E, F., & Mick, D, G. (1992). On resonance: A critical pluralistic inquiry into advertising
rhetoric. Journal of Consumer Research, 19(2), 180–97.
McQuarrie, E, F., & Mick, D, G. (2008). A laboratory study of the effect of verbal rhetoric versus
repetition when consumers are not directed to process advertising. International Journal of
Advertising, 28(2), 287–312.
Mitchel, A, A. (1986). The Effect of Verbal and Visual Components of Advertisements on Brand
Attitudes and Attitude Toward the Advertisement, Journal of Consumer Research, 13(1), 12-
24.
Myers, J, R., & Sar, S. (2011). Persuasive social approval cues in print advertising: Exploring visual and
textual strategies and consumer self-monitoring, Journal of Marketing Communications,
19(3), 168–181.

38
North, A, C., Hargreaves, D, J., & McKendrick, J. (1999). The Influence of In-Store Music on Wine
Selections. Journal of Applied Psychology, 84(2), 271-276.
Olsen, J., Thompson, K., & Clarke, T. (2003). Consumers Self-Confidence in Wine Purchases.
International Journal of Wine Marketing, 15(3), 40-52.
Parsons, A. G., & Thompson, A. M. (2009). Wine recommendations: who do I believe?. British Food
Journal, 111(9), 1003-1015.
Pieters, R., & Warlop, L. (1999). Visual attention during brand choice: The impact of time pressure
and task motivation. International Journal of Research in Marketing, 16(1), 1-16.
Rasmussen, M. and Lockshin, L. (1999), Wine choice behaviour: the effect of regional branding,
International Journal of Wine Marketing, 11(1), 36-46.
Rauber, C. (2004). Newsom's wine wins top honor. San Francisco Business Times.
Sharafi, Z., Marchetto, A., Susi, A., Antoniol, G., & Gueheneuc, Y. G. (2013, May). An empirical study
on the efficiency of graphical vs. textual representations in requirements comprehension. In
Program Comprehension (ICPC), 2013 IEEE 21st International Conference on (pp. 33-42).
IEEE.
Sherman, S., & Tuten, T. (2011). Message on a bottle: the wine label’s influence. International Journal
of Wine Business Research, 23(3), 221-234.
Silayoi, P., & Speece, M. (2004). Packaging and purchase decisions: an exploratory study on the
impact of involvement level and time pressure. British food journal, 106(8), 607-628.
Spence, C., Ngo, M, K., Percival, B., & Smith, B. (2013). Cross modal correspondences: Assessing
shape symbolism for cheese. Food Quality and Preference, 28, 206–212.
Thomas, A. (2000). Elements influencing wine purchasing: a New Zealand view. International Journal
of Wine Marketing, 12(2), 47-62.
Thomas, A., & Pickering, G. (2003). The importance of wine label information. International Journal of
Wine Marketing, 15(2), 58-74.
39
Townsend, C., & Kahn, B. (2014) The “Visual Preference Heuristic”: The influence of visual versus
verbal depiction on assortment processing, perceived variety, and choice overload, Journal of
consumer research, 40, 993-1015.
Yeoh, J, P, S., & North, A, C. (2010). The effects of musical fit on choice between two competing
foods. Musicae Scientiae, 14, 165-180.
Yeoh, J, P, S., & North, A, C. (2011). The effect of musical fit, on consumers' preferences between
competing alternate petrols. Psychology of Music, 40, 709-719.
40
Appendix
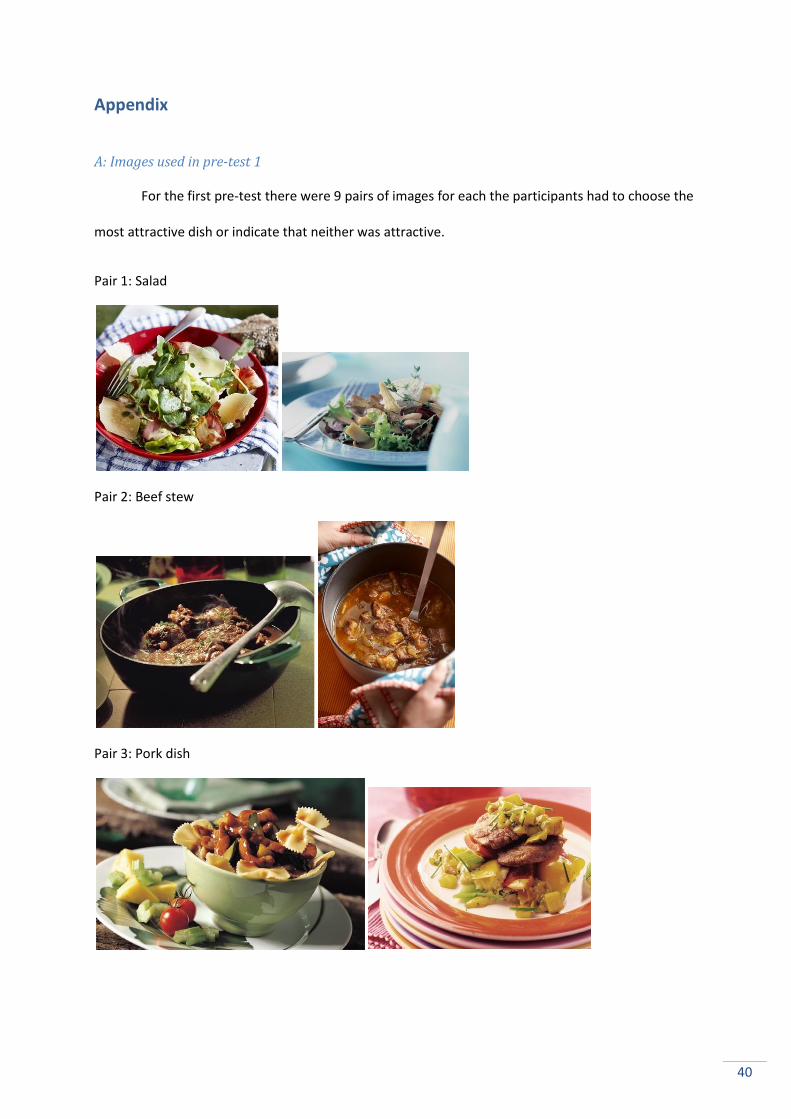
A: Images used in pre-test 1
For the first pre-test there were 9 pairs of images for each the participants had to choose the
most attractive dish or indicate that neither was attractive.
Pair 1: Salad
Pair 2: Beef stew
Pair 3: Pork dish
41
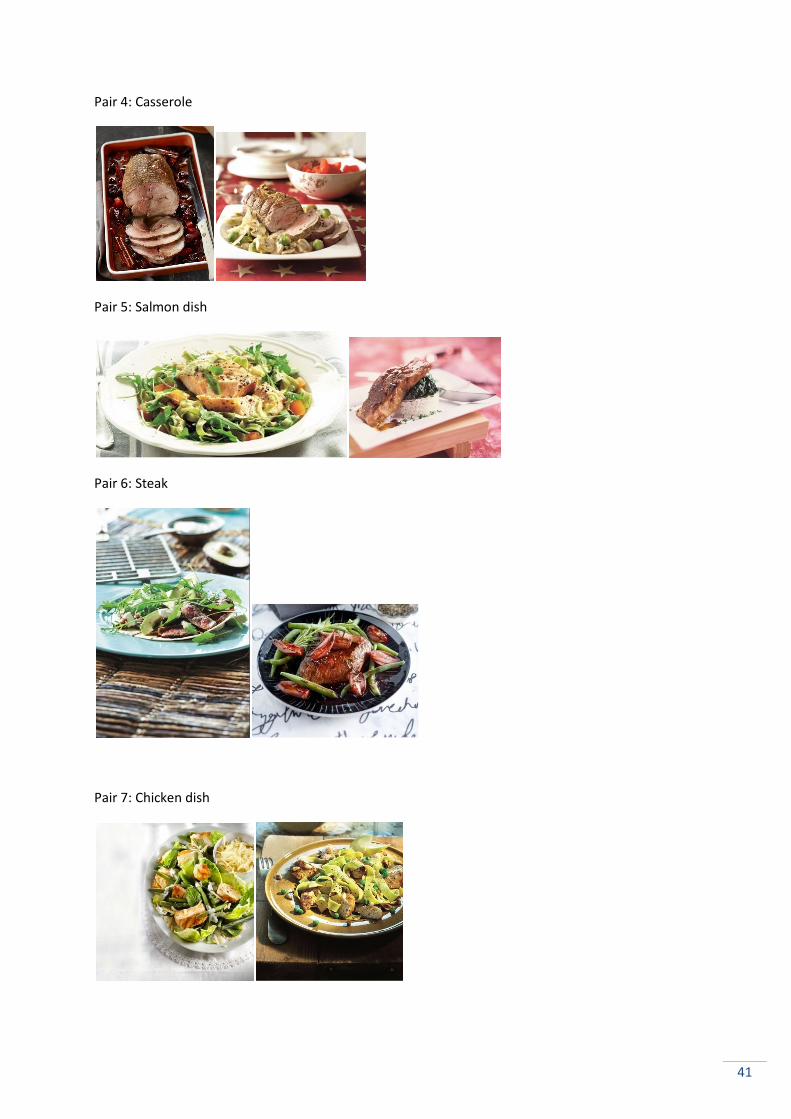
Pair 4: Casserole
Pair 5: Salmon dish
Pair 6: Steak
Pair 7: Chicken dish

42
Pair 8: Pasta
Pair 9: Stir-frie
43
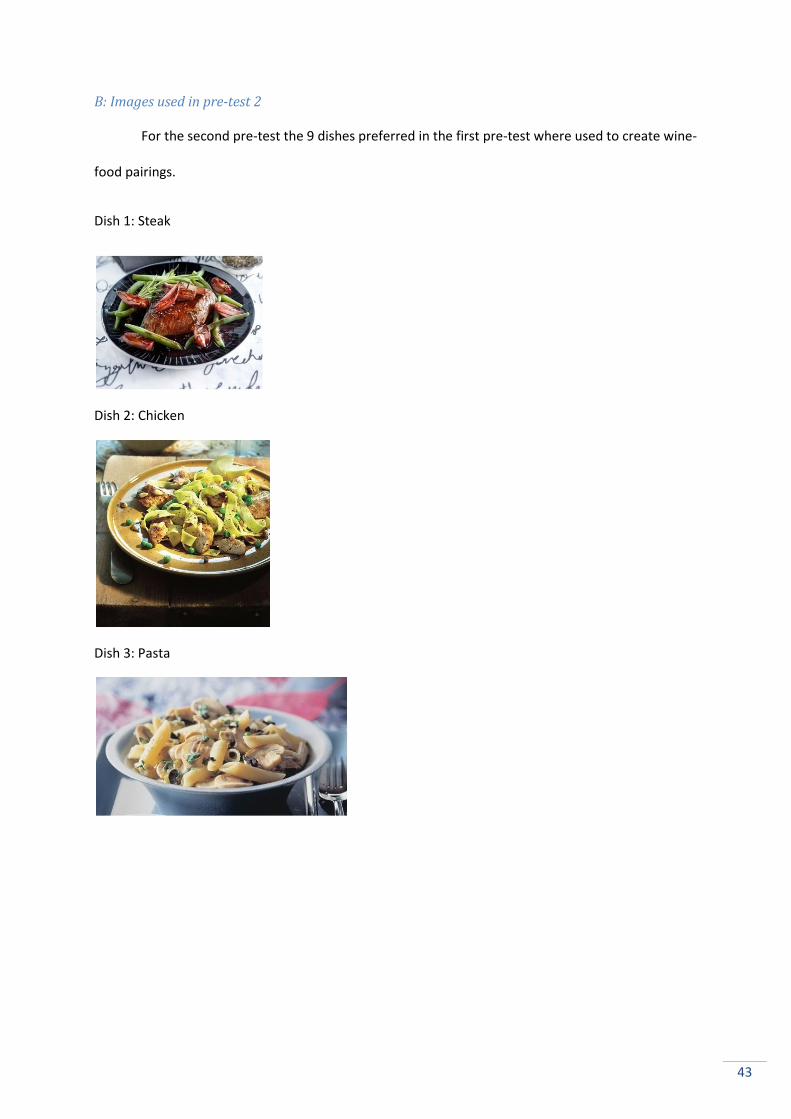
B: Images used in pre-test 2
For the second pre-test the 9 dishes preferred in the first pre-test where used to create wine-
food pairings.
Dish 1: Steak
Dish 2: Chicken
Dish 3: Pasta
44
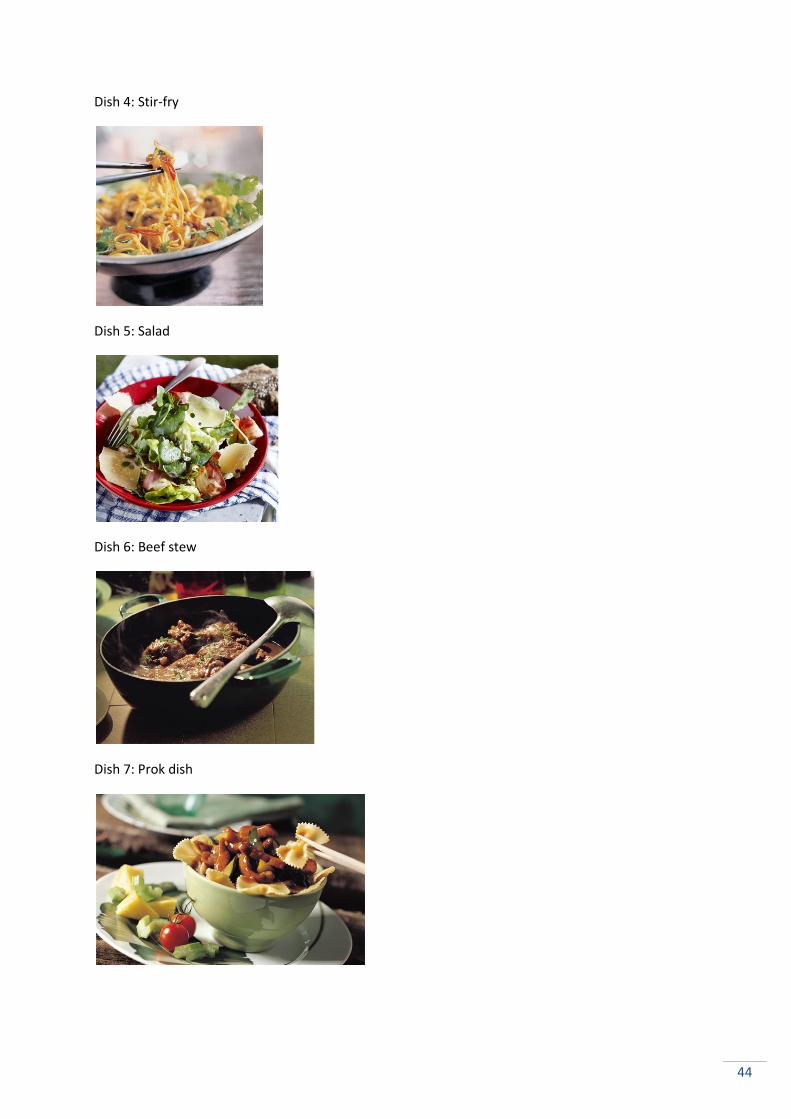
Dish 4: Stir-fry
Dish 5: Salad
Dish 6: Beef stew
Dish 7: Prok dish

45
Dish 8: Casserole
Dish 9: Salmon dish
46
C: Sample question pre test 2
This is a screenshot of the actual survey and show how the questions were presented.

47
D: Shelf tags used in the experiment
These are all the shelf tags that were used in the experiment.
48
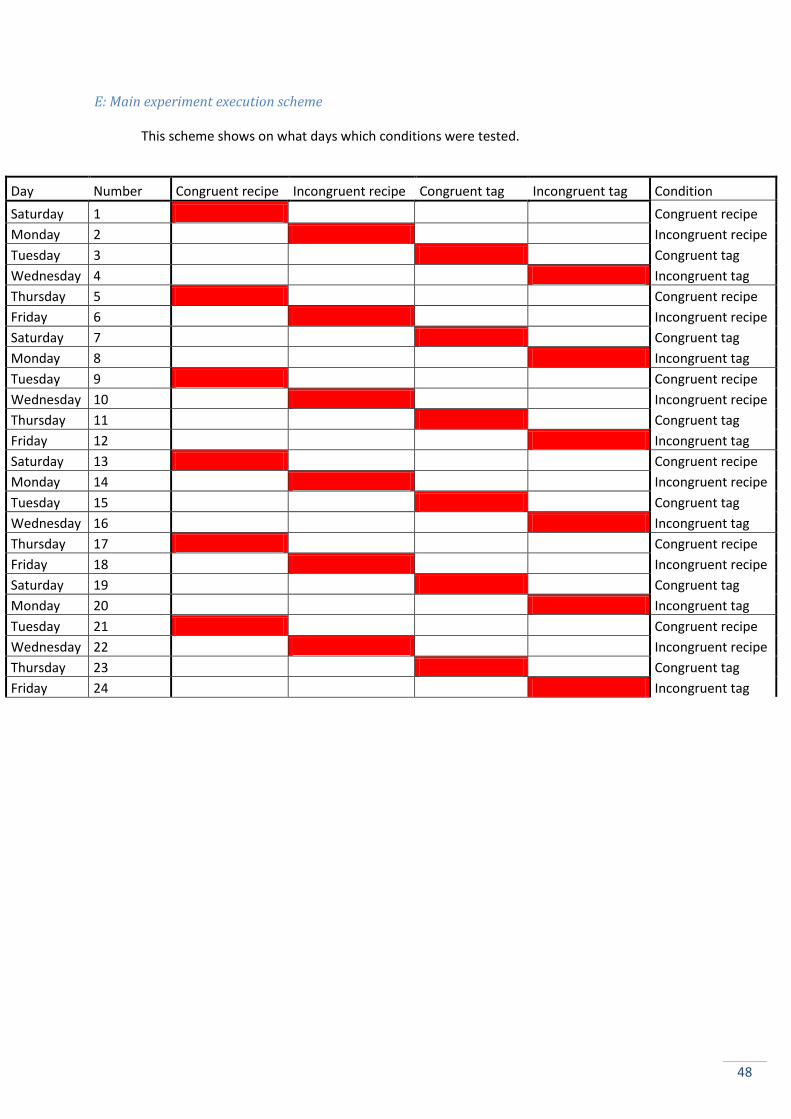
E: Main experiment execution scheme
This scheme shows on what days which conditions were tested.
Day Number Congruent recipe Incongruent recipe Congruent tag Incongruent tag Condition
Saturday 1 Congruent recipe
Monday 2 Incongruent recipe
Tuesday 3 Congruent tag
Wednesday 4 Incongruent tag
Thursday 5 Congruent recipe
Friday 6 Incongruent recipe
Saturday 7 Congruent tag
Monday 8 Incongruent tag
Tuesday 9 Congruent recipe
Wednesday 10 Incongruent recipe
Thursday 11 Congruent tag
Friday 12 Incongruent tag
Saturday 13 Congruent recipe
Monday 14 Incongruent recipe
Tuesday 15 Congruent tag
Wednesday 16 Incongruent tag
Thursday 17 Congruent recipe
Friday 18 Incongruent recipe
Saturday 19 Congruent tag
Monday 20 Incongruent tag
Tuesday 21 Congruent recipe
Wednesday 22 Incongruent recipe
Thursday 23 Congruent tag
Friday 24 Incongruent tag
49
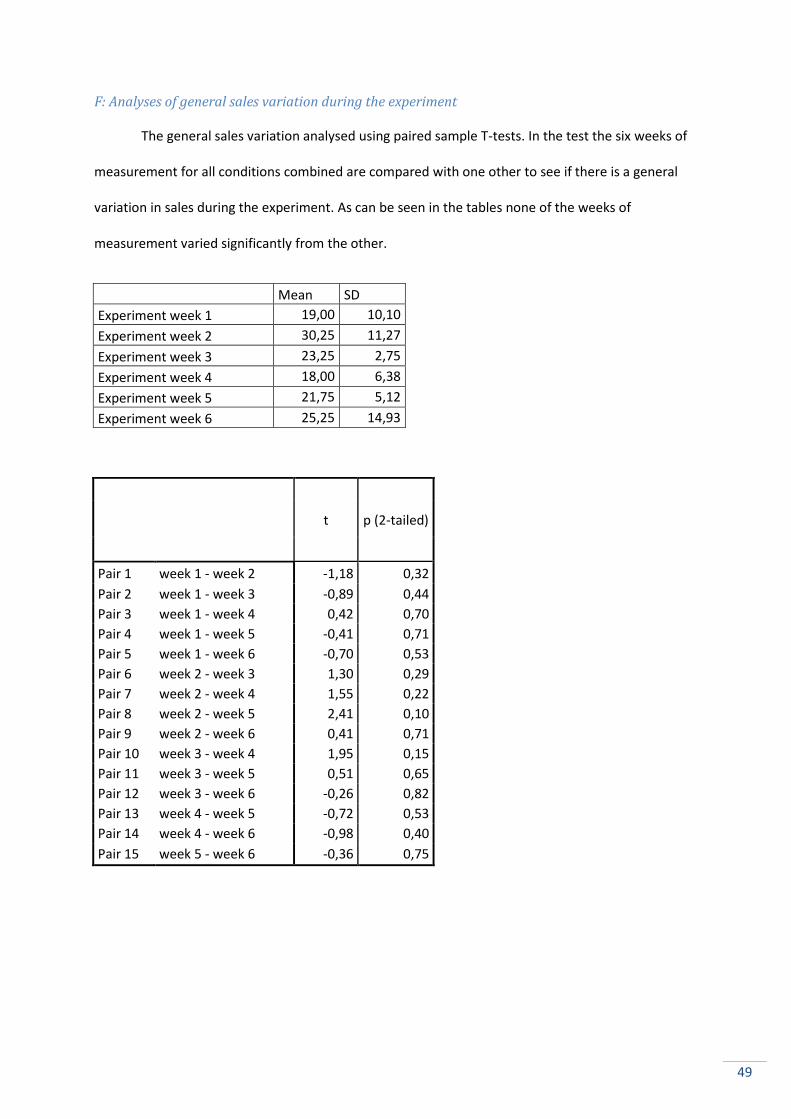
F: Analyses of general sales variation during the experiment
The general sales variation analysed using paired sample T-tests. In the test the six weeks of
measurement for all conditions combined are compared with one other to see if there is a general
variation in sales during the experiment. As can be seen in the tables none of the weeks of
measurement varied significantly from the other.
Mean SD
Experiment week 1 19,00 10,10
Experiment week 2 30,25 11,27
Experiment week 3 23,25 2,75
Experiment week 4 18,00 6,38
Experiment week 5 21,75 5,12
Experiment week 6 25,25 14,93
t p (2-tailed)
Pair 1 week 1 - week 2 -1,18 0,32
Pair 2 week 1 - week 3 -0,89 0,44
Pair 3 week 1 - week 4 0,42 0,70
Pair 4 week 1 - week 5 -0,41 0,71
Pair 5 week 1 - week 6 -0,70 0,53
Pair 6 week 2 - week 3 1,30 0,29
Pair 7 week 2 - week 4 1,55 0,22
Pair 8 week 2 - week 5 2,41 0,10
Pair 9 week 2 - week 6 0,41 0,71
Pair 10 week 3 - week 4 1,95 0,15
Pair 11 week 3 - week 5 0,51 0,65
Pair 12 week 3 - week 6 -0,26 0,82
Pair 13 week 4 - week 5 -0,72 0,53
Pair 14 week 4 - week 6 -0,98 0,40
Pair 15 week 5 - week 6 -0,36 0,75
50
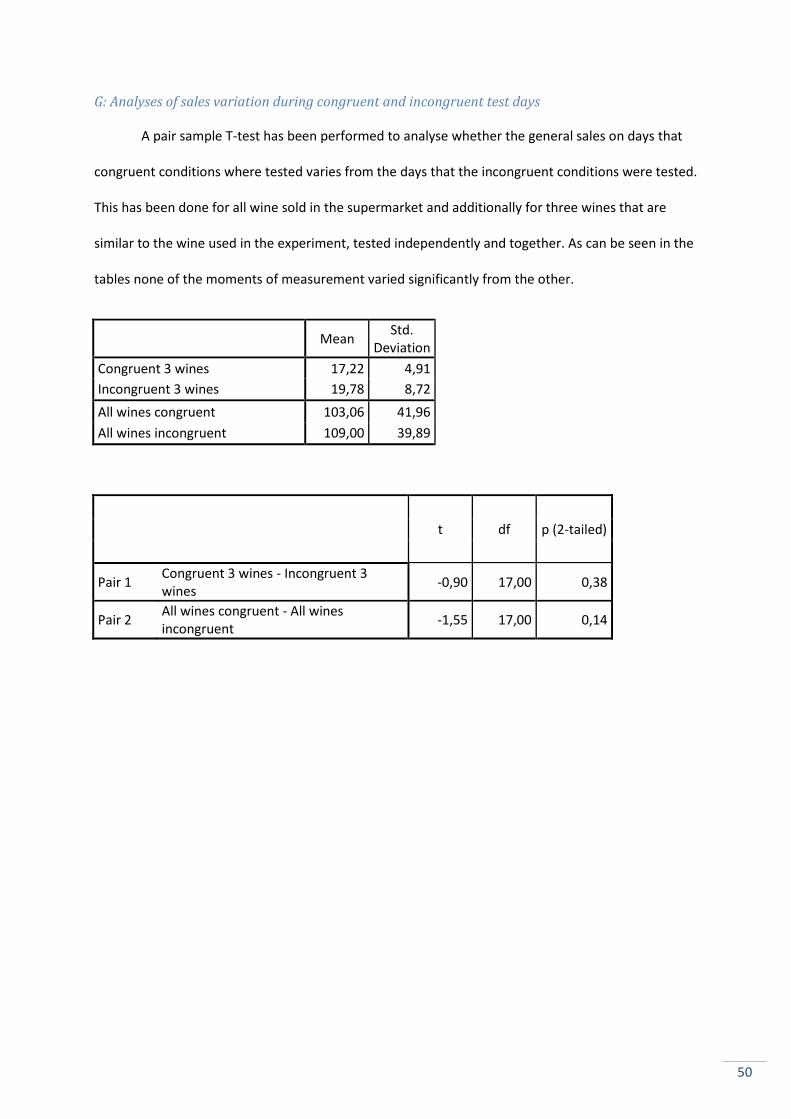
G: Analyses of sales variation during congruent and incongruent test days
A pair sample T-test has been performed to analyse whether the general sales on days that
congruent conditions where tested varies from the days that the incongruent conditions were tested.
This has been done for all wine sold in the supermarket and additionally for three wines that are
similar to the wine used in the experiment, tested independently and together. As can be seen in the
tables none of the moments of measurement varied significantly from the other.
Mean Std.
Deviation
Congruent 3 wines 17,22 4,91
Incongruent 3 wines 19,78 8,72
All wines congruent 103,06 41,96
All wines incongruent 109,00 39,89
t df p (2-tailed)
Pair 1 Congruent 3 wines - Incongruent 3 wines
-0,90 17,00 0,38
Pair 2 All wines congruent - All wines incongruent
-1,55 17,00 0,14