ind: gudang garam equity research reports… · mal: sp setia 16/06 potential impact of brexit...
TRANSCRIPT

Equity research│June 23, 2016
Asia Pacific Daily - 23 June 2016
Equity Research Reports…
▌IDEA OF THE DAY | Hong Kong PAX Global Technology Ltd. ADD, tp:HK$11.00▼) - Momentum continuing overseas | P2 Problems at Verifone present opportunity for PAX to take share. US market expected to see two years of triple-digit growth. China slowdown but only on currency basis. Ingenico and PAX keeping up the momentum. Trading at 10.6x P/E, 15x FY17F P/E target price of HK$11 offers over 70% upside. ——————————————————————————————————————————————————————————————————————————————————————— ▌REGIONAL / ASEAN / APAC Strategy Note - Brexit likely minimal impact on Asian EMs | P3 ——————————————————————————————————————————————————————————————————————————————————————— ▌Australia Reliance Worldwide (HOLD- Initiation, tp:A$3.10) - Pushing the boundaries in plumbing | P4 ——————————————————————————————————————————————————————————————————————————————————————— ▌China/Hong Kong Gaming (OVERWEIGHT) - Eye on Macau Vol. 34 – Feedback from 2016 Hong Kong… | P5 ——————————————————————————————————————————————————————————————————————————————————————— ▌Malaysia Heineken Malaysia Bhd (ADD, tp:RM16.10) - Brewing it right | P6 ——————————————————————————————————————————————————————————————————————————————————————— ▌Singapore Riverstone Holdings (HOLD▲, tp:S$0.91) - Expect a better 2H | P7 ——————————————————————————————————————————————————————————————————————————————————————— ▌Taiwan Strategy Note - Range bound | P8 ——————————————————————————————————————————————————————————————————————————————————————— ▌Thailand Thai Oil (ADD, tp:THB75.00) - On the road to growth recovery | P9 ——————————————————————————————————————————————————————————————————————————————————————— ▌Vietnam Khang Dien House Trading and Investment JSC (ADD, tp:VND29,100.00▲) - Another high… | P10
Showcasing CIMB Research Ideas
IND: Gudang Garam 21/06 Dividend bonanza >PDF
———————————————————————————————————————————————————————————————————————————————————
KR: Kolon Industries 20/06 Empowering the foldable future >PDF
———————————————————————————————————————————————————————————————————————————————————
CHN/HKG: Banks 17/06 The stars are slowly starting to align >PDF
———————————————————————————————————————————————————————————————————————————————————
MAL: SP Setia 16/06 Potential impact of Brexit >PDF
———————————————————————————————————————————————————————————————————————————————————
MAL: Plantations 16/06 Possible Brexit impact >PDF
Regional Equity Research Contacts
Michael GREENALL, CFP Regional Head of Research/Head of Research Msia T: (60) 3 2261 9088 E: [email protected]
———————————————————————————————————————————————————————————————————————————————————
Show Style "View Doc Map"
CIMB Conference / Events |
CIMB 10th Annual Indonesia Conference 08-12 August 2016, Bali
———————————————————————————————————————————————————————————————————————————————————
IMPORTANT DISCLOSURES, INCLUDING ANY REQUIRED RESEARCH CERTIFICATIONS, ARE PROVIDED AT THE END OF THIS REPORT. IF THIS REPORT IS DISTRIBUTED IN THE UNITED STATES IT IS DISTRIBUTED BY CIMB SECURITIES (USA), INC. AND IS CONSIDERED THIRD-PARTY AFFILIATED RESEARCH.
Powered by the EFA Platform

Technology - Others│Hong Kong│Equity research│June 22, 2016
Company Note │ Alpha series
IMPORTANT DISCLOSURES, INCLUDING ANY REQUIRED RESEARCH CERTIFICATIONS, ARE PROVIDED AT THE END OF THIS REPORT. IF THIS REPORT IS DISTRIBUTED IN THE UNITED STATES IT IS DISTRIBUTED BY CIMB SECURITIES (USA), INC. AND IS CONSIDERED THIRD-PARTY AFFILIATED RESEARCH.
Powered by the EFA Platform
PAX Global Technology Ltd Momentum continuing overseas
Problems at Verifone present opportunity for PAX to take share. ■ US market expected to see two years of triple-digit growth. China slowdown but only ■on currency basis.
Ingenico and PAX keeping up the momentum. ■ Trading at 10.6x P/E, 15x FY17F P/E target price of HK$11 offers over 70% upside. ■
Recent woes with Verifone give rise to opportunity The share price of PAX’s key competitor, Verifone, has fallen over 30% in the past two weeks after lowering its sales target for 2016 to 5% from 8%, citing some issues with bottlenecks in the US, while slow markets in China/Brazil are seeing pricing pressure. While the issues faced by Verifone in some cases apply to the overall industry, they seem to be more company-specific issues that bode well for PAX.
PAX taking on the US Having spent several years working on cracking the US market, PAX is reaping the rewards for its efforts. Through its comprehensive/customisable product range and market-leading customer support, the company is seeing tremendous growth as small-medium sized retailers have only reached an estimated 20% penetration with the EMV upgrade (vs. 70% for level 1 retailers). PAX has also cracked the Level 1 market.
China impacted by currency While PAX is making inroads into Verifone’s international market position, it appears that the China slowdown is impacting all players. 1H16 is likely to see flat growth yoy as a result of Rmb depreciation (high single-digit growth ex-Rmb impact). However, at the interim stage last year, there was some revenue delay and we are unlikely to see the same catch up in 3Q as last year and as a result, cut back on our China growth forecast.
Ingenico and PAX – the two winners We spoke with Kepler Cheuvreux’s analyst who covers Ingenico (the world’s largest payment terminal provider) about its current performance given Verifone’s woes. PAX concedes that Ingenico is a good company and that with Verifone losing ground, banks and merchant acquirers are hopefully going to use a combination of Ingenico and PAX solutions (they typically will use two suppliers).
Interims may present buying opportunity We look for interims to show flat growth from China and in excess of 30% growth from international markets (i.e. 15-20% topline growth). Gross margins are likely to show an improvement yoy due to the growth in higher profitable international sales, although we expect some impact at the bottomline from a higher effective taxation rate due to the expiry of certain tax holidays. Any results-related weakness is a buying opportunity.
Cut numbers but valuations look attractive We cut our numbers by 5-7% on the back of lower assumptions in China, but see valuations at 10.6x FY16F P/E, or a 47% discount to Ingenico, as too low given the strong momentum in its international business (US, EMEA and AP). We keep our 15x FY17F P/E target price (25% discount to Ingenico), which is reduced to HK$11 after the earnings cut. Maintain Add, with international sales and M&A deals as potential catalysts. Downside risks include worsening environment in China and Brazil.
▎Hong Kong
ADD (no change) Consensus ratings*: Buy 16 Hold 2 Sell 1
Current price: HK$6.36
Target price: HK$11.00
Previous target: HK$11.53
Up/downside: 73.0%
CIMB / Consensus: 12.3%
Reuters: 0327.HK
Bloomberg: 327 HK
Market cap: US$916.2m
HK$7,109m
Average daily turnover: US$6.56m
HK$50.94m
Current shares o/s: 1,101m
Free float: 65.2% * Source: Bloomberg
Key changes in this note
FY16F Revenue reduced by 4.8%.
FY16F EPS reduced by 5.7%.
Source: Bloomberg
Price performance 1M 3M 12M
Absolute (%) 4.4 -18.5 -46.3
Relative (%) 0.3 -18.4 -23.5
Major shareholders % held Hi Sun Technology (China) Limited 32.8
FMR LLC 7.0
Analyst(s)
Paul SNELGROVE
T (852) 2532 1125 E [email protected]
[ X ]
SOURCE: COMPANY DATA, CIMB FORECASTS
Financial Summary Dec-14A Dec-15A Dec-16F Dec-17F Dec-18F
Revenue (HK$m) 2,373 2,871 3,435 4,076 4,849
Operating EBITDA (HK$m) 444 642 751 919 1,103
Net Profit (HK$m) 391.8 620.3 657.9 804.8 965.5
Normalised EPS (HK$) 0.37 0.56 0.60 0.73 0.88
Normalised EPS Growth 67.9% 54.3% 6.1% 22.3% 20.0%
FD Normalised P/E (x) 17.41 11.29 10.64 8.70 7.25
DPS (HK$) 0.00 0.04 0.12 0.15 0.18
Dividend Yield 0.00% 0.65% 1.88% 2.30% 2.76%
EV/EBITDA (x) 11.04 7.56 5.86 4.33 3.14
P/FCFE (x) 40.01 19.11 11.69 11.94 9.96
Net Gearing (75.3%) (69.7%) (72.2%) (71.3%) (70.5%)
P/BV (x) 2.75 2.27 1.94 1.65 1.39
ROE 16.9% 22.1% 19.7% 20.5% 20.8%
% Change In Normalised EPS Estimates (5.71%) (4.86%) (7.21%)
Normalised EPS/consensus EPS (x) 1.02 1.07 1.10
70.0
82.0
94.0
106.0
118.0
130.0
5.1
7.1
9.1
11.1
13.1
15.1
Price Close Relative to HSI (RHS)
20
40
60
Jun-15 Sep-15 Dec-15 Mar-16
Vo
l m
2

Asia Pacific│Equity research│June 22, 2016
Strategy Note
IMPORTANT DISCLOSURES, INCLUDING ANY REQUIRED RESEARCH CERTIFICATIONS, ARE PROVIDED AT THE END OF THIS REPORT. IF THIS REPORT IS DISTRIBUTED IN THE UNITED STATES IT IS DISTRIBUTED BY CIMB SECURITIES (USA), INC. AND IS CONSIDERED THIRD-PARTY AFFILIATED RESEARCH.
Powered by the EFA Platform
Asia Pacific Strategy Brexit likely minimal impact on Asian EMs
■ The most updated polls suggest that Bremain is almost equal with Brexit as the undecided camp starts to make their stand.
■ Voters will decide on the referendum on 23 Jun. Bremain is the status quo but…
■ …a Brexit decision would only be implemented by 2018 and the immediate impact would be seen in the British pound and asset values.
■ Brexit equals a weaker pound and perhaps a contagion impact on the Euro and stronger gold prices.
■ We screened companies under coverage, but equity market impact is very minimal.
Odds are equal for Bremain and Brexit for now What a difference a weekend and a murder make. Last Friday, the Brexit camp led the Bremain camp 45 to 39. Over the weekend, those sitting on the fence started to make their decisions and most voted in favour of Bremain. As of 20 Jun, the ratio changed to 44:42 and now the odds are almost equal with just two days to go.
If Brexit does not occur - then it is status quo The pound and Euro should strengthen, domestic and international confidence is likely to return and market volatility could decline. The gold price will also come off and eventually, market confidence is likely to return.
However, if Brexit happens - possible contagion effect on Euro If the Brexit camp wins on 23 Jun, it should be at least two years before any impact comes into effect. However, in between, volatility may increase and the devaluation of the pound may spark a contagion impact on the Euro. The decline in asset values could result in investors seeking safety in gold and the gold price is likely to rise. There may also be a flight to the US$. The UK’s exit may also increase the likelihood of economically weaker countries (such as Greece and Spain) seeking to leave the EU.
Very limited impact on Asian EM companies We scanned the 600+ companies in our active coverage over ASEAN, Korea, Taiwan, India and Hong Kong. The most impacted sectors were those that derived their income or revenues from the UK and/or those with UK-based assets representing more than 30% of their asset base. Companies that fit this profile came largely from property, technology, IT, autos and conglomerates (Figures 2-4). Countries in our coverage without significant UK exposure were Indonesia, Vietnam and, to some extent, Thailand.
▎Asia Pacific
Analyst(s)
Michael GREENALL, CFP
T (60) 3 2261 9088 E [email protected] Asia Pacific Research Team
Figure 1: Bloomberg EU Referendum Poll Tracker: Exit/Stay: 44/42 (20 Jun)
SOURCES: CIMB RESEARCH, COMPANY
3

Building Materials│Australia│Equity research│June 22, 2016
IMPORTANT DISCLOSURES REGARDING COMPANIES THAT ARE THE SUBJECT OF THIS REPORT AND AN EXPLANATION OF RECOMMENDATIONS CAN BE FOUND AT THE END OF THIS DOCUMENT. MORGANS FINANCIAL LIMITED (ABN 49 010 669 726) AFSL 235410 - A PARTICIPANT OF ASX GROUP
Powered by EFA
Reliance Worldwide
Pushing the boundaries in plumbing
RWC is the clear market leader in the brass PTC plumbing fittings category with ■around 80% market share (by volume) in the US.
Growth opportunities include further penetration of brass PTC plumbing fittings ■products in the US, expansion into new markets (US construction) and global expansion.
We forecast EBITDA growth of 23% in FY16 and 20% in FY17 (in line with ■prospectus).
We initiate coverage on RWC with a Hold rating and A$3.10 target price. ■
A leader in the plumbing field RWC designs, manufactures and supplies premium branded water flow and control products for the plumbing industry. RWC has established operations in the US, Australia, UK, Canada, and New Zealand, and is building a presence in Europe. RWC’s products are used in residential (houses and apartments) and commercial (including retail and office buildings, hotels, and healthcare facilities) applications. In our view, one of RWC’s key competitive advantages lies in its strong market positions, with an estimated 80% share of the brass push-to-connect (PTC) plumbing fittings category in the residential market in the US under the well-known “SharkBite” brand.
Strong pipeline of growth opportunities RWC has a number of growth opportunities both in the US and globally. Given its ease-of-use and time savings benefits, we believe RWC will benefit from continued growth in PTC fittings products in the US over the next few years on the back of further penetration from the category. Other potential growth areas include expansion into new markets (ie. development of a new range of PTC products targeted at the US new residential and commercial construction markets) and expansion into new geographic regions such as Europe, Latin America and South East Asia.
A track record of consistent earnings growth RWC has a track record of strong and consistent revenue growth. It has achieved a revenue CAGR (constant currency) of 13% over the past 10 years. More recently (FY13-15), RWC has increased revenue and EBITDA at a CAGR of 22% and 54%, respectively. Management is forecasting 23% EBITDA growth in FY16 and 20% growth in FY17. Morgans’ forecasts are in line with this.
Initiate coverage with a Hold rating, A$3.10 target price We initiate coverage of RWC with a Hold rating and A$3.10 target price, which is based on a PE relative methodology. While we are attracted to RWC’s clear market dominance in the brass PTC plumbing fittings segment (80% market share), strong growth opportunities, highly experienced management team and impressive financial returns (FY16F ROE 32%), trading on 26.2x FY17F PE and 1.9% yield we see these attributes as largely reflected in the current share price. Despite our neutral stance in the short term, we remain positive on RWC in the long term and would look to reconsider our view on share price weakness.
SOURCE: MORGANS, COMPANY REPORTS
▎Australia
HOLD Current price: A$3.12
Target price: A$3.10
Previous target: A$
Up/downside: -0.6%
Reuters: RWC.AX
Bloomberg: RWC AU
Market cap: US$1,226m
A$1,638m
Average daily turnover: US$13.41m
A$17.83m
Current shares o/s 525.0m
Free float: 70.0%
Key changes in this note
N/A
Price performance 1M 3M 12M
Absolute (%) 5.8
Relative (%) 7.2
Alexander LU, CFA
T (61) 2 9043 7901
Alexandra CLARKE
T (61) 2 9043 7905
Financial Summary Jun-14A Jun-15A Jun-16F Jun-17F Jun-18F
Revenue (A$m) 392.2 451.7 534.9 587.8 647.8
Operating EBITDA (A$m) 65.7 79.4 97.8 117.7 135.6
Net Profit (A$m) 34.48 43.66 51.32 62.61 72.99
Normalised EPS (A$) 0.07 0.08 0.10 0.12 0.14
Normalised EPS Growth 143% 27% 18% 22% 17%
FD Normalised P/E (x) 47.51 37.52 31.92 26.16 22.44
DPS (A$) - - 0.019 0.060 0.070
Dividend Yield 0.00% 0.00% 0.62% 1.91% 2.23%
EV/EBITDA (x) 24.93 20.63 18.15 14.89 12.75
P/FCFE (x) 39.2 33.4 207.3 59.6 48.3
Net Gearing 95.6% 64.1% 42.0%
P/BV (x) NA NA 11.44 9.19 7.54
ROE 71.7% 38.9% 36.9%
% Change In Normalised EPS Estimates
Normalised EPS/consensus EPS (x) -
93.0
97.0
101.0
105.0
109.0
2.800
2.900
3.000
3.100
3.200
Price Close Relative to S&P/ASX 200 (RHS)
Source: Bloomberg
50
100
150
Apr-16 May-16 May-16 Jun-16
Vo
l m
4

Travel and Leisure│Hong Kong│Equity research│June 22, 2016
Sector Note
IMPORTANT DISCLOSURES, INCLUDING ANY REQUIRED RESEARCH CERTIFICATIONS, ARE PROVIDED AT THE END OF THIS REPORT. IF THIS REPORT IS DISTRIBUTED IN THE UNITED STATES IT IS DISTRIBUTED BY CIMB SECURITIES (USA), INC. AND IS CONSIDERED THIRD-PARTY AFFILIATED RESEARCH.
Powered by the EFA Platform
Gaming Eye on Macau Vol. 34 – Feedback from 2016 Hong Kong International Travel Expo
Stronger foot traffic expected over the summer holidays, in line with expectations. ■
Despite falling Rmb, Macau has become more cost competitive vs. other tourist ■locations because of falling hotel rates on the back of additional supply.
Maintain sector Overweight, with Galaxy as top pick. A potential re-rating catalyst is ■improvement in industry revenue during the summer holiday season.
Summer holiday visitation boost expected Expo feedback is the summer holidays (July-August) will bring strong visitation to Macau as previous seasonally stronger months in 2016 have resulted in yoy visitor growth (i.e. Lunar New Year +5% yoy). Travel agents expect visitation to grow by ~5% yoy in the summer, in line with previous expectations. Union Pay restrictions and China’s stagnant economy are not likely to have a major impact on Macau visitation, based on our conversations with travel agents.
Macau more competitive against other locations Despite the Rmb depreciation, travel agencies noted the drop in Macau room rates due to increased supply compensates for the Rmb depreciation. For example, The Venetian Macao’s average daily revenue has fallen 20% since 4Q14. Most of the summer visitors are expected to come via IVS and not within a tour group as tour group visitation to Hong Kong is projected to remain weak. Mainland visitors until recently have historically visited Macau and Hong Kong on the same trip.
Sands Parisian should appeal to the masses Travel agencies indicated that upcoming new properties, at least initially, are likely to attract incremental visitation. Agents are the most optimistic about Sands Parisian as the property is the most “theme park-like” out of the new openings, with features such as a replica Eiffel Tower. The expected room rate of HK$1.4k will be slightly more expensive than Cotai Central. The exact opening date is still unknown as travel agents have not been given specific travel package price points from Sands.
Concern – sustainable incremental visitation may only be gradual To the non-gamer, Macau has the image as ‘gaming-only’ but this is slowly changing as more non-gaming attractions are added. Travel agents are concerned that strong visitation may not be immediately sustainable post the current build-out and instead will only be gradual as Macau transforms its image which will take time. Our 800 person survey in China indicates 57% would increase their visitation to Macau as more non-gaming elements are added. This is positive for eventual visitation.
Reiterate Overweight on the sector Galaxy remains our top sector pick given undemanding valuations (10x Bloomberg consensus EV/EBITDA vs. 13x for Sands) and its strong product offering that can capture market share. The sector is trading at an undemanding valuation of 10x FY16 consensus EV/EBITDA. Key risks include slower-than-expected industry revenues.
Figure 1: Macau consensus forward EV/EBITDA
SOURCES: CIMB, BLOOMBERG
Title:
Source:
Please fill in the values above to have them entered in your report
7
9
11
13
15
17
19
EV/EBITDA Mean +1 Stdev -1 Stdev
[ X ]
▎Hong Kong
Overweight (no change)
Highlighted companies
Galaxy Entertainment ADD, TP HK$39.91, HK$23.35 close
Galaxy continues to deliver strong earnings performance across all gaming segments. In the longer term, Galaxy will have the most significant landbank following the ongoing Cotai expansion.
MGM China Holdings ADD, TP HK$15.20, HK$10.52 close
Given MGM China’s low fixed costs on an absolute basis, its earnings are likely to be the first to recover when sector revenues rise.
Sands China ADD, TP HK$36.92, HK$25.90 close
Sands China’s dividends are the most sustainable among all gaming operators, making this stock relatively defensive.
Summary valuation metrics
Analyst(s)
Michael TING
T (852) 2532 1121 E [email protected]
Jensen POON T (852) 2868 0350 E [email protected]
P/E (x) Dec-16F Dec-17F Dec-18F
Galaxy Entertainment 17.15 16.72 15.73
MGM China Holdings 20.04 14.39 13.38
Sands China 21.08 19.07 17.94
P/BV (x) Dec-16F Dec-17F Dec-18F
Galaxy Entertainment 2.22 2.08 1.94
MGM China Holdings 2.83 3.82 3.17
Sands China 4.00 4.19 4.08
Dividend Yield Dec-16F Dec-17F Dec-18F
Galaxy Entertainment 2.92% 2.99% 3.18%
MGM China Holdings 1.52% 2.11% 2.99%
Sands China 8.40% 9.24% 10.17%
5

Brewers│Malaysia│Equity research│June 21, 2016
Company Note
IMPORTANT DISCLOSURES, INCLUDING ANY REQUIRED RESEARCH CERTIFICATIONS, ARE PROVIDED AT THE END OF THIS REPORT. IF THIS REPORT IS DISTRIBUTED IN THE UNITED STATES IT IS DISTRIBUTED BY CIMB SECURITIES (USA), INC. AND IS CONSIDERED THIRD-PARTY AFFILIATED RESEARCH.
Powered by the EFA Platform
Heineken Malaysia Bhd Brewing it right
Our recent visit to Heineken’s plant yielded pleasant surprises as the 50-year old ■plant is running on a fully-automated system, requiring minimal support staff.
The group will continue to roll out new products to increase its product offerings. ■ The increase in the legal purchasing and drinking age to 21 from 1 Dec 2017 is ■expected to have limited impact as this age group is not a significant contributor.
There is a possibility of a 2-4% price increase when the anti-profiteering act expires ■on 30 Jun 16 in a bid to pass on the additional cost.
Maintain Add with TP of RM16.10. Dividend yields of 5.5-5.8% remain attractive. ■
A visit to one of Malaysia’s oldest breweries We recently brought 22 fund managers and buy-side analysts to visit Heineken’s 51-year old plant in Sungei Wey, Selangor. We were pleasantly surprised to find that its manufacturing process is almost fully-automated and requires minimal support staff. The plant currently manufactures 95% of its product volume, including brands such as Guinness, Heineken, Tiger and Anchor. However, the group also imports brands with limited volume such as Paulaner, Kirin Beer, Affligem, Strongbow and Smirnoff Ice.
More product launches to come During our discussion with the group’s finance director, Atul Chhaparwal, we understand that the company will continue to innovate and roll out new products. We believe that this is essential to increase its product portfolio, catering for a larger market while increasing its foothold with younger and savvier drinkers. We think that the group will focus on rolling out beers with lower alcohol content which are more affordable with their lower ASPs. Lower alcohol content drinks have lower excise duties.
No major impact from increase in legal age to 21 The government recently announced that the legal purchasing and drinking age will be raised to 21 from 18 effective 1 Dec 2017. Management expects the new ruling to have limited impact on volumes as this age group is not the biggest consumer of alcoholic beverages compared to other age groups. Our channel checks also reveal that this age group has limited access to on-trade market locations as these locations have enforced a minimum entry age of 21.
A possible price hike of an estimated 2-4% Management also did not discount the possibility of increasing prices after the anti-profiteering act expires on 30 Jun 16. Notably, the group has not passed on any additional GST costs while its recent price increase by 2-5% was purely to account for the 10-12% hike in excise duty (Mar 16). In our view, any price increase is likely to be capped at an average of 2-4%, which is manageable and unlikely to result in a material drop in sales volume given an inelastic demand for alcoholic drinks.
Maintain Add, no changes to earnings We make no changes to our earnings forecasts pending further updates on any potential price increases. Hence, no change to our Add call and DDM-based target price of RM16.10. Heineken Malaysia continues to be our sector top pick as we expect the group to maintain its dominance in Malaysia’s malt liquor market (MLM) and earnings growth to be driven through continuous efforts to optimise efficiency and production. Dividend yields also remain attractive at 5.5-5.8%. Risk to our view: drop in MLM volumes.
▎Malaysia
ADD (no change) Consensus ratings*: Buy 8 Hold 1 Sell 0
Current price: RM14.98
Target price: RM16.10
Previous target: RM16.10
Up/downside: 7.5%
CIMB / Consensus: 1.0%
Reuters: HEIN.KL
Bloomberg: HEIM MK
Market cap: US$1,114m
RM4,525m
Average daily turnover: US$0.27m
RM1.05m
Current shares o/s: 302.1m
Free float: 49.0% * Source: Bloomberg
Key changes in this note
No changes to our earnings forecast.
Source: Bloomberg
Price performance 1M 3M 12M Absolute (%) 0.4 7.5 3.9
Relative (%) 0.1 12.4 9
Major shareholders % held GAPL Pte Ltd 51.0
Aberdeen Asset Mgmt PLC 5.5
Analyst(s)
Walter AW
T (60) 3 2261 9093 E [email protected]
[ X ]
SOURCE: COMPANY DATA, CIMB FORECASTS
Financial Summary Jun-14A Jun-15A Jun-16F Jun-17F Jun-18F
Revenue (RMm) 1,611 1,749 1,735 1,806 1,824
Operating EBITDA (RMm) 311.8 337.1 389.8 395.8 411.1
Net Profit (RMm) 198.2 214.2 252.7 258.4 269.4
Core EPS (RM) 0.66 0.71 0.84 0.86 0.89
Core EPS Growth (8.9%) 8.1% 18.0% 2.3% 4.3%
FD Core P/E (x) 22.83 21.13 17.91 17.52 16.80
DPS (RM) 0.65 0.71 0.82 0.84 0.87
Dividend Yield 4.31% 4.74% 5.47% 5.60% 5.83%
EV/EBITDA (x) 14.80 13.49 11.78 11.59 11.13
P/FCFE (x) 22.57 24.42 21.95 17.47 16.51
Net Gearing 24.7% 6.0% 17.3% 15.9% 13.1%
P/BV (x) 12.68 12.03 11.87 11.71 11.55
ROE 54.9% 58.4% 66.7% 67.3% 69.3%
CIMB/consensus EPS (x) 1.01 0.99 0.98
92.0
97.7
103.4
109.1
12.00
13.00
14.00
15.00
Price Close Relative to FBMKLCI (RHS)
200
400
600
Jun-15 Sep-15 Dec-15 Mar-16
Vol th
6

Rubber Gloves│Singapore│Equity research│June 22, 2016
Company Note
IMPORTANT DISCLOSURES, INCLUDING ANY REQUIRED RESEARCH CERTIFICATIONS, ARE PROVIDED AT THE END OF THIS REPORT. IF THIS REPORT IS DISTRIBUTED IN THE UNITED STATES IT IS DISTRIBUTED BY CIMB SECURITIES (USA), INC. AND IS CONSIDERED THIRD-PARTY AFFILIATED RESEARCH.
Powered by the EFA Platform
Riverstone Holdings Expect a better 2H
The phase III expansion capacity (6 lines; totaling 1bn pieces p.a.) is slated to start ■contribution in 2H16.
After a slower 1Q16, demand for cleanroom gloves has shown signs of ■improvement in 2Q; management expects demand to pick up further in 2H16.
The healthcare glove segment should continue to face ASP and margin pressure ■due to stiff competition.
We upgrade Riverstone from Reduce to Hold, with an unchanged target price of ■S$0.91, still pegged to the peer average of 17x CY17 core P/E.
Phase III capacity expansion on track From our recent conversation with management, we understood that the completion of the group’s phase III capacity expansion should remain on schedule. To recap, Riverstone is undergoing a multi-year expansion programme, with its capacity slated to increase by 5bn pieces to 8.2bn pieces p.a. by end-FY18. Upon completion of phase III expansion by end-FY16, Riverstone’s production capacity would reach 6.2bn pieces p.a., representing a 19.2% increase yoy (end-FY15: 5.2bn).
Securing new orders for the new lines The phase III expansion comprises 3 single lines and 3 double lines, with each single line able to produce c.10m pieces per month and each double line c.20m pieces per month. The first line (single) is slated to start commissioning by the end of June, and the second line (single) by July. We understand that the first two lines have already been filled up by new orders, and management is in talks with existing and potential new customers to take up the capacity of the remaining four lines.
Expect improved demand for cleanroom gloves According to management, there have been signs of improvement in demand for cleanroom gloves in 2Q, following a subdued 1Q16 due to slower orders from the hard disk drive sector. Management expects demand for cleanroom gloves to pick up in the 2H, driven by the mobile phone and tablet sectors. We continue to like the prospects of the cleanroom segment for which Riverstone has an economic moat (c.60% global market share) to protect its margins.
Pressure on healthcare glove ASP and margin would still be felt We expect the ASP and margins of the group’s healthcare gloves to continue facing downward pressure going forward. Unlike its niche cleanroom segment, the healthcare gloves are more generic in nature and hence, subject to much stiffer competition. We maintain our view that most, if not all, of the benefits of more favourable FX and raw material prices in this segment will have to be passed on to its customers.
Upgrade from Reduce to Hold In anticipation of the fresh contribution from phase III capacity expansion and potentially improving demand for cleanroom gloves in 2H16, we upgrade our rating for Riverstone from Reduce to Hold. Smooth project execution and stronger-than-expected earnings growth are the key catalysts, while stiffer competition in the healthcare gloves segment is a key downside risk.
▎Singapore
HOLD (previously REDUCE) Consensus ratings*: Buy 2 Hold 3 Sell 1
Current price: S$0.89
Target price: S$0.91
Previous target: S$0.91
Up/downside: 3.1%
CIMB / Consensus: -9.5%
Reuters: RVHL.SI
Bloomberg: RSTON SP
Market cap: US$489.0m
S$655.9m
Average daily turnover: US$0.41m
S$0.56m
Current shares o/s: 741.8m
Free float: 33.2% * Source: Bloomberg
Key changes in this note
No change.
Source: Bloomberg
Price performance 1M 3M 12M Absolute (%) -1.7 -9.2 8.3
Relative (%) -2.5 -5.9 24.3
Major shareholders % held Ringlet Investment Limited 50.8
Lee Wai Keong 11.7
Wong Teck Choon 4.0
Analyst(s)
Roy CHEN, CFA
T (65) 6210 8685 E [email protected]
William TNG, CFA T (65) 6210 8676 E [email protected]
[ X ]
SOURCE: COMPANY DATA, CIMB FORECASTS
Financial Summary Dec-14A Dec-15A Dec-16F Dec-17F Dec-18F
Revenue (RMm) 399.3 560.2 635.1 729.7 828.3
Operating EBITDA (RMm) 95.4 162.8 175.9 196.7 218.1
Net Profit (RMm) 66.6 120.9 120.8 133.2 146.5
Core EPS (RM) 0.08 0.14 0.15 0.16 0.18
Core EPS Growth 5.9% 80.5% 5.3% 11.4% 10.9%
FD Core P/E (x) 34.24 18.97 18.02 16.18 14.60
DPS (RM) 0.035 0.065 0.066 0.073 0.080
Dividend Yield 1.30% 2.42% 2.47% 2.73% 2.99%
EV/EBITDA (x) 19.84 11.33 10.34 9.14 8.05
P/FCFE (x) NA 31.41 38.69 26.15 21.45
Net Gearing (21.4%) (26.7%) (26.9%) (26.8%) (29.0%)
P/BV (x) 5.31 4.10 3.42 3.01 2.62
ROE 16.6% 24.4% 20.7% 19.8% 19.2%
% Change In Core EPS Estimates 0% 0% 0%
CIMB/consensus EPS (x) 0.97 0.97 0.96
91
117
142
168
0.700
0.900
1.100
1.300
Price Close Relative to FSSTI (RHS)
1
2
3
4
Jun-15 Sep-15 Dec-15 Mar-16
Vo
l m
7

Taiwan│Equity research│June 23, 2016
Strategy Note
IMPORTANT DISCLOSURES, INCLUDING ANY REQUIRED RESEARCH CERTIFICATIONS, ARE PROVIDED AT THE END OF THIS REPORT. IF THIS REPORT IS DISTRIBUTED IN THE UNITED STATES IT IS DISTRIBUTED BY CIMB SECURITIES (USA), INC. AND IS CONSIDERED THIRD-PARTY AFFILIATED RESEARCH.
Powered by the EFA Platform
Taiwan Strategy Range bound
■ TAIEX up 3.5% YTD, capped by poor macro, political uncertainties, no catalysts.
■ Corporate earnings likely to drop hoh/yoy in 1H16 and recover somewhat in 2H16, thanks to low base, seasonal demand pick-up, and new product launches.
■ We are Overweight on foundry, and underweight on touch panel.
■ Expect 6M TAIEX range of 7,800-8,800 as current valuation discounts both the lacklustre 1H16 results and improved 2H16 fundamentals.
■ Top picks: TSMC, Largan, Parade, Yeong Guan and Bon Fame.
YTD performance capped by poor macro and political uncertainties TAIEX has risen 3.5% YTD and now trades at a narrower range of 1.4-1.5x P/BV on annualised ROE of 10-11% and dividend yield of c.4%. We believe this is due to the persistent slowdown in the domestic economy (evidenced by falling exports, sluggish private investment, capital outflow and across-the-board earnings contraction), rising political uncertainties post presidential election, and lack of major catalysts.
2H16 > 1H16; full-year earnings contraction inevitable We estimate 1H16 earnings to decline hoh and yoy due to tech inventory adjustment. The momentum should be better off in 2H16 given the low base yoy/hoh and seasonal demand pick-up, particularly in the downstream segment, along with new product launches. We forecast 7% yoy full-year earnings decline in the CIMB Taiwan universe, with non-tech/non-financial being the only sector registering earnings expansion.
Upstream: good entering 3Q16; downstream: stronger 2H16 Foundries and fabless players should see decent bookings lasting into 3Q16. We foresee stronger hardware recovery in 2H16, while Apple’s sell-in as well as shipment of PC and smartphone components could still drop yoy due to weaker stocking. We are Overweight on foundry, Underweight on touch panel and Neutral on the other segments.
Financial: trending down; non-tech: case by case We are Neutral on financials and non-tech. We expect financial companies to post yoy/hoh earnings growth in 2H16 given the low base, seasonality, and absence of provisions, but their full-year earnings could flatten/drop on weakening topline. We like non-tech names with structural drivers, unique business format and improved operations, and more US market-leveraged. We also see investment opportunities for stocks related to the five innovative industries promoted by the new government.
TAIEX to range-trade at 7,800-8,800 the next six months We think the current TAIEX valuation somewhat discounts both the lacklustre 1H16 results and improved 2H16 fundamentals. We expect it to trade range-bound at 7,800-8,800 points, or 1.3-1.5x P/BV, in the next six months. Key upside risks are Bremain and stronger seasonal demand while downside risks include Brexit, US rate decision, Japan’s policy moves, weaker China’s macro outlook and further strained cross-Strait relations. Our top picks are TSMC, Largan, Parade, Yeong Guan and Bon Fame.
[ X ]
Figure 1: TAIEX vs. P/BV
SOURCES: CIMB, TAIWAN ECONOMIC JOURNAL
▎ Taiwan
Highlighted companies
Largan Precision ADD, TP NT$3,600, NT$3,050 close
We believe Largan should benefit the most within the semiconductor supply chain due to its market dominance. We expect its bottomline to benefit more than its topline, with margin improvement on better sales mix.
TSMC ADD, TP NT$179.0, NT$166.0 close
TSMC’s 16nm market share should surge in 2H16 with the debut of Apple’s new mobile AP and customers expediting their node migration. Its foundry dominance should be strengthened on the launch of 10nm/7nm nodes in late 2016/2017.
Yeong Guan ADD, TP NT$262.0, NT$204.5 close
YGG should benefit from growing global wind turbine demand and metal casting industry consolidation. Its capacity expansion will support share gain while backend machinery services will boost margins.
Analysts
Eric LIN
T (886) 2 8729 8380 E [email protected]
Nora HOU T (886) 2 8729 8373 E [email protected]
0.0
0.5
1.0
1.5
2.0
2.5
3,500
5,000
6,500
8,000
9,500
11,000
Dec-0
6
Jun
-07
Dec-0
7
Jun
-08
Dec-0
8
Jun
-09
Dec-0
9
Jun
-10
De
c-1
0
Jun
-11
Dec-1
1
Jun
-12
Dec-1
2
Jun
-13
Dec-1
3
Jun
-14
Dec-1
4
Jun
-15
Dec-1
5
Jun
-16
TAIEX P/BV (RHS)
(Index) (x)
8

Oil & Gas Refinery│Thailand│Equity research│June 22, 2016
Company Note
IMPORTANT DISCLOSURES, INCLUDING ANY REQUIRED RESEARCH CERTIFICATIONS, ARE PROVIDED AT THE END OF THIS REPORT. IF THIS REPORT IS DISTRIBUTED IN THE UNITED STATES IT IS DISTRIBUTED BY CIMB SECURITIES (USA), INC. AND IS CONSIDERED THIRD-PARTY AFFILIATED RESEARCH.
Powered by the EFA Platform
Thai Oil On the road to growth recovery
Investors were highly satisfied with TOP’s efficient operation, good capital ■management, and well-implemented strategy.
Power-led earnings from SPPs and GPSC will not only propel growth but also ■enhance earnings sustainability post 2015, in our view.
We see limited downside for the company’s refinery business. ■ We believe TOP deserves a valuation rerating due to its superior earnings portfolio; ■Add with a TP of THB75, based on industry-average 6x CY17F EV/EBITDA.
Power-led growth timely offsets weaker refinery During our five-day NDR in EU with management to meet 21 clients, most investors were highly satisfied with the company’s operations, capital management and implementation of its business strategy. While concerns on weak refinery earnings existed, investors were relieved that TOP is shifting its earnings portfolio towards higher earnings from power and specialty products. The dividend is expected to be maintained at a 45-50% payout, thanks to TOP’s rising free cash flow and solid balance sheet.
Timely power-led growth offsets weaker refinery business Over the next three years we believe TOP’s earnings will enter a transformation phase that will not only sustain its earnings but also enhance its earnings quality by increasing the proportion of high-quality earnings from power business. We project TOP’s earnings from power will rise from only 4% of TOP’s total earnings in 2013 to 25% by 2018, offsetting weaker refinery earnings, which we project to decline from 65% in 2015-17 to 40% in 2018 due to an oversupply of diesel.
Emerging power earnings growth The increase in power earnings will come from two sources: 1) its two 100%-owned SPP power plants with total capacity of 239MW, already started up in 2016, which we project can generate high-margin earnings of up to THB5m/MW p.a.; and 2) TOP’s 24%-owned Global Power Synergy (GPSC), the earnings growth of which we see accelerating during 2016-19 driven by the capacity growth of its SPP and IPP hydro power plants in Laos.
Limited downside for refinery business After weak market gross refining margins in 1Q16 dragged down by rising crude oil costs and the poor diesel-Dubai spread, we project TOP’s market GRM will remain flat qoq at US$5-6/bbl, given: 1) a flat qoq crude premium of Murban-Dubai of US$3/bbl; and 2) a weaker gasoline-Dubai spread offset by the improved diesel-Dubai spread.
Higher-quality earnings portfolio to justify higher valuation Despite weaker refinery earnings (vs 2015 peak GRM), we think TOP’s earnings will remain strong in 2016-18 thanks to its timely and well implemented strategies that include its diversification into the power business and its downstream expansion into specialty products. In our view, TOP looks attractive trading at 1.1x P/B and 7.4x CY17F P/E vs its CY17F ROE of 15% vs (COE 10.4%)and historical forward P/E average of 7.5x. Key risks to our call include lower-than-expected market GRM and inventory loss.
▎Thailand
ADD (no change) Consensus ratings*: Buy 14 Hold 8 Sell 4
Current price: THB59.75
Target price: THB75.00
Previous target: THB75.00
Up/downside: 25.5%
CIMB / Consensus: 3.7%
Reuters: TOP.BK
Bloomberg: TOP TB
Market cap: US$3,461m
THB121,892m
Average daily turnover: US$9.48m
THB334.1m
Current shares o/s: 2,040m
Free float: 40.0% * Source: Bloomberg
Key changes in this note
No changes.
Source: Bloomberg
Price performance 1M 3M 12M Absolute (%) -4.8 -13.7 13.3
Relative (%) -8 -16.4 17.4
Major shareholders % held PTT Plc 49.5
Credit Agricole 3.1
Analyst(s)
Suwat SINSADOK, CFA, FRM
T (66) 2 657 9228 E [email protected]
[ X ]
SOURCE: COMPANY DATA, CIMB FORECASTS
Financial Summary Dec-14A Dec-15A Dec-16F Dec-17F Dec-18F
Revenue (THBm) 390,090 293,569 212,361 290,239 286,462
Operating EBITDA (THBm) (189) 23,309 25,057 26,139 25,041
Net Profit (THBm) (4,026) 12,181 15,438 16,418 15,448
Core EPS (THB) (2.46) 7.32 7.57 8.05 7.57
Core EPS Growth (138%) 3% 6% (6%)
FD Core P/E (x) NA 8.16 7.90 7.42 7.89
DPS (THB) 1.17 2.43 3.08 3.28 3.08
Dividend Yield 1.96% 4.07% 5.15% 5.48% 5.16%
EV/EBITDA (x) NA 5.83 4.64 3.34 2.01
P/FCFE (x) 13.75 6.73 7.97 4.11 3.19
Net Gearing 32.1% 23.1% 3.2% (20.8%) (48.1%)
P/BV (x) 1.47 1.32 1.19 1.09 1.02
ROE (5.8%) 17.1% 15.9% 15.3% 13.3%
% Change In Core EPS Estimates 0% 0% 0%
CIMB/consensus EPS (x) 1.03 1.11 1.05
87.0
104.1
121.3
138.4
42.0
52.0
62.0
72.0
Price Close Relative to SET (RHS)
10
20
30
Jun-15 Sep-15 Dec-15 Mar-16
Vol m
9

Property Devt & Invt│Vietnam│Equity research│June 22, 2016
Company Note
THIS REPORT IS PREPARED IN ASSOCIATION WITH VNDIRECT SECURITIES CORPORATION. PLEASE SEE DISCLAIMER AND IMPORTANT NOTICES APPEARING AT THE END OF THIS DOCUMENT.IMPORTANT DISCLOSURES, INCLUDING ANY REQUIRED RESEARCH CERTIFICATIONS, ARE PROVIDED AT THE END OF THIS REPORT. IF THIS REPORT IS DISTRIBUTED IN THE UNITED STATES IT IS DISTRIBUTED BY CIMB SECURITIES (USA), INC. AND IS CONSIDERED THIRD-PARTY AFFILIATED RESEARCH.
Powered by the EFA Platform
Khang Dien House Trading and Investment JSC Another high growth year for KDH
■ KDH’s FY16 revenues and profits should surge by 120% and 70% respectively, driven by 66% unit sales growth, and by a ~40% increase in the prices of its houses.
■ The company launched two new projects to tap an increasing demand for villas in D9; over 1/3 of the units in those projects were sold 3 months after being launched.
■ The acquisition of BCI in 2015 tripled the size of KDH’s landbank.
■ KDH is trading at a 35% discount-to-NAV and we expect EPS to grow 40% CAGR over the next 3 years. The BCI acquisition prompted us to raise our target price by 18%.
Growth driven by four gated townhouse projects; pre-sales up 70% Khang Dien House’s revenues and profits look set to continue surging in FY16, after having grown by 100% and 140% respectively last year, driven by KDH’s Mega Village, Melosa Garden, Lucasta, and Venica projects. The company achieved success developing its gated, affordable townhouse communities (~$800/sqm) in HCMC’s suburban Disctrict 9, although Lucasta and Venica are high-end projects. KDH’s pre-sales increased by ~70% this year, implying a continued surge in revenues & profits.
Thriving D9 market, mortgages & affordability also support growth KDH’s earnings growth is supported by its unique affordable townhouse products, which appeal to suburban home buyers, and by a boom in the D9 property market. Growth is also being supported by a dramatic improvement in the availability of mortgages (over ½ of the purchases of KDH’s homes are financed with mortgages), and by the fact that despite rising D9 property prices, the company’s products are still affordable to end-buyers that have a $2,000/month household income (~¼ of HCMC’s households).
Infrastructure development ignited District 9 real estate prices Real estate prices in HCMC’s District 9 suburb are up 50% over the last 2 years, driven by infrastructure improvements - which is one reason KDH has been our top small-cap real estate pick for the last 2 years. A new highway cut the drive time from D9 to the CBD by 40% last year (to 20 minutes), the newly developed Ring Road 2 will connect KDH’s projects to HCMC’s new MRT, and the Rach Chiec 2 bridge, completed in January, connects KDH’s two high-end projects with Samsung’s new US$1.4b factory.
BCI acquisition is a long-term growth driver KDH acquired 57% of BCI in 2015 at a ~55% discount-to-RNAV. BCI has a large land bank in the suburbs at the eastern periphery of HCMC (KDH’s landbank is in the west of HCMC), so the acquisition tripled KDH’s landbank to 400ha, but BCI will only contribute ~15-20% of KDH’s overall revenues & earnings this year. BCI is an SOE so it’s been struggling to monetize its low-cost land bank for years; we think KDH can triple BCI’s annual earnings – but it will take at least 2 years to restructure BCI.
35% Discount-to-NAV and 40% CAGR, 3-year earnings growth KDH is trading at a 35% discount-to-NAV, and we expect earnings to grow 40% CAGR over FY16-18, with longer-term growth driven by the BCI acquisition. Our only concern is the company’s recent foray into the high-end market, because KDH previously stumbled in this segment, but KDH’s two new high-end projects are ~2km from Samsung’s new factory, so buy-to-let purchases of units in those projects have surged.
▎Vietnam
ADD (no change) Consensus ratings*: Buy 2 Hold 2 Sell 0
Current price: VND23,000
Target price: VND29,100
Previous target: VND24,600
Up/downside: 26.5%
CIMB / Consensus: 21.1%
Reuters: KDH.VN
Bloomberg: KDH VN
Market cap: US$185.7m
VND4,140,000m
Average daily turnover: US$0.12m
VND2,767m
Current shares o/s: 126.0m
Free float: 45.0% * Source: Bloomberg
Key changes in this note
FY16F EPS increased by 5%.
FY17F EPS increased by 20%.
Source: Bloomberg
Price performance 1M 3M 12M Absolute (%) 0.4 -1.3 16.4
Relative (%) -1.7 -11 9
Major shareholders % held A Au Investment JSC 11.6
Gama Investment JSC 11.3
Tien Loc Investment JSC 9.9
Analyst(s)
VO Phuc Nguyen
T (84) 90 501 5884 E [email protected]
[ X ]
SOURCE: COMPANY DATA, CIMB FORECASTS
Financial Summary Dec-14A Dec-15A Dec-16F Dec-17F Dec-18F
Total Net Revenues (VNDb) 612 1,050 2,347 2,929 3,898
Operating EBITDA (VNDb) 30.7 202.1 619.4 843.9 991.9
Net Profit (VNDb) 102.1 260.4 434.8 605.0 685.7
Core EPS (VND) 1,659 1,447 2,415 3,361 3,809
Core EPS Growth (12.8%) 66.9% 39.2% 13.3%
FD Core P/E (x) 13.86 11.26 9.52 6.84 6.04
DPS (VND) 0 0 1,500 2,500 3,000
Dividend Yield 0.0% 0.0% 6.5% 10.9% 13.0%
EV/EBITDA (x) 66.81 33.36 10.22 6.84 5.28
P/FCFE (x) 5.99 2.97 NA 12.11 5.73
Net Gearing 38.9% 45.2% 34.6% 21.5% 9.9%
P/BV (x) 1.15 1.27 1.21 1.16 1.12
ROE 8.3% 10.9% 13.0% 17.3% 18.9%
% Change In Core EPS Estimates 4.9% 20.4%
CIMB/consensus EPS (x) 1.10 1.12
89.0
97.9
106.8
115.7
124.6
16,000
18,000
20,000
22,000
24,000
Price Close Relative to VNINDEX (RHS)
500
1000
Jun-15 Sep-15 Dec-15 Mar-16
Vol th
10

Asia Pacific Daily│Equity research│June 23, 2016
REGIONAL HEAD
Michael Greenall Regional Head of Research & HOR Malaysia +60 (3) 2261 9088 [email protected]
COUNTRY HEADS OF RESEARCH
Ivy NG, CFA Bertram LAI Eric LIN Erwan TEGUH Pramod AMTHE Malaysia (Deputy Head) Hong Kong/China Taiwan Indonesia India +60 (3) 2261 9073 +852 2532 1111 +886 (2) 8729 8380 +62 (21) 3006 1720 +91 (22) 6602-5167 [email protected] [email protected] [email protected] [email protected] [email protected] Dohoon LEE Kenneth NG, CFA Kasem PRUNRATANAMALA, CFA South Korea Singapore Thailand +82 (2) 6730 6121 +65 6210 8610 +66 (2) 657 9221 [email protected] [email protected] [email protected] Michael KOKALARI, CFA Jose Paolo Deogracias Fontanilla Yolan SEIMON Vietnam Philippines Sri Lanka +84 907 974408 +63 (2) 888 7118 +94 (11) 2306273 [email protected] [email protected] [email protected] Coverage via partnership arrangement with Coverage via partnership arrangement with SB Equities John Keells Stock Brokers
REGIONAL SECTOR HEADS
KJ KWANG Ivy NG, CFA Raymond YAP, CFA Offshore & Marine Plantations Transportation +82 (2) 6730 6123 +60 (3) 2261 9073 +60 (3) 2261 9072 [email protected] [email protected] [email protected]
7
11

Asia Pacific Daily│Equity research│June 23, 2016
DISCLAIMER WJV#05
The content of this report (including the views and opinions expressed therein, and the information comprised therein) has been prepared by and belongs to CIMB save that (i) if it is a report written by the analyst(s) of John Keells Stock Brokers (“John Keells”), it belongs to John Keells; (ii) if it is a report written by the analyst(s) of SB Equities Inc (“SBE”), it belongs to SBE; and (iii) if it is a report written by the analyst(s) of Morgans Financial Limited (“Morgans”), it belongs to Morgans. This report is distributed by CIMB and in respect of sections of the report relating to (i), (ii) and/or (iii) aforesaid, it is distributed pursuant to an arrangement between John Keells, SBE and Morgans respectively and none of the aforesaid parties is an affiliate of CIMB. This report is not directed to, or intended for distribution to or use by, any person or entity who is a citizen or resident of or located in any locality, state, country or other jurisdiction where such distribution, publication, availability or use would be contrary to law or regulation. By accepting this report, the recipient hereof represents and warrants that he is entitled to receive such report in accordance with the restrictions set forth below and agrees to be bound by the limitations contained herein (including the “Restrictions on Distributions” set out below). Any failure to comply with these limitations may constitute a violation of law. This publication is being supplied to you strictly on the basis that it will remain confidential. No part of this report may be (i) copied, photocopied, duplicated, stored or reproduced in any form by any means or (ii) redistributed or passed on, directly or indirectly, to any other person in whole or in part, for any purpose without the prior written consent of CIMB. The information contained in this research report is prepared from data believed to be correct and reliable at the time of issue of this report. CIMB, John Keells, SBE and/or Morgans, as the case may be, may or may not issue regular reports on the subject matter of this report at any frequency and may cease to do so or change the periodicity of reports at any time. None of CIMB, John Keells, SBE or Morgans is under any obligation to update this report in the event of a material change to the information contained in this report. None of CIMB, John Keells, SBE or Morgans has any and none of them will accept any, obligation to (i) check or ensure that the contents of this report remain current, reliable or relevant, (ii) ensure that the content of this report constitutes all the information a prospective investor may require, (iii) ensure the adequacy, accuracy, completeness, reliability or fairness of any views, opinions and information, and accordingly, CIMB, John Keells, SBE and Morgans and their respective affiliates and related persons (and their respective directors, associates, connected persons and/or employees) shall not be liable in any manner whatsoever for any consequences (including but not limited to any direct, indirect or consequential losses, loss of profits and damages) of any reliance thereon or usage thereof. In particular, CIMB, John Keells, SBE and Morgans disclaim all responsibility and liability for the views and opinions set out in this report. Unless otherwise specified, this report is based upon reasonable sources. Such sources will, unless otherwise specified, for market data, be market data and prices available from the main stock exchange or market where the relevant security is listed, or, where appropriate, any other market. Information on the accounts and business of company(ies) will generally be based on published statements of the company(ies), information disseminated by regulatory information services, other publicly available information and information resulting from our research. Whilst every effort is made to ensure that statements of facts made in this report are accurate, all estimates, projections, forecasts, expressions of opinion and other subjective judgments contained in this report are based on assumptions considered to be reasonable as of the date of the document in which they are contained and must not be construed as a representation that the matters referred to therein will occur. Past performance is not a reliable indicator of future performance. The value of investments may go down as well as up and those investing may, depending on the investments in question, lose more than the initial investment. No report shall constitute an offer or an invitation by or on behalf of CIMB, John Keells, SBE or Morgans or their respective affiliates to any person to buy or sell any investments. CIMB, John Keells, SBE and/or Morgans and/or their respective affiliates and related companies, their directors, associates, connected parties and/or employees may own or have positions in securities of the company(ies) covered in this research report or any securities related thereto and may from time to time add to or dispose of, or may be materially interested in, any such securities. Further, CIMB, John Keells, SBE and/or Morgans and/or their respective affiliates and related companies do and seek to do business with the company(ies) covered in this research report and may from time to time act as market maker or have assumed an underwriting commitment in securities of such company(ies), may sell them to or buy them from customers on a principal basis and may also perform or seek to perform significant investment banking, advisory, underwriting or placement services for or relating to such company(ies) as well as solicit such investment, advisory or other services from any entity mentioned in this report. CIMB, John Keells, SBE and/or Morgans and/or their respective affiliates may enter into an agreement with the company(ies) covered in this report relating to the production of research reports. CIMB, John Keells, SBE and/or Morgans may disclose the contents of this report to the company(ies) covered by it and may have amended the contents of this report following such disclosure. The analyst responsible for the production of this report hereby certifies that the views expressed herein accurately and exclusively reflect his or her personal views and opinions about any and all of the issuers or securities analysed in this report and were prepared independently and autonomously. No part of the compensation of the analyst(s) was, is, or will be directly or indirectly related to the inclusion of specific recommendations(s) or view(s) in this report. The analyst(s) who prepared this research report are prohibited from receiving any compensation, incentive or bonus based on specific investment banking transactions or for providing a specific recommendation for, or view of, a particular company. Information barriers and other arrangements may be established where necessary to prevent conflicts of interests arising. However, the analyst(s) may receive compensation that is based on his/their coverage of company(ies) in the performance of his/their duties or the performance of his/their recommendations and the research personnel involved in the preparation of this report may also participate in the solicitation of the businesses as described above. In reviewing this research report, an investor should be aware that any or all of the foregoing, among other things, may give rise to real or potential conflicts of interest. Additional information is, subject to the duties of confidentiality, available on request. The term “John Keells Stock Brokers” shall, unless the context otherwise requires, mean each of John Keells Stock Brokers and its affiliates, subsidiaries and related companies. The term “SB Equities Inc.” shall, unless the context otherwise requires, mean each of SB Equities Inc. and its affiliates, subsidiaries and related companies. The term “Morgans Financial Limited” shall, unless the context otherwise requires, mean each of Morgans Financial Limited and its affiliates, subsidiaries and related companies. The term “CIMB” shall denote, where appropriate, the relevant entity distributing or disseminating the report in the particular jurisdiction referenced below, or, in every other case, CIMB Group Holdings
8
12

Asia Pacific Daily│Equity research│June 23, 2016
Berhad ("CIMBGH") and its affiliates, subsidiaries and related companies.
Country CIMB Entity Regulated by Hong Kong CIMB Securities Limited Securities and Futures Commission Hong Kong India CIMB Securities (India) Private Limited Securities and Exchange Board of India (SEBI) Indonesia PT CIMB Securities Indonesia Financial Services Authority of Indonesia Malaysia CIMB Investment Bank Berhad Securities Commission Malaysia Singapore CIMB Research Pte. Ltd. Monetary Authority of Singapore South Korea CIMB Securities Limited, Korea Branch Financial Services Commission and Financial Supervisory Service Taiwan CIMB Securities Limited, Taiwan Branch Financial Supervisory Commission Thailand CIMB Securities (Thailand) Co. Ltd. Securities and Exchange Commission Thailand
Information in this report is a summary derived from individual research reports. As such, readers are directed to the individual research report or note to review the individual Research Analyst’s full analysis of the subject company. Important disclosures relating to the companies that are the subject of research reports published by CIMB, John Keells, SBE or Morgans, as the case may be, and the proprietary position by each of them and shareholdings of its Research Analysts’ who prepared the report in the securities of the company(s) are available in the individual research report. This report does not purport to contain all the information that a prospective investor may require. CIMB, John Keells, SBE and Morgans and their respective affiliates do not make any guarantee, representation or warranty, express or implied, as to the adequacy, accuracy, completeness, reliability or fairness of any such information and opinion contained in this report. None of CIMB, John Keells, SBE, Morgans and their respective affiliates and related persons shall be liable in any manner whatsoever for any consequences (including but not limited to any direct, indirect or consequential losses, loss of profits and damages) of any reliance thereon or usage thereof. This report is general in nature and has been prepared for information purposes only. It is intended for circulation amongst CIMB and its affiliates’ clients generally and does not have regard to the specific investment objectives, financial situation and the particular needs of any specific person who may receive this report. The information and opinions in this report are not and should not be construed or considered as an offer, recommendation or solicitation to buy or sell the subject securities, related investments or other financial instruments or any derivative instrument, or any rights pertaining thereto. Investors are advised to make their own independent evaluation of the information contained in this research report, consider their own individual investment objectives, financial situation and particular needs and consult their own professional and financial advisers as to the legal, business, financial, tax and other aspects before participating in any transaction in respect of the securities of company(ies) covered in this research report. The securities of such company(ies) may not be eligible for sale in all jurisdictions or to all categories of investors.
Australia : The distribution of this report is not an offer to buy or sell to any person within or outside Australia or a solicitation to any person within or outside of Australia to buy or sell any instrument described herein. This report is being issued outside Australia to a limited number of institutional investors and may not be provided to any person other than the original recipient and may not be reproduced or used for any other purposes. Canada: This research report has not been prepared in accordance with the disclosure requirements of Dealer Member Rule 3400 – Research Restrictions and Disclosure Requirements of the Investment Industry Regulatory Organization of Canada. For any research report distributed by CIBC, further disclosures related to CIBC conflicts of interest can be found at https://researchcentral.cibcwm.com . China: For the purpose of this report, the People’s Republic of China (“PRC”) does not include the Hong Kong Special Administrative Region, the Macau Special Administrative Region or Taiwan. The distributor of this report has not been approved or licensed by the China Securities Regulatory Commission or any other relevant regulatory authority or governmental agency in the PRC. This report contains only marketing information. The distribution of this report is not an offer to buy or sell to any person within or outside PRC or a solicitation to any person within or outside of PRC to buy or sell any instruments described herein. This report is being issued outside the PRC to a limited number of institutional investors and may not be provided to any person other than the original recipient and may not be reproduced or used for any other purpose. France: Only qualified investors within the meaning of French law shall have access to this report. This report shall not be considered as an offer to subscribe to, or used in connection with, any offer for subscription or sale or marketing or direct or indirect distribution of financial instruments and it is not intended as a solicitation for the purchase of any financial instrument. Germany: This report is only directed at persons who are professional investors as defined in sec 31a(2) of the German Securities Trading Act (WpHG). This publication constitutes research of a non-binding nature on the market situation and the investment instruments cited here at the time of the publication of the information. The current prices/yields in this issue are based upon closing prices from Bloomberg as of the day preceding publication. Please note that neither the German Federal Financial Supervisory Agency (BaFin), nor any other supervisory authority exercises any control over the content of this report. Hong Kong: This report is issued and distributed in Hong Kong by CIMB Securities Limited (“CHK”) which is licensed in Hong Kong by the Securities and Futures Commission for Type 1 (dealing in securities), Type 4 (advising on securities) and Type 6 (advising on corporate finance) activities. Any investors wishing to purchase or otherwise deal in the securities covered in this report should contact the Head of Sales at CIMB Securities Limited. The views and opinions in this research report are of CIMB, John Keells, SBE or Morgans, as the case may be, as of the date hereof and are subject to change. If the Financial Services and Markets Act of the United Kingdom or the rules of the Financial Conduct Authority apply to a recipient, our obligations owed to such recipient therein are unaffected. CHK has no obligation to update its opinion or the information in this research report. This publication is strictly confidential and is for private circulation only to clients of CHK. India: This report is issued and distributed in India by CIMB Securities (India) Private Limited (“CIMB India”) which is registered with the National Stock Exchange of India Limited and BSE Limited as a trading and clearing member under the Securities and Exchange Board of India (Stock
9
13

Asia Pacific Daily│Equity research│June 23, 2016
Brokers and Sub-Brokers) Regulations, 1992. In accordance with the provisions of Regulation 4(g) of the Securities and Exchange Board of India (Investment Advisers) Regulations, 2013, CIMB India is not required to seek registration with the Securities and Exchange Board of India (“SEBI”) as an Investment Adviser. CIMB India is registered with SEBI as a Research Analyst pursuant to the SEBI (Research Analysts) Regulations, 2014 ("Regulations"). This report does not take into account the particular investment objectives, financial situations, or needs of the recipients. It is not intended for and does not deal with prohibitions on investment due to law/jurisdiction issues etc. which may exist for certain persons/entities. Recipients should rely on their own investigations and take their own professional advice before investment. The report is not a “prospectus” as defined under Indian Law, including the Companies Act, 2013, and is not, and shall not be, approved by, or filed or registered with, any Indian regulator, including any Registrar of Companies in India, SEBI, any Indian stock exchange, or the Reserve Bank of India. No offer, or invitation to offer, or solicitation of subscription with respect to any such securities listed or proposed to be listed in India is being made, or intended to be made, to the public, or to any member or section of the public in India, through or pursuant to this report. The research analysts, strategists or economists principally responsible for the preparation of this research report are segregated from the other activities of CIMB India and they have received compensation based upon various factors, including quality, accuracy and value of research, firm profitability or revenues, client feedback and competitive factors. Research analysts', strategists' or economists' compensation is not linked to investment banking or capital markets transactions performed or proposed to be performed by CIMB India or its affiliates. Indonesia: This report is issued and distributed by PT CIMB Securities Indonesia (“CIMBI”). The views and opinions in this research report are our own as of the date hereof and are subject to change. If the Financial Services and Markets Act of the United Kingdom or the rules of the Financial Conduct Authority apply to a recipient, our obligations owed to such recipient therein are unaffected. CIMBI has no obligation to update its opinion or the information in this research report. Neither this report nor any copy hereof may be distributed in Indonesia or to any Indonesian citizens wherever they are domiciled or to Indonesian residents except in compliance with applicable Indonesian capital market laws and regulations. This research report is not an offer of securities in Indonesia. The securities referred to in this research report have not been registered with the Financial Services Authority (Otoritas Jasa Keuangan) pursuant to relevant capital market laws and regulations, and may not be offered or sold within the territory of the Republic of Indonesia or to Indonesian citizens through a public offering or in circumstances which constitute an offer within the meaning of the Indonesian capital market law and regulations. Ireland: CIMB is not an investment firm authorised in the Republic of Ireland and no part of this document should be construed as CIMB acting as, or otherwise claiming or representing to be, an investment firm authorised in the Republic of Ireland. Malaysia: This report is issued and distributed by CIMB Investment Bank Berhad (“CIMB”) solely for the benefit of and for the exclusive use of our clients. If the Financial Services and Markets Act of the United Kingdom or the rules of the Financial Conduct Authority apply to a recipient, our obligations owed to such recipient therein are unaffected. CIMB has no obligation to update, revise or reaffirm its opinion or the information in this research reports after the date of this report. New Zealand: In New Zealand, this report is for distribution only to persons who are wholesale clients pursuant to section 5C of the Financial Advisers Act 2008. Singapore: This report is issued and distributed by CIMB Research Pte Ltd (“CIMBR”). CIMBR is a financial adviser licensed under the Financial Advisers Act, Cap 110 (“FAA”) for advising on investment products, by issuing or promulgating research analyses or research reports, whether in electronic, print or other form. Accordingly CIMBR is a subject to the applicable rules under the FAA unless it is able to avail itself to any prescribed exemptions. Recipients of this report are to contact CIMB Research Pte Ltd, 50 Raffles Place, #19-00 Singapore Land Tower, Singapore in respect of any matters arising from, or in connection with this report. CIMBR has no obligation to update its opinion or the information in this research report. This publication is strictly confidential and is for private circulation only. If you have not been sent this report by CIMBR directly, you may not rely, use or disclose to anyone else this report or its contents. If the recipient of this research report is not an accredited investor, expert investor or institutional investor, CIMBR accepts legal responsibility for the contents of the report without any disclaimer limiting or otherwise curtailing such legal responsibility. If the recipient is an accredited investor, expert investor or institutional investor, the recipient is deemed to acknowledge that CIMBR is exempt from certain requirements under the FAA and its attendant regulations, and as such, is exempt from complying with the following : (a) Section 25 of the FAA (obligation to disclose product information); (b) Section 27 (duty not to make recommendation with respect to any investment product without having a reasonable basis where you may be reasonably expected to rely on the recommendation) of the FAA; (c) MAS Notice on Information to Clients and Product Information Disclosure [Notice No. FAA-N03]; (d) MAS Notice on Recommendation on Investment Products [Notice No. FAA-N16]; (e) Section 36 (obligation on disclosure of interest in securities), and (f) any other laws, regulations, notices, directive, guidelines, circulars and practice notes which are relates to the above, to the extent permitted by applicable laws, as may be amended from time to time, and any other laws, regulations, notices, directive, guidelines, circulars, and practice notes as we may notify you from time to time. In addition, the recipient who is an accredited investor, expert investor or institutional investor acknowledges that a CIMBR is exempt from Section 27 of the FAA, the recipient will also not be able to file a civil claim against CIMBR for any loss or damage arising from the recipient’s reliance on any recommendation made by CIMBR which would otherwise be a right that is available to the recipient under Section 27 of the FAA, the recipient will also not be able to file a civil claim against CIMBR for any loss or damage arising from the recipient’s reliance on any recommendation made by CIMBR which would otherwise be a right that is available to the recipient under Section 27 of the FAA. South Korea: This report is issued and distributed in South Korea by CIMB Securities Limited, Korea Branch (“CIMB Korea”) which is licensed as a cash equity broker, and regulated by the Financial Services Commission and Financial Supervisory Service of Korea. In South Korea, this report is for distribution only to professional investors under Article 9(5) of the Financial Investment Services and Capital Market Act of Korea
10
14
Asia Pacific Daily│Equity research│June 23, 2016
(“FSCMA”). Spain: This document is a research report and it is addressed to institutional investors only. The research report is of a general nature and not personalised and does not constitute investment advice so, as the case may be, the recipient must seek proper advice before adopting any investment decision. This document does not constitute a public offering of securities. CIMB is not registered with the Spanish Comision Nacional del Mercado de Valores to provide investment services. Sweden: This report contains only marketing information and has not been approved by the Swedish Financial Supervisory Authority. The distribution of this report is not an offer to sell to any person in Sweden or a solicitation to any person in Sweden to buy any instruments described herein and may not be forwarded to the public in Sweden. Switzerland: This report has not been prepared in accordance with the recognized self-regulatory minimal standards for research reports of banks issued by the Swiss Bankers’ Association (Directives on the Independence of Financial Research). Taiwan: This research report is not an offer or marketing of foreign securities in Taiwan. The securities as referred to in this research report have not been and will not be registered with the Financial Supervisory Commission of the Republic of China pursuant to relevant securities laws and regulations and may not be offered or sold within the Republic of China through a public offering or in circumstances which constitutes an offer or a placement within the meaning of the Securities and Exchange Law of the Republic of China that requires a registration or approval of the Financial Supervisory Commission of the Republic of China. Thailand: This report is issued and distributed by CIMB Securities (Thailand) Company Limited (“CIMBS”) based upon sources believed to be reliable (but their accuracy, completeness or correctness is not guaranteed). The statements or expressions of opinion herein were arrived at after due and careful consideration for use as information for investment. Such opinions are subject to change without notice and CIMBS has no obligation to update its opinion or the information in this research report. If the Financial Services and Markets Act of the United Kingdom or the rules of the Financial Conduct Authority apply to a recipient, our obligations owed to such recipient are unaffected. CIMB Securities (Thailand) Co., Ltd. may act or acts as Market Maker, and issuer and offerer of Derivative Warrants and Structured Note which may have the following securities as its underlying securities. Investors should carefully read and study the details of the derivative warrants in the prospectus before making investment decisions. AAV, ADVANC, AMATA, ANAN, AOT, AP, BA, BANPU, BBL, BCP, BDMS, BEAUTY, BEC, BEM, BH, BJCHI, BLA, BLAND, BTS, CBG, CENTEL, CHG, CK, CKP, CPALL, CPF, CPN, DELTA, DTAC, EARTH, EGCO, EPG, GL, GLOW, GPSC, GUNKUL, HANA, HMPRO, ICHI, INTUCH, IRPC, ITD, IVL, JAS, KBANK, KCE, KKP, KTB, KTC, LH, LHBANK, LPN, M, MAJOR, MINT, PLANB, PLAT, PS, PTG, PTT, PTTEP, PTTGC, QH, ROBINS, RS, S, SAMART, SAMTEL, SAWAD, SCB, SCC, SCCC, SCN, SGP, SIRI, SPALI, SPCG, STEC, STPI, SVI, TASCO, TCAP, THAI, THCOM, TICON, TISCO, TMB, TOP, TPIPL, TRUE, TTA, TTCL, TTW, TU, UNIQ, UV, VGI, VNG, WHA, WORK. Corporate Governance Report: The disclosure of the survey result of the Thai Institute of Directors Association (“IOD”) regarding corporate governance is made pursuant to the policy of the Office of the Securities and Exchange Commission. The survey of the IOD is based on the information of a company listed on the Stock Exchange of Thailand and the Market for Alternative Investment disclosed to the public and able to be accessed by a general public investor. The result, therefore, is from the perspective of a third party. It is not an evaluation of operation and is not based on inside information. The survey result is as of the date appearing in the Corporate Governance Report of Thai Listed Companies. As a result, the survey result may be changed after that date. CIMBS does not confirm nor certify the accuracy of such survey result.
Score Range: 90 - 100 80 - 89 70 - 79 Below 70 or No Survey Result Description: Excellent Very Good Good N/A
United Arab Emirates: The distributor of this report has not been approved or licensed by the UAE Central Bank or any other relevant licensing authorities or governmental agencies in the United Arab Emirates. This report is strictly private and confidential and has not been reviewed by, deposited or registered with UAE Central Bank or any other licensing authority or governmental agencies in the United Arab Emirates. This report is being issued outside the United Arab Emirates to a limited number of institutional investors and must not be provided to any person other than the original recipient and may not be reproduced or used for any other purpose. Further, the information contained in this report is not intended to lead to the sale of investments under any subscription agreement or the conclusion of any other contract of whatsoever nature within the territory of the United Arab Emirates. United Kingdom: In the United Kingdom and European Economic Area, this report is being disseminated by CIMB Securities (UK) Limited (“CIMB UK”). CIMB UK is authorized and regulated by the Financial Conduct Authority and its registered office is at 27 Knightsbridge, London, SW1X7YB. Unless specified to the contrary, this report has been issued and approved for distribution in the U.K. and the EEA by CIMB UK. Investment research issued by CIMB UK has been prepared in accordance with CIMB Group’s policies for managing conflicts of interest arising as a result of publication and distribution of investment research. This report is for distribution only to, and is solely directed at, selected persons on the basis that those persons: (a) are eligible counterparties and professional clients of CIMB UK; (b) have professional experience in matters relating to investments falling within Article 19(5) of the Financial Services and Markets Act 2000 (Financial Promotion) Order 2005 (as amended, the “Order”), (c) fall within Article 49(2)(a) to (d) (“high net worth companies, unincorporated associations etc”) of the Order; (d) are outside the United Kingdom subject to relevant regulation in each jurisdiction, or (e) are persons to whom an invitation or inducement to engage in investment activity (within the meaning of section 21 of the Financial Services and Markets Act 2000) in connection with any investments to which this report relates may otherwise lawfully be communicated or caused to be communicated (all such persons together being referred to as “relevant persons”). This report is directed only at relevant persons and must not be acted on or relied on by persons who are not relevant persons. Any investment or investment activity to which this report relates is available only to relevant persons and will be engaged in only with relevant persons. Where this report is labelled as non-independent, it does not provide an impartial or objective assessment of the subject matter and does not constitute independent “investment research” under the applicable rules of the Financial Conduct Authority in the UK. Consequently, any such
11
15
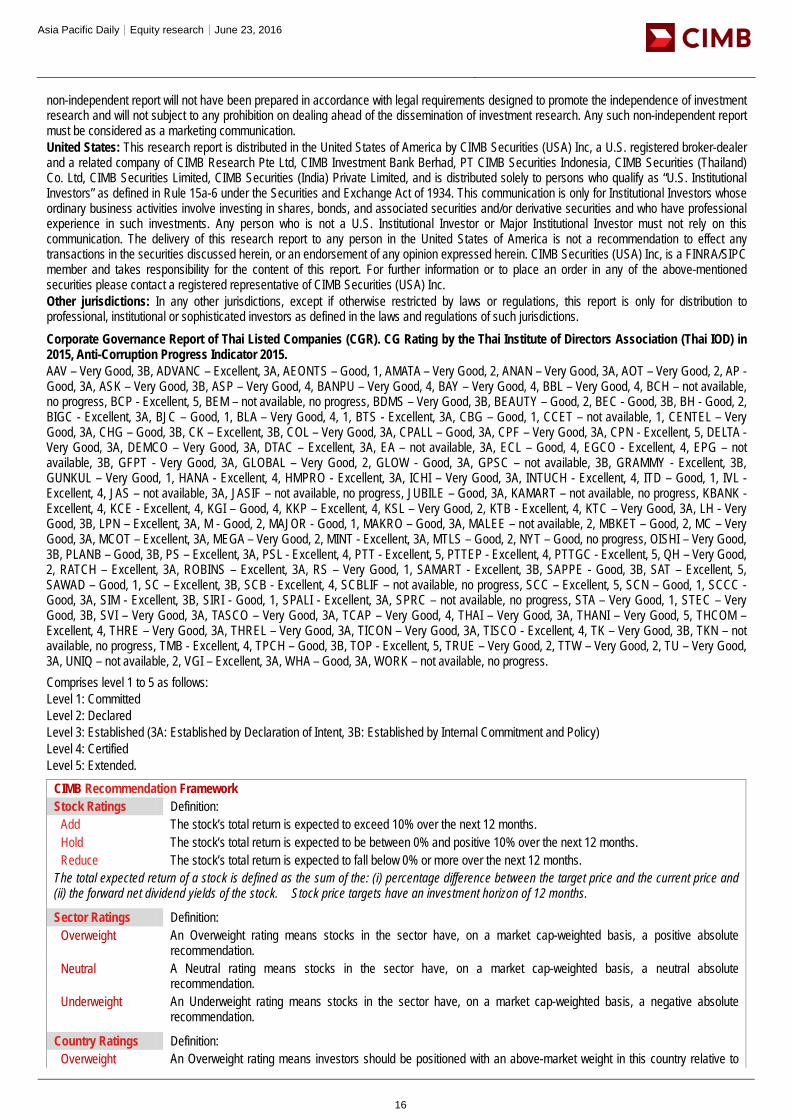
Asia Pacific Daily│Equity research│June 23, 2016
non-independent report will not have been prepared in accordance with legal requirements designed to promote the independence of investment research and will not subject to any prohibition on dealing ahead of the dissemination of investment research. Any such non-independent report must be considered as a marketing communication. United States: This research report is distributed in the United States of America by CIMB Securities (USA) Inc, a U.S. registered broker-dealer and a related company of CIMB Research Pte Ltd, CIMB Investment Bank Berhad, PT CIMB Securities Indonesia, CIMB Securities (Thailand) Co. Ltd, CIMB Securities Limited, CIMB Securities (India) Private Limited, and is distributed solely to persons who qualify as “U.S. Institutional Investors” as defined in Rule 15a-6 under the Securities and Exchange Act of 1934. This communication is only for Institutional Investors whose ordinary business activities involve investing in shares, bonds, and associated securities and/or derivative securities and who have professional experience in such investments. Any person who is not a U.S. Institutional Investor or Major Institutional Investor must not rely on this communication. The delivery of this research report to any person in the United States of America is not a recommendation to effect any transactions in the securities discussed herein, or an endorsement of any opinion expressed herein. CIMB Securities (USA) Inc, is a FINRA/SIPC member and takes responsibility for the content of this report. For further information or to place an order in any of the above-mentioned securities please contact a registered representative of CIMB Securities (USA) Inc. Other jurisdictions: In any other jurisdictions, except if otherwise restricted by laws or regulations, this report is only for distribution to professional, institutional or sophisticated investors as defined in the laws and regulations of such jurisdictions.
Corporate Governance Report of Thai Listed Companies (CGR). CG Rating by the Thai Institute of Directors Association (Thai IOD) in 2015, Anti-Corruption Progress Indicator 2015. AAV – Very Good, 3B, ADVANC – Excellent, 3A, AEONTS – Good, 1, AMATA – Very Good, 2, ANAN – Very Good, 3A, AOT – Very Good, 2, AP - Good, 3A, ASK – Very Good, 3B, ASP – Very Good, 4, BANPU – Very Good, 4, BAY – Very Good, 4, BBL – Very Good, 4, BCH – not available, no progress, BCP - Excellent, 5, BEM – not available, no progress, BDMS – Very Good, 3B, BEAUTY – Good, 2, BEC - Good, 3B, BH - Good, 2, BIGC - Excellent, 3A, BJC – Good, 1, BLA – Very Good, 4, 1, BTS - Excellent, 3A, CBG – Good, 1, CCET – not available, 1, CENTEL – Very Good, 3A, CHG – Good, 3B, CK – Excellent, 3B, COL – Very Good, 3A, CPALL – Good, 3A, CPF – Very Good, 3A, CPN - Excellent, 5, DELTA - Very Good, 3A, DEMCO – Very Good, 3A, DTAC – Excellent, 3A, EA – not available, 3A, ECL – Good, 4, EGCO - Excellent, 4, EPG – not available, 3B, GFPT - Very Good, 3A, GLOBAL – Very Good, 2, GLOW - Good, 3A, GPSC – not available, 3B, GRAMMY - Excellent, 3B, GUNKUL – Very Good, 1, HANA - Excellent, 4, HMPRO - Excellent, 3A, ICHI – Very Good, 3A, INTUCH - Excellent, 4, ITD – Good, 1, IVL - Excellent, 4, JAS – not available, 3A, JASIF – not available, no progress, JUBILE – Good, 3A, KAMART – not available, no progress, KBANK - Excellent, 4, KCE - Excellent, 4, KGI – Good, 4, KKP – Excellent, 4, KSL – Very Good, 2, KTB - Excellent, 4, KTC – Very Good, 3A, LH - Very Good, 3B, LPN – Excellent, 3A, M - Good, 2, MAJOR - Good, 1, MAKRO – Good, 3A, MALEE – not available, 2, MBKET – Good, 2, MC – Very Good, 3A, MCOT – Excellent, 3A, MEGA – Very Good, 2, MINT - Excellent, 3A, MTLS – Good, 2, NYT – Good, no progress, OISHI – Very Good, 3B, PLANB – Good, 3B, PS – Excellent, 3A, PSL - Excellent, 4, PTT - Excellent, 5, PTTEP - Excellent, 4, PTTGC - Excellent, 5, QH – Very Good, 2, RATCH – Excellent, 3A, ROBINS – Excellent, 3A, RS – Very Good, 1, SAMART - Excellent, 3B, SAPPE - Good, 3B, SAT – Excellent, 5, SAWAD – Good, 1, SC – Excellent, 3B, SCB - Excellent, 4, SCBLIF – not available, no progress, SCC – Excellent, 5, SCN – Good, 1, SCCC - Good, 3A, SIM - Excellent, 3B, SIRI - Good, 1, SPALI - Excellent, 3A, SPRC – not available, no progress, STA – Very Good, 1, STEC – Very Good, 3B, SVI – Very Good, 3A, TASCO – Very Good, 3A, TCAP – Very Good, 4, THAI – Very Good, 3A, THANI – Very Good, 5, THCOM – Excellent, 4, THRE – Very Good, 3A, THREL – Very Good, 3A, TICON – Very Good, 3A, TISCO - Excellent, 4, TK – Very Good, 3B, TKN – not available, no progress, TMB - Excellent, 4, TPCH – Good, 3B, TOP - Excellent, 5, TRUE – Very Good, 2, TTW – Very Good, 2, TU – Very Good, 3A, UNIQ – not available, 2, VGI – Excellent, 3A, WHA – Good, 3A, WORK – not available, no progress.
Comprises level 1 to 5 as follows: Level 1: Committed Level 2: Declared Level 3: Established (3A: Established by Declaration of Intent, 3B: Established by Internal Commitment and Policy) Level 4: Certified Level 5: Extended.
CIMB Recommendation Framework Stock Ratings Definition: Add The stock’s total return is expected to exceed 10% over the next 12 months. Hold The stock’s total return is expected to be between 0% and positive 10% over the next 12 months. Reduce The stock’s total return is expected to fall below 0% or more over the next 12 months. The total expected return of a stock is defined as the sum of the: (i) percentage difference between the target price and the current price and (ii) the forward net dividend yields of the stock. Stock price targets have an investment horizon of 12 months.
Sector Ratings Definition: Overweight An Overweight rating means stocks in the sector have, on a market cap-weighted basis, a positive absolute
recommendation. Neutral A Neutral rating means stocks in the sector have, on a market cap-weighted basis, a neutral absolute
recommendation. Underweight An Underweight rating means stocks in the sector have, on a market cap-weighted basis, a negative absolute
recommendation.
Country Ratings Definition: Overweight An Overweight rating means investors should be positioned with an above-market weight in this country relative to
12
16

Asia Pacific Daily│Equity research│June 23, 2016
benchmark. Neutral A Neutral rating means investors should be positioned with a neutral weight in this country relative to benchmark. Underweight An Underweight rating means investors should be positioned with a below-market weight in this country relative to
benchmark.
13
17