independent alignment review of the science missouri ... · independent alignment review of the...
TRANSCRIPT

Human Resources Research Organization (HumRRO) i
FR-12-64
Independent Alignment Review of the Science Missouri Assessment Program-Alternate (MAP-A)
Final Report
Prepared for: Missouri Department of Elementary and Secondary Education 205 Jefferson Street P. O. Box 480 Jefferson City, Missouri 65102
Authors: Yvette M. Nemeth
Arthur Thacker Richard Deatz Erin Smith
Date: January 31, 2013

Chapter Number or Title goes here i
FR-12-64
Independent Alignment Review of the Science Missouri Assessment Program-Alternate (MAP-A)
Final Report
Prepared for: Missouri Department of Elementary and Secondary Education 205 Jefferson Street P. O. Box 480 Jefferson City, Missouri 65102
Authors: Yvette M. Nemeth
Arthur Thacker Richard Deatz Erin Smith
Date: January 31, 2013

Missouri Department of Elementary & Secondary Education Non-Discrimination Notice
It is the policy of the Missouri Department of Elementary and Secondary Education not to discriminate on the basis of race, color, religion, gender, national origin, age, or disability in its programs or employment practices as required by Title VI and VII of the Civil Rights Act of 1964, Title IX of the Education Amendments of 1972, Section 504 of the Rehabilitation Act of 1973, the Age Discrimination Act of 1975 and Title II of the Americans with Disabilities Act of 1990. Inquiries related to Department programs and to the location of services, activities, and facilities that are accessible by persons with disabilities may be directed to the Jefferson State Office Building, Office of the General Counsel, Coordinator–Civil Rights Compliance (Title VI/Title IX/504/ADA/Age Act), 6th Floor, 205 Jefferson Street, P.O. Box 480, Jefferson City, MO 65102-0480; telephone number (573) 526-4757 or TTY (800) 735-2966, fax (573) 522-4883, email [email protected]

Executive Summary i
Executive Summary
Purpose and Scope of Work The Missouri Department of Elementary and Secondary Education (DESE) requested an external independent alignment study (evaluation/analysis) of the Missouri Assessment Program-Alternate (MAP-A) in science for students with significant cognitive disabilities. Specifically, DESE wanted an evaluation of the alignment between the MAP-A portfolio assessment, the extended content standards (or Alternate Grade-Level Expectations), and the state content standards (or Grade-/Course-Level Expectations). Missouri uses the MAP-A portfolio assessment in the federal and state accountability programs. DESE awarded Human Resources Research Organization (HumRRO) the contract to conduct this alignment study, and work began on September 18, 2012. DESE requested the alignment study to meet federal requirements. The federal requirement of the U.S. Department of Education (USDE) stems from the No Child Left Behind (NCLB) Act of 2001. Alternate assessments are included in this requirement. The federal government has established regulations for students with the most significant cognitive disabilities in the calculation of school and district Adequate Yearly Progress (AYP) determinations, often referred to as the “1% rule” (U.S. Department of Education, 2005). This rule allows the state to accommodate students with the most significant cognitive disabilities in its AYP calculations by setting different performance expectations for up to 1% of the student population. As a result, states can develop alternate or extended content standards, achievement standards, and assessments designed to more fairly and accurately demonstrate the achievement of these students. However, the content on which these students are assessed must be academic, and the achievement of these students must continue to reflect challenging academic goals. As such, states must show that the extended standards and alternate achievement standards for these students link to the regular grade-level expectations, although the breadth and depth of these expectations can be reduced (USDE, 2005).
Methodology The alignment evaluation performed was twofold: 1) the science Alternate Grade-Level Expectations (AGLEs) were aligned to the Missouri Grade-/Course-Level Expectations (GLEs/CLEs) for science in grades 5, 8, and 11; 2) the 2012 science MAP-A was aligned to the science AGLEs. Alignment evaluation involved a review of the science AGLEs and sample portfolios by Missouri educators highly familiar with the content standards and the assessment. Reviewers included both regular and special education teachers, either currently teaching or recently retired, as well as special education administrators and curriculum specialists. Review of Content Alignment and Accessibility For the evaluations of the AGLEs and portfolios, HumRRO convened three separate panels (each comprised of five - six members) to review the grades 5, 8, and 11 science portfolios. Each panelist performed multiple ratings in order to carry out the comparison of the science AGLEs to the Missouri GLEs/CLEs for science and science MAP-A portfolios (per grade test) to the

ii Executive Summary
AGLEs. The purpose of these tasks was to evaluate the content alignment of the AGLEs and portfolios relative to the GLEs/CLEs. In addition, panelists reviewed the content and performance accessibility of the AGLEs and portfolios to the population of students for whom the alternate assessment was designed. HumRRO developed the review panels with the assistance of DESE. Panelists were recruited by HumRRO from a database of Missouri educators, and district administrators were contacted to recruit new panelists. Every effort was made to assemble panels consisting of teachers reflecting those who work with the population of students who take the MAP-A, as well as those with expertise in science content at the applicable grade ranges. Panels were convened at the University of Missouri Assessment Resource Center (ARC). HumRRO directed the actual reviews independently of DESE. HumRRO used the Links for Academic Learning alignment method (referred to as the LAL method in this report) developed by the National Alternate Assessment Center (NAAC) to conduct the reviews and analyze the results (Flowers, Wakeman, Browder, & Karvonen, 2007). This method requires panelists to rate the content standards and assessments on multiple dimensions. Ratings are then analyzed and interpreted based on seven criteria. These criteria are listed below (adapted from Flowers et al., 2007):
Criterion 1: Academic - The content is academic and includes the major domains/strands of the content area as reflected in state and national standards (e.g., mathematics, reading, science). Criterion 2: Age Appropriate - The content is referenced to the student’s assigned grade level (based on chronological age). Criterion 3: Standards Fidelity
a. Content Centrality - The target content maintains fidelity with the content of the original grade-level standards.
b. Performance Centrality - The focus of achievement maintains fidelity with the specified performance in the grade-level standards.
Criterion 4: Content Coverage - (Webb alignment indicators) - The content differs from grade level in range, balance, and depth of knowledge (DOK), but matches high expectations set for students with the most significant cognitive disabilities. Criterion 5: Content Differentiation - There is some differentiation in content across grade levels or grade bands. Criterion 6: Achievement - The expected achievement for students is to show learning of grade referenced academic content. Criterion 7: Performance Accuracy - The potential barriers to demonstrating what students know and can do are minimized in the assessment to increase measurement accuracy of student performance.
Under Criterion 4 above, we refer to the “Webb alignment indicators.” Dr. Norman Webb (2005) developed an alignment procedure involving an evaluation of the assessment to the content standards using four statistics. These statistics indicate how well an assessment covers the content standards in terms of content breadth and depth. Webb’s method generally has been applied to regular general education assessments, and some special education researchers (i.e.,
Executive Summary iii
Flowers et al., 2007) consider this approach to be limited as a primary alignment method for alternate assessments. However, the Webb alignment indicators are still informative regarding content coverage even for an alternate assessment. Thus, the LAL method includes the Webb alignment indicators. These alignment indicators include:
Categorical concurrence – determines the degree of overall content coverage by the assessment for each content strand.
Range-of-knowledge correspondence – indicates the specific content expectations (e.g., standard, benchmark) assessed within each strand.
Balance-of-knowledge representation – provides a statistical index reflecting the distribution of assessed content within each strand, meaning how evenly the content is assessed.
Depth-of-knowledge consistency – compares the cognitive complexity ratings of the items with the complexity ratings of each content standard.
The outcomes of the analyses on the LAL criteria and Webb alignment indicators are evaluated against decision rules to judge their acceptability.
Summary Alignment Results Key Findings and Conclusions The results of the alignment reviews provide positive support for the content validity of the MAP-A science assessment based on several outcomes. First, the majority of panelists found all of the grade-level AGLEs for science to be linked adequately to the GLEs/CLEs in content breadth and depth. Second, the majority of MAP-A performance tasks across grades were rated as matched to AGLEs. Finally, panelists determined that the AGLEs and portfolios are accessible to a wide range of students with various physical and cognitive disabilities. As with most alignment reviews, the findings also point to some areas where content and performance alignment could be strengthened over time. We present a summary of more detailed conclusions regarding degree of alignment on various LAL dimensions below. Science AGLEs to GLEs/CLEs All MAP-A content was judged to be academic. Criterion 1 from the LAL method was initially designed to determine if academic assessments (e.g., math) also contained functional life skills (e.g. hygiene) that represented construct irrelevant (not related to math) variance. It is rare for modern alternate assessments to include non-academic content. Table 1 displays the overall conclusions regarding content alignment between the AGLEs and the GLEs/CLEs for science. These judgments are based on whether the AGLEs achieved acceptable levels of linkage with the full content standards for each set of grade level AGLEs. Criterion 5, Content Differentiation, was not evaluated during this alignment study since the assessment is for a grade span and not individual grades. Additionally, the AGLEs are summative such that all of the AGLEs in grade 5 are also in grade 8 and all AGLEs in grade 8
iv Executive Summary
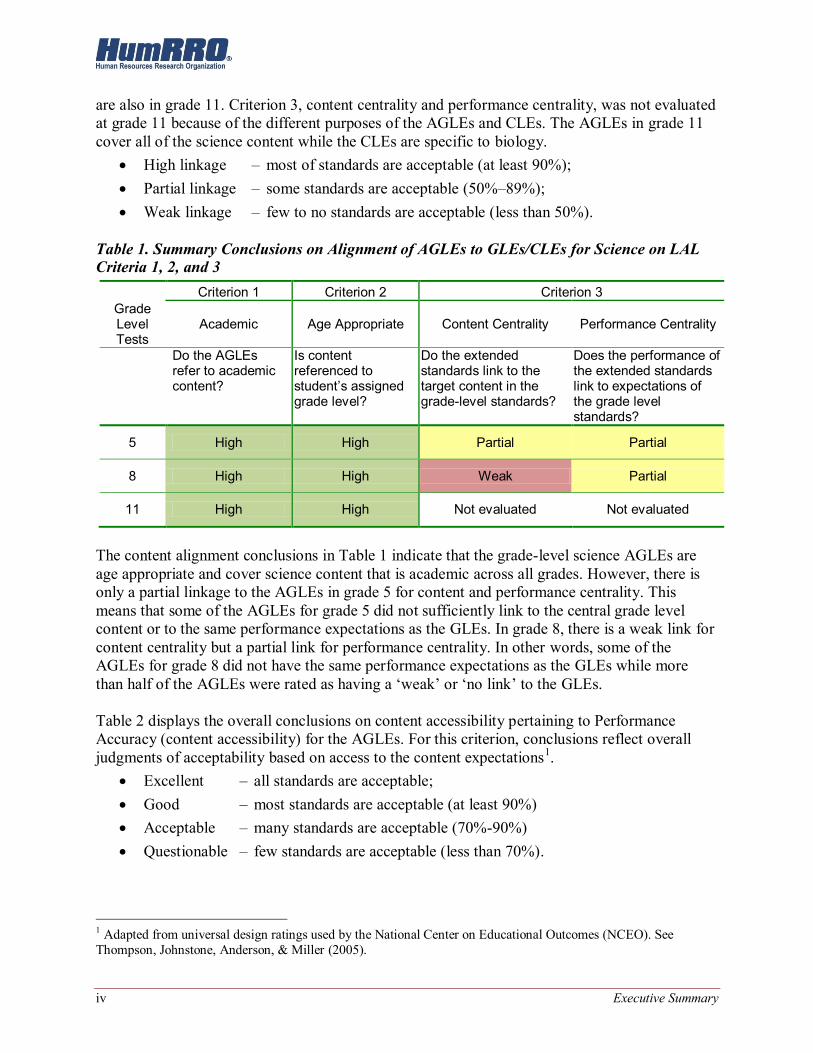
are also in grade 11. Criterion 3, content centrality and performance centrality, was not evaluated at grade 11 because of the different purposes of the AGLEs and CLEs. The AGLEs in grade 11 cover all of the science content while the CLEs are specific to biology.
High linkage – most of standards are acceptable (at least 90%); Partial linkage – some standards are acceptable (50%–89%); Weak linkage – few to no standards are acceptable (less than 50%).
Table 1. Summary Conclusions on Alignment of AGLEs to GLEs/CLEs for Science on LAL Criteria 1, 2, and 3
Criterion 1 Criterion 2 Criterion 3 Grade Level Tests
Academic Age Appropriate Content Centrality Performance Centrality
Do the AGLEs refer to academic content?
Is content referenced to student’s assigned grade level?
Do the extended standards link to the target content in the grade-level standards?
Does the performance of the extended standards link to expectations of the grade level standards?
5 High High Partial Partial
8 High High Weak Partial
11 High High Not evaluated Not evaluated
The content alignment conclusions in Table 1 indicate that the grade-level science AGLEs are age appropriate and cover science content that is academic across all grades. However, there is only a partial linkage to the AGLEs in grade 5 for content and performance centrality. This means that some of the AGLEs for grade 5 did not sufficiently link to the central grade level content or to the same performance expectations as the GLEs. In grade 8, there is a weak link for content centrality but a partial link for performance centrality. In other words, some of the AGLEs for grade 8 did not have the same performance expectations as the GLEs while more than half of the AGLEs were rated as having a ‘weak’ or ‘no link’ to the GLEs. Table 2 displays the overall conclusions on content accessibility pertaining to Performance Accuracy (content accessibility) for the AGLEs. For this criterion, conclusions reflect overall judgments of acceptability based on access to the content expectations1.
Excellent – all standards are acceptable; Good – most standards are acceptable (at least 90%) Acceptable – many standards are acceptable (70%-90%) Questionable – few standards are acceptable (less than 70%).
1 Adapted from universal design ratings used by the National Center on Educational Outcomes (NCEO). See Thompson, Johnstone, Anderson, & Miller (2005).
Executive Summary v
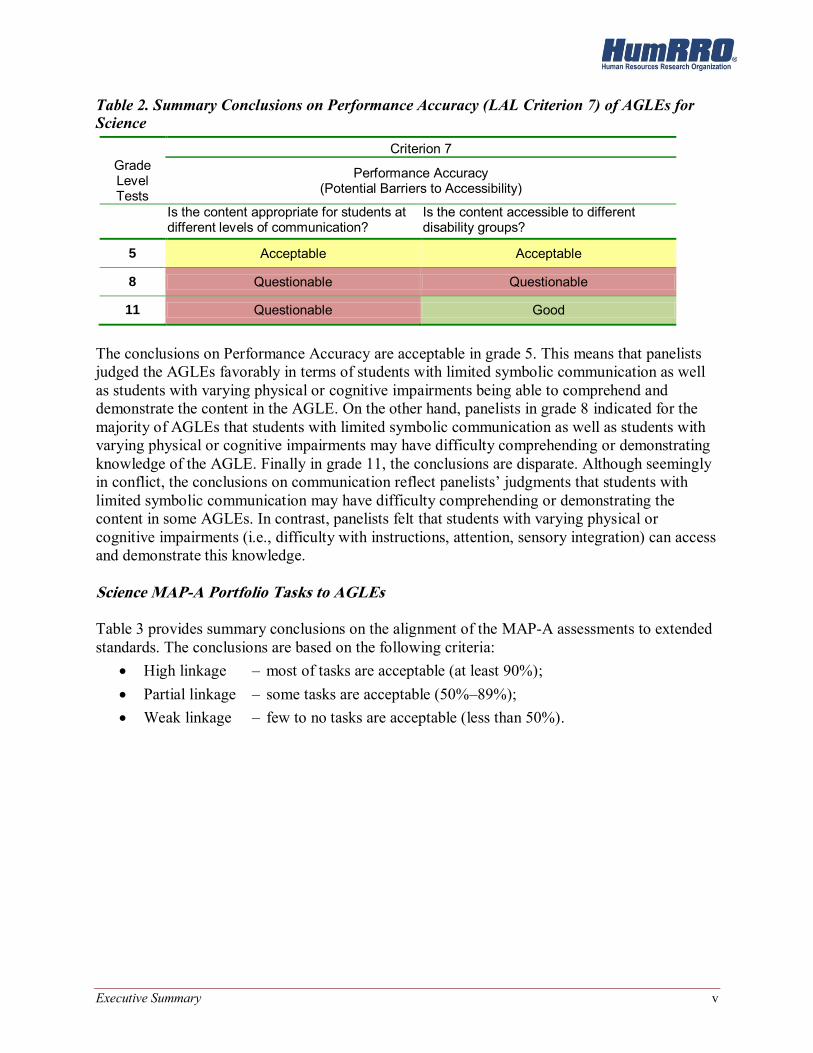
Table 2. Summary Conclusions on Performance Accuracy (LAL Criterion 7) of AGLEs for Science
Criterion 7 Grade Level Tests
Performance Accuracy (Potential Barriers to Accessibility)
Is the content appropriate for students at different levels of communication?
Is the content accessible to different disability groups?
5 Acceptable Acceptable
8 Questionable Questionable
11 Questionable Good
The conclusions on Performance Accuracy are acceptable in grade 5. This means that panelists judged the AGLEs favorably in terms of students with limited symbolic communication as well as students with varying physical or cognitive impairments being able to comprehend and demonstrate the content in the AGLE. On the other hand, panelists in grade 8 indicated for the majority of AGLEs that students with limited symbolic communication as well as students with varying physical or cognitive impairments may have difficulty comprehending or demonstrating knowledge of the AGLE. Finally in grade 11, the conclusions are disparate. Although seemingly in conflict, the conclusions on communication reflect panelists’ judgments that students with limited symbolic communication may have difficulty comprehending or demonstrating the content in some AGLEs. In contrast, panelists felt that students with varying physical or cognitive impairments (i.e., difficulty with instructions, attention, sensory integration) can access and demonstrate this knowledge. Science MAP-A Portfolio Tasks to AGLEs Table 3 provides summary conclusions on the alignment of the MAP-A assessments to extended standards. The conclusions are based on the following criteria:
High linkage – most of tasks are acceptable (at least 90%); Partial linkage – some tasks are acceptable (50%–89%); Weak linkage – few to no tasks are acceptable (less than 50%).

vi Executive Summary
Table 3. Summary Conclusions on Alignment of Science MAP-A Portfolios to AGLEs for LAL Criteria 1, 2, 3, and 4
Criterion 1 Criterion 2 Criterion 3 Criterion 4 Grade Level Academic Age
Appropriate Content
Centrality Performance
Centrality Content Coverage
Are students assessed on academic content?
Is task content referenced to student’s assigned grade level?
Do tasks link to the target content in the AGLEs?
Does the performance of task link to expectations of the AGLEs?
Do the tasks assess students at the appropriate breadth of knowledge? a
Do the tasks assess students at the appropriate depth-of-knowledge? b
5 Partial High High High Partial Partial
8 High High Partial High Partial High
11 Partial High Partial Partial Partial High a These conclusions are based on a summary judgment across the Webb statistics of Categorical Concurrence, Range of Knowledge, and Balance of Knowledge. It is still important to consider each of the criteria separately as well. b These conclusions are based on the results from the DOK consistency analyses. As Table 3 illustrates, the 2012 science MAP-A assessments linked well to the content of the AGLEs for some of the dimensions. Across all grades, some restriction in the range of content assessed resulted in partial ratings. In grades 5 and 11, there were a number of portfolio tasks that panelists rated as functional instead of academic. In grade 5, panelists rated the majority of portfolio tasks as age appropriate, linked to AGLEs, and linked to the expectations of the AGLEs. On depth-of-knowledge assessed, panelists determined that many tasks assessed students at a different level of cognitive complexity than expected in the AGLEs for grade 5. For grade 8, panelists rated the majority of tasks as age appropriate, linked to the expectations of the AGLEs, and assessing students at the same level of cognitive complexity as expected in the AGLEs. However, some of the portfolio tasks were rated by panelists as not linking to the AGLEs. In grade 11, panelists rated the majority of portfolio tasks as being age appropriate and assessing students at the same level of cognitive complexity as expected in the AGLEs. On the other hand, panelists determined that some of the portfolio tasks did not link to the AGLEs and did not link to the expectations of the AGLEs. Table 4 includes results relative to Criteria 6 and 7 of the LAL method. These criteria asked panelists to determine whether the assessment tasks were designed in such a way that students could demonstrate knowledge at various levels of functioning and ability. Ratings in this case are based on evaluations of accessibility, rather than on content alignment2.
Excellent – all tasks are acceptable; Good – most tasks are acceptable (at least 90%); Acceptable – many tasks are acceptable (70%-90%); Questionable – few tasks are acceptable (less than 70%).
2Alignment refers to overlap in content expectations. In this case, the goal is not to measure the test against the content expectations but to evaluate the level of accessibility.

Executive Summary vii
Table 4. Summary Conclusions on Accessibility (LAL Criteria 6 and 7) of Science MAP-A Portfolios
Criterion 6 Criterion 7 Grade Level Tests
Achievement Performance Accuracy (Potential Barriers)
Does the assessment allow for accurate inference about student learning?
What level of symbolic communication does task require?
Is task accessible to different disability groups?
Can task be modified/supports provided without changing meaning or difficulty?
5 Good Questionable Good Good
8 Acceptable Questionable Questionable Acceptable
11 Questionable Questionable Acceptable Good
The most noticeable issue regarding accessibility for the science MAP-A assessments concerns the measurement of achievement (Criterion 6), particularly for grade 11. For this grade, panelists indicated difficulty determining a level of inference about student achievement regarding generalizability, standard setting, and program quality indicators. Results on Criterion 7 were mixed. For grade 5, ‘Good’ results can be found for the tasks being accessible to different disability groups as well as amenable to modifications or supports. Grade 8 showed questionable results for whether the task is accessible to different disability groups. Panelists rated the majority of portfolio tasks as providing modifications or supports without altering the meaning or difficulty in grades 8 and 11. Additionally in grade 11, portfolio tasks were found to be accessible to different disability groups. Across all grades, questionable results were seen for the level of symbolic communication required to answer a portfolio task. Recommendations HumRRO makes the following recommendations to strengthen the linkage between the components of the Missouri alternate assessment:
AGLEs for Science Review the access points for the AGLEs at all grade levels. Panelists identified some
AGLEs that may limit access only to those students with higher symbolic abilities, thus excluding a portion of students from the assessment. Reviewing the AGLEs may involve additional bias reviews to modify the current expectations; or, additional explanation (e.g., content limitations, examples) within the MAP-A Instructor’s Guide and Implementation Manual may be sufficient to better illustrate how teachers might make these content expectations more appropriate for students with lower symbolic abilities.
Review the link between the AGLEs and the GLEs/CLEs at all grade levels. Panelists
identified a number of AGLEs as having a ‘weak’ or ‘no’ link to the GLEs/CLEs. For a

viii Executive Summary
small number of AGLEs, only one panelist was able to provide a GLE that matched the AGLE. We suggest that DESE review all of the AGLEs to ensure that the content expectations are similar to those in the GLEs/CLEs.
MAP-A Portfolio Tasks Improve the ability of the science MAP-A assessments to accurately demonstrate
student knowledge. Panelists rated the assessment materials as providing little inference about student learning on multiple dimensions. Panelists reported that a student’s score may be inflated and not truly demonstrative of the student’s knowledge. Additionally, a student’s score is dependent on how well the teacher is able to write a task to assess an Alternate Performance Indicator (API) and not completely on the student’s ability.
The issue of support is one that many states struggle with in trying to balance the use of a standardized assessment against allowing considerable flexibility for individual students with a broad range of disabilities. One option used in some states (e.g., Kentucky) is to include a checklist of common and appropriate accommodations and supports along with the conditions under which each accommodation can be provided. The Accommodations Manual, developed by the Assessment of Special Education Students State Collaborative on Assessment and Student Standards (ASES SCASS), is a good resource that includes condition charts that can be adapted by each state (Thompson, Morse, Sharpe, & Hall, 2005). Although most test administrators are familiar with appropriate accommodations, research by National Assessment and Accreditation Council (NAAC) suggests that competencies required to administer alternate assessments can vary widely, even within a state. With the MAP-A, portfolio tasks are designed specifically for a student and so should take into account the student’s abilities and need for accommodations or support. The difficulty lies in making sure that a student is not unfairly advantaged or disadvantaged.
Review the link between portfolio tasks and the APIs. Panelists determined that the majority of portfolio tasks assessed the content of the identified API. However, panelists rated between 14% and 32% of portfolio tasks as not matching the API. Additionally, panelists provided an AGLE match to each portfolio task but the identified AGLE was not necessarily the corresponding API. This means that for some of the portfolio tasks the content that was supposed to be assessed, in fact, was not. This in turn connects back to whether a student’s score really does provide information on the student’s knowledge of the content. We suggest that DESE review the training and training materials provided to teachers on how to write a portfolio task to assess an API.
Consider implementing an “improvement” requirement for portfolio tasks. Portfolios include multiple opportunities for students to complete tasks. In most cases, the reviewed portfolios contained two or more instances where a student completed the same task. In most cases, students received 100% credit for all repeated tasks. If the tasks are to be repeated, it would be more appropriate for students to repeat tasks with which they initially struggled. Educational value is minimal for re-demonstrating content one has already mastered. Panelists were concerned about the lack of any indicator of new learning. By requiring that the initial attempt at a portfolio task result in a lower than

Executive Summary ix
100% score, Missouri could generate a type of pre-test/post-test indicator of new learning. Adopting this kind of system would also help allay concerns that the portfolio tasks, which are designed by teachers, may not always be at the appropriate level for a given student. Requiring that the tasks represent challenging material, as demonstrated by an initially lower score, may force educators to create tasks that better match the ability of their students.
Consider reducing the number of AGLEs eligible to be assessed on the MAP-A. Currently, teachers can assess students from the following: 125 AGLEs in grade 5, 216 AGLEs in grade 8, and 271 AGLEs in grade 11. Across the sample of portfolios reviewed, a very small number of AGLEs were actually assessed: 32 in grade 5, 48 in grade 8, and 41 in grade 11. According to Webb’s criteria for range of knowledge, the assessment should include at least one task per AGLE. With so many AGLEs at each grade level, a one to one correspondence will not occur. DESE may want to consider allowing teachers to choose from a subset of the testable AGLEs at each grade level, reduce the number of AGLEs overall, or alter the format of the assessment to include more items/tasks.

Table of Contents xi
INDEPENDENT ALIGNMENT REVIEW OF THE SCIENCE MISSOURI ASSESSMENT PROGRAM-ALTERNATE (MAP-A)
Table of Contents Chapter 1: Introduction ...............................................................................................................1
Structure of Missouri’s Alternate Assessment System .............................................................2
Organization and Contents of the Report .................................................................................3
Chapter 2: Alignment Study Design and Methodology ................................................................5
Alignment of Assessments and Standards on Content and Performance...................................5
Content Alignment and Accessibility ...................................................................................5
Scope of Alignment Evaluations for Science MAP-A Assessments .........................................7
Review of Content Alignment and Accessibility ..................................................................8
Chapter 3: Results: AGLEs and GLEs/CLEs ............................................................................. 13
Results on AGLEs based on LAL Criteria ............................................................................. 13
Summary and Discussion of AGLEs and GLEs/CLEs ........................................................... 19
Chapter 4: Results: Science MAP-A Tasks and AGLEs............................................................. 23
Results on Science MAP-A Tasks based on LAL Criteria...................................................... 23
Reliability Results ................................................................................................................. 36
Panelist-Test Developer Analyses ...................................................................................... 36
Summary and Discussion of Science MAP-A Tasks and Extended Standards ........................ 37
Chapter 5: Summary and Recommendations ............................................................................. 39
References ................................................................................................................................ 43
Appendix A. Webb Alignment Results per Grade Level Assessment ..................................... A-1
Appendix B. Familiarization Training Slides and Debriefing Questions ................................. B-1
Appendix C. Sample Alignment Review Materials ................................................................. C-1

xii Table of Contents
List of Tables
Table 1. Summary Conclusions on Alignment of AGLEs to GLEs/CLEs for Science on LAL Criteria 1, 2, and 3 .................................................................................................... iv
Table 2. Summary Conclusions on Performance Accuracy (LAL Criterion 7) of AGLEs for Science ...............................................................................................................................v
Table 3. Summary Conclusions on Alignment of Science MAP-A Portfolios to AGLEs for LAL Criteria 1, 2, 3, and 4 ................................................................................................ vi
Table 4. Summary Conclusions on Accessibility (LAL Criteria 6 and 7) of Science MAP-A Portfolios ..................................................................................................................... vii
Table 1.1. Summary of Content Strands Assessed by Grade Level ..............................................2
Table 2.1. Professional and Demographic Characteristics of Science MAP-A Alignment Panelists ..............................................................................................................................8
Table 2.2. Characteristics of the Science MAP-A Tests Reviewed ...............................................9
Table 3.1. Mean Number of AGLEs Rated as Academic ........................................................... 14
Table 3.2. Mean Number of AGLEs Rated as Age Appropriate ................................................. 14
Table 3.3. AGLEs Matched to GLEs ......................................................................................... 15
Table 3.4. Mean Number of AGLEs at Various Levels of Content Centrality ............................ 16
Table 3.5. Frequency of AGLEs at Same, Lower, or Higher Levels of Complexity Compared to Related Benchmarks..................................................................................... 17
Table 3.6. Mean Number of AGLEs at Various Levels of Performance Centrality ..................... 17
Table 3.7. Mean Number of AGLEs Rated at Each Level of Symbolic Communication ............ 18
Table 3.8. Frequency of AGLEs Rated as Accessible to All Students ........................................ 19
Table 3.9. Summary Conclusions on Alignment of AGLEs to GLEs/CLEs for Science on LAL Criteria 1, 2, and 3 .................................................................................................... 20
Table 3.10. Summary Conclusions on Performance Accuracy (LAL Criterion 7) of AGLEs for Science ........................................................................................................................ 21
Table 4.1. Mean Number of Tasks Rated as Academic by Panelists .......................................... 23
Table 4.2. Mean Percentage of Tasks at Various Levels of Age Appropriateness....................... 24
Table 4.3. Mean Number of Tasks Linked to AGLEs ................................................................ 24
Table 4.4. Mean Percent of Tasks at Various Levels of Content Centrality ................................ 25
Table 4.5. Mean Percent of Tasks at Various Levels of Performance Centrality ........................ 25
Table 4.6. Summary of Content Strands Assessed by Grade Level ............................................ 26
Table 4.7. Summary of Portfolio Tasks Reviewed by Panelists by Content Strand Identified by API .............................................................................................................. 27
Table 4.8. Summary of Categorical Concurrence Results for Science MAP-A by Grade Level ................................................................................................................................. 27
Table 4.9. Mean Percentage of Tasks at Each DOK Level ......................................................... 28
Table 4.10. Summary of Depth-of-Knowledge Results for Science MAP-A by Grade Level ..... 29
Table 4.11. Summary of Range-of-Knowledge Results for Science MAP-A by Grade Level ..... 29
Table of Contents xiii
Table 4.12. Summary of Balance-of-Knowledge Representation Results for Science MAP-A by Grade Level .............................................................................................................. 30
Table 4.13. Degree of Inference Evident on Student Learning in Science MAP-A Assessments ...................................................................................................................... 32
Table 4.14. Mean Percentage of Tasks at Various Levels of Symbolic Communication ............. 35
Table 4.15. Frequency of Tasks Rated as Accessible to All Students ......................................... 35
Table 4.16. Frequency of Tasks Rated as Amenable to Accommodations or Supports ............... 36
Table 4.17. Percentage Agreement between Panelists and Teachers on Assessment Target for MAP-A Science ........................................................................................................... 37
Table 4.18. Summary Conclusions on Alignment of Science MAP-A Assessments to AGLEs for LAL Criteria 1, 2, 3, and 4 .............................................................................. 37
Table 4.19. Summary Conclusions on Accessibility (LAL Criteria 6 and 7) of Science MAP-A Assessments ........................................................................................................ 38
Table A.1. Categorical Concurrence for Science MAP-A, Grade 5: Mean Number of Performance Tasks per Strand ........................................................................................ A-1
Table A.2. Categorical Concurrence for Science MAP-A, Grade 8: Mean Number of Performance Tasks per Strand ........................................................................................ A-1
Table A.3. Categorical Concurrence for Science MAP-A, Grade 11: Mean Number of Performance Tasks per Strand ........................................................................................ A-2
Table A.4. Depth-of-Knowledge Consistency for Science MAP-A, Grade 5: Mean Percent of Performance Tasks with DOK Below, At, and Above DOK Level of Objectives ....... A-2
Table A.5. Depth-of-Knowledge Consistency for Science MAP-A, Grade 8: Mean Percent of Performance Tasks with DOK Below, At, and Above DOK Level of Objectives ....... A-3
Table A.6. Depth-of-Knowledge Consistency for Science MAP-A, Grade 11: Mean Percent of Performance Tasks with DOK Below, At, and Above DOK Level of Objectives ...................................................................................................................... A-3
Table A.7. Range-of-Knowledge for Science MAP-A, Grade 5: Mean Percent of AGLEs per Strand Linked with Performance Tasks .................................................................... A-4
Table A.8. Range-of-Knowledge for Science MAP-A, Grade 8: Mean Percent of AGLEs per Strand Linked with Performance Tasks .................................................................... A-4
Table A.9. Range-of-Knowledge for Science MAP-A, Grade 11: Mean Percent of AGLEs per Strand Linked with Performance Tasks .................................................................... A-5
Table A.10. Grade 5 MAP-A: Grade Span AGLEs Matched to Items by Panelists ................. A-5
Table A.11. Grade 8 MAP-A: Grade Span AGLEs Matched to Items by Panelists ................. A-7
Table A.12. Grade 11 MAP-A: Grade Span AGLEs Matched to Items by Panelists...............A-11
Table A.13. Balance-of-Knowledge Representation for Science MAP-A, Grade 5: Mean Balance Index per Strand ..............................................................................................A-17
Table A.14. Balance-of-Knowledge Representation for Science MAP-A, Grade 8: Mean Balance Index per Strand ..............................................................................................A-17
Table A.15. Balance-of-Knowledge Representation for Science MAP-A, Grade 11: Mean Balance Index per Strand ..............................................................................................A-18

Chapter 1: Introduction 1
Independent Alignment Review of the Science Missouri Assessment Program - Alternate (MAP-A)
Chapter 1: Introduction
The Missouri Department of Elementary and Secondary Education (DESE) requested an external independent alignment study (evaluation/analysis) of the Missouri Assessment Program-Alternate (MAP-A) in science for students with significant cognitive disabilities in grades 5, 8, and 11. Specifically, DESE wanted an evaluation of the alignment between the science MAP-A portfolio assessment, the extended content standards (or Alternate Grade-Level Expectations)3, and the state content standards (or Grade-/Course-Level Expectations) for science4. Missouri uses the MAP-A portfolio assessment in the federal and state accountability programs. DESE awarded Human Resources Research Organization (HumRRO) the contract to conduct this alignment study, and work began on September 18, 2012. DESE requested the alignment study to meet federal requirements. The federal requirement of the U.S. Department of Education (USDE) stems from the No Child Left Behind (NCLB) Act of 2001. NCLB challenges each state to establish a coherent assessment system based on solid academic standards. This law calls for states to provide independent evidence of the validity of its assessments used to calculate Adequate Yearly Progress (AYP). All states receiving Title I funds must present evidence of establishing a fair and consistent assessment system that is based on rigorous standards, sufficient alignment between standards and assessments, and high-quality educational results. An alignment review can provide one form of evidence supporting the validity of the state assessment system. Alignment results should demonstrate that the assessments represent the full range of the content standards, and that these assessments measure student knowledge in the same manner and at the same level of complexity as expected in the content standards. All aspects of the state assessment system must coincide, including the academic content standards and each assessment. Alternate assessments are included in this requirement. The federal government has established regulations for students with significant cognitive disabilities in the calculation of school and district AYP determinations, often referred to as the “1% rule” (U.S. Department of Education, 2005). This rule allows the state to accommodate students with significant cognitive disabilities in its AYP calculations by setting different performance expectations for up to 1% of the student population. As a result, states can develop alternate content standards (often referred to as extended standards), achievement standards, and assessments designed to more fairly and accurately demonstrate the achievement of these students. However, the content on which these students are assessed must be academic, and the achievement of these students must continue to reflect challenging academic goals. As such, states must show that the extended standards for
3 Missouri Alternate Grade Level Expectations can be found at: http://www.dese.mo.gov/divimprove/assess/mapa_resources.html 4 Missouri Grade-/Course-Level Expectations can be found at: http://dese.mo.gov/divimprove/curriculum/GLE/

2 Chapter 1: Introduction
these students link to the regular grade-level expectations, although the breadth and depth of these expectations can be reduced (USDE, 2005).
Structure of Missouri’s Alternate Assessment System
Missouri has a portfolio system for those students with the most significant cognitive disabilities. A portfolio assessment is unique to each student and based on the student’s Individualized Education Program (IEP), as opposed to a fully standardized assessment with common items or tasks across students. As part of this alternate assessment system, Missouri constructed Alternate Grade-Level Expectations (AGLEs) aligned to the state’s approved content standards – the Show-Me Standards, Grade-Level Expectations (GLEs), and Course-Level Expectations (CLEs) – for science. The Alternate Performance Indicators (APIs) are the AGLEs on which the portfolio assessments must be based. The science AGLEs are organized into eight content strands, and six of the eight content strands are assessed at each grade (5, 8, and 11). For each tested grade, two strands are designated as “required” for assessment; in addition, teachers must select one strand from each of the remaining two pairs of strands for assessment. Table 1.1 shows the content strands covered at each grade. Table 1.1. Summary of Content Strands Assessed by Grade Level
Grade Level
Content Strand (Required)
Content Strand (Required)
Content Strand (Choose One)
Content Strand (Choose One)
5
Processes and Interactions of the Earth’s Systems
(ES)
Composition and Structure of the
Universe and the Motion of the Objects
within it (UN)
Scientific Inquiry (IN) or Impact of
Science, Technology, and
Human Activity (ST)
Characteristics and Interactions of Living Organisms (LO) or
Changes in Ecosystems and Interactions of
Organisms with Their Environment (EC)
8 Properties and
Principles of Matter and Energy (ME)
Properties and Principles of Force and Motion (FM)
Scientific Inquiry (IN) or Impact of
Science, Technology, and
Human Activity (ST)
Processes and Interactions of the Earth’s
Systems (ES) or Composition and
Structure of the Universe and the Motion of the Objects within it (UN)
11 Characteristics and
Interactions of Living Organisms (LO)
Changes in Ecosystems and Interactions of
Organisms with Their Environment (EC)
Scientific Inquiry (IN) or Impact of
Science, Technology, and
Human Activity (ST)
Properties and Principles of Matter and Energy
(ME) or Properties and Principles of Force and
Motion (FM) Portfolios might include content learned in prior grades as prior grade AGLEs are included in higher grade AGLEs. The design of the assessment is such that for each student, the teacher submits two entries for each assessed content strand. The two entries per content strand assess the same API, and the task typically does not change. However, the teacher has the flexibility to alter the task in the second entry to more accurately assess a student’s knowledge of the material.

Chapter 1: Introduction 3
In addition, teachers have the ability to use the same task to measure more than one API. Across the three grade levels, the science MAP-A covers all eight content strands.
Organization and Contents of the Report
This report contains four chapters. Chapter 2 explains alignment methodologies, including general methods used to evaluate alignment of alternate assessments. Subsequent chapters provide alignment results for comparisons between the components of the assessment system: (a) Chapter 3 presents results of the alignment comparison between the AGLEs and the GLEs and CLEs, (b) Chapter 4 presents results of the content review of the science MAP-A portfolio tasks relative to the AGLEs; and (c) Chapter 5 provides recommendations for DESE to strengthen alignment of the science MAP-A assessment over time. Additional information is provided in the appendices to this report. Appendix A contains tables providing more detail on the content alignment results at each grade-level. Appendix B contains slides and debriefing questionnaire from the pre-workshop training session. Appendix C provides examples of rating forms and training materials used in the alignment workshops.

Chapter 2: Alignment Study Design and Methodology 5
Chapter 2: Alignment Study Design and Methodology
In this section, we discuss key concepts related to alignment research, followed by a description of the alignment evaluations and methods used as part of the Missouri study.
Alignment of Assessments and Standards on Content and Performance
The term alignment in this context refers to the degree of accuracy evident in instruction and measurement of the state’s academic content standards. School curricula must include appropriate content laid out by the state. Any documents developed to accompany the content standards (e.g., performance descriptors, test specifications, teaching guides) must accurately represent the expectations. Assessments must measure only the content specified in the standards, and student scores generated from these assessments should adequately reflect student knowledge of the content standards. An alignment study evaluates the strength of any or all of these relationships. In general, alignment evaluations for any assessment reveal the breadth, or scope, of knowledge as well as the depth-of-knowledge, or cognitive processing, expected of students by the state’s content standards. Alignment analyses help to answer questions such as the following:
How much and what type of content is covered by the assessment? Is the content in the assessment, or extended standards, sufficiently similar to the
expectations of the full content standards? Are students asked to demonstrate this knowledge at the same level of rigor as expected
in the full content standards? Does the assessment accurately measure student knowledge of content standards?
These questions can be grouped into two categories – content alignment and performance alignment. However, all alignment evaluations tie back to the state content standards. Content Alignment and Accessibility
Several alignment methods are currently in use for general education and alternate assessments. Most of these methods involve rating various aspects of test items or performance tasks relative to the content standards. Ratings are made by education experts and then analyzed statistically to determine the extent of alignment. Alignment studies of alternate assessments often require review of additional aspects of alignment unique to those assessments. These dimensions include: (a) accessibility of the assessment system to students with a variety of disabilities, (b) the extent to which test content is academic, and (c) the extent to which alternate content standards are linked with the state’s general academic standards. Alternate assessments differ from general state assessments in form and structure; thus, an alignment methodology must be responsive to these differences. Links for Academic Learning Alignment Method. For the current alignment study, HumRRO used the Links for Academic Learning alignment method (referred to in this report as LAL) developed by the National Alternate Assessment Center to conduct the content alignment

6 Chapter 2: Alignment Study Design and Methodology
reviews and analyze the results (Flowers, Wakeman, Browder, & Karvonen, 2007). This method requires panelists to rate the content standards and assessments on multiple dimensions. Ratings are then analyzed and interpreted based on seven criteria. These criteria are listed below (adapted from Flowers et al, 2007):
Criterion 1: Academic - The content is academic and includes the major domains/strands of the content area as reflected in state and national standards (e.g., reading, mathematics, science). Criterion 2: Age Appropriate - The content is referenced to the student’s assigned grade level (based on chronological age). Criterion 3: Standards Fidelity
a. Content Centrality - The target content maintains fidelity with the content of the original grade-level standards.
b. Performance Centrality - The focus of achievement maintains fidelity with the specified performance in the grade-level standards.
Criterion 4: Content Coverage - (Webb alignment indicators) - The content differs from grade level in range, balance, and depth of knowledge (DOK), but matches high expectations set for students with significant cognitive disabilities. Criterion 5: Content Differentiation - There is some differentiation in content across grade levels or grade bands. Criterion 6: Achievement - The expected achievement for students is to show learning of grade referenced academic content. Criterion 7: Performance Accuracy - The potential barriers to demonstrating what students know and can do are minimized in the assessment to increase measurement accuracy of student performance.
The LAL method is appropriate for alignment of assessments to standards and alignment of extended standards to full content standards. The review of assessments to standards, such as the MAP-A assessment to the AGLEs for science, includes all of the Criteria 1 through 7. However, only Criteria 2, 3, 4, 5, and 7 can be applied to a review of AGLEs. Criterion 1 is intended to evaluate the assessment tasks as to whether they are academic in content, while Criterion 6 is intended to evaluate the measurement accuracy of the assessment. Criterion 5 was not evaluated in this alignment study as MAP-A science is a grade span assessment and not given as individual grade level tests. Webb Alignment Method. Under Criterion 4 of the LAL method, we refer to “Webb alignment indicators.” Dr. Norman Webb (2005) developed an alignment procedure involving an evaluation of the assessment to the content standards using four statistics. These statistics indicate how well an assessment covers the content standards in terms of content breadth and depth. Webb’s method generally has been applied to general education assessments, and some special education researchers (i.e., Flowers et al., 2007) consider this approach to be limited as a primary alignment method for alternate assessments. However, the Webb alignment indicators are still informative regarding content coverage even for an alternate assessment. Thus, the LAL method includes the Webb alignment indicators.

Chapter 2: Alignment Study Design and Methodology 7
The Webb alignment method has been used extensively to conduct alignment reviews of regular assessments to state content standards (e.g., Webb, 1997; 1999; 2005), and his approach is supported by the Council of Chief State School Officers (CCSSO). The Webb approach includes four alignment indicators linked with statistical procedures to assess how well the assessment matches individual portions of the standards documents. The four alignment criteria are (a) categorical concurrence, (b) depth-of-knowledge consistency, (c) range-of-knowledge correspondence, (d) and balance-of-knowledge representation. Categorical concurrence is a basic measure of alignment between content standards and test items. This term refers to the proportion of overlap between the content stated in the standards document and that assessed by items on the test. Depth of Knowledge measures the type of cognitive processing required by items and content objectives (i.e., benchmarks). For example, is a student expected to simply identify or recall basic facts, or is the student expected to use reasoning by manipulating information or strategizing? In science, a student may be asked to identify the appropriate use of a decimal among several answer choices. This task should be less complex than trying to explain the concept of a decimal and how and why it can be moved. In language arts, asking a student to identify Greek over Norse mythology requires less processing compared with asking a student to use knowledge of Greek mythology to understand the origin and meaning of new words. The purpose of using DOK as a measure of alignment is to determine whether a test item (or performance task) and corresponding benchmark are both written at the same level of cognitive complexity. Reviewers make two separate judgments about cognitive complexity, one for the benchmark and one for the item. These two judgments are compared to determine whether the item is written at the same level as the benchmark to which it is linked. Webb refers to his comparison as depth-of-knowledge consistency. Another measure examines the range-of-knowledge correspondence between the assessment and benchmarks. The range-of-knowledge measure examines in greater detail the breadth of knowledge represented by test items. Categorical concurrence simply notes whether a sufficient number of items on the test covers each general content topic (individual strands). However, the range indicates the number of benchmarks assessed by items, although the number of items per benchmark is not evaluated. Finally, the balance-of-knowledge representation criterion focuses on content coverage in even more detail. In this case, the number of items matched to the benchmark does matter. The balance of representation determines whether the assessment equitably measures the benchmarks within each strand. Based on Webb’s method, items should be distributed evenly across the benchmarks per strand for good balance. The balance-of-knowledge representation is determined by calculating an index, or score, for each strand. Each strand should meet or surpass a minimum index level to demonstrate adequate balance.
Scope of Alignment Evaluations for Science MAP-A Assessments
Two different types of alignment evaluations were performed for this Missouri study: (a) the AGLEs to the GLEs/CLEs for science and (b) the science MAP-A portfolio tasks to the AGLEs.
8 Chapter 2: Alignment Study Design and Methodology
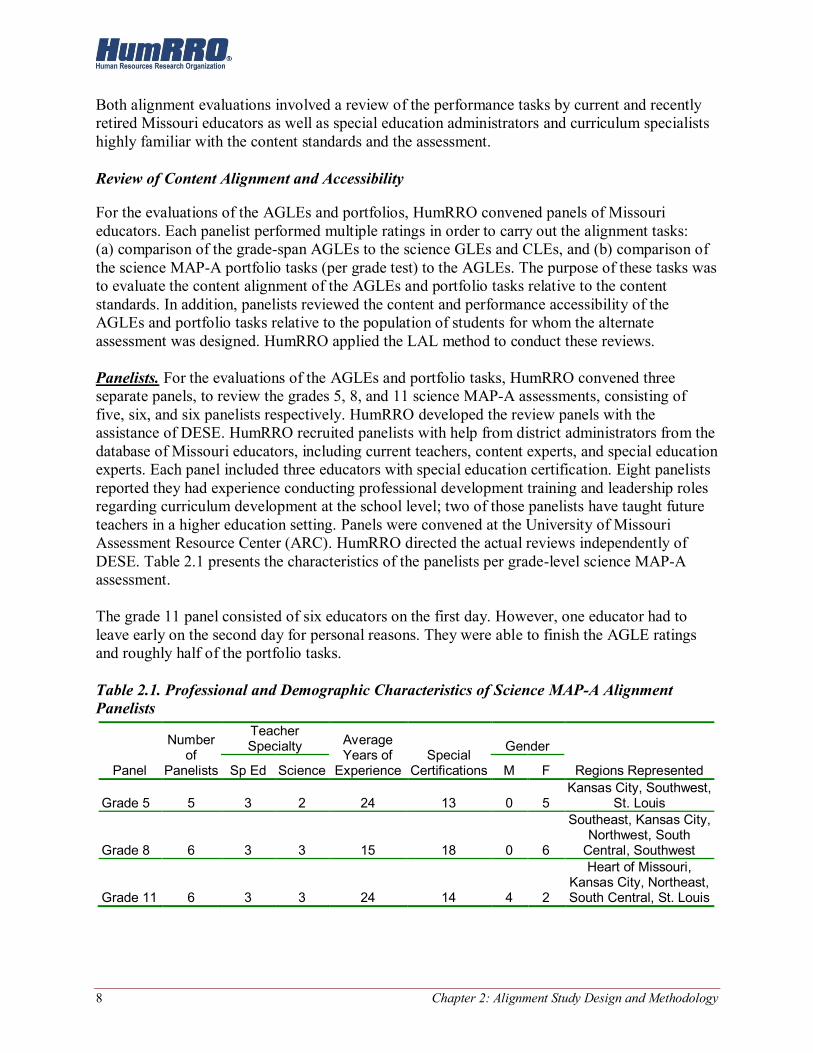
Both alignment evaluations involved a review of the performance tasks by current and recently retired Missouri educators as well as special education administrators and curriculum specialists highly familiar with the content standards and the assessment. Review of Content Alignment and Accessibility
For the evaluations of the AGLEs and portfolios, HumRRO convened panels of Missouri educators. Each panelist performed multiple ratings in order to carry out the alignment tasks: (a) comparison of the grade-span AGLEs to the science GLEs and CLEs, and (b) comparison of the science MAP-A portfolio tasks (per grade test) to the AGLEs. The purpose of these tasks was to evaluate the content alignment of the AGLEs and portfolio tasks relative to the content standards. In addition, panelists reviewed the content and performance accessibility of the AGLEs and portfolio tasks relative to the population of students for whom the alternate assessment was designed. HumRRO applied the LAL method to conduct these reviews. Panelists. For the evaluations of the AGLEs and portfolio tasks, HumRRO convened three separate panels, to review the grades 5, 8, and 11 science MAP-A assessments, consisting of five, six, and six panelists respectively. HumRRO developed the review panels with the assistance of DESE. HumRRO recruited panelists with help from district administrators from the database of Missouri educators, including current teachers, content experts, and special education experts. Each panel included three educators with special education certification. Eight panelists reported they had experience conducting professional development training and leadership roles regarding curriculum development at the school level; two of those panelists have taught future teachers in a higher education setting. Panels were convened at the University of Missouri Assessment Resource Center (ARC). HumRRO directed the actual reviews independently of DESE. Table 2.1 presents the characteristics of the panelists per grade-level science MAP-A assessment. The grade 11 panel consisted of six educators on the first day. However, one educator had to leave early on the second day for personal reasons. They were able to finish the AGLE ratings and roughly half of the portfolio tasks. Table 2.1. Professional and Demographic Characteristics of Science MAP-A Alignment Panelists
Panel
Number of
Panelists
Teacher Specialty Average
Years of Experience
Special Certifications
Gender
Regions Represented Sp Ed Science M F
Grade 5 5 3 2 24 13 0 5 Kansas City, Southwest,
St. Louis
Grade 8 6 3 3 15 18 0 6
Southeast, Kansas City, Northwest, South
Central, Southwest
Grade 11 6 3 3 24 14 4 2
Heart of Missouri, Kansas City, Northeast, South Central, St. Louis
Chapter 2: Alignment Study Design and Methodology 9
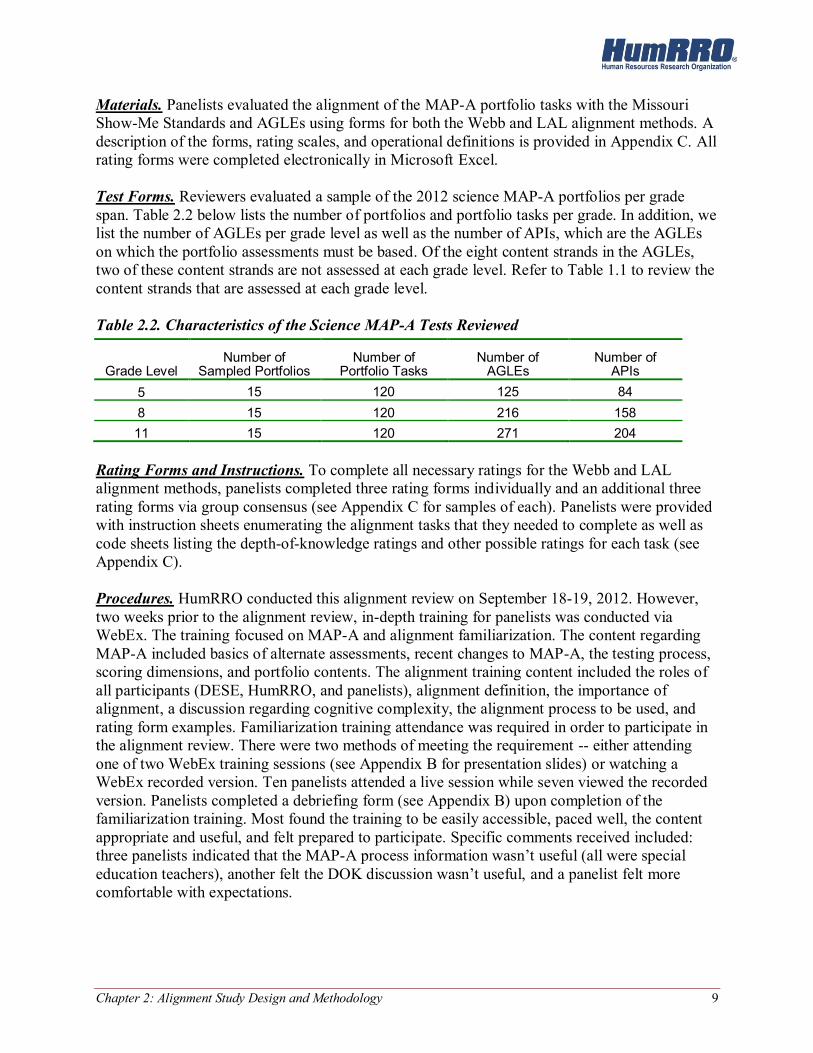
Materials. Panelists evaluated the alignment of the MAP-A portfolio tasks with the Missouri Show-Me Standards and AGLEs using forms for both the Webb and LAL alignment methods. A description of the forms, rating scales, and operational definitions is provided in Appendix C. All rating forms were completed electronically in Microsoft Excel. Test Forms. Reviewers evaluated a sample of the 2012 science MAP-A portfolios per grade span. Table 2.2 below lists the number of portfolios and portfolio tasks per grade. In addition, we list the number of AGLEs per grade level as well as the number of APIs, which are the AGLEs on which the portfolio assessments must be based. Of the eight content strands in the AGLEs, two of these content strands are not assessed at each grade level. Refer to Table 1.1 to review the content strands that are assessed at each grade level. Table 2.2. Characteristics of the Science MAP-A Tests Reviewed
Grade Level Number of
Sampled Portfolios Number of
Portfolio Tasks Number of
AGLEs Number of
APIs 5 15 120 125 84 8 15 120 216 158 11 15 120 271 204
Rating Forms and Instructions. To complete all necessary ratings for the Webb and LAL alignment methods, panelists completed three rating forms individually and an additional three rating forms via group consensus (see Appendix C for samples of each). Panelists were provided with instruction sheets enumerating the alignment tasks that they needed to complete as well as code sheets listing the depth-of-knowledge ratings and other possible ratings for each task (see Appendix C). Procedures. HumRRO conducted this alignment review on September 18-19, 2012. However, two weeks prior to the alignment review, in-depth training for panelists was conducted via WebEx. The training focused on MAP-A and alignment familiarization. The content regarding MAP-A included basics of alternate assessments, recent changes to MAP-A, the testing process, scoring dimensions, and portfolio contents. The alignment training content included the roles of all participants (DESE, HumRRO, and panelists), alignment definition, the importance of alignment, a discussion regarding cognitive complexity, the alignment process to be used, and rating form examples. Familiarization training attendance was required in order to participate in the alignment review. There were two methods of meeting the requirement -- either attending one of two WebEx training sessions (see Appendix B for presentation slides) or watching a WebEx recorded version. Ten panelists attended a live session while seven viewed the recorded version. Panelists completed a debriefing form (see Appendix B) upon completion of the familiarization training. Most found the training to be easily accessible, paced well, the content appropriate and useful, and felt prepared to participate. Specific comments received included: three panelists indicated that the MAP-A process information wasn’t useful (all were special education teachers), another felt the DOK discussion wasn’t useful, and a panelist felt more comfortable with expectations.

10 Chapter 2: Alignment Study Design and Methodology
The workshops began with introductions of staff and observers. Next, panelists read and signed affidavits of nondisclosure for the secure materials they would review during the workshop. HumRRO staff then gave a brief description of the tasks reviewers would be performing. Following the general introduction, panelists began working within their content groups. Three groups of five, six, and six panelists reviewed each grade-span test (i.e., grades 3-5, grades 6-8). HumRRO staff supervised the groups. Within their small groups, HumRRO staff further trained reviewers using sample AGLEs and portfolio tasks. Regarding instructions on how to rate AGLEs and tasks, HumRRO staff provided general suggestions and comments when appropriate; however, they emphasized to reviewers that staff would not give explicit direction on how to rate AGLEs or tasks because reviewers were valued as content experts. Each panelist was given access to a desktop computer with rating forms already uploaded and formatted. HumRRO staff provided brief instructions about how to use the electronic rating forms. After reviewing sample DOK evaluations as a group, reviewers rated the DOK level of each AGLE. Panelists first made independent evaluations without discussion. Once all reviewers had completed their ratings, groups discussed their ratings to achieve consensus DOK ratings for each AGLE. HumRRO staff recorded the consensus DOK ratings in an Excel spreadsheet. Next, reviewers rated the AGLEs on a variety of factors, including (a) whether the GLE listed is the best match, (b) how well the AGLE links to the GLEs, (c) whether the AGLE measures student performance of the GLEs, (d) whether the AGLE is appropriate for the chronological age at which it is measured, (e) the level of symbolic communication required of students to demonstrate its content, and (f) whether the content expectation of the AGLE is accessible to various disability groups. These ratings were made individually; no consensus ratings were obtained. Reviewers then received more specific instructions for rating portfolio tasks. For training, HumRRO staff facilitated reviewers in evaluating and discussing sample tasks as a group. After completing sample tasks, reviewers individually rated portfolio tasks on electronic rating forms on their computers. The panelists rated the tasks on a variety of factors, including (a) whether the AGLE listed is the best match, (b) how well the task links to the AGLE, (c) whether the task measures student performance of the AGLE, (d) whether the task is appropriate for the chronological age at which it is measured, (e) the level of symbolic communication required of students to demonstrate its content, and (f) whether the content expectation of the task is accessible to various disability groups. In addition, reviewers were instructed to assign a primary AGLE to a task based on a judgment that a task clearly measured this AGLE. Furthermore, reviewers could assign an additional AGLE only if the task seemed to assess another AGLE as clearly as the primary AGLE. Reviewers also indicated whether the content of the performance task was academic and whether it could be modified or supports be provided without changing its meaning. Finally, panelists worked in their small groups to develop consensus ratings for two additional aspects of the MAP-A tests. HumRRO staff trained panelists on each task and recorded the

Chapter 2: Alignment Study Design and Methodology 11
group’s consensus ratings in preformatted Excel spreadsheets. The first consensus task required panelists to rate whole test barriers, or aspects of the MAP-A as a whole that might prevent students with various disabilities from fully participating (with or without supports or accommodations). The second consensus task asked panelists to rate the extent to which the scoring rubric and achievement standards allow for the demonstration of student learning. Typically, reviewers develop consensus ratings of the extent to which content differs across grades to assess the LAL Criterion 5: Content Differentiation. This criterion was not assessed for the science MAP-A because the test itself is a grade-span test. Additionally, the AGLEs are cumulative such that the AGLEs in grade 5 are a subset of AGLEs in grade 8 and the AGLEs in grade 8 are a subset of AGLEs in grade 11.

Chapter 3: Results: AGLEs and GLEs/CLEs 13
Chapter 3: Results: AGLEs and GLEs/CLEs
The alternate assessment system should link to the full academic content standards on several dimensions, and it should provide appropriate access to the students for whom the alternate assessment was designed. For grade 11 AGLEs, Missouri made the decision to not alter the AGLEs even though the GLEs moved to CLEs which focus not at the grade level but on a specific course such as Biology. Missouri decided to wait for the alternate common core standards to be released rather than changing the AGLEs in grade 11 to be representative of course level material instead of grade level. As a result of this mismatch between the AGLEs and CLEs for grade 11, the results for aligning the AGLEs to CLEs are not relevant for some of the criteria. In this chapter, we describe the results of the evaluation of the science AGLEs compared to the GLEs for science. These analyses relate to Criteria 1, 2, 3, and 7 of the LAL method for grades 5 and 8. For grade 11, the analyses relate to Criteria 1, 2, and 7.
Results on AGLEs based on LAL Criteria
Panelists rated the AGLEs on a number of scales with various response options. Most results reported here refer to mean ratings on these scales. To analyze these ratings, we first counted how many AGLEs were rated at each response option per panelist for each scale. For most scales, we then calculated the mean number of AGLEs per response option (across panelists) from the frequency counts. Finally, we determined the percentage of AGLEs rated at each level per rating scale based on the means. Results of these analyses are presented for each set of AGLEs per grade span. We point to several features of the results for more accurate interpretation. First, since the calculation of the percentage of AGLEs is based on the mean ratings, the total percentages across a rating scale per grade may sum to above 100%. Second, it is important to keep in mind that these percentages are based on five to six panelists’ ratings of over a hundred AGLEs. In other words, a small number of raters evaluated a large number of AGLEs. Third, not all raters provided a rating for all AGLEs on any given criteria so the total percentages across a rating scale may sum to below 100%; however, raters provided ratings on the majority of the rating scales for each AGLE. Finally, most LAL criteria include a minimum number of AGLEs (generally 90%) needed to demonstrate reasonable linkage with the full content standards.
Criterion 1: Academic - The content is academic and includes the major domains/strands of the content area as reflected in state and national standards (e.g., mathematics, communication arts, science)
Per the USDE (2005), alternate assessments counting towards Title I must assess students only on academic content, as opposed to functional life skills. Panelists judged the science assessments as to whether each AGLE focuses primarily on academics (similar to the GLEs/CLEs). Results of this analysis are presented in Table 3.1. In terms of acceptability, at least 90% of AGLEs should be rated as academic.

14 Chapter 3: Results: AGLEs and GLEs/CLEs
Table 3.1. Mean Number of AGLEs Rated as Academic
Grade Number of
AGLEs
Mean Number of AGLEs Academic
Mean Number of AGLEs
Functional Mean Percentage of
AGLEs Rated Academic M SD M SD
5 125 124.0 2.2 1.0 2.2 99% 8 216 212.7 2.9 3.3 2.9 98% 11 271 270.8 0.4 0.2 0.4 100%
As Table 3.1 demonstrates, panelists indicated that the science AGLEs focus primarily on academic content. There was one panelist in grade 5 that rated a group of AGLEs as functional. In grade 8, five of the six panelists rated at least one AGLE as functional. Essentially, there was little debate among panelists about the academic nature of the Missouri AGLEs in grades 5 and 11. Panelists questioned the academic nature of a very small number of AGLEs in grade 8.
Criterion 2: Age Appropriate - The content is referenced to the student’s assigned grade level (based on chronological age).
Criterion 2 pertains to the developmental level of the content included in the AGLEs. For this evaluation, panelists were asked whether the content of the science AGLEs is appropriate for the age and grade level indicated. Several response options were possible:
Adapted – Linked to grade level content. Neutral – Content is not age-bound and is appropriate at any age. Inappropriate – Content is off-grade level.
Table 3.2 includes the results of panelists’ evaluations. Column 2 lists the rating categories, while the ‘Mean’ in Column 3 refers to the mean number of AGLEs receiving that rating across panelists. Column 5 represents this same mean as a percentage of the total number of AGLEs per grade. For this criterion, at least 90% of AGLEs should be rated as ‘adapted’ or ‘neutral’5. Table 3.2. Mean Number of AGLEs Rated as Age Appropriate
Grade Age-Related Content Mean SD Percentage of AGLEs per Ratinga
5 Adapted 119.6 10.5 96% Neutral 0.8 1.3 1% Inappropriate 0.8 1.8 1%
8 Adapted 201.3 17.3 93% Neutral 12.5 16.6 6% Inappropriate 0.0 0.0 0%
11 Adapted 153.0 123.6 56% Neutral 109.5 130.2 40% Inappropriate 0.8 2.04 0%
a Total may sum to above 100% because percentages are based on mean numbers.
5 The LAL method does not specify a minimum for Criterion 2. This minimum level was established by HumRRO.

Chapter 3: Results: AGLEs and GLEs/CLEs 15
Very few to none of the AGLEs for any grade were judged inappropriate by raters. This means that almost all of the AGLEs contain content that is on-grade level.
Criterion 3: Standards Fidelity a. Content Centrality - The focus of achievement maintains fidelity with the content of
the original grade level standards. To meet Criterion 3, panelists were asked to provide several ratings indicating their judgments of the degree of content match between the AGLEs and GLEs for science. First, we asked panelists to provide a simple evaluation (yes or no) of whether the benchmarks listed as linked with the AGLEs did, in fact, match. For those statements judged as matched to the designated grade level expectation (GLE), we then asked panelists to go further with a second rating to indicate how well the AGLE linked to the GLE. Concerning overall content match, panelists at each grade level rated most of the science AGLEs as matched to a primary GLE. Table 3.3 shows the number of AGLEs that were assigned a GLE by only one panelist. The grade 11 AGLEs were not analyzed for this criterion since the CLEs refer only to the biology CLEs, while the AGLEs for grade 11 refer to the full range of the grade 11 science content expectations. Table 3.3. AGLEs Matched to GLEs
Grade Number of
Raters
Average Number of
AGLEs Matched
Range of AGLEs
Matched
Number of AGLEs Matched
by 1 Panelist 5 5 111.8 93 - 125 3 8 6 207.0 171 - 216 2
For the second evaluation, panelists reviewed each grade-span AGLE for the degree of link to the central content targeted by the GLEs. In this case, panelists used the following four-point scale to determine how well the AGLE reflects the GLE content:
1 2 3 4 No Link Weak Link Moderate Link Close Link
For Criterion 3, at least 90% of AGLEs should be rated as ‘moderate’ or ‘close’ to the full standards. Again, the grade 11 AGLEs and CLEs were not analyzed for this criterion due to the difference in purpose of the two sets of standards. Table 3.4 shows that the AGLEs in none of the grades surpassed this minimum. Panelists rated 73% of the AGLEs in grade 5 as linking sufficiently (‘moderate’ or ‘close’ link) with the GLEs. There were 44% of the AGLEs in grade 8 that link sufficiently with the GLEs and 55% of the AGLEs that were rated as entirely different from the full GLEs. In grade 8, it may be necessary to review the AGLEs.

16 Chapter 3: Results: AGLEs and GLEs/CLEs
Table 3.4. Mean Number of AGLEs at Various Levels of Content Centrality
Grade Content Centrality Rating Mean SD Percentage of AGLEs per Ratinga
5
No link 4.4 5.6 4% Weak link 17.0 13.8 14% Moderate link 52.0 22.9 42% Close link 38.4 13.1 31%
8
No link 14.0 21.7 6% Weak link 106.0 58.9 49% Moderate link 68.3 43.3 32% Close link 26.2 34.6 12%
a Total may not sum 100% because not all panelists provided ratings for all AGLEs.
b. Performance Centrality - The focus of achievement maintains fidelity with the specified performance.
The AGLEs should link to the full academic standards in performance expectations as well as content, although the depth of these expectations can be reduced for the alternate assessment. Several analyses were conducted to compare the performance levels specified in the AGLEs to the GLEs. One analysis focused on the DOK ratings. Panelists worked together to achieve consensus DOK ratings on the AGLEs and the GLEs separately. These ratings were analyzed for comparability. Due to the difference in purpose between the grade 11 AGLEs and CLEs, this analysis was not performed for grade 11. We compared the DOK ratings of the AGLEs to those ratings given to the corresponding GLEs. For one of the steps in evaluating the AGLEs, panelists were instructed to determine which GLE best matched each AGLE and not all panelists assigned the same GLE to the same AGLE. In determining the DOK level of the GLE associated with each AGLE, there was a multi-step process taken. First, the GLE that the majority of panelists associated with an AGLE was determined. Second, the DOK level for each GLE matched to each AGLE was listed. From this list of DOK values, the most frequently occurring DOK level or the DOK for the GLE assigned by the majority of panelists was selected for the GLE. Finally, a comparison was made between the DOK level of the AGLE and GLE. Table 3.5 presents the percentage of AGLEs per grade-span rated as expecting performance at the same level, or higher or lower levels, as the full content standards. There is no minimum level of acceptable overlap in depth-of-knowledge based on the LAL criteria; however, it is reasonable to expect that as many as half of the AGLEs would require students to demonstrate performance at a lower level than the grade level content standards. Additionally, it would be problematic to find many (if any) AGLEs with performance expectations at a higher level than the regular content standards. For some AGLEs, a clear DOK level for the associated GLE could not be determined or panelists did not match any GLEs to a given AGLE. The percent of AGLEs that fall into this situation are categorized as having ‘No Rating’.

Chapter 3: Results: AGLEs and GLEs/CLEs 17
Table 3.5. Frequency of AGLEs at Same, Lower, or Higher Levels of Complexity Compared to Related Benchmarks
AGLEs at Varying Levels of Complexity Same Lower Higher No Rating
Grade Level
Number AGLEs
Percentage AGLEs
Number AGLEs
Percentage AGLEs
Number AGLEs
Percentage AGLEs
Number AGLEs
Percentage AGLEs
5 17 14% 78 62% 13 10% 17 14% 8 57 26% 123 57% 24 11% 12 6%
For grades 5 and 8, panelists rated 76% and 83%, respectively, of the AGLEs as assessing student knowledge at the same or lower level of complexity as the GLEs. We also asked panelists to directly compare the written performance expectations in the AGLEs with the full content standards. Panelists evaluated the language of each AGLE to decide whether the expectations are the same, partly similar, or differ entirely from what is expected in the corresponding benchmarks. For example, if the GLE requires students to ‘compare and contrast’ traits, and the AGLE asks students to ‘group’ or ‘categorize’ based on traits, these expectations are parallel. If a GLE expects students to ‘identify and explain’ while the AGLE asks students to ‘identify’ only, these expectations are partly similar. When students are asked to ‘distinguish between’ in the GLE but the AGLE requires students to ‘recognize’, then the expectation for demonstrating knowledge is different. Again, comparisons between the grade 11 AGLEs and high school CLEs were not made for this particular analysis due to the difference in purpose. Table 3.6 shows the results of this comparison. At least 90% of the AGLEs should be rated as ‘some’ or ‘all’ compared with the full content standards. Table 3.6. Mean Number of AGLEs at Various Levels of Performance Centrality
Grade Performance Centrality
Rating Mean SD Percentage of AGLEs per
Ratinga
5 None 9.0 7.0 7% Some 61.4 28.1 49% All 41.2 24.3 33%
8 None 30.8 59.0 14% Some 162.8 62.1 75% All 20.5 38.6 9%
a Total may not sum 100% because not all panelists provided ratings for all AGLEs. A higher percentage of grade 8 than grade 5 AGLEs received a rating of ‘no similarity.’
Criterion 5: Content Differentiation - There is some differentiation in content across grade levels.
This criterion focuses on whether the content expectations change appropriately between grade levels. Since the science MAP-A assessments are grade-span tests, this criterion was not evaluated. Additionally, the AGLEs are cumulative across the grades such that all of the AGLEs in grade 5 are also in grade 8 and all of the AGLEs in grade 8 are also in grade 11.

18 Chapter 3: Results: AGLEs and GLEs/CLEs
Criterion 7: Performance Accuracy - The potential barriers to demonstrating what students know and can do are minimized in the assessment to increase measurement accuracy of student performance.
Panelists evaluated whether students could reasonably demonstrate the content and performance expected in the AGLEs by providing two separate ratings. First, we asked panelists to determine the level of communication required by each AGLE in order for students to demonstrate knowledge. The common categories applied, according to the LAL method, include three ability levels for students with significant disabilities6:
Pre-symbolic – student may demonstrate intentionality by showing interest, focus, or desire for a result through behavior; can use idiosyncratic gestures, sounds, or purposeful movements but no discrimination between pictures or other symbols.
Early symbolic – student demonstrates emerging knowledge of symbols with some recognition of symbol-object relationships.
Symbolic – student has broad knowledge of and can communicate consistently with symbols (e.g., pictures) or words (e.g., speech, assistive technology, signs).
In general for AGLEs and alternate assessments, it is expected that teachers and test administrators can modify the content to instruct and assess students at the appropriate level based on their IEPs. However, if the level of communication required in the AGLEs is always ‘symbolic,’ it becomes much more difficult for supports to be provided and still retain comparability in content and performance at the more basic levels of communication. Instead, it is preferable that the access point of most AGLEs (and assessment tasks) be pre-symbolic. Thus, the minimum level of acceptability is that the access point for at least 90% of the AGLEs should be pre-symbolic. Table 3.7 presents panelists’ mean ratings on the communication levels needed to demonstrate content knowledge for each set of grade level AGLEs. Table 3.7. Mean Number of AGLEs Rated at Each Level of Symbolic Communication
Grade Level of Symbolic
Communication Required Mean SD Percentage of AGLEs per
Ratinga
5 Pre-symbolic 95.0 31.0 76% Early Symbolic 19.4 25.2 16% Full Symbolic 6.4 10.0 5%
8 Pre-symbolic 76.8 40.0 36% Early Symbolic 42.5 48.3 20% Full Symbolic 95.0 72.5 44%
11 Pre-symbolic 34.5 34.9 13% Early Symbolic 96.2 92.3 35% Full Symbolic 140.0 90.4 52%
a Total may not sum 100% because not all panelists provided ratings for all AGLEs.
6 In addition to rating descriptions in the LAL manual, these definitions for communication levels have been expanded for clarity based on descriptions in a document published by the North Carolina Department of Public Instruction, Exceptional Children Division: http://www.ncpublicschools.org/docs/ec/instructional/extended/extendedcontentstandards.ppt

Chapter 3: Results: AGLEs and GLEs/CLEs 19
Based on the panelists’ ratings, none of the grades met the minimum requirement of 90%. Grade 5 had the most AGLEs rated as pre-symbolic with 76%. In grade 8, 36% of the AGLEs were rated as pre-symbolic. For grade 11, 13% of the AGLEs were rated as being pre-symbolic, and 52% of the AGLEs were rated as full symbolic. These outcomes may indicate that students with the lowest level of symbolic abilities cannot access the full range of content expectations. We encourage Missouri to review the AGLEs to evaluate accessibility. The second rating performed by panelists focused on general accessibility to students based on various types of disabilities (beyond communication abilities). For example, can students with visual impairments, an inability to follow instructions, or need for assistive technology demonstrate the knowledge expected by the AGLEs? Panelists provided a simple ‘yes’ (accessible to all) or ‘no’ (not accessible to some groups) response to indicate their judgments. If they gave a ‘no’ rating, we asked panelists to provide some explanation of which groups would be disadvantaged and why. Table 3.8 includes the percentage of AGLEs that were judged as accessible to all groups. Table 3.8. Frequency of AGLEs Rated as Accessible to All Students
Grade Frequency Percentage of AGLEs per Rating 5 104 83% 8 120 56%
11 267 98% In contrast to their ratings on symbolic communication abilities, panelists felt that the AGLEs particularly in grades 5 and 11 could be accessed by a wide range of students with different physical and cognitive disabilities. In grade 8, panelists rated only 56% of the AGLEs as being accessible to a wide range of students.
Summary and Discussion of AGLEs and GLEs/CLEs
For this alignment evaluation, panelists reviewed the AGLEs for science in two ways. First, they evaluated the content alignment (Criteria 1, 2 and 3 from the LAL method) between the grade span AGLEs and the corresponding GLEs/CLEs. Second, panelists rated the accessibility and appropriateness (Criterion 7) of the content for this population of students. The results of this review indicated that these panelists found the majority of AGLEs across grade levels to link sufficiently with the GLEs. In comparison, while most panelists found these content expectations to be accessible to various disability groups, they did express concern over access for students with limited symbolic communication. Table 3.9 displays the overall conclusions regarding content alignment between the AGLEs and GLEs/CLEs for science. These judgments are based on whether the AGLEs achieved acceptable levels of linkage with the full content standards for each set of grade level AGLEs.

20 Chapter 3: Results: AGLEs and GLEs/CLEs
High linkage – most of standards are acceptable (at least 90%) Partial linkage – some standards are acceptable (50-89%) Weak linkage – few to no standards are acceptable (less than 50%)
Table 3.9. Summary Conclusions on Alignment of AGLEs to GLEs/CLEs for Science on LAL Criteria 1, 2, and 3
Criterion 1 Criterion 2 Criterion 3 Grade Level Tests
Academic Age Appropriate Content Centrality Performance Centrality
Do the AGLEs refer to academic content?
Is content referenced to student’s assigned grade level?
Do the extended standards link to the target content in the grade-level standards?
Does the performance of the extended standards link to expectations of the grade level standards?
5 High High Partial Partial
8 High High Weak Partial
11 High High Not evaluated Not evaluated
The content alignment conclusions in Table 3.9 indicate that the grade-level science AGLEs are age appropriate and cover science content that is academic across all grades. However, there is only a partial linkage to the AGLEs in grade 5 for content and performance centrality. This means that some of the AGLEs for grade 5 did not sufficiently link to the central grade level content or to the same performance expectations as the GLEs. In grade 8, there is a weak link for content centrality but a partial link for performance centrality. In other words, some of the AGLEs for grade 8 did not have the same performance expectations as the GLEs while more than half of the AGLEs were rated as having a ‘weak’ or ‘no link’ to the content of the GLEs. Table 3.10 displays the overall conclusions on content accessibility pertaining to Performance Accuracy (content accessibility) for the AGLEs. For this criterion, conclusions reflect overall judgments of acceptability based on access to the content expectations7.
Excellent – all standards are acceptable Good – most standards are acceptable (at least 90%) Acceptable – many standards are acceptable (70%-90%) Questionable – few standards are acceptable (less than 70%)
7 Adapted from universal design ratings used by the National Center on Educational Outcomes (NCEO). See Thompson, Johnstone et al. (2005).

Chapter 3: Results: AGLEs and GLEs/CLEs 21
Table 3.10. Summary Conclusions on Performance Accuracy (LAL Criterion 7) of AGLEs for Science
Criterion 7 Grade Level Tests
Performance Accuracy (Potential Barriers to Accessibility)
Is the content appropriate for students at different levels of communication?
Is the content accessible to different disability groups?
5 Acceptable Acceptable
8 Questionable Questionable
11 Questionable Good
The conclusions on Performance Accuracy are acceptable in grade 5. This means that panelists judged the AGLEs favorably in terms of students with limited symbolic communication as well as students with varying physical or cognitive impairments being able to comprehend and demonstrate the content in the AGLE. On the other hand, panelists in grade 8 indicated for the majority of AGLEs that students with limited symbolic communication as well as students with varying physical or cognitive impairments may have difficulty comprehending or demonstrating knowledge of the AGLE. Finally in grade 11, the conclusions are disparate. Although seemingly in conflict, the conclusions on communication reflect panelists’ judgments that students with limited symbolic communication may have difficulty comprehending or demonstrating the content in some AGLEs. In contrast, panelists felt that students with varying physical or cognitive impairments (i.e., difficulty with instructions, attention, sensory integration) can access and demonstrate this knowledge.

Chapter 4: Results: Science MAP-A Tasks and AGLEs 23
Chapter 4: Results: Science MAP-A Tasks and AGLEs
In this chapter, we report the results of panelists’ ratings on the science MAP-A tasks per grade assessment. We present the results on the LAL Criteria 1 through 7. For grade 5, portfolio tasks were rated by five panelists. In grades 8 and 11, six panelists started the portfolio evaluations; however, one panelist in grade 8 and two panelists in grade 11 did not rate more than half of the portfolio tasks. For this reason, their data was removed from analyses as outliers. All of the grade 8 results in this chapter are from five panelists while the grade 11 results are from four panelists.
Results on Science MAP-A Tasks based on LAL Criteria
Ratings involved evaluation of the assessment relative to the AGLEs on all seven of the LAL criteria. Most results reflect mean ratings on a series of scales. Mean ratings were derived from frequency counts (per panelist) of how many AGLEs were rated at each response option. From these counts, we then calculated the mean number of AGLEs per response option (across panelists) for each rating scale. At least 90% of tasks must achieve acceptable ratings to demonstrate linkage to grade-level content for each LAL criterion.
Criterion 1: Academic - The content is academic and includes the major domains/strands of the content area as reflected in state and national standards (e.g., reading, mathematics, science).
Per the USDE (2005), alternate assessments counting towards Title I must assess students only on academic content, as opposed to functional life skills. Panelists were asked to judge the grade-level science portfolio tasks as to whether each task does focus primarily on academics. Results of this analysis are presented in Table 4.1. At least 90% of tasks should be rated as academic. Table 4.1. Mean Number of Tasks Rated as Academic by Panelists
Grade Number of
Tasks Rated
Mean Number of Tasks Academic
Mean Number of Tasks Functional
Percentage of Tasks Rated
Academic M SD M SD 5 120 8.6 30.7 20 31.0 82% 8 120 110.2 19.2 3.8 7.4 92% 11 119a 105.5 9.4 7.8 8.7 89%
a. There was one portfolio in grade 11 that had only 7 portfolio tasks instead of 8.
Panelists considered the majority of portfolio tasks to be academic in nature in all grades. However, a higher percentage of portfolio tasks were not considered academic in grades 5 and 11. Missouri may want to review training regarding portfolio task development for teachers.
Criterion 2: Age Appropriate - The content is referenced to the student’s assigned grade level (based on chronological age).
Panelists evaluated the portfolio tasks on whether the content and performance assessed students at an appropriate level linked to their assigned grade. Table 4.2 shows the mean number and percent of tasks judged as adapted (linked) to grade level, inappropriate (off-grade), and neutral

24 Chapter 4: Results: Science MAP-A Tasks and AGLEs
(not age-bound). For acceptable linkage, at least 90% of tasks must be judged adapted or neutral. For all grades, the science tests surpassed the minimum requirement of 90% tasks rated as “adapted” or “neutral.” This finding indicates that panelists found the majority of the tasks to be linked to grade-level content. Table 4.2. Mean Percentage of Tasks at Various Levels of Age Appropriateness
Grade Age Appropriateness Rating Mean SD Percentage of
Tasks per Ratinga
5 Adapted 115.2 8.7 96% Neutral 1.2 1.8 1% Inappropriate 3.6 7.0 3%
8 Adapted 112.0 10.1 93% Neutral 2.4 5.4 2% Inappropriate 0.0 0.0 0%
11 Adapted 51.5 58.6 43% Neutral 61.8 63.5 52% Inappropriate 0.0 0.0 0%
a. Percentages may not sum to 100% as not all panelists provided ratings for all portfolio tasks.
Criterion 3: Standards Fidelity
a. Content Centrality - The focus of achievement maintains fidelity with the content of the original grade level standards.
Panelists rated tasks for content match to the AGLEs to determine the extent to which the tasks assess grade-level content. Several analyses were performed on these ratings. First, we reviewed the number of tasks that were linked to at least one AGLE. Table 4.3 shows that all raters considered all portfolio tasks for each grade science test to link to an AGLE. Table 4.3. Mean Number of Tasks Linked to AGLEs
Grade Percentage of Tasks Linked to AGLEs 5 100% 8 100%
11 100% We also asked panelists to evaluate how well the tasks targeted the AGLEs. At least 90% of tasks should be judged as moderately to closely linked with the AGLEs for acceptability. Table 4.4 presents the mean number and percent of tasks that fell into each category based on panelists’ ratings.

Chapter 4: Results: Science MAP-A Tasks and AGLEs 25
Table 4.4. Mean Percent of Tasks at Various Levels of Content Centrality
Grade Content Centrality Rating Mean SD
Percentage of Tasks per Ratinga
5
No Link 1.2 1.1 1% Weak Link 8.0 5.1 7% Moderate Link 21.2 3.3 18% Close Link 89.2 7.3 74%
8
No Link 4.4 3.8 4% Weak Link 18 12.3 15% Moderate Link 22.4 9.3 19% Close Link 69.6 25.9 58%
11
No Link 6.3 6.7 5% Weak Link 6.5 4.1 5% Moderate Link 21.0 5.5 18% Close Link 79.5 11.6 67%
a. Percentages may not sum to 100% as not all panelists provided ratings for all portfolio tasks. Panelists in grades 5 and 11 rated the majority of tasks as linked to the target content of the AGLEs. There was a small number of portfolio tasks in grades 5 and 11 that panelists rated as having a ‘weak’ or ‘no’ link to the AGLEs. A greater concern is in the grade 8 ratings where 19% of the tasks were rated as having a ‘weak’ or ‘no’ link to the AGLEs.
b. Performance Centrality - The focus of achievement maintains fidelity with the specified performance.
In addition to the targeted content, the alternate assessment tasks should retain the performance intended by the full content standards to some extent. For example, if the full content standards require students to ‘compare and contrast’ content, the AGLEs should require students to make some type of distinction. Table 4.5 shows the mean number of tasks rated as retaining all (same performance), some, or none of the performance expectations of the corresponding benchmarks. At least 90% of tasks should receive ratings of ‘Some’ or ‘All.’ Table 4.5. Mean Percent of Tasks at Various Levels of Performance Centrality
Grade Performance Centrality Rating Mean SD
Percentage of Tasks per Ratinga
5 All 97.4 11.7 81% Some 19.0 10.6 16% None 3.2 5.0 3%
8 All 69.4 26.7 58% Some 40.0 20. 33% None 5.0 5.2 4%
11 All 81.0 12.6 68% Some 25.0 10.7 21% None 7.3 6.0 6%
a. Percentages may not sum to 100% as not all panelists provided ratings for all portfolio tasks.

26 Chapter 4: Results: Science MAP-A Tasks and AGLEs
Grades 5 and 8 surpassed the minimum level of acceptability (90%) of tasks assessing students on at least some of the same performance expectations as the AGLEs. Grade 11 just missed the minimum level of acceptability; however, there was one panelist in grade 11 that rated the majority of portfolio tasks but not all portfolio tasks due to time constraints.
Criterion 4: Content Coverage - (Webb dimensions) - The content differs from grade level in range, balance, and DOK, but matches high expectations set for students with significant cognitive disabilities.
Criterion 4 incorporates the Webb alignment statistics. For each alignment indicator, we present the mean results of panelists’ ratings for each grade test. Results are reported at the strand level. Thus, the mean ratings reported indicate which content strands associated with the AGLEs are covered well on the assessment, based on panelists’ evaluations. The MAP-A is designed such that in each grade assessment, there are four content strands that a student is assessed on. Across grades 5, 8, and 11, all eight of the content strands are assessed; however, only six of the eight content strands are assessed at each grade level. Two of the content strands are the same for all students in each grade while the other two strands are chosen from the remaining four content strands assessed at that grade level. Table 4.6 shows the breakdown of content strands assessed in each grade. Table 4.7 shows the number of portfolio tasks that were reviewed by panelists for each assessed content strand. Table 4.6. Summary of Content Strands Assessed by Grade Level
Grade Level
Content Strand (Required)
Content Strand (Required)
Content Strand (Choose One)
Content Strand (Choose One)
5
Processes and Interactions of the Earth’s Systems
(ES)
Composition and Structure of the
Universe and the Motion of the
Objects within it (UN)
Scientific Inquiry (IN) or Impact of
Science, Technology, and
Human Activity (ST)
Characteristics and Interactions of Living Organisms (LO) or
Changes in Ecosystems and Interactions of
Organisms with Their Environment (EC)
8 Properties and
Principles of Matter and Energy (ME)
Properties and Principles of Force and Motion (FM)
Scientific Inquiry (IN) or Impact of
Science, Technology, and
Human Activity (ST)
Processes and Interactions of the
Earth’s Systems (ES) or Composition and
Structure of the Universe and the Motion of the Objects within it (UN)
11
Characteristics and Interactions of
Living Organisms (LO)
Changes in Ecosystems and Interactions of
Organisms with Their Environment
(EC)
Scientific Inquiry (IN) or Impact of
Science, Technology, and
Human Activity (ST)
Properties and Principles of Matter and
Energy (ME) or Properties and
Principles of Force and Motion (FM)

Chapter 4: Results: Science MAP-A Tasks and AGLEs 27
Table 4.7. Summary of Portfolio Tasks Reviewed by Panelists by Content Strand Identified by API
Grade Level
Strand 1: ME
Strand 2: FM
Strand 3: LO
Strand 4: EC
Strand 5: ES
Strand 6: UN
Strand 7: IN
Strand 8: ST
Total Tasks
5 n/a n/a 18 12 30 30 18 12 120
8 30 30 n/a n/a 20 10 20 10 120
11 20 10 30 29 n/a n/a 18 12 119
Categorical Concurrence. In the previous section on Content Centrality under Criterion 3, we presented results on whether or not, and how well, each task matched to content expectations. For this analysis, we focus on the content expectations to determine which AGLEs were assessed. Categorical concurrence describes the extent to which the AGLEs are covered by the assessment. For a regular assessment, Webb recommends a minimum of six test questions assessing each content strand to adequately cover that content; but for an alternate assessment, the criterion is one portfolio task per strand. This change is appropriate because alternate assessments tend to include considerably fewer items or tasks compared with a regular assessment. In addition, a single task may assess multiple content expectations8. Table 4.8 summarizes the MAP-A alignment results for categorical concurrence. As Table 4.8 indicates, all grade-level tests met the Webb alignment criterion of at least one task per content strand. Table 4.8. Summary of Categorical Concurrence Results for Science MAP-A by Grade Level
Grade Level
Mean Number of Tasks per Strand Strands with at Least One
Task ME FM LO EC ES UN IN ST
5 n/a n/a 18.4 12.0 30.0 30.0 18.4 12.0 6 of 6
8 31.4 26.0 n/a n/a 19.4 7.2 23.8 9.4 6 of 6
11 19.0 11.5 29.5 26.0 n/a n/a 20.0 10.0 6 of 6
Depth-of-Knowledge Consistency. Depth-of-Knowledge (DOK) consistency measures the type of cognitive processing required by each performance task compared to the requirements implied by the content objectives. To make these judgments, reviewers first determined the DOK level for each AGLE using a rating scale (see Appendix C for the LAL DOK level descriptions). Next, as they reviewed portfolio tasks, panelists rated the level of processing needed to perform the task using the same DOK rating scales. Table 4.9 shows the mean percentage of tasks rated at each DOK level per grade level.
8 The psychometric trade-off is that fewer tasks per strand may lead to a decrease in scoring accuracy.

28 Chapter 4: Results: Science MAP-A Tasks and AGLEs
Table 4.9. Mean Percentage of Tasks at Each DOK Level
Grade Task DOK Rating Mean SD Percentage of Tasks
per Rating
5
None 4.00a n/a 0.66 Attention 11.00 6.63 9.11 Memorize/recall 22.00 15.57 18.21 Performance 51.40 6.95 42.55 Comprehension 27.80 20.72 23.01 Application 7.80 7.09 6.46 Analysis, Synthesis, Evaluation 0.00 0.00 0.00
8
None 2.00a n/a 0.34 Attention 11.00 6.16 9.26 Memorize/recall 10.40 4.93 8.75 Performance 55.40 14.42 46.63 Comprehension 23.40 11.93 19.70 Application 13.00 5.96 10.94 Analysis, Synthesis, Evaluation 8.67 3.06 4.38
11
None 1.00a n/a 0.21 Attention 9.25 6.08 7.87 Memorize/recall 33.25 22.25 28.30 Performance 52.25 19.02 44.47 Comprehension 8.50 4.43 7.23 Application 12.25 6.34 10.43 Analysis, Synthesis, Evaluation 7.00a n/a 1.49
a Only one reviewer gave this rating. We then compared these two separate judgments about cognitive complexity (one for the AGLE, one for the portfolio task) to determine the proportion of tasks written at the appropriate level. Webb refers to this comparison as depth-of-knowledge consistency. Table 4.10 summarizes the depth-of-knowledge consistency results for each grade level of the science MAP-A assessment. Since reviewers evaluated depth-of-knowledge at the most specific level of the standards document (AGLEs), the table refers to consistency between the portfolio tasks and the AGLEs to which they were matched. Results are summarized in terms of the percentage of tasks with cognitive complexity ratings at or above the rating for the corresponding strand. Webb’s suggested criterion for this alignment indicator is the same as for a regular assessment – at least 50% of the portfolio tasks should have complexity ratings at or above the level of the corresponding AGLE per content strand.

Chapter 4: Results: Science MAP-A Tasks and AGLEs 29
Table 4.10. Summary of Depth-of-Knowledge Results for Science MAP-A by Grade Level
Grade Level
Percent of Tasks with DOK At or Above the Level of the AGLEs per Strand Number of
Strands Assessed
Adequately
Specific Strands
Assessed Inadequately ME FM LO EC ES UN IN ST
5 n/a n/a 72.0 100.0 79.3 79.3 47.1 80.0 5 of 6 Scientific Inquiry (IN)
8 93.9 91.6 n/a n/a 95.3 100.0 89.0 100.0 6 of 6 n/a
11 89.4 91.7 95.7 93.9 n/a n/a 73.1 100.0 6 of 6 n/a
All of the grade-level science assessments met Webb’s target of 50% consistency with the AGLEs in grades 8 and 11. Webb’s target was met for all AGLEs in grade 5 except Scientific Inquiry (IN). In this grade, panelists found tasks assessing AGLEs under the Scientific Inquiry (IN) strand to be lower in complexity than expected. Based on these findings, Missouri may wish to review training for writing portfolio tasks and AGLEs to determine if changes are necessary for one or both. Range of Knowledge Correspondence. Range of knowledge correspondence measures how fully the tasks cover each of the AGLEs within each strand. The assessed AGLEs within a strand should be linked with at least one portfolio task. Webb’s minimum level of acceptability for range-of-knowledge correspondence is 50% per strand. This means that at least 50% of the AGLEs must be matched to one or more portfolio tasks. Table 4.11 summarizes the range-of-knowledge correspondence results for each grade level of the MAP-A. We computed the number of AGLEs covered for each strand separately for each panelist and then averaged across panelists to obtain the summary alignment indicator. Table 4.11. Summary of Range-of-Knowledge Results for Science MAP-A by Grade Level
Grade Level
Percent of AGLEs per Strand Matched to at Least One Task Number of
Strands Assessed
Adequately
Specific Strands Assessed
Inadequately ME FM LO EC ES UN IN ST
5 n/a n/a 21.1 22.9 44.4 61.5 46.7 80.0 2 of 6 LO, EC, ES, IN
8 31.6 37.8 n/a n/a 20.0 22.5 33.1 30.8 0 of 6 ME, FM, ES, UN, IN, ST
11 12.0 14.2 25.0 25.0 n/a n/a 22.6 25.0 0 of 6 ME, FM, LO, EC, IN, ST
As Table 4.11 demonstrates, only two strands were covered adequately by the assessments across all grade levels, Universe (UN) and Science, Technology (ST) in grade 5. That is, at least 50% of the AGLEs were linked to at least one portfolio task in those grade 5 content strands. For all the other grade 5 content strands as well as all of the content strands in grades 8 and 11, the

30 Chapter 4: Results: Science MAP-A Tasks and AGLEs
sample of portfolios indicates that the majority of AGLEs are not tested by portfolio tasks. Part of this finding is a result of the large number of AGLEs for each content strand and that for some content strands teachers choose between two. This means that there are a large number of AGLEs from which teachers develop one task to assess the student. Missouri may want to consider allowing teachers to choose from a subset of AGLEs within each content strand, reducing the number of AGLEs, or altering the format of the assessment to include more items/tasks. Balance-of-Knowledge Representation. The fourth measure of alignment included in the Webb method is balance-of-knowledge representation. This measure indicates the number of tasks linked to each AGLE per strand. The number of tasks should be distributed rather evenly between the objectives for each strand to achieve good balance. The content balance is determined by calculating an index, or score, for each strand9. According to Webb, the minimum acceptable index for a single strand is 70 (on a scale of 0 to 100, with 100 representing perfect balance). To be clear, a strand may include more objectives than reviewers actually linked to portfolio tasks. Thus, only those objectives actually used by the reviewers are included in calculations of the balance index. Table 4.12 summarizes the results on balance of content representation per grade level of the science MAP-A. As the table demonstrates, all content strands met Webb’s criterion of a balance index of at least 70 across all grade levels. Table 4.12. Summary of Balance-of-Knowledge Representation Results for Science MAP-A by Grade Level
Grade Level
Balance Index per Strand Strands with Adequate Balance
Strands with Limited Balance ME FM LO EC ES UN IN ST
5 n/a n/a 74 83 71 80 82 85 6 of 6 n/a
8 83 86 n/a n/a 84 92 79 87 6 of 6 n/a
11 84 93 79 74 n/a n/a 80 83 6 of 6 n/a
Criterion 5: Content Differentiation - There is some differentiation in content across grade levels.
This criterion focuses on whether the content expectations change appropriately between grade levels. Since the science MAP-A assessments are grade-span tests, this criterion was not evaluated. Additionally, the AGLEs are cumulative across the grades such that all of the AGLEs in grade 5 are also in grade 8 and all of the grade 8 AGLEs are also in grade 11.
9 The exact formula for calculating the balance index is explained in detail in Norman Webb’s (2005) alignment training manual: http://www.wcer.wisc.edu/WAT/index.aspx.

Chapter 4: Results: Science MAP-A Tasks and AGLEs 31
Criterion 6: Achievement - The expected achievement for students is for the students to show learning of grade-referenced academic content.
The sixth LAL criterion pertains to demonstration of student learning. Thus, this criterion focuses more on accessibility to students than on content alignment. The alternate assessment should allow students with disabilities to demonstrate academic skills or knowledge acquired from their coursework on the assessment. To determine the extent to which the MAP-A enables students to demonstrate this learning, panelists evaluated the scoring rubric and achievement level descriptors relative to the assessment.
After panelists completed their portfolio ratings, each grade-level panel discussed how effectively the MAP-A allowed students to demonstrate their learning. For the panelists that were not special educators, this was their first exposure to the MAP-A. As a result, there was a very steep learning curve needed to understand the intricacies of the MAP-A as well as the population served. Panelists worked together for consensus to determine whether the assessment allowed for demonstration of high, low, or no evidence of student learning. These ratings were made across several dimensions of learning, which are described below (adapted from Flowers et al, 2007):
Level of accuracy – extent to which scoring makes clear distinctions in student responses.
Level of independence
– extent to which student performance is based on independent response without teacher supports.
New learning – extent to which evidence of new learning is demonstrable based on use of baseline or pretest OR clear content differentiation between grade tests.
Generalization across people and settings
– extent to which students must demonstrate knowledge across people or settings to receive credit.
Generalization across materials and activities
– extent to which students must demonstrate knowledge across different types of materials (i.e., objects) or activities.
Standard setting – extent to which achievement standards are distinct and based on demonstration of independent student performance.
Program quality indicators
– extent to which the inclusion of program characteristics (i.e., opportunities for instruction; access to materials; teacher qualities) is limited as part of student score.
For accurate assessment of achievement, most dimensions should receive ratings of ‘high inference’ regarding the ability to evaluate student learning. Table 4.13 includes the group consensus ratings on the degree of student inference evident in the science MAP-A assessment per grade level and a summary of each group’s discussion of the characteristics of the assessment. It is important to note that the rationale given for each grade is the panelists’ perception and understanding of what is being asked in reference to the MAP-A. Each group functioned differently and a different group of panelists may give slightly different

32 Chapter 4: Results: Science MAP-A Tasks and AGLEs
responses. Additionally, each facilitator functioned differently with two facilitators noting the full conversation among panelists while one facilitator noted the overall conclusion of the discussion. Table 4.13. Degree of Inference Evident on Student Learning in Science MAP-A Assessments Grade Dimensions Rating Rationale
5
Level of Accuracy H The teacher instructions provide clear guidance as to how to develop the task and how it links to the API. The task and description of student performance spelled out by the teachers are reviewed by scorers and given a final score that includes level of accuracy as a component. Implemented correctly, there is high student inference with regard to accuracy.
Level of Independence
H It is laid out well in the teacher instructions and reinforced in the student performance as described by the teacher in the Student Work Record document. The task and description of student performance are reviewed by scorers and given a final score that includes level of independence as a component.
New Learning L Since different strands are assessed each assessment period and no pre-test/post-test conditions, it is difficult to know if new learning occurs. Teachers develop the tasks based on their students’ ability and learning; therefore, a complete absence of new learning is illogical.
Generalization across People and Settings
H The system is designed to demonstrate one task with one person; however, the system does generalize to people and settings from the standpoint of two iterations that often involve a task being modified. From the tasks reviewed by panelists, the tasks could easily be used across people and settings.
Generalization across Materials and Activities
H Although, teachers design tasks so that they target what the student can do and knows, choosing the materials and activities best suited to their student, the tasks could fit many students.
Standard Setting H There are no limits built into the system, so expectations can be as high as the student’s potential. The teacher has the power, and the familiarity with their students, to determine what students must do in order to demonstrate their knowledge, as defined by each individual student's capability.
Program Quality Indicators
H There are many indicators: DOK, task specific assistance, rubric, task design guidance, and teacher evaluations of student performance. Specific information that should be addressed in the task and data collection are specified.
(continued)

Chapter 4: Results: Science MAP-A Tasks and AGLEs 33
Table 4.13. Degree of Inference Evident on Student Learning in Science MAP-A Assessments (continued) Grade Dimensions Rating Rationale
8
Level of Accuracy H Students are asked to complete tasks within level of accuracy asked by the teacher.
Level of Independence
H Students’ scores reflected the level of assistance needed.
New Learning N Baseline is not gathered for students.
Generalization across People and Settings
H Activities can be generalized across multiple students and settings.
Generalization across Materials and Activities
L Variation in amount of activities or expectations that are required.
Standard Setting H Correct responses were specific to the task.
Program Quality Indicators
N Student's scores can be dependent on the ability of the teacher to create activities that correspond with the API.
11
Level of Accuracy L Accuracy appears pretty good by design. However, the test is teacher driven-- teachers write and assess the activities. Portfolios include activities that students will be successful at. Therefore, scores may be artificially inflated. Scores are individualized, so a high score does not necessarily indicate knowledge and skills, but rather where the student is at time of testing. Students always tested on something different (no 2 AGLEs for the same kid).
Level of Independence
H Questions are designed where students can be more independent. Test forms have an indicator for accuracy and independence.
New Learning L It is a status test--no baseline or pretest. Test year to year to year. The test content changes from year to year, so new learning is difficult to judge across years. Within a year it is possible that only 1 or 2 tasks might be used (administered 3 or even 6 times), so the information gathered on new learning is necessarily limited by the amount of tested content within a year. Finally, since most students score in the upper 2 levels, gauging new learning is limited by a “ceiling effect.”
(continued)

34 Chapter 4: Results: Science MAP-A Tasks and AGLEs
Table 4.13. Degree of Inference Evident on Student Learning in Science MAP-A Assessments (continued) Grade Dimensions Rating Rationale
11 (cont’d)
Generalization across People and Settings
* From the test we would not know whether the tasks were generalizable across settings or people. They may certainly be, but may not. Tasks are repeated, and we don't know whether there was effort on this front. Some students are mainstreamed into classrooms, others not. Collection period may provide variance. Try to replicate to get better indication of new learning. See above.
Generalization across Materials and Activities
* Same as above.
Standard Setting * You can tell more about what students know and can do from the design of the tasks than from the scores. It hinges on the teacher activity, but may not be reflected in the score. Can tell more from the description than the accuracy or independence levels or scores. Must answer the "why" question in the description. Hard to report.
Program Quality Indicators
* Scores combined with regular EOC MAP scores. Partly based on how well the teacher designed the prompt, not programmatic.
H = high student inference; L = low student inference; N = no student inference*Grade 11 teachers did not provide several dimension ratings. Variability from school-to-school would make the ratings differ, so they provided descriptions rather than ratings. For grades 5 and 8, panelists determined that the scoring rubric and achievement standards allowed for clear distinctions among student responses on tasks, as demonstrated by their ratings on Level of Accuracy. In grade 11, panelists determined that there was low distinction among student responses because the assessment is teacher driven and scores are indicative of what a student knows at that time. Panelists’ ratings suggest that the grade 5 assessment seems to enable students to demonstrate learning better overall (across multiple dimensions) while the grade 8 assessment seems to do so only across people and settings. Panelists noted that it is difficult to identify evidence of “new learning” because no baseline exists for comparison, particularly if tasks between grades are quite similar. Additionally, panelists were not exposed to information found in the higher or lower grade than the one they were reviewing; thus, the focus of conversation was on pre-/post- assessment and not differentiation between grades. Given the focus on pre-/post- assessment, panelists saw little evidence that new content has been taught or learned by students. In grade 11, panelists were torn in providing a rating as their rationale points to a conditional response for the majority of the dimensions being rated. They claimed that, depending on the teacher’s/school’s efforts and expertise, the ratings could range from low to high.
Criterion 7: Performance Accuracy - The potential barriers to demonstrating what students know and can do are minimized in the assessment to increase measurement accuracy of student performance.

Chapter 4: Results: Science MAP-A Tasks and AGLEs 35
Criterion 7 is intended to evaluate the degree of accessibility of the assessment for all student groups who take it. Reduced access to the assessment tasks would decrease accurate measurement of these students’ skills. Panelists rated tasks on the levels of communication required to respond and the access to each type of student who takes the assessment. In addition, panelists evaluated each portfolio task on whether accommodations or supports can be provided for different types of students without substantially altering the target content. Table 4.14 gives mean ratings on the communication levels required of students in order to respond to the science MAP-A. At least 90% of tasks should be rated as pre-symbolic for reasonable access by all students. None of the grades met this minimum requirement. The panelists for grade 5 rated more than half of the portfolio tasks as requiring pre-symbolic ability. On the other hand, panelists rated less than 10% of the portfolio tasks as requiring pre-symbolic ability in grades 8 and 11. These results are based on the portfolio task that was developed specifically for the student and at the student’s ability level. The possibility exists that the sample of portfolios selected for review consisted of students with higher levels of communication; therefore, the portfolio tasks designed specifically for these students assessed the student at the appropriate symbolic level even though that level may be higher than pre-symbolic. Table 4.14. Mean Percentage of Tasks at Various Levels of Symbolic Communication
Grade Symbolic Ability Rating Mean SD Percentage of Tasks per
Ratinga
5 Pre-symbolic 80.0 41.3 67% Early Symbolic 14.0 19.5 12% Symbolic 26.0 27.2 22%
8 Pre-symbolic 12.0 9.5 10% Early Symbolic 34.0 21.1 28% Symbolic 68.4 33.8 57%
11 Pre-symbolic 2.0 2.8 2% Early Symbolic 81.5 28.0 68% Symbolic 29.8 14.0 25%
a. Percentages may not sum to 100% as not all panelists provided ratings for all portfolio tasks. Concerning the accessibility of task content to students with a variety of disabilities, panelists for the grade 5 and grade 11 assessments considered the majority of operational tasks to be accessible to a wide range of students, as shown in Table 4.15. In grade 8, panelists found that half of the portfolio tasks were accessible to a wide range of students. Again, the portfolio tasks are designed specifically for the student and these ratings may reflect more on the type of students in the sample than accessibility issues in general. Table 4.15. Frequency of Tasks Rated as Accessible to All Students
Grade Frequency Percentage of Tasks per Rating 5 112.4 94% 8 64.2 54% 11 103.5 87%
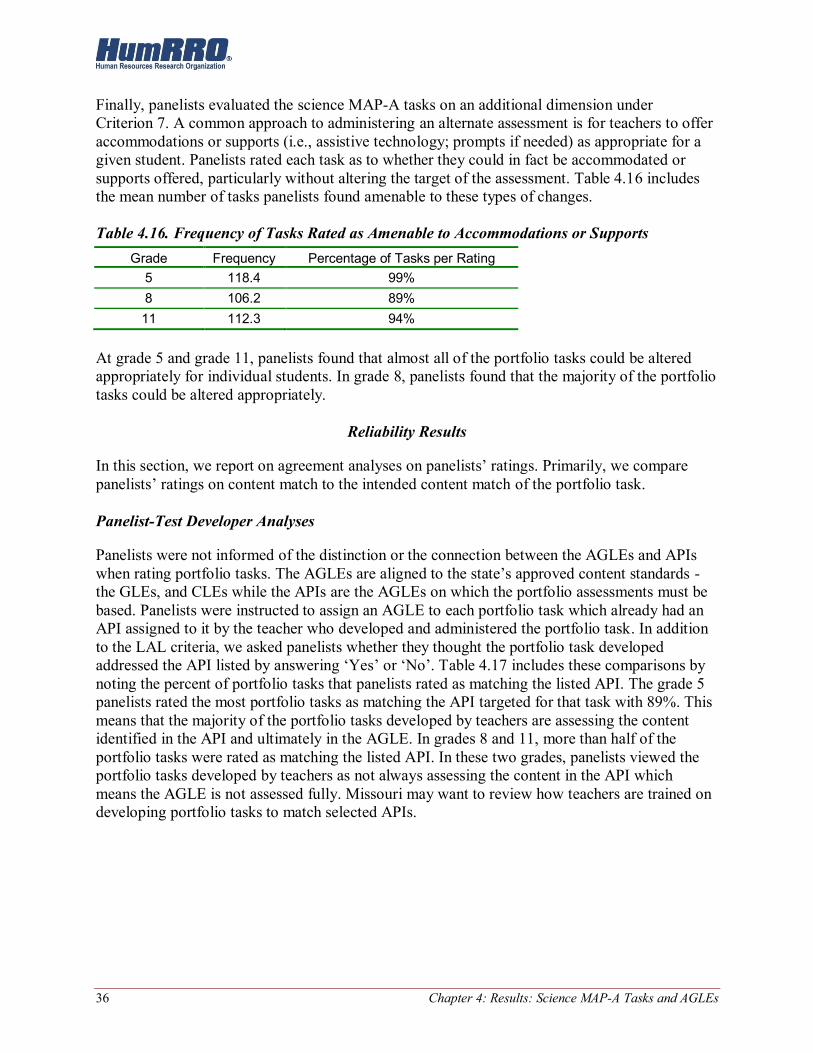
36 Chapter 4: Results: Science MAP-A Tasks and AGLEs
Finally, panelists evaluated the science MAP-A tasks on an additional dimension under Criterion 7. A common approach to administering an alternate assessment is for teachers to offer accommodations or supports (i.e., assistive technology; prompts if needed) as appropriate for a given student. Panelists rated each task as to whether they could in fact be accommodated or supports offered, particularly without altering the target of the assessment. Table 4.16 includes the mean number of tasks panelists found amenable to these types of changes. Table 4.16. Frequency of Tasks Rated as Amenable to Accommodations or Supports
Grade Frequency Percentage of Tasks per Rating 5 118.4 99% 8 106.2 89% 11 112.3 94%
At grade 5 and grade 11, panelists found that almost all of the portfolio tasks could be altered appropriately for individual students. In grade 8, panelists found that the majority of the portfolio tasks could be altered appropriately.
Reliability Results
In this section, we report on agreement analyses on panelists’ ratings. Primarily, we compare panelists’ ratings on content match to the intended content match of the portfolio task. Panelist-Test Developer Analyses
Panelists were not informed of the distinction or the connection between the AGLEs and APIs when rating portfolio tasks. The AGLEs are aligned to the state’s approved content standards - the GLEs, and CLEs while the APIs are the AGLEs on which the portfolio assessments must be based. Panelists were instructed to assign an AGLE to each portfolio task which already had an API assigned to it by the teacher who developed and administered the portfolio task. In addition to the LAL criteria, we asked panelists whether they thought the portfolio task developed addressed the API listed by answering ‘Yes’ or ‘No’. Table 4.17 includes these comparisons by noting the percent of portfolio tasks that panelists rated as matching the listed API. The grade 5 panelists rated the most portfolio tasks as matching the API targeted for that task with 89%. This means that the majority of the portfolio tasks developed by teachers are assessing the content identified in the API and ultimately in the AGLE. In grades 8 and 11, more than half of the portfolio tasks were rated as matching the listed API. In these two grades, panelists viewed the portfolio tasks developed by teachers as not always assessing the content in the API which means the AGLE is not assessed fully. Missouri may want to review how teachers are trained on developing portfolio tasks to match selected APIs.

Chapter 4: Results: Science MAP-A Tasks and AGLEs 37
Table 4.17. Percentage Agreement between Panelists and Teachers on Assessment Target for MAP-A Science
Grade Mean Number of Tasks
that Match API Percentage of Tasks that
Match API 5 107.2 89% 8 82.0 68% 11 92.5 78%
Summary and Discussion of Science MAP-A Tasks and Extended Standards
Table 4.18 displays the overall conclusions regarding content alignment between the science MAP-A assessments and the AGLEs. These judgments are based on whether the MAP-A portfolio tasks achieved acceptable levels of linkage with the AGLEs for each grade test. The minimum level for each of the criteria in Table 4.15 is 90%.
High linkage – most of tasks are acceptable (at least 90%) Partial linkage – some tasks are acceptable (50-89%) Weak linkage – few to no tasks are acceptable. (less than 50%)
Table 4.18. Summary Conclusions on Alignment of Science MAP-A Assessments to AGLEs for LAL Criteria 1, 2, 3, and 4
Criterion 1 Criterion 2 Criterion 3 Criterion 4 Grade Level Academic Age
Appropriate Content
Centrality Performance
Centrality Content Coverage
Are students assessed on academic content?
Is task content referenced to student’s assigned grade level?
Do tasks link to the target content in the AGLEs?
Does the performance of task link to expectations of the AGLEs?
Do the tasks assess students at the appropriate breadth of knowledge? a
Do the tasks assess students at the appropriate depth-of-knowledge? b
5 Partial High High High Partial Partial
8 High High Partial High Partial High
11 Partial High Partial Partial Partial High a Conclusions are based on a summary judgment across the Webb statistics of Categorical Concurrence, Range of Knowledge, and Balance of Knowledge. It is still important to consider each of the criteria separately as well. b Conclusions are based on the results from the DOK consistency analyses. As Table 4.18 illustrates, the 2012 science MAP-A assessments linked well to the content of the AGLEs for some of the dimensions. Across all grades, some restriction in the range of content assessed resulted in partial ratings. In grades 5 and 11, there were a number of portfolio tasks that panelists rated as functional instead of academic. In grade 5, panelists rated the majority of portfolio tasks as age appropriate, linking to AGLEs, and linked to the expectations of the AGLEs. On depth-of-knowledge assessed, panelists determined that many tasks assessed students at a different level of cognitive complexity than expected in the AGLEs for grade 5. For grade 8, panelists rated the majority of tasks as age appropriate, linked to the expectations of the AGLEs, and assessing students at the same level of cognitive complexity as expected in the AGLEs. However, some of the portfolio tasks were rated by panelists as not linking to the AGLEs. In

38 Chapter 4: Results: Science MAP-A Tasks and AGLEs
grade 11, panelists rated the majority of portfolio tasks as being age appropriate and assessing students at the same level of cognitive complexity as expected in the AGLEs. On the other hand, panelists determined that some of the portfolio tasks did not link to the AGLEs and did not link to the expectations of the AGLEs. Table 4.19 includes results relative to Criterion 6 and 7 of the LAL method. These rating questions asked panelists to determine whether the assessment tasks are designed in such a way that students can demonstrate knowledge at various levels of functioning and ability. Ratings in this case are based on evaluations of accessibility, rather than on content alignment.
Excellent – all tasks are acceptable Good – most tasks are acceptable (at least 90%) Acceptable – many tasks are acceptable (70%-89%) Questionable – few tasks are acceptable (less than 70%)
Table 4.19. Summary Conclusions on Accessibility (LAL Criteria 6 and 7) of Science MAP-A Assessments
Criterion 6 Criterion 7 Grade Level Tests
Achievement Performance Accuracy (Potential Barriers)
Does the assessment allow for accurate inference about student learning?
What level of symbolic communication does task require?
Is task accessible to different disability groups?
Can task be modified/supports provided without changing meaning or difficulty?
5 Good Questionable Good Good
8 Acceptable Questionable Questionable Acceptable
11 Questionable Questionable Acceptable Good
The most noticeable issue regarding accessibility for the science MAP-A assessments concerns the measurement of achievement (Criterion 6), particularly for grade 11. For this grade, panelists indicated difficulty determining a level of inference about student achievement regarding generalizability, standard setting, and program quality indicators because ratings could range from high to low depending on the teacher’s/school’s efforts and expertise. Results on Criterion 7 were mixed. For grade 5, ‘Good’ results can be found for the tasks being accessible to different disability groups as well as amenable to modifications or supports. Grade 8 showed questionable results for whether the task is accessible to different disability groups. Panelists rated the majority of portfolio tasks as providing modifications or supports without altering the meaning or difficulty in grades 8 and 11. Additionally in grade 11, portfolio tasks were found to be accessible to different disability groups. Across all grades, questionable results were seen for the level of symbolic communication required to answer a portfolio task.

Chapter 5: Summary and Recommendations 39
Chapter 5: Summary and Recommendations
HumRRO conducted an alignment review of the science MAP-A assessment to evaluate the content alignment, as well as content accessibility, of the AGLEs and GLE/CLEs. Alignment to the state academic content standards is a requirement of the No Child Left Behind Act of 2001, although alternate standards and assessments may be reduced in breadth and depth. Furthermore, all aspects of the assessment system must be accessible to the student for whom it was designed. Two types of alignment evaluations were applied to the Grades 5, 8, and 11 science MAP-A tests: (a) alignment of the AGLEs to the GLEs/CLEs for science and (b) alignment of the science MAP-A assessments to the AGLEs. The cumulative results point to reasonable content linkage of the assessment and AGLEs with the content standards on most dimensions. The findings on content accessibility were mixed for the assessments. For the 2012 assessments, panelists identified some concerns over the ability to make accurate inferences about student knowledge based on the present scoring rubric and achievement standards. Finally, panelists noted that some content expectations may be set too high, which could exclude students with pre-symbolic or even early symbolic communication ability to access the assessment. HumRRO does suggest areas where Missouri could improve access to the content of the AGLEs, as well as strengthen content alignment and access for the science MAP-A assessments. For this reason, HumRRO makes the following recommendations to Missouri per the assessment component. These recommendations focus on the more critical findings, including those portions of Tables 3.9 and 3.10 in Chapter 3 and Tables 4.18 and 4.19 in Chapter 4 highlighted in red (weak or questionable) or in yellow (partial) .
AGLEs for Science Review the access points for the AGLEs at all grade levels. Panelists identified some
AGLEs that may limit access only to those students with higher symbolic abilities, thus excluding a portion of students from the assessment. Reviewing the AGLEs may involve additional bias reviews to modify the current expectations; or, additional explanation (e.g., content limitations, examples) within the MAP-A Instructor’s Guide and Implementation Manual may be sufficient to better illustrate how teachers might make these content expectations more appropriate for students with lower symbolic abilities.
Review the link between the AGLEs and the GLEs at all grade levels. Panelists identified a number of AGLEs as having a ‘weak’ or ‘no’ link to the GLEs. For a small number of AGLEs, only one panelist was able to provide a GLE that matched the AGLE. We suggest that DESE review the all of the AGLEs to ensure that the content expectations are similar to those in the content standards.
MAP-A Portfolio Tasks Improve the ability of the science MAP-A assessments to accurately demonstrate
student knowledge. Panelists rated the assessment materials as providing little inference about student learning on multiple dimensions. Panelists reported that a student’s score may be inflated and not truly demonstrative of the student’s knowledge. Additionally, a

40 Chapter 5: Summary and Recommendations
student’s score is dependent on how well the teacher is able to write a task to assess an API and not completely on the student’s ability.
The issue of support is one that many states struggle with in trying to balance the use of a standardized assessment against allowing considerable flexibility for individual students with a broad range of disabilities. One option used in some states (e.g., Kentucky) is to include a checklist of common and appropriate accommodations and supports along with the conditions under which each accommodation can be provided. The Accommodations Manual, developed by the Assessment of Special Education Students State Collaborative on Assessment and Student Standards (ASES SCASS), is a good resource that includes condition charts that can be adapted by each state (Thompson, Morse et al. 2005). Although most test administrators are familiar with appropriate accommodations, research by the National Assessment and Accreditation Council (NAAC) suggests that competencies required to administer alternate assessments can vary widely, even within a state. With the MAP-A, portfolio tasks are designed specifically for a student which should take into account the student’s abilities and need for accommodations or support. The difficulty lies in making sure that a student is not unfairly advantaged or disadvantaged.
Review the link between portfolio tasks and the APIs. Panelists determined that the majority of portfolio tasks assessed the content of the identified API. However, panelists rated between 14% and 32% of portfolio tasks as not matching the API. Additionally, panelists provided an AGLE match to each portfolio task but the identified AGLE was not necessarily the corresponding API. This means that for some of the portfolio tasks the content that was supposed to be assessed, in fact, was not. This in turn connects back to whether a student’s score really does provide information on the student’s knowledge of the content. We suggest that DESE review the training and training materials provided to teachers on how to write a portfolio task to assess an API.
Consider implementing an “improvement” requirement for portfolio tasks. Portfolios include multiple opportunities for students to complete tasks. In most cases, the reviewed portfolios contained two or more instances where a student completed the same task. In most cases, students received 100% credit for all repeated tasks. If the tasks are to be repeated, it would be more appropriate for students to repeat tasks with which they initially struggled. Educational value is minimal for re-demonstrating content one has already mastered. Panelists were concerned about the lack of any indicator of new learning. By requiring that the initial attempt at a portfolio task result in a lower than 100% score, Missouri could generate a type of pre-test/post-test indicator of new learning. Adopting this kind of system would also help allay concerns that the portfolio tasks, which are designed by teachers, may not always be at the appropriate level for a given student. Requiring that the tasks represent challenging material, as demonstrated by an initially lower score, may force educators to create tasks that better match the ability of their students.
Consider reducing the number of AGLEs eligible to be assessed on the MAP-A. Currently, teachers can assess students from the following: 125 AGLEs in grade 5, 216 AGLEs in grade 8, and 271 AGLEs in grade 11. Across the sample of portfolios reviewed, a very small number of AGLEs were actually assessed: 32 in grade 5, 48 in grade 8, and 41 in grade 11. According to Webb’s criteria for range of knowledge, an

Chapter 5: Summary and Recommendations 41
assessment should include at least one task per AGLE. With so many AGLEs at each grade level, a one to one correspondence will not occur. DESE may want to consider allowing teachers to choose from a subset of the testable AGLEs at each grade level, reduce the number of AGLEs overall, or alter the format of the assessment to include more items/tasks.

References 43
References
Flowers, C., Wakeman, S., Browder, D., & Karvonen, M. (2007). Links for academic learning: An alignment protocol for alternate assessments based on alternate achievement standards. Charlotte, NC: University of North Carolina at Charlotte. Retrieved from: http://www.naacpartners.org/LAL/documents/NAAC_AlignmentManualVer8_3.pdf
No Child Left Behind Act of 2001. Public Law 107-110.
North Carolina Department of Public Instruction. (unknown). Extended content standards: Three levels of access so that all children can participate in the general education curriculum. Charlotte, NC: North Carolina Department of Public Instruction. Retrieved from: http:// www.ncpublicschools.org/docs/ec/instructional/extended/extendedcontentstandards.ppt
Thompson, S.J., Johnstone, C.J., Anderson, M. E., & Miller, N. A. (2005). Considerations for the development and review of universally designed assessments (Technical Report 42). Minneapolis, MN: University of Missouri, National Center on Educational Outcomes.
Thompson, S. J., Morse, A. B., Sharpe, M., & Hall, S. (2005). Accommodations manual: How to select, administer, and evaluate use of accommodations for instruction and assessment of students with disabilities. CCSSO State Collaborative on Assessment and Student Standards Assessing Special Education Students. Washington, DC. Retrieved from http://www.osepideasthatwork.org/toolkit/accommodations_manual.asp
U.S. Department of Education. (August, 2005). Alternate achievement standards for students with the most significant cognitive disabilities. Washington, DC: U.S. Department of Education, Office of Elementary and Secondary Education. Retrieved from http://www.ed.gov/admins/lead/account/saa.html#guidance.
Webb, N. L. (1999). Alignment of math and science standards and assessments in four states. (Research Monograph 18). Madison, WI: National Institute for Math Education and Council of Chief State School Officers. (ERIC Document Reproduction Service No. ED440852)
Webb, N. L. (1997). Research Monograph No. 6: Criteria for alignment of expectations and assessments in Science and Math education. Washington, D.C.: Council of Chief State Schools Officers.
Webb, N. L. (2005). Webb alignment tool: Training manual. Madison, WI: Wisconsin Center for Education Research. Available: http://www.wcer.wisc.edu/WAT/index.aspx.
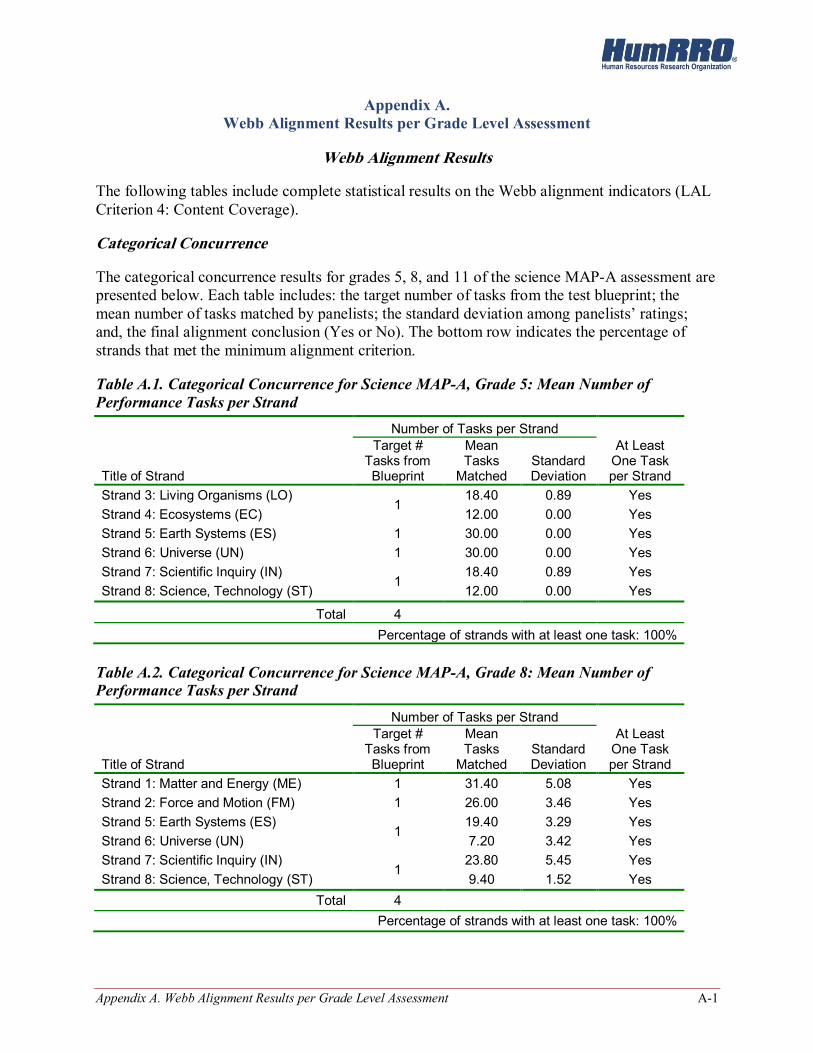
Appendix A. Webb Alignment Results per Grade Level Assessment A-1
Appendix A. Webb Alignment Results per Grade Level Assessment
Webb Alignment Results The following tables include complete statistical results on the Webb alignment indicators (LAL Criterion 4: Content Coverage). Categorical Concurrence The categorical concurrence results for grades 5, 8, and 11 of the science MAP-A assessment are presented below. Each table includes: the target number of tasks from the test blueprint; the mean number of tasks matched by panelists; the standard deviation among panelists’ ratings; and, the final alignment conclusion (Yes or No). The bottom row indicates the percentage of strands that met the minimum alignment criterion. Table A.1. Categorical Concurrence for Science MAP-A, Grade 5: Mean Number of Performance Tasks per Strand Number of Tasks per Strand
Title of Strand
Target # Tasks from Blueprint
Mean Tasks
Matched Standard Deviation
At Least One Task per Strand
Strand 3: Living Organisms (LO) 1
18.40 0.89 Yes Strand 4: Ecosystems (EC) 12.00 0.00 Yes Strand 5: Earth Systems (ES) 1 30.00 0.00 Yes Strand 6: Universe (UN) 1 30.00 0.00 Yes Strand 7: Scientific Inquiry (IN)
1 18.40 0.89 Yes
Strand 8: Science, Technology (ST) 12.00 0.00 Yes
Total 4 Percentage of strands with at least one task: 100%
Table A.2. Categorical Concurrence for Science MAP-A, Grade 8: Mean Number of Performance Tasks per Strand Number of Tasks per Strand
Title of Strand
Target # Tasks from Blueprint
Mean Tasks
Matched Standard Deviation
At Least One Task per Strand
Strand 1: Matter and Energy (ME) 1 31.40 5.08 Yes Strand 2: Force and Motion (FM) 1 26.00 3.46 Yes Strand 5: Earth Systems (ES)
1 19.40 3.29 Yes
Strand 6: Universe (UN) 7.20 3.42 Yes Strand 7: Scientific Inquiry (IN)
1 23.80 5.45 Yes
Strand 8: Science, Technology (ST) 9.40 1.52 Yes Total 4
Percentage of strands with at least one task: 100%

A-2 Appendix A. Webb Alignment Results per Grade Level Assessment
Table A.3. Categorical Concurrence for Science MAP-A, Grade 11: Mean Number of Performance Tasks per Strand Number of Tasks per Strand
Title of Strand
Target # Tasks from Blueprint
Mean Tasks
Matched Standard Deviation
At Least One Task per Strand
Strand 1: Matter and Energy (ME) 1
19.00 2.00 Yes Strand 2: Force and Motion (FM) 11.50 4.43 Yes Strand 3: Living Organisms (LO) 1 29.50 3.32 Yes Strand 4: Ecosystems (EC) 1 26.00 4.24 Yes Strand 7: Scientific Inquiry (IN)
1 20.00 4.00 Yes
Strand 8: Science, Technology (ST) 1000 2.31 Yes
Total 4
Percentage of strands with at least one task: 100%
Depth-of-Knowledge Consistency The Depth-of-Knowledge (DOK) consistency results for grades 5, 8, and 11 of the science MAP-A assessment are presented below. The tables present the results from the comparison between the depth-of-knowledge expected in the standards and the depth-of-knowledge assessed by tasks. The tables include the mean percentage of tasks rated as below, at the same level, or above the DOK level of the content standards along with the corresponding standard deviations. Results are separated by grade level. Standards with at least 50% of tasks at the same (or above) DOK level met the minimum criterion. Table A.4. Depth-of-Knowledge Consistency for Science MAP-A, Grade 5: Mean Percent of Performance Tasks with DOK Below, At, and Above DOK Level of Objectives
Title of Strand
Depth-of-Knowledge Consistency
DOK Consistency Target Met
Mean Tasks
per Strand
% Tasks Below
% Tasks Same Level
% Tasks Above
M SD M SD M SD
Strand 3: Living Organisms (LO) 18.40 28.0 15.9 30.9 18.6 41.1 7.5 Yes Strand 4: Ecosystems (EC) 12.00 0.0 0.0 23.3 9.1 76.7 9.1 Yes Strand 5: Earth Systems (ES) 30.00 12.3 6.1 11.32 8.0 76.4 7.3 Yes Strand 6: Universe (UN) 30.00 20.7 10.1 16.0 10.1 63.3 18.6 Yes Strand 7: Scientific Inquiry (IN) 18.40 52.9 19.8 35.1 13.4 12.0 8.3 No Strand 8: Science, Technology (ST) 12.00 20.0 13.9 21.7 7.5 58.3 14.4 Yes
Percent of strands with 50% of task DOK at or above objective DOK: 83%

Appendix A. Webb Alignment Results per Grade Level Assessment A-3
Table A.5. Depth-of-Knowledge Consistency for Science MAP-A, Grade 8: Mean Percent of Performance Tasks with DOK Below, At, and Above DOK Level of Objectives
Title of Strand
Depth-of-Knowledge Consistency
DOK Consistency Target Met
Mean Tasks
per Strand
% Tasks Below
% Tasks Same Level
% Tasks Above
M SD M SD M SD
Strand 1: Matter and Energy (ME) 31.40 6.1 6.6 41.2 14.9 52.7 15.0 Yes Strand 2: Force and Motion (FM) 26.00 8.4 8.8 38.3 3.1 53.3 6.1 Yes Strand 5: Earth Systems (ES) 19.40 4.7 6.5 27.0 9.5 68.3 9.8 Yes Strand 6: Universe (UN) 7.20 0.0 0.0 4.4 9.9 95.6 9.9 Yes Strand 7: Scientific Inquiry (IN) 23.80 11.0 12.2 43.1 13.2 45.9 13.3 Yes Strand 8: Science, Technology (ST) 9.40 0.0 0.0 37.7 17.7 62.3 17.7 Yes
Percent of strands with 50% of task DOK at or above objective DOK: 100%
Table A.6. Depth-of-Knowledge Consistency for Science MAP-A, Grade 11: Mean Percent of Performance Tasks with DOK Below, At, and Above DOK Level of Objectives
Title of Strand
Depth-of-Knowledge Consistency
DOK Consistency Target Met
Mean Tasks
per Strand
% Tasks Below
% Tasks Same Level
% Tasks Above
M SD M SD M SD
Strand 1: Matter and Energy (ME) 19.00 10.6 8.3 64.4 19.8 25.0 20.8 Yes Strand 2: Force and Motion (FM) 11.50 8.3 9.6 38.2 18.1 53.5 11.3 Yes Strand 3: Living Organisms (LO) 29.50 4.3 5.0 45.6 9.1 50.1 5.0 Yes Strand 4: Ecosystems (EC) 26.00 6.2 7.3 35.6 15.1 58.3 18.5 Yes Strand 7: Scientific Inquiry (IN) 20.00 26.9 12.8 42.0 16.5 31.1 23.7 Yes Strand 8: Science, Technology (ST) 1000 0.0 0.0 35.4 33.6 64.6 33.6 Yes
Percent of strands with 50% of task DOK at or above objective DOK: 100%
Range-of-Knowledge Correspondence The results for Range-of-Knowledge correspondence for grades 5, 8, and 11 of the science MAP-A assessment are presented below. The tables include the mean number, standard deviation, and percentage of AGLEs by strand. For acceptable range-of-knowledge correspondence, a minimum of 50% of content AGLEs within each strand should be matched to at least one portfolio task.

A-4 Appendix A. Webb Alignment Results per Grade Level Assessment
Table A.7. Range-of-Knowledge for Science MAP-A, Grade 5: Mean Percent of AGLEs per Strand Linked with Performance Tasks Range of AGLEs
Range-of-Knowledge Target Met Title of Strand
Number of
AGLEs
Mean Tasks
per Strand
AGLEs with At Least One Task
% of Total AGLEs per
Strand M SD M
Strand 1: Matter and Energy (ME) 19 18.4 4.0 0.0 21.1 No Strand 2: Force and Motion (FM) 14 12.0 3.2 0.4 22.9 No Strand 5: Earth Systems (ES) 18 29.6 8.0 0.7 44.4 No Strand 6: Universe (UN) 13 30.0 8.0 0.0 61.5 Yes Strand 7: Scientific Inquiry (IN) 15 18.4 7.0 0.0 46.7 No Strand 8: Science, Technology (ST) 5 12.0 4.0 0.0 80.0 Yes
Total 84
Percentage of strands with 50% of extended standards linked to at least one task: 33%
Table A.8. Range-of-Knowledge for Science MAP-A, Grade 8: Mean Percent of AGLEs per Strand Linked with Performance Tasks Range of AGLEs
Range-of-Knowledge Target Met Title of Strand
Number of
AGLEs
Mean Tasks
per Strand
AGLEs with At Least One Task
% of Total AGLEs per
Strand M SD M
Strand 3: Living Organisms (LO) 38 31.2 12.0 1.2 31.6 No Strand 4: Ecosystems (EC) 27 26.0 10.2 1.3 37.8 No Strand 5: Earth Systems (ES) 38 19.2 7.6 0.5 20.0 No Strand 6: Universe (UN) 16 7.2 3.6 1.5 22.5 No Strand 7: Scientific Inquiry (IN) 26 23.4 8.6 1.7 33.1 No Strand 8: Science, Technology (ST) 13 9.4 4.0 0.7 30.8 No
Total 158
Percentage of strands with 50% of extended standards linked to at least one task: 0%
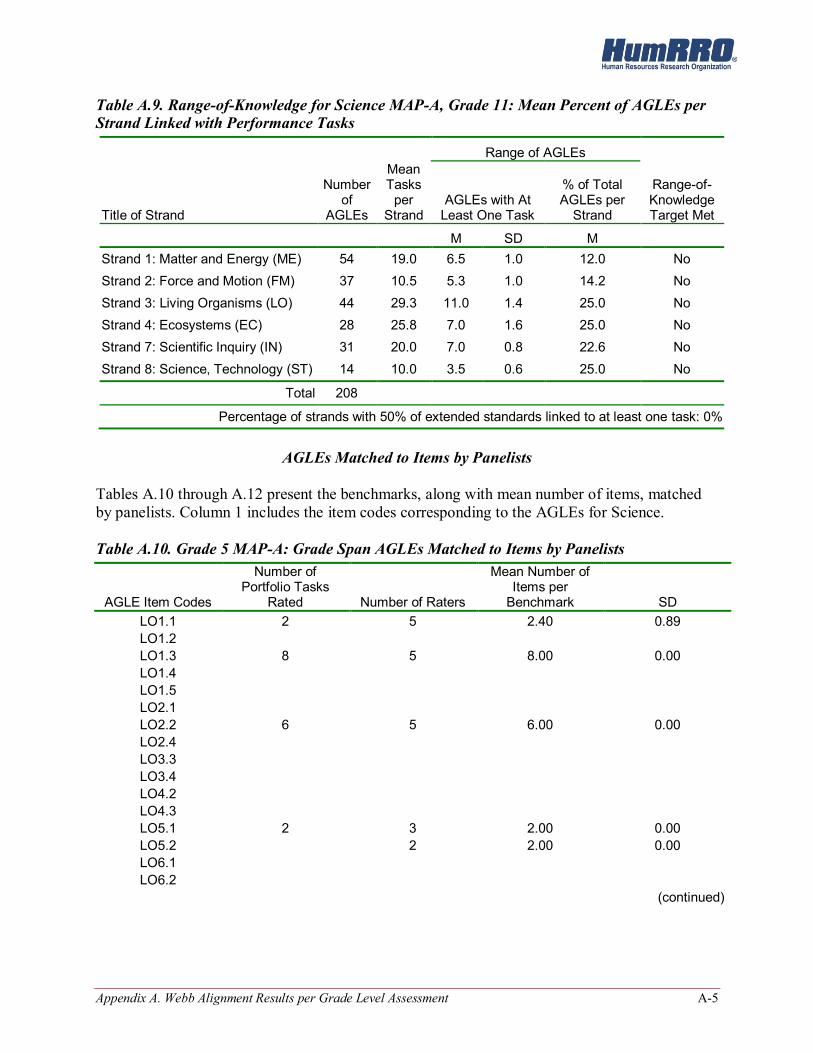
Appendix A. Webb Alignment Results per Grade Level Assessment A-5
Table A.9. Range-of-Knowledge for Science MAP-A, Grade 11: Mean Percent of AGLEs per Strand Linked with Performance Tasks Range of AGLEs
Range-of-Knowledge Target Met Title of Strand
Number of
AGLEs
Mean Tasks
per Strand
AGLEs with At Least One Task
% of Total AGLEs per
Strand M SD M
Strand 1: Matter and Energy (ME) 54 19.0 6.5 1.0 12.0 No Strand 2: Force and Motion (FM) 37 10.5 5.3 1.0 14.2 No Strand 3: Living Organisms (LO) 44 29.3 11.0 1.4 25.0 No Strand 4: Ecosystems (EC) 28 25.8 7.0 1.6 25.0 No Strand 7: Scientific Inquiry (IN) 31 20.0 7.0 0.8 22.6 No Strand 8: Science, Technology (ST) 14 10.0 3.5 0.6 25.0 No
Total 208
Percentage of strands with 50% of extended standards linked to at least one task: 0%
AGLEs Matched to Items by Panelists
Tables A.10 through A.12 present the benchmarks, along with mean number of items, matched by panelists. Column 1 includes the item codes corresponding to the AGLEs for Science. Table A.10. Grade 5 MAP-A: Grade Span AGLEs Matched to Items by Panelists
AGLE Item Codes
Number of Portfolio Tasks
Rated Number of Raters
Mean Number of Items per
Benchmark SD LO1.1 2 5 2.40 0.89 LO1.2 LO1.3 8 5 8.00 0.00 LO1.4 LO1.5 LO2.1 LO2.2 6 5 6.00 0.00 LO2.4 LO3.3 LO3.4 LO4.2 LO4.3 LO5.1 2 3 2.00 0.00 LO5.2 2 2.00 0.00 LO6.1 LO6.2
(continued)

A-6 Appendix A. Webb Alignment Results per Grade Level Assessment
Table A.10. Grade 5 MAP-A: Grade Span AGLEs Matched to Items by Panelists (continued)
AGLE Item Codes
Number of Portfolio Tasks
Rated Number of Raters
Mean Number of Items per
Benchmark SD LO8.1 LO8.2 LO8.4 EC1.1 1 1.00 n/a EC1.2 4 5 4.00 0.00 EC1.4 2 5 2.20 1.10 EC1.5 6 5 5.6 0.89 EC1.7 EC1.8 EC2.3 EC3.1 EC3.2 EC4.1 EC4.2 EC4.6 EC5.1 EC5.3 ES1.1 2 5 2.40 0.89 ES1.2 2 5 2.00 0.00 ES1.4 2 4 2.00 0.00 ES2.1 ES3.1 2 5 1.80 0.45 ES3.2 ES3.4 ES3.9 ES5.1 ES5.2 ES5.4 ES7.1 10 5 9.60 0.89 ES7.3 2 5 2.00 0.00 ES8.1 1 1.00 n/a ES8.2 ES8.3 4 5 4.00 4.00 ES8.4 6 5 6.00 0.00 ES8.6 UN1.1 6 5 6.00 0.00 UN1.2 4 5 4.00 0.00 UN1.3 UN2.1 2 5 2.00 0.00 UN2.2 2 5 2.00 0.00 UN2.4 5 2.00 0.00 UN3.1
(continued)

Appendix A. Webb Alignment Results per Grade Level Assessment A-7
Table A.10. Grade 5 MAP-A: Grade Span AGLEs Matched to Items by Panelists (continued)
AGLE Item Codes
Number of Portfolio Tasks
Rated Number of Raters
Mean Number of Items per
Benchmark SD UN4.1 2 5 3.20 1.10 UN4.2 8 5 6.80 1.10 UN4.3 UN4.4 UN4.5 4 5 4.00 0.00 UN4.6 IN1.1 2 5 2.00 0.00 IN1.2 IN1.3 IN1.7 2 5 2.00 0.00 IN1.8 4 5 4.40 0.89 IN2.1 4 5 4.20 0.45 IN2.2 IN2.3 IN2.6 IN2.7 2 5 1.80 0.45 IN3.1 IN3.2 IN4.1 IN5.1 2 5 2.00 0.00 IN5.2 ST1.1 2 5 2.00 0.00 ST1.2 4 5 3.80 0.45 ST1.3 2 5 2.20 0.45 ST3.1 4 5 4.00 0.00 ST4.1
Table A.11. Grade 8 MAP-A: Grade Span AGLEs Matched to Items by Panelists
AGLE Item Codes
Number of Portfolio Tasks
Developed Number of Raters
Mean Number of Items per
Benchmark SD ME1.1 4 5 3.60 0.55 ME1.2 2 5 2.20 0.45 ME1.3 4 4 4.5 1.00 ME1.4 ME1.5 ME1.6 2 5 2.40 0.89 ME1.7 2 2 4.00 2.83 ME1.8 2 3 2.67 1.15 ME1.9 4 3.00 1.15 ME2.1 ME2.2 4 5 3.40 1.34 ME2.3
(continued)
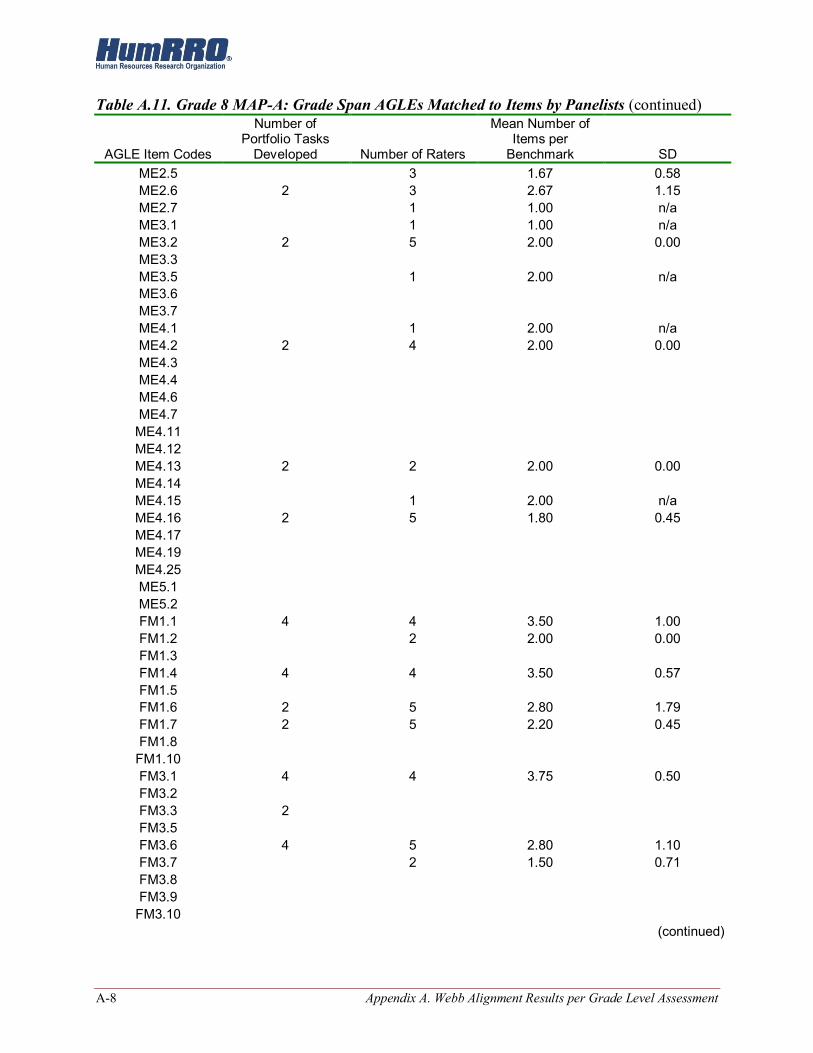
A-8 Appendix A. Webb Alignment Results per Grade Level Assessment
Table A.11. Grade 8 MAP-A: Grade Span AGLEs Matched to Items by Panelists (continued)
AGLE Item Codes
Number of Portfolio Tasks
Developed Number of Raters
Mean Number of Items per
Benchmark SD ME2.5 3 1.67 0.58 ME2.6 2 3 2.67 1.15 ME2.7 1 1.00 n/a ME3.1 1 1.00 n/a ME3.2 2 5 2.00 0.00 ME3.3 ME3.5 1 2.00 n/a ME3.6 ME3.7 ME4.1 1 2.00 n/a ME4.2 2 4 2.00 0.00 ME4.3 ME4.4 ME4.6 ME4.7
ME4.11 ME4.12 ME4.13 2 2 2.00 0.00 ME4.14 ME4.15 1 2.00 n/a ME4.16 2 5 1.80 0.45 ME4.17 ME4.19 ME4.25 ME5.1 ME5.2 FM1.1 4 4 3.50 1.00 FM1.2 2 2.00 0.00 FM1.3 FM1.4 4 4 3.50 0.57 FM1.5 FM1.6 2 5 2.80 1.79 FM1.7 2 5 2.20 0.45 FM1.8
FM1.10 FM3.1 4 4 3.75 0.50 FM3.2 FM3.3 2 FM3.5 FM3.6 4 5 2.80 1.10 FM3.7 2 1.50 0.71 FM3.8 FM3.9
FM3.10 (continued)
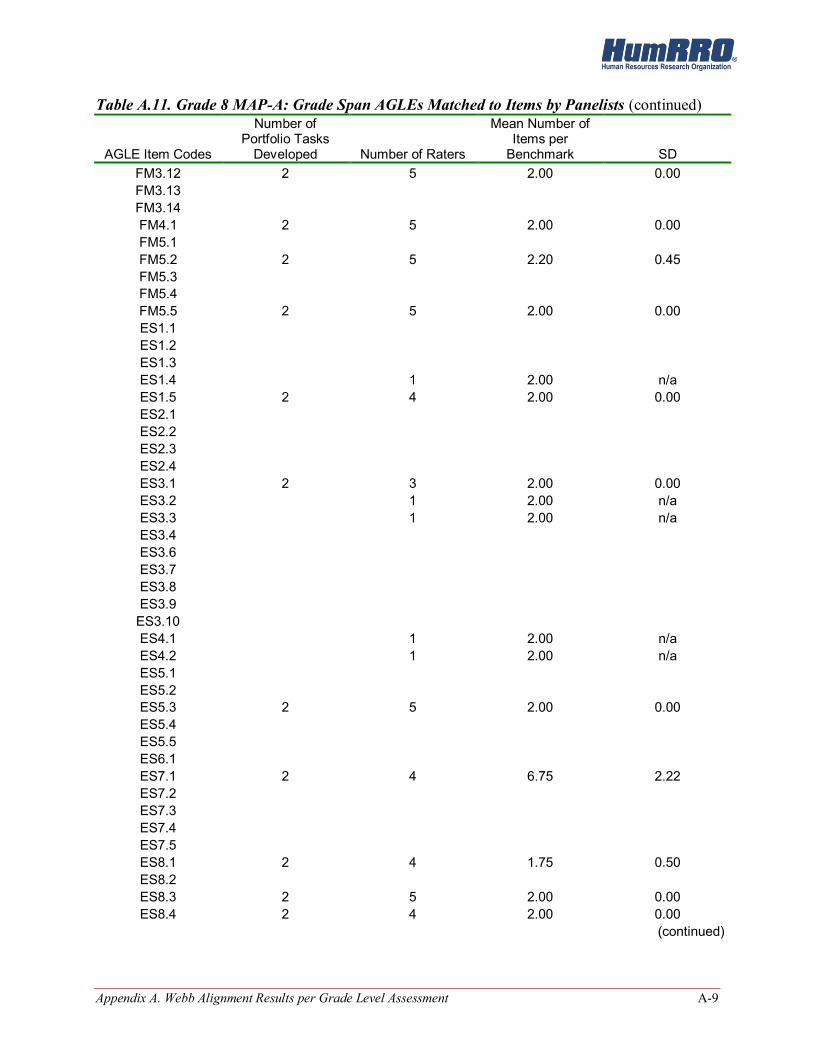
Appendix A. Webb Alignment Results per Grade Level Assessment A-9
Table A.11. Grade 8 MAP-A: Grade Span AGLEs Matched to Items by Panelists (continued)
AGLE Item Codes
Number of Portfolio Tasks
Developed Number of Raters
Mean Number of Items per
Benchmark SD FM3.12 2 5 2.00 0.00 FM3.13 FM3.14 FM4.1 2 5 2.00 0.00 FM5.1 FM5.2 2 5 2.20 0.45 FM5.3 FM5.4 FM5.5 2 5 2.00 0.00 ES1.1 ES1.2 ES1.3 ES1.4 1 2.00 n/a ES1.5 2 4 2.00 0.00 ES2.1 ES2.2 ES2.3 ES2.4 ES3.1 2 3 2.00 0.00 ES3.2 1 2.00 n/a ES3.3 1 2.00 n/a ES3.4 ES3.6 ES3.7 ES3.8 ES3.9
ES3.10 ES4.1 1 2.00 n/a ES4.2 1 2.00 n/a ES5.1 ES5.2 ES5.3 2 5 2.00 0.00 ES5.4 ES5.5 ES6.1 ES7.1 2 4 6.75 2.22 ES7.2 ES7.3 ES7.4 ES7.5 ES8.1 2 4 1.75 0.50 ES8.2 ES8.3 2 5 2.00 0.00 ES8.4 2 4 2.00 0.00
(continued)
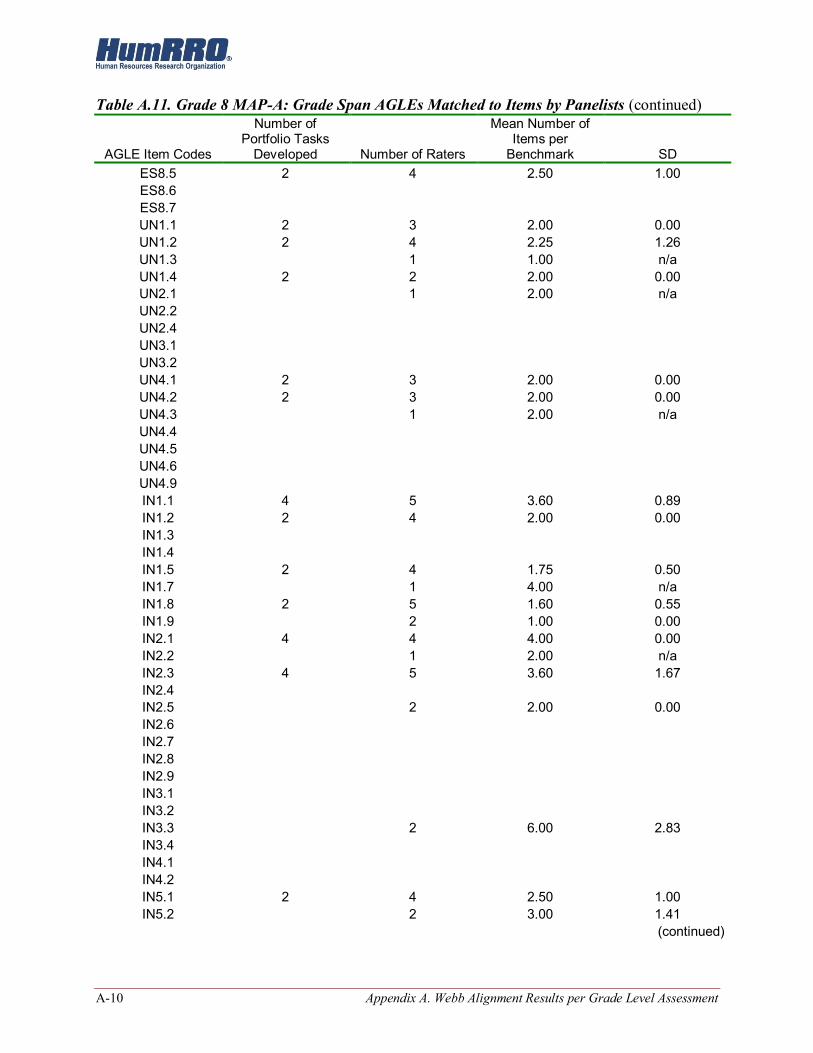
A-10 Appendix A. Webb Alignment Results per Grade Level Assessment
Table A.11. Grade 8 MAP-A: Grade Span AGLEs Matched to Items by Panelists (continued)
AGLE Item Codes
Number of Portfolio Tasks
Developed Number of Raters
Mean Number of Items per
Benchmark SD ES8.5 2 4 2.50 1.00 ES8.6 ES8.7 UN1.1 2 3 2.00 0.00 UN1.2 2 4 2.25 1.26 UN1.3 1 1.00 n/a UN1.4 2 2 2.00 0.00 UN2.1 1 2.00 n/a UN2.2 UN2.4 UN3.1 UN3.2 UN4.1 2 3 2.00 0.00 UN4.2 2 3 2.00 0.00 UN4.3 1 2.00 n/a UN4.4 UN4.5 UN4.6 UN4.9 IN1.1 4 5 3.60 0.89 IN1.2 2 4 2.00 0.00 IN1.3 IN1.4 IN1.5 2 4 1.75 0.50 IN1.7 1 4.00 n/a IN1.8 2 5 1.60 0.55 IN1.9 2 1.00 0.00 IN2.1 4 4 4.00 0.00 IN2.2 1 2.00 n/a IN2.3 4 5 3.60 1.67 IN2.4 IN2.5 2 2.00 0.00 IN2.6 IN2.7 IN2.8 IN2.9 IN3.1 IN3.2 IN3.3 2 6.00 2.83 IN3.4 IN4.1 IN4.2 IN5.1 2 4 2.50 1.00 IN5.2 2 3.00 1.41
(continued)

Appendix A. Webb Alignment Results per Grade Level Assessment A-11
Table A.11. Grade 8 MAP-A: Grade Span AGLEs Matched to Items by Panelists (continued)
AGLE Item Codes
Number of Portfolio Tasks
Developed Number of Raters
Mean Number of Items per
Benchmark SD IN5.3 2 1.00 0.00 ST1.1 2 3 2.67 1.15 ST1.2 ST1.3 ST1.4 2 4 2.00 0.00 ST1.5 2 2 2.00 0.00 ST2.1 2 1.50 0.71 ST2.2 2 4 2.50 1.00 ST2.3 ST3.1 1 5.00 n/a ST3.2 2 4 2.25 0.50 ST4.1 ST4.2 ST4.3
Table A.12. Grade 11 MAP-A: Grade Span AGLEs Matched to Items by Panelists
AGLE Item Codes
Number of Portfolio Tasks
Developed Number of Raters
Mean Number of Items per
Benchmark SD ME1.1 4 4 4.00 0.00 ME1.2 ME1.3 ME1.4 ME1.5 ME1.6 ME1.7 4 4 4.00 0.00 ME1.8 2 3 2.00 0.00 ME1.9 1 2.00 n/a
ME1.10 ME2.1 ME2.2 4 4 4.00 0.00 ME2.3 ME2.4 ME2.5 ME2.6 ME2.7 ME3.1 1 2.00 n/a ME3.2 2 2 2.00 0.00 ME3.3 ME3.4 ME3.5
(continued)
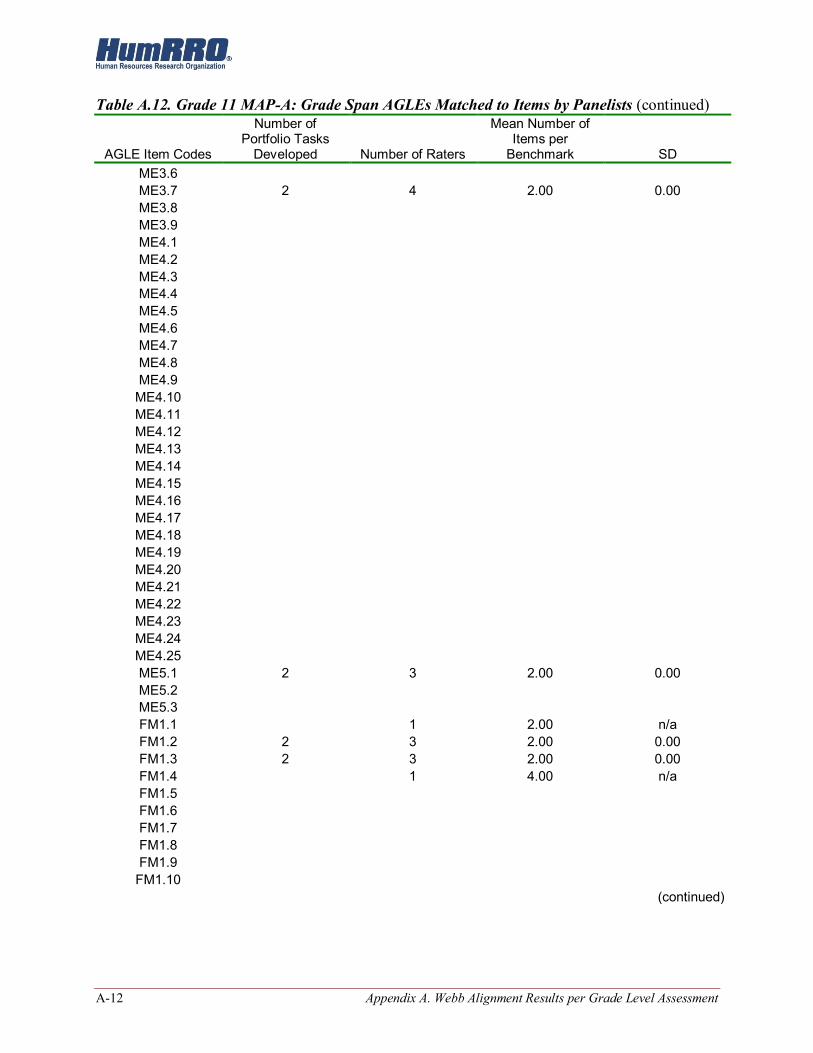
A-12 Appendix A. Webb Alignment Results per Grade Level Assessment
Table A.12. Grade 11 MAP-A: Grade Span AGLEs Matched to Items by Panelists (continued)
AGLE Item Codes
Number of Portfolio Tasks
Developed Number of Raters
Mean Number of Items per
Benchmark SD ME3.6 ME3.7 2 4 2.00 0.00 ME3.8 ME3.9 ME4.1 ME4.2 ME4.3 ME4.4 ME4.5 ME4.6 ME4.7 ME4.8 ME4.9
ME4.10 ME4.11 ME4.12 ME4.13 ME4.14 ME4.15 ME4.16 ME4.17 ME4.18 ME4.19 ME4.20 ME4.21 ME4.22 ME4.23 ME4.24 ME4.25 ME5.1 2 3 2.00 0.00 ME5.2 ME5.3 FM1.1 1 2.00 n/a FM1.2 2 3 2.00 0.00 FM1.3 2 3 2.00 0.00 FM1.4 1 4.00 n/a FM1.5 FM1.6 FM1.7 FM1.8 FM1.9
FM1.10 (continued)

Appendix A. Webb Alignment Results per Grade Level Assessment A-13
Table A.12. Grade 11 MAP-A: Grade Span AGLEs Matched to Items by Panelists (continued)
AGLE Item Codes
Number of Portfolio Tasks
Developed Number of Raters
Mean Number of Items per
Benchmark SD FM1.11 FM1.12 FM2.1 FM3.1 FM3.2 FM3.3 FM3.4 FM3.5 FM3.6 FM3.7 FM3.8 1 2.00 n/a FM3.9 2 3 2.00 0.00
FM3.10 2 3 2.00 0.00 FM3.11 FM3.12 FM3.13 FM3.14 FM3.15 FM4.1 FM4.2 FM4.3 FM5.1 2 3 1.67 0.58 FM5.2 FM5.3 3 1.67 0.58 FM5.4 FM5.5 FM5.6 LO1.1 6 4 5.75 1.26 LO1.2 2 3 1.67 0.58 LO1.3 2 3 2.00 0.00 LO1.4 4 4 5.50 1.91 LO1.5 LO1.6 2 4 2.00 0.00 LO1.7 LO1.8 LO1.9 LO2.1 LO2.2 2 3 2.00 0.00 LO2.3 LO2.4 LO2.5 1 2.00 n/a LO2.6
(continued)

A-14 Appendix A. Webb Alignment Results per Grade Level Assessment
Table A.12. Grade 11 MAP-A: Grade Span AGLEs Matched to Items by Panelists (continued)
AGLE Item Codes
Number of Portfolio Tasks
Developed Number of Raters
Mean Number of Items per
Benchmark SD LO2.7 LO2.8 LO2.9 LO3.1 LO3.2 LO3.3 2 4 2.00 0.00 LO3.4 1 2.00 n/a LO3.5 LO4.1 2 3 2.00 0.00 LO4.2 LO4.3 LO4.4 LO4.5 LO4.6 LO4.7 LO5.1 2 4 2.00 0.00 LO5.2 LO6.1 LO6.2 1 2.00 n/a LO6.3 2 4 2.50 1.00 LO6.4 2 2 2.00 0.00 LO6.5 LO7.1 LO7.2 LO8.1 2 3 1.67 0.58 LO8.2 LO8.3 LO8.4 LO8.5 EC1.1 4 4 2.75 0.96 EC1.2 1 2.00 n/a EC1.3 EC1.4 3 6.67 2.31 EC1.5 16 4 7.00 4.83 EC1.6 2 3.50 3.54 EC1.7 EC1.8 EC1.9
EC1.10 2 3 2.00 0.00 EC1.11 EC2.1 1 2.00 n/a EC2.2 2 3 1.67 0.58 EC2.3 2 4 4.00 0.00
(continued)

Appendix A. Webb Alignment Results per Grade Level Assessment A-15
Table A.12. Grade 11 MAP-A: Grade Span AGLEs Matched to Items by Panelists (continued)
AGLE Item Codes
Number of Portfolio Tasks
Developed Number of Raters
Mean Number of Items per
Benchmark SD EC2.4 EC3.1 EC3.2 EC3.3 EC4.1 EC4.2 EC4.3 EC4.4 EC4.5 EC4.6 2 3 2.00 0.00 EC5.1 EC5.2 EC5.3 EC5.4 IN1.1 IN1.2 IN1.3 IN1.4 IN1.5 IN1.6 IN1.7 IN1.8 1 2.00 n/a IN1.9
IN1.10 IN2.1 1 5.00 n/a IN2.2 IN2.3 1 5.00 n/a IN2.4 6 4 5.50 1.00 IN2.5 1 2.00 n/a IN2.6 2 4 2.50 1.00 IN2.7 2 2 2.00 0.00 IN2.8 IN2.9 IN3.1 IN3.2 IN3.3 IN3.4 IN3.5 2 3 2.00 0.00 IN4.1 IN4.2 IN4.3 IN5.1 2 4 2.50 1.00 IN5.2 2 4 2.00 0.00
(continued)
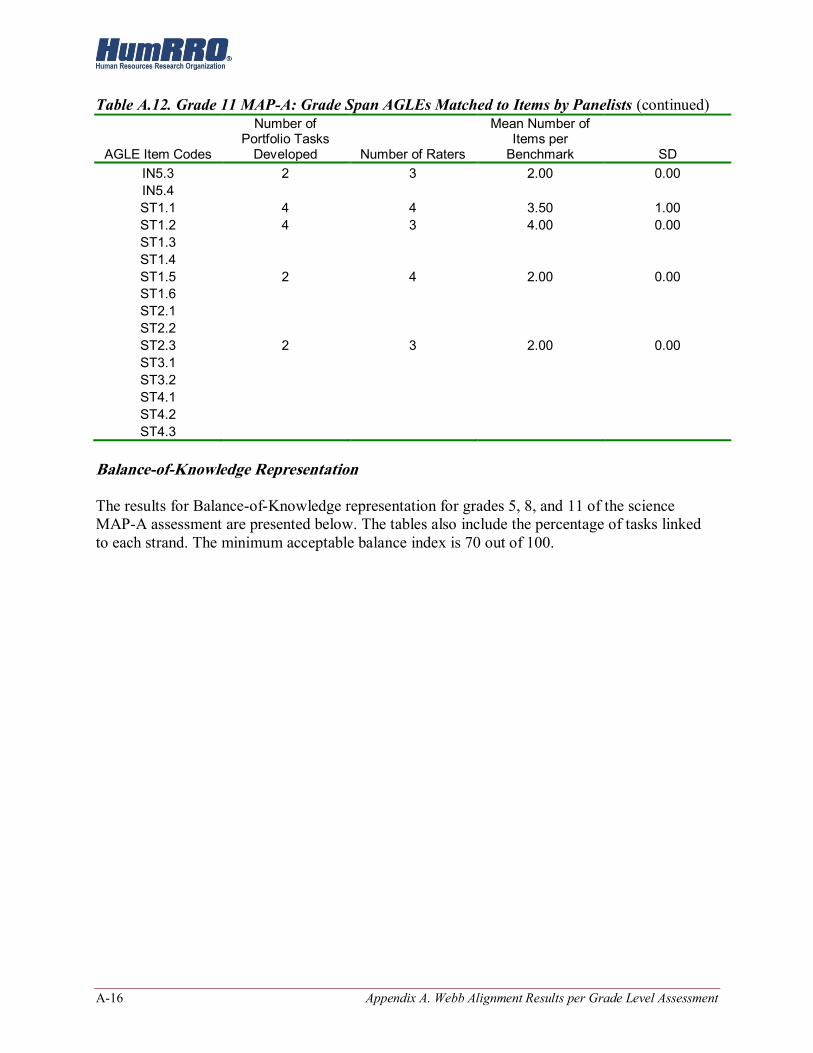
A-16 Appendix A. Webb Alignment Results per Grade Level Assessment
Table A.12. Grade 11 MAP-A: Grade Span AGLEs Matched to Items by Panelists (continued)
AGLE Item Codes
Number of Portfolio Tasks
Developed Number of Raters
Mean Number of Items per
Benchmark SD IN5.3 2 3 2.00 0.00 IN5.4 ST1.1 4 4 3.50 1.00 ST1.2 4 3 4.00 0.00 ST1.3 ST1.4 ST1.5 2 4 2.00 0.00 ST1.6 ST2.1 ST2.2 ST2.3 2 3 2.00 0.00 ST3.1 ST3.2 ST4.1 ST4.2 ST4.3
Balance-of-Knowledge Representation The results for Balance-of-Knowledge representation for grades 5, 8, and 11 of the science MAP-A assessment are presented below. The tables also include the percentage of tasks linked to each strand. The minimum acceptable balance index is 70 out of 100.

Appendix A. Webb Alignment Results per Grade Level Assessment A-17
Table A.13. Balance-of-Knowledge Representation for Science MAP-A, Grade 5: Mean Balance Index per Strand
Balance-of-Knowledge Representation
Title of Strand
AGLEs per
Strand
Mean AGLEs Linked
with Tasks
Mean Tasks
per Strand
Mean % of Tasks
(of total) Linked to Strand
Mean Balance
Index
Balance Index Target
Met
M M M M SD
Strand 1: Matter and Energy (ME) 19 4.0 18.4 15.3 73.8 3.5 Yes
Strand 2: Force and Motion (FM) 14 3.2 12.0 10.0 83.3 11.8 Yes
Strand 5: Earth Systems (ES) 18 8.0 29.6 24.6 71.4 3.2 Yes
Strand 6: Universe (UN) 13 8.0 30.0 24.9 80.2 3.2 Yes
Strand 7: Scientific Inquiry (IN) 15 7.0 18.4 15.3 81.9 3.0 Yes
Strand 8: Science, Technology (ST) 5 4.0 12.0 10.0 85.0 3.7 Yes
Total 84
Percentage of strands with a balance of representation index of 70 or greater: 100%
Table A.14. Balance-of-Knowledge Representation for Science MAP-A, Grade 8: Mean Balance Index per Strand
Balance-of-Knowledge Representation
Title of Strand
AGLEs per
Strand
Mean AGLEs Linked
with Tasks
Mean Tasks
per Strand
Mean % of Tasks
(of total) Linked to Strand
Mean Balance
Index
Balance Index Target
Met
M M M M SD
Strand 3: Living Organisms (LO) 38 12.0 31.2 26.8 83.0 4.1 Yes
Strand 4: Ecosystems (EC) 27 10.2 26.0 22.3 85.9 4.9 Yes
Strand 5: Earth Systems (ES) 38 7.6 19.2 16.5 83..8 11.5 Yes
Strand 6: Universe (UN) 16 3.6 7.2 6.0 91.9 8.0 Yes
Strand 7: Scientific Inquiry (IN) 26 8.6 23.4 20.3 78.8 4.3 Yes
Strand 8: Science, Technology (ST) 13 4.0 9.4 8.1 86.5 9.6 Yes
Total 158
Percentage of strands with a balance of representation index of 70 or greater: 100%

A-18 Appendix A. Webb Alignment Results per Grade Level Assessment
Table A.15. Balance-of-Knowledge Representation for Science MAP-A, Grade 11: Mean Balance Index per Strand
Balance-of-Knowledge Representation
Title of Strand
AGLEs per
Strand
Mean AGLEs Linked
with Tasks
Mean Tasks
per Strand
Mean % of Tasks
(of total) Linked to Strand
Mean Balance
Index
Balance Index Target
Met
M M M M SD
Strand 1: Matter and Energy (ME) 54 6.5 19.0 16.6 83.4 1.1 Yes
Strand 2: Force and Motion (FM) 37 5.3 10.5 9.0 92.9 8.5 Yes
Strand 3: Living Organisms (LO) 44 11.0 29.3 25.5 78.9 4.9 Yes
Strand 4: Ecosystems (EC) 28 7.0 25.8 22.4 74.1 6.0 Yes
Strand 7: Scientific Inquiry (IN) 31 7.0 20.0 17.8 80.1 1.6 Yes
Strand 8: Science, Technology (ST) 14 3.5 10.0 8.7 83.3 0.0 Yes
Total 208
Percentage of strands with a balance of representation index of 70 or greater: 100%

Appendix B. Familiarization Training Slides and Debriefing Questions B-1
Appendix B. Familiarization Training Slides and Debriefing Questions
The following includes the complete MAP-A Science Alignment Study Alignment Familiarization presentation slides and the Debriefing Questions provided after training to the panelists. Presentation Slides

B-2 Appendix B. Familiarization Training Slides and Debriefing Questions

Appendix B. Familiarization Training Slides and Debriefing Questions B-3

B-4 Appendix B. Familiarization Training Slides and Debriefing Questions

Appendix B. Familiarization Training Slides and Debriefing Questions B-5
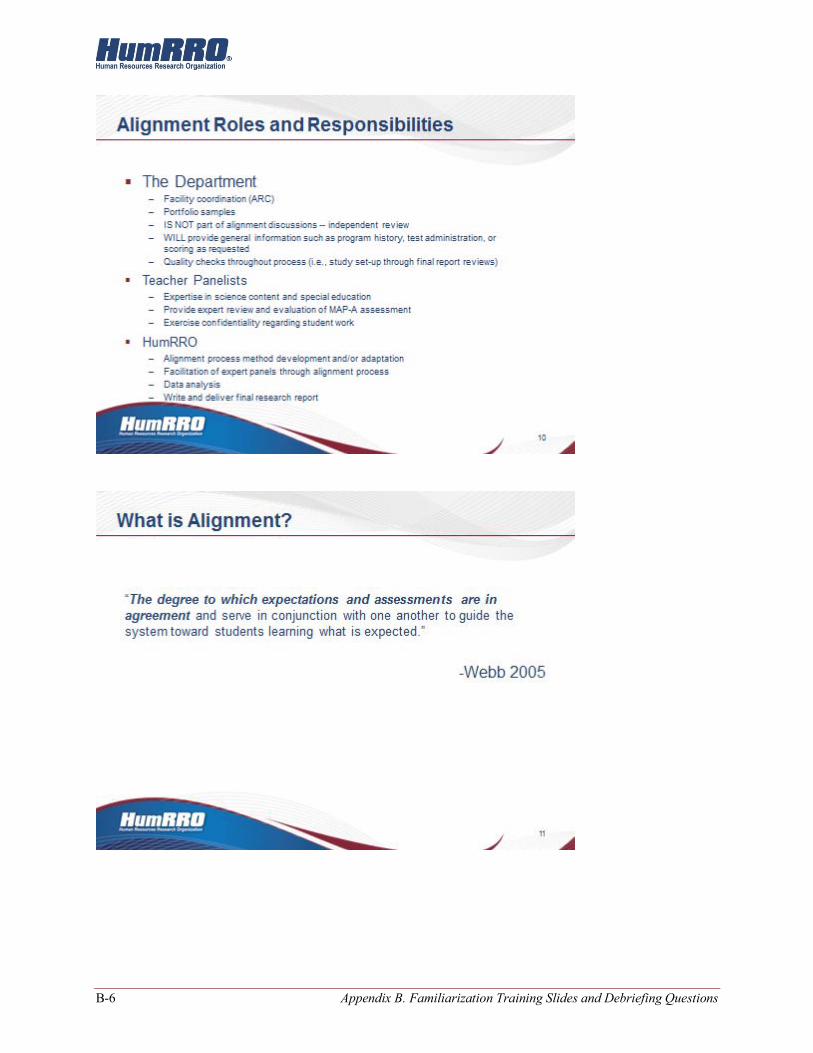
B-6 Appendix B. Familiarization Training Slides and Debriefing Questions

Appendix B. Familiarization Training Slides and Debriefing Questions B-7

B-8 Appendix B. Familiarization Training Slides and Debriefing Questions

Appendix B. Familiarization Training Slides and Debriefing Questions B-9
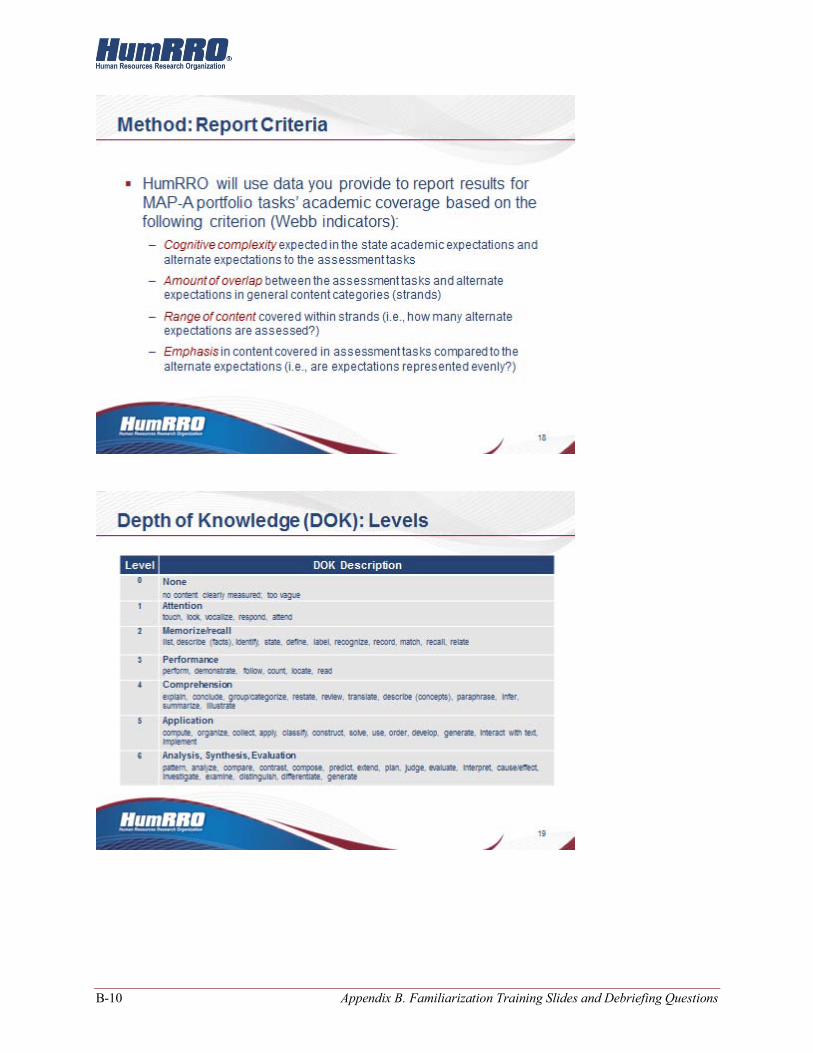
B-10 Appendix B. Familiarization Training Slides and Debriefing Questions
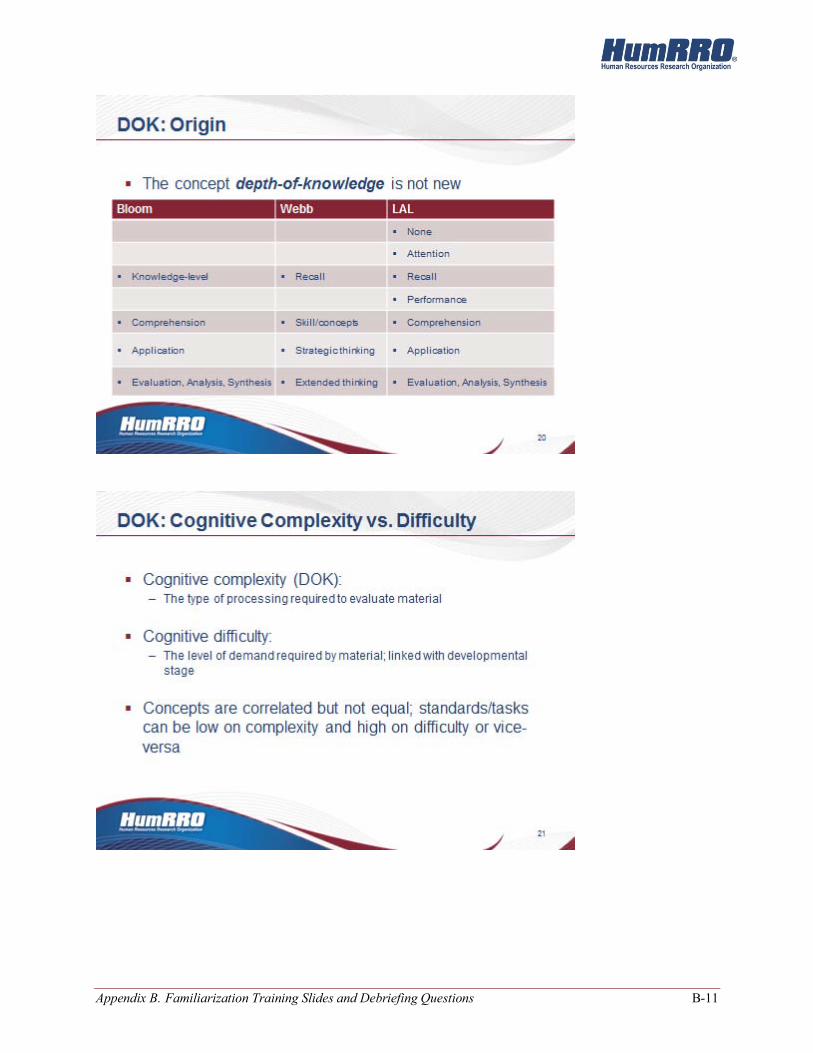
Appendix B. Familiarization Training Slides and Debriefing Questions B-11

B-12 Appendix B. Familiarization Training Slides and Debriefing Questions
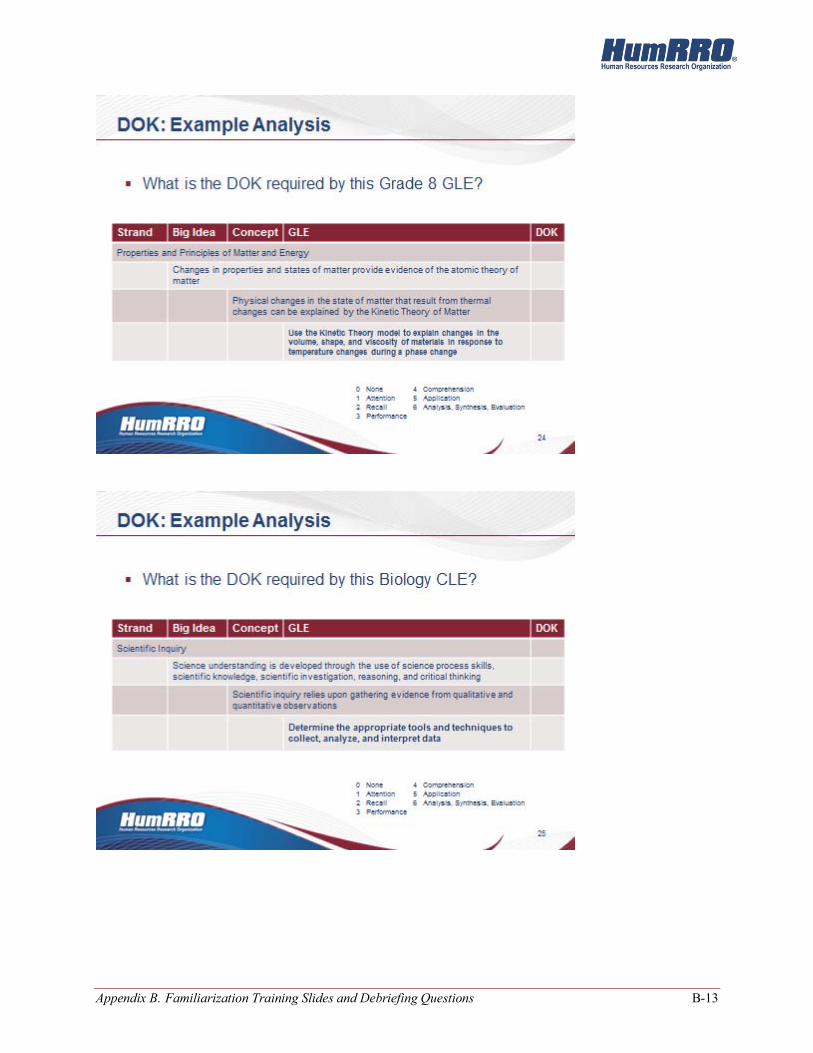
Appendix B. Familiarization Training Slides and Debriefing Questions B-13

B-14 Appendix B. Familiarization Training Slides and Debriefing Questions

Appendix B. Familiarization Training Slides and Debriefing Questions B-15

B-16 Appendix B. Familiarization Training Slides and Debriefing Questions
Familiarization Training Debriefing Questions
MAP-A Science Alignment Study: Web Training Debriefing Form
Place an “x” next to the response you feel best represents your experience.
Question Your Response
Which type of training session did you attend?
Live: Recorded:
Were you able to connect to the training with reasonable effort?
Yes: No:
Were you able to clearly see the text and graphics on the slides?
All the time: Most of time: Some of time: Rarely, if at all:
How was the pace of the training? Too Fast: Just Right: Too Slow:
Does the content covered in the presentation seem useful in preparation for the study?
Useful: Mostly useful: Not useful:
Please type content you felt was not useful or of little benefit.
type here…
Was the content that was covered the right amount?
Right amount: About right: Too much: Too little:
Do you feel you are prepared to participate in the alignment study?
If no, please indicate why.
Yes: Pretty much: No:
type here…
Please provide any comments that would help to improve this type of training.
type here…

Appendix C. Sample Alignment Review Materials C-1
Appendix C. Sample Alignment Review Materials
Panelists received the following instruction sheet as a reference guide corresponding with verbal instructions from HumRRO facilitators.
MAP-A Science Panelist Instructions
Rating Step Documents Needed File Format
1 DOK for GLE/CLE (Consensus)
(1) Grade Level Expectations (HumRRO coded) (2) DOK rating answer sheet
Print Copy Print Copy
2 DOK of AGLE (Consensus)
(1) Alternate Grade Level Expectations (HumRRO coded) (2) DOK rating answer sheet
Print copy Print Copy
3 AGLE evaluation (Individual)
(1) Alternate Grade Level Expectations (HumRRO coded) (2) Grade Level Expectations (HumRRO coded) (3) “AGLE Eval_GradesX”
Print Copy Print Copy Excel file
4
MAP-A tasks (Individual)
(1) Alternate Grade Level Expectations (HumRRO coded)
(2) Sample portfolios (3) “MAP-A Task Rate_GradeX”
Print copy Electronic file Excel file
5
Student learning evaluation across grades (Consensus)
(1) Alternate Grade Level Expectations (HumRRO coded) (2) MAP-A item documents (e.g., checklist, validation
form, entry/data summary sheets) (3) MAP-A task instructor guide & implementation manual (4) “MAP-A Student Learn_GradeX”
Print copy Print copy Print copy Excel file
6
Whole test evaluation across grade span (Consensus)
(1) Alternate Grade Level Expectations (HumRRO Coded) (2) “MAP-A Whole Test_GradeX”
Print copy Excel file
1 Rate DOK for GLE/CLEs (Consensus) Using the “Grade Level Expectations” printout, assign a depth-of-knowledge rating to each
GLE/CLE on the provided DOK rating answer sheet. You will first rate the GLE/CLE independently and then your panel will come to consensus on each rating (3/4 majority, if necessary). The consensus ratings will be retained for analysis and input into the “GLE DOK_GradeX” excel spreadsheet by HumRRO facilitator. See next page for code descriptions 2 Rate DOK for AGLE (Consensus)
Using the “Alternate Grade Level Expectations” printout, assign a depth-of-knowledge (DOK) rating to each AGLE on the provided DOK rating answer sheet. You will first do this independently and then your panel will come to consensus on each rating (3/4 majority, if necessary). The consensus ratings will be retained for analysis and input into the “AGLE DOK_GradesX” excel spreadsheet by the HumRRO facilitator. See next page for code descriptions

C-2 Appendix C. Sample Alignment Review Materials
DOK DOK Description
0 None (no content clearly measured; too vague)
1 Attention
(touch, look, vocalize, respond, attend).
2 Memorize/recall
(list, describe (facts), identify, state, define, label, recognize, record, match, recall, relate).
3 Performance
(perform, demonstrate, follow, count, locate, read).
4
Comprehension
(explain, conclude, group/categorize, restate, review, translate, describe (concepts), paraphrase, infer, summarize, illustrate).
5
Application
(compute, organize, collect, apply, classify, construct, solve, use, order, develop, generate, interact with text, implement).
6
Analysis, Synthesis, Evaluation
(pattern, analyze, compare, contrast, compose, predict, extend, plan, judge, evaluate, interpret, cause/effect, investigate, examine, distinguish, differentiate, generate).
3 AGLE Evaluation (Individual) Open the Excel file “AGLE Eval_GradesX”. Evaluate the AGLEs on all of the dimensions
(columns) in the form. The AGLEs are rated on each dimension independently.
A. Determine if the AGLE’s content is academically based?
Category Code Description
Academic N Neither: Does not directly relate to curriculum or life skills F Foundational: Life skills (e.g., hygiene, social interaction) A Academic: Directly related to education-based curriculum
B. Determine which GLE/CLE best matches with the listed AGLEs. Enter the HumRRO ID
found on the “Grade Level Expectations” printout. If there is absolutely no GLE/CLE you can list, leave the cell blank.
C. Indicate how well you think that the AGLE actually links to the GLE (Content Centrality). Please reserve the use of a code of ‘1’ (No Link) for two circumstances: (1) the AGLE does not link to any GLE/CLE, (2) AGLE only links to the overall category for the GLE/CLE listed.
Category Code Description
Content Centrality
1 No link 2 Weak link 3 Moderate link 4 Close link

Appendix C. Sample Alignment Review Materials C-3
D. Determine to what extent the AGLE measures student performance expected in the GLE/CLE.
Category Code Description
Performance Centrality
N None - performance expectation is different from GLE/CLE
S Some - performance expectation partially matches GLE/CLE (GLE/CLE may include two different performance expectations, such as 'identify and explain').
A All - performance expectation is identical to GLE/CLE
E. Evaluate whether the AGLE is appropriate for the age-level at which the content is
measured. Content may be age-level appropriate, off age-level, or age-level neutral (meaning that the content/topic could be assessed regardless of age).
Category Code Description
Age-Level Appropriate
I Inappropriate; off age-level content N Neutral; content is not age-level bound A Adapted from age-level content
F. Evaluate the level of symbolic communication required to demonstrate content
knowledge. ‘Symbolic communication’ can include use of pictures, symbols, signs, and speech. NOTE: Please consider the lowest functioning student who could access this AGLE.
Category Code Description
Opportunity to Demonstrating Knowledge
Symbolic
Communication
A Awareness/Pre-symbolic (gesture, purposeful moving toward object/sound)
E Early Symbolic S Symbolic (pictures, symbols, signs, speech)
G. Evaluate the accessibility of the AGLE for various disability groups. If the content is
accessible, enter a ‘Y’ (yes). If you think that the content is NOT accessible by some groups, enter ‘N’ (no) and provide an annotation in the Notes/Comments column to indicate those groups negatively affected.
Category Code Description
Opportunity to Demonstrating Knowledge
Accessibility
Y Yes, the AGLE is accessible to all students.
N No, some students cannot access the content of this AGLE or item (PLEASE provide annotation in Notes to explain).
4 Rate MAP-A Tasks Open the Excel file “MAP-A Task Rate_GradeX” and add”_your 3 initials”. You will rate
each Collection Period (CP) Activity independently.

C-4 Appendix C. Sample Alignment Review Materials
A. Determine if the AGLE’s content is academically based? (See rating code on page 2 under A.)
B. Assign a depth-of-knowledge (DOK) rating to each CP Activity. (See rating code on page
2 under Step 2.)
C. Determine which GLE/CLE best matches with the listed AGLEs. Enter the HumRRO ID found on the “Grade Level Expectations” printout. If there is absolutely no GLE/CLE you can list, leave the cell blank. If there is a secondary AGLE match (which is rare), enter the HumRRO ID in the next column and provide a comment of why it is listed.
D. Indicate how well you think that the CP Activity actually links to the AGLE (Content Centrality). Please reserve the use of a code of ‘1’ (No Link) for two circumstances: (1) the CP Activity does not link to any AGLE, (2) CP Activity only links to the overall category for the AGLE listed. (See rating code on page 2 under C.)
E. Determine to what extent the AGLE measures student performance expected in the GLE/CLE. (See rating code on page 2 under D.)
F. Evaluate whether the AGLE is appropriate for the age-level at which the content is measured. Content may be age-level appropriate, off age-level, or age-level neutral (meaning that the content/topic could be assessed regardless of age). (See rating code on page 3 under E.)
G. Evaluate the level of symbolic communication required to demonstrate content knowledge. ‘Symbolic communication’ can include use of pictures, symbols, signs, and speech. NOTE: Please consider the lowest functioning student who could access this CP Activity. (See rating code on page 3 under F.)
H. Evaluate the accessibility of the AGLE for various disability groups. If the content is accessible, enter a ‘Y’ (yes). If you think that the content is NOT accessible by some groups, enter ‘N’ (no) and provide an annotation in the Notes/Comments column to indicate those groups negatively affected. (See rating code on page 3 under G.)
I. Evaluate whether the CP Activity can be modified or supports provided without changing the meaning or difficulty of the CP Activity.
Category Code Description
Opportunity to Demonstrating Knowledge
Modification
Y Yes, the MAP-A CP Activity can be modified without changing difficulty or meaning.
N No, modification will change the difficulty or meaning. (PLEASE provide annotation in Notes to explain).
J. Rate (yes, no) whether the CP Activity adequately measures the API listed on the
portfolio’s student work record. Only if it fully measures the API should a “Yes” rating be used.
Step 5. Rate student learning starts next page.

Appendix C. Sample Alignment Review Materials C-5
5 Rate student learning (Performance Level Descriptors and Task Specifications) (consensus) Open the “MAP-A Student Learn_GradeX”, add “_your 3 initials”. Rate the Task dimensions
after reviewing item documents, scoring guidance, and the task administration manual, with regard to the extent to which they allow for the demonstration of student learning. These documents should provide information about student performance rather than system or teacher performance. The HumRRO facilitator will capture the consensus evaluation.
Degree of Inference about Student Learning
(based on scoring for each Alternate Assessment (AA) item/task or found in AA documents) Criterion High Student Inference
Can clearly infer student showed learning
Low Student Inference
Student performance mixed with educator or program performance
No Student Inference
Can clearly infer student did not have to show any learning, it is educator or program performance rated
Level of accuracy
High level of accuracy (If one response; response is correct. If multiple responses, above 90% correct).
Lower level of accuracy or accuracy intermixed with teacher assistance to extent difficult to determine what student did.
Does not have to get items correct to receive credit.
Level of
independence
Only independent response receives credit (Students may receive a verbal question or direction to respond but not told what response to make).
Credit given for responses in which student performs either without guidance after told or shown the exact response to make (verbal, model, prompts, scaffolding) or are done after shown or told exact response to make and also given some guidance to make the response (partial physical).
Credit given for responses made with hand over hand assistance.
New learning
(important to AA because alternate achievement is not as clear as grade level)
Baseline or pretest provides support that this is new learning OR one time performance but clear differentiation of AA items or tasks by grade level (criteria 5).
One time performance AND grade level differentiation of AA items or tasks was not clear (criteria 5).
No baseline, pretest, and weak differentiation across grade level AA items or tasks suggest student could achieve proficiency by making same response year after year (criteria 5).
Generalizations across people and settings
(Note: less critical than conceptual generalization)
Items or tasks are demonstrated across people or settings for full credit.
At least some items or tasks are demonstrated across more than one person or setting.
Item or task is only demonstrated with one person in one setting.
Generalizations across materials and activities (conceptual generalization)
Items or tasks are demonstrated across materials and activities or all expectations have more than one item or task.
At least some items or tasks are demonstrated across materials or activities; or there is more than one item or task for some expectations.
Item or task is only demonstrated with one specific materials and activity, there is only one item or task per expectation.
Expectation setting
Expectation set for proficiency is based on independent student performance and high level of accuracy.
Expectation set for proficiency will require student show some independent responding and respond correctly above chance level.
Expectation set for proficiency is so low students could meet it with either chance responding or prompting that gives student the answer.
Program quality
indicators
If program quality indicators are used, they are not factored into student score.
If program quality indicators are used, they have minimal impact on student score (e.g., small portion of rubric).
Student score is heavily influenced by program quality indicators in rubric.

C-6 Appendix C. Sample Alignment Review Materials
6 Rate ‘Whole Test’ barriers to demonstrating student knowledge (Consensus) Open the Excel “MAP-A Science Whole Test_GradeX” file and add”_your 3 initials”. Make
an evaluation of the test as a whole on the dimensions listed. Consider each student group who may be taking the assessment. These evaluations only require a Y (yes) or N (no) response in each of the blank cells. If N (no) response is given, provide an explanation for the rating with evidence from the portfolios. The HumRRO facilitator will capture the consensus evaluation.

Appendix C. Sample Alignment Review Materials C-7
Panelists received the Missouri Grade-Level Expectations for Science coded for data entry into rating forms. The content of the standards was extracted exactly from the full Missouri Show-Me Standards document. Only a portion of the coded standards is replicated below for grade 5 as an example.
Grade Strand Big Idea Concept followed by GLE(s) HumRRO
ID
5 1. Properties and Principles of Matter and Energy (ME)
1. Changes in properties and states of matter provide evidence of the atomic theory of matter
C. Properties of matter can be explained in terms of moving particles too small to be seen without tremendous magnification
a. Describe how changes in state (i.e., freezing/melting, condensation/evaporation/boiling) provide evidence that matter is made of particles too small to be seen
1511301
D. Physical changes in the state of matter that result from thermal changes can be explained by the Kinetic Theory of Matter
a. Classify matter as a solid, a liquid, or a gas, as it exists at room temperature, using physical properties (i.e., volume, shape, ability to flow)
1511401
b. Predict the effect of heat (thermal energy) on the physical properties of water as it changes to and from a solid, liquid, or gas (i.e., freezes/melts, evaporates/condenses/boils)
1511402
I. Mass is conserved during any physical or chemical change
a. Observe the mass of water remains constant as it changes state (as evidenced in a closed container)
1511901
2. Energy has a source, can be stored, and can be transferred but is conserved within a system
A. Forms of energy have a source, a means of transfer (work and heat), and a receiver
a. Observe and explain light being transferred from the source to the receiver (eye) through space in straight lines
1512101

C-8 Appendix C. Sample Alignment Review Materials
Panelists reviewed the individual science MAP-A portfolio tasks using the following rating form in electronic format. The format of the rating form was identical for each grade span.

Appendix C. Sample Alignment Review Materials C-9
Panelists reviewed the Science MAP-A assessments for Grades 5, 8, and 11 on Criterion 6: Achievement using the following rating form in electronic format. The format of the rating form was identical for each grade assessment.

C-10 Appendix C. Sample Alignment Review Materials
Panelists reviewed each science MAP-A assessment as a whole for Criterion 7: Performance Accuracy (Potential Barriers) using the following rating form in electronic format. The format of the rating form was identical for each grade span.