independent auditor’s report - sun pharma...s aractica istris iit 129 annual report 201718 cosoiat...
TRANSCRIPT

SUN PHARMACEUTICAL INDUSTRIES LIMITED
129
ANNUAL REPORT 2017-18 CONSOLIDATED FINANCIAL STATEMENTS
Independent Auditor’s ReportTo the Members of Sun Pharmaceutical Industries Limited
Report on the Consolidated Ind AS Financial StatementsWe have audited the accompanying consolidated Ind AS financial statements of Sun Pharmaceutical Industries Limited (hereinafter referred to as “the Holding Company”), its subsidiaries (the Holding Company and its subsidiaries together referred to as “the Group”) its associates and joint ventures, comprising of the consolidated Balance Sheet as at March 31, 2018, the consolidated Statement of Profit and Loss including other comprehensive income, the consolidated Cash Flow Statement, the consolidated Statement of Changes in Equity for the year then ended, and a summary of significant accounting policies and other explanatory information (hereinafter referred to as “the consolidated Ind AS financial statements”).
Management’s Responsibility for the Consolidated Ind AS Financial StatementsThe Holding Company’s Board of Directors is responsible for the preparation of these consolidated Ind AS financial statements in terms of the requirement of the Companies Act, 2013 (“the Act”) that give a true and fair view of the consolidated financial position, consolidated financial performance including other comprehensive income, consolidated cash flows and consolidated statement of changes in equity of the Group including its Associates and Joint Ventures in accordance with accounting principles generally accepted in India, including the Indian Accounting Standards (Ind AS) specified under Section 133 of the Act, read with the Companies (Indian Accounting Standard) Rules, 2015, as amended. The respective Board of Directors of the companies included in the Group and of its associates and joint ventures are responsible for maintenance of adequate accounting records in accordance with the provisions of the Act for safeguarding of the assets of the Group and of its associates and joint ventures and for preventing and detecting frauds and other irregularities; the selection and application of appropriate accounting policies; making judgments and estimates that are reasonable and prudent; and the design, implementation and maintenance of adequate internal financial controls, that were operating effectively for ensuring the accuracy and completeness of the accounting records, relevant to the preparation and presentation of the financial statements that give a true and fair view and are free from material misstatement, whether due to fraud or error, which have been used for the purpose of preparation of the consolidated Ind AS financial statements by the Directors of the Holding Company, as aforesaid.
Auditor’s ResponsibilityOur responsibility is to express an opinion on these consolidated Ind AS financial statements based on our audit. While conducting the audit, we have taken into account the provisions of the Act, the accounting and auditing standards and matters which are required to be included in the audit report under the provisions of the Act and the Rules made thereunder. We conducted our audit in accordance with the Standards on Auditing, issued by the Institute of Chartered Accountants of India, as specified under Section 143(10) of the Act. Those Standards require that we comply with ethical requirements and plan and perform the audit to obtain reasonable assurance about whether the financial statements are free from material misstatement.
An audit involves performing procedures to obtain audit evidence about the amounts and disclosures in the consolidated financial statements. The procedures selected depend on the auditor’s judgment, including the assessment of the risks of material misstatement of the consolidated financial statements, whether due to fraud or error. In making those risk assessments, the auditor considers internal financial control relevant to the Holding Company’s preparation of the consolidated Ind AS financial statements that give a true and fair view in order to design audit procedures that are appropriate in the circumstances. An audit also includes evaluating the appropriateness of accounting policies used and the reasonableness of the accounting estimates made by the Holding Company’s Board of Directors, as well as evaluating the overall presentation of the consolidated financial statements. We believe that the audit evidence obtained by us and the audit evidence obtained by the other auditors in terms of their reports referred to in sub-paragraph (a) of the Other Matters paragraph below, is sufficient and appropriate to provide a basis for our audit opinion on the consolidated Ind AS financial statements.
OpinionIn our opinion and to the best of our information and according to the explanations given to us and based on the consideration of reports of other auditors on separate financial statements and on the other financial information of the subsidiaries, associates and joint ventures, the aforesaid consolidated Ind AS financial statements give the information required by the Act in the manner so required and give a true and fair view in conformity with the accounting principles generally accepted in India of the consolidated state of affairs of the Group, its associates and joint ventures as at March 31, 2018, their consolidated profit including other comprehensive income, their consolidated cash flows and consolidated statement of changes in equity for the year ended on that date.
Other Matter(a) We did not audit the financial statements and other financial information, in respect of 24 subsidiaries, whose Ind AS financial
statements, without giving effect to elimination of intra group transactions, include total assets of ` 566,133.5 Million and net assets of ` 418,322.5 Million as at March 31, 2018, and total revenues of ` 185,173.2 Million and net cash outflows of ` 6,056.8 Million for the year ended on that date. These financial statement and other financial information have been audited by other auditors, which financial

SUN PHARMACEUTICAL INDUSTRIES LIMITED
130
Independent Auditor’s ReportTo the Members of Sun Pharmaceutical Industries Limited
statements, other financial information and auditor’s reports have been furnished to us by the management. The consolidated Ind AS financial statements also include the Group’s share of net loss of ` 254.4 Million for the year ended March 31, 2018, as considered in the consolidated financial statements, in respect of 8 associates and joint ventures, whose financial statements, other financial information have been audited by other auditors and whose reports have been furnished to us by the Management. Our opinion on the consolidated Ind AS financial statements, in so far as it relates to the amounts and disclosures included in respect of these subsidiaries, joint ventures and associates, and our report in terms of sub-sections (3) of Section 143 of the Act, in so far as it relates to the aforesaid subsidiaries, joint ventures and associates, is based solely on the reports of such other auditors.
Certain of these subsidiaries are located outside India whose financial statements and other financial information have been prepared in accordance with accounting principles generally accepted in their respective countries and which have been audited by other auditors under generally accepted auditing standards applicable in their respective countries. The Company’s management has converted the financial statements of such subsidiaries located outside India from accounting principles generally accepted in their respective countries to accounting principles generally accepted in India. We have audited these conversion adjustments made by the Company’s management. Our opinion in so far as it relates to the balances and affairs of such subsidiaries located outside India is based on the report of other auditors and the conversion adjustments prepared by the management of the Company and audited by us.
(b) The accompanying consolidated Ind AS financial statements include unaudited financial statements and other unaudited financial information in respect of 39 subsidiaries, whose financial statements and other financial information, without giving effect to elimination of intra group transactions, reflect total assets of ` 217,210.8 Million and net assets of ` 208,537.0 Million as at March 31, 2018, and total revenues of ` 6,131.0 Million and net cash outflows of ` 496.9 Million for the year ended on that date. These unaudited financial statements and other unaudited financial information have been furnished to us by the management. Our opinion, in so far as it relates amounts and disclosures included in respect of these subsidiaries, joint ventures and associates, and our report in terms of sub-sections (3) of Section 143 of the Act in so far as it relates to the aforesaid subsidiaries, joint ventures and associates, is based solely on such unaudited financial statement and other unaudited financial information. In our opinion and according to the information and explanations given to us by the Management, these financial statements and other financial information are not material to the Group.
(c) The consolidated Ind AS financial statements of the Company for the year ended March 31, 2017, included in these consolidated Ind AS financial statements, have been audited by the predecessor auditor who expressed an unmodified opinion on those statements on May 26, 2017.
Our opinion above on the consolidated Ind AS financial statements, and our report on Other Legal and Regulatory Requirements below, is not modified in respect of the above matters with respect to our reliance on the work done and the reports of the other auditors and the financial statements and other financial information certified by the Management.
Report on Other Legal and Regulatory RequirementsAs required by section 143 (3) of the Act, based on our audit and on the consideration of report of the other auditors on separate financial statements and the other financial information of subsidiaries, associates and joint ventures, as noted in the ‘other matter’ paragraph we report, to the extent applicable, that:
(a) We / the other auditors whose reports we have relied upon have sought and obtained all the information and explanations which to the best of our knowledge and belief were necessary for the purpose of our audit of the aforesaid consolidated Ind AS financial statements;
(b) In our opinion proper books of account as required by law relating to preparation of the aforesaid consolidation of the financial statements have been kept so far as it appears from our examination of those books and reports of the other auditors;
(c) The consolidated Balance Sheet, consolidated Statement of Profit and Loss including the Statement of Other Comprehensive Income, the consolidated Cash Flow Statement and consolidated Statement of Changes in Equity dealt with by this Report are in agreement with the books of account maintained for the purpose of preparation of the consolidated Ind AS financial statements;
(d) In our opinion, the aforesaid consolidated Ind AS financial statements comply with the Indian Accounting Standards specified under section 133 of the Act, read with Companies (Indian Accounting Standard) Rules, 2015, as amended;

SUN PHARMACEUTICAL INDUSTRIES LIMITED
131
ANNUAL REPORT 2017-18 CONSOLIDATED FINANCIAL STATEMENTS
Independent Auditor’s ReportTo the Members of Sun Pharmaceutical Industries Limited
(e) On the basis of the written representations received from the directors of the Holding Company as on March 31, 2018 taken on record by the Board of Directors of the Holding Company and the reports of the statutory auditors who are appointed under Section 139 of the Act, of its subsidiary companies, associate companies and joint ventures incorporated in India, none of the directors of the Group’s companies, its associates and joint ventures incorporated in India is disqualified as on March 31, 2018 from being appointed as a director in terms of Section 164 (2) of the Act.
(f) With respect to the adequacy and the operating effectiveness of the internal financial controls over financial reporting with reference to these consolidated Ind AS financial statements of the Holding Company and its subsidiary companies, refer to our separate report in “Annexure 1” to this report;
(g) With respect to the other matters to be included in the Auditor’s Report in accordance with Rule 11 of the Companies (Audit and Auditors) Rules, 2014, as amended, in our opinion and to the best of our information and according to the explanations given to us and based on the consideration of the report of the other auditors on separate financial statements as also the other financial information of the subsidiaries, associates, joint ventures, as noted in the ‘Other matter’ paragraph:
i. The consolidated Ind AS financial statements disclose the impact of pending litigations on its consolidated financial position of the Group, its associates and joint ventures – Refer Note 40 to the consolidated Ind AS financial statements;
ii. Provision has been made in the consolidated Ind AS financial statements, as required under the applicable law or accounting standards, for material foreseeable losses, if any, on long-term contracts including derivative contracts – Refer (a) Note 23 and Note 29 to the consolidated Ind AS financial statements in respect of such items as it relates to the Group, its associates and joint ventures and (b) the Group’s share of net profit/loss in respect of its associates;
iii. There has been no delay in transferring amounts, required to be transferred, to the Investor Education and Protection Fund by the Holding Company, its subsidiaries, associates and joint ventures incorporated in India, except a sum of ` 16.9 Million, which is held in abeyance due to pending legal cases.
For S R B C & CO LLPChartered AccountantsICAI Firm Registration No.: 324982E/E300003
per PAUL ALVARESPartnerMembership No.: 105754
Place: MumbaiDate: May 25, 2018

SUN PHARMACEUTICAL INDUSTRIES LIMITED
132
ANNEXURE 1 TO THE INDEPENDENT AUDITOR’S REPORT OF EVEN DATE ON THE CONSOLIDATED FINANCIAL STATEMENTS OF SUN PHARMACEUTICAL INDUSTRIES LIMITED
Report on the Internal Financial Controls under Clause (i) of Sub-section 3 of Section 143 of the Companies Act, 2013 (“the Act”)In conjunction with our audit of the consolidated financial statements of Sun Pharmaceutical Industries Limited as of and for the year ended March 31, 2018, we have audited the internal financial controls over financial reporting of Sun Pharmaceutical Industries Limited (hereinafter referred to as the “Holding Company”) and its subsidiary companies, which are companies incorporated in India, as of that date.
Management’s Responsibility for Internal Financial Controls The respective Board of Directors of the Holding Company, its subsidiary companies, which are companies incorporated in India, are responsible for establishing and maintaining internal financial controls based on the internal control over financial reporting criteria established by the Holding Company considering the essential components of internal control stated in the Guidance Note on Audit of Internal Financial Controls Over Financial Reporting issued by the Institute of Chartered Accountants of India. These responsibilities include the design, implementation and maintenance of adequate internal financial controls that were operating effectively for ensuring the orderly and efficient conduct of its business, including adherence to the respective company’s policies, the safeguarding of its assets, the prevention and detection of frauds and errors, the accuracy and completeness of the accounting records, and the timely preparation of reliable financial information, as required under the Act.
Auditor’s ResponsibilityOur responsibility is to express an opinion on the company’s internal financial controls over financial reporting with reference to these consolidated financial statements based on our audit. We conducted our audit in accordance with the Guidance Note on Audit of Internal Financial Controls Over Financial Reporting (the “Guidance Note”) and the Standards on Auditing, both, issued by Institute of Chartered Accountants of India, and deemed to be prescribed under section 143(10) of the Act, to the extent applicable to an audit of internal financial controls. Those Standards and the Guidance Note require that we comply with ethical requirements and plan and perform the audit to obtain reasonable assurance about whether adequate internal financial controls over financial reporting with reference to these consolidated financial statements was established and maintained and if such controls operated effectively in all material respects.
Our audit involves performing procedures to obtain audit evidence about the adequacy of the internal financial controls over financial reporting with reference to these consolidated financial statements and their operating effectiveness. Our audit of internal financial controls over financial reporting included obtaining an understanding of internal financial controls over financial reporting with reference to these consolidated financial statements, assessing the risk that a material weakness exists, and testing and evaluating the design and operating effectiveness of internal control based on the assessed risk. The procedures selected depend on the auditor’s judgement, including the assessment of the risks of material misstatement of the financial statements, whether due to fraud or error.
We believe that the audit evidence we have obtained and the audit evidence obtained by the other auditors in terms of their reports referred to in the Other Matters paragraph below, is sufficient and appropriate to provide a basis for our audit opinion on the internal financial controls over financial reporting with reference to these consolidated financial statements.
Meaning of Internal Financial Controls Over Financial Reporting With Reference to these Consolidated Financial StatementsA company’s internal financial control over financial reporting with reference to these consolidated financial statements is a process designed to provide reasonable assurance regarding the reliability of financial reporting and the preparation of financial statements for external purposes in accordance with generally accepted accounting principles. A company’s internal financial control over financial reporting with reference to these consolidated financial statements includes those policies and procedures that (1) pertain to the maintenance of records that, in reasonable detail, accurately and fairly reflect the transactions and dispositions of the assets of the company; (2) provide reasonable assurance that transactions are recorded as necessary to permit preparation of financial statements in accordance with generally accepted accounting principles, and that receipts and expenditures of the company are being made only in accordance with authorisations of management and directors of the company; and (3) provide reasonable assurance regarding prevention or timely detection of unauthorised acquisition, use, or disposition of the company’s assets that could have a material effect on the financial statements.

SUN PHARMACEUTICAL INDUSTRIES LIMITED
133
ANNUAL REPORT 2017-18 CONSOLIDATED FINANCIAL STATEMENTS
ANNEXURE 1 TO THE INDEPENDENT AUDITOR’S REPORT OF EVEN DATE ON THE CONSOLIDATED FINANCIAL STATEMENTS OF SUN PHARMACEUTICAL INDUSTRIES LIMITED
Inherent Limitations of Internal Financial Controls Over Financial Reporting With Reference to these Consolidated Financial StatementsBecause of the inherent limitations of internal financial controls over financial reporting with reference to these consolidated financial statements, including the possibility of collusion or improper management override of controls, material misstatements due to error or fraud may occur and not be detected. Also, projections of any evaluation of the internal financial controls over financial reporting with reference to these consolidated financial statements to future periods are subject to the risk that the internal financial control over financial reporting with reference to these consolidated financial statements may become inadequate because of changes in conditions, or that the degree of compliance with the policies or procedures may deteriorate.
OpinionIn our opinion, the Holding Company and its subsidiary companies, which are companies incorporated in India, have, maintained in all material respects, adequate internal financial controls over financial reporting with reference to these consolidated financial statements and such internal financial controls over financial reporting with reference to these consolidated financial statements were operating effectively as at March 31, 2018, based on the internal control over financial reporting criteria established by the Holding Company considering the essential components of internal control stated in the Guidance Note on Audit of Internal Financial Controls Over Financial Reporting issued by the Institute of Chartered Accountants of India.
Other MattersOur report under Section 143(3)(i) of the Act on the adequacy and operating effectiveness of the internal financial controls over financial reporting with reference to these consolidated financial statements of the Holding Company, insofar as it relates to these 3 subsidiary companies, which are companies incorporated in India, is based on the corresponding reports of the auditors of such subsidiary, incorporated in India.
For S R B C & CO LLPChartered AccountantsICAI Firm Registration No.: 324982E/E300003
per PAUL ALVARESPartnerMembership No.: 105754
Place: MumbaiDate: May 25, 2018
SUN PHARMACEUTICAL INDUSTRIES LIMITED
134
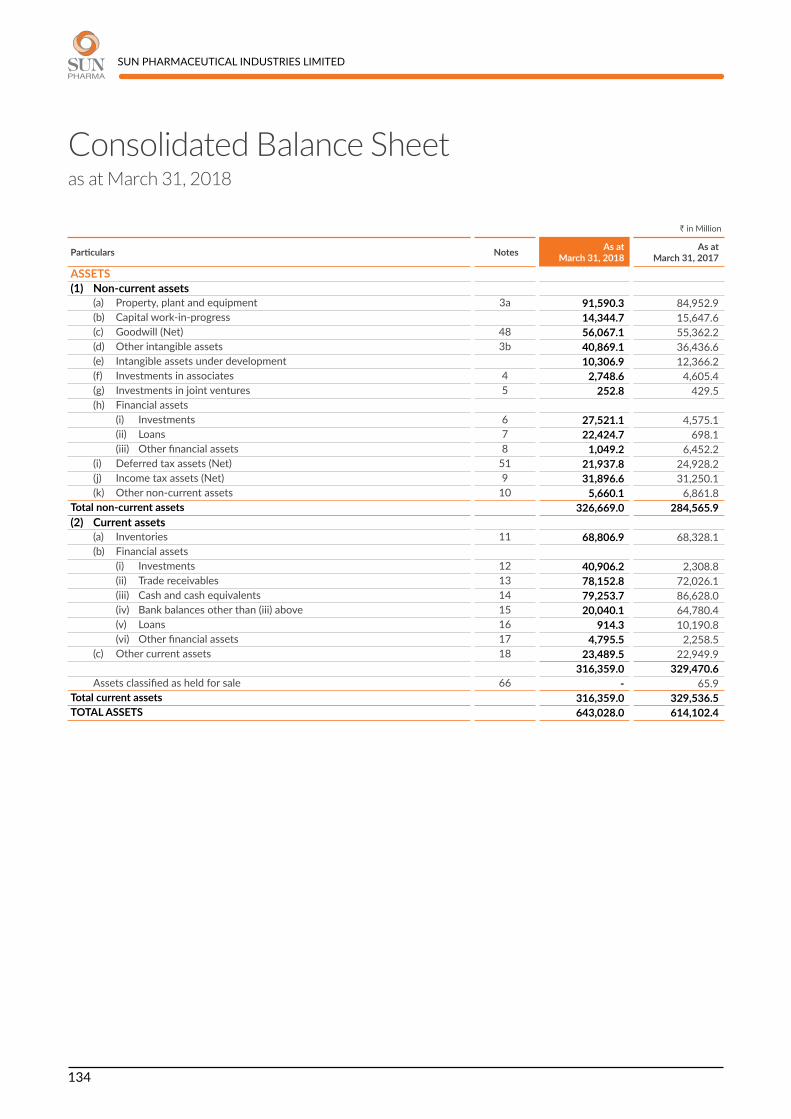
Consolidated Balance Sheet as at March 31, 2018
` in Million
Particulars Notes As at March 31, 2018
As at March 31, 2017
ASSETS(1) Non-current assets (a) Property, plant and equipment 3a 91,590.3 84,952.9 (b) Capital work-in-progress 14,344.7 15,647.6 (c) Goodwill (Net) 48 56,067.1 55,362.2 (d) Other intangible assets 3b 40,869.1 36,436.6 (e) Intangible assets under development 10,306.9 12,366.2 (f) Investments in associates 4 2,748.6 4,605.4 (g) Investments in joint ventures 5 252.8 429.5 (h) Financial assets (i) Investments 6 27,521.1 4,575.1 (ii) Loans 7 22,424.7 698.1 (iii) Other financial assets 8 1,049.2 6,452.2 (i) Deferred tax assets (Net) 51 21,937.8 24,928.2 (j) Income tax assets (Net) 9 31,896.6 31,250.1 (k) Other non-current assets 10 5,660.1 6,861.8 Total non-current assets 326,669.0 284,565.9 (2) Current assets (a) Inventories 11 68,806.9 68,328.1 (b) Financial assets (i) Investments 12 40,906.2 2,308.8 (ii) Trade receivables 13 78,152.8 72,026.1 (iii) Cash and cash equivalents 14 79,253.7 86,628.0 (iv) Bank balances other than (iii) above 15 20,040.1 64,780.4 (v) Loans 16 914.3 10,190.8 (vi) Other financial assets 17 4,795.5 2,258.5 (c) Other current assets 18 23,489.5 22,949.9
316,359.0 329,470.6 Assets classified as held for sale 66 - 65.9 Total current assets 316,359.0 329,536.5 TOTAL ASSETS 643,028.0 614,102.4

SUN PHARMACEUTICAL INDUSTRIES LIMITED
135
ANNUAL REPORT 2017-18 CONSOLIDATED FINANCIAL STATEMENTS
Consolidated Balance Sheet as at March 31, 2018
The accompanying notes are an integral part of the consolidated financial statements
As per our report of even date
For S R B C & CO LLP For and on behalf of the Board of Directors of Chartered Accountants Sun Pharmaceutical Industries LimitedICAI Firm Registration No. : 324982E/E300003
per PAUL ALVARES DILIP S. SHANGHVIPartner Managing DirectorMembership No. : 105754Mumbai, May 25, 2018
C. S. MURALIDHARAN SUDHIR V. VALIA Chief Financial Officer Wholetime Director
SUNIL R. AJMERA SAILESH T. DESAI Company Secretary Wholetime Director
Mumbai, May 25, 2018
` in Million
Particulars Notes As at March 31, 2018
As at March 31, 2017
EQUITY AND LIABILITIESEquity (a) Equity share capital 19 2,399.3 2,399.3 (b) Other equity 20 378,606.3 363,997.4 Equity attributable to the equity shareholders of the Company 381,005.6 366,396.7 Non-controlling interests 38,841.6 37,908.6 Total equity 419,847.2 404,305.3 Liabilities(1) Non-current liabilities (a) Financial liabilities (i) Borrowings 21 17,720.9 14,360.8 (ii) Other financial liabilities 22 316.5 1,048.0 (b) Provisions 23 4,044.6 12,111.1 (c) Deferred tax liabilities (Net) 51 2,189.6 3,147.9 (d) Other non-current liabilities 24 266.0 259.1 Total non-current liabilities 24,537.6 30,926.9 (2) Current liabilities (a) Financial liabilities (i) Borrowings 25 79,797.0 66,549.2 (ii) Trade payables 26 47,662.0 43,953.9 (iii) Other financial liabilities 27 13,377.2 22,116.3 (b) Other current liabilities 28 5,382.1 4,620.5 (c) Provisions 29 51,096.6 40,159.1 (d) Current tax liabilities (Net) 30 1,328.3 1,471.2 Total current liabilities 198,643.2 178,870.2 Total liabilities 223,180.8 209,797.1 TOTAL EQUITY AND LIABILITIES 643,028.0 614,102.4

SUN PHARMACEUTICAL INDUSTRIES LIMITED
136
Consolidated Statement of Profit and Loss for the year ended March 31, 2018
` in Million
Particulars Notes Year ended March 31, 2018
Year ended March 31, 2017
(I) Revenue from operations 31 264,894.6 315,784.4 (II) Other income 32 8,387.6 6,231.5 (III) Total income (I+II) 273,282.2 322,015.9 (IV) Expenses Cost of materials consumed 33 44,626.0 51,246.1 Purchases of stock-in-trade 27,313.8 32,777.6 Changes in inventories of finished goods, stock-in-trade and work-in-progress 34 2,307.0 (2,716.3) Employee benefits expense 35 53,670.5 49,023.0 Finance costs 36 5,175.7 3,998.0 Depreciation and amortisation expense 3 (a & b) 14,998.4 12,647.5 Other expenses 37 80,896.0 84,561.3 Total expenses (IV) 228,987.4 231,537.2 (V) Profit before exceptional items and tax (III-IV) 44,294.8 90,478.7 (VI) Exceptional item 62 (9,505.0) - (VII) Profit before tax (V+VI) 34,789.8 90,478.7 (VIII) Tax expense Current tax 6,628.0 4,046.4 Deferred tax a) Deferred tax charge/(credit) (720.6) 8,069.3 b) Deferred tax charge/(credit) - exceptional 74 2,544.5 - Total tax expense (VIII) 50 8,451.9 12,115.7 (IX) Profit for the year before share of profit/(loss) of associates and joint
ventures (VII-VIII) 26,337.9 78,363.0
(X) Share of profit/(loss) of associates (net of tax) (246.6) 299.6 (XI) Share of profit/(loss) of joint ventures (net of tax) (7.8) (200.3)(XII) Profit for the year before non-controlling interests (IX+X+XI) 26,083.5 78,462.3 (XIII) Non-controlling interests 4,468.0 8,818.6 (XIV) Profit for the year attributable to owners of the Company 21,615.5 69,643.7 (XV) Other comprehensive income (A) Itemsthatwillnotbereclassifiedtoprofitorloss (a) Re-measurements of the defined benefit plans 782.7 (766.9) Income tax on above (274.8) 56.6
507.9 (710.3) (b) Equity instruments through other comprehensive income 1,288.3 (3,741.4) Income tax on above (23.2) -
1,265.1 (3,741.4)Total (A) 1,773.0 (4,451.7)

SUN PHARMACEUTICAL INDUSTRIES LIMITED
137
ANNUAL REPORT 2017-18 CONSOLIDATED FINANCIAL STATEMENTS
Consolidated Statement of Profit and Loss for the year ended March 31, 2018
The accompanying notes are an integral part of the consolidated financial statements
As per our report of even date
For S R B C & CO LLP For and on behalf of the Board of Directors of Chartered Accountants Sun Pharmaceutical Industries LimitedICAI Firm Registration No. : 324982E/E300003
per PAUL ALVARES DILIP S. SHANGHVIPartner Managing DirectorMembership No. : 105754Mumbai, May 25, 2018
C. S. MURALIDHARAN SUDHIR V. VALIA Chief Financial Officer Wholetime Director
SUNIL R. AJMERA SAILESH T. DESAI Company Secretary Wholetime Director
Mumbai, May 25, 2018
` in Million
Particulars Notes Year ended March 31, 2018
Year ended March 31, 2017
(B) Itemsthatmaybereclassifiedtoprofitorloss (a) Debt instruments through other comprehensive income (98.3) (4.7) Income tax on above 8.7 -
(89.6) (4.7) (b) Effective portion of gains and loss on designated portion of hedging
instruments in a cash flow hedge (75.7) 46.2
(c) Exchange differences in translating the financial statements of foreign operations
4,025.7 (10,461.7)
(d) Exchange differences on translation of net investment in a foreign operations
(400.9) -
Total (B) 3,459.5 (10,420.2)(XV) Total other comprehensive income (A + B) 5,232.5 (14,871.9)(XVI) Total comprehensive income for the year (XII+XV) 31,316.0 63,590.4 Other comprehensive income for the year attributable to:- Owners of the Company 4,754.8 (13,337.6)- Non-controlling interests 477.7 (1,534.3)Total comprehensive income for the year attributable to:- Owners of the Company 26,370.3 56,306.1 - Non-controlling interests 4,945.7 7,284.3 Earnings per equity share (face value per equity share - ` 1) 52Basic ( in `) 9.0 29.0 Diluted ( in `) 9.0 29.0

SUN PHARMACEUTICAL INDUSTRIES LIMITED
138
Con
solid
ated
Sta
tem
ent
of C
hang
es in
Equ
ity
for
the
year
end
ed M
arch
31
, 20
18
` in
Mill
ion
Par
ticul
ars
Equ
ity
shar
e ca
pita
l
Res
erve
s and
surp
lus
Oth
er c
ompr
ehen
sive
inco
me
(OCI
) A
ttrib
utab
le
to o
wne
rs
of P
aren
t Co
mpa
ny
Non
-co
ntro
lling
in
tere
sts
TO
TAL
Sha
re
appl
icati
on
mon
ey
pend
ing
allo
tmen
t
Cap
ital
rese
rve
Sec
uriti
es
prem
ium
re
serv
e
Deb
entu
re
rede
mpti
on
rese
rve
Sha
re o
ption
ou
tsta
ndin
g ac
coun
t
Am
alga
mati
on
rese
rve
Cap
ital
rede
mpti
on
rese
rve
Leg
al
rese
rve
Gen
eral
re
serv
e R
etai
ned
earn
ings
D
ebt
inst
rum
ent
thro
ugh
OCI
Equ
ity
inst
rum
ent
thro
ugh
OCI
For
eign
cu
rren
cy
tran
slatio
n re
serv
e
Effe
ctive
po
rtion
of
cash
flow
he
dges
Bala
nce
as a
t M
arch
31,
201
6 2
,406
.6
6.7
4
56.9
1
8,58
5.2
1,0
41.7
4
8.9
43.
8 -
1.1
35
,578
.0
251
,630
.4
1.3
4
,081
.1
15,
943.
1 -
329
,824
.8
40,
852.
5 3
70,6
77.3
Profi
t for
the
year
- -
- -
- -
- -
- -
69,
643.
7 -
- -
- 6
9,64
3.7
8,8
18.6
7
8,46
2.3
Exch
ange
diff
eren
ce
arisi
ng o
n tr
ansla
tion
of
fore
ign
oper
ation
s
- -
- -
- -
- -
- -
- -
- (8
,927
.4)
- (8
,927
.4)
(1,5
34.3
) (1
0,46
1.7)
Oth
er c
ompr
ehen
sive
inco
me
for t
he y
ear,
net
of in
com
e ta
x
- -
- -
- -
- -
- -
* (7
10.3
) (4
.7)
(3,7
41.4
) -
46.
2 (4
,410
.2)
- (4
,410
.2)
Tota
l com
preh
ensi
ve
inco
me
for t
he y
ear
- -
- -
- -
- -
- -
68,
933.
4 (4
.7)
(3,7
41.4
) (8
,927
.4)
46.
2 5
6,30
6.1
7,2
84.3
6
3,59
0.4
Paym
ent o
f div
iden
d -
- -
- -
- -
- -
- (2
,406
.8)
- -
- -
(2,4
06.8
) (3
0.4)
(2,4
37.2
)D
ivid
end
dist
ributi
on
tax
- -
- -
- -
- -
- -
(490
.0)
- -
- -
(490
.0)
- (4
90.0
)
Reco
gniti
on o
f sha
re-
base
d pa
ymen
ts to
em
ploy
ees
- -
- -
- 3
2.3
- -
- -
- -
- -
- 3
2.3
- 3
2.3
Issu
e of
equ
ity s
hare
s 0
.2
(6.7
) -
31.
3 -
- -
- -
- -
- -
- -
24.
8 -
24.
8 Bu
y-ba
ck o
f equ
ity
shar
es (R
efer
not
e 65
) (7
.5)
- -
(6,7
42.5
) -
- -
- -
- -
- -
- -
(6,7
50.0
) -
(6,7
50.0
)
Expe
nditu
re o
n bu
y-ba
ck o
f equ
ity s
hare
s -
- -
(34.
2) -
- -
- -
- -
- -
- -
(34.
2) -
(34.
2)
Buy-
back
of e
quity
sh
ares
by
over
seas
su
bsid
iary
Com
pany
- -
- -
- -
- -
- -
(10,
110.
3) -
- -
- (1
0,11
0.3)
(10,
447.
5) (2
0,55
7.8)
Tran
sfer
to c
apita
l re
dem
ption
rese
rve
on b
uy-b
ack
of e
quity
sh
ares
- -
- -
- -
- 7
.5
- -
(7.5
) -
- -
- -
- -
Tran
sfer
from
sur
plus
in
cons
olid
ated
sta
tem
ent
of p
rofit
and
loss
- -
- -
1,0
41.7
-
- -
- -
(1,0
41.7
) -
- -
- -
- -
Addi
tiona
l non
-co
ntro
lling
inte
rest
s ar
ising
on
the
acqu
isitio
n of
JSC
Bios
inte
z
- -
- -
- -
- -
- -
- -
- -
- -
249
.7
249
.7
Tran
sfer
from
sur
plus
in
cons
olid
ated
sta
tem
ent
of p
rofit
and
loss
as
per t
he lo
cal l
aw o
f an
over
seas
sub
sidia
ry
- -
50.
6 -
- -
- -
- -
(50.
6) -
- -
- -
- -
Tran
sfer
on
exer
cise
of
shar
e op
tions
- -
- 5
4.8
- (5
4.8)
- -
- -
- -
- -
- -
- -
Bala
nce
as a
t M
arch
31,
201
7 2
,399
.3
# 0.
0 5
07.5
1
1,89
4.6
2,0
83.4
2
6.4
43.
8 7
.5
1.1
35
,578
.0
306
,456
.9
(3.4
) 3
39.7
7
,015
.7
46.
2 3
66,3
96.7
3
7,90
8.6
404
,305
.3

SUN PHARMACEUTICAL INDUSTRIES LIMITED
139
ANNUAL REPORT 2017-18 CONSOLIDATED FINANCIAL STATEMENTS
Con
solid
ated
Sta
tem
ent
of C
hang
es in
Equ
ity
for
the
year
end
ed M
arch
31
, 20
18
The
acco
mpa
nyin
g no
tes
are
an in
tegr
al p
art o
f the
con
solid
ated
fina
ncia
l sta
tem
ents
As
per o
ur re
port
of e
ven
date
For S
R B
C &
CO
LLP
For a
nd o
n be
half
of th
e Bo
ard
of D
irect
ors
of
Char
tere
d Ac
coun
tant
sSu
n Ph
arm
aceu
tical
Indu
strie
s Lim
ited
ICA
I Firm
Reg
istra
tion
No.
: 32
4982
E/E3
0000
3
per P
AUL
ALV
ARE
SD
ILIP
S. S
HA
NG
HV
IPa
rtne
rM
anag
ing
Dire
ctor
Mem
bers
hip
No.
: 10
5754
Mum
bai,
May
25,
201
8C.
S. M
URA
LID
HA
RAN
SUD
HIR
V. V
ALI
A
Chie
f Fin
anci
al O
ffice
r W
hole
time
Dire
ctor
SUN
IL R
. AJM
ERA
SAIL
ESH
T. D
ESA
I Co
mpa
ny S
ecre
tary
Who
letim
e D
irect
or
Mum
bai,
May
25,
201
8
` in
Mill
ion
Par
ticul
ars
Equ
ity
shar
e ca
pita
l
Res
erve
s and
surp
lus
Oth
er c
ompr
ehen
sive
inco
me
(OCI
) A
ttrib
utab
le
to o
wne
rs
of P
aren
t Co
mpa
ny
Non
-co
ntro
lling
in
tere
sts
TO
TAL
Sha
re
appl
icati
on
mon
ey
pend
ing
allo
tmen
t
Cap
ital
rese
rve
Sec
uriti
es
prem
ium
re
serv
e
Deb
entu
re
rede
mpti
on
rese
rve
Sha
re o
ption
ou
tsta
ndin
g ac
coun
t
Am
alga
mati
on
rese
rve
Cap
ital
rede
mpti
on
rese
rve
Leg
al
rese
rve
Gen
eral
re
serv
e R
etai
ned
earn
ings
D
ebt
inst
rum
ent
thro
ugh
OCI
Equ
ity
inst
rum
ent
thro
ugh
OCI
For
eign
cu
rren
cy
tran
slatio
n re
serv
e
Effe
ctive
po
rtion
of
cash
flow
he
dges
Profi
t for
the
year
- -
- -
- -
- -
- -
21,
615.
5 -
- -
21,
615.
5 4
,468
.0
26,
083.
5 Ex
chan
ge d
iffer
ence
ar
ising
on
tran
slatio
n of
fo
reig
n op
erati
ons
/net
in
vest
men
t in
fore
ign
oper
ation
s
- -
- -
- -
- -
- -
- -
- 3
,104
.4
- 3
,104
.4
520
.4
3,6
24.8
Oth
er c
ompr
ehen
sive
inco
me
for t
he y
ear,
net
of in
com
e ta
x
- -
- -
- -
- -
- -
* 50
7.7
(90.
5) 1
,308
.9
- (7
5.7)
1,6
50.4
(4
2.7)
1,6
07.7
Tota
l com
preh
ensi
ve
inco
me
for t
he y
ear
- -
- -
- -
- -
- -
22,
123.
2 (9
0.5)
1,3
08.9
3
,104
.4
(75.
7) 2
6,37
0.3
4,9
45.7
3
1,31
6.0
Paym
ent o
f div
iden
d -
- -
- -
- -
- -
- (7
,977
.4)
- -
- -
(7,9
77.4
) (1
52.8
) (8
,130
.2)
Div
iden
d di
strib
ution
tax
- -
- -
- -
- -
- -
(1,6
24.0
) -
- -
- (1
,624
.0)
- (1
,624
.0)
Reco
gniti
on o
f sha
re-
base
d pa
ymen
ts to
em
ploy
ees
- -
- -
- (1
.0)
- -
- -
- -
- -
- (1
.0)
- (1
.0)
Issu
e of
equ
ity s
hare
s@ 0
.0
(0.0
) -
9.1
-
- -
- -
- -
- -
- -
9.1
-
9.1
Tr
ansf
er to
deb
entu
re
rede
mpti
on re
serv
e -
- -
- (8
33.4
) -
- -
- -
833
.4
- -
- -
- -
-
Buy-
back
of e
quity
sh
ares
by
over
seas
su
bsid
iarie
s Co
mpa
ny
- -
- -
- -
- -
- -
(2,1
68.1
) -
- -
- (2
,168
.1)
(4,5
86.4
) (6
,754
.5)
Addi
tiona
l non
-co
ntro
lling
inte
rest
ar
ising
on
the
acqu
isitio
n of
Zen
otec
h (R
efer
not
e 76
)
- -
- -
- -
- -
- -
- -
- -
- -
726
.5
726
.5
Tran
sfer
from
sur
plus
in
cons
olid
ated
sta
tem
ent
of p
rofit
and
loss
as
per t
he lo
cal l
aw o
f an
over
seas
sub
sidia
ry
- -
- -
- -
- -
2.5
-
(2.5
) -
- -
- -
- -
Tran
sfer
on
exer
cise
of
shar
e op
tions
- -
- 2
5.4
- (2
5.4)
- -
- -
- -
- -
- -
- -
Bala
nce
as a
t Mar
ch
31, 2
018
2,3
99.3
-
507
.5
11,
929.
1 1
,250
.0
- 4
3.8
7.5
3
.6
35,5
78.0
3
17,6
41.5
(9
3.9)
1,6
48.6
1
0,12
0.1
(29.
5) 3
81,0
05.6
3
8,84
1.6
419
,847
.2
* Re
pres
ents
re-m
easu
rem
ents
of t
he d
efine
d be
nefit
pla
ns
# (M
arch
31,
201
7 : `
7,1
77)
@ (M
arch
31,
201
8 : `
62,
365)

SUN PHARMACEUTICAL INDUSTRIES LIMITED
140
Consolidated Cash Flow Statement for the year ended March 31, 2018
` in Million
Particulars Year ended March 31, 2018
Year ended March 31, 2017
A. CASH FLOW FROM OPERATING ACTIVITIESProfit before tax 34,789.8 90,478.7 Adjustments for: Depreciation and amortisation expense 14,998.4 12,647.5 Impairment of property, plant and equipment, goodwill and other intangible assets 26.7 203.6 Loss on sale / write off of property, plant and equipment and other intangible assets, net 201.6 108.8 Finance costs 5,175.7 3,998.0 Interest income (5,197.6) (3,711.7) Dividend income on investments (371.6) (420.5) Net gain arising on financial assets measured at fair value through profit or loss (1,236.6) (72.2) Net gain on sale of financial assets measured at fair value through profit or loss (234.0) (479.3) Net loss on sale of financial assets measured at fair value through other comprehensive income 7.5 - Gain on disposal of an associate entity - (201.3) Provision / write off for doubtful trade receivables / advances 1,095.9 341.8 Sundry balances written back, net (170.6) (618.5) Expense/ (income) recognised in respect of share based payments to employees (1.0) 32.3 Impairment in value of investments (725.7) 6.8 Effect of exchange rate changes 253.5 (6,828.6)Operating profit before working capital changes 48,612.0 95,485.4 Movements in working capital: Increase in inventories (40.0) (3,449.9) Increase in trade receivables (7,730.1) (2,934.5) Increase in other assets (1,163.3) (6,464.2) Increase in trade payables 3,830.4 7,354.5 Decrease in other liabilities (217.4) (1,530.7) Increase in provisions 3,197.3 2,932.7 Cash generated from operations 46,488.9 91,393.3 Income tax paid (net of refund) (7,417.4) (20,571.2)Net cash generated from operating activities (A) 39,071.5 70,822.1
B. CASH FLOW FROM INVESTING ACTIVITIESPayments for purchase of property, plant and equipment (including capital work-in-progress, other intangible assets and intangible assets under development)
(19,607.8) (36,928.6)
Proceeds from disposal of property, plant and equipment and other intangible assets 664.9 1,024.7 Loans / inter corporate deposits Given / placed (25,847.2) (6,504.6) Received back / matured 13,230.0 6,796.8 Purchase of investments [including associates and joint venture ` 324.7 Million (March 31, 2017: ` 1,543.6 Million)]
(405,866.8) (388,310.4)
Proceeds from sale of investments 349,923.7 391,943.9 Bank balances not considered as cash and cash equivalents Fixed deposits / margin money placed (16,812.3) (67,586.6) Fixed deposits / margin money matured 65,987.1 55,224.3 Net cash outflow on acquisition of subsidiaries / business units (Refer note 76) (855.0) (1,671.8)Interest received 5,103.7 3,365.2 Receipt of rental on assets given under finance lease - 10.6 Dividend received 371.6 420.5 Net cash used in investing activities (B) (33,708.1) (42,216.0)
C. CASH FLOW FROM FINANCING ACTIVITIESProceeds from borrowings 122,061.7 91,975.6 Repayment of borrowings (127,811.2) (80,649.9)Payment for buy-back of equity shares of parent and buy-back of equity shares held by non-controlling interests of subsidiaries
(6,754.5) (27,307.8)
Dividend payment to non-controlling interests (152.8) (30.4)Payment for share buy-back expenses - (34.2)Net increase / (decrease) in working capital demand loans 11,625.7 (604.5)

SUN PHARMACEUTICAL INDUSTRIES LIMITED
141
ANNUAL REPORT 2017-18 CONSOLIDATED FINANCIAL STATEMENTS
Notes: ` In Million
Particulars As at March 31, 2018
As at March 31, 2017
Cash and cash equivalents comprises ofBalances with banks In current accounts 55,137.3 49,192.3 In deposit accounts with original maturity less than 3 months 24,099.3 35,576.1 Cheques, drafts on hand 10.6 1,813.9 Cash on hand 6.5 45.7 Cash and cash equivalents (Refer note 14) 79,253.7 86,628.0 Less:- cash credit facilities included under loans repayable on demand in note 25 189.2 204.4 Cash and cash equivalents in cash flow statement 79,064.5 86,423.6
Change in financial liability/ asset arising from financing activities` In Million
Particulars Year ended March 31, 2018
Borrowings DerivativesBalance as on April 01, 2017 98,317.7 1,210.0 Changes from financing cash flows 5,876.2 (518.0)The effect of changes in foreign exchange rates 180.5 (32.1)Other changes (521.7) - Changes in fair value - 94.2 Balance as on March 31, 2018 103,852.7 754.1
The accompanying notes are an integral part of the consolidated financial statements
As per our report of even date
For S R B C & CO LLP For and on behalf of the Board of Directors of Chartered Accountants Sun Pharmaceutical Industries LimitedICAI Firm Registration No. : 324982E/E300003
per PAUL ALVARES DILIP S. SHANGHVIPartner Managing DirectorMembership No. : 105754Mumbai, May 25, 2018
C. S. MURALIDHARAN SUDHIR V. VALIA Chief Financial Officer Wholetime Director
SUNIL R. AJMERA SAILESH T. DESAI Company Secretary Wholetime Director
Mumbai, May 25, 2018
Consolidated Cash Flow Statement for the year ended March 31, 2018
` in Million
Particulars Year ended March 31, 2018
Year ended March 31, 2017
Proceeds from issue of equity shares on exercise of stock options / share application money received
9.1 24.8
Finance costs (4,765.2) (3,338.3)Dividend paid (7,981.4) (2,399.2)Dividend distribution tax (1,624.0) (490.0)Net cash used in financing activities (C) (15,392.6) (22,853.9)Net (decrease) / increase in cash and cash equivalents (A+B+C) (10,029.2) 5,752.2 Cash and cash equivalents at the beginning of the year 86,423.6 80,316.9 Cash and cash equivalents taken over on acquisition of subsidiaries (Refer note 76) 1,197.3 - Effect of exchange differences on restatement of foreign currency cash and cash
equivalents 1,472.8 354.5
Cash and cash equivalents at the end of the year 79,064.5 86,423.6

SUN PHARMACEUTICAL INDUSTRIES LIMITED
142
Notes to the Consolidated Financial Statementsfor the year ended March 31, 2018
1. GENERAL INFORMATION Sun Pharmaceutical Industries Limited (“the Parent Company”)
is a public limited company incorporated and domiciled in India, having it’s registered office at Vadodara, Gujarat, India and has its listing on the Bombay Stock Exchange Limited and National Stock Exchange of India Limited. The Company is in the business of manufacturing, developing and marketing a wide range of branded and generic formulations and Active Pharmaceutical Ingredients (APIs). The Parent Company and its subsidiaries (hereinafter referred to as “the Company” or “the Group”) have manufacturing locations spread across the world with trading and other incidental and related activities extending to the global markets.
The consolidated financial statement were authorised for issue in accordance with a resolution of the directors on May 25, 2018.
2. SIGNIFICANT ACCOUNTING POLICIES2.1 Statement of compliance The Group has prepared its consolidated financial statements
for the year ended March 31, 2018 in accordance with Indian Accounting Standards (Ind AS) notified under the Companies (Indian Accounting Standards) Rules, 2015 (as amended) together with the comparative period data as at and for the year ended March 31, 2017.
2.2 Basis of preparation and presentation The consolidated financial statements have been prepared on
the historical cost basis, except for: (i) financial instruments that are measured at fair values at the end of each reporting period; (ii) Non-current assets classified as held for sale which are measured at the lower of their carrying amount and fair value less costs to sell; (iii) derivative financial instrument and (iv) defined benefit plans – plan assets that are measured at fair values at the end of each reporting period, as explained in the accounting policies below:
Historical cost is generally based on the fair value of the consideration given in exchange for goods and services.
The consolidated financial statements are presented in ` and all values are rounded to the nearest Million (` 000,000) upto one decimal, except when otherwise indicated.
Fair value is the price that would be received to sell an asset or paid to transfer a liability in an orderly transaction between market participants at the measurement date, regardless of whether that price is directly observable or estimated using another valuation technique. In estimating the fair value of an asset or a liability, the Group takes into account the characteristics of the asset or liability if market participants would take those characteristics into account when pricing the asset or liability at the measurement date. Fair value for
measurement and/or disclosure purposes in these consolidated financial statements is determined on such a basis, except for share-based payment transactions that are within the scope of Ind AS 102, leasing transactions that are within the scope of Ind AS 17, and measurements that have some similarities to fair value but are not fair value, such as net realisable value in Ind AS 2 or value in use in Ind AS 36.
In addition, for financial reporting purposes, fair value measurements are categorised into Level 1, 2, or 3 based on the degree to which the inputs to the fair value measurements are observable and the significance of the inputs to the fair value measurement in its entirety, which are described as follows:
• Level 1 inputs are quoted prices (unadjusted) in active markets for identical assets or liabilities that the entity can access at the measurement date;
• Level 2 inputs are inputs, other than quoted prices included within Level 1, that are observable for the asset or liability, either directly or indirectly; and
• Level 3 inputs are unobservable inputs for the asset or liability.
The Group has consistently applied the following accounting policies to all periods presented in these consolidated financial statements.
a. Basisofconsolidation The consolidated financial statements comprise the
financial statements of the Parent Company, and its subsidiaries as disclosed in Note 39. Control exists when the parent has power over the entity, is exposed, or has rights, to variable returns from its involvement with the entity and has the ability to affect those returns by using its power over the entity. Power is demonstrated through existing rights that give the ability to direct relevant activities, those which significantly affect the entity’s returns. Subsidiaries are consolidated from the date control commences until the date control ceases.
Profit or loss and each component of other comprehensive income are attributed to the owners of the Company and to the non-controlling interests. Total comprehensive income of subsidiaries is attributed to the owners of the Company and to the non-controlling interests even if this results in the non-controlling interests having a deficit balance.
The financial statements of the Group companies are consolidated on a line-by-line basis and intra-group balances, transactions including unrealised gain /

SUN PHARMACEUTICAL INDUSTRIES LIMITED
143
ANNUAL REPORT 2017-18
Notes to the Consolidated Financial Statementsfor the year ended March 31, 2018
CONSOLIDATED FINANCIAL STATEMENTS
loss from such transactions and cash flows relating to transactions between members of the Group are eliminated upon consolidation. These financial statements are prepared by applying uniform accounting policies in use at the Group.
Changes in the Group’s ownership interests in existing subsidiaries
Changes in the Group’s ownership interests in subsidiaries that do not result in the Group losing control over the subsidiaries are accounted for as equity transactions. The carrying amounts of the Group’s interests and the non-controlling interests are adjusted to reflect the changes in their relative interests in the subsidiaries. Any difference between the amount by which the non-controlling interests are adjusted and the fair value of the consideration paid or received is recognised directly in equity and attributed to owners of the Company.
When the Group loses control of a subsidiary, a gain or loss is recognised in profit or loss and is calculated as the difference between (i) the aggregate of the fair value of the consideration received and the fair value of any retained interest and (ii) the previous carrying amount of the assets (including goodwill) and liabilities of the subsidiary and any non-controlling interests. All amounts previously recognised in other comprehensive income in relation to that subsidiary are accounted for as if the Group had directly disposed off the related assets or liabilities of the subsidiary (i.e. reclassified to profit or loss or transferred to another category of equity as specified/ permitted by applicable Ind AS). The fair value of any investment retained in the former subsidiary at the date when control is lost is regarded as the fair value on initial recognition for subsequent accounting under Ind AS 109, or, when applicable, the cost on initial recognition of an investment in an associate or a joint venture.
Investments in Associates and Joint Ventures
Associates are those entities over which the Group has significant influence. Significant influence is the power to participate in the financial and operating policy decisions of the entities but is not control or joint control of those policies.
A joint venture is a joint arrangement whereby the parties that have joint control of the arrangement have rights to the net assets of the joint arrangement. Joint control is the contractually agreed sharing of control of an arrangement, which exists only when decisions about the relevant activities require unanimous consent of the parties sharing control.
The results and assets and liabilities of associates or joint ventures are incorporated in these consolidated financial statements using the equity method of accounting, except when the investment, or a portion thereof, is classified as held for sale, in which case it is accounted for in accordance with Ind AS 105. Under the equity method, an investment in an associate or a joint venture is initially recognised in the consolidated balance sheet at cost and adjusted thereafter to recognise the Group’s share of the profit or loss and other comprehensive income of the associate or joint venture. Distributions received from an associate or a joint venture reduce the carrying amount of the investment. The carrying value of the Group’s investment includes goodwill identified on acquisition, net of any accumulated impairment losses. When the Group’s share of losses of an associate or a joint venture exceeds its interest in that associate or joint venture, the carrying amount of that interest (including any long-term investments) is reduced to zero and the recognition of further losses is discontinued except to the extent that the Group has obligations or has made payments on behalf of the associate or joint venture.
An investment in an associate or a joint venture is accounted for using the equity method from the date on which the investee becomes an associate or a joint venture and discontinues from the date when the investment ceases to be an associate or a joint venture, or when the investment is classified as held for sale.
The difference between the carrying amount of the associate or joint venture at the date the equity method was discontinued, and the fair value of any retained interest and any proceeds from disposing of a part interest in the associate or joint venture is included in the determination of the gain or loss on disposal of the associate or joint venture. In addition, the Group accounts for all amounts previously recognised in other comprehensive income in relation to that associate or joint venture on the same basis as would be required if that associate or joint venture had directly disposed off the related assets or liabilities.
When a Group entity transacts with an associate or a joint venture of the Group, profits and losses resulting from the transactions with the associate or joint venture are recognised in the Group’s consolidated financial statements only to the extent of interests in the associate or joint venture that are not related to the Group.
b. Current vs. Non-current The Group presents assets and liabilities in the balance
sheet based on current / non-current classification. An asset is treated as current when it is:

SUN PHARMACEUTICAL INDUSTRIES LIMITED
144
Notes to the Consolidated Financial Statementsfor the year ended March 31, 2018
• Expected to be realised or intended to be sold or consumed in normal operating cycle
• Held primarily for the purpose of trading
• Expected to be realised within twelve months after the reporting period, or
• Cash or cash equivalent unless restricted from being exchanged or used to settle a liability for at least twelve months after the reporting period
All other assets are classified as non-current.
A liability is current when:
• It is expected to be settled in normal operating cycle
• It is held primarily for the purpose of trading
• It is due to be settled within twelve months after the reporting period, or
• There is no unconditional right to defer the settlement of the liability for at least twelve months after the reporting period
The Group classifies all other liabilities as non-current.
Deferred tax assets and liabilities are classified as non-current assets and liabilities.
The operating cycle is the time between the acquisition of assets for processing and their realisation in cash and cash equivalents. The Group has identified twelve months as its operating cycle.
c. Businesscombinations The Group uses the acquisition method of accounting
to account for business combinations that occurred on or after April 01, 2015. The acquisition date is generally the date on which control is transferred to the acquirer. Judgment is applied in determining the acquisition date and determining whether control is transferred from one party to another. Control exists when the Group is exposed to, or has rights to, variable returns from its involvement with the entity and has the ability to affect those returns through power over the entity. In assessing control, potential voting rights are considered only if the rights are substantive. The Group measures goodwill as of the applicable acquisition date at the fair value of the consideration transferred, including the recognised amount of any non-controlling interest in the acquiree and the fair value of the acquirer’s previously held equity interest in the acquiree (if any), less the net recognised amount of the identifiable assets acquired and liabilities
assumed. When the fair value of the net identifiable assets acquired and liabilities assumed exceeds the consideration transferred, a bargain purchase gain is recognised immediately in the OCI and accumulates the same in equity as Capital Reserve where there exists clear evidence of the underlying reasons for classifying the business combination as a bargain purchase else the gain is directly recognised in equity as Capital Reserve. Consideration transferred includes the fair values of the assets transferred, liabilities incurred by the Group to the previous owners of the acquiree, and equity interests issued by the Group. Consideration transferred also includes the fair value of any contingent consideration. Changes in the fair value of the contingent consideration that qualify as measurement period adjustments are adjusted retrospectively, with corresponding adjustments against goodwill or capital reserve, as the case maybe. The subsequent accounting for changes in the fair value of the contingent consideration that do not qualify as measurement period adjustments depends on how the contingent consideration is classified. Contingent consideration that is classified as equity is not remeasured at subsequent reporting dates and its subsequent settlement is accounted for within equity. Contingent consideration that is classified as an asset or a liability is remeasured at fair value at subsequent reporting dates with the corresponding gain or loss being recognised in profit or loss. Consideration transferred does not include amounts related to settlement of pre-existing relationships.
A contingent liability of the acquiree is assumed in a business combination only if such a liability represents a present obligation and arises from a past event, and its fair value can be measured reliably. On an acquisition-by-acquisition basis, the Group recognises any non-controlling interest in the acquiree either at fair value or at the non-controlling interest’s proportionate share of the acquiree’s identifiable net assets. Transaction costs that the Group incurs in connection with a business combination, such as finder’s fees, legal fees, due diligence fees and other professional and consulting fees, are expensed as incurred.
If the business combination is achieved in stages, any previously held equity interest is re-measured at its acquisition date fair value and any resulting gain or loss is recognised in profit or loss or OCI, as appropriate.
If the initial accounting for a business combination is incomplete by the end of the reporting period in which the combination occurs, the Group reports provisional amounts for the items for which the accounting is incomplete. Those provisional amounts are adjusted during the measurement period (see above), or additional

SUN PHARMACEUTICAL INDUSTRIES LIMITED
145
ANNUAL REPORT 2017-18
Notes to the Consolidated Financial Statementsfor the year ended March 31, 2018
CONSOLIDATED FINANCIAL STATEMENTS
assets or liabilities are recognised, to reflect new information obtained about facts and circumstances that existed at the acquisition date that, if known, would have affected the amounts recognised at that date.
d. Foreigncurrency Foreigncurrencytransactions In preparing the financial statements of each individual
Group entity, transactions in currencies other than the entity’s functional currency (foreign currencies) are translated at exchange rates at the dates of the transactions. Monetary assets and liabilities denominated in foreign currencies at the reporting date are translated into the functional currency at the exchange rate at that date. Exchange differences arising on the settlement of monetary items or on translating monetary items at rates different from those at which they were translated on initial recognition during the period or in previous period are recognised in profit or loss in the period in which they arise except for:
• exchange differences on foreign currency borrowings relating to assets under construction for future productive use, which are included in the cost of those assets when they are regarded as an adjustment to interest costs on those foreign currency borrowings (see note 2.2.r).
• exchange differences on transactions entered into in order to hedge certain foreign currency risks (see note 2.2.j below for hedging accounting policies).
• exchange differences on monetary items receivable from or payable to a foreign operation for which settlement is neither planned nor likely to occur (therefore forming part of the net investment in the foreign operation) are recognised in other comprehensive income / (loss) and presented within equity as a part of Foreign Currency Translation Reserve. On disposal of the foreign operation, the relevant amount in the Foreign Currency Translation Reserve is reclassified to profit or loss.
Non-monetary items that are measured in terms of historical cost in foreign currency are measured using the exchange rates at the date of initial transaction.
Foreignoperations For the purposes of presenting these consolidated
financial statements, the assets and liabilities of Group’s foreign operations, are translated to the Indian Rupees at exchange rates at the end of each reporting period. The income and expenses of such foreign operations are translated at the average exchange rates for the period.
Resulting foreign currency differences are recognised in other comprehensive income / (loss) and presented within equity as part of Foreign Currency Translation Reserve (and attributed to non-controlling interests as appropriate). When a foreign operation is disposed off, the relevant amount in the Foreign Currency Translation Reserve is reclassified to profit or loss.
In addition, in relation to a partial disposal of a subsidiary that includes a foreign operation that does not result in the Group losing control over the subsidiary, the proportionate share of accumulated exchange differences are re-attributed to non-controlling interests and are not recognised in profit or loss. For all other partial disposals (i.e. partial disposals of associates or joint arrangements that do not result in the Group losing significant influence or joint control), the proportionate share of the accumulated exchange differences is reclassified to profit or loss.
Goodwill and fair value adjustments to identifiable assets acquired and liabilities assumed through acquisition of a foreign operation are treated as assets and liabilities of the foreign operation and translated at the rate of exchange prevailing at the end of each reporting period. Exchange differences arising are recognised in other comprehensive income.
e. Segmentreporting Operating segments are reported in a manner consistent
with the internal reporting provided to the chief operating decision maker. The chief operating decision maker of the Company is responsible for allocating resources and assessing performance of the operating segments.
f. Property,plantandequipment Items of property, plant and equipment are stated in
consolidated balance sheet at cost less accumulated depreciation and accumulated impairment losses, if any. Freehold land is not depreciated.
Assets in the course of construction for production, supply or administrative purposes are carried at cost, less any recognised impairment loss. Cost includes purchase price, borrowing costs if capitalisation criteria are met and directly attributable cost of bringing the asset to its working condition for the intended use. Subsequent expenditures are capitalised only when they increase the future economic benefits embodied in the specific asset to which they relate. Such assets are classified to the appropriate categories of property, plant and equipment when completed and ready for intended use. Depreciation of these assets, on the same basis as
SUN PHARMACEUTICAL INDUSTRIES LIMITED
146
Notes to the Consolidated Financial Statementsfor the year ended March 31, 2018
other assets, commences when the assets are ready for their intended use. When parts of an item of property, plant and equipment have different useful lives, they are accounted for as separate items (major components) of property, plant and equipment.
An item of property, plant and equipment is derecognised upon disposal or when no future economic benefits are expected to arise from the continued use of the asset. Any gain or loss arising on the disposal or retirement of an item of property, plant and equipment is determined as the difference between the sales proceeds and the carrying amount of property, plant and equipment and is recognised in profit or loss.
Items of property, plant and equipment acquired through exchange of non-monetary assets are measured at fair value, unless the exchange transaction lacks commercial substance or the fair value of either the asset received or asset given up is not reliably measurable, in which case the acquired asset is measured at the carrying amount of the asset given up.
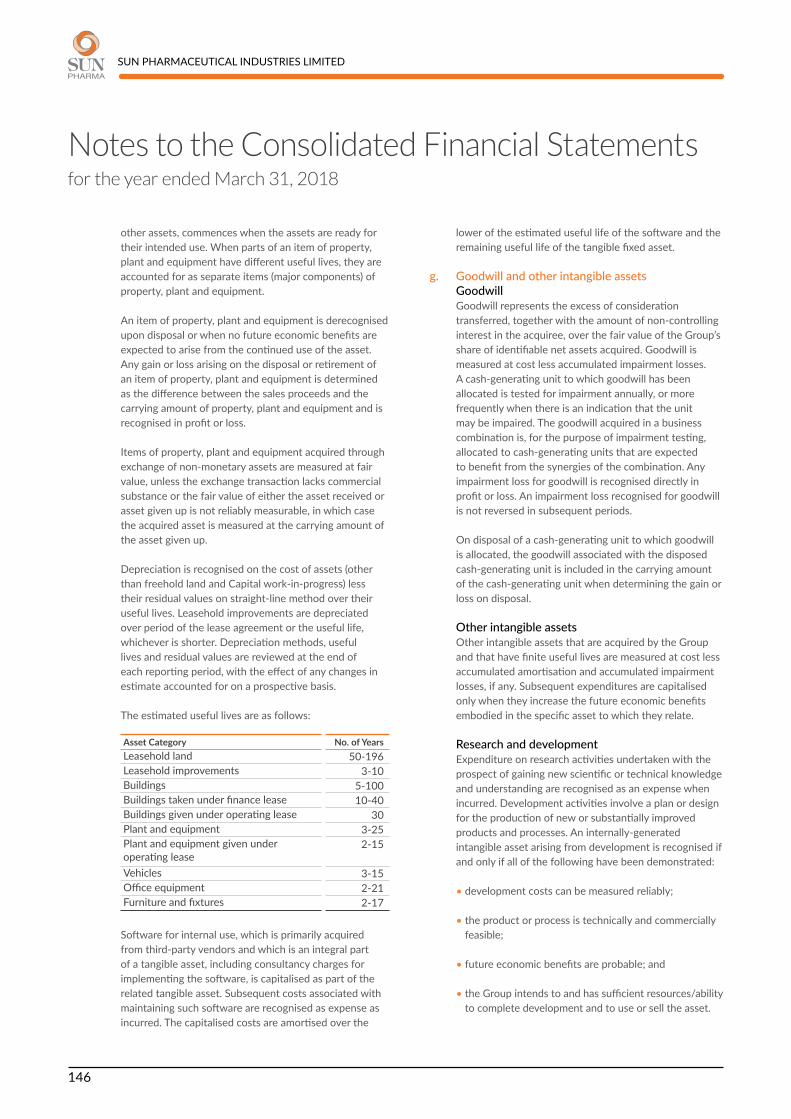
Depreciation is recognised on the cost of assets (other than freehold land and Capital work-in-progress) less their residual values on straight-line method over their useful lives. Leasehold improvements are depreciated over period of the lease agreement or the useful life, whichever is shorter. Depreciation methods, useful lives and residual values are reviewed at the end of each reporting period, with the effect of any changes in estimate accounted for on a prospective basis.
The estimated useful lives are as follows:
Asset Category No. of YearsLeasehold land 50-196Leasehold improvements 3-10Buildings 5-100Buildings taken under finance lease 10-40Buildings given under operating lease 30Plant and equipment 3-25Plant and equipment given under operating lease
2-15
Vehicles 3-15Office equipment 2-21Furniture and fixtures 2-17
Software for internal use, which is primarily acquired from third-party vendors and which is an integral part of a tangible asset, including consultancy charges for implementing the software, is capitalised as part of the related tangible asset. Subsequent costs associated with maintaining such software are recognised as expense as incurred. The capitalised costs are amortised over the
lower of the estimated useful life of the software and the remaining useful life of the tangible fixed asset.
g. Goodwillandotherintangibleassets Goodwill Goodwill represents the excess of consideration
transferred, together with the amount of non-controlling interest in the acquiree, over the fair value of the Group’s share of identifiable net assets acquired. Goodwill is measured at cost less accumulated impairment losses. A cash-generating unit to which goodwill has been allocated is tested for impairment annually, or more frequently when there is an indication that the unit may be impaired. The goodwill acquired in a business combination is, for the purpose of impairment testing, allocated to cash-generating units that are expected to benefit from the synergies of the combination. Any impairment loss for goodwill is recognised directly in profit or loss. An impairment loss recognised for goodwill is not reversed in subsequent periods.
On disposal of a cash-generating unit to which goodwill is allocated, the goodwill associated with the disposed cash-generating unit is included in the carrying amount of the cash-generating unit when determining the gain or loss on disposal.
Otherintangibleassets Other intangible assets that are acquired by the Group
and that have finite useful lives are measured at cost less accumulated amortisation and accumulated impairment losses, if any. Subsequent expenditures are capitalised only when they increase the future economic benefits embodied in the specific asset to which they relate.
Researchanddevelopment Expenditure on research activities undertaken with the
prospect of gaining new scientific or technical knowledge and understanding are recognised as an expense when incurred. Development activities involve a plan or design for the production of new or substantially improved products and processes. An internally-generated intangible asset arising from development is recognised if and only if all of the following have been demonstrated:
• development costs can be measured reliably;
• the product or process is technically and commercially feasible;
• future economic benefits are probable; and
• the Group intends to and has sufficient resources/ability to complete development and to use or sell the asset.

SUN PHARMACEUTICAL INDUSTRIES LIMITED
147
ANNUAL REPORT 2017-18
Notes to the Consolidated Financial Statementsfor the year ended March 31, 2018
CONSOLIDATED FINANCIAL STATEMENTS
The expenditure to be capitalised include the cost of materials and other costs directly attributable to preparing the asset for its intended use. Other development expenditure is recognised in profit or loss as incurred.
Payments to third parties that generally take the form of up-front payments and milestones for in-licensed products, compounds and intellectual property are capitalised since the probability of expected future economic benefits criterion is always considered to be satisfied for separately acquired intangible assets.
Acquired research and development intangible assets which are under development, are recognised as In-Process Research and Development assets (“IPR&D”). IPR&D assets are not amortised, but evaluated for potential impairment on an annual basis or when there are indications that the carrying value may not be recoverable. Any impairment charge on such IPR&D assets is recognised in profit or loss. Intangible assets relating to products under development, other intangible assets not available for use and intangible assets having indefinite useful life are tested for impairment annually, or more frequently when there is an indication that the assets may be impaired. All other intangible assets are tested for impairment when there are indications that the carrying value may not be recoverable.
The consideration for acquisition of intangible asset which is based on reaching specific milestone that are dependent on the Group’s future activity is recognised only when the activity requiring the payment is performed.
Subsequent expenditures are capitalised only when they increase the future economic benefits embodied in the specific asset to which they relate. All other expenditures, including expenditures on internally generated goodwill and brands, are recognised in the statement of profit and loss as incurred.
Amortisation is recognised on a straight-line basis over the estimated useful lives of intangible assets. Intangible assets that are not available for use are amortised from the date they are available for use.
The estimated useful lives for Product related intangibles and Other intangibles ranges from 5 to 20 years.
The estimated useful life and the amortisation method for intangible assets with a finite useful life are reviewed at the end of each reporting period, with the effect of any changes in estimate being accounted for on a prospective basis.
The estimated useful life and amortisation method are reviewed at the end of each reporting period, with the effect of any changes in estimate being accounted for on a prospective basis.
De-recognitionofintangibleassets Intangible assets are de-recognised either on their
disposal or where no future economic benefits are expected from their use. Gain or loss arising on such de-recognition is recognised in profit or loss, and are measured as the difference between the net disposal proceeds, if any, and the carrying amount of respective intangible assets as on the date of de-recognition.
h. Impairmentofnon-financialassetsotherthangoodwill
The carrying amounts of the Group’s non-financial assets are reviewed at each reporting date to determine whether there is any indication of impairment. If any such indication exists, then the asset’s recoverable amount is estimated in order to determine the extent of the impairment loss, if any.
The recoverable amount of an asset or cash generating unit (as defined below) is the greater of its value in use and its fair value less costs to sell. In assessing value in use, the estimated future cash flows are discounted to their present value using a pre-tax discount rate that reflects current market assessments of the time value of money and the risks specific to the asset or the cash generating unit for which the estimates of future cash flows have not been adjusted. For the purpose of impairment testing, assets are grouped together into the smallest group of assets that generates cash inflows from continuing use that are largely independent of the cash inflows of other assets or groups of assets (the “cash generating unit”).
An impairment loss is recognised in the profit or loss if the estimated recoverable amount of an asset or its cash generating unit is lower than its carrying amount. Impairment losses recognised in respect of cash generating units are allocated first to reduce the carrying amount of any goodwill allocated to the units and then to reduce the carrying amount of the other assets in the unit on a pro-rata basis.
In respect of assets other than goodwill, impairment losses recognised in prior periods are assessed at each reporting date for any indications that the loss has decreased or no longer exists. An impairment loss is reversed if there has been a change in the estimates used to determine the recoverable amount. An impairment loss is reversed only to the extent that the asset’s

SUN PHARMACEUTICAL INDUSTRIES LIMITED
148
Notes to the Consolidated Financial Statementsfor the year ended March 31, 2018
carrying amount does not exceed the carrying amount that would have been determined, net of depreciation or amortisation, if no impairment loss had been recognised.
i. Non-currentassetsheldforsale Non-current assets and disposal groups are classified as
held for sale if their carrying amount will be recovered principally through a sale transaction rather than through continuing use. This condition is regarded as met only when the asset (or disposal group) is available for immediate sale in its present condition subject only to terms that are usual and customary for sales of such asset (or disposal group) and its sale is highly probable. Management must be committed to the sale, which should be expected to qualify for recognition as a completed sale within one year from the date of classification.
When the Group is committed to a sale plan involving loss of control of a subsidiary, all of the assets and liabilities of that subsidiary are classified as held for sale when the criteria described above are met, regardless of whether the Group will retain a non-controlling interest in its former subsidiary after the sale.
When the Group is committed to a sale plan involving disposal of an investment, or a portion of an investment, in an associate or joint venture, the investment or the portion of the investment that will be disposed off is classified as held for sale when the criteria described above are met, and the Group discontinues the use of the equity method in relation to the portion that is classified as held for sale.
Any retained portion of an investment in an associate or a joint venture that has not been classified as held for sale continues to be accounted for using the equity method. The Group discontinues the use of the equity method at the time of disposal when the disposal results in the Group losing significant influence over the associate or joint venture.
After the disposal takes place, the Group accounts for any retained interest in the associate or joint venture in accordance with Ind AS 109 unless the retained interest continues to be an associate or a joint venture, in which case the Group uses the equity method (see the accounting policy regarding investments in associates or joint ventures above).
Non-current assets (and disposal groups) classified as held for sale are measured at the lower of their carrying amount and fair value less costs to sell. Non-current assets are not depreciated or amortised.
j. Financialinstruments A financial instrument is any contract that gives rise to
a financial asset of one entity and a financial liability or equity instrument of another entity.
Financialassets Initialrecognitionandmeasurement All financial assets are recognised initially at fair value
plus, in the case of financial assets not recorded at fair value through profit or loss, transaction costs that are attributable to the acquisition of the financial asset. Purchases or sales of financial assets that require delivery of assets within a time frame established by regulation or convention in the market place (regular way trades) are recognised on the date the group commits to purchase or sale the financial assets.
Subsequentmeasurement For purposes of subsequent measurement, financial
assets are classified in four categories:
• Debt instruments at amortised cost
• Debt instruments at fair value through other comprehensive income (FVTOCI)
• Debt instruments and equity instruments at fair value through profit or loss (FVTPL)
• Equity instruments measured at fair value through other comprehensive income (FVTOCI)
Debtinstrumentsatamortisedcost A ‘debt instrument’ is measured at the amortised cost if
both the following conditions are met:
a) The asset is held within a business model whose objective is to hold assets for collecting contractual cash flows, and
b) Contractual terms of the asset give rise on specified dates to cash flows that are solely payments of principal and interest (SPPI) on the principal amount outstanding.
After initial measurement, such financial assets are subsequently measured at amortised cost using the effective interest rate (EIR) method. Amortised cost is calculated by taking into account any discount or premium on acquisition and fees or costs that are an integral part of the EIR. The EIR amortisation is included in Other Income in the profit or loss. The losses arising from impairment are recognised in the profit or loss.

SUN PHARMACEUTICAL INDUSTRIES LIMITED
149
ANNUAL REPORT 2017-18
Notes to the Consolidated Financial Statementsfor the year ended March 31, 2018
CONSOLIDATED FINANCIAL STATEMENTS
DebtinstrumentatFVTOCI A ‘debt instrument’ is measured as at FVTOCI if both of
the following criteria are met:
a) The objective of the business model is achieved both by collecting contractual cash flows and selling the financial assets, and
b) The contractual terms of the instrument give rise on specified dates to cash flows that are SPPI on the principal amount outstanding.
Debt instruments included within the FVTOCI category are measured initially as well as at each reporting date at fair value. Fair value movements are recognised in the other comprehensive income (OCI). However, the Group recognises interest income, impairment losses and reversals and foreign exchange gain or loss in the profit or loss. On derecognition of the asset, cumulative gain or loss previously recognised in OCI is reclassified from the equity to profit or loss. Interest earned whilst holding FVTOCI debt instrument is reported as interest income using the EIR method.
DebtinstrumentatFVTPL FVTPL is a residual category for debt instruments. Any
debt instrument, which does not meet the criteria for categorisation as at amortised cost or as FVTOCI, is classified as at FVTPL.
In addition, the Group may elect to designate a debt instrument, which otherwise meets amortised cost or FVTOCI criteria, as at FVTPL. However, such election is allowed only if doing so reduces or eliminates a measurement or recognition inconsistency (referred to as ‘accounting mismatch’).
Debt instruments included within the FVTPL category are measured at fair value with all the changes in the profit or loss.
Equityinstruments All equity instruments in scope of Ind AS 109 are
measured at fair value. Equity instruments which are held for trading and contingent consideration recognised by an acquirer in a business combination to which Ind AS 103 applies are classified as at FVTPL. For all other equity instruments, the Group may make an irrevocable election to present subsequent changes in the fair value in OCI. The Group makes such election on an instrument-by-instrument basis. The classification is made on initial recognition and is irrevocable.
If the Group decides to classify an equity instrument as at FVTOCI, then all fair value changes on the instrument, including foreign exchange gain or loss and excluding dividends, are recognised in the OCI. There is no recycling of the amounts from OCI to profit or loss, even on sale of investment. However, the Group may transfer the cumulative gain or loss within equity.
Equity instruments included within the FVTPL category are measured at fair value with all changes recognised in the profit or loss.
Derecognition A financial asset (or, where applicable, a part of a financial
asset or part of a group of similar financial assets) is primarily derecognised (i.e. removed from the Group’s consolidated balance sheet) when:
• The contractual rights to receive cash flows from the asset have expired, or
• The Group has transferred its rights to receive contractual cash flows from the asset or has assumed an obligation to pay the received cash flows in full without material delay to a third party under a ‘pass-through’ arrangement; and either (a) the Group has transferred substantially all the risks and rewards of the asset, or (b) the Group has neither transferred nor retained substantially all the risks and rewards of the asset, but has transferred control of the asset.
When the Group has transferred its rights to receive cash flows from an asset or has entered into a pass-through arrangement, it evaluates if and to what extent it has retained the risks and rewards of ownership. When it has neither transferred nor retained substantially all of the risks and rewards of the asset, nor transferred control of the asset, the Group continues to recognise the transferred asset to the extent of the Group’s continuing involvement. In that case, the Group also recognises an associated liability. The transferred asset and the associated liability are measured on a basis that reflects the rights and obligations that the Group has retained.
On derecognition of a financial asset in its entirety, the difference between the asset’s carrying amount and the sum of the consideration received and receivable and the cumulative gain or loss that had been recognised in OCI and accumulated in equity is recognised in profit or loss if such gain or loss would have otherwise been recognised in profit or loss on disposal of that financial asset.

SUN PHARMACEUTICAL INDUSTRIES LIMITED
150
Notes to the Consolidated Financial Statementsfor the year ended March 31, 2018
Impairmentoffinancialassets In accordance with Ind AS 109, the Group applies
expected credit loss (ECL) model for measurement and recognition of impairment loss on the Trade receivables or any contractual right to receive cash or another financial asset that result from transactions that are within the scope of Ind AS 18.
The Group follows ‘simplified approach’ for recognition of impairment loss allowance on trade receivables or any contractual right to receive cash or another financial asset. The application of simplified approach does not require the Group to track changes in credit risk. Rather, it recognises impairment loss allowance based on lifetime ECLs at each reporting date, right from its initial recognition.
As a practical expedient, the Group uses a provision matrix to determine impairment loss allowance on portfolio of its trade receivables. The provision matrix is based on its historically observed default rates over the expected life of the trade receivables and is adjusted for forward-looking estimates. At every reporting date, the historical observed default rates are updated and changes in the forward-looking estimates are analysed.
Financialliabilitiesandequityinstruments Classificationasdebtorequity Debt and equity instruments issued by a Group entity
are classified as either financial liabilities or as equity in accordance with the substance of the contractual arrangements and the definitions of a financial liability and an equity instrument.
Equityinstruments An equity instrument is any contract that evidences a
residual interest in the assets of an entity after deducting all of its liabilities. Equity instruments issued by a Group entity are recognised at the proceeds received, net of direct issue costs.
Repurchase of the Parent Company’s own equity instruments is recognised and deducted directly in equity. No gain or loss is recognised in profit or loss on the purchase, sale, issue or cancellation of the Parent Company’s own equity instruments.
Compoundfinancialinstruments The component parts of compound financial instruments
(convertible notes) issued by the Group are classified separately as financial liabilities and equity in accordance with the substance of the contractual arrangements and the definitions of a financial liability and an equity instrument.
Initialrecognitionandmeasurement All financial liabilities are recognised initially at fair value
and, in the case of loans and borrowings and payables, net of directly attributable transaction costs.
The Company’s financial liabilities include trade and other payables, loans and borrowings including bank overdrafts, financial guarantee contracts and derivative financial instruments.
Subsequentmeasurement All financial liabilities are subsequently measured at
amortised cost using the effective interest method or at FVTPL.
Financialliabilitiesatfairvaluethroughprofit or loss
Financial liabilities are classified as at FVTPL when the financial liability is either contingent consideration recognised by the Group as an acquirer in a business combination to which Ind AS 103 applies or is held for trading or is designated upon initial recognition as at fair value through profit or loss. Financial liabilities are classified as held for trading if they are incurred principally for the purpose of repurchasing in the near term or on initial recognition it is part of a portfolio of identified financial instruments that the Group manages together and has a recent actual pattern of short-term profit-taking. This category also includes derivative financial instruments that are not designated as hedging instruments in hedge relationships as defined by Ind AS 109. Gains or losses on liabilities held for trading are recognised in the profit or loss.
Financial liabilities designated upon initial recognition at fair value through profit or loss are designated as such at the initial date of recognition, and only if the criteria in Ind AS 109 are satisfied. For instruments not held-for-trading financial liabilities designated as at FVTPL, fair value gains/ losses attributable to changes in own credit risk are recognised in OCI, unless the recognition of the effects of changes in the liability’s credit risk in OCI would create or enlarge an accounting mismatch in profit or loss, in which case these effects of changes in credit risk are recognised in profit or loss. These gains/ loss are not subsequently transferred to profit or loss. All other changes in fair value of such liability are recognised in the consolidated statement of profit or loss.
Financialliabilitiessubsequentlymeasuredatamortisedcost
Financial liabilities that are not held-for-trading and are not designated as at FVTPL are measured at amortised cost in subsequent accounting periods. The carrying

SUN PHARMACEUTICAL INDUSTRIES LIMITED
151
ANNUAL REPORT 2017-18
Notes to the Consolidated Financial Statementsfor the year ended March 31, 2018
CONSOLIDATED FINANCIAL STATEMENTS
amounts of financial liabilities that are subsequently measured at amortised cost are determined based on the effective interest rate (EIR) method. Interest expense that is not capitalised as part of costs of an asset is included in the ‘Finance costs’ line item in the profit or loss.
After initial recognition, such financial liabilities are subsequently measured at amortised cost using the EIR method. Amortised cost is calculated by taking into account any discount or premium on acquisition and fees or costs that are an integral part of the EIR. The EIR amortisation is included as finance costs in the profit or loss.
Financialguaranteecontracts Financial guarantee contracts are those contracts that
require a payment to be made to reimburse the holder for a loss it incurs because the specified debtor fails to make a payment when due in accordance with the terms of a debt instrument. Financial guarantee contracts are recognised initially as a liability at fair value, adjusted for transaction costs that are directly attributable to the issuance of the guarantee. If not designated as at FVTPL, are subsequently measured at the higher of the amount of loss allowance determined as per impairment requirements of Ind AS 109 and the amount initially recognised less cumulative amount of income recognised.
Derecognition A financial liability is derecognised when the obligation
under the liability is discharged or cancelled or expires. When an existing financial liability is replaced by another from the same lender on substantially different terms, or the terms of an existing liability are substantially modified, such an exchange or modification is treated as the derecognition of the original liability and the recognition of a new liability. The difference between the carrying amount of the financial liability derecognised and the consideration paid and payable is recognised in profit or loss.
Embeddedderivatives Derivatives embedded in non-derivative host contracts
that are not financial assets within the scope of Ind AS 109 are accounted for as separate derivatives and recorded at fair value if their economic characteristics and risks are not closely related to those of the host contracts and the host contracts are not held for trading or designated at fair value though profit or loss. These embedded derivatives are measured at fair value with changes in fair value recognised in profit or loss, unless designated as effective hedging instruments.
Reclassificationoffinancialassets The Group determines classification of financial
assets and liabilities on initial recognition. After initial recognition, no reclassification is made for financial assets which are equity instruments and financial liabilities. For financial assets which are debt instruments, a reclassification is made only if there is a change in the business model for managing those assets. Changes to the business model are expected to be infrequent. The Group’s senior management determines change in the business model as a result of external or internal changes which are significant to the Group’s operations. Such changes are evident to external parties. A change in the business model occurs when the Group either begins or ceases to perform an activity that is significant to its operations. If the Group reclassifies financial assets, it applies the reclassification prospectively from the reclassification date which is the first day of the immediately next reporting period following the change in business model. The Group does not restate any previously recognised gains, losses (including impairment gains or losses) or interest.
Derivativefinancialinstrumentsandhedgeaccounting
Initialrecognitionandsubsequentmeasurement The Group uses derivative financial instruments, such as
forward currency contracts, full currency swap, options and interest rate swaps to hedge its foreign currency risks and interest rate risks respectively. Such derivative financial instruments are initially recognised at fair value on the date on which a derivative contract is entered into and are subsequently re-measured at fair value at the end of each reporting period. Derivatives are carried as financial assets when the fair value is positive and as financial liabilities when the fair value is negative.
Any gains or losses arising from changes in the fair value of derivatives are taken directly to profit or loss, except for the effective portion of cash flow hedges, which is recognised in OCI and later reclassified to profit or loss when the hedge item affects profit or loss or treated as basis adjustment if a hedged forecast transaction subsequently results in the recognition of a non-financial asset or non-financial liability.
For the purpose of hedge accounting, hedges are classified as:
• Fair value hedges when hedging the exposure to changes in the fair value of a recognised asset or liability or an unrecognised firm commitment.

SUN PHARMACEUTICAL INDUSTRIES LIMITED
152
Notes to the Consolidated Financial Statementsfor the year ended March 31, 2018
• Cash flow hedges when hedging the exposure to variability in cash flows that is either attributable to a particular risk associated with a recognised asset or liability or a highly probable forecast transaction or the foreign currency risk in an unrecognised firm commitment
• Hedges of a net investment in a foreign operation.
At the inception of a hedge relationship, the Group formally designates and documents the hedge relationship to which the Group wishes to apply hedge accounting and the risk management objective and strategy for undertaking the hedge. The documentation includes the Group’s risk management objective and strategy for undertaking hedge, the hedging/economic relationship, the hedged item or transaction, the nature of the risk being hedged, hedge ratio and how the entity will assess the effectiveness of changes in the hedging instrument’s fair value in offsetting the exposure to changes in the hedged item’s fair value or cash flows attributable to the hedged risk. Such hedges are expected to be highly effective in achieving offsetting changes in fair value or cash flows and are assessed on an ongoing basis to determine that they actually have been highly effective throughout the financial reporting periods for which they were designated.
Hedges that meet the strict criteria for hedge accounting are accounted for, as described below:
(i) Fairvaluehedges Changes in fair value of the designated portion
of derivatives that qualify as fair value hedges are recognised in profit or loss immediately, together with any changes in the fair value of the hedged asset or liability that are attributable to the hedged risk.
(ii) Cashflowhedges The effective portion of changes in the fair value of the
hedging instrument is recognised in OCI in the cash flow hedge reserve, while any ineffective portion is recognised immediately in profit or loss. The Group uses forward currency contracts as hedges of its exposure to foreign currency risk in forecast transactions and firm commitments. Amounts recognised as OCI are transferred to profit or loss when the hedged transaction affects profit or loss, such as when a forecast sale occurs. When the hedged item is the cost of a non-financial asset or non-financial liability, the amounts recognised as OCI are transferred to the initial carrying amount of the non-financial asset or liability.
If the hedging instrument expires or is sold, terminated or exercised or if its designation as a hedge is revoked, or when the hedge no longer meets the criteria for hedge accounting, any cumulative gain or loss previously recognised in OCI remains separately in equity until the forecast transaction occurs or the foreign currency firm commitment is met. When a forecast transaction is no longer expected to occur, the gain or loss accumulated in equity is recognised immediately in profit or loss.
(iii) NetInvestmentHedge The group designates certain foreign currency liability
as hedge against certain net investment in foreign subsidiaries. Hedges of net investments in foreign operations are accounted similar to cash flow hedges. Any gain or loss on the hedging instrument relating to the effective portion of the hedge is recognised in other comprehensive income and held in foreign currency translation reserve (‘FCTR’)- a component of equity. The ineffective portion of the gain or loss on these hedges is immediately recognised in the statement of profit and loss. The amounts accumulated in equity are included in the statement of profit and loss when the foreign operation is disposed or partially disposed.
Treasuryshares The Group has created an Employee Benefit Trust (EBT)
for providing share-based payment to its employees. The Group uses EBT as a vehicle for distributing shares to employees under the employee remuneration schemes. The Group treats EBT as its extension and shares held by EBT are treated as treasury shares.
Own equity instruments that are reacquired (treasury shares) are deducted from equity. No gain or loss is recognised in profit or loss on the purchase, sale, issue or cancellation of the Group’s own equity instruments. Consideration paid or received shall be recognised directly in equity.
DividenddistributiontoequityholdersoftheParent The Parent Company recognises a liability to make
dividend distributions to equity holders of the parent when the distribution is authorised and the distribution is no longer at the discretion of the Parent Company. As per the corporate laws in India, a distribution is authorised when it is approved by the shareholders. A corresponding amount is recognised directly in equity.
k. Leases A lease that transfers substantially all the risks and
rewards incidental to ownership to the lessee is classified as a finance lease. All other leases are classified as operating leases.

SUN PHARMACEUTICAL INDUSTRIES LIMITED
153
ANNUAL REPORT 2017-18
Notes to the Consolidated Financial Statementsfor the year ended March 31, 2018
CONSOLIDATED FINANCIAL STATEMENTS
Groupasalessee Finance leases are capitalised at the commencement of
the lease at the inception date fair value of the leased assets or, if lower, at the present value of the minimum lease payments. The corresponding liability to the lessor is included in the consolidated balance sheet as a finance lease obligation. Lease payments are apportioned between finance charges and reduction of the lease liability so as to achieve a constant rate of interest on the remaining balance of the liability. Finance charges are recognised in profit or loss as finance costs. Contingent rentals are recognised as expenses in the periods in which they are incurred.
Operating lease payments are generally recognised as an expense in the profit or loss on a straight-line basis over the lease term. Where the rentals are structured solely to increase in line with expected general inflation to compensate for the lessor’s expected inflationary cost increases, such increases are recognised in the year in which such benefits accrue. Contingent rentals arising under operating leases are also recognised as expenses in the periods in which they are incurred.
Groupasalessor Rental income from operating lease is generally
recognised on a straight-line basis over the term of the relevant lease. Where the rentals are structured solely to increase in line with expected general inflation to compensate for the Group’s expected inflationary cost increases, such increases are recognised in the year in which such benefits accrue. Initial direct costs incurred in negotiating and arranging an operating lease are added to the carrying amount of the leased asset and recognised over the lease term on the same basis as rental income. Contingent rents are recognised as revenue in the period in which they are earned.
Amounts due from lessees under finance leases are recorded as receivables at the Group’s net investment in the leases. Finance lease income is allocated to accounting periods so as to reflect a constant periodic rate of return on the Group’s net investment outstanding in respect of the leases.
l. Inventories Inventories consisting of raw materials and packing
materials, work-in-progress, stock-in-trade, stores and spares and finished goods are measured at the lower of cost and net realisable value. The cost of all categories of inventories is based on the weighted average method. Cost of raw materials and packing materials, stock-in-trade, stores and spares includes cost of purchases and other costs incurred in bringing the inventories to their
present location and condition. Cost of work-in-progress and finished goods comprises direct material, direct labour and an appropriate proportion of variable and fixed overhead expenditure, the latter being allocated on the basis of normal operating capacity.
Net realisable value is the estimated selling price in the ordinary course of business, less the estimated costs of completion and costs necessary to make the sale.
The factors that the Company considers in determining the allowance for slow moving, obsolete and other non-saleable inventory include estimated shelf life, planned product discontinuances, price changes, ageing of inventory and introduction of competitive new products, to the extent each of these factors impact the Company’s business and markets. The Company considers all these factors and adjusts the inventory provision to reflect its actual experience on a periodic basis
m. Cashandcashequivalents Cash and cash equivalent in the balance sheet comprise
cash at banks and on hand and short-term deposits with an original maturity of three months or less, which are subject to an insignificant risk of changes in value.
For the purpose of the consolidated statement of cash flows, cash and cash equivalents consist of cash and short-term deposits, as defined above, net of outstanding bank overdrafts as they are considered an integral part of the Companies cash management.
n. Provisions,contingentliabilitiesandcontingentassets
Provisions are recognised when the Group has a present obligation (legal or constructive) as a result of past event, it is probable that an outflow of resources embodying economic benefits will be required to settle the obligation and a reliable estimate can be made of the amount of obligation. When the Company expects some or all of a provision to be reimbursed, for example, under an insurance contract, the reimbursement is recognised as a separate asset, but only when the reimbursement is certain. The expense relating to a provision is presented in the statement of profit and loss net of any reimbursement.
If the effect of the time value of money is material, provisions are determined by discounting the expected future cash flows at a pre-tax rate that reflects current market assessments of the time value of money and the risks specific to the liability. Where discounting is used, the increase in the provision due to the passage of time is recognised as a finance cost.

SUN PHARMACEUTICAL INDUSTRIES LIMITED
154
Notes to the Consolidated Financial Statementsfor the year ended March 31, 2018
Restructuring A provision for restructuring is recognised when the
Group has a detailed formal restructuring plan and has raised a valid expectation in those affected that it will carry out the restructuring by starting to implement the plan or announcing its main features to those affected by it. The measurement of a restructuring provision includes only the direct expenditure arising from the restructuring, which are those amounts that are both necessarily entailed by the restructuring and not associated with the ongoing activities of the entity.
Onerous contracts Present obligations arising under onerous contracts are
recognised and measured as provisions. An onerous contract is considered to exist where the Group has a contract under which the unavoidable costs of meeting the obligations under the contract exceed the economic benefit expected to be received from the contract.
Contingentliabilitiesandcontingentassets Contingent liability is disclosed for,
(i) Possible obligations which will be confirmed only by future events not wholly within the control of the Company, or
(ii) Present obligations arising from past events where it is not probable that an outflow of resources will be required to settle the obligation or a reliable estimate of the amount of the obligation cannot be made.
Contingent assets are not recognised in the consolidated financial statements.
o. Revenue Revenue from sale of goods is measured at the fair value
of the consideration received or receivable. Revenue is stated exclusive of sales tax, value added tax, goods and service tax and net of returns, chargebacks, rebates and other similar allowances. Revenue is inclusive of excise duty till the period, provision of excise duty was levied on sale of goods.
Saleofgoods Revenue from sale of goods is recognised when the
significant risks and rewards of ownership have been transferred to the buyer, usually on delivery of goods, it is probable that the economic benefit will flow to the Group, the associated costs and possible return of goods can be estimated reliably, there is neither continuing
management involvement to the degree usually associated with ownership nor effective control over the goods sold and the amount of revenue can be measured reliably. The company is principal in all of its revenue arrangements, since it is the primary obligor in all of the revenue arrangements, as it has pricing latitude and is exposed to inventory and credit risks.
Provisions for chargeback, rebates, discounts and medicaid payments are estimated and provided for in the year of sales and recorded as reduction of revenue.
Sales returns The Company accounts for sales returns accrual by
recording an allowance for sales returns concurrent with the recognition of revenue at the time of a product sale. This allowance is based on the Company’s estimate of expected sales returns. With respect to established products, the Company considers its historical experience of sales returns, levels of inventory in the distribution channel, estimated shelf life, product discontinuances, price changes of competitive products, and the introduction of competitive new products, to the extent each of these factors impact the Company’s business and markets. With respect to new products introduced by the Company, such products have historically been either extensions of an existing line of product where the Company has historical experience or in therapeutic categories where established products exist and are sold either by the Company or the Company’s competitors.
Renderingofservices Revenue from services rendered is recognised in the
consolidated statement profit and loss as the underlying services are performed. Upfront non-refundable payments received are deferred and recognised as revenue over the expected period over which the related services are expected to be performed.
Royalties Royalty revenue is recognised on an accrual basis in
accordance with the substance of the relevant agreement (provided that it is probable that economic benefits will flow to the Group and the amount of revenue can be measured reliably). Royalty arrangements that are based on production, sales and other measures are recognised by reference to the underlying arrangement.
p. Dividendandinterestincome Dividend income is recognised when the Group’s right
to receive the payment is established, which is generally when shareholders approve the dividend.
SUN PHARMACEUTICAL INDUSTRIES LIMITED
155
ANNUAL REPORT 2017-18
Notes to the Consolidated Financial Statementsfor the year ended March 31, 2018
CONSOLIDATED FINANCIAL STATEMENTS
Interest income from a financial asset is recognised when it is probable that the economic benefits will flow to the Group and the amount of income can be measured reliably. Interest income is accrued on a time basis, by reference to the principal outstanding and at the effective interest rate applicable, which is the rate that exactly discounts estimated future cash receipts through the expected life of the financial asset to that asset’s net carrying amount on initial recognition.
q. Governmentgrants The Group recognises government grants only when
there is reasonable assurance that the conditions attached to them will be complied with, and the grants will be received. When the grant relates to an expense item, it is recognised as income on a systematic basis over the periods that the related costs, for which it is intended to compensate, are expensed. When the grant relates to an asset, the Company deducts such grant amount from the carrying amount of the asset.
r. Employeebenefits Definedbenefitplans The Company operates a defined benefit gratuity plan
which requires contribution to be made to a separately administered fund.
The liability in respect of defined benefit plans is calculated using the projected unit credit method with actuarial valuations being carried out at the end of each annual reporting period. The present value of the defined benefit obligation is determined by discounting the estimated future cash outflows by reference to market yields at the end of the reporting period on government bonds. The currency and term of the government bonds shall be consistent with the currency and estimated term of the post-employment benefit obligations. The current service cost of the defined benefit plan, recognised in the profit or loss as employee benefits expense, reflects the increase in the defined benefit obligation resulting from employee service in the current year, benefit changes, curtailments and settlements. Past service costs are recognised in profit or loss in the period of a plan amendment. The net interest cost is calculated by applying the discount rate to the net balance of the defined benefit obligation and the fair value of plan assets. This cost is included in employee benefit expense in profit or loss. Actuarial gains and losses arising from experience adjustments and changes in actuarial assumptions are charged or credited to OCI in the period in which they arise and is reflected immediately in retained earnings and is not reclassified to profit or loss.
Terminationbenefits Termination benefits are recognised as an expense at
the earlier of the date when the Group can no longer withdraw the offer of those benefits and when the entity recognises costs for a restructuring that is within the scope of Ind AS 37 and involves the payment of termination benefits.
Short-termandotherlong-termemployeebenefits Accumulated leave, which is expected to be utilised
within the next 12 months, is treated as short-term employee benefit. The Company measures the expected cost of such absences as the additional amount that it expects to pay as a result of the unused entitlement that has accumulated at the reporting date.
The Group treats accumulated leave expected to be carried forward beyond twelve months, as long-term employee benefit for measurement purposes. Such long-term compensated absences are provided for based on the actuarial valuation using the projected unit credit method at the year-end. Actuarial gains/losses are immediately taken to the statement of profit and loss and are not deferred.
The Group’s net obligation in respect of other long-term employee benefits is the amount of future benefit that employees have earned in return for their service in the current and previous periods. That benefit is discounted to determine its present value.
Definedcontributionplans The Group’s contributions to defined contribution plans
are recognised as an expense as and when the services are received from the employees entitling them to the contributions. The Group does not have any obligation other than the contribution made.
Share-basedpaymentarrangements The grant date fair value of options granted to
employees is recognised as an employee expense, with a corresponding increase in equity, on a straight line basis, over the vesting period, based on the Group’s estimate of equity instruments that will eventually vest. At the end of each reporting period, the Group revises its estimate of the number of equity instruments expected to vest. The impact of the revision of the original estimates, if any, is recognised in profit or loss such that the cumulative expense reflects the revised estimate, with a corresponding adjustment to the equity-settled employee benefits reserve.

SUN PHARMACEUTICAL INDUSTRIES LIMITED
156
Notes to the Consolidated Financial Statementsfor the year ended March 31, 2018
For cash-settled share-based payments, a liability is recognised for the goods or services acquired, measured initially at the fair value of the liability. At the end of each reporting period until the liability is settled, and at the date of settlement, the fair value of the liability is remeasured, with any changes in fair value recognised in profit or loss for the year.
s. Borrowingcosts Borrowing costs that are directly attributable to the
construction or production of a qualifying asset are capitalised as part of the cost of that asset. All other borrowing costs are expensed in the period in which they occur. Borrowing costs consist of interest and other costs that an entity incurs in connection with the borrowing of funds. Borrowing costs also include exchange differences to the extent regarded as an adjustment to the borrowing costs. A qualifying asset is one that necessarily takes substantial period of time to get ready for its intended use.
t. Income tax Income tax expense consists of current and deferred tax.
Income tax expense is recognised in profit or loss except to the extent that it relates to items recognised in OCI or directly in equity, in which case it is recognised in OCI or directly in equity respectively. Current tax is the expected tax payable on the taxable profit for the year, using tax rates enacted or substantively enacted by the end of the reporting period, and any adjustment to tax payable in respect of previous years. Current tax assets and tax liabilities are offset where the Company has a legally enforceable right to offset and intends either to settle on a net basis, or to realise the asset and settle the liability simultaneously.
Deferred tax is recognised on temporary differences between the carrying amounts of assets and liabilities in the consolidated financial statements and the corresponding tax bases used in the computation of taxable profit. Deferred tax is not recognised for the temporary differences that arise on the initial recognition of assets or liabilities in a transaction that is not a business combination and that affects neither accounting nor taxable profits and taxable temporary differences arising upon the initial recognition of goodwill.
Deferred tax is measured at the tax rates that are expected to be applied to the temporary differences
when they reverse, based on the laws that have been enacted or substantively enacted by the end of the reporting period. Deferred tax assets and liabilities are offset if there is a legally enforceable right to set off corresponding current tax assets against current tax liabilities and the deferred tax assets and deferred tax liabilities relate to income taxes levied by the same tax authority on the Company.
A deferred tax asset is recognised to the extent that it is probable that future taxable profits will be available against which the temporary difference can be utilised. Deferred tax assets are reviewed at each reporting date and are reduced to the extent that it is no longer probable that the related tax benefit will be realised. Withholding tax arising out of payment of dividends to shareholders under the Indian income tax regulations is not considered as tax expense for the Company and all such taxes are recognised in the statement of changes in equity as part of the associated dividend payment.
Minimum Alternate Tax (‘MAT’) credit is recognised as deferred tax asset only when and to the extent there is convincing evidence that the Company will pay normal income tax during the period for which the MAT credit can be carried forward for set-off against the normal tax liability. MAT credit recognised as an asset is reviewed at each Balance Sheet date and written down to the extent the aforesaid convincing evidence no longer exists.
u. Earningspershare The Parent Company presents basic and diluted earnings
per share (“EPS”) data for its equity shares. Basic EPS is calculated by dividing the profit or loss attributable to equity shareholders of the Parent Company by the weighted average number of equity shares outstanding during the period. Diluted EPS is determined by adjusting the profit or loss attributable to equity shareholders and the weighted average number of equity shares outstanding for the effects of all dilutive potential ordinary shares, which includes all stock options granted to employees.
The number of equity shares and potentially dilutive equity shares are adjusted retrospectively for all periods presented for any share splits and bonus shares issues including for changes effected prior to the approval of the financial statements by the Board of Directors.

SUN PHARMACEUTICAL INDUSTRIES LIMITED
157
ANNUAL REPORT 2017-18
Notes to the Consolidated Financial Statementsfor the year ended March 31, 2018
CONSOLIDATED FINANCIAL STATEMENTS
v. RecentAccountingpronouncements Standards issued but not yet effective and not early
adopted by the Company
IndAS115,RevenuefromContractswithCustomers In March 2018, the Ministry of Corporate Affairs (“MCA”)
has notified Ind AS 115, Revenue from Contracts with Customers, which is effective for accounting periods beginning on or after April 01, 2018. This comprehensive new standard will supersede existing revenue recognition guidance, and requires an entity to recognise revenue to depict the transfer of promised goods or services to customers in an amount that reflects the consideration to which the entity expects to be entitled in exchange for those goods or services. The new standard also will result in enhanced disclosures about revenue, provide guidance for transactions that were not previously addressed comprehensively (for example, service revenue and contract modifications) and improve guidance for multiple-element arrangements.
Ind AS 115 is effective for annual reporting periods beginning on or after April 01, 2018.
The Group intends to adopt Ind AS 115 effective April 01, 2018, using the modified retrospective method. The Group is evaluating the requirements of the standard and its impact on its financials.
AmendmentstoIndAS7StatementofCashFlows: The amendments require entities to provide disclosure
of changes in their liabilities arising from financing activities, including both changes arising from cash flows and non-cash changes (such as foreign exchange gains or losses). The Company has provided the information for the current period in Consolidated Cash Flow Statement. Since amendment is effect from April 01, 2017, no comparative period information is required.
OtherAmendments: On March 28, 2018, the MCA, issued certain
amendments to Ind AS. The amendments relate to the following standards:
• Ind AS 40, Investment Property
• Ind AS 21, The Effects of Changes in Foreign Exchange Rates
• Ind AS 12, Income Taxes
• Ind AS 28, Investments in Associates and Joint Ventures
• Ind AS 112, Disclosure of Interests in Other Entities
The amendments are effective April 01, 2018. The Group believes that the aforementioned amendments will not materially impact the financial position, performance or the cash flows of the Group.
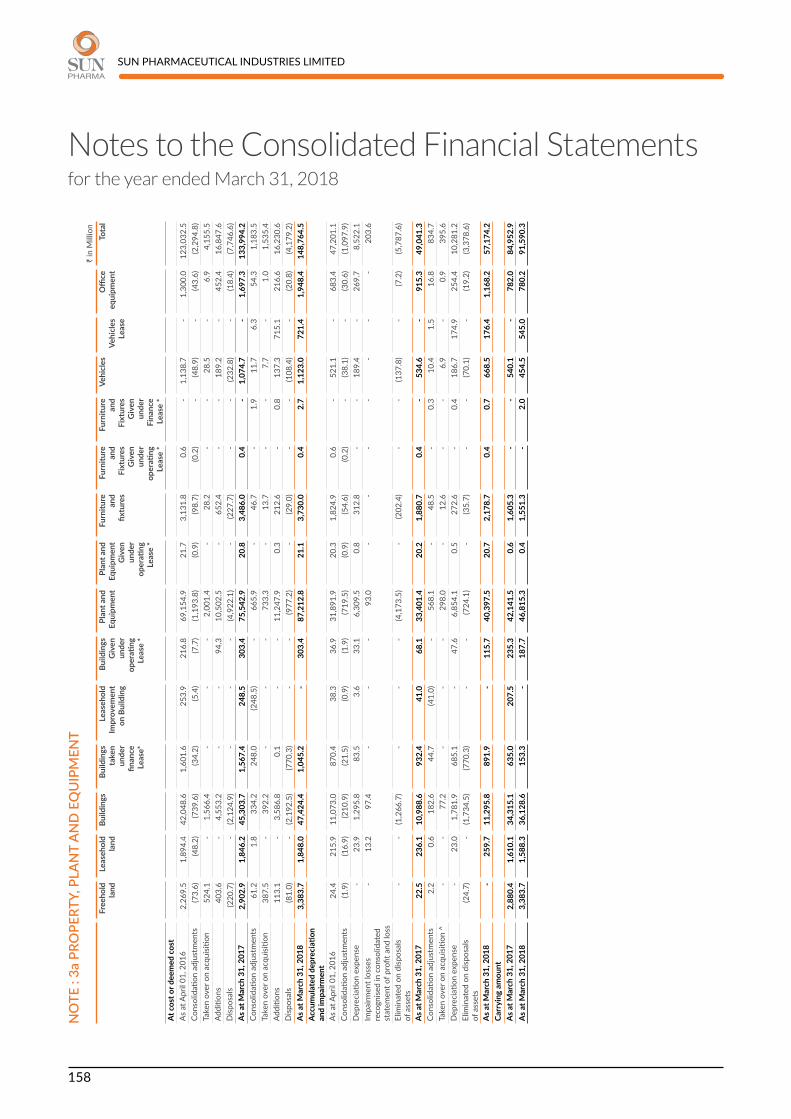
SUN PHARMACEUTICAL INDUSTRIES LIMITED
158
Notes to the Consolidated Financial Statementsfor the year ended March 31, 2018
NO
TE :
3a P
ROPE
RTY,
PLA
NT
AN
D E
QU
IPM
ENT
` in
Mill
ion
Fre
ehol
d la
nd
Lea
seho
ld
land
B
uild
ings
B
uild
ings
ta
ken
unde
r fin
ance
Le
ase*
Lea
seho
ld
Impr
ovem
ent
on B
uild
ing
Bui
ldin
gs
Giv
en
unde
r op
erati
ng
Leas
e *
Pla
nt a
nd
Equi
pmen
t P
lant
and
Eq
uipm
ent
Giv
en
unde
r op
erati
ng
Leas
e *
Fur
nitu
re
and
fixtu
res
Fur
nitu
re
and
Fixt
ures
G
iven
un
der
oper
ating
Le
ase
*
Fur
nitu
re
and
Fixt
ures
G
iven
un
der
Fina
nce
Leas
e *
Veh
icle
s
Vehi
cles
Le
ase
Offi
ce
equi
pmen
t To
tal
At c
ost o
r dee
med
cos
tA
s at
Apr
il 01
, 201
6 2
,269
.5
1,8
94.4
4
2,04
8.6
1,6
01.6
2
53.9
2
16.8
6
9,15
4.9
21.
7 3
,131
.8
0.6
-
1,1
38.7
-
1,3
00.0
1
23,0
32.5
Co
nsol
idati
on a
djus
tmen
ts (7
3.6)
(48.
2) (7
39.6
) (3
4.2)
(5.4
) (7
.7)
(1,1
93.8
) (0
.9)
(98.
7) (0
.2)
- (4
8.9)
- (4
3.6)
(2,2
94.8
)Ta
ken
over
on
acqu
isitio
n 5
24.1
-
1,5
66.4
-
- -
2,0
01.4
-
28.
2 -
- 2
8.5
- 6
.9
4,1
55.5
Ad
ditio
ns 4
03.6
-
4,5
53.2
-
- 9
4.3
10,
502.
5 -
652
.4
- -
189
.2
- 4
52.4
1
6,84
7.6
Disp
osal
s (2
20.7
) -
(2,1
24.9
) -
- -
(4,9
22.1
) -
(227
.7)
- -
(232
.8)
- (1
8.4)
(7,7
46.6
)A
s at M
arch
31,
201
7 2
,902
.9
1,8
46.2
4
5,30
3.7
1,5
67.4
2
48.5
3
03.4
7
5,54
2.9
20.
8 3
,486
.0
0.4
-
1,0
74.7
-
1,6
97.3
1
33,9
94.2
Co
nsol
idati
on a
djus
tmen
ts 6
1.2
1.8
3
34.2
2
48.0
(2
48.5
) -
665
.9
- 4
6.7
- 1
.9
11.
7 6
.3
54.
3 1
,183
.5
Take
n ov
er o
n ac
quisi
tion
387
.5
- 3
92.2
-
- -
733
.3
- 1
3.7
- -
7.7
-
1.0
1
,535
.4
Addi
tions
113
.1
- 3
,586
.8
0.1
-
- 1
1,24
7.9
0.3
2
12.6
-
0.8
1
37.3
7
15.1
2
16.6
1
6,23
0.6
Disp
osal
s (8
1.0)
- (2
,192
.5)
(770
.3)
- -
(977
.2)
- (2
9.0)
- -
(108
.4)
- (2
0.8)
(4,1
79.2
)A
s at M
arch
31,
201
8 3
,383
.7
1,8
48.0
4
7,42
4.4
1,0
45.2
-
303
.4
87,
212.
8 2
1.1
3,7
30.0
0
.4
2.7
1
,123
.0
721
.4
1,9
48.4
1
48,7
64.5
Ac
cum
ulat
ed d
epre
ciati
on
and
impa
irmen
tA
s at
Apr
il 01
, 201
6 2
4.4
215
.9
11,
073.
0 8
70.4
3
8.3
36.
9 3
1,89
1.9
20.
3 1
,824
.9
0.6
-
521
.1
- 6
83.4
4
7,20
1.1
Cons
olid
ation
adj
ustm
ents
(1.9
) (1
6.9)
(210
.9)
(21.
5) (0
.9)
(1.9
) (7
19.5
) (0
.9)
(54.
6) (0
.2)
- (3
8.1)
- (3
0.6)
(1,0
97.9
)D
epre
ciati
on e
xpen
se -
23.
9 1
,295
.8
83.
5 3
.6
33.
1 6
,309
.5
0.8
3
12.8
-
- 1
89.4
-
269
.7
8,5
22.1
Im
pairm
ent l
osse
s re
cogn
ised
in c
onso
lidat
ed
stat
emen
t of p
rofit
and
loss
- 1
3.2
97.
4 -
- -
93.
0 -
- -
- -
- -
203
.6
Elim
inat
ed o
n di
spos
als
of a
sset
s -
- (1
,266
.7)
- -
- (4
,173
.5)
- (2
02.4
) -
- (1
37.8
) -
(7.2
) (5
,787
.6)
As a
t Mar
ch 3
1, 2
017
22.
5 2
36.1
1
0,98
8.6
932
.4
41.
0 6
8.1
33,
401.
4 2
0.2
1,8
80.7
0
.4
- 5
34.6
-
915
.3
49,
041.
3 Co
nsol
idati
on a
djus
tmen
ts 2
.2
0.6
1
82.6
4
4.7
(41.
0) -
568
.1
- 4
8.5
- 0
.3
10.
4 1
.5
16.
8 8
34.7
Ta
ken
over
on
acqu
isitio
n ^
- -
77.
2 -
- -
298
.0
- 1
2.6
- -
6.9
-
0.9
3
95.6
D
epre
ciati
on e
xpen
se -
23.
0 1
,781
.9
685
.1
- 4
7.6
6,8
54.1
0
.5
272
.6
- 0
.4
186
.7
174
.9
254
.4
10,
281.
2 El
imin
ated
on
disp
osal
s of
ass
ets
(24.
7) -
(1,7
34.5
) (7
70.3
) -
- (7
24.1
) -
(35.
7) -
- (7
0.1)
- (1
9.2)
(3,3
78.6
)
As a
t Mar
ch 3
1, 2
018
- 2
59.7
1
1,29
5.8
891
.9
- 1
15.7
4
0,39
7.5
20.
7 2
,178
.7
0.4
0
.7
668
.5
176
.4
1,1
68.2
5
7,17
4.2
Carr
ying
am
ount
As a
t Mar
ch 3
1, 2
017
2,8
80.4
1
,610
.1
34,
315.
1 6
35.0
2
07.5
2
35.3
4
2,14
1.5
0.6
1
,605
.3
- -
540
.1
- 7
82.0
8
4,95
2.9
As a
t Mar
ch 3
1, 2
018
3,3
83.7
1
,588
.3
36,
128.
6 1
53.3
-
187
.7
46,
815.
3 0
.4
1,5
51.3
-
2.0
4
54.5
5
45.0
7
80.2
9
1,59
0.3

SUN PHARMACEUTICAL INDUSTRIES LIMITED
159
ANNUAL REPORT 2017-18
Notes to the Consolidated Financial Statementsfor the year ended March 31, 2018
CONSOLIDATED FINANCIAL STATEMENTS
NOTE : 3b OTHER INTANGIBLE ASSETS Other than internally generated
` in Million Computer
Software Trademarks and
Designs Total
At cost or deemed costAs at April 01, 2016 1,358.4 41,065.8 42,424.2 Consolidation adjustments (16.1) (1,461.4) (1,477.5)Taken over on acquisition - 3.5 3.5 Additions 99.1 15,041.3 15,140.4 Disposals (25.8) (757.0) (782.8)As at March 31, 2017 1,415.6 53,892.2 55,307.8 Consolidation adjustments 14.1 653.1 667.2 Taken over on acquisition - 550.0 550.0 Additions 332.6 8,150.8 8,483.4 Disposals (8.7) (343.2) (351.9)As at March 31, 2018 1,753.6 62,902.9 64,656.5 Accumulated amortisation and impairmentAs at April 01, 2016 701.9 15,178.6 15,880.5 Consolidation adjustments (12.1) (579.8) (591.9)Amortisation expense 237.6 3,887.8 4,125.4 Eliminated on disposals of assets (15.1) (527.7) (542.8)As at March 31, 2017 912.3 17,958.9 18,871.2 Consolidation adjustments 9.8 541.1 550.9 Amortisation expense 219.7 4,497.5 4,717.2 Eliminated on disposals of assets (8.6) (343.3) (351.9)As at March 31, 2018 1,133.2 22,654.2 23,787.4 Carrying amountAs at March 31, 2017 503.3 35,933.3 36,436.6 As at March 31, 2018 620.4 40,248.8 40,869.1
Footnotes : (a) Buildings include ` 8,620 (As at March 31, 2017: ` 8,620) towards cost of shares in a co-operative housing society and also includes ` 4.5 Million
(March 31, 2017: ` 4.5 Million) towards cost of flats not registered in the name of the Parent Company but is entitled to right of use and occupancy. (b) Excludes Assets classified as held for sale (Refer note 66). (c) Deletions / adjustments during the previous year includes refund received from authorities in respect of dismantling charges. (d) Borrowing cost capitalised during the year ` Nil (March 31, 2017: ` 110.3 Million) (e) The aggregate depreciation has been included under depreciation and amortisation expense in the statement of profit and loss. (f) For details of assets pledged as security refer note 67 and 68. * Refer note 55 ^ Refer note 76

SUN PHARMACEUTICAL INDUSTRIES LIMITED
160
Notes to the Consolidated Financial Statementsfor the year ended March 31, 2018
4. INVESTMENTS IN ASSOCIATES (NON-CURRENT)
As at March 31, 2018 As at March 31, 2017Quantity ` in Million Quantity ` in Million
Carrying amount determined using equity method of accountingUnquoted, fully paidInvestmentsinequityinstruments Medinstill LLC 1,999 1,436.4 1,999 1,110.2 Investmentsinlimitedpartnership[Refernote39(z)] Fraizer Healthcare VII, L.P. - - - 1,436.9 Versant Venture Capital V, L.P. - - - 951.4 Investmentsinlimitedliabilitypartnership Trumpcard Advisors and Finvest LLP - 444.6 - 312.5 Generic Solar Power LLP
[` 28,760 (As at March 31, 2017: ` 28,760)] - 0.0 - 0.0
Quoted, fully paid Investmentsinequityinstruments (Atcost,lessimpairmentinvalueofinvestments) scPharmaceuticals Inc. 2,167,679.0 867.6 - 794.4 Zenotech Laboratories Limited
[Shares of ` 10 each fully paid [Refer note 39 (t)] - - 16,128,078 2,463.5
Less: Impairment in value of investment - (2,463.5) 2,748.6 4,605.4
Aggregate carrying value of unquoted investments 1,881.0 3,811.0 Aggregate book value (carrying value) of quoted investments 867.6 2,463.5 Market value of quoted investment 1,745.3 570.1 Aggregate amount of impairment in value of investments in an associate
- 2,463.5
5. INVESTMENTS IN JOINT VENTURES (NON-CURRENT)
As at March 31, 2018 As at March 31, 2017Quantity ` in Million Quantity ` in Million
Carrying amount determined using equity method of accountingUnquoted, fully paidInvestmentsinequityinstruments MSD-Sun, LLC - - 10,564 0.7 S&I Ophthalmic LLC - - - 183.9 Artes Biotechnology GmbH 15,853 252.8 15,853 244.9
252.8 429.5
Aggregate carrying value of unquoted investments 252.8 429.5
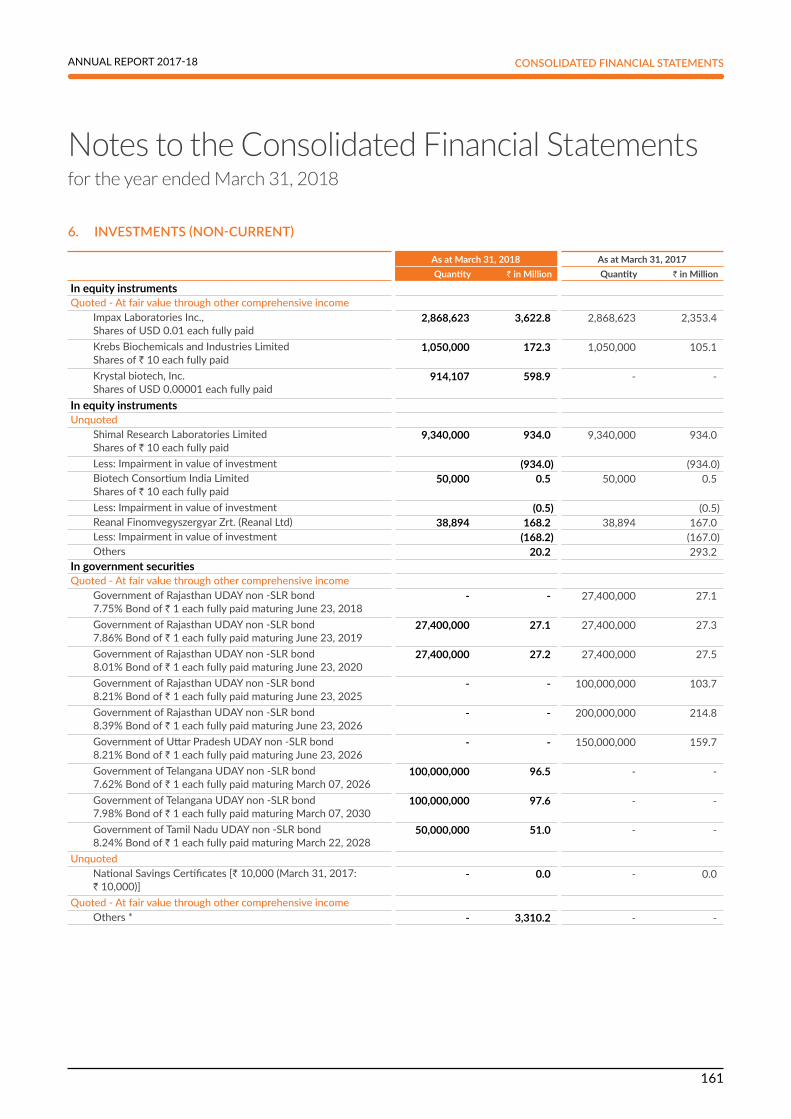
SUN PHARMACEUTICAL INDUSTRIES LIMITED
161
ANNUAL REPORT 2017-18
Notes to the Consolidated Financial Statementsfor the year ended March 31, 2018
CONSOLIDATED FINANCIAL STATEMENTS
6. INVESTMENTS (NON-CURRENT)
As at March 31, 2018 As at March 31, 2017Quantity ` in Million Quantity ` in Million
In equity instrumentsQuoted-Atfairvaluethroughothercomprehensiveincome Impax Laboratories Inc.,
Shares of USD 0.01 each fully paid 2,868,623 3,622.8 2,868,623 2,353.4
Krebs Biochemicals and Industries Limited Shares of ` 10 each fully paid
1,050,000 172.3 1,050,000 105.1
Krystal biotech, Inc. Shares of USD 0.00001 each fully paid
914,107 598.9 - -
In equity instrumentsUnquoted Shimal Research Laboratories Limited
Shares of ` 10 each fully paid 9,340,000 934.0 9,340,000 934.0
Less: Impairment in value of investment (934.0) (934.0) Biotech Consortium India Limited
Shares of ` 10 each fully paid 50,000 0.5 50,000 0.5
Less: Impairment in value of investment (0.5) (0.5) Reanal Finomvegyszergyar Zrt. (Reanal Ltd) 38,894 168.2 38,894 167.0 Less: Impairment in value of investment (168.2) (167.0) Others 20.2 293.2 In government securitiesQuoted-Atfairvaluethroughothercomprehensiveincome Government of Rajasthan UDAY non -SLR bond
7.75% Bond of ` 1 each fully paid maturing June 23, 2018 - - 27,400,000 27.1
Government of Rajasthan UDAY non -SLR bond 7.86% Bond of ` 1 each fully paid maturing June 23, 2019
27,400,000 27.1 27,400,000 27.3
Government of Rajasthan UDAY non -SLR bond 8.01% Bond of ` 1 each fully paid maturing June 23, 2020
27,400,000 27.2 27,400,000 27.5
Government of Rajasthan UDAY non -SLR bond 8.21% Bond of ` 1 each fully paid maturing June 23, 2025
- - 100,000,000 103.7
Government of Rajasthan UDAY non -SLR bond 8.39% Bond of ` 1 each fully paid maturing June 23, 2026
- - 200,000,000 214.8
Government of Uttar Pradesh UDAY non -SLR bond 8.21% Bond of ` 1 each fully paid maturing June 23, 2026
- - 150,000,000 159.7
Government of Telangana UDAY non -SLR bond 7.62% Bond of ` 1 each fully paid maturing March 07, 2026
100,000,000 96.5 - -
Government of Telangana UDAY non -SLR bond 7.98% Bond of ` 1 each fully paid maturing March 07, 2030
100,000,000 97.6 - -
Government of Tamil Nadu UDAY non -SLR bond 8.24% Bond of ` 1 each fully paid maturing March 22, 2028
50,000,000 51.0 - -
Unquoted National Savings Certificates [` 10,000 (March 31, 2017:
` 10,000)] - 0.0 - 0.0
Quoted-Atfairvaluethroughothercomprehensiveincome Others * - 3,310.2 - -

SUN PHARMACEUTICAL INDUSTRIES LIMITED
162
Notes to the Consolidated Financial Statementsfor the year ended March 31, 2018
As at March 31, 2018 As at March 31, 2017Quantity ` in Million Quantity ` in Million
In debentures/bondsQuoted-Atfairvaluethroughothercomprehensiveincome Housing Development Finance Corporation Ltd - 9.9% Non-
convertible Debentures of ` 1,000,000 each fully paid 250 253.5 250 259.4
National Highways Authority of India - 8.2% Bonds of ` 1,000 each fully paid of maturing on January 25, 2022
61,809 66.1 61,809 66.7
Power Finance Corporation Ltd (Series I) -8.2% Bonds of ` 1,000 each fully paid of maturing on February 01, 2022
142,393 152.2 142,393 153.6
Indian Railway Finance Corporation Ltd - 8/8.15% Bonds of ` 1,000 each fully paid of maturing on February 23, 2022
163,131 173.5 163,131 175.1
Investment in Bonds (various small denomination investments) - 11,340.5 - - ONGC Videsh 4.625% Regd. Notes 16,000,000 1,067.4 - - NTPC 4.375% Regd. Euro Medium Term Notes 10,000,000 661.4 - - State Bank of India 4.875% 700,000 476.1 - - Other investments - Unquoted 5,306.6 608.5
27,521.1 4,575.1
Aggregate book value (carrying value) of quoted investments 22,194.3 3,673.4 Aggregate amount of quoted investments at market value 22,194.3 3,673.4 Aggregate amount of unquoted investments before impairment 6,429.5 2,003.2 Aggregate amount of impairment in value of investments 1,102.7 1,101.5
*includes investment in various small denomination U.S Treasuries, certificates of deposits and commercial papers
7. LOANS (NON-CURRENT)` in Million
As at March 31, 2018
As at March 31, 2017
Loans to Employees/Others * Secured, considered good 10.2 20.4 Unsecured, considered good 22,414.5 677.7 Doubtful - 0.8 Less: allowance for bad and doubtful loans - (0.8)
22,424.7 698.1 * Others: Loans given to various parties at prevailing market interest rate.
8. OTHER FINANCIAL ASSETS (NON-CURRENT)` in Million
As at March 31, 2018
As at March 31, 2017
Bank deposits with more than 12 months maturity * 1.0 4,589.2 Margin money/ security against guarantees/ commitments 2.2 - Security deposits - unsecured, considered good 653.8 462.0 Derivatives designated as hedges - 67.1 Derivatives not designated as hedges 82.8 627.7 Others# 309.4 706.2
1,049.2 6,452.2 * includes deposits pledged with government authorities of ` 1.0 Million (March 31, 2017 : ` 1.6 Million) # includes receivable towards sale of manufacturing facility

SUN PHARMACEUTICAL INDUSTRIES LIMITED
163
ANNUAL REPORT 2017-18
Notes to the Consolidated Financial Statementsfor the year ended March 31, 2018
CONSOLIDATED FINANCIAL STATEMENTS
9. INCOME TAX ASSET (NET) [NON-CURRENT]` in Million
As at March 31, 2018
As at March 31, 2017
Advance income tax (net of provisions)* 31,896.6 31,250.1 31,896.6 31,250.1
* includes amount paid under protest
10. OTHER NON-CURRENT ASSETS` in Million
As at March 31, 2018
As at March 31, 2017
Capital advances 4,430.3 3,971.7 Prepaid expenses 91.0 91.1 Balances with government authorities* 1,122.1 2,058.5 Other assets 16.7 740.5
5,660.1 6,861.8 * includes amount paid under protest
11. INVENTORIES` in Million
As at March 31, 2018
As at March 31, 2017
Lower of cost and net realisable valueRaw materials and packing materials 24,360.1 21,212.3 Goods in transit 261.1 598.7
24,621.2 21,811.0
Work-in-progress 14,514.2 15,467.2
Finished goods 22,429.0 24,986.8
Stock-in-trade 6,217.1 4,614.3 Goods in transit 25.5 94.7
6,242.6 4,709.0
Stores and spares 999.0 1,350.9 Goods in transit 0.9 3.2
999.9 1,354.1
68,806.9 68,328.1
(i) Inventory write downs are accounted, considering the nature of inventory, ageing, liquidation plan and net realisable value. Write downs of inventories amounted to ` 10,437.8 Million (March 31, 2017: ` 9,174.9 Million). The changes in write downs are recognised as an expense in the consolidated statement of profit and loss.
(ii) For details of inventories pledged as security refer note 67 and 68.
(iii) The cost of inventories recognised as an expense is disclosed in notes 33, 34 and 37 and as purchases of stock-in-trade in the consolidated statement of profit and loss.

SUN PHARMACEUTICAL INDUSTRIES LIMITED
164
Notes to the Consolidated Financial Statementsfor the year ended March 31, 2018
12. INVESTMENTS (CURRENT)
As at March 31, 2018 As at March 31, 2017Quantity ` in Million Quantity ` in Million
In Government securitiesQuoted(Fairvaluethroughothercomprehensiveincome) Government of Rajasthan UDAY non -SLR bond
7.75% Bond of ` 1 each fully paid maturing June 23, 2018 27,400,000 26.9 - -
Investment in others@ 22,087.4 In equity instrumentsQuoted(Fairvaluethroughothercomprehensiveincome) FS Invt Corp Com - - 22,316 14.2 In bonds/debenturesQuoted(Fairvaluethroughothercomprehensiveincome) I Shares New York Amt Free Muni - - 6,032 43.1 SPDR Ser TR Barclays Long - - - 2.0 Investment in Bonds (various small denomination
investments) - 13,612.4 - 170.8
In mutual funds *UnquotedUnit of ` 10 each - - 3.1 Unit of ` 100 each 420.7 400.1 Unit of ` 1000 each 4,756.5 1,675.5 In equity instrumentsUnquoted 2.3 -
40,906.2 2,308.8 * Investments in mutual funds have been fair valued at closing net asset value (NAV). @ includes investment in various small denomination U.S Treasuries, certificates of deposits and commercial papers
Aggregate book value (carrying value) of quoted investments 35,726.7 230.1 Aggregate amount of quoted investments at market value 35,726.7 230.1 Aggregate amount of unquoted investments before impairment 5,179.5 2,078.7 Aggregate amount of impairment in value of investments - -
13. TRADE RECEIVABLES ` in Million
As at March 31, 2018
As at March 31, 2017
Unsecured Considered good 78,152.8 72,026.1 Considered doubtful 3,142.9 2,109.9
81,295.7 74,136.0 Less: allowance for doubtful debts (expected credit loss allowance) (3,142.9) (2,109.9)
78,152.8 72,026.1
14. CASH AND CASH EQUIVALENTS` in Million
As at March 31, 2018
As at March 31, 2017
Balance with banks In current accounts 55,137.3 49,192.3 In deposit accounts with original maturity less than 3 months 24,099.3 35,576.1 Cheques, drafts on hand 10.6 1,813.9 Cash on hand 6.5 45.7
79,253.7 86,628.0

SUN PHARMACEUTICAL INDUSTRIES LIMITED
165
ANNUAL REPORT 2017-18
Notes to the Consolidated Financial Statementsfor the year ended March 31, 2018
CONSOLIDATED FINANCIAL STATEMENTS
15. BANK BALANCES OTHER THAN DISCLOSED IN NOTE 14 ABOVE` in Million
As at March 31, 2018
As at March 31, 2017
Deposit accounts (*) 19,610.3 64,573.9 Earmarked balances with banks Unpaid dividend accounts 73.0 59.3 Balances held as margin money or security against guarantees and other commitments (*) 356.8 147.2
20,040.1 64,780.4 (*) Other bank balances include deposits amounting to ` 115.8 Million (March 31, 2017: ` 25,700.8 Million) and margin monies amounting to ` 327.7 Million (March 31, 2017: ` 70.2 Million) which have an original maturity of more than 12 months.
16. LOANS (CURRENT)` in Million
As at March 31, 2018
As at March 31, 2017
Loans to related parties Unsecured, considered good - 454.0 Considered doubtful (Refer notes 69 and 75) - 512.0 Less: allowance for doubtful loans - (512.0)
- 454.0 Loans to Employees/Others* Secured, considered good 18.2 8.7 Unsecured, considered good 896.1 9,728.1 Considered doubtful 4.5 4.5 Less: allowance for doubtful loans (4.5) (4.5)
914.3 9,736.8 914.3 10,190.8
* Others: Loans given to various parties at prevailing market interest rate.
17. OTHER FINANCIAL ASSETS (CURRENT)` in Million
As at March 31, 2018
As at March 31, 2017
Interest accrued on investments/balances with banks 316.0 599.9 Interest accrued and due on loans (Refer note 69) Considered good - 0.2 Considered doubtful - 214.9 Less: allowance for doubtful interest accrued and due on loans - (214.9)
- 0.2 Security deposits (unsecured, considered good) 107.1 70.9 Derivatives not designated as hedges 700.7 627.7 Refund due from government authorities 2,079.4 - Others * 1,592.3 959.8
4,795.5 2,258.5 * As at March 31, 2018 and as at March 31, 2017 includes receivable towards sale of assets/manufacturing facilities.
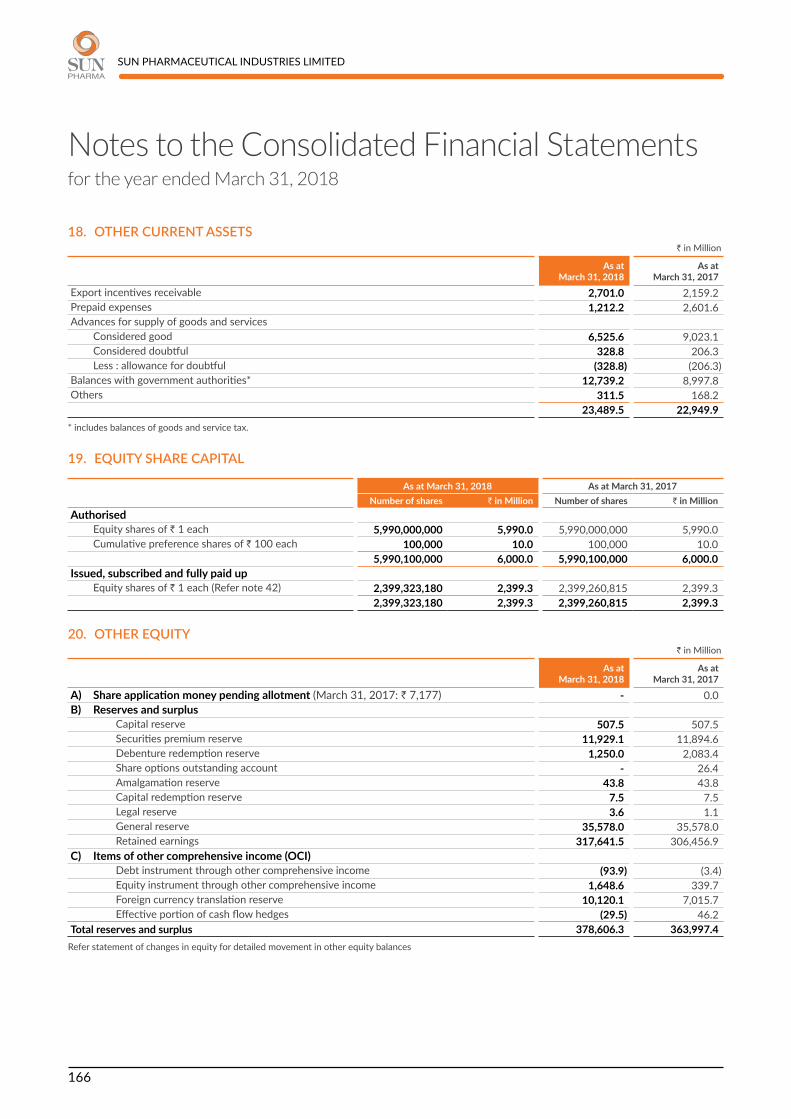
SUN PHARMACEUTICAL INDUSTRIES LIMITED
166
Notes to the Consolidated Financial Statementsfor the year ended March 31, 2018
18. OTHER CURRENT ASSETS` in Million
As at March 31, 2018
As at March 31, 2017
Export incentives receivable 2,701.0 2,159.2 Prepaid expenses 1,212.2 2,601.6 Advances for supply of goods and services Considered good 6,525.6 9,023.1 Considered doubtful 328.8 206.3 Less : allowance for doubtful (328.8) (206.3)Balances with government authorities* 12,739.2 8,997.8 Others 311.5 168.2
23,489.5 22,949.9 * includes balances of goods and service tax.
19. EQUITY SHARE CAPITAL
As at March 31, 2018 As at March 31, 2017 Number of shares ` in Million Number of shares ` in Million
Authorised Equity shares of ` 1 each 5,990,000,000 5,990.0 5,990,000,000 5,990.0 Cumulative preference shares of ` 100 each 100,000 10.0 100,000 10.0
5,990,100,000 6,000.0 5,990,100,000 6,000.0 Issued, subscribed and fully paid up Equity shares of ` 1 each (Refer note 42) 2,399,323,180 2,399.3 2,399,260,815 2,399.3
2,399,323,180 2,399.3 2,399,260,815 2,399.3
20. OTHER EQUITY` in Million
As at March 31, 2018
As at March 31, 2017
A) Share application money pending allotment (March 31, 2017: ` 7,177) - 0.0 B) Reserves and surplus Capital reserve 507.5 507.5 Securities premium reserve 11,929.1 11,894.6 Debenture redemption reserve 1,250.0 2,083.4 Share options outstanding account - 26.4 Amalgamation reserve 43.8 43.8 Capital redemption reserve 7.5 7.5 Legal reserve 3.6 1.1 General reserve 35,578.0 35,578.0 Retained earnings 317,641.5 306,456.9 C) Items of other comprehensive income (OCI) Debt instrument through other comprehensive income (93.9) (3.4) Equity instrument through other comprehensive income 1,648.6 339.7 Foreign currency translation reserve 10,120.1 7,015.7 Effective portion of cash flow hedges (29.5) 46.2 Total reserves and surplus 378,606.3 363,997.4
Refer statement of changes in equity for detailed movement in other equity balances

SUN PHARMACEUTICAL INDUSTRIES LIMITED
167
ANNUAL REPORT 2017-18
Notes to the Consolidated Financial Statementsfor the year ended March 31, 2018
CONSOLIDATED FINANCIAL STATEMENTS
Nature and purpose of each reserveCapital reserve - During amalgamation / merger / acquisition, the excess of net assets taken, over the consideration paid, if any, is treated as capital reserve.
Securities premium reserve - The amount received in excess of face value of the equity shares is recognised in securities premium reserve. In case of equity-settled share based payment transactions, the difference between fair value on grant date and nominal value of share is accounted as securities premium reserve. This reserve is utilised in accordance with the provisions of the Companies Act, 2013.
Debenture redemption reserve - The Company is required to create a debenture redemption reserve out of the profits which is available for payment of dividend. This reserve will be transferred to retained earning on redemption of debentures.
Share options outstanding account - The fair value of the equity settled share based payment transactions is recognised to share options outstanding account.
Amalgamation reserve - The reserve was created pursuant to scheme of amalgamation in earlier years.
Capital redemption reserve - The Company has recognised capital redemption reserve on buyback of equity shares from its retained earnings. The amount in capital redemption reserve is equal to nominal amount of the equity shares bought back.
Legal reserve - The reserve has been created by an overseas subsidiary in compliance with requirements of local laws.
General reserve: The reserve arises on transfer portion of the net profit pursuant to the earlier provisions of the Companies Act, 1956.
Mandatory transfer to general reserve is not required under the Companies Act, 2013.
Debt instrument through OCI - This represents the cumulative gain and loss arising on fair valuation of debt instruments measured through other comprehensive income. This amount will be reclassified to profit and loss account on derecognition of debt instrument.
Equity instrument through OCI - The Company has elected to recognise changes in the fair value of certain investment in equity instrument in other comprehensive income. This amount will be reclassified to retained earnings on derecognition of equity instrument.
Foreign currency translation reserve - Exchange differences relating to the translation of the results and net assets of the Group’s foreign operations from their functional currencies to the Group’s presentation currency (i.e. ₹) are recognised directly in the other comprehensive income and accumulated in foreign currency translation reserve. Exchange difference in the foreign currency translation reserve are reclassified to profit or loss on the disposal of the foreign operation.
Effective portion of cash flow hedges - The cash flow hedging reserve represents the cumulative effective portion of gains or losses arising on changes in fair value of designated portion of hedging instruments entered into for cash flow hedges. The cumulative gain or loss arising on the changes of the fair value of the designated portion of the hedging instruments that are recognised and accumulated under the cash flow hedges reserve will be reclassified to profit or loss only when the hedged transaction affects the profit or loss, or included as a basis adjustment to the non-financial hedged item.
21. BORROWINGS (NON-CURRENT)` in Million
As at March 31, 2018
As at March 31, 2017
Redeemable non-convertible debentures (unsecured) - 5,000.0 Term loans From banks (unsecured) 15,538.7 7,498.2 From banks (secured) 1,035.3 1,085.2 From department of biotechnology (secured) 108.2 108.2 Long-term maturities of finance lease obligations (secured) 1,033.4 662.5 Deferred payment liabilities (unsecured - at amortised cost) 5.3 6.7
17,720.9 14,360.8 (Refer notes 55 and 67 for borrowings [Non-Current])

SUN PHARMACEUTICAL INDUSTRIES LIMITED
168
Notes to the Consolidated Financial Statementsfor the year ended March 31, 2018
22. OTHER FINANCIAL LIABILITIES (NON-CURRENT)` in Million
As at March 31, 2018
As at March 31, 2017
Interest accrued 9.1 - Other financial liabilities* 307.4 1,048.0
316.5 1,048.0 * includes contractual and expected milestone obligations.
23. PROVISIONS (NON-CURRENT)` in Million
As at March 31, 2018
As at March 31, 2017
Employee benefits (Refer note 56) 2,219.0 3,146.3 Others (Refer note 61) 1,825.6 8,964.8
4,044.6 12,111.1
24. OTHER NON-CURRENT LIABILITIES` in Million
As at March 31, 2018
As at March 31, 2017
Deferred revenue 120.7 105.7 Others 145.3 153.4
266.0 259.1
25. BORROWINGS (CURRENT)` in Million
As at March 31, 2018
As at March 31, 2017
Loans repayable on demand From banks (secured) - 198.1 From banks (unsecured) 23,810.6 47,046.5 From others (unsecured) - 1,001.4 Other loans From banks (unsecured) 16,881.9 - Commercial paper (unsecured) 39,104.5 18,303.2
79,797.0 66,549.2 (Refer note 68 for Borrowings [current])
26. TRADE PAYABLES` in Million
As at March 31, 2018
As at March 31, 2017
Dues to micro and small enterprises 125.8 123.8 Others 47,536.2 43,830.1
47,662.0 43,953.9
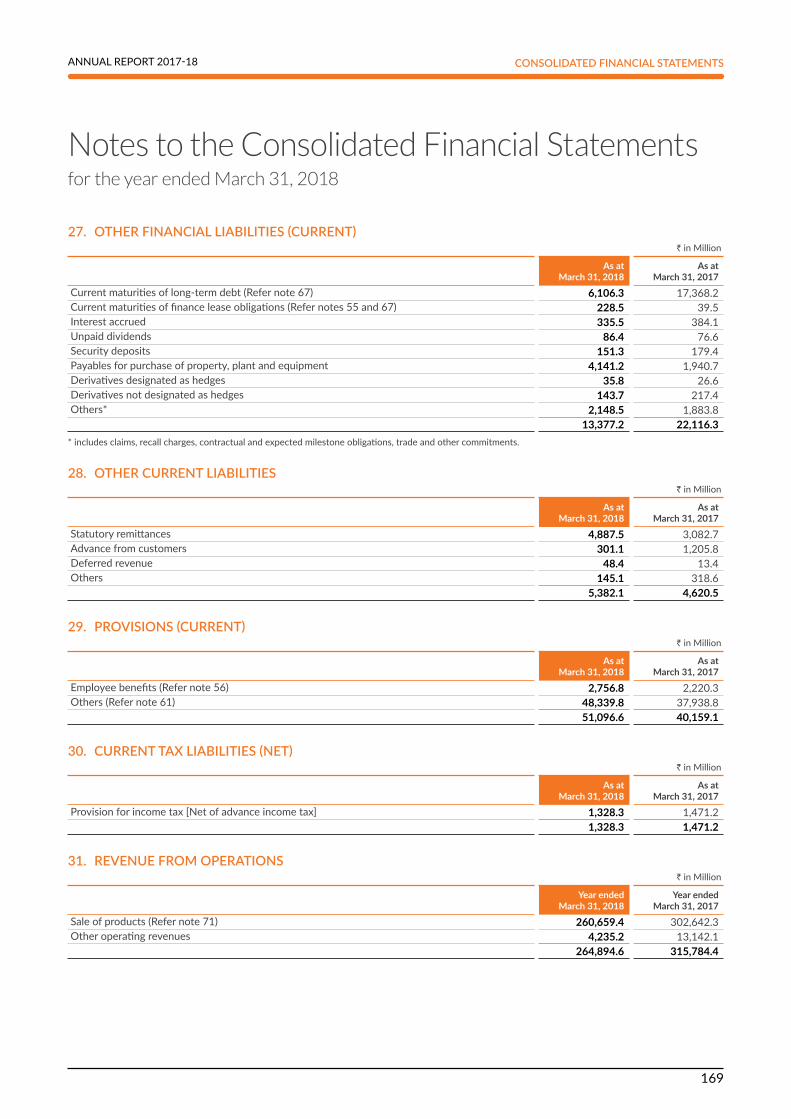
SUN PHARMACEUTICAL INDUSTRIES LIMITED
169
ANNUAL REPORT 2017-18
Notes to the Consolidated Financial Statementsfor the year ended March 31, 2018
CONSOLIDATED FINANCIAL STATEMENTS
27. OTHER FINANCIAL LIABILITIES (CURRENT) ` in Million
As at March 31, 2018
As at March 31, 2017
Current maturities of long-term debt (Refer note 67) 6,106.3 17,368.2 Current maturities of finance lease obligations (Refer notes 55 and 67) 228.5 39.5 Interest accrued 335.5 384.1 Unpaid dividends 86.4 76.6 Security deposits 151.3 179.4 Payables for purchase of property, plant and equipment 4,141.2 1,940.7 Derivatives designated as hedges 35.8 26.6 Derivatives not designated as hedges 143.7 217.4 Others* 2,148.5 1,883.8
13,377.2 22,116.3 * includes claims, recall charges, contractual and expected milestone obligations, trade and other commitments.
28. OTHER CURRENT LIABILITIES` in Million
As at March 31, 2018
As at March 31, 2017
Statutory remittances 4,887.5 3,082.7 Advance from customers 301.1 1,205.8 Deferred revenue 48.4 13.4 Others 145.1 318.6
5,382.1 4,620.5
29. PROVISIONS (CURRENT)` in Million
As at March 31, 2018
As at March 31, 2017
Employee benefits (Refer note 56) 2,756.8 2,220.3 Others (Refer note 61) 48,339.8 37,938.8
51,096.6 40,159.1
30. CURRENT TAX LIABILITIES (NET)` in Million
As at March 31, 2018
As at March 31, 2017
Provision for income tax [Net of advance income tax] 1,328.3 1,471.2 1,328.3 1,471.2
31. REVENUE FROM OPERATIONS` in Million
Year ended March 31, 2018
Year ended March 31, 2017
Sale of products (Refer note 71) 260,659.4 302,642.3 Other operating revenues 4,235.2 13,142.1
264,894.6 315,784.4

SUN PHARMACEUTICAL INDUSTRIES LIMITED
170
Notes to the Consolidated Financial Statementsfor the year ended March 31, 2018
32. OTHER INCOME` in Million
Year ended March 31, 2018
Year ended March 31, 2017
Interest income on: Bank deposits at amortised cost 1,399.0 1,602.3 Loans at amortised cost 921.4 769.3 Investments carried at amortised cost - 73.4 Investments in debt instruments at fair value through other comprehensive income 553.9 61.0 Investments carried at fair value through profit or loss - 9.7 Other financial assets carried at amortised cost 921.3 852.7 Others (includes interest on income tax refund) 1,402.0 343.3
5,197.6 3,711.7 Dividend income on investments 371.6 420.5 Net gain on sale of financial assets measured at fair value through profit or loss 234.0 479.3 Net gain / (loss) on sale of financial assets measured at fair value through other comprehensive income
(7.5) -
Net gain arising on financial assets measured at fair value through profit or loss 1,236.6 72.2 Net gain on disposal of property, plant and equipment and other intangible assets 31.3 18.7 Sundry balances written back, net 170.6 618.5 Insurance claims 258.6 134.4 Lease rental and hire charges 296.1 249.4 Gain on disposal of an associate entity - 201.3 Miscellaneous income 598.7 325.5
8,387.6 6,231.5
33. COST OF MATERIALS CONSUMED` in Million
Year ended March 31, 2018
Year ended March 31, 2017
Raw materials and packing materials Inventories at the beginning of the year 21,811.0 20,495.8 Inventories acquired on acquisition (Refer note 76) 17.5 171.0 Purchases during the year 47,327.2 52,565.2 Foreign currency translation difference 91.5 (174.9) Inventories at the end of the year (24,621.2) (21,811.0)
44,626.0 51,246.1
34. CHANGES IN INVENTORIES OF FINISHED GOODS, STOCK-IN-TRADE AND WORK-IN-PROGRESS` in Million
Year ended March 31, 2018
Year ended March 31, 2017
Inventories at the beginning of the year 45,163.0 42,786.5 Foreign currency translation difference 329.8 (339.8)Inventories at the end of the year (43,185.8) (45,163.0)
2,307.0 (2,716.3)

SUN PHARMACEUTICAL INDUSTRIES LIMITED
171
ANNUAL REPORT 2017-18
Notes to the Consolidated Financial Statementsfor the year ended March 31, 2018
CONSOLIDATED FINANCIAL STATEMENTS
35. EMPLOYEE BENEFITS EXPENSE` in Million
Year ended March 31, 2018
Year ended March 31, 2017
Salaries, wages and bonus 47,082.9 43,229.1 Contribution to provident and other funds * 3,903.7 3,001.0 Share based payments to employees (1.0) 32.3 Staff welfare expenses 2,684.9 2,760.6
53,670.5 49,023.0 * includes gratuity expense of ` 450.4 Million (March 2017 ` 279.0 Million)
36. FINANCE COSTS` in Million
Year ended March 31, 2018
Year ended March 31, 2017
Interest expense for financial liabilities carried at amortised cost 4,227.8 2,854.6 Interest expense others 21.5 10.9 Exchange differences regarded as an adjustment to borrowing costs 660.6 694.7 Unwinding of discounts on provisions 265.8 437.8
5,175.7 3,998.0
37. OTHER EXPENSES` in Million
Year ended March 31, 2018
Year ended March 31, 2017
Consumption of materials, stores and spare parts 7,511.5 6,531.0 Conversion and other manufacturing charges 6,499.4 6,408.8 Power and fuel 5,599.7 5,250.9 Rent 1,120.8 1,237.8 Rates and taxes 3,237.2 3,022.3 Insurance 1,312.9 1,068.2 Selling and distribution 13,661.6 20,736.5 Commission on sale 1,350.0 1,130.0 Repairs and maintenance 4,263.1 4,097.0 Printing and stationery 612.3 859.7 Travelling and conveyance 5,190.2 5,250.1 Freight outward and handling charges 3,633.9 3,339.9 Communication 801.9 726.1 Provision/write off for doubtful trade receivables/advances 1,095.9 341.8 Professional, legal and consultancy 16,153.1 14,642.6 Donations 254.8 32.1 Loss on sale/write off of property, plant and equipment and intangible assets, net 232.9 127.5 Net (gain) / loss on foreign currency transactions 82.5 (3,730.7)Excise duty on sales 739.2 2,703.0 (Decrease)/increase of excise duty on inventories (729.7) (5.2)Payment to auditors (net of input credit, where applicable) 196.1 232.9 Impairment in value of investments (725.7) 6.8 Impairment of property, plant and equipment and goodwill other intangible assets 26.7 203.6 Miscellaneous expenses 8,775.7 10,348.6
80,896.0 84,561.3

SUN PHARMACEUTICAL INDUSTRIES LIMITED
172
Notes to the Consolidated Financial Statementsfor the year ended March 31, 2018
38. RESEARCH AND DEVELOPMENT EXPENDITURE INCLUDED IN THE CONSOLIDATED STATEMENT OF PROFIT AND LOSS
` in Million
Year ended March 31, 2018
Year ended March 31, 2017
Salaries, wages and bonus 6,062.5 5,270.2 Contribution to provident and other funds 277.2 406.3 Staff welfare expenses 250.9 228.0 Consumption of materials, stores and spare parts 3,516.6 3,976.2 Power and fuel 322.1 366.3 Rates and taxes 349.6 318.0 Rent 89.1 92.9 Insurance 15.2 41.1 Repairs and maintenance 524.5 583.2 Printing and stationery 41.0 40.2 Travelling and conveyance 182.6 209.6 Communication 39.4 57.1 Professional, legal and consultancy 6,787.5 7,939.4 Loss on sale/write off of property, plant and equipment and intangible assets, net 4.8 (0.4)Miscellaneous expenses 2,206.4 1,930.4
20,669.4 21,458.5 Less: Miscellaneous income 2.8 11.2 Receipts from research activities 145.7 423.0
148.5 434.2 20,520.9 21,024.3
39 a) List of entities included in the Consolidated Financial Statements is as under:
Particulars Country of IncorporationProportion of ownership interest
for the year ended
March 31, 2018 March 31, 2017ParentCompanySun Pharmaceutical Industries LimitedDirectSubsidiaries
1 Green Eco Development Centre Limited India 100.00% 100.00%2 Sun Pharmaceutical (Bangladesh) Limited Bangladesh 72.50% 72.50%3 Sun Pharmaceutical Industries, Inc. United States of America 100.00% 100.00%4 Sun Farmaceutica do Brasil Ltda. Brazil 100.00% 100.00%5 Sun Pharma De Mexico S.A. DE C.V. Mexico 75.00% 75.00%6 SPIL De Mexico S.A. DE C.V. Mexico 100.00% 100.00%7 Sun Pharmaceutical Peru S.A.C. Peru 99.33% 99.33%8 OOO "Sun Pharmaceutical Industries" Limited Russia 100.00% 100.00%9 Sun Pharma De Venezuela, C.A. Venezuela 100.00% 100.00%10 Sun Pharma Laboratories Limited India 100.00% 100.00%11 Faststone Mercantile Company Private Limited India 100.00% 100.00%12 Neetnav Real Estate Private Limited India 100.00% 100.00%13 Realstone Multitrade Private Limited India 100.00% 100.00%14 Skisen Labs Private Limited India 100.00% 100.00%15 Sun Pharma Holdings Mauritius 100.00% 100.00%16 Softdeal Trading Company Private Limited India 100.00% 100.00%17 Ranbaxy Pharmacie Generiques France 100.00% 100.00%18 Ranbaxy Drugs Limited India -
(Refer note n)100.00%

SUN PHARMACEUTICAL INDUSTRIES LIMITED
173
ANNUAL REPORT 2017-18
Notes to the Consolidated Financial Statementsfor the year ended March 31, 2018
CONSOLIDATED FINANCIAL STATEMENTS
Particulars Country of IncorporationProportion of ownership interest
for the year ended
March 31, 2018 March 31, 201719 Vidyut Investments Limited India -
(Refer note n)100.00%
20 Gufic Pharma Limited India -(Refer note n)
100.00%
21 Ranbaxy (Malaysia) SDN. BHD. Malaysia 90.74% 71.22%22 Ranbaxy Nigeria Limited Nigeria 85.31% 85.31%23 Sun Pharma (Netherlands) B.V. (Formerly known as Ranbaxy
(Netherlands) B.V. )Netherlands 100.00% 100.00%
24 Foundation for Disease Elimination and Control of India India 100.00% 100.00%25 Zenotech Laboratories Limited India 57.56%
(Refer note t & u) -
26 Sun Pharma Medisales Private Limited (Formerly known as Solrex Pharmaceuticals Company)
India -(Refer note n)
100.00% (Refer note n)
StepdownSubsidiaries27 Chattem Chemicals Inc. United States of America 100.00% 100.00%28 The Taro Development Corporation United States of America 100.00% 100.00%29 Alkaloida Chemical Company Zrt. Hungary 99.99% 99.99%30 Sun Pharmaceuticals UK Limited United Kingdom 100.00%
(Refer note w)100.00%
31 Sun Pharmaceutical Industries (Australia) Pty Limited Australia 100.00% 100.00%32 Aditya Acquisition Company Ltd. Israel 100.00% 100.00%33 Sun Pharmaceutical Industries (Europe) B.V. Netherlands 100.00% 100.00%34 Sun Pharmaceuticals Italia S.R.L. Italy 100.00% 100.00%35 Sun Pharmaceuticals Spain, S.L.U. Spain - -
(Refer note g)36 Sun Pharmaceuticals Germany GmbH Germany 100.00% 100.00%37 Sun Pharmaceuticals France France 100.00% 100.00%38 Sun Pharma Global FZE United Arab Emirates 100.00% 100.00%39 Sun Pharmaceuticals SA (Pty) Ltd South Africa 100.00% 100.00%40 Sun Global Canada Pty. Ltd. Canada 100.00% 100.00%41 Sun Pharma Philippines, Inc. Philippines 100.00% 100.00%42 Sun Pharmaceuticals Korea Ltd. South Korea 100.00% 100.00%43 Sun Global Development FZE United Arab Emirates 100.00% 100.00%44 Caraco Pharmaceuticals Private Limited India 100.00% 100.00%45 Sun Pharma Japan Ltd. Japan 100.00% 100.00%46 Sun Pharma Healthcare FZE United Arab Emirates 100.00% 100.00%47 Morley & Company, Inc. United States of America 100.00% 100.00%48 Sun Laboratories FZE United Arab Emirates 100.00% 100.00%49 Taro Pharmaceutical Industries Ltd. (Taro) Israel (Refer note b) 74.82% 72.81%50 Taro Pharmaceuticals Inc. Canada 74.82% 72.81%51 Taro Pharmaceuticals U.S.A., Inc. United States of America 74.82% 72.81%52 Taro Pharmaceuticals North America, Inc. Cayman Islands, British
West Indies74.82% 72.81%
53 Taro Pharmaceuticals Europe B.V. Netherlands 74.82% 72.81%54 Taro Pharmaceuticals Ireland Ltd Ireland 74.82%
(Refer note x)72.81%
55 Taro International Ltd. Israel 74.82% 72.81%56 Taro Pharmaceuticals (UK) Ltd. United Kingdom 74.82%
(Refer note f)72.81%
57 Taro Hungary Intellectual Property Licensing Limited Liability Company
Hungary - -(Refer note h)
58 3 Skyline LLC United States of America 74.82% 72.81%59 One Commerce Drive LLC United States of America 74.82% 72.81%

SUN PHARMACEUTICAL INDUSTRIES LIMITED
174
Notes to the Consolidated Financial Statementsfor the year ended March 31, 2018
Particulars Country of IncorporationProportion of ownership interest
for the year ended
March 31, 2018 March 31, 201760 Taro Pharmaceutical Laboratories Inc. United States of America 74.82% 72.81%61 Taro Pharmaceuticals Canada, Ltd. Canada 74.82% 72.81%62 Taro Pharmaceutical India Private Limited India -
(Refer note i)72.81%
(Refer note i)63 Alkaloida Sweden AB Sweden 100.00% 100.00%64 Dusa Pharmaceuticals, Inc. United States of America 100.00% 100.00%65 Dusa Pharmaceuticals New York, Inc. United States of America - -
(Refer note j)66 Sirius Laboratories Inc United States of America - -
(Refer note k)67 Mutual Pharmaceutical Company Inc. United States of America 100.00% 100.00%68 Dungan Mutual Associates, LLC United States of America 100.00% 100.00%69 URL PharmPro, LLC United States of America 100.00% 100.00%70 2 Independence Way LLC United States of America 100.00% 100.00%71 Thallion Pharmaceutical Inc., United States of America - -
(Refer note l)72 Universal Enterprises Private Limited India 100.00% 100.00%73 Sun Pharma Switzerland Ltd. Switzerland 100.00% 100.00%74 Sun Pharma East Africa Limited Kenya 100.00% 100.00%75 Pharmalucence, Inc. United States of America 100.00% 100.00%76 PI Real Estate Ventures, LLC United States of America 100.00% 100.00%77 Sun Pharma ANZ Pty Ltd (Formerly known as Ranbaxy Australia
Pty Ltd)Australia 100.00% 100.00%
78 Ranbaxy Farmaceutica Ltda. Brazil 100.00% 100.00%79 Ranbaxy Pharmaceuticals Canada Inc. Canada 100.00% 100.00%80 Sun Pharma Egypt Limited LLC (Formerly known as Ranbaxy
Egypt Ltd)Egypt 100.00% 100.00%
81 Rexcel Egypt LLC Egypt 100.00% 100.00%82 Office Pharmaceutique Industriel Et Hospitalier France 100.00% 100.00%83 Basics GmbH Germany 100.00% 100.00%84 Ranbaxy GmbH Germany 100.00% 100.00%85 Ranbaxy Ireland Limited Ireland 100.00% 100.00%86 Ranbaxy Italia S.P.A. Italy 100.00% 100.00%87 Sun Pharmaceutical Industries S.A.C. (Formerly known as
Ranbaxy - PRP (Peru) S.A.C.)Peru 100.00% 100.00%
88 Ranbaxy (Poland) SP. Z O.O. Poland 100.00% 100.00%89 Terapia SA Romania 96.81% 96.70%90 AO Ranbaxy (Formerly known as ZAO Ranbaxy) Russia 100.00% 100.00%91 Ranbaxy South Africa (Pty) Ltd South Africa 100.00% 100.00%92 Ranbaxy Pharmaceuticals (Pty) Ltd South Africa 100.00% 100.00%93 Be-Tabs Investments (Pty) Ltd South Africa 100.00% 100.00%94 Sonke Pharmaceuticals Proprietary Limited South Africa 70.00% 70.00%95 Laboratorios Ranbaxy, S.L.U. Spain 100.00% 100.00%96 Ranbaxy (U.K.) Limited United Kingdom 100.00% 100.00%97 Ranbaxy Holdings (U.K.) Limited United Kingdom 100.00% 100.00%98 Ranbaxy Europe Limited United Kingdom 100.00%
(Refer note y)100.00%
99 Ranbaxy Inc. United States of America 100.00% 100.00%100 Ranbaxy Pharmaceuticals, Inc. United States of America -
(Refer note v)100.00%
101 Ranbaxy (Thailand) Co., Ltd. Thailand 100.00% 100.00%102 Ohm Laboratories, Inc. United States of America 100.00% 100.00%103 Ranbaxy Laboratories, Inc. United States of America -
(Refer note v)100.00%
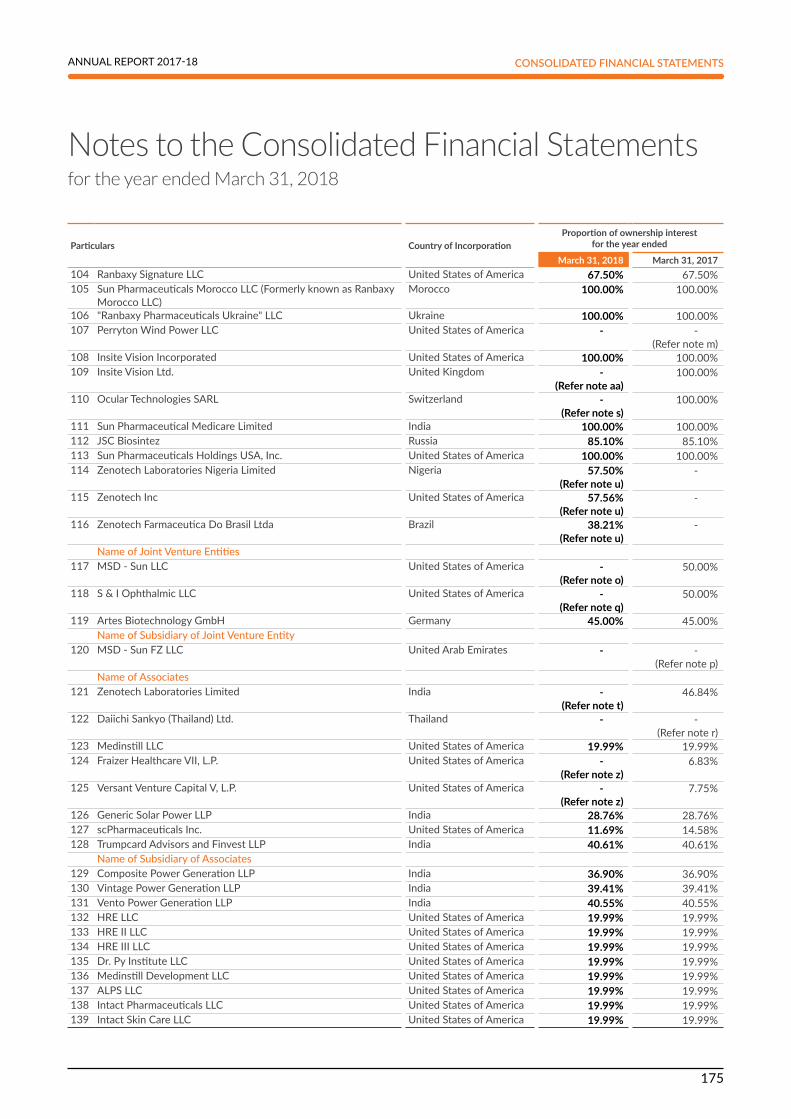
SUN PHARMACEUTICAL INDUSTRIES LIMITED
175
ANNUAL REPORT 2017-18
Notes to the Consolidated Financial Statementsfor the year ended March 31, 2018
CONSOLIDATED FINANCIAL STATEMENTS
Particulars Country of IncorporationProportion of ownership interest
for the year ended
March 31, 2018 March 31, 2017104 Ranbaxy Signature LLC United States of America 67.50% 67.50%105 Sun Pharmaceuticals Morocco LLC (Formerly known as Ranbaxy
Morocco LLC) Morocco 100.00% 100.00%
106 "Ranbaxy Pharmaceuticals Ukraine" LLC Ukraine 100.00% 100.00%107 Perryton Wind Power LLC United States of America - -
(Refer note m)108 Insite Vision Incorporated United States of America 100.00% 100.00%109 Insite Vision Ltd. United Kingdom -
(Refer note aa)100.00%
110 Ocular Technologies SARL Switzerland - (Refer note s)
100.00%
111 Sun Pharmaceutical Medicare Limited India 100.00% 100.00%112 JSC Biosintez Russia 85.10% 85.10%113 Sun Pharmaceuticals Holdings USA, Inc. United States of America 100.00% 100.00%114 Zenotech Laboratories Nigeria Limited Nigeria 57.50%
(Refer note u) -
115 Zenotech Inc United States of America 57.56% (Refer note u)
-
116 Zenotech Farmaceutica Do Brasil Ltda Brazil 38.21% (Refer note u)
-
NameofJointVentureEntities117 MSD - Sun LLC United States of America -
(Refer note o)50.00%
118 S & I Ophthalmic LLC United States of America -(Refer note q)
50.00%
119 Artes Biotechnology GmbH Germany 45.00% 45.00%NameofSubsidiaryofJointVentureEntity
120 MSD - Sun FZ LLC United Arab Emirates - -(Refer note p)
Name of Associates121 Zenotech Laboratories Limited India -
(Refer note t)46.84%
122 Daiichi Sankyo (Thailand) Ltd. Thailand - -(Refer note r)
123 Medinstill LLC United States of America 19.99% 19.99%124 Fraizer Healthcare VII, L.P. United States of America -
(Refer note z)6.83%
125 Versant Venture Capital V, L.P. United States of America -(Refer note z)
7.75%
126 Generic Solar Power LLP India 28.76% 28.76%127 scPharmaceuticals Inc. United States of America 11.69% 14.58%128 Trumpcard Advisors and Finvest LLP India 40.61% 40.61%
NameofSubsidiaryofAssociates129 Composite Power Generation LLP India 36.90% 36.90%130 Vintage Power Generation LLP India 39.41% 39.41%131 Vento Power Generation LLP India 40.55% 40.55%132 HRE LLC United States of America 19.99% 19.99%133 HRE II LLC United States of America 19.99% 19.99%134 HRE III LLC United States of America 19.99% 19.99%135 Dr. Py Institute LLC United States of America 19.99% 19.99%136 Medinstill Development LLC United States of America 19.99% 19.99%137 ALPS LLC United States of America 19.99% 19.99%138 Intact Pharmaceuticals LLC United States of America 19.99% 19.99%139 Intact Skin Care LLC United States of America 19.99% 19.99%

SUN PHARMACEUTICAL INDUSTRIES LIMITED
176
Notes to the Consolidated Financial Statementsfor the year ended March 31, 2018
b Following are the details of the Group’s holding in Taro:
March 31, 2018 March 31, 2017Voting power 83.21% 81.87%Beneficial ownership 74.82% 72.81%
c In respect of entities at Sr. Nos. 4 to 8, 90,106, 107, 108, 109, 110, 112 and 119 the reporting date is as of December 31, 2017 and different from the reporting date of the Parent Company. Adjustments have been made for significant transactions of these subsidiaries for the periods from January 01, 2017 to March 31, 2017 and January 01, 2018 to March 31, 2018, on the basis of their management accounts for the said periods.
d Entities at Sr. No. 25 and 114 to 116 have been acquired during the year ended March 31, 2018.
e Foundation for Disease Elimination and Control of India (FDEC), a wholly owned subsidiary incorporated in India on September 21, 2016 by the Company as part of its Corporate Social Responsibility (CSR) initiative. FDEC has entered into an MOU with Indian Council of Medical Research (ICMR) and Madhya Pradesh State Government to undertake the Mandla Malaria Elimination Demonstration Project with a goal to eliminate Malaria in the state. FDEC is a Section 8 company not considered for consolidation since it can apply its income for charitable purposes only and can raise funds/contribution independently.
f Taro Pharmaceuticals (UK) Limited is under Liquidation.
g With effect from March 02, 2017, Sun Pharmaceuticals Spain, S.L.U. has been liquidated.
h With effect from February 16, 2017, Taro Hungary Intellectual Property Licensing Limited Liability Company has been liquidated.
i Taro Pharmaceutical India Private Limited has been liquidated on April 04, 2017.
j With effect from August 16, 2016 Dusa Pharmaceuticals New York, Inc. has been dissolved.
k With effect from February 22, 2017 Sirius Laboratories Inc. has been dissolved.
l With effect from March 16, 2017, Thallion Pharmaceutical Inc. was acquired and merged with Taro Pharmaceuticals Inc.
m With effect from April 07, 2016 Perryton Wind Power LLC has been liquidated.
n During the year 2016-17 , Solrex Pharmaceuticals Company, a partnership firm was converted into company which is known as Sun Pharma Medisales Private Limited. The Board of Directors of the Company at their meeting held on November 10, 2016 and the shareholders and unsecured creditors of the Company at their respective meetings held on June 20, 2017 approved the proposed scheme of arrangement u/s 230 to 232 of the Companies Act, 2013 for amalgamation of Sun Pharma Medisales Private Limited, Ranbaxy Drugs Limited, Gufic Pharma Limited and Vidyut Investments Limited into the Company with effect from April 01, 2017, the appointed date. On completion of all the formalities of the merger of the above companies with the Company , the said merger became effective September 08, 2017.
o With effect from June 19, 2017 MSD - Sun LLC is liquidated
p MSD-Sun FZ LLC has been deregistered with effect from September 14, 2015 having deregistration certificate dated December 25, 2016.
q With effect from December 21, 2017 S & I Ophthalmic LLC has been dissolved.
r Daiichi Sankyo (Thailand) Ltd.’s shares were sold as per agreement dated May 13, 2016.
s With effect from April 01, 2017 vide certificate dated August 09, 2017 Ocular Technologies SARL has been merged with Sun Pharma Switzerland Limited.
t With effect from July 27, 2017 Zenotech Laboratories Limited has ceased to be an associate and has become a subsidiary of Sun Pharmaceutical Industries Limited.
u Books of accounts and other related records/documents of the overseas subsidiaries of the Zenotech Laboratories Limited were missing and due to non-availability of those records/information, Zenotech Laboratories Limited is unable to prepare consolidated accounts.
v With effect from August 01, 2017, Ranbaxy Pharmaceuticals, Inc. and Ranbaxy Laboratories, Inc. have been merged with Sun Pharmaceutical Industries Inc.
w With effect from May 20, 2018 Sun Pharmaceuticals UK Limited has been dissolved.

SUN PHARMACEUTICAL INDUSTRIES LIMITED
177
ANNUAL REPORT 2017-18
Notes to the Consolidated Financial Statementsfor the year ended March 31, 2018
CONSOLIDATED FINANCIAL STATEMENTS
x Taro Pharmaceuticals Ireland Limited is under Liquidation.
y Ranbaxy Europe Limited is under Liquidation.
z Fraizer Healthcare VII, L.P. and Versant Venture Capital V, L.P. were treated as associates till March 31, 2017 and are now being classified and measured as investments at fair value through profit and loss.
aa With effect from April 25, 2017 Insite Vision Ltd. has been dissolved.
ab Significant Accounting Policies and other Notes to these Consolidated Financial Statements are intended to serve as a means of informative disclosure and a guide for better understanding of the consolidated position of the Group. Recognising this purpose, the Group has disclosed only such policies and notes from the individual financial statements which fairly represent the needed disclosures. Lack of homogeneity and other similar considerations made it desirable to exclude some of them, which in the opinion of the management, could be better viewed when referred from the individual financial statements.
40 CONTINGENT LIABILITIES (TO THE EXTENT NOT PROVIDED FOR)` in Million
As at March 31, 2018
As at March 31, 2017
A) Contingent liabilities I) Claims against the Group not acknowledged as debts 855.4 1,147.6 II) Liabilities disputed - appeals filed with respect to:
Income tax on account of disallowances / additions 59,274.1 56,712.6 Sales tax on account of rebate / classification 122.5 45.7 Excise duty on account of valuation / cenvat credit 2,290.4 4,548.1 Environment cess 23.3 23.3 ESIC contribution on account of applicability 130.5 132.8 Drug Price Equalisation Account [DPEA] on account of demand towards unintended benefit, enjoyed by the Group
3,488.2 3,488.2
Demand by JDGFT for import duty with respect to import alleged to be in excess of entitlement as per the Advanced Licence Scheme
17.4 16.7
Fine imposed for anti-competitive settlement agreement by European Commission 830.7 715.4 Octroi demand on account of rate difference 171.0 171.0 Other matters - State Electricity Board, Punjab Land Preservation Act related matters etc. 77.4 126.0 Note: Includes interest till date of demand, wherever applicable.
III) Legal proceedings The Company and/or its subsidiaries are involved in various legal proceedings including product liability, contracts, employment claims, anti-trust and other regulatory matters relating to conduct of its business. Most of these legal proceedings involve various complex issues on account of which, making a reliable estimate of the expected financial effect is not always attainable and involves significant uncertainties. To the extent that the Company concludes that a liability is probable and estimable based on the status of these cases, advice of the counsel, management assessment of the likely damages etc. the Company records a provision in the financial statements. The Company carries product liability insurance / is contractually indemnified by the manufacturer, for an amount it believes is sufficient for its needs. In respect of other claims, the Company believes, these claims do not constitute material litigation matters and with its meritorious defences the ultimate disposition of these matters are not expected to have material adverse effect on its Financial Statements.Footnote: Future cash outflows in respect of the above matters are determinable only on receipt of judgements / decisions pending at various forums / authorities.
B) Guarantees given by the bankers on behalf of the Group 2,850.6 2,250.5

SUN PHARMACEUTICAL INDUSTRIES LIMITED
178
Notes to the Consolidated Financial Statementsfor the year ended March 31, 2018
41 COMMITMENTS` in Million
As at March 31, 2018
As at March 31, 2017
I) Estimated amount of contracts remaining to be executed on capital account (net of advances) 19,579.2 6,089.7 II) Derivative related commitments - forward foreign exchange contracts [Refer note 47(c)]III) Lease related commitments [Refer note 55]IV) Investment related commitments 2,873.3 1,715.2 V) Letters of credit for imports 1,300.3 2,362.0
42 DISCLOSURES RELATING TO SHARE CAPITALi Rights, preferences and restrictions attached to equity shares The equity shares of the Parent Company, having par value of ` 1 per share, rank pari passu in all respects including voting rights and
entitlement to dividend.
ii Reconciliation of the number of shares and amount outstanding at the beginning and at the end of reporting period
Year ended March 31, 2018 Year ended March 31, 2017Number of Shares ` in Million Number of Shares ` in Million
Equitysharesof`1eachOpening balance 2,399,260,815 2,399.3 2,406,605,118 2,406.6 Add: shares allotted to employees on exercise of employee stock options (excluding shares held by ESOP trust) (* : ` 62,365)
62,365 * 0.0 155,697 0.2
Less: buy-back of shares (Refer note 65) - - (7,500,000) (7.5)Closing balance 2,399,323,180 2,399.3 2,399,260,815 2,399.3
iii The movement of shares issued to ESOP Trust at face value is as follows:
Year ended March 31, 2018 Year ended March 31, 2017Number of Shares ` in Million Number of Shares ` in Million
Equitysharesof`1eachOpening balance (March 31, 2018 : * : ` 30,366) 30,366 * 0.0 123,381 0.1 Less: shares allotted by ESOP trust on exercise of employee stock options (March 31, 2018 : * : ` 30,366)
(30,366) * (0.0) (93,015) (0.1)
Closing balance (March 31, 2017 : ` 30,366) - - 30,366 0.0
iv 1,035,581,955 (upto March 31, 2017: 1,035,581,955) equity shares of ` 1 each have been allotted as fully paid up bonus shares during the period of five years immediately preceding the date at which the Balance Sheet is prepared.
v 334,956,764 (upto March 31, 2017: 334,956,764) equity shares of ` 1 each have been allotted, pursuant to scheme of amalgamation, without payment being received in cash during the period of five years immediately preceding the date at which the Balance Sheet is prepared.
vi Refer note 58 for number of employee stock options against which equity shares are to be issued by the Company / ESOP Trust upon vesting and exercise of those stock options.
vii 7,500,000 (upto March 31, 2017: 7,500,000) equity shares of ` 1 each have been bought back during the period of five years immediately preceding the date at which the Balance Sheet is prepared. The shares bought back in the previous year were cancelled immediately. (Refer note 65)

SUN PHARMACEUTICAL INDUSTRIES LIMITED
179
ANNUAL REPORT 2017-18
Notes to the Consolidated Financial Statementsfor the year ended March 31, 2018
CONSOLIDATED FINANCIAL STATEMENTS
viii Equity shares held by each shareholder holding more than 5 percent equity shares in the Parent Company are as follows:
Name of Shareholders As at March 31, 2018 As at March 31, 2017
Number of Shares held % of Holding Number of
Shares held % of Holding
Dilip Shantilal Shanghvi 230,285,690 9.6 230,285,690 9.6 Viditi Investment Pvt. Ltd. 200,846,362 8.4 200,846,362 8.4 Tejaskiran Pharmachem Industries Pvt. Ltd. 194,820,971 8.1 194,820,971 8.1 Family Investment Pvt. Ltd. 182,437,880 7.6 182,437,880 7.6 Quality Investments Pvt. Ltd. 182,379,237 7.6 182,379,237 7.6 Life Insurance Corporation of India* 145,302,877 6.1 106,329,652 4.4
*Shareholding has been consolidated on the basis of PAN as per SEBI circular dated December 19, 2017
43 RESEARCH AND DEVELOPMENT EXPENDITURE` in Million
Year ended March 31, 2018
Year ended March 31, 2017
Revenue, net (excluding depreciation) [Refer note 38] 20,520.9 21,024.3 Capital 1,819.4 1,679.3 Total 22,340.3 22,703.6
44 CATEGORIES OF FINANCIAL INSTRUMENTS
` in Million As at March 31, 2018
Fair value through profit or loss
Fair value through other
comprehensive income
Amortised cost
Financial assets Investments Equity instruments - quoted - 4,394.0 - Equity instruments - unquoted 22.5 - - Bonds/debentures - quoted - 27,803.1 - Government securities - quoted - 326.3 - Government securities - unquoted (` 10,000) - - 0.0 Mutual Funds - unquoted 5,177.2 - - Others - quoted - 25,397.6 - Others - unquoted 5,306.6 - - Loans to employees/others - - 23,339.0 Trade receivables - - 78,152.8 Bank deposits with more than 12 months maturity - - 1.0 Margin money/ security against guarantees/ commitments - - 2.2 Security deposits - - 760.9 Cash and cash equivalents - - 79,253.7 Bank balances other than Cash and cash equivalents - - 20,040.1 Interest accrued on investments / balances with banks - - 316.0 Refund due from Government authorities 2,079.4 Other financial assets - - 1,901.7 Mandatorily measured : Derivatives not designated as hedges 783.5 - - Total 11,289.8 57,921.0 205,846.8

SUN PHARMACEUTICAL INDUSTRIES LIMITED
180
Notes to the Consolidated Financial Statementsfor the year ended March 31, 2018
` in Million As at March 31, 2018
Fair value through profit or loss
Fair value through other
comprehensive income
Amortised cost
Financial liabilities Borrowings - - 97,517.9 Current maturities of long-term debt and finance lease obligations - - 6,334.8 Trade payables - - 47,662.0 Interest accrued - - 344.6 Unpaid dividends - - 86.4 Trade/security deposits - - 151.3 Payable for purchase of property, plant and equipment - - 4,141.2 Derivatives designated as hedges - 35.8 - Other financial liabilities - - 2,455.9 Mandatorily measured : Derivatives not designated as hedges 143.7 - - Total 143.7 35.8 158,694.1
` in Million As at March 31, 2017
Fair value through profit or loss
Fair value through other
comprehensive income
Amortised cost
Financial assets Investments Equity instruments - quoted - 2,472.7 - Equity instruments - unquoted 293.2 - - Bonds/debentures - quoted - 870.7 - Government securities - quoted - 560.1 - Government securities - unquoted (` 10,000) - - 0.0 Mutual Funds - unquoted 2,078.7 - - Others - unquoted 608.5 - - Loans to related parties - - 454.0 Loans to employees/others - - 10,434.9 Trade receivables - - 72,026.1 Bank deposits with more than 12 months maturity - - 4,589.2 Security deposits - - 532.9 Cash and cash equivalents - - 86,628.0 Bank balances other than Cash and cash equivalents - - 64,780.4 Interest accrued on investments / balances with banks - - 599.9 Interest accrued on investments loans - - 0.2 Derivatives designated as hedges - 67.1 - Other financial assets - - 1,666.0 Mandatorily measured : Derivatives not designated as hedges 1,255.4 - - Total 4,235.8 3,970.6 241,711.6

SUN PHARMACEUTICAL INDUSTRIES LIMITED
181
ANNUAL REPORT 2017-18
Notes to the Consolidated Financial Statementsfor the year ended March 31, 2018
CONSOLIDATED FINANCIAL STATEMENTS
` in Million As at March 31, 2017
Fair value through profit or loss
Fair value through other
comprehensive income
Amortised cost
Financial liabilities Borrowings - - 80,910.0 Current maturities of long-term debt and finance lease obligations - - 17,407.7 Trade payables - - 43,953.9 Interest accrued - - 384.1 Unpaid dividends - - 76.6 Trade/security deposits - - 179.4 Payable for purchase of property, plant and equipment - - 1,940.7 Derivatives designated as hedges - 26.6 - Other financial liabilities - - 2,931.8 Mandatorily measured : Derivatives not designated as hedges 217.4 - - Total 217.4 26.6 147,784.2
45 FAIR VALUE HIERARCHYFinancial assets and liabilities measured at fair value on a recurring basis
` in MillionAs at March 31, 2018
Level 1 Level 2 Level 3Financial assets Investments Equity instruments - quoted 4,394.0 - - Equity instruments - unquoted - - 22.5 Bonds/debentures - quoted 27,803.1 - - Government securities - quoted 326.3 - - Mutual Funds - unquoted 5,177.2 - - Others - quoted 25,397.6 - - Others - unquoted - 5,306.6 - Derivatives not designated as hedges - 783.5 -
63,098.2 6,090.1 22.5 Financial liabilities Derivatives not designated as hedges - 143.7 - Derivatives designated as hedges - 35.8 -
- 179.5 -
` in MillionAs at March 31, 2017
Level 1 Level 2 Level 3Financial assets Investments Equity instruments - quoted 2,472.7 - - Equity instruments - unquoted - - 293.2 Bonds/debentures - quoted 870.7 - - Government securities - quoted 560.1 - - Mutual Funds - unquoted 2,078.7 - - Others - unquoted - - 608.5 Derivatives not designated as hedges - 1,255.4 - Derivatives designated as hedges - 67.1 -
5,982.2 1,322.5 901.7 Financial liabilities Derivatives not designated as hedges - 217.4 - Derivatives designated as hedges - 26.6 -
- 244.0 -

SUN PHARMACEUTICAL INDUSTRIES LIMITED
182
Notes to the Consolidated Financial Statementsfor the year ended March 31, 2018
Level 1 inputs are quoted prices (unadjusted) in active markets for identical assets or liabilities that the entity can access at the measurement date. Level 2 inputs are inputs, other than quoted prices included within Level 1, that are observable for the asset or liability, either directly or indirectly.Level 3 inputs are unobservable inputs for the asset or liability.
The investments included in Level 3 of fair value hierarchy have been valued using the cost approach to arrive at their fair value. The cost of unquoted investments approximates the fair value because there is wide range of possible fair value measurements and the costs represents estimate of fair value within that range.
The investments which are fair valued through other comprehensive income, are not held for trading. Instead, they are held for medium or long-term strategic purpose. Upon the application of Ind AS 109, the Group has chosen to designate these investments in equity instruments as at fair value through other comprehensive income as the management believe that this provides a more meaningful presentation for medium or long-term strategic investments, than reflecting changes in fair value immediately in consolidated statement of profit and loss.
There were no transfers between Level 1 and 2 in the periods.
The management considers that the carrying amount of financial assets and financial liabilities carried at amortised cost approximates their fair value.
Reconciliation of Level 3 fair value measurements` in Million
Year ended March 31, 2018
Year ended March 31, 2017
Unlisted shares valued at fair value Balance at the beginning of the year 901.7 544.1 Purchases 7.4 462.8 Foreign currency translation difference - (98.4) Others including disposal / settlements / charged to consolidated statement of profit and loss
(Refer note 39 (z)) (886.6) (6.8)
Balance at the end of the year 22.5 901.7
46 CAPITAL MANAGEMENT
a) The Group’s capital management objectives are: - to ensure the Group’s ability to continue as a going concern; and - to provide an adequate return to shareholders through optimisation of debts and equity balance. The Group monitors capital on the basis of the carrying amount of debt less cash and cash equivalents, bank balances (excluding earmarked balances with banks) and current investments as presented on the face of the consolidated financial statements. The Group’s objective for capital management is to maintain an optimum overall financial structure.
` in Million
As at March 31, 2018
As at March 31, 2017
Debt (includes non-current borrowings, current borrowings, current maturities of finance lease obligations and current maturities of long-term debt)
103,852.7 98,317.7
Less : cash and cash equivalents, bank balances (excluding earmarked balances with banks) and current investments
139,770.2 153,510.7
Net debt (35,917.5) (55,193.0)Total equity, including reserves 419,847.2 404,305.3 Net debt to total equity ratio N.A. N.A.

SUN PHARMACEUTICAL INDUSTRIES LIMITED
183
ANNUAL REPORT 2017-18
Notes to the Consolidated Financial Statementsfor the year ended March 31, 2018
CONSOLIDATED FINANCIAL STATEMENTS
b) Dividend on equity shares paid during the year` in Million
Year ended March 31, 2018
Year ended March 31, 2017
DividendonequitysharesFinal dividend for the year ended March 31, 2017 of ` 3.5 (year ended March 31, 2016: ` 1.0) per fully paid share
7,977.4 2,406.8
Dividend distribution tax on above 1,624.0 490.0
Dividendsnotrecognisedattheendofthereportingperiod The Board of Directors at it’s meeting held on May 25, 2018 have recommended payment of final dividend of ` 2 per share of face value of ` 1 each for the year ended March 31, 2018. The same amounts to ` 4,798.7 Million.
This proposed dividend is subject to the approval of shareholders in the ensuing annual general meeting and hence not recognised as liability.
47 FINANCIAL RISK MANAGEMENT The Group’s activities expose it to a variety of financial risks, including market risk, credit risk and liquidity risk. The Group’s risk
management assessment and policies and processes are established to identify and analyse the risks faced by the Group, to set appropriate risk limits and controls, and to monitor such risks and compliance with the same. Risk assessment and management policies and processes are reviewed regularly to reflect changes in market conditions and the Group’s activities.
Credit risk Credit risk is the risk of financial loss to the Group, if a customer or counterparty to a financial instrument fails to meet its contractual
obligations and arises principally from the Group’s receivables from customers, loans and investments. Credit risk is managed through credit approvals, establishing credit limits and continuously monitoring the creditworthiness of counterparty to which the Group grants credit terms in the normal course of business.
Investments The Group limits its exposure to credit risk by generally investing in liquid securities and only with counterparties that have a good
credit rating. The Group does not expect significant any losses from non-performance by these counter-parties, and does not have any significant concentration of exposures to specific industry sectors or specific country risks.
Trade receivables The Group has used expected credit loss (ECL) model for assessing the impairment loss. For this purpose, the Group uses a provision
matrix to compute the expected credit loss amount. The provision matrix takes into account external and internal risk factors and historical data of credit losses from various customers.
` in Million
As at March 31, 2018
As at March 31, 2017
Financial assets for which loss allowances is measured using the expected credit loss Trade receivables less than 180 days 75,974.0 69,889.0 180 - 365 days 2,781.2 1,729.0 beyond 365 days 2,540.5 2,518.0 Total 81,295.7 74,136.0

SUN PHARMACEUTICAL INDUSTRIES LIMITED
184
Notes to the Consolidated Financial Statementsfor the year ended March 31, 2018
` in Million
Year ended March 31, 2018
Year ended March 31, 2017
MovementintheexpectedcreditlossallowanceontradereceivablesBalance at the beginning of the year 2,109.9 1,955.7 Addition 1,358.0 318.1 Recoveries (325.0) (163.9)Balance at the end of the year 3,142.9 2,109.9
Other than trade receivables, the Group has no significant class of financial assets that is past due but not impaired. The Group has recognised an allowance of ` 4.5 Million (March 31, 2017 : ` 732.2 Million) against a past due loan including interest.
Liquidity risk Liquidity risk is the risk that the Group will not be able to meet its financial obligations as they become due. The Group manages its liquidity risk by ensuring, as far as possible, that it will always have sufficient liquidity to meet its liabilities when due, under both normal and stressed conditions, without incurring unacceptable losses or risk to the Group’s reputation.
The Group had unutilised working capital lines from banks of ` 47,081.4 Million as on March 31, 2018, ` 62,162.2 Million as on March 31, 2017.
The table below provides details regarding the contractual maturities of undiscounted significant financial liabilities as at March 31, 2018:
` in Million
Less than 1 year 1 - 3 years More than 3 years Total As at March 31, 2018
Non derivative Borrowings 87,043.5 13,796.2 3,936.8 104,776.5 Trade payables 47,662.0 - - 47,662.0 Other financial liabilities 6,862.9 316.5 - 7,179.4
141,568.4 14,112.7 3,936.8 159,617.9 Derivatives 179.5 - - 179.5
The table below provides details regarding the contractual maturities of undiscounted significant financial liabilities as at March 31, 2017:
` in Million
Less than 1 year 1 - 3 years More than 3 years Total As at March 31, 2017
Non derivative Borrowings 84,178.8 12,881.4 1,482.4 98,542.6 Trade payables 43,953.9 - - 43,953.9 Other financial liabilities 4,464.6 1,048.0 - 5,512.6
132,597.3 13,929.4 1,482.4 148,009.1 Derivatives 244.0 - - 244.0
Market risk Market risk is the risk of loss of future earnings, fair values or future cash flows that may result from adverse changes in market rates and prices (such as interest rates, foreign currency exchange rates and commodity prices) or in the price of market risk-sensitive instruments as a result of such adverse changes in market rates and prices. Market risk is attributable to all market risk-sensitive financial instruments, all foreign currency receivables and payables and all short term and long-term debt. The Group is exposed to market risk primarily related to foreign exchange rate risk, interest rate risk and the market value of its investments. Thus, the Group’s exposure to market risk is a function of investing and borrowing activities and revenue generating and operating activities in foreign currencies.
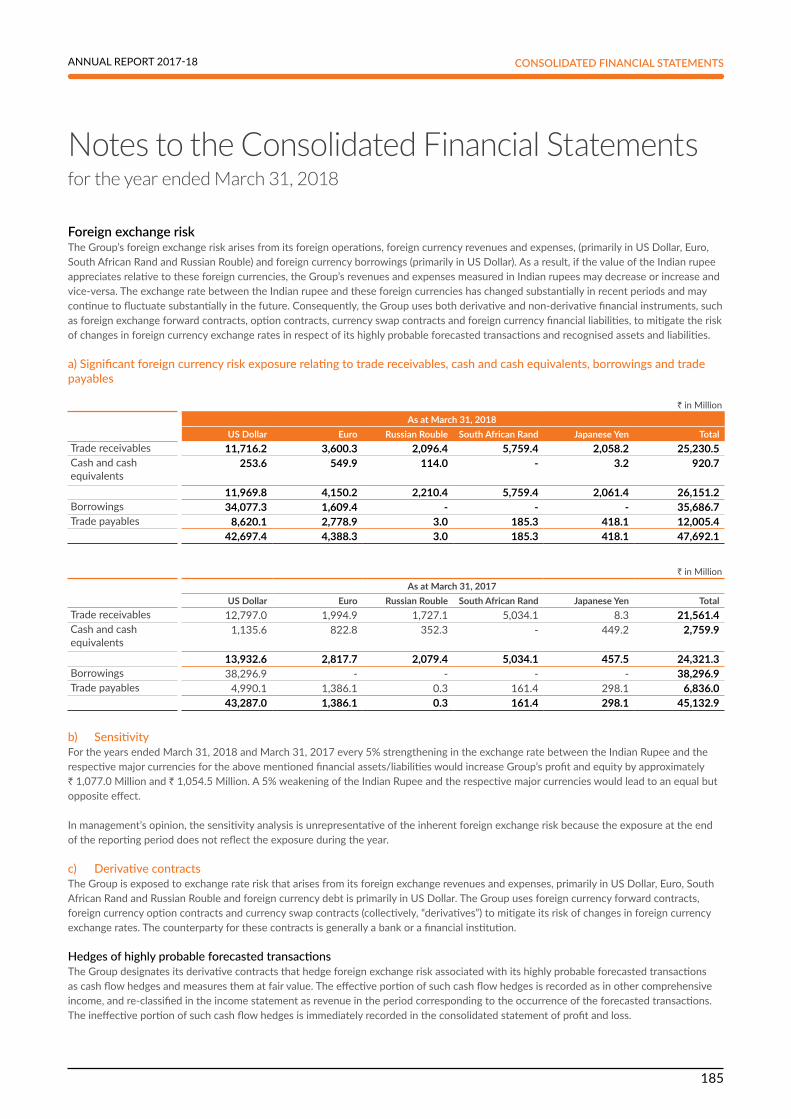
SUN PHARMACEUTICAL INDUSTRIES LIMITED
185
ANNUAL REPORT 2017-18
Notes to the Consolidated Financial Statementsfor the year ended March 31, 2018
CONSOLIDATED FINANCIAL STATEMENTS
Foreign exchange risk The Group’s foreign exchange risk arises from its foreign operations, foreign currency revenues and expenses, (primarily in US Dollar, Euro, South African Rand and Russian Rouble) and foreign currency borrowings (primarily in US Dollar). As a result, if the value of the Indian rupee appreciates relative to these foreign currencies, the Group’s revenues and expenses measured in Indian rupees may decrease or increase and vice-versa. The exchange rate between the Indian rupee and these foreign currencies has changed substantially in recent periods and may continue to fluctuate substantially in the future. Consequently, the Group uses both derivative and non-derivative financial instruments, such as foreign exchange forward contracts, option contracts, currency swap contracts and foreign currency financial liabilities, to mitigate the risk of changes in foreign currency exchange rates in respect of its highly probable forecasted transactions and recognised assets and liabilities.
a)Significantforeigncurrencyriskexposurerelatingtotradereceivables,cashandcashequivalents,borrowingsandtradepayables
` in MillionAs at March 31, 2018
US Dollar Euro Russian Rouble South African Rand Japanese Yen TotalTrade receivables 11,716.2 3,600.3 2,096.4 5,759.4 2,058.2 25,230.5 Cash and cash equivalents
253.6 549.9 114.0 - 3.2 920.7
11,969.8 4,150.2 2,210.4 5,759.4 2,061.4 26,151.2 Borrowings 34,077.3 1,609.4 - - - 35,686.7 Trade payables 8,620.1 2,778.9 3.0 185.3 418.1 12,005.4
42,697.4 4,388.3 3.0 185.3 418.1 47,692.1
` in MillionAs at March 31, 2017
US Dollar Euro Russian Rouble South African Rand Japanese Yen TotalTrade receivables 12,797.0 1,994.9 1,727.1 5,034.1 8.3 21,561.4 Cash and cash equivalents
1,135.6 822.8 352.3 - 449.2 2,759.9
13,932.6 2,817.7 2,079.4 5,034.1 457.5 24,321.3 Borrowings 38,296.9 - - - - 38,296.9 Trade payables 4,990.1 1,386.1 0.3 161.4 298.1 6,836.0
43,287.0 1,386.1 0.3 161.4 298.1 45,132.9
b) Sensitivity For the years ended March 31, 2018 and March 31, 2017 every 5% strengthening in the exchange rate between the Indian Rupee and the respective major currencies for the above mentioned financial assets/liabilities would increase Group’s profit and equity by approximately ` 1,077.0 Million and ` 1,054.5 Million. A 5% weakening of the Indian Rupee and the respective major currencies would lead to an equal but opposite effect.
In management’s opinion, the sensitivity analysis is unrepresentative of the inherent foreign exchange risk because the exposure at the end of the reporting period does not reflect the exposure during the year.
c) Derivativecontracts The Group is exposed to exchange rate risk that arises from its foreign exchange revenues and expenses, primarily in US Dollar, Euro, South African Rand and Russian Rouble and foreign currency debt is primarily in US Dollar. The Group uses foreign currency forward contracts, foreign currency option contracts and currency swap contracts (collectively, “derivatives”) to mitigate its risk of changes in foreign currency exchange rates. The counterparty for these contracts is generally a bank or a financial institution.
Hedgesofhighlyprobableforecastedtransactions The Group designates its derivative contracts that hedge foreign exchange risk associated with its highly probable forecasted transactions as cash flow hedges and measures them at fair value. The effective portion of such cash flow hedges is recorded as in other comprehensive income, and re-classified in the income statement as revenue in the period corresponding to the occurrence of the forecasted transactions. The ineffective portion of such cash flow hedges is immediately recorded in the consolidated statement of profit and loss.

SUN PHARMACEUTICAL INDUSTRIES LIMITED
186
Notes to the Consolidated Financial Statementsfor the year ended March 31, 2018
In respect of the aforesaid hedges of highly probable forecasted transactions, the Group has recorded a loss of ` 75.7 Million for the year ended March 2018 and gain of ` 46.2 Million for year ended March 31, 2017 in other comprehensive income. The Group also recorded as a component of revenue, gain of ` 47.6 Million for year ended March 31, 2018 and loss of ` 559.7 Million for year ended March 31, 2017 due to occurrence of forecasted sale transaction.
Changes in the fair value of forward contracts and option contracts that economically hedge monetary assets and liabilities in foreign currencies, and for which no hedge accounting is applied, are recognised in the consolidated statement of profit and loss. The changes in fair value of the forward contracts and option contracts, as well as the foreign exchange gains and losses relating to the monetary items, are recognised in the consolidated statement of profit and loss.
The following table gives details in respect of the notional amount of outstanding foreign exchange derivative contracts:Amount in Million
Currency Buy / Sell Cross Currency As at March 31, 2018
As at March 31, 2017
Derivatives designated as hedges Forward contracts ZAR Sell USD - USD 22.0 Forward Contracts USD Buy JPY USD 31.7 USD 19.5 Derivatives not designated as hedges Forward contracts USD Buy INR USD 18.2 USD 22.5 Forward contracts AUD Sell USD USD 8.2 USD 1.3 Forward contracts RUB Sell USD USD 5.0 USD 12.0 Forward contracts GBP Sell USD USD 2.8 - Forward contracts ZAR Sell USD USD 21.0 - Forward contracts CAD Sell USD USD 3.6 - Currency cum interest rate swaps USD Buy INR USD 50.0 USD 50.0 Currency options USD Buy INR USD 100.0 USD 100.0 Interest rate swaps USD Buy INR USD 150.0 USD 150.0 Forward contracts USD Sell NIS USD 52.2 USD 0.7 Forward contracts USD Sell CAD USD 53.4 USD 2.1 Forward contracts USD Sell HUF USD 4.5 USD 5.9 Forward contracts RUB Sell RON RON 4.8 RON 11.5
Interest rate risk The Group has loan facilities on floating interest rate, which exposes the Group to risk of changes in interest rates. The Group monitors the interest rate movement and manages the interest rate risk by evaluating interest rate swaps etc. based on the market / risk perception.
For the year ended March 31, 2018 and March 31, 2017, every 50 basis point decrease in the floating interest rate component applicable to its loans and borrowings would increase the Group’s profit before tax by approximately ` 162.2 Million and ` 196.2 Million respectively. A 50 basis point increase in floating interest rate would have led to an equal but opposite effect.
CommodityrateriskExposure to market risk with respect to commodity prices primarily arises from the Group’s purchases and sales of active pharmaceutical ingredients, including the raw material components for such active pharmaceutical ingredients. These are commodity products, whose prices may fluctuate significantly over short periods of time. The prices of the Group’s raw materials generally fluctuate in line with commodity cycles, although the prices of raw materials used in the Group’s active pharmaceutical ingredients business are generally more volatile. Cost of raw materials forms the largest portion of the Group’s cost of revenues. Commodity price risk exposure is evaluated and managed through operating procedures and sourcing policies. As of March 31, 2018, the Group had not entered into any material derivative contracts to hedge exposure to fluctuations in commodity prices.
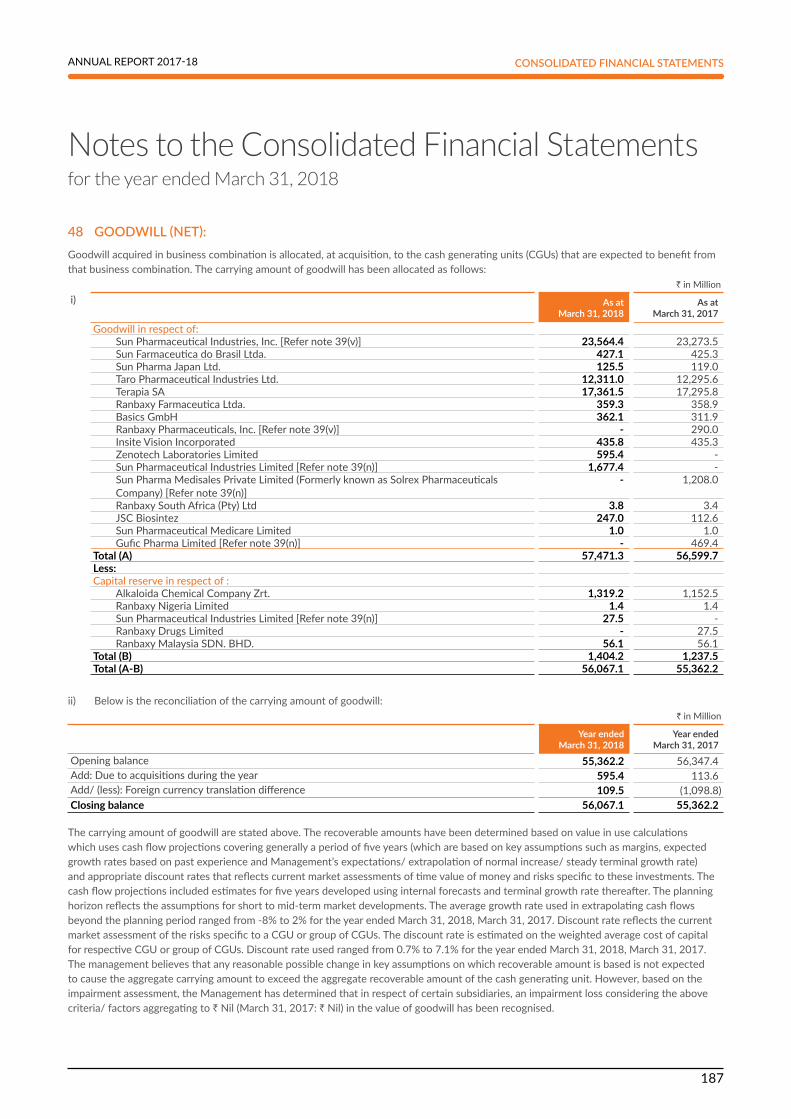
SUN PHARMACEUTICAL INDUSTRIES LIMITED
187
ANNUAL REPORT 2017-18
Notes to the Consolidated Financial Statementsfor the year ended March 31, 2018
CONSOLIDATED FINANCIAL STATEMENTS
48 GOODWILL (NET): Goodwill acquired in business combination is allocated, at acquisition, to the cash generating units (CGUs) that are expected to benefit from that business combination. The carrying amount of goodwill has been allocated as follows:
` in Million
i) As at March 31, 2018
As at March 31, 2017
Goodwillinrespectof: Sun Pharmaceutical Industries, Inc. [Refer note 39(v)] 23,564.4 23,273.5 Sun Farmaceutica do Brasil Ltda. 427.1 425.3 Sun Pharma Japan Ltd. 125.5 119.0 Taro Pharmaceutical Industries Ltd. 12,311.0 12,295.6 Terapia SA 17,361.5 17,295.8 Ranbaxy Farmaceutica Ltda. 359.3 358.9 Basics GmbH 362.1 311.9 Ranbaxy Pharmaceuticals, Inc. [Refer note 39(v)] - 290.0 Insite Vision Incorporated 435.8 435.3 Zenotech Laboratories Limited 595.4 - Sun Pharmaceutical Industries Limited [Refer note 39(n)] 1,677.4 - Sun Pharma Medisales Private Limited (Formerly known as Solrex Pharmaceuticals
Company) [Refer note 39(n)] - 1,208.0
Ranbaxy South Africa (Pty) Ltd 3.8 3.4 JSC Biosintez 247.0 112.6 Sun Pharmaceutical Medicare Limited 1.0 1.0 Gufic Pharma Limited [Refer note 39(n)] - 469.4 Total (A) 57,471.3 56,599.7 Less: Capitalreserveinrespectof: Alkaloida Chemical Company Zrt. 1,319.2 1,152.5 Ranbaxy Nigeria Limited 1.4 1.4 Sun Pharmaceutical Industries Limited [Refer note 39(n)] 27.5 - Ranbaxy Drugs Limited - 27.5 Ranbaxy Malaysia SDN. BHD. 56.1 56.1 Total (B) 1,404.2 1,237.5 Total (A-B) 56,067.1 55,362.2
ii) Below is the reconciliation of the carrying amount of goodwill:` in Million
Year endedMarch 31, 2018
Year endedMarch 31, 2017
Opening balance 55,362.2 56,347.4 Add: Due to acquisitions during the year 595.4 113.6 Add/ (less): Foreign currency translation difference 109.5 (1,098.8)Closing balance 56,067.1 55,362.2
The carrying amount of goodwill are stated above. The recoverable amounts have been determined based on value in use calculations which uses cash flow projections covering generally a period of five years (which are based on key assumptions such as margins, expected growth rates based on past experience and Management’s expectations/ extrapolation of normal increase/ steady terminal growth rate) and appropriate discount rates that reflects current market assessments of time value of money and risks specific to these investments. The cash flow projections included estimates for five years developed using internal forecasts and terminal growth rate thereafter. The planning horizon reflects the assumptions for short to mid-term market developments. The average growth rate used in extrapolating cash flows beyond the planning period ranged from -8% to 2% for the year ended March 31, 2018, March 31, 2017. Discount rate reflects the current market assessment of the risks specific to a CGU or group of CGUs. The discount rate is estimated on the weighted average cost of capital for respective CGU or group of CGUs. Discount rate used ranged from 0.7% to 7.1% for the year ended March 31, 2018, March 31, 2017. The management believes that any reasonable possible change in key assumptions on which recoverable amount is based is not expected to cause the aggregate carrying amount to exceed the aggregate recoverable amount of the cash generating unit. However, based on the impairment assessment, the Management has determined that in respect of certain subsidiaries, an impairment loss considering the above criteria/ factors aggregating to ` Nil (March 31, 2017: ` Nil) in the value of goodwill has been recognised.
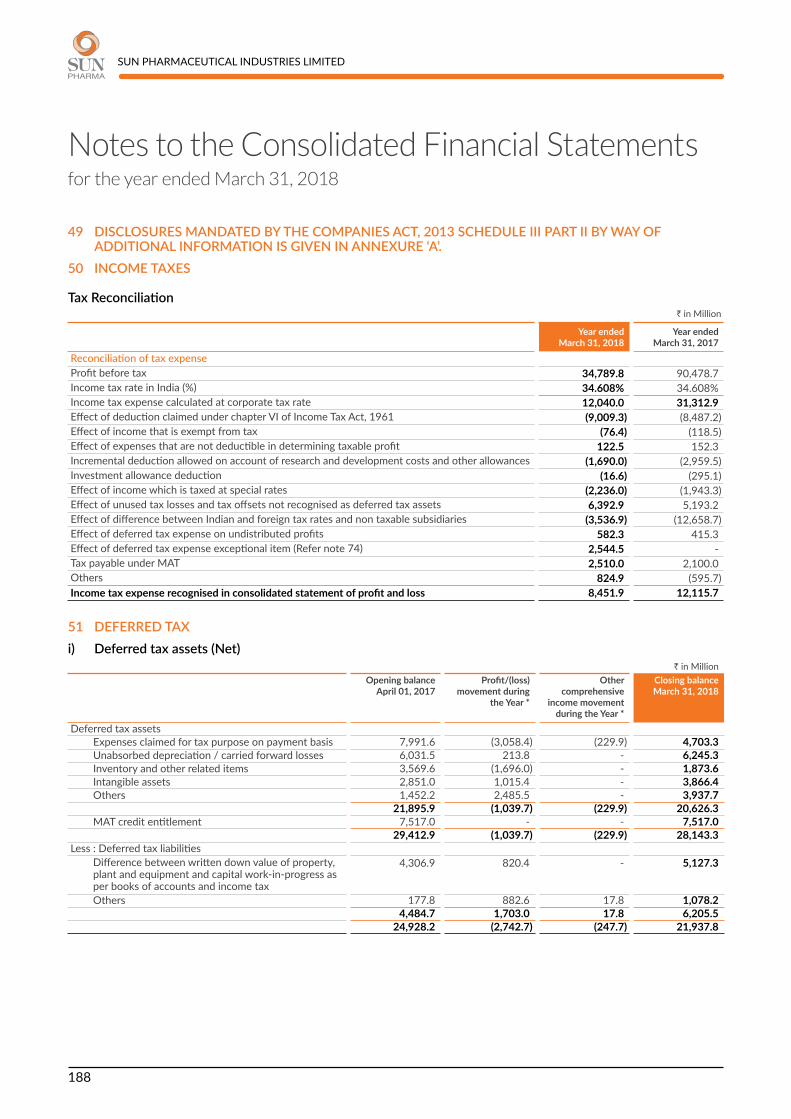
SUN PHARMACEUTICAL INDUSTRIES LIMITED
188
Notes to the Consolidated Financial Statementsfor the year ended March 31, 2018
49 DISCLOSURES MANDATED BY THE COMPANIES ACT, 2013 SCHEDULE III PART II BY WAY OF ADDITIONAL INFORMATION IS GIVEN IN ANNEXURE ‘A’.
50 INCOME TAXES
Tax Reconciliation` in Million
Year ended March 31, 2018
Year ended March 31, 2017
ReconciliationoftaxexpenseProfit before tax 34,789.8 90,478.7 Income tax rate in India (%) 34.608% 34.608%Income tax expense calculated at corporate tax rate 12,040.0 31,312.9 Effect of deduction claimed under chapter VI of Income Tax Act, 1961 (9,009.3) (8,487.2)Effect of income that is exempt from tax (76.4) (118.5)Effect of expenses that are not deductible in determining taxable profit 122.5 152.3 Incremental deduction allowed on account of research and development costs and other allowances (1,690.0) (2,959.5)Investment allowance deduction (16.6) (295.1)Effect of income which is taxed at special rates (2,236.0) (1,943.3)Effect of unused tax losses and tax offsets not recognised as deferred tax assets 6,392.9 5,193.2 Effect of difference between Indian and foreign tax rates and non taxable subsidiaries (3,536.9) (12,658.7)Effect of deferred tax expense on undistributed profits 582.3 415.3 Effect of deferred tax expense exceptional item (Refer note 74) 2,544.5 - Tax payable under MAT 2,510.0 2,100.0 Others 824.9 (595.7)Income tax expense recognised in consolidated statement of profit and loss 8,451.9 12,115.7
51 DEFERRED TAXi) Deferred tax assets (Net)
` in MillionOpening balance
April 01, 2017 Profit/(loss)
movement during the Year *
Other comprehensive
income movement during the Year *
Closing balance March 31, 2018
Deferred tax assets Expenses claimed for tax purpose on payment basis 7,991.6 (3,058.4) (229.9) 4,703.3 Unabsorbed depreciation / carried forward losses 6,031.5 213.8 - 6,245.3 Inventory and other related items 3,569.6 (1,696.0) - 1,873.6 Intangible assets 2,851.0 1,015.4 - 3,866.4 Others 1,452.2 2,485.5 - 3,937.7
21,895.9 (1,039.7) (229.9) 20,626.3 MAT credit entitlement 7,517.0 - - 7,517.0
29,412.9 (1,039.7) (229.9) 28,143.3 Less : Deferred tax liabilities Difference between written down value of property,
plant and equipment and capital work-in-progress as per books of accounts and income tax
4,306.9 820.4 - 5,127.3
Others 177.8 882.6 17.8 1,078.2 4,484.7 1,703.0 17.8 6,205.5
24,928.2 (2,742.7) (247.7) 21,937.8

SUN PHARMACEUTICAL INDUSTRIES LIMITED
189
ANNUAL REPORT 2017-18
Notes to the Consolidated Financial Statementsfor the year ended March 31, 2018
CONSOLIDATED FINANCIAL STATEMENTS
ii) Deferred tax liabilities (Net) ` in Million
Opening balance April 01, 2017
Profit/(loss) movement during
the Year *
Other comprehensive
income movement during the Year *
Closing balance March 31, 2018
Deferred tax liabilities Difference between written down value of property,
plant and equipment and capital work-in-progress as per books of accounts and income tax and others
3,678.7 (1,797.4) - 1,881.3
Undistributed profits - 984.5 - 984.5 3,678.7 (812.9) - 2,865.8
Less : Deferred tax assets Expenses claimed for tax purpose on payment basis 469.4 (157.0) (44.9) 267.5 Others 61.4 344.0 3.3 408.7
530.8 187.0 (41.6) 676.2 3,147.9 (999.9) 41.6 2,189.6
Out of a MAT credit entitlement of ` 8,222.7 Million which was written down by the erstwhile RLL during the quarter ended December 31, 2014, an amount of ` 7,517.0 Million was recognised by the Company in the year ended March 31, 2015, on a reassessment by the Management, based on convincing evidence that the combined amalgamated entity would pay normal income tax during the specified period and would therefore be able to utilize the MAT credit entitlement so recognised. * Movement during the year includes foreign currency translation difference amounting to ` 81.1 Million (loss) for the year ended March 31, 2018.
iii) Deductible temporary differences, unused tax losses and unused tax credits for which no deferred tax assets have been recognised are attributable to the following :
` in Million
As at March 31, 2018
As at March 31, 2017
Tax losses 101,672.0 81,776.7 Unabsorbed depreciation 31,260.2 24,900.1 Unused tax credits (Including MAT credit entitlement) 7,606.1 8,178.9 Deductible temporary differences 22,933.0 25,892.5
163,471.3 140,748.2
The unused tax credits will expire from financial year 2018-19 to financial year 2028-29 and unused tax losses expiry ranges from financial year 2018-19 to 2032-33. In case of certain overseas subsidiaries which have tax losses and unused tax credits, the amount is not material and there is no expiry period for tax losses and unused tax credits.
52 EARNINGS PER SHARE
Year ended March 31, 2018
Year ended March 31, 2017
Profit for the year (` in Million) - used as numerator for calculating earnings per share 21,615.5 69,643.7 Weighted average number of shares used in computing basic earnings per share (A) 2,399,296,653 2,403,319,673 Add: Dilution effect of employee stock options (B) 65,420 203,455 Weighted average number of shares used in computing diluted earnings per share (A+B) 2,399,362,073 2,403,523,128 Nominal value per share (in `) 1 1 Basic earnings per share (in `) 9.0 29.0 Diluted earnings per share (in `) 9.0 29.0

SUN PHARMACEUTICAL INDUSTRIES LIMITED
190
Notes to the Consolidated Financial Statementsfor the year ended March 31, 2018
53 SEGMENT REPORTINGThe Chief Operating Decision Maker (‘CODM’) evaluates the Group’s performance and allocates resources based on an analysis of various performance indicators by reportable segments. The Group’s reportable segments are as follows: 1. India 2. United States of America 3. Emerging Markets 4. Rest of World The reportable segments derives their revenues from the sale of pharmaceuticals products (generics, speciality, API, etc.). The CODM reviews revenue as the performance indicator. The measurement of each segment’s revenues, expenses and assets is consistent with the accounting policies that are used in preparation of the Group’s consolidated financial statements.
Revenue by Geography ` in Million
Year ended March 31, 2018
Year ended March 31, 2017
India 84,102.0 80,610.1 United States of America 88,635.4 138,823.6 Emerging markets 52,221.6 49,074.2 Rest of world 35,700.4 34,134.4
260,659.4 302,642.3
In view of the interwoven / intermix nature of business and manufacturing facility, other segmental information is not ascertainable.
Concentration of revenues from two customers of the Group were 38.4% and 35.7% of total revenue for the year ended March 31, 2018 and March 31, 2017 respectively.
54 Other intangible assets consisting of trademarks, designs, technical know-how, licences, non-compete fees and other intangible assets are stated at cost of acquisition based on their agreements. The amortisable amount of intangible assets is arrived at, based on the management’s best estimates of useful lives of such assets after due consideration as regards their expected usage, the product life cycles, technical and technological obsolescence, market demand for products, competition and their expected future benefits to the Group.
55 LEASES(a) The Group has given certain premises and Plant and Machinery under operating lease or leave and license agreements. These are
generally not non-cancellable and periods range between 11 months to 10 years under leave and license / lease and are renewable by mutual consent on mutually agreeable terms. The Group has received refundable interest free security deposits, where applicable, in accordance with agreed terms.
(b) The Group has obtained certain premises for its business operations (including furniture and fittings, therein as applicable) under operating lease or leave and license agreements. These are generally not non-cancellable and range between 11 months to 10 years under leave and licenses, or longer for other lease and are renewable by mutual consent on mutually agreeable terms. The Group has given refundable interest free security deposits in accordance with the agreed terms. These refundable security deposits have been valued at amortised cost under relevant Ind AS.
(c) Lease receipts/payments are recognised in the consolidated statement of profit and loss under “Lease rental and hire charges” and “Rent” in note 32 and note 37.
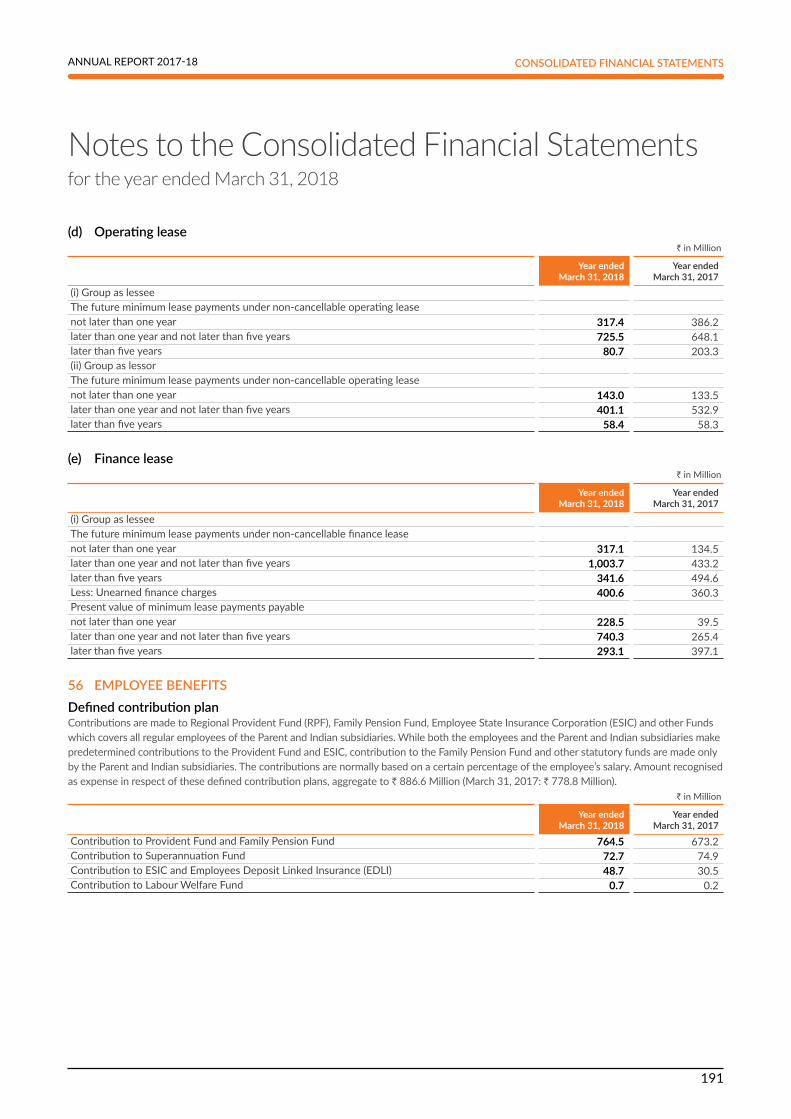
SUN PHARMACEUTICAL INDUSTRIES LIMITED
191
ANNUAL REPORT 2017-18
Notes to the Consolidated Financial Statementsfor the year ended March 31, 2018
CONSOLIDATED FINANCIAL STATEMENTS
(d) Operating lease` in Million
Year ended March 31, 2018
Year ended March 31, 2017
(i) Group as lesseeThe future minimum lease payments under non-cancellable operating leasenot later than one year 317.4 386.2 later than one year and not later than five years 725.5 648.1 later than five years 80.7 203.3 (ii) Group as lessorThe future minimum lease payments under non-cancellable operating leasenot later than one year 143.0 133.5 later than one year and not later than five years 401.1 532.9 later than five years 58.4 58.3
(e) Finance lease` in Million
Year ended March 31, 2018
Year ended March 31, 2017
(i) Group as lesseeThe future minimum lease payments under non-cancellable finance leasenot later than one year 317.1 134.5 later than one year and not later than five years 1,003.7 433.2 later than five years 341.6 494.6 Less: Unearned finance charges 400.6 360.3 Present value of minimum lease payments payablenot later than one year 228.5 39.5 later than one year and not later than five years 740.3 265.4 later than five years 293.1 397.1
56 EMPLOYEE BENEFITS Defined contribution plan Contributions are made to Regional Provident Fund (RPF), Family Pension Fund, Employee State Insurance Corporation (ESIC) and other Funds which covers all regular employees of the Parent and Indian subsidiaries. While both the employees and the Parent and Indian subsidiaries make predetermined contributions to the Provident Fund and ESIC, contribution to the Family Pension Fund and other statutory funds are made only by the Parent and Indian subsidiaries. The contributions are normally based on a certain percentage of the employee’s salary. Amount recognised as expense in respect of these defined contribution plans, aggregate to ` 886.6 Million (March 31, 2017: ` 778.8 Million).
` in Million
Year ended March 31, 2018
Year ended March 31, 2017
Contribution to Provident Fund and Family Pension Fund 764.5 673.2 Contribution to Superannuation Fund 72.7 74.9 Contribution to ESIC and Employees Deposit Linked Insurance (EDLI) 48.7 30.5 Contribution to Labour Welfare Fund 0.7 0.2

SUN PHARMACEUTICAL INDUSTRIES LIMITED
192
Notes to the Consolidated Financial Statementsfor the year ended March 31, 2018
Defined benefit plan a) Gratuity In respect of Gratuity, a defined benefit plan, contributions
are made to LIC’s Recognised Group Gratuity Fund Scheme. It is governed by the Payment of Gratuity Act, 1972. Under the Gratuitiy Act, employees are entitled to specific benefit at the time of retirement or termination of the employment on completion of five years or death while in employement. The level of benefit provided depends on the member’s length of service and salary at the time of retirement/termination age. Provision for Gratuity is based on actuarial valuation done by an independent actuary as at the year end. Each year, the Parent and Indian subsidiaries reviews the level of funding in gratuity fund. The Parent and Indian subsidiaries decides its contribution based on the results of its annual review. The Parent and Indian subsidiaries aims to keep annual contributions relatively stable at a level such that the fund assets meets the requirements of gratuity payments in short to medium term.
b) Pensionfund The Parent and Indian subsidiaries has an obligation towards
pension, a defined benefit retirement plan, with respect to certain employees, who had already retired before March 01, 2013, will continue to receive the pension as per the pension plan.
Risks These plans typically expose the Parent and Indian subsidiaries to actuarial risks such as: investment risk, interest rate risk, longevity risk and salary risk.
i) Investment risk - The present value of the defined benefit plan liability is calculated using a discount rate determined by reference to the market yields on government bonds
denominated in Indian Rupees. If the actual return on plan asset is below this rate, it will create a plan deficit. However, the risk is partially mitigated by investment in LIC managed fund.
ii) Interest rate risk - A decrease in the bond interest rate will increase the plan liability. However, this will be partially offset by an increase in the return on the plan’s debt investments.
iii) Longevity risk - The present value of the defined benefit plan liability is calculated by reference to the best estimate of the mortality of plan participants both during and after their employment. An increase in the life expectancy of the plan participants will increase the plan’s liability.
iv) Salary risk - The present value of the defined benefit plan liability is calculated by reference to the future salaries of plan participants. As such, an increase in the salary of the plan participants will increase the plan’s liability.
Other long term benefit planActuarial valuation for compensated absences is done as at the year end and the provision is made as per the Parent and Indian subsidiaries rules with corresponding (gain) / charge to the consolidated statement of profit and loss amounting to gain of ` 51.4 Million (March 31, 2017 loss of ` 499.6 Million) and it covers all regular employees. Major drivers in actuarial assumptions, typically, are years of service and employee compensation.
Obligation in respect of defined benefit plan and other long term employee benefit plans are actuarially determined as at the year end using the ‘Projected Unit Credit’ method. Gains and losses on changes in actuarial assumptions relating to defined benefit obligation are recognised in other comprehensive income whereas gains and losses in respect of other long term employee benefit plans are recognised in the consolidated statement of profit and loss.

SUN PHARMACEUTICAL INDUSTRIES LIMITED
193
ANNUAL REPORT 2017-18
Notes to the Consolidated Financial Statementsfor the year ended March 31, 2018
CONSOLIDATED FINANCIAL STATEMENTS
` in Million
Year ended March 31, 2018 Year ended March 31, 2017
Pension Fund (Unfunded)
Gratuity (Funded)
Pension Fund (Unfunded)
Provident Fund (Funded)
Gratuity (Funded)
Expense recognised in the consolidated statement of profit and loss (Refer note 35)Current service cost - 360.6 - - 244.1 Interest cost 66.0 251.0 70.2 592.6 212.5 Expected return on plan assets - (161.2) - (598.5) (177.6)Recognition of unrecognised liabilities of earlier years
- - - - -
Excess of planned assets over commitments not recognised in financial statements
- - - 5.9 -
Expense charged to the consolidated statement of profit and loss
66.0 450.4 70.2 - 279.0
Remeasurement of defined benefit obligation recognised in other comprehensive incomeActuarial loss / (gain) on defined benefit obligation
(44.4) (695.7) 56.2 - 728.7
Actuarial gain on plan assets - (42.6) - - (18.0)Expense/(income) charged to other comprehensive income
(44.4) (738.3) 56.2 - 710.7
Reconciliation of defined benefit obligations Obligations as at the beginning of the year
969.5 3,682.3 930.7 4,598.6 2,708.4
Current service cost - 360.6 - - 244.1 Interest cost 66.0 251.0 70.2 592.6 212.5 Liability transferred in/ acquisitions (Refer note 76)
- 1.6 - - 17.4
Obligations transferred - - - 1.8 - Benefits paid (87.4) (173.6) (87.6) (507.6) (228.8)Obligation transferred to regional provident fund, net of accumulated unrecognised gains
- - - (4,685.4) -
Actuarial (gains)/losses on obligations due to change in demographic
assumptions - (160.9) - - 16.3
due to change in financial assumptions (50.0) (575.4) 54.5 - 624.3 due to experience 5.6 40.6 1.7 - 88.1 Obligation as at the year end 903.7 3,426.2 969.5 - 3,682.3
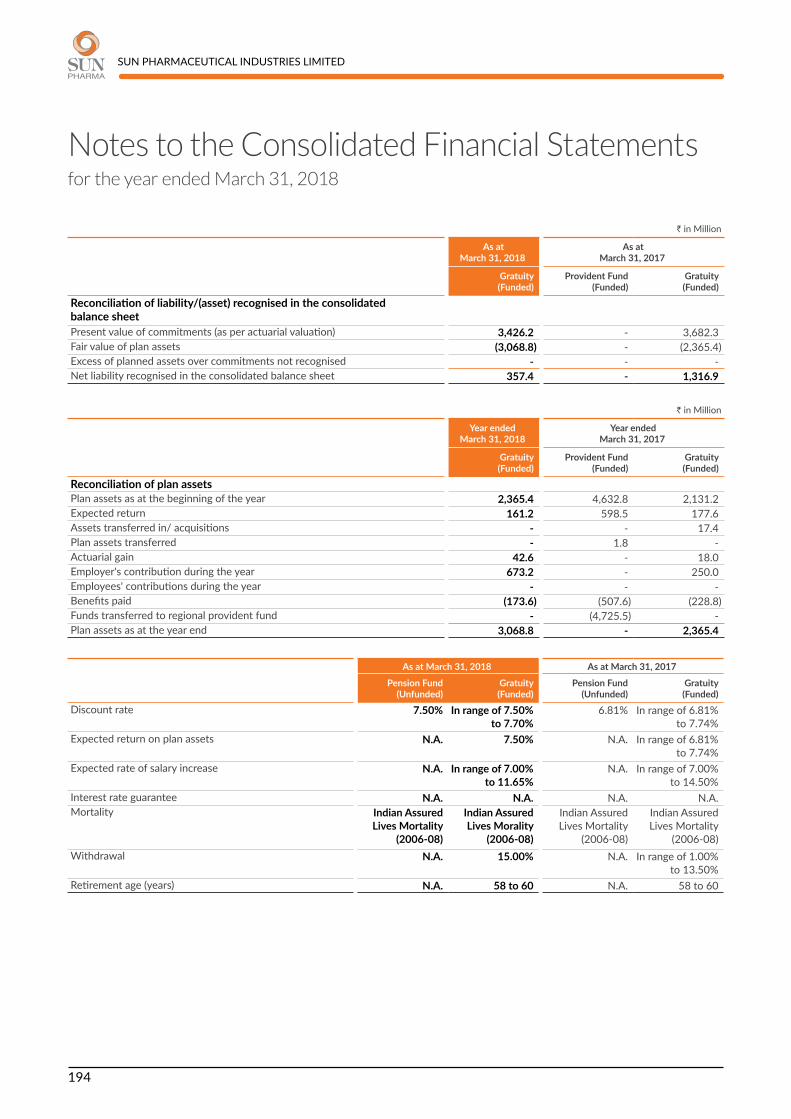
SUN PHARMACEUTICAL INDUSTRIES LIMITED
194
Notes to the Consolidated Financial Statementsfor the year ended March 31, 2018
` in Million
As at March 31, 2018
As at March 31, 2017
Gratuity (Funded)
Provident Fund (Funded)
Gratuity (Funded)
Reconciliation of liability/(asset) recognised in the consolidated balance sheetPresent value of commitments (as per actuarial valuation) 3,426.2 - 3,682.3 Fair value of plan assets (3,068.8) - (2,365.4)Excess of planned assets over commitments not recognised - - - Net liability recognised in the consolidated balance sheet 357.4 - 1,316.9
` in Million
Year ended March 31, 2018
Year ended March 31, 2017
Gratuity (Funded)
Provident Fund (Funded)
Gratuity (Funded)
Reconciliation of plan assets Plan assets as at the beginning of the year 2,365.4 4,632.8 2,131.2 Expected return 161.2 598.5 177.6 Assets transferred in/ acquisitions - - 17.4 Plan assets transferred - 1.8 - Actuarial gain 42.6 - 18.0 Employer's contribution during the year 673.2 - 250.0 Employees' contributions during the year - - - Benefits paid (173.6) (507.6) (228.8)Funds transferred to regional provident fund - (4,725.5) - Plan assets as at the year end 3,068.8 - 2,365.4
As at March 31, 2018 As at March 31, 2017
Pension Fund (Unfunded)
Gratuity (Funded)
Pension Fund (Unfunded)
Gratuity (Funded)
Discount rate 7.50% In range of 7.50% to 7.70%
6.81% In range of 6.81% to 7.74%
Expected return on plan assets N.A. 7.50% N.A. In range of 6.81% to 7.74%
Expected rate of salary increase N.A. In range of 7.00% to 11.65%
N.A. In range of 7.00% to 14.50%
Interest rate guarantee N.A. N.A. N.A. N.A.Mortality Indian Assured
Lives Mortality (2006-08)
Indian Assured Lives Morality
(2006-08)
Indian Assured Lives Mortality
(2006-08)
Indian Assured Lives Mortality
(2006-08)Withdrawal N.A. 15.00% N.A. In range of 1.00%
to 13.50%Retirement age (years) N.A. 58 to 60 N.A. 58 to 60

SUN PHARMACEUTICAL INDUSTRIES LIMITED
195
ANNUAL REPORT 2017-18
Notes to the Consolidated Financial Statementsfor the year ended March 31, 2018
CONSOLIDATED FINANCIAL STATEMENTS
` in Million
As at March 31, 2018 As at March 31, 2017
Pension Fund (Unfunded)
Gratuity (Funded)
Pension Fund (Unfunded)
Gratuity (Funded)
Sensitivity analysis:Impact on defined benefit obligationDelta effect of +1% change in discount rate (68.2) (155.8) (73.2) (226.5)Delta effect of -1% change in discount rate 80.2 173.1 86.0 257.8 Delta effect of +1% change in salary escalation rate - 164.9 - 237.5 Delta effect of -1% change in salary escalation rate - (151.5) - (214.1)Delta effect of +1% change in rate of employee turnover - (40.5) - (98.2)Delta effect of -1% change in rate of employee turnover - 44.6 - 110.7 Maturity analysis of projected benefit obligation 31-Mar-19 87.4 560.3 87.4 466.6 31-Mar-20 100.3 390.2 100.4 320.2 31-Mar-21 115.2 397.7 115.3 353.9 31-Mar-22 132.3 389.4 132.5 352.3 31-Mar-23 151.9 355.1 152.1 353.2 Thereafter 174.4 1,496.9 174.8 1,601.0 The major categories of plan assets are as under: Central government securities - 9.9 - 20.9 Bonds and securities of public sector / financial institutions - 67.3 - 69.3 Insurer managed funds (Funded with LIC, break-up not
available) - 2,977.6 - 2,253.0
Surplus fund lying uninvested - 14.0 - 22.2
The contribution expected to be made by the Parent and Indian subsidiaries for gratuity, during financial year ending March 31, 2019 is ` 384.8 Million (March 31, 2018: ` 486.3 Million).
In the United States, the Company sponsors a defined contribution 401(k) retirement savings plan for all eligible employees who meet minimum age and service requirements. The Company has no further obligations under the plan beyond its annual matching contributions.
57 Taro Pharmaceutical Industries Ltd and its Israeli subsidiaries are required to make severance or pension payments to dismissed employees and to employees terminating employment under certain other circumstances. Deposits are made with a pension fund or other insurance plans to secure pension and severance rights for the employees in Israel.
58 EMPLOYEE SHARE-BASED PAYMENT PLANS Erstwhile Ranbaxy Laboratories Limited (RLL) had Employee Stock Option Schemes (“ESOS’s”) namely, Employees Stock Option Scheme
-II (ESOS-II), Employees Stock Option Scheme 2005 (ESOS 2005) and Employees Stock Option Plan 2011 (ESOP 2011) for the grant of stock options to the eligible employees and Directors of the Erstwhile RLL and its subsidiaries. ESOS-II had been discontinued from January 17, 2015. The ESOS’s are administered by the Compensation Committee (“Committee”). Options are granted at the discretion of the Committee to selected employees depending upon certain criterion. Each option comprises one underlying equity share.
ESOS 2005 provided that the grant price of options would be the latest available closing price on the stock exchange on which the shares of the erstwhile RLL were listed, prior to the date of the meeting of the Committee in which the options were granted. If the shares are listed on more than one stock exchange, then the stock exchange where there was highest trading volume on the said date were be considered. The options vested evenly over a period of five years from the date of grant. Options lapse, if they are not exercised prior to the expiry date, which was ten years from the date of grant.

SUN PHARMACEUTICAL INDUSTRIES LIMITED
196
Notes to the Consolidated Financial Statementsfor the year ended March 31, 2018
ESOP 2011 provided that the grant price of options would be the face value of the equity share i.e. ` 5 per share. The options vested evenly over a period of three years from the date of grant. Options lapse, if they were not exercised prior to the expiry date, which was three months from the date of the vesting. An ESOP Trust had been formed to administer ESOP 2011. Shares issued to the ESOP Trust were allocated to the eligible employees upon exercise of stock options from time to time.
The Shareholders’ Committee of erstwhile RLL had approved issuance of options under the ESOS’s as per details given below:
Date of approval Scheme Original No. of options approved
June 25, 2003 ESOS-II 4,000,000 June 30, 2005 ESOS 2005 4,000,000 May 09, 2011 ESOP 2011 3,000,000
In accordance with the above approval of issuance of options, stock options have been granted from time to time.
The stock options outstanding as on June 30, 2005 are proportionately adjusted in view of the sub-division of equity shares of the Erstwhile RLL from the face value of ` 10 each into 2 equity shares of ` 5 each.
Pursuant to the Scheme of Amalgamation, Sun Pharmaceutical Industries Limited (‘transferee company’) formulated two Employee Stock Option Schemes, namely, (i) SUN Employee Stock Option Scheme-2015 (SUN-ESOS 2015) to administer ESOS 2005 (ii) SUN Employee Stock Option Plan-2015 (SUN-ESOP 2015) to administer ESOP 2011. These scheme provide that the number of transferee options issued shall equal to the product of number of transferor options outstanding on effectiveness of Scheme multiplied by the Share exchange ratio (0.80) and each transferee option shall have an exercise price per equity share equal to transferor option exercise price per equity shares divided by the share exchange ratio (0.80) and fractions rounded off to the next higher whole number. The terms and conditions of ESOS, of transferee company are not less favourable than those of ESOS’s of erstwhile RLL. No new grants shall be made under these schemes and these schemes shall operate only for the purpose of administering the exercise of options already granted / vested on an employee pursuant to SUN-ESOS 2015 and SUN-ESOP 2015.
The movement of the options (post split) granted under SUN-ESOS 2015
March 31, 2018Stock options
(numbers)Range of exercise
prices (`)Weighted-average exercise prices (`)
Weighted-average remaining contractual
life (years)Outstanding at the commencement of the year 401,678 270.0-562.5 462.9 1.9 Exercised during the year $ (18,893) 270.0-562.5 480.5 - Lapsed during the year (119,105) 270.0-562.5 488.1 - Outstanding at the end of the year * 263,680 270.0-562.5 450.3 1.5 Exercisable at the end of the year * 263,680 270.0-562.5 450.3 1.5
* Includes options exercised, pending allotment $ Weighted average share price on the date of exercise ` 565.14
March 31, 2017Stock options
(numbers)Range of exercise
prices (`)Weighted-average exercise prices (`)
Weighted-average remaining
contractual life (years)
Outstanding at the commencement of the year 610,739 270.0-703.0 480.9 2.5 Exercised during the year $ (62,682) 270.0-562.5 500.1 - Lapsed during the year (146,379) 270.0-562.5 521.7 - Outstanding at the end of the year * 401,678 270.0-562.5 462.9 1.9 Exercisable at the end of the year * 401,678 270.0-562.5 462.9 1.9
* Includes options exercised, pending allotment $ Weighted average share price on the date of exercise ` 690.23

SUN PHARMACEUTICAL INDUSTRIES LIMITED
197
ANNUAL REPORT 2017-18
Notes to the Consolidated Financial Statementsfor the year ended March 31, 2018
CONSOLIDATED FINANCIAL STATEMENTS
The movement of the options (post split) granted under SUN-ESOP 2015
March 31, 2018Stock options
(numbers)Exercise price (`) Weighted-average
exercise prices (`)Weighted-
average remaining contractual life
(years)
Outstanding at the commencement of the year 52,284 6.3 6.3 0.4 Forfeited during the year (168) 6.3 6.3 - Exercised during the year # (43,472) 6.3 6.3 - Lapsed during the year (8,644) 6.3 6.3 - Outstanding at the end of the year - 6.3 6.3 -
# Weighted average share price on the date of exercise ` 562.58
March 31, 2017Stock options
(numbers)Exercise price (`) Weighted-average
exercise prices (`)Weighted-
average remaining contractual life
(years)
Outstanding at the commencement of the year 169,913 6.3 6.3 1.1 Forfeited during the year (11,179) 6.3 6.3 - Exercised during the year # (93,015) 6.3 6.3 - Lapsed during the year (13,435) 6.3 6.3 - Outstanding at the end of the year * 52,284 6.3 6.3 0.4 Exercisable at the end of the year * 941 6.3 6.3 -
* Includes options exercised, pending allotment # Weighted average share price on the date of exercise ` 802.00
During the current year, the Parent Company has recorded a Stock-based employee compensation expense / (gain) of ` (1.0) Million (March 31, 2017: ` 32.3 Million). The amount has been determined under a fair value method wherein the grant date fair value of the options was calculated by using Black Scholes pricing model.
The following table summarises the assumptions used in calculating the grant date fair value for instrument granted in the year ended March 31, 2015: @@
Particulars Year ended March 31, 2015Grant Date May 08, 2014Dividend yield 0.43%Expected life of options from the date(s) of grant 1.25, 2.25 and 3.25 yearsRisk free interest rate 8.57% (1.25 years)
8.65% (2.25 years)8.71% (3.25 years)
Expected volatility 40.47%Grant date fair value ` 462.39 (1.25 years)
` 460.79 (2.25 years)` 459.16 (3.25 years)
@@ Assumptions used are as applicable at the date of grant in the context of erstwhile RLL.
The Black Scholes option-pricing model was developed for estimating fair value of trade options that have no vesting restrictions and are fully transferable. Since options pricing models require use of subjective assumptions, changes therein can materially affect fair value of the options. The options pricing models do not necessary provide a reliable measure of fair value of options. The volatility in the share price is based on volatility of historical stock price of the erstwhile RLL for last 60 months.

SUN PHARMACEUTICAL INDUSTRIES LIMITED
198
Notes to the Consolidated Financial Statementsfor the year ended March 31, 2018
63 a) Since the US-FDA import alert at Karkhadi facility in March 2014, the Company remained fully committed to implement all corrective measures to address the observations made by the US-FDA with the help of third party consultant. Substantial progress has been made at the Karkhadi facility in terms of completing all the action items to address the observations made by the US-FDA in its warning letter issued in May 2014. The Company is continuing to work closely and co-operatively with the US-FDA to resolve the matter. The contribution of this facility to Company’s revenues is not significant.
b) The US-FDA, on January 23, 2014, had prohibited using API manufactured at Toansa facility for manufacture of finished drug products intended for distribution in the U.S. market. Consequentially, the Toansa manufacturing facility was subject to certain provisions of the consent decree of permanent injunction entered in January 2012 by erstwhile Ranbaxy Laboratories Ltd (which was merged with Sun Pharmaceutical Industries Ltd in March 2015). In addition, the Department of Justice of the USA (‘US DOJ’), United States Attorney’s Office for the District of New Jersey had also issued an administrative
subpoena dated March 13, 2014 seeking information primarily related to Toansa manufacturing facility for which a Form 483 containing findings of the US-FDA was issued in January 2014. The Company is continuing to fully co-operate and provide requisite information to the US DOJ.
c) In December 2015, the USFDA issued a warning letter to the manufacturing facility at Halol. Post the November 2016 inspection, the USFDA re-inspected Halol facility in February 2018. At the conclusion of the inspection, USFDA issued a Form-483 with three observations. The Company has submitted its response documenting the corrective measures to resolve the Form-483 observations. The Company continues to manufacture and distribute products to the U.S from Halol facility and at the same time is working closely and co-operatively with the USFDA to resolve the matter.
d) In September 2013, the USFDA had put the Mohali facility under import alert and was also subjected to certain provisions of the consent decree of permanent injunction entered in January 2012 by erstwhile
59 Expenditure related to Corporate Social Responsibility as per Section 135 of the Companies Act, 2013 read with Schedule VII thereof: ` 209.6 Million (March 31, 2017: ` 96.1 Million).
60 The Group does not have any material associates or joint ventures warranting a disclosure in respect of individual associates or joint ventures. The Group’s share of other comprehensive income is ` Nil (March 31, 2017: ` Nil) in respect of such associates and joint ventures. The unrecognised share of loss of ` Nil (March 31, 2017: ` Nil) in respect of such associates and joint ventures.
61 In respect of any present obligation as a result of a past event that could lead to a probable outflow of resources, provision has been made, which would be required to settle the obligation. The said provisions are made as per the best estimate of the management and disclosure as per Ind AS 37 - “Provisions, Contingent Liabilities and Contingent Assets” has been given below:
` in Million
Year ended March 31, 2018
Year ended March 31, 2017
Product and Sales related *
Product and Sales related *
Opening balance 46,903.6 44,707.6 Add: Provision for the year 20,577.9 18,905.5 Add: Unwinding of discounts on provisions 265.8 437.8 Less: Utilisation/settlement/reversal (18,597.2) (15,852.3)Add/(less): Foreign currency translation difference 1,015.3 (1,295.0)Closing balance 50,165.4 46,903.6
* Includes provision for trade commitments, discounts, rebates, price reductions, product returns, chargeback, medicaids and contingency provision.
62 The Company is a defendant in respect of a civil antitrust litigation relating to a product Modafinil, in which the plaintiff’s have alleged that the Company excluded its generic version of Modafinil from the US market and hence have claimed damages under the Sherman Act of US. This case is pending in the United States District Court for the Eastern District of Pennsylvania. The Company and one of its wholly owned subsidiaries entered into settlements with certain plaintiffs (Apotex Corporation and Retailer Purchasers) in the month of July 2017 and September 2017 whereby the Company agreed to pay an aggregate amount of USD 147 Million (` 9,505.0 Million). This amount has been provided for in the consolidated financial statements and disclosed as an exceptional item. The Company continues to litigate the case against the other plaintiff’s (other than those settled).

SUN PHARMACEUTICAL INDUSTRIES LIMITED
199
ANNUAL REPORT 2017-18
Notes to the Consolidated Financial Statementsfor the year ended March 31, 2018
CONSOLIDATED FINANCIAL STATEMENTS
Ranbaxy Laboratories Ltd (which was merged with Sun Pharmaceutical Industries Ltd in March 2015). In March 2017, the USFDA lifted the import alert and indicated that the facility was in compliance with the requirements of cGMP provisions mentioned in the consent decree. The facility will continue to demonstrate sustainable cGMP compliance for a fixed period of time as required by the consent decree. The Company has started manufacturing and distributing products to the U.S from Mohali facility.
64 Pursuant to the declaration executed by the Sun Pharma Laboratories Limited (SPLL) (‘Donor’) in favour of an entity controlled by Trumpcard Advisors and Finvest LLP (Associate of the SPLL), namely Vintage Power Generation LLP (‘Donee’) on March 31, 2017, the power undertaking of the Donor located at Kukshi, Madhya Pradesh has been gifted to the Donee. Accordingly, on and with effect from the close of business hours on March 31, 2017, all the assets, movable and immovable, tangible and intangible, along with the liabilities pertaining to the said power undertaking stand transferred to and vested in the Donee as a going concern without consideration. Accordingly, the value of power undertaking gifted to the Donee has been added to the cost of investment of the SPLL in the said Associate.
65 The Parent Company completed buy-back of 7,500,000 equity shares of ` 1 each (representing 0.31% of total pre buy back paid up equity capital) on October 18, 2016, from the shareholders on a proportionate basis by way of a tender offer at a price of ` 900 per equity share for an aggregate amount of ` 6,750.0 Million in accordance with the provisions of the Companies Act, 2013 and the SEBI (Buy Back of Securities) Regulations, 1998. This buyback of equity shares was approved by the Board of Directors of the Parent Company at its meeting held on June 23, 2016.
66 Property, plant and equipment consisting of land, building, plant and equipments, furniture and fixtures amounting to ` Nil (March 31, 2017: ` 65.9 Million) in respect of the manufacturing facility in Ireland are held for sale.
67 DETAILS OF LONG-TERM BORROWINGS AND CURRENT MATURITIES OF LONG-TERM DEBT AND FINANCE LEASE OBLIGATIONS [INCLUDED UNDER OTHER FINANCIAL LIABILITIES (CURRENT)]
A Secured term loan from other parties: Secured term loan from department of biotechnology
of ` 108.2 Million (March 31, 2017: ` 108.2 Million) has been secured by hypothecation of all assets of the Parent Company. The loan is repayable in 10 equal half yearly installments commencing from December 14, 2019, last installment is due on June 14, 2024.
B Lease obligations of ` 1,261.9 Million (March 31, 2017: ` 702.0 Million) [included in non-current borrowing March 31, 2018: ` 1,033.4 Million (March 31, 2017: ` 662.5 Million) and March 31, 2018: ` 228.5 Million (March 31, 2017: ` 39.5 Million) in current maturities of long term finance lease obligations] repayable by FY 2019-2025 is secured against assets taken on finance lease.
C Term loan from banks: Secured (i) Loan of USD 16.7 Million equivalent to ` 1,086.5
Million (March 31, 2017: USD 17.5 Million equivalent ` 1,134.2 Million [Included in non-current borrowing March 31, 2018: ` 1,035.3 Million (March 31, 2017: ` 1,085.2 Million) and March 31, 2018: ` 51.2 Million (March 31, 2017: ` 49.0 Million) in current maturities of long-term debt], which is repayable in varying amounts by June 2033. The loan is collateralised by substantially all the assets of Pharmalucence Inc. The effective interest rate was 3.05% at March 31, 2018.
Unsecured (i) Unsecured External Commercial Borrowings
(ECBs) has 5 loans aggregating of USD 256 Million (March 31, 2017: USD 256 Million) equivalent to ` 16,622.1 Million (March 31, 2017: ` 16,602.9 Million). For the ECB loans outstanding as at March 31, 2018, the terms of repayment for borrowings are as follows:
a) USD Nil (March 31, 2017: USD 10 Million) equivalent to ` Nil (March 31, 2017: ` 648.6 Million). The loan was taken on June 30, 2011 and is repayable in 3 equal installments of USD 10 Million each at the end of 4th year, 5th year and 6th year. Last installment of USD 10 Million has been repaid during the year ended March 31, 2018. First and second installment of USD 10 Million each has been repaid in previous years.
b) USD 50 Million (March 31, 2017 : USD 50 Million) equivalent to ` 3,246.5 Million (March 31, 2017 : ` 3,242.7 Million). The loan was taken on September 20, 2012 and is repayable in 2 equal installments of USD 25 Million each. The first installment of USD 25 Million is due on September 20, 2019 and last installment of USD 25 Million is due on September 18, 2020.
c) USD 100 Million (March 31, 2017: USD 100 Million) equivalent to ` 6,493.0 Million (March 31, 2017: ` 6,485.5 Million). The loan was taken on June 04, 2013 and is repayable in 3 installments

SUN PHARMACEUTICAL INDUSTRIES LIMITED
200
Notes to the Consolidated Financial Statementsfor the year ended March 31, 2018
viz., the first installment of USD 30 Million is due on May 31, 2020, second installment of USD 30 Million is due on November 30, 2020 and last installment of USD 40 Million is due on November 30, 2021.
d) USD 50 Million (March 31, 2017: USD 50 Million) equivalent to ` 3,246.5 Million (March 31, 2017: ` 3,242.7 Million). The loan was taken on August 11, 2015 and is repayable on August 08, 2019.
e) USD Nil (March 31, 2017: USD 30 Million) equivalent to ` Nil. (March 31, 2017: ` 1,945.7 Million). The loan was taken on September 09, 2015 and has been repaid during the year ended March 31, 2018.
f) USD 26 Million (March 31, 2017 : USD 16 Million) equivalent to ` 1,688.2 Million (March 31, 2017 : ` 1,037.7 Million). The loan was taken in tranches of USD 16 Million on March 24, 2017 and USD 10 Million on June 30, 2017. The loan is repayable
in 2 installments viz., the first installment of USD 16 Million is due on March 22, 2019 and last installment of USD 10 Million is due on June 28, 2019.
g) USD 30 Million (March 31, 2017 : USD Nil) equivalent to ` 1,947.9 Million (March 31, 2017: ` Nil). The loan was taken on September 08, 2017 and is repayable on September 07, 2020.
(ii) Unsecured loan under Foreign Currency Non-Resident (FCNR B) Scheme of USD Nil (March 31, 2017: USD 50 Million) equivalent to ` Nil (March 31, 2017: ` 3,242.8 Million). The loan was taken on August 19, 2015 and has been repaid during the year ended March 31, 2018.
The aforementioned unsecured ECB loans are availed from various banks at floating rate linked to Libor (2.26% as at March 31, 2018) and secured loan from department of biotechnology have been availed at a range from 2% to 3%.
D Unsecured debentures: 10,000 Million (March 31, 2017: ` 10,000 Million) rated unsecured listed redeemable non-convertible debentures at a coupon
rate of 7.94% p.a. were issued by Sun Pharma Laboratories Limited (“SPLL” - the Wholly owned subsidiary) on December 23, 2015. Following are the details
Face Value (`)Redemption
Amount (` in Million)
Date of Redemption
Rated unsecured listed redeemable 5,000 Non-Convertible debentures Series 2 (included in current maturities of long-term debt as at March 31, 2018)
1,000,000 5,000.0 March 22, 2019
Rated unsecured listed redeemable 5,000 Non-Convertible debentures Series 1 (redeemed during the year)
1,000,000 5,000.0 December 22, 2017
The Company has not defaulted on repayment of loan and interest payment thereon during the year.
68 DETAILS OF SECURITIES FOR CURRENT BORROWINGS ARE AS UNDER: a) Borrowings made by overseas subsidiaries are supported by the letters of awareness issued by the Parent Company.
b) As on March 31, 2017, secured short term borrowings had first charge on a pari-passu basis, by hypothecation of inventories and receivables, both present and future. The charge has been relinquished during the year ended March 31, 2018.

SUN PHARMACEUTICAL INDUSTRIES LIMITED
201
ANNUAL REPORT 2017-18
Notes to the Consolidated Financial Statementsfor the year ended March 31, 2018
CONSOLIDATED FINANCIAL STATEMENTS
69 LOANS/ADVANCES DUE FROM AN ASSOCIATE
` in Million
As at March 31, 2018
As at March 31, 2017
Interest bearing with specified repayment schedule:Zenotech Laboratories Limited, India* [Refer note 39(t)]Considered doubtful - 726.9
- 726.9 Less: allowance for doubtful loan/interest accrued and due on loan - 726.9
- - * includes interest accrued and due on loans amounting to ` 214.9 Million in March 31, 2017 Loans have been granted to the above entity for the purpose of its business.
70 a) Sun Pharma Global FZE, a subsidiary of the Parent Company holds 23.35% in the capital of Enceladus Pharmaceutical B.V. However, as Sun Pharma Global FZE does not have any ‘Significant Influence’ in Enceladus Pharmaceutical B.V., as is required under Ind AS 28 - “Investments in Associates and Joint Ventures”, the said investment in Enceladus Pharmaceutical B.V. has not been consolidated as an “Associate Entity”.
b) The Parent Company holds 24.91% in the capital of Shimal Research Laboratories Limited. However, as the Parent Company does not have any ‘Significant Influence’ in Shimal Research Laboratories Limited, as is required under Ind AS 28 - “Investments in Associates and Joint Ventures”, the said investment in Shimal Research Laboratories Limited has not been consolidated as an “Associate Entity”.
71 Post implementation of Goods and Service Tax (“GST”) with effect from July 01, 2017, sale of products is disclosed net of GST. Sale of products for the previous year included excise duty which is now subsumed in GST. Sale of products for the year ended March 31, 2018 includes excise duty for the period ended June 30, 2017. Accordingly, sale of products for the year ended March 31, 2018 are not comparable with year ended March 31, 2017.
72 DISCLOSURE OF A SUBSIDIARY THAT HAS NON-CONTROLLING INTEREST THAT IS MATERIAL TO THE GROUP
Name of Subsidiary Principal place of business
Country of incorporation Nature* As at
March 31, 2018As at
March 31, 2017Taro Pharmaceutical Industries Ltd. and its subsidiaries (TARO Group)
United States of America
Israel Beneficial ownership
25.18% 27.19%
Voting power 16.79% 18.13%* Held by non-controlling interest
` in Million
Name of Subsidiary
Profit allocated to non-controlling interests Accumulated non-controlling interests
Year ended March 31, 2018
Year ended March 31, 2017
As at March 31, 2018
As at March 31, 2017
TARO Group 4,284.6 8,599.9 36,811.1 36,547.7 Individually immaterial subsidiaries with non-controlling interests
183.4 218.7 2,030.5 1,360.9
Total 4,468.0 8,818.6 38,841.6 37,908.6

SUN PHARMACEUTICAL INDUSTRIES LIMITED
202
Notes to the Consolidated Financial Statementsfor the year ended March 31, 2018
The summarised consolidated financial information of TARO Group before inter-company eliminations: ` in Million
As at March 31, 2018
As at March 31, 2017
Consolidated balance sheet of TARO GroupNon-current assets 43,974.4 34,063.2 Current assets 116,578.1 113,879.1 Non-current liabilities (350.4) (277.6)Current liabilities (14,010.4) (13,248.8)
` in Million
Year ended March 31, 2018
Year ended March 31, 2017
Consolidated statement of profit and loss of TARO GroupTotal income 45,216.7 60,748.8 Total expenses 26,101.3 (23,243.0)Profit after tax 16,551.7 30,612.9 Total comprehensive income for the year 18,691.8 25,241.9
` in Million
Year ended March 31, 2018
Year ended March 31, 2017
Consolidated cash flows information of TARO GroupNet cash generated from operating activities 21,318.0 29,345.5 Net cash used in investing activities (15,576.7) (7,899.4)Net cash used in financing activities (6,896.6) (19,760.5)
There has been no dividend paid by TARO during the year ended March 31, 2018 and March 31, 2017.
73 The Board of Directors of the Company at its meeting held on May 25, 2018, approved the Scheme of Arrangement between the Company, Sun Pharma (Netherlands) B.V. and Sun Pharmaceutical Holdings USA Inc. (both being wholly owned subsidiaries of the Company) which inter-alia, envisages spin-off of the specified investment undertaking of the Company. Further, the Board of Directors of the Company at its meeting held on November 14, 2017 had approved the Scheme of Arrangement between Company and Sun Pharma Global FZE (wholly owned subsidiary of the Company) which inter-alia, envisages demerger of unbranded generic pharmaceutical undertaking of Sun Pharma Global FZE into the Company. The above schemes shall be effective post receipt of
required approvals and accordingly, the consolidated financial statements do not reflect the impact, if any, on account of the schemes.
74 Tax expense (exceptional) for the year ended March 31, 2018 includes deferred tax assets of ` 2,585.7 Million created on difference on tax and book value on intra-group transfer of certain intangibles. Further, it also includes an impact of ` 5,130.2 Million on account of re-measurement of the Group’s deferred tax assets as a result of the Tax Cut and Jobs Act enacted in United States of America on December 22, 2017.
75 RELATED PARTY DISCLOSURES (IND AS-24) - AS PER ANNEXURE ‘B’

SUN PHARMACEUTICAL INDUSTRIES LIMITED
203
ANNUAL REPORT 2017-18
Notes to the Consolidated Financial Statementsfor the year ended March 31, 2018
CONSOLIDATED FINANCIAL STATEMENTS
76 BUSINESS COMBINATIONS Zenotech Laboratories Limited With effect from July 27, 2017 Zenotech Laboratories Limited
has ceased to be an associate and has become a subsidiary of Sun Pharmaceutical Industries Limited.
The Group has elected to measure the non-controlling interests in the acquiree at its proportionate share of net assets.
The following assets and liabilities were recognised as at the date of acquisition (at fair value):
` in MillionAssetsCash and cash equivalents 1,197.3 Trade receivables 0.1 Inventories 17.5 Other current assets 2.0 Other non-current assets 28.7 Property, plant and equipment and other intangible assets
1,689.8
Bank balances other than above 8.0 Other financial assets 1.2 Total 2,944.6 LiabilitiesBorrowings 512.0 Trade payables 48.3 Other current financial liabilities 297.4 Other current liabilities 184.5 Deferred tax liabilities - Provision 190.6 Total 1,232.8 Net worth 1,711.8 Total identifiable assets at fair valueNon-controlling interest 726.5 Goodwill 595.4 Total purchase price 1,580.7 Purchase price paid 855.0 Impairment reversal 725.7
From the date of acquisition, Zenotech Laboratories Limited has contributed revenue of ` 60.8 Million and loss before tax of ` 60.9 Million to the Group. If the business combinations had taken place at the beginning of the year, revenue would have been ` 64.1 Million and the loss before tax would have been ` 68.2 Million. In compliance with the relevant provisions of Ind AS 103, the Company has reversed impairment in the books to the extent of fair value of equity shares determined on the basis of right issue price amounting to ` 725.7 Million.
77 On November 23, 2016, Taro announced that its Board of Directors authorised a USD 250 Million share repurchase of ordinary shares. On November 07, 2017, Taro Board extended the share repurchase program for one year. During the year ended March 31, 2018, Taro has repurchased 1,085,694 shares at an average price of USD 102.52 (March 2017 : 2,252,725 shares at an average price of USD 130.87). Through May 01, 2018, in total under the authorisation, Taro has repurchased 1,774,064 shares at an average price of USD 102.83; with USD 67.6 Million remaining.
78 In March 2018, Taro reached a settlement with the tax authority, under which Taro is obligated to pay a reduced tax assessment of USD 15.0 Million, and Taro was permitted to record the unutilised capital loss, transfer intellectual property from Taro North America to Taro Israel and Taro Canada and reorganise assets held by Taro subsidiaries without triggering an Israeli tax event (the “Settlement”). The settlement settled all tax disputes between the parties for the tax years 2010 through 2014 as well as related tax issues with respect to the tax years 2015 through 2016, which years were not subject to the disputes.
As per our report of even date
For S R B C & CO LLP For and on behalf of the Board of Directors of Chartered Accountants Sun Pharmaceutical Industries LimitedICAI Firm Registration No. : 324982E/E300003
per PAUL ALVARES DILIP S. SHANGHVIPartner Managing DirectorMembership No. : 105754Mumbai, May 25, 2018
C. S. MURALIDHARAN SUDHIR V. VALIA Chief Financial Officer Wholetime Director
SUNIL R. AJMERA SAILESH T. DESAI Company Secretary Wholetime Director
Mumbai, May 25, 2018

SUN PHARMACEUTICAL INDUSTRIES LIMITED
204
Notes to the Consolidated Financial Statementsfor the year ended March 31, 2018
Disclosure of additional information pertaining to the Parent Company, subsidiaries, associates and joint ventures as per Schedule III of Companies Act, 2013:
S. No. Name of the entity
Net Assets, i.e., total assets minus total liabilities Share in profit or (loss)
Share in other comprehensive income
(OCI)
Share in total comprehensive income
(TCI)2017-18 2017-18 2017-18 2017-18
As % of consolidated
net assets` in Million
As % of consolidated
profit or (loss)` in Million
As % of consolidated
OCI` in Million
As % of consolidated
TCI` in Million
Parent Entity - Sun Pharmaceutical Industries Limited
47.1 1,97,701.0 (22.9) (4,945.9) 10.4 494.9 (16.9) (4,451.0)
Subsidiaries Indian1 Green Eco Development
Centre Limited 0.0 1.6 (0.0) (0.1) - - (0.0) (0.1)
2 Sun Pharma Laboratories Limited
46.9 196,823.7 40.5 8,762.2# 1.6 78.1 33.5 8,840.3#
3 Faststone Mercantile Company Private Limited
0.0 11.5 0.0 0.4 - - 0.0 0.4
4 Neetnav Real Estate Private Limited
0.7 2,920.9 0.0 0.6 - - 0.0 0.6
5 Realstone Multitrade Private Limited
0.0 11.5 0.0 0.4 - - 0.0 0.4
6 Skisen Labs Private Limited
0.0 0.0 0.0 0.0 - - 0.0 0.0
7 Softdeal Trading Company Private Limited
0.0 11.0 0.0 0.4 - - 0.0 0.4
8 Universal Enterprises Private Limited
0.0 5.3 0.0 0.0 - - 0.0 0.0
9 Sun Pharmaceutical Medicare Limited
(0.0) (83.9) (0.3) (61.4) (0.2) (11.5) (0.3) (72.9)
10 Zenotech Laboratories Limited
0.4 1,553.4 (0.7) (159.0)** 0.0 0.5 (0.6) (158.5)**
Foreign1 Sun Pharmaceutical
(Bangladesh) Limited 0.3 1,084.7 0.9 187.8 - - 0.7 187.8
2 Sun Farmaceutica Do Brasil Ltda.
(0.5) (2,289.9) (0.9) (199.1) - - (0.8) (199.1)
3 Sun Pharma De Mexico S.A. DE C.V.
0.2 717.1 1.0 223.5 - - 0.8 223.5
4 SPIL De Mexico S.A. DE C.V.
0.0 0.2 - - - - - -
5 Sun Pharmaceutical Peru S.A.C.
(0.0) (149.3) 0.0 1.8 - - 0.0 1.8
6 OOO "Sun Pharmaceutical Industries" Limited
(0.0) (187.8) (0.0) (10.0) - - (0.0) (10.0)
7 Sun Pharma De Venezuela, C.A.
(0.0) (2.6) (0.0) (0.7) - - (0.0) (0.7)
8 Ranbaxy Pharmacie Generiques
(0.5) (2,199.2) (1.2) (257.9) - - (1.0) (257.9)
9 Ranbaxy (Malaysia) SDN. BHD.
0.2 877.7 2.1 455.7 - - 1.7 455.7
10 Ranbaxy Nigeria Limited 0.1 211.2 (1.6) (343.5) - - (1.3) (343.5)11 Sun Pharma
(Netherlands) B.V (Formerly known as Ranbaxy (Netherlands) B.V.)
12.6 52,694.6 (5.0) (1,077.4)# 3.0 143.1 (3.5) (934.3)#
12 Alkaloida Chemical Company Zrt.
5.8 24,387.2 (0.8) (163.4) - - (0.6) (163.4)
ANNEXURE ‘A’

SUN PHARMACEUTICAL INDUSTRIES LIMITED
205
ANNUAL REPORT 2017-18
Notes to the Consolidated Financial Statementsfor the year ended March 31, 2018
CONSOLIDATED FINANCIAL STATEMENTS
S. No. Name of the entity
Net Assets, i.e., total assets minus total liabilities Share in profit or (loss)
Share in other comprehensive income
(OCI)
Share in total comprehensive income
(TCI)2017-18 2017-18 2017-18 2017-18
As % of consolidated
net assets` in Million
As % of consolidated
profit or (loss)` in Million
As % of consolidated
OCI` in Million
As % of consolidated
TCI` in Million
13 Sun Pharmaceuticals UK Limited
0.0 0.0 0.4 95.2 - - 0.4 95.2
14 Sun Pharmaceutical Industries (Australia) Pty Limited
0.4 1,512.7 (5.6) (1,220.1) - - (4.6) (1,220.1)
15 Aditya Acquisition Company Ltd.
0.0 12.0 0.0 5.6 - - 0.0 5.6
16 Sun Pharmaceutical Industries (Europe) B.V.
(0.0) (66.0) 0.3 62.0 - - 0.2 62.0
17 Sun Pharmaceuticals Italia S.R.L.
0.0 46.1 (0.0) (0.9) - - (0.0) (0.9)
18 Sun Pharmaceuticals Germany GmbH
(0.0) (207.2) 0.1 15.0 - - 0.1 15.0
19 Sun Pharmaceuticals France
(0.0) (24.7) (0.0) (4.5) - - (0.0) (4.5)
20 Sun Pharma Global FZE (Consolidated with a Joint venture)
30.3 127,032.1 10.6 2,295.7* 22.6 1,073.1 12.8 3,368.8*
21 Sun Pharmaceuticals (SA) (Pty) Ltd.
(0.0) (0.0) 0.0 0.1 - - 0.0 0.1
22 Sun Global Canada Pty. Ltd.
(0.0) (1.4) (0.0) (0.2) - - (0.0) (0.2)
23 Sun Pharma Philippines, Inc.
(0.1) (441.5) (0.2) (38.4) - - (0.1) (38.4)
24 Sun Pharmaceuticals Korea Ltd.
0.0 4.4 0.0 0.0 - - 0.0 0.0
25 Sun Global Development FZE
0.0 180.9 (0.0) (0.7) - - (0.0) (0.7)
26 Sun Pharma Japan Ltd. (0.4) (1,480.3) (4.4) (950.6) - - (3.6) (950.6)27 Sun Pharma HealthCare
FZE 0.0 183.4 0.0 2.2 - - 0.0 2.2
28 Sun Laboratories FZE (0.1) (265.1) 0.4 79.9 - - 0.3 79.9 29 Taro Pharmaceutical
Industries Ltd. (TARO) (Consolidated with its Subsidiaries)
34.8 146,191.6 76.6 16,551.7 45.0 2,140.0 70.9 18,691.7
30 Alkaloida Sweden AB 0.0 38.3 0.1 14.3 - - 0.1 14.3 31 Sun Pharma Switzerland
Ltd. 0.6 2,631.0 (0.0) (4.7) - - (0.0) (4.7)
32 Sun Pharma Holdings 48.6 204,008.4 (0.1) (29.5) - - (0.1) (29.5)33 Sun Pharma East Africa
Limited (0.0) (148.8) (0.3) (73.6) - - (0.3) (73.6)
34 Sun Pharma ANZ Pty Ltd (Formerly known as Ranbaxy Australia Pty Ltd)
(0.1) (348.2) 0.4 80.2 - - 0.3 80.2
35 Ranbaxy Farmaceutica Ltda.
(0.3) (1,103.7) (0.4) (89.2) - - (0.3) (89.2)
36 Ranbaxy Pharmaceuticals Canada Inc.
0.1 278.2 (0.3) (62.6) - - (0.2) (62.6)
37 Sun Pharma Egypt Limited LLC (Formerly known as Ranbaxy Egypt Ltd)
0.1 382.7 (0.1) (22.0) - - (0.1) (22.0)
38 Rexcel Egypt LLC (0.0) (18.7) (0.0) (7.3) - - (0.0) (7.3)39 Office Pharmaceutique
Industriel Et Hospitalier 0.0 93.8 0.0 2.5 - - 0.0 2.5
ANNEXURE ‘A’Disclosure of additional information pertaining to the Parent Company, subsidiaries, associates and joint ventures as per Schedule III of Companies Act, 2013:

SUN PHARMACEUTICAL INDUSTRIES LIMITED
206
Notes to the Consolidated Financial Statementsfor the year ended March 31, 2018
S. No. Name of the entity
Net Assets, i.e., total assets minus total liabilities Share in profit or (loss)
Share in other comprehensive income
(OCI)
Share in total comprehensive income
(TCI)2017-18 2017-18 2017-18 2017-18
As % of consolidated
net assets` in Million
As % of consolidated
profit or (loss)` in Million
As % of consolidated
OCI` in Million
As % of consolidated
TCI` in Million
40 Basics GmbH 0.2 1,024.6 0.3 54.1 - - 0.2 54.1 41 Ranbaxy GmbH 0.0 2.0 - - - - - - 42 Ranbaxy Ireland Limited 0.1 571.0 (0.1) (14.7) - - (0.1) (14.7)43 Ranbaxy Italia S.P.A. 0.0 0.7 (0.0) (6.5) - - (0.0) (6.5)44 Sun Pharmaceutical
Industries S.A.C. (Formerly known as Ranbaxy - PRP (Peru) S.A.C.)
(0.0) (125.0) (0.1) (29.6) - - (0.1) (29.6)
45 Ranbaxy (Poland) SP. Z O.O. 0.0 194.8 0.1 11.8 - - 0.0 11.8 46 Terapia S.A. 3.4 14,079.7 10.1 2,174.2 - - 8.2 2,174.2 47 AO Ranbaxy (Formerly
Known ZAO Ranbaxy) 0.2 1,027.0 0.3 57.8 - - 0.2 57.8
48 JSC Biosintez 0.2 994.4 (2.4) (511.8) - - (1.9) (511.8)49 Ranbaxy South Africa (Pty)
Limited (Consolidated with its Subsidiary)
0.3 1,225.3 1.4 307.9 - - 1.2 307.9
50 Ranbaxy Pharmaceuticals (Pty) Limited
(0.2) (979.5) 0.8 183.1 - - 0.7 183.1
51 Be- Tabs Investments (Pty) Limited
0.0 19.8 - - - - - -
52 Laboratorios Ranbaxy, S.L.U.
0.1 355.3 0.3 62.9 - - 0.2 62.9
53 Ranbaxy (U.K.) Limited 0.3 1,383.9 0.3 55.7 - - 0.2 55.7 54 Ranbaxy Holdings (U.K.)
Limited 0.7 2,832.7 - - - - - -
55 Ranbaxy Europe Limited 0.0 0.0 (0.0) (0.1) - - (0.0) (0.1)56 Sun Pharma Holding USA
Inc (Consolidated with its Subsidiaries, its associates and a Joint venture)
11.8 49,434.6 (25.3) (5,466.9)# - - (20.7) (5,466.9)#
57 Ranbaxy (Thailand) Co., Ltd.
0.0 208.0 0.1 30.0 - - 0.1 30.0
58 Sun Pharmaceuticals Morocco LLC (Formerly known as Ranbaxy Morocco LLC)
(0.0) (72.9) (0.1) (31.2) - - (0.1) (31.2)
59 "Ranbaxy Pharmaceuticals Ukraine" LLC
0.0 158.6 0.2 48.0 - - 0.2 48.0
Non controlling interest in all subsidiaries
9.3 38,841.6 (20.7) (4,468.0) (10.0) (477.7) (18.8) (4,945.7)
Intercompany Elimination and Consolidation Adjustments
(153.6) (643,919.3) 46.2 10,044.3 27.6 1,314.3 43.0 11,358.6
Total 100.0 419,847.2 100.0 21,615.5 100.0 4,754.8 100.0 26,370.3
# Includes share of profit/loss and share of TCI, from its associates and a joint venture of ` 262.0 Million* Includes share of profit and share of TCI, from a joint venture of ` 7.6 Million ** With effect from July 27, 2017 Zenotech Laboratories Limited has ceased to be an associate and has become subsidiary of Sun Pharmaceutical Industries Limited.Note: The above amounts / percentage of net assets and net profit or (loss) in respect of the Parent Company, its subsidiaries, associates and joint ventures
are determined based on the amounts of the respective entities included in consolidated financial statements before inter-company eliminations / consolidation adjustments.
ANNEXURE ‘A’Disclosure of additional information pertaining to the Parent Company, subsidiaries, associates and joint ventures as per Schedule III of Companies Act, 2013:
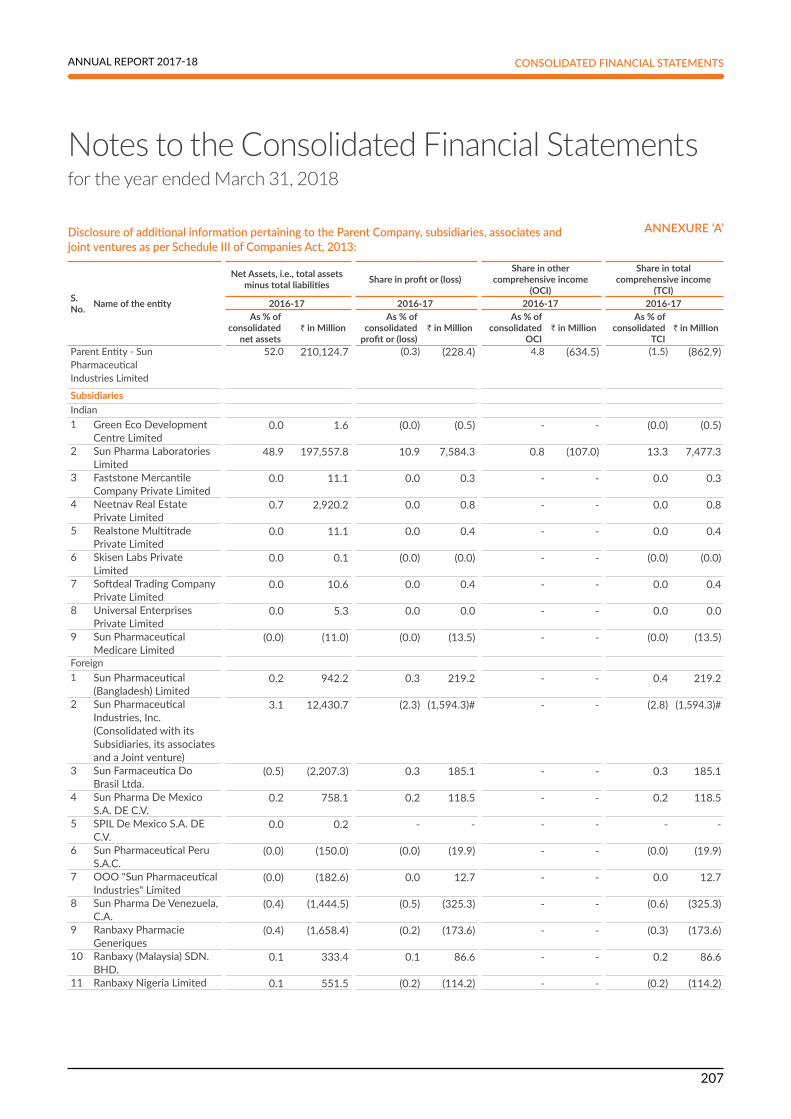
SUN PHARMACEUTICAL INDUSTRIES LIMITED
207
ANNUAL REPORT 2017-18
Notes to the Consolidated Financial Statementsfor the year ended March 31, 2018
CONSOLIDATED FINANCIAL STATEMENTS
S. No. Name of the entity
Net Assets, i.e., total assets minus total liabilities Share in profit or (loss)
Share in other comprehensive income
(OCI)
Share in total comprehensive income
(TCI)2016-17 2016-17 2016-17 2016-17
As % of consolidated
net assets` in Million
As % of consolidated
profit or (loss)` in Million
As % of consolidated
OCI` in Million
As % of consolidated
TCI` in Million
Parent Entity - Sun Pharmaceutical Industries Limited
52.0 210,124.7 (0.3) (228.4) 4.8 (634.5) (1.5) (862.9)
Subsidiaries Indian1 Green Eco Development
Centre Limited 0.0 1.6 (0.0) (0.5) - - (0.0) (0.5)
2 Sun Pharma Laboratories Limited
48.9 197,557.8 10.9 7,584.3 0.8 (107.0) 13.3 7,477.3
3 Faststone Mercantile Company Private Limited
0.0 11.1 0.0 0.3 - - 0.0 0.3
4 Neetnav Real Estate Private Limited
0.7 2,920.2 0.0 0.8 - - 0.0 0.8
5 Realstone Multitrade Private Limited
0.0 11.1 0.0 0.4 - - 0.0 0.4
6 Skisen Labs Private Limited
0.0 0.1 (0.0) (0.0) - - (0.0) (0.0)
7 Softdeal Trading Company Private Limited
0.0 10.6 0.0 0.4 - - 0.0 0.4
8 Universal Enterprises Private Limited
0.0 5.3 0.0 0.0 - - 0.0 0.0
9 Sun Pharmaceutical Medicare Limited
(0.0) (11.0) (0.0) (13.5) - - (0.0) (13.5)
Foreign1 Sun Pharmaceutical
(Bangladesh) Limited 0.2 942.2 0.3 219.2 - - 0.4 219.2
2 Sun Pharmaceutical Industries, Inc. (Consolidated with its Subsidiaries, its associates and a Joint venture)
3.1 12,430.7 (2.3) (1,594.3)# - - (2.8) (1,594.3)#
3 Sun Farmaceutica Do Brasil Ltda.
(0.5) (2,207.3) 0.3 185.1 - - 0.3 185.1
4 Sun Pharma De Mexico S.A. DE C.V.
0.2 758.1 0.2 118.5 - - 0.2 118.5
5 SPIL De Mexico S.A. DE C.V.
0.0 0.2 - - - - - -
6 Sun Pharmaceutical Peru S.A.C.
(0.0) (150.0) (0.0) (19.9) - - (0.0) (19.9)
7 OOO "Sun Pharmaceutical Industries" Limited
(0.0) (182.6) 0.0 12.7 - - 0.0 12.7
8 Sun Pharma De Venezuela, C.A.
(0.4) (1,444.5) (0.5) (325.3) - - (0.6) (325.3)
9 Ranbaxy Pharmacie Generiques
(0.4) (1,658.4) (0.2) (173.6) - - (0.3) (173.6)
10 Ranbaxy (Malaysia) SDN. BHD.
0.1 333.4 0.1 86.6 - - 0.2 86.6
11 Ranbaxy Nigeria Limited 0.1 551.5 (0.2) (114.2) - - (0.2) (114.2)
ANNEXURE ‘A’Disclosure of additional information pertaining to the Parent Company, subsidiaries, associates and joint ventures as per Schedule III of Companies Act, 2013:

SUN PHARMACEUTICAL INDUSTRIES LIMITED
208
Notes to the Consolidated Financial Statementsfor the year ended March 31, 2018
S. No. Name of the entity
Net Assets, i.e., total assets minus total liabilities Share in profit or (loss)
Share in other comprehensive income
(OCI)
Share in total comprehensive income
(TCI)2016-17 2016-17 2016-17 2016-17
As % of consolidated
net assets` in Million
As % of consolidated
profit or (loss)` in Million
As % of consolidated
OCI` in Million
As % of consolidated
TCI` in Million
12 Sun Pharma (Netherlands) B.V. (Formerly known as Ranbaxy (Netherlands) B.V. )
13.2 53,421.2 1.5 1,079.2 - - 1.9 1,079.2
13 Alkaloida Chemical Company Zrt.
6.1 24,524.0 (1.9) (1,356.0) - - (2.4) (1,356.0)
14 Sun Pharmaceuticals UK Limited
(0.0) (91.4) (0.0) (0.8) - - (0.0) (0.8)
15 Sun Pharmaceutical Industries (Australia) Pty Limited
0.5 1,975.6 (0.5) (360.9) - - (0.6) (360.9)
16 Aditya Acquisition Company Ltd.
0.0 6.0 0.0 5.6 - - 0.0 5.6
17 Sun Pharmaceutical Industries (Europe) B.V.
(0.0) (110.5) 0.0 26.9 - - 0.0 26.9
18 Sun Pharmaceuticals Italia S.R.L.
0.0 40.5 (0.0) (1.5) - - (0.0) (1.5)
19 Sun Pharmaceuticals Spain, S.L.U.
- - (0.0) (5.2) - - (0.0) (5.2)
20 Sun Pharmaceuticals Germany GmbH
(0.0) (186.0) (0.0) (2.4) - - (0.0) (2.4)
21 Sun Pharmaceuticals France
(0.0) (17.1) (0.0) (4.3) - - (0.0) (4.3)
22 Sun Pharma Global FZE (Consolidated with a Joint venture)
30.5 123,500.6 21.0 14,620.6* 27.4 (3,657.4) 19.5 10,963.2*
23 Sun Pharmaceuticals SA (Pty) Ltd
(0.0) (0.1) (0.0) (0.0) - - (0.0) (0.0)
24 Sun Global Canada Pty. Ltd.
(0.0) (1.1) (0.0) (0.0) - - (0.0) (0.0)
25 Sun Pharma Philippines, Inc.
(0.1) (419.5) (0.2) (152.5) - - (0.3) (152.5)
26 Sun Pharmaceuticals Korea Ltd.
0.0 4.2 (0.0) (0.3) - - (0.0) (0.3)
27 Sun Global Development FZE
0.0 181.3 (0.0) (0.7) - - (0.0) (0.7)
28 Sun Pharma Japan Ltd. (0.1) (443.6) (0.2) (117.8) - - (0.2) (117.8)29 Sun Pharma HealthCare
FZE 0.0 181.0 0.0 2.5 - - 0.0 2.5
30 Sun Laboratories FZE (0.1) (344.7) (0.2) (114.3) - - (0.2) (114.3)31 Taro Pharmaceutical
Industries Ltd. (TARO) (Consolidated with its Subsidiaries)
33.2 134,415.9 44.0 30,612.8 12.6 (1,683.7) 51.4 28,929.1
32 Alkaloida Sweden AB 0.0 20.0 0.0 9.6 - - 0.0 9.6 33 Sun Pharma Switzerland
Ltd. (0.0) (21.8) (0.0) (27.8) - - (0.0) (27.8)
34 Ocular Technologies SARL 0.6 2,626.6 3.9 2,713.8 - - 4.8 2,713.8 35 Sun Pharma Holdings 50.4 203,802.5 (0.0) (9.7) - - (0.0) (9.7)
ANNEXURE ‘A’Disclosure of additional information pertaining to the Parent Company, subsidiaries, associates and joint ventures as per Schedule III of Companies Act, 2013:

SUN PHARMACEUTICAL INDUSTRIES LIMITED
209
ANNUAL REPORT 2017-18
Notes to the Consolidated Financial Statementsfor the year ended March 31, 2018
CONSOLIDATED FINANCIAL STATEMENTS
S. No. Name of the entity
Net Assets, i.e., total assets minus total liabilities Share in profit or (loss)
Share in other comprehensive income
(OCI)
Share in total comprehensive income
(TCI)2016-17 2016-17 2016-17 2016-17
As % of consolidated
net assets` in Million
As % of consolidated
profit or (loss)` in Million
As % of consolidated
OCI` in Million
As % of consolidated
TCI` in Million
36 Sun Pharma East Africa Limited
(0.0) (71.5) (0.0) (32.2) - - (0.1) (32.2)
37 Sun Pharma ANZ Pty Ltd (Formerly known as Ranbaxy Australia Pty Ltd)
(0.1) (429.7) 0.0 34.8 - - 0.1 34.8
38 Ranbaxy Farmaceutica Ltda.
(0.3) (1,070.3) 0.1 87.3 - - 0.2 87.3
39 Ranbaxy Pharmaceuticals Canada Inc.
0.1 332.7 (0.1) (64.1) - - (0.1) (64.1)
40 Sun Pharma Egypt Limited LLC (Formerly known as Ranbaxy Egypt Ltd)
0.1 265.7 (0.1) (95.4) - - (0.2) (95.4)
41 Rexcel Egypt LLC (0.0) (10.9) (0.0) (11.8) - - (0.0) (11.8)42 Office Pharmaceutique
Industriel Et Hospitalier 0.0 78.6 0.0 14.5 - - 0.0 14.5
43 Basics GmbH 0.2 842.2 0.1 41.2 - - 0.1 41.2 44 Ranbaxy GmbH 0.0 1.7 - - - - - - 45 Ranbaxy Ireland Limited 0.1 505.2 0.2 146.8 - - 0.3 146.8 46 Ranbaxy Italia S.P.A. 0.0 19.8 (0.0) (33.9) 0.0 (2.5) (0.1) (36.4)47 Sun Pharmaceutical
Industries S.A.C. (Formerly known as Ranbaxy - PRP (Peru) S.A.C.)
(0.0) (94.5) (0.0) (22.2) - - (0.0) (22.2)
48 Ranbaxy (Poland) Sp. Z o.o.
0.0 156.9 0.0 11.0 - - 0.0 11.0
49 Terapia S.A. 2.6 10,409.9 3.2 2,237.1 - - 4.0 2,237.1 50 AO Ranbaxy (Formerly
Known ZAO Ranbaxy) 0.2 987.2 0.2 143.0 - - 0.3 143.0
51 JSC Biosintez 0.4 1,703.7 0.0 25.1 - - 0.0 25.1 52 Ranbaxy South Africa
Proprietary Limited (Consolidated with its Subsidiary)
0.2 852.4 0.4 308.1 - - 0.5 308.1
53 Ranbaxy Pharmaceuticals (Pty) Limited
(0.3) (1,035.4) 0.3 186.9 - - 0.3 186.9
54 Be- Tabs Investments (Pty) Limited
0.0 17.3 0.0 0.1 - - 0.0 0.1
55 Laboratorios Ranbaxy, S.L.U.
0.1 248.6 0.2 104.9 - - 0.2 104.9
56 Ranbaxy (U.K.) Limited 0.3 1,164.6 0.1 63.2 - - 0.1 63.2 57 Ranbaxy Holdings (U.K.)
Limited 0.6 2,480.0 (0.0) (1.0) - - (0.0) (1.0)
58 Ranbaxy Europe Limited 0.0 148.1 0.0 0.0 - - 0.0 0.0 59 Ranbaxy Inc. (Consolidated
with its Subsidiaries) 9.4 38,000.0 7.6 5,297.3 - - 9.4 5,297.3
60 Sun Pharmaceuticals Holdings USA, INC
5.1 20,673.7 0.0 0.1 - - 0.0 0.1
61 Ranbaxy (Thailand) Co., Ltd.
0.0 160.8 (0.1) (91.1) - - (0.2) (91.1)
ANNEXURE ‘A’Disclosure of additional information pertaining to the Parent Company, subsidiaries, associates and joint ventures as per Schedule III of Companies Act, 2013:

SUN PHARMACEUTICAL INDUSTRIES LIMITED
210
Notes to the Consolidated Financial Statementsfor the year ended March 31, 2018
S. No. Name of the entity
Net Assets, i.e., total assets minus total liabilities Share in profit or (loss)
Share in other comprehensive income
(OCI)
Share in total comprehensive income
(TCI)2016-17 2016-17 2016-17 2016-17
As % of consolidated
net assets` in Million
As % of consolidated
profit or (loss)` in Million
As % of consolidated
OCI` in Million
As % of consolidated
TCI` in Million
62 Sun Pharmaceuticals Morocco LLC (Formerly known as Ranbaxy Morocco LLC)
(0.0) (40.2) 0.1 81.7 - - 0.1 81.7
63 "Ranbaxy Pharmaceuticals Ukraine" LLC
0.0 107.4 0.0 27.1 - - 0.0 27.1
Non controlling interest in all subsidiaries
9.4 37,908.6 (12.7) (8,818.6) (11.5) 1,534.3 (12.9) (7,284.3)
Foreign Joint Venture (Investment as per equity method)1 MSD - Sun LLC
(Consolidated with its subsidiary)
0.0 0.7 - - - - - -
Intercompany Elimination and Consolidation Adjustments
(166.3) (673,076.4) 24.8 17,348.4 65.9 (8,786.8) 15.1 8,561.6
Total 100.0 404,305.3 100.0 69,643.7 100.0 (13,337.6) 100.0 56,306.1 # Includes share of profit and share of TCI, from its associates and joint venture of ` 101.8 Million. * Includes share of loss and share of TCI, from a joint venture of ` 2.5 Million.Note: The above amounts / percentage of net assets and net profit or (loss) in respect of the Parent Company, its subsidiaries, associates and joint ventures
are determined based on the amounts of the respective entities included in consolidated financial statements before inter-company eliminations / consolidation adjustments.
ANNEXURE ‘A’Disclosure of additional information pertaining to the Parent Company, subsidiaries, associates and joint ventures as per Schedule III of Companies Act, 2013:

SUN PHARMACEUTICAL INDUSTRIES LIMITED
211
ANNUAL REPORT 2017-18
Notes to the Consolidated Financial Statementsfor the year ended March 31, 2018
CONSOLIDATED FINANCIAL STATEMENTS
IND AS- 24 - “ RELATED PARTY DISCLOSURES” ANNEXURE ‘B’Names of related parties where there are transactions and description of relationships
a Key Managerial Personnel (KMP)Dilip S. Shanghvi Managing DirectorSudhir V. Valia Executive DirectorSailesh T. Desai Executive DirectorIsrael Makov Chairman and Non- Executive DirectorKalyansundaram Subramanian (w.e.f. February 14, 2017) Executive Director
b Non - Executive DirectorsS. Mohanchand DadhaHasmukh S. Shah (resigned w.e.f. November 15, 2017)Keki M. MistryAshwin S. DaniRekha SethiVivek C. Sehgal (w.e.f. November 14, 2017)
c Relatives of Key Managerial Personnel Aalok ShanghviVidhi Shanghvi
d Others (Entities in which the KMP and Relatives of KMP have control or significant influence) Makov Associates LtdShantilal Shanghvi FoundationSun Pharma Advanced Research Company LtdSun Petrochemicals Pvt LtdAlfa Infraprop Pvt. Ltd.Sidmak Laboratories India Private LimitedRamdev Chemicals Private LimitedSholapur Organics Private LimitedUnited Medisales Private LimitedVirtous Finance Private LimitedAditya Medisales Limited United Medisales Private Limited
e Joint VentureS & I Ophthalmic LLCArtes Biotechnology GmbH
f AssociatesZenotech Laboratories Limited [Refer note 39 (t) and 39 (u)] Daiichi Sankyo (Thailand) Ltd. [Refer note 39 (r)]Medinstill LLCscPharmaceuticals Inc.Trumpcard Advisors and Finvest LLP Generic Solar Power LLPVintage Power Generation LLP
g Unconsolidated subsidiaryFoundation for Disease Elimination and Control of India
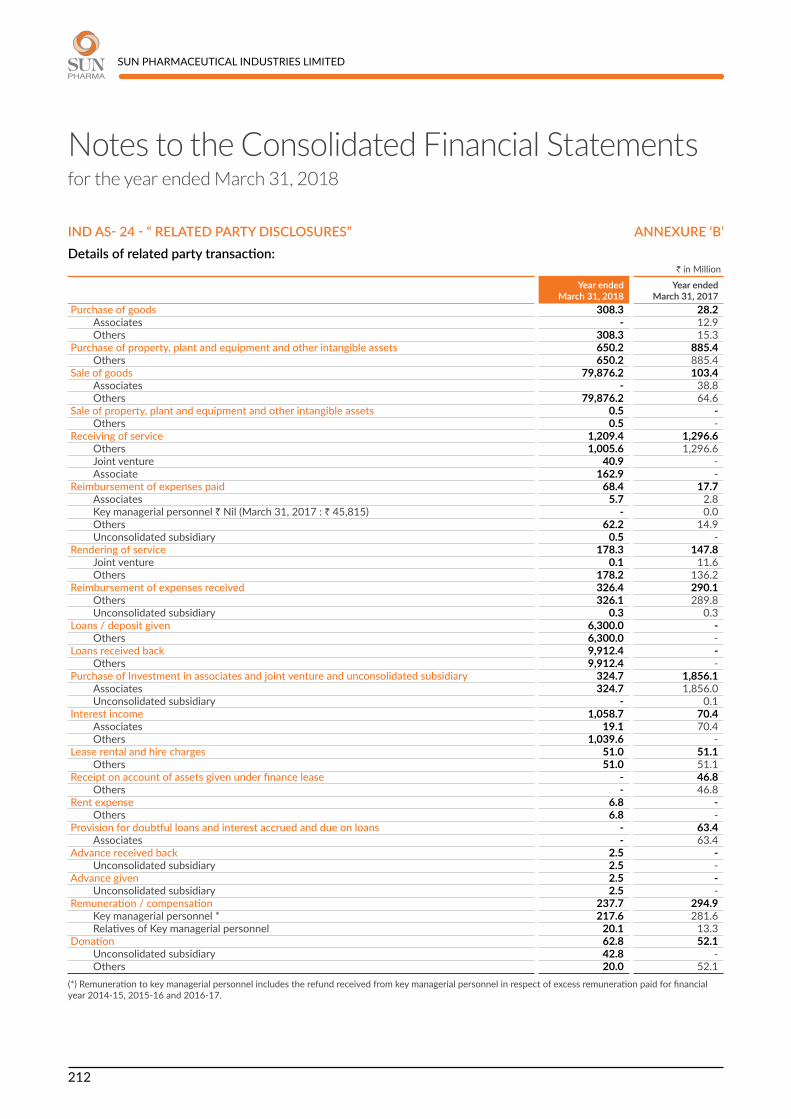
SUN PHARMACEUTICAL INDUSTRIES LIMITED
212
Notes to the Consolidated Financial Statementsfor the year ended March 31, 2018
IND AS- 24 - “ RELATED PARTY DISCLOSURES” ANNEXURE ‘B’Details of related party transaction:
` in Million
Year ended March 31, 2018
Year ended March 31, 2017
Purchaseofgoods 308.3 28.2 Associates - 12.9 Others 308.3 15.3 Purchaseofproperty,plantandequipmentandotherintangibleassets 650.2 885.4 Others 650.2 885.4 Saleofgoods 79,876.2 103.4 Associates - 38.8 Others 79,876.2 64.6 Saleofproperty,plantandequipmentandotherintangibleassets 0.5 - Others 0.5 - Receivingofservice 1,209.4 1,296.6 Others 1,005.6 1,296.6 Joint venture 40.9 - Associate 162.9 - Reimbursementofexpensespaid 68.4 17.7 Associates 5.7 2.8 Key managerial personnel ` Nil (March 31, 2017 : ` 45,815) - 0.0 Others 62.2 14.9 Unconsolidated subsidiary 0.5 - Renderingofservice 178.3 147.8 Joint venture 0.1 11.6 Others 178.2 136.2 Reimbursementofexpensesreceived 326.4 290.1 Others 326.1 289.8 Unconsolidated subsidiary 0.3 0.3 Loans/depositgiven 6,300.0 - Others 6,300.0 - Loansreceivedback 9,912.4 - Others 9,912.4 - PurchaseofInvestmentinassociatesandjointventureandunconsolidatedsubsidiary 324.7 1,856.1 Associates 324.7 1,856.0 Unconsolidated subsidiary - 0.1 Interest income 1,058.7 70.4 Associates 19.1 70.4 Others 1,039.6 - Leaserentalandhirecharges 51.0 51.1 Others 51.0 51.1 Receiptonaccountofassetsgivenunderfinancelease - 46.8 Others - 46.8 Rentexpense 6.8 - Others 6.8 - Provisionfordoubtfulloansandinterestaccruedanddueonloans - 63.4 Associates - 63.4 Advancereceivedback 2.5 - Unconsolidated subsidiary 2.5 - Advancegiven 2.5 - Unconsolidated subsidiary 2.5 - Remuneration/compensation 237.7 294.9 Key managerial personnel * 217.6 281.6 Relatives of Key managerial personnel 20.1 13.3 Donation 62.8 52.1 Unconsolidated subsidiary 42.8 - Others 20.0 52.1
(*) Remuneration to key managerial personnel includes the refund received from key managerial personnel in respect of excess remuneration paid for financial year 2014-15, 2015-16 and 2016-17.
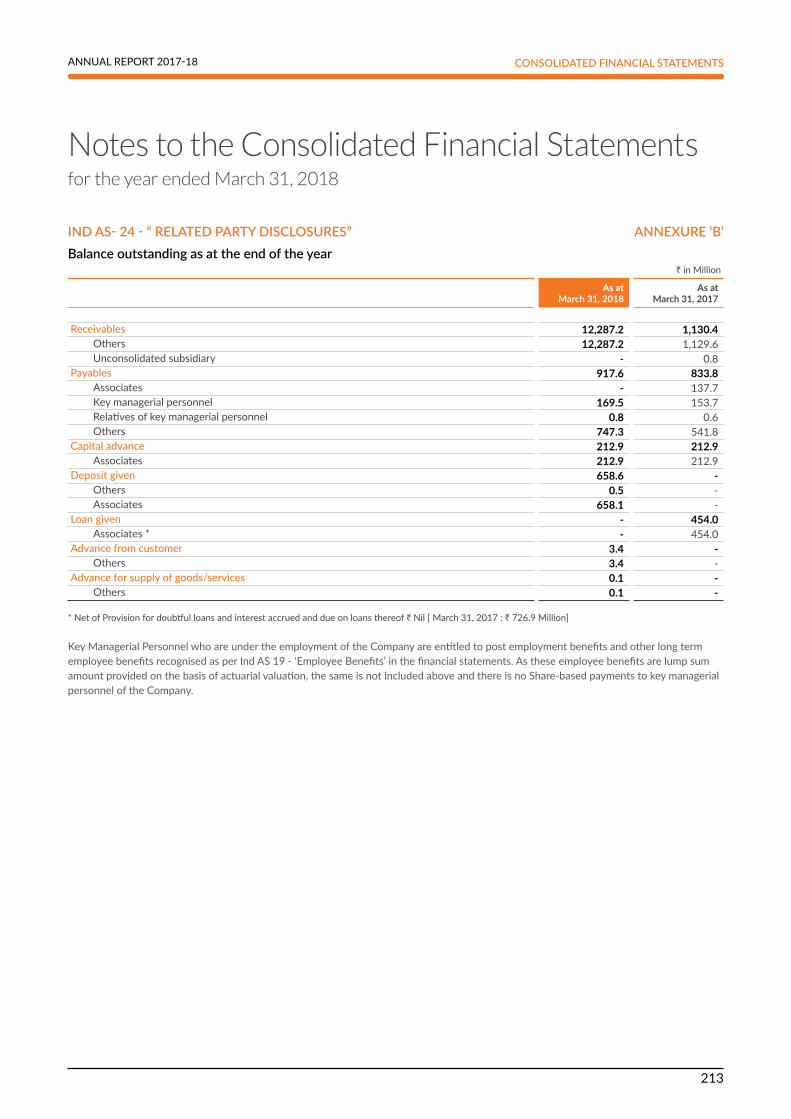
SUN PHARMACEUTICAL INDUSTRIES LIMITED
213
ANNUAL REPORT 2017-18
Notes to the Consolidated Financial Statementsfor the year ended March 31, 2018
CONSOLIDATED FINANCIAL STATEMENTS
IND AS- 24 - “ RELATED PARTY DISCLOSURES” ANNEXURE ‘B’Balance outstanding as at the end of the year
` in Million
As atMarch 31, 2018
As atMarch 31, 2017
Receivables 12,287.2 1,130.4 Others 12,287.2 1,129.6 Unconsolidated subsidiary - 0.8 Payables 917.6 833.8 Associates - 137.7 Key managerial personnel 169.5 153.7 Relatives of key managerial personnel 0.8 0.6 Others 747.3 541.8 Capitaladvance 212.9 212.9 Associates 212.9 212.9 Depositgiven 658.6 - Others 0.5 - Associates 658.1 - Loangiven - 454.0 Associates * - 454.0 Advancefromcustomer 3.4 - Others 3.4 - Advanceforsupplyofgoods/services 0.1 - Others 0.1 -
* Net of Provision for doubtful loans and interest accrued and due on loans thereof ` Nil [ March 31, 2017 : ` 726.9 Million]
Key Managerial Personnel who are under the employment of the Company are entitled to post employment benefits and other long term employee benefits recognised as per Ind AS 19 - ‘Employee Benefits’ in the financial statements. As these employee benefits are lump sum amount provided on the basis of actuarial valuation, the same is not included above and there is no Share-based payments to key managerial personnel of the Company.
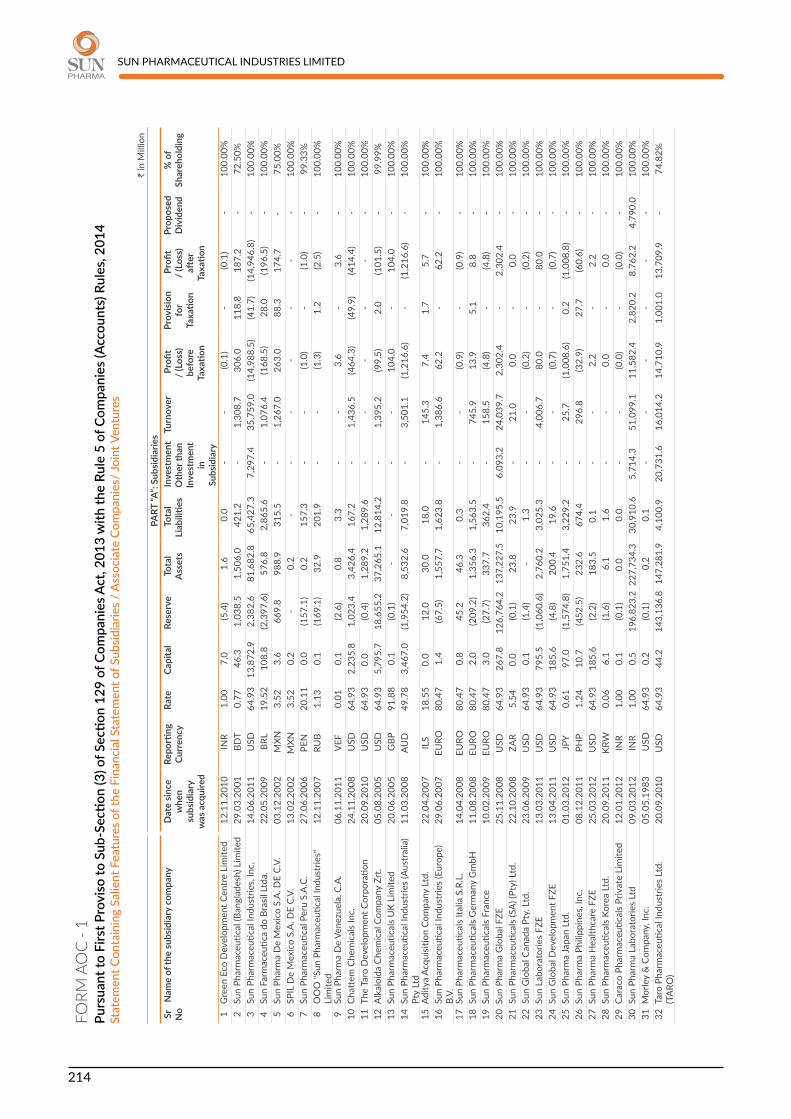
SUN PHARMACEUTICAL INDUSTRIES LIMITED
214
` in
Mill
ion
PART
“A”:
Subs
idia
ries
Sr
No
Nam
e of
the
subs
idia
ry c
ompa
nyD
ate
sinc
e w
hen
subs
idia
ry
was
acq
uire
d
Repo
rting
Cu
rren
cy R
ate
Cap
ital
Res
erve
To
tal
Ass
ets
Tota
l Li
abili
ties
Inve
stm
ent
Oth
er th
an
Inve
stm
ent
in
Subs
idia
ry
Turn
over
P
rofit
/
(Los
s)
befo
re
Taxa
tion
Prov
isio
n fo
r Ta
xatio
n
Pro
fit
/ (L
oss)
aft
er
Taxa
tion
Prop
osed
D
ivid
end
% o
f Sh
areh
oldi
ng
1G
reen
Eco
Dev
elop
men
t Cen
tre
Lim
ited
12.1
1.20
10 IN
R 1
.00
7.0
(5
.4)
1.6
0
.0
- -
(0.1
) -
(0.1
) -
100.
00%
2Su
n Ph
arm
aceu
tical
(Ban
glad
esh)
Lim
ited
29.0
3.20
01 B
DT
0.7
7 4
6.3
1,0
38.5
1
,506
.0
421
.2
- 1
,308
.7
306
.0
118
.8
187
.2
- 72
.50%
3Su
n Ph
arm
aceu
tical
Indu
strie
s, In
c.14
.06.
2011
USD
6
4.93
13
,872
.9
2,3
82.6
8
1,68
2.8
65,
427.
3 7
,297
.4
35,
759.
0 (1
4,98
8.5)
(41.
7) (1
4,94
6.8)
- 10
0.00
%4
Sun
Farm
aceu
tica
do B
rasil
Ltd
a.22
.05.
2009
BRL
1
9.52
1
08.8
(2
,397
.6)
576
.8
2,8
65.6
-
1,0
76.4
(1
68.5
) 2
8.0
(196
.5)
- 10
0.00
%5
Sun
Phar
ma
De
Mex
ico
S.A
. DE
C.V.
03.1
2.20
02 M
XN
3.5
2 3
.6
669
.8
988
.9
315
.5
- 1
,267
.0
263
.0
88.
3 1
74.7
-
75.0
0%6
SPIL
De
Mex
ico
S.A
. DE
C.V.
13.0
2.20
02M
XN 3
.52
0.2
-
0.2
-
- -
- -
- -
100.
00%
7Su
n Ph
arm
aceu
tical
Per
u S.
A.C
.27
.06.
2006
PEN
20.
11
0.0
(1
57.1
) 0
.2
157
.3
- -
(1.0
) -
(1.0
) -
99.3
3%8
OO
O "S
un P
harm
aceu
tical
Indu
strie
s"
Lim
ited
12.1
1.20
07RU
B 1
.13
0.1
(1
69.1
) 3
2.9
201
.9
- -
(1.3
) 1
.2
(2.5
) -
100.
00%
9Su
n Ph
arm
a D
e Ve
nezu
ela,
C.A
.06
.11.
2011
VEF
0.0
1 0
.1
(2.6
) 0
.8
3.3
-
- 3
.6
- 3
.6
- 10
0.00
%10
Chatt
em C
hem
ical
s In
c.24
.11.
2008
USD
6
4.93
2
,235
.8
1,0
23.4
3
,426
.4
167
.2
- 1
,436
.5
(464
.3)
(49.
9) (4
14.4
) -
100.
00%
11Th
e Ta
ro D
evel
opm
ent C
orpo
ratio
n20
.09.
2010
USD
6
4.93
0.
0 (0
.4)
1,2
89.2
1
,289
.6
- -
- -
- -
100.
00%
12A
lkal
oida
Che
mic
al C
ompa
ny Z
rt.
05.0
8.20
05 U
SD
64.
93
5,7
95.7
1
8,65
5.2
37,
265.
1 1
2,81
4.2
- 1
,395
.2
(99.
5) 2
.0
(101
.5)
- 99
.99%
13Su
n Ph
arm
aceu
tical
s U
K Li
mite
d20
.06.
2005
GBP
9
1.88
0
.1
(0.1
) -
- -
- 1
04.0
-
104
.0
- 10
0.00
%14
Sun
Phar
mac
eutic
al In
dust
ries
(Aus
tral
ia)
Pty
Ltd
11.0
3.20
08AU
D 4
9.78
3
,467
.0
(1,9
54.2
) 8
,532
.6
7,0
19.8
-
3,5
01.1
(1
,216
.6)
- (1
,216
.6)
- 10
0.00
%
15Ad
itya
Acqu
isitio
n Co
mpa
ny L
td.
22.0
4.20
07IL
S 1
8.55
0.
0 1
2.0
30.
0 1
8.0
- 1
45.3
7
.4
1.7
5
.7
- 10
0.00
%16
Sun
Phar
mac
eutic
al In
dust
ries
(Eur
ope)
B.
V.29
.06.
2007
EURO
80.
47
1.4
(6
7.5)
1,5
57.7
1
,623
.8
- 1
,386
.6
62.
2 -
62.
2 -
100.
00%
17Su
n Ph
arm
aceu
tical
s Ita
lia S
.R.L
.14
.04.
2008
EURO
80.
47
0.8
4
5.2
46.
3 0
.3
- -
(0.9
) -
(0.9
) -
100.
00%
18Su
n Ph
arm
aceu
tical
s G
erm
any
Gm
bH11
.08.
2008
EURO
80.
47
2.0
(2
09.2
) 1
,356
.3
1,5
63.5
-
745
.9
13.
9 5
.1
8.8
-
100.
00%
19Su
n Ph
arm
aceu
tical
s Fr
ance
10.0
2.20
09EU
RO 8
0.47
3
.0
(27.
7) 3
37.7
3
62.4
-
158
.5
(4.8
) -
(4.8
) -
100.
00%
20Su
n Ph
arm
a G
loba
l FZE
25.1
1.20
08U
SD 6
4.93
2
67.8
12
6,76
4.2
137
,227
.5
10,
195.
5 6
,093
.2
24,
039.
7 2
,302
.4
- 2
,302
.4
- 10
0.00
%21
Sun
Phar
mac
eutic
als
(SA
) (Pt
y) L
td.
22.1
0.20
08ZA
R 5
.54
0.0
(0.1
) 2
3.8
23.
9 -
21.
0 0
.0
- 0
.0
- 10
0.00
%22
Sun
Glo
bal C
anad
a Pt
y. L
td.
23.0
6.20
09U
SD 6
4.93
0
.1
(1.4
) -
1.3
-
- (0
.2)
- (0
.2)
- 10
0.00
%23
Sun
Labo
rato
ries
FZE
13.0
3.20
11U
SD 6
4.93
7
95.5
(1
,060
.6)
2,7
60.2
3
,025
.3
- 4
,006
.7
80.
0 -
80.
0 -
100.
00%
24Su
n G
loba
l Dev
elop
men
t FZE
13.0
4.20
11U
SD 6
4.93
1
85.6
(4
.8)
200
.4
19.
6 -
- (0
.7)
- (0
.7)
- 10
0.00
%25
Sun
Phar
ma
Japa
n Lt
d.01
.03.
2012
JPY
0.6
1 9
7.0
(1,5
74.8
) 1
,751
.4
3,2
29.2
-
25.
7 (1
,008
.6)
0.2
(1
,008
.8)
- 10
0.00
%26
Sun
Phar
ma
Phili
ppin
es, I
nc.
08.1
2.20
11PH
P 1
.24
10.
7 (4
52.5
) 2
32.6
6
74.4
-
296
.8
(32.
9) 2
7.7
(60.
6) -
100.
00%
27Su
n Ph
arm
a H
ealth
care
FZE
25.0
3.20
12U
SD 6
4.93
1
85.6
(2
.2)
183
.5
0.1
- -
2.2
-
2.2
-
100.
00%
28Su
n Ph
arm
aceu
tical
s Ko
rea
Ltd.
20.0
9.20
11KR
W 0
.06
6.1
(1
.6)
6.1
1
.6
- -
0.0
-
0.0
-
100.
00%
29Ca
raco
Pha
rmac
eutic
als
Priv
ate
Lim
ited
12.0
1.20
12IN
R 1
.00
0.1
(0
.1)
0.0
0.0
-
- (0
.0)
- (0
.0)
- 10
0.00
%30
Sun
Phar
ma
Labo
rato
ries
Ltd
09.0
3.20
12IN
R 1
.00
0.5
1
96,8
23.2
227
,734
.3
30,
910.
6 5,
714.
3 5
1,09
9.1
11,
582.
4 2
,820
.2
8,7
62.2
4
,790
.0
100.
00%
31M
orle
y &
Com
pany
, Inc
.05
.05.
1983
USD
6
4.93
0
.2
(0.1
) 0
.2
0.1
-
- -
- -
- 10
0.00
%32
Taro
Pha
rmac
eutic
al In
dust
ries
Ltd.
(T
ARO
)20
.09.
2010
USD
64.
93
44.
2 1
43,1
36.8
14
7,28
1.9
4,1
00.9
20
,731
.6 1
6,01
4.2
14,
710.
9 1
,001
.0
13,
709.
9 -
74.8
2%
FO
RM
AO
C -
1Pu
rsua
nt to
Firs
t Pro
viso
to S
ub-S
ectio
n (3
) of S
ectio
n 12
9 of
Com
pani
es A
ct, 2
013
with
the
Rule
5 o
f Com
pani
es (A
ccou
nts)
Rul
es, 2
014
StatementContainingSalientFeaturesoftheFinancialStatementofSubsidiaries/AssociateCompanies/JointVentures

SUN PHARMACEUTICAL INDUSTRIES LIMITED
215
ANNUAL REPORT 2017-18 CONSOLIDATED FINANCIAL STATEMENTS
FO
RM
AO
C -
1Pu
rsua
nt to
Firs
t Pro
viso
to S
ub-S
ectio
n (3
) of S
ectio
n 12
9 of
Com
pani
es A
ct, 2
013
with
the
Rule
5 o
f Com
pani
es (A
ccou
nts)
Rul
es, 2
014
StatementContainingSalientFeaturesoftheFinancialStatementofSubsidiaries/AssociateCompanies/JointVentures
` in
Mill
ion
PART
“A”:
Subs
idia
ries
Sr
No
Nam
e of
the
subs
idia
ry c
ompa
nyD
ate
sinc
e w
hen
subs
idia
ry
was
acq
uire
d
Repo
rting
Cu
rren
cy R
ate
Cap
ital
Res
erve
To
tal
Ass
ets
Tota
l Li
abili
ties
Inve
stm
ent
Oth
er th
an
Inve
stm
ent
in
Subs
idia
ry
Turn
over
P
rofit
/
(Los
s)
befo
re
Taxa
tion
Prov
isio
n fo
r Ta
xatio
n
Pro
fit
/ (L
oss)
aft
er
Taxa
tion
Prop
osed
D
ivid
end
% o
f Sh
areh
oldi
ng
33Ta
ro P
harm
aceu
tical
s In
c.20
.09.
2010
CAD
50.
33
12,1
48.2
7
9,78
3.5
95,
373.
7 3
,442
.0
25,
308.
2 1
7,62
7.8
6,0
09.7
1
,182
.6
4,8
27.1
-
74.8
2%34
Taro
Pha
rmac
eutic
als
U.S
.A.,
Inc.
20.0
9.20
10U
SD 6
4.93
9
.4
(1,7
30.1
) 3
1,56
2.4
33,
283.
1 -
34,
905.
9 6
62.8
2
,889
.6
(2,2
26.8
) -
74.8
2%35
Taro
Pha
rmac
eutic
als
Nor
th A
mer
ica,
Inc.
20.0
9.20
10U
SD 6
4.93
0.
0 3
2,77
6.4
32,
776.
4 -
4,31
0.8
- 1
2,03
5.2
- 1
2,03
5.2
- 74
.82%
36Ta
ro P
harm
aceu
tical
s Eu
rope
B.V
.20
.09.
2010
EURO
80.
47
1.4
2
.6
44.
2 4
0.2
- -
40.
6 -
40.
6 -
74.8
2%37
Taro
Pha
rmac
eutic
als
Irela
nd L
td20
.09.
2010
EURO
80.
47
40.
3 (4
0.3)
- -
- -
(304
.0)
- (3
04.0
) -
74.8
2%38
Taro
Inte
rnati
onal
Ltd
.20
.09.
2010
USD
6
4.93
0
.0
578
.5
1,0
94.1
5
15.6
-
1,6
98.4
2
03.7
4
9.1
154
.6
- 74
.82%
39Ta
ro P
harm
aceu
tical
s (U
K) L
td.
20.0
9.20
10G
BP 9
1.88
0.
0 (0
.0)
- -
- -
842
.3
- 8
42.3
-
74.8
2%40
Taro
Pha
rmac
eutic
als
Cana
da, L
td.
20.0
9.20
10CA
D 5
0.33
0.
0 0.
1 0
.1
- -
- 0
.1
- 0
.1
- 74
.82%
41A
lkal
oida
Sw
eden
AB
22.1
1.20
12SE
K 7
.83
55.
8 (1
7.3)
143
.0
104
.5
- 6
96.0
1
7.0
- 1
7.0
- 10
0.00
%42
Dus
a Ph
arm
aceu
tical
s, In
c.19
.12.
2012
USD
64.
93
0.6
8
,105
.4
10,
527.
3 2
,421
.3
- 6
,090
.7
1,6
74.8
(1
,360
.9)
3,0
35.7
-
100.
00%
43M
utua
l Pha
rmac
eutic
al C
ompa
ny In
c.05
.02.
2013
USD
64.
93
0.0
9
,127
.2
9,2
11.3
8
4.1
- 4
,380
.5
1,6
11.0
1
,676
.4
(65.
4) -
100.
00%
44Fa
stst
one
Mer
canti
le C
ompa
ny P
rivat
e Li
mite
d01
.04.
2012
INR
1.0
0 0
.1
11.
4 1
1.5
0.0
-
- 0
.5
0.1
0
.4
- 10
0.00
%
45N
eetn
av R
eal E
stat
e Pr
ivat
e Li
mite
d01
.04.
2012
INR
1.0
0 0
.1
2,9
20.8
3
,077
.3
156
.4
- 1
.3
0.8
0
.2
0.6
-
100.
00%
46Re
alst
one
Mul
titra
de P
rivat
e Li
mite
d01
.04.
2012
INR
1.0
0 0
.1
11.
4 1
1.6
0.1
- -
0.5
0
.1
0.4
-
100.
00%
47Sk
isen
Labs
Priv
ate
Lim
ited
01.0
4.20
12 IN
R 1
.00
163
.6
(163
.6)
0.1
0.
1 0
.0
(0.0
) (0
.0)
- (0
.0)
- 10
0.00
%48
Soft
deal
Tra
ding
Com
pany
Priv
ate
Lim
ited
01.0
4.20
12 IN
R 1
.00
0.1
1
0.9
11.
0 0.
0 -
- 0
.5
0.1
0
.4
- 10
0.00
%
49U
nive
rsal
Ent
erpr
ises
Priv
ate
Lim
ited
31.0
8.20
12 IN
R 1
.00
4.5
0
.8
5.3
0.
0 -
- (0
.0)
- (0
.0)
- 10
0.00
%50
Sun
Phar
ma
Switz
erla
nd L
td.
10.0
6.20
13CH
F 6
8.26
6
.8
(5.4
) 1
4.0
12.
6 -
- (2
.1)
- (2
.1)
- 10
0.00
%51
Sun
Phar
ma
Hol
ding
s06
.08.
2015
USD
64.
93 2
22,1
15.3
(1
8,08
7.6)
204,
784.
9 7
57.2
-
- (2
9.7)
- (2
9.7)
- 10
0.00
%52
Phar
mal
ucen
ce, I
nc.
15.0
7.20
14U
SD 6
4.93
0
.0
5,4
69.1
7
,217
.9
1,7
48.8
-
2,4
23.7
3
53.9
(6
9.7)
423
.6
- 10
0.00
%53
PI R
eal E
stat
e Ve
ntur
es L
LC15
.07.
2014
USD
64.
93
584
.5
321
.9
1,9
93.0
1
,086
.6
- 2
14.3
1
35.1
2
8.4
106
.7
- 10
0.00
%54
Sun
Phar
ma
East
Afr
ica
Lim
ited
13.0
6.20
14KE
S 0
.64
0.1
(1
05.6
) 3
58.6
4
64.1
-
363
.3
(75.
8) (2
2.4)
(53.
4) -
100.
00%
55Ba
sics
Gm
bH24
.03.
2015
EURO
80.
47
392
.3
372
.6
5,3
20.2
4
,555
.3
- 3
,164
.3
89.
5 3
5.3
54.
2 -
100.
00%
56Ra
nbax
y G
mbH
24.0
3.20
15EU
RO 8
0.47
2
.0
- 5
.2
3.2
-
65.
2 -
- -
- 10
0.00
%57
"Ran
baxy
Pha
rmac
eutic
als
Ukr
aine
" LLC
24
.03.
2015
UA
H 2
.45
98.
0 3
7.7
208
.4
72.
7 -
731
.9
38.
0 6
.8
31.
2 -
100.
00%
58Su
n Ph
arm
aceu
tical
s M
oroc
co L
LC
(For
mer
ly k
now
n as
Ran
baxy
Mor
occo
LL
C)
24.0
3.20
15M
AD
7.0
9 8
6.8
(159
.5)
1,2
36.2
1
,308
.9
- 1
,224
.6
48.
0 5
3.8
(5.8
) -
100.
00%
59Su
n Ph
arm
aceu
tical
Indu
strie
s S.
A.C
. (F
orm
erly
kno
wn
as R
anba
xy -
PRP
(Per
u) S
.A.C
.)
24.0
3.20
15PE
N 2
0.11
8
7.3
(211
.8)
229
.7
354
.2
- 3
01.3
(2
9.8)
- (2
9.8)
- 10
0.00
%
60Ra
nbax
y H
oldi
ngs
(U.K
.) Li
mite
d24
.03.
2015
GBP
9
1.88
2
,807
.4
140
.7
2,9
48.9
0
.8
- -
167
.3
- 1
67.3
-
100.
00%
61Ra
nbax
y Ph
arm
acie
Gen
eriq
ues
24.0
3.20
15EU
RO 8
0.47
2
,007
.6
(4,2
06.7
) 9
86.5
3
,185
.6
- 1
,501
.9
(273
.6)
- (2
73.6
) -
100.
00%

SUN PHARMACEUTICAL INDUSTRIES LIMITED
216
` in
Mill
ion
PART
“A”:
Subs
idia
ries
Sr
No
Nam
e of
the
subs
idia
ry c
ompa
nyD
ate
sinc
e w
hen
subs
idia
ry
was
acq
uire
d
Repo
rting
Cu
rren
cy R
ate
Cap
ital
Res
erve
To
tal
Ass
ets
Tota
l Li
abili
ties
Inve
stm
ent
Oth
er th
an
Inve
stm
ent
in
Subs
idia
ry
Turn
over
P
rofit
/
(Los
s)
befo
re
Taxa
tion
Prov
isio
n fo
r Ta
xatio
n
Pro
fit
/ (L
oss)
aft
er
Taxa
tion
Prop
osed
D
ivid
end
% o
f Sh
areh
oldi
ng
62O
ffice
Pha
rmac
eutiq
ue In
dust
riel E
t H
ospi
talie
r24
.03.
2015
EU
RO
80.
47
107
.0
(13.
2) 2
97.3
2
03.5
-
278
.7
2.5
-
2.5
-
100.
00%
63Ra
nbax
y Ita
lia S
.P.A
.24
.03.
2015
EURO
80.
47
4.0
0
.1
2,2
22.8
2
,218
.7
- 1
,734
.7
(20.
3) 1
.6
(21.
9) -
100.
00%
64Ra
nbax
y Ph
arm
aceu
tical
s (P
ty) L
imite
d24
.03.
2015
ZA
R 5
.54
1,10
8.4
(2,1
36.5
) 6
,406
.5
7,4
34.6
-
6,8
36.0
1
95.2
-
195
.2
- 10
0.00
%65
Sonk
e Ph
arm
aceu
tical
s Pr
oprie
tary
Li
mite
d24
.03.
2015
ZAR
5.5
4 11
.1
597
.7
3,0
08.5
2
,399
.7
- 6
,408
.8
507
.2
146
.3
360
.9
-70
.00%
66Ra
nbax
y So
uth
Afric
a (P
ty) L
imite
d24
.03.
2015
ZAR
5.5
4 9
7.0
688
.0
2,5
44.6
1
,759
.6
- 1
,617
.1
1.9
(9
.6)
11.
5 -
100.
00%
67Su
n Ph
arm
a Eg
ypt L
imite
d LL
C (F
orm
erly
kn
own
as R
anba
xy E
gypt
Ltd
)24
.03.
2015
EGP
3.6
7 4
83.2
(9
6.0)
563
.7
176
.5
- 3
60.4
(1
4.1)
4.6
(1
8.7)
- 10
0.00
%
68Re
xcel
Egy
pt C
ompa
ny L
LC24
.03.
2015
EGP
3.6
7 0
.9
(19.
6) 5
.6
24.
3 -
(2.6
) (7
.4)
- (7
.4)
- 10
0.00
%69
Ranb
axy
(U.K
.) Li
mite
d 24
.03.
2015
GBP
91.
88
1,9
98.3
(6
14.5
) 2
,605
.7
1,2
21.9
-
1,8
98.9
7
6.9
17.
1 5
9.8
- 10
0.00
%70
Ranb
axy
(Pol
and)
SP.
Z O
.O.
24.0
3.20
15PL
N 1
9.11
8
2.0
112
.8
244
.9
50.
1 -
552
.9
17.
4 4
.8
12.
6 -
100.
00%
71Ra
nbax
y N
iger
ia L
imite
d24
.03.
2015
NG
N 0
.21
8.2
2
00.4
2
,123
.1
1,9
14.5
-
1,0
24.0
(4
28.7
) 5
.1
(433
.8)
- 85
.31%
72Ra
nbax
y (T
haila
nd) C
o., L
td.
24.0
3.20
15TH
B 2
.08
238
.8
(30.
9) 9
90.0
7
82.1
-
1,2
90.3
3
0.9
- 3
0.9
- 10
0.00
%73
Ohm
Lab
orat
orie
s, In
c.24
.03.
2015
USD
64.
93
15.5
7,12
4.6
214,
538.
0 2
07,3
97.9
-
15,
381.
5 2
,810
.9
(1,2
53.3
) 4
,064
.2
- 10
0.00
%74
Ranb
axy
Labo
rato
ries,
Inc.
24.0
3.20
15U
SD 6
4.93
-
80.
8 8
0.8
- -
3,5
87.0
(5
68.7
) -
(568
.7)
- 10
0.00
%75
Ranb
axy
Sign
atur
e LL
C24
.03.
2015
USD
64.
93
3.2
3
54.8
4
97.7
1
39.7
-
528
.7
411
.6
- 4
11.6
-
67.5
0%76
Ranb
axy
Phar
mac
eutic
als,
Inc.
24.0
3.20
15U
SD 6
4.93
0.
0 4
.8
4.8
-
- 4
,065
.3
(3,1
17.3
) -
(3,1
17.3
) -
100.
00%
77Ra
nbax
y In
c.
24.0
3.20
15U
SD 6
4.93
-
642
.3
750
.8
108
.5
- -
(364
.8)
(148
.1)
(216
.7)
- 10
0.00
%78
Ranb
axy
Irela
nd L
imite
d24
.03.
2015
EURO
80.
47
572
.2
(2.0
) 5
72.9
2
.7
- 6
.1
(8.1
) 7
.6
(15.
7) -
100.
00%
79AO
Ran
baxy
(For
mer
ly K
now
n ZA
O
Ranb
axy)
24.0
3.20
15RU
B 1
.13
183
.8
835
.4
4,0
38.9
3
,019
.7
- 5
,999
.8
147
.2
75.
6 7
1.6
- 10
0.00
%
80La
bora
torio
s Ra
nbax
y, S
.L.U
.24
.03.
2015
EURO
80.
47
80.
5 2
81.2
1
,597
.2
1,2
35.5
-
1,6
95.2
7
5.3
8.6
6
6.7
- 10
0.00
%81
Ranb
axy
(Mal
aysia
) SD
N. B
HD
. 24
.03.
2015
MYR
16.
80
139
.4
740
.8
1,6
41.3
7
61.1
-
2,0
06.2
4
95.6
-
495
.6
- 90
.74%
82Ra
nbax
y Fa
rmac
eutic
a Lt
da.
24.0
3.20
15BR
L 1
9.52
3
39.0
(1
,437
.9)
1,0
60.0
2
,158
.9
- 1
,716
.4
(25.
5) 4
8.2
(73.
7) -
100.
00%
83Ra
nbax
y Eu
rope
Lim
ited
24.0
3.20
15G
BP 9
1.88
0
.0
- 0
.0
- -
- (0
.0)
- (0
.0)
- 10
0.00
%84
Sun
Phar
ma
AN
Z Pt
y Lt
d (F
orm
erly
kn
own
as R
anba
xy A
ustr
alia
Pty
Ltd
)24
.03.
2015
AUD
49.
78
866
.2
(1,2
14.8
) 9
73.8
1
,322
.4
- 2
,163
.3
83.
1 -
83.
1 -
100.
00%
85Ra
nbax
y Ph
arm
aceu
tical
s Ca
nada
Inc.
24.0
3.20
15CA
D 5
0.33
1
13.3
1
64.9
8
77.8
5
99.6
-
1,1
81.0
(6
6.6)
- (6
6.6)
- 10
0.00
%86
Tera
pia
S.A
.24
.03.
2015
RON
17.
27
432
.1
14,
702.
3 1
7,86
8.5
2,7
34.1
-
11,
851.
9 2
,643
.3
350
.7
2,2
92.6
-
96.8
1%87
Be- T
abs
Inve
stm
ents
(Pty
) Lim
ited
24.0
3.20
15ZA
R 5
.54
0.0
19.
8 1
9.8
- -
- (0
.0)
- (0
.0)
- 10
0.00
%88
Sun
Phar
ma
(Net
herla
nds)
B.V
(For
mer
ly
know
n as
Ran
baxy
(Net
herla
nds)
B.V
.)24
.03.
2015
USD
64.
93
44,
039.
3 8
,655
.3
53,
355.
2 6
60.6
92
3.6
0.0
(485
.6)
95.
5 (5
81.1
) -
100.
00%
89In
site
Visi
on In
corp
orat
ed02
.11.
2015
USD
64.
93
0.0
(349
.9)
1,2
64.3
1
,614
.2
- -
224
.4
1,1
92.6
(9
68.2
) -
100.
00%
90JS
C Bi
osin
tez
19.1
2.20
16RU
B 1
.13
0.3
723.
1 4,
700.
1 3,
976.
7 2
.3
2,90
6.1
80.
7 72
.5
8.2
-
85.1
0%
FO
RM
AO
C -
1Pu
rsua
nt to
Firs
t Pro
viso
to S
ub-S
ectio
n (3
) of S
ectio
n 12
9 of
Com
pani
es A
ct, 2
013
with
the
Rule
5 o
f Com
pani
es (A
ccou
nts)
Rul
es, 2
014
StatementContainingSalientFeaturesoftheFinancialStatementofSubsidiaries/AssociateCompanies/JointVentures
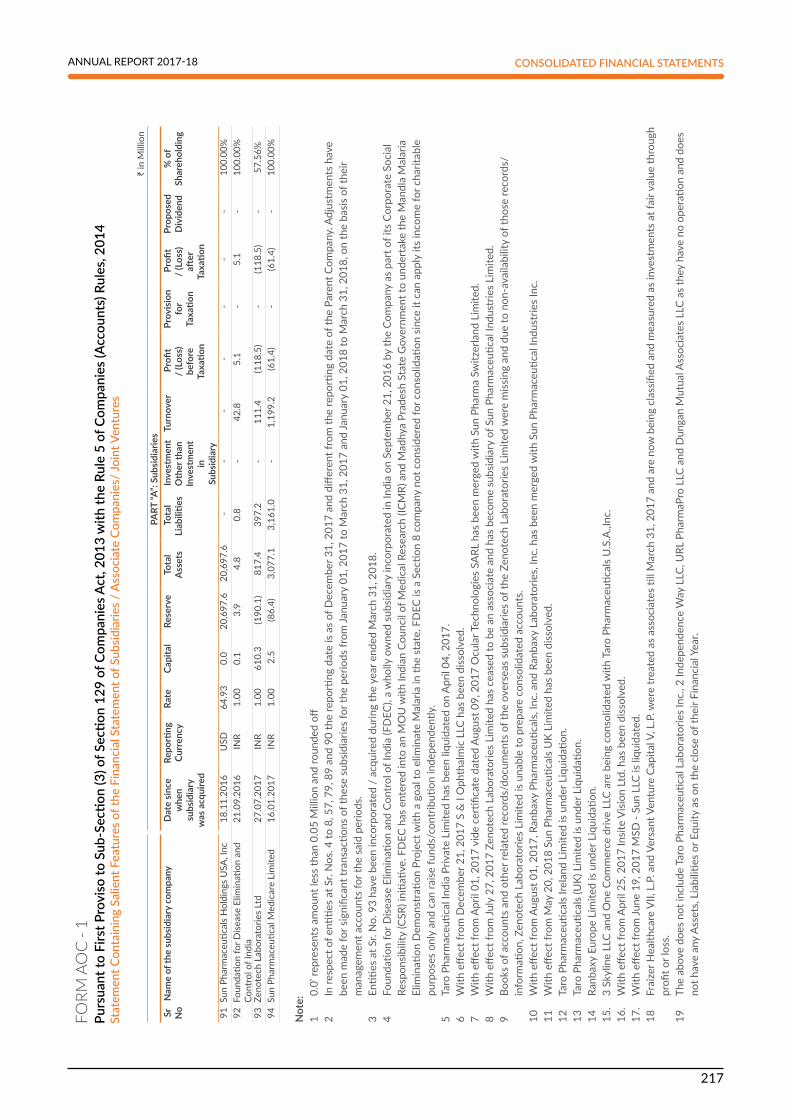
SUN PHARMACEUTICAL INDUSTRIES LIMITED
217
ANNUAL REPORT 2017-18 CONSOLIDATED FINANCIAL STATEMENTS
` in
Mill
ion
PART
“A”:
Subs
idia
ries
Sr
No
Nam
e of
the
subs
idia
ry c
ompa
nyD
ate
sinc
e w
hen
subs
idia
ry
was
acq
uire
d
Repo
rting
Cu
rren
cy R
ate
Cap
ital
Res
erve
To
tal
Ass
ets
Tota
l Li
abili
ties
Inve
stm
ent
Oth
er th
an
Inve
stm
ent
in
Subs
idia
ry
Turn
over
P
rofit
/
(Los
s)
befo
re
Taxa
tion
Prov
isio
n fo
r Ta
xatio
n
Pro
fit
/ (L
oss)
aft
er
Taxa
tion
Prop
osed
D
ivid
end
% o
f Sh
areh
oldi
ng
91Su
n Ph
arm
aceu
tical
s H
oldi
ngs
USA
, Inc
18.1
1.20
16U
SD 6
4.93
0.
020
,697
.6
20,6
97.6
-
- -
- -
- -
100.
00%
92Fo
unda
tion
for D
iseas
e El
imin
ation
and
Co
ntro
l of I
ndia
21.0
9.20
16IN
R 1
.00
0.1
3.9
4.
8 0.
8 -
42.8
5
.1
- 5
.1
- 10
0.00
%
93Ze
note
ch L
abor
ator
ies
Ltd
27.0
7.20
17IN
R 1
.00
610.
3 (1
90.1
)81
7.4
397.
2 -
111.
4 (1
18.5
) -
(118
.5)
- 57
.56%
94Su
n Ph
arm
aceu
tical
Med
icar
e Li
mite
d16
.01.
2017
INR
1.0
0 2
.5
(86.
4)3,
077.
1 3,
161.
0 -
1,19
9.2
(61.
4) -
(61.
4) -
100.
00%
Not
e:1
0.0’
repr
esen
ts a
mou
nt le
ss th
an 0
.05
Mill
ion
and
roun
ded
off2
In re
spec
t of e
ntitie
s at
Sr.
Nos
. 4 to
8, 5
7, 7
9, 8
9 an
d 90
the
repo
rting
dat
e is
as o
f Dec
embe
r 31,
201
7 an
d di
ffere
nt fr
om th
e re
porti
ng d
ate
of th
e Pa
rent
Com
pany
. Adj
ustm
ents
hav
e be
en m
ade
for s
igni
fican
t tra
nsac
tions
of t
hese
sub
sidia
ries
for t
he p
erio
ds fr
om Ja
nuar
y 01
, 201
7 to
Mar
ch 3
1, 2
017
and
Janu
ary
01, 2
018
to M
arch
31,
201
8, o
n th
e ba
sis o
f the
ir m
anag
emen
t acc
ount
s fo
r the
sai
d pe
riods
.3
Entiti
es a
t Sr.
No.
93
have
bee
n in
corp
orat
ed /
acq
uire
d du
ring
the
year
end
ed M
arch
31,
201
8.4
Foun
datio
n fo
r Dise
ase
Elim
inati
on a
nd C
ontr
ol o
f Ind
ia (F
DEC
), a
who
lly o
wne
d su
bsid
iary
inco
rpor
ated
in In
dia
on S
epte
mbe
r 21,
201
6 by
the
Com
pany
as
part
of i
ts C
orpo
rate
Soc
ial
Resp
onsib
ility
(CSR
) ini
tiativ
e. F
DEC
has
ent
ered
into
an
MO
U w
ith In
dian
Cou
ncil
of M
edic
al R
esea
rch
(ICM
R) a
nd M
adhy
a Pr
ades
h St
ate
Gov
ernm
ent t
o un
dert
ake
the
Man
dla
Mal
aria
El
imin
ation
Dem
onst
ratio
n Pr
ojec
t with
a g
oal t
o el
imin
ate
Mal
aria
in th
e st
ate.
FD
EC is
a S
ectio
n 8
com
pany
not
con
sider
ed fo
r con
solid
ation
sin
ce it
can
app
ly it
s in
com
e fo
r cha
ritab
le
purp
oses
onl
y an
d ca
n ra
ise fu
nds/
cont
ributi
on in
depe
nden
tly.
5 Ta
ro P
harm
aceu
tical
Indi
a Pr
ivat
e Li
mite
d ha
s be
en li
quid
ated
on
Apr
il 04
, 201
7.6
With
effe
ct fr
om D
ecem
ber 2
1, 2
017
S &
I O
phth
alm
ic L
LC h
as b
een
diss
olve
d.7
With
effe
ct fr
om A
pril
01, 2
017
vide
cer
tifica
te d
ated
Aug
ust 0
9, 2
017
Ocu
lar T
echn
olog
ies
SARL
has
bee
n m
erge
d w
ith S
un P
harm
a Sw
itzer
land
Lim
ited.
8 W
ith e
ffect
from
July
27,
201
7 Ze
note
ch L
abor
ator
ies
Lim
ited
has
ceas
ed to
be
an a
ssoc
iate
and
has
bec
ome
subs
idia
ry o
f Sun
Pha
rmac
eutic
al In
dust
ries
Lim
ited.
9 Bo
oks
of a
ccou
nts
and
othe
r rel
ated
reco
rds/
docu
men
ts o
f the
ove
rsea
s su
bsid
iarie
s of
the
Zeno
tech
Lab
orat
orie
s Li
mite
d w
ere
miss
ing
and
due
to n
on-a
vaila
bilit
y of
thos
e re
cord
s/in
form
ation
, Zen
otec
h La
bora
torie
s Li
mite
d is
unab
le to
pre
pare
con
solid
ated
acc
ount
s.10
W
ith e
ffect
from
Aug
ust 0
1, 2
017,
Ran
baxy
Pha
rmac
eutic
als,
Inc.
and
Ran
baxy
Lab
orat
orie
s, In
c. h
as b
een
mer
ged
with
Sun
Pha
rmac
eutic
al In
dust
ries
Inc.
11
With
effe
ct fr
om M
ay 2
0, 2
018
Sun
Phar
mac
eutic
als
UK
Lim
ited
has
been
diss
olve
d.12
Ta
ro P
harm
aceu
tical
s Ire
land
Lim
ited
is un
der L
iqui
datio
n.13
Ta
ro P
harm
aceu
tical
s (U
K) L
imite
d is
unde
r Liq
uida
tion.
14
Ranb
axy
Euro
pe L
imite
d is
unde
r Liq
uida
tion.
15.
3 Sk
ylin
e LL
C an
d O
ne C
omm
erce
driv
e LL
C ar
e be
ing
cons
olid
ated
with
Tar
o Ph
arm
aceu
tical
s U
.S.A
.,Inc
.16
. W
ith e
ffect
from
Apr
il 25
, 201
7 In
site
Visi
on L
td. h
as b
een
diss
olve
d.17
. W
ith e
ffect
from
June
19,
201
7 M
SD -
Sun
LLC
is liq
uida
ted.
18
Frai
zer H
ealth
care
VII,
L.P
. and
Ver
sant
Ven
ture
Cap
ital V
, L.P
. wer
e tr
eate
d as
ass
ocia
tes
till M
arch
31,
201
7 an
d ar
e no
w b
eing
cla
ssifi
ed a
nd m
easu
red
as in
vest
men
ts a
t fai
r val
ue th
roug
h pr
ofit o
r los
s.
19
The
abov
e do
es n
ot in
clud
e Ta
ro P
harm
aceu
tical
Lab
orat
orie
s In
c., 2
Inde
pend
ence
Way
LLC
, URL
Pha
rmaP
ro L
LC a
nd D
unga
n M
utua
l Ass
ocia
tes
LLC
as th
ey h
ave
no o
pera
tion
and
does
no
t hav
e an
y A
sset
s, Li
abili
ties
or E
quity
as
on th
e cl
ose
of th
eir F
inan
cial
Yea
r.
FO
RM
AO
C -
1Pu
rsua
nt to
Firs
t Pro
viso
to S
ub-S
ectio
n (3
) of S
ectio
n 12
9 of
Com
pani
es A
ct, 2
013
with
the
Rule
5 o
f Com
pani
es (A
ccou
nts)
Rul
es, 2
014
StatementContainingSalientFeaturesoftheFinancialStatementofSubsidiaries/AssociateCompanies/JointVentures

SUN PHARMACEUTICAL INDUSTRIES LIMITED
218
` in Million
Part “B”: Associate Companies and Joint Ventures
Sr. No Name of Associates/Joint Ventures
Jointly Controlled Entity Associates Artes
Biotechnology GmbH
S & I Ophthalmic
LLC
sc Pharmaceuticals
Inc.
Generic Solar Power LLP
Trumpcard Advisors and
Finvest LLP
Medinstill LLC
1 Latest audited Balance Sheet Date 31-Dec-17 31-Dec-17 31-Dec-17 31-Mar-18 31-Mar-18 31-Mar-18Date of acquisition 13.02.2014 28.10.2013 29.12.2016 09.10.2015 31.03.2017 13.03.2014
2 Shares of Associate/Joint Ventures held by the company on the year end No. 15,853 NA 13,000,000 28,760 NA 1,999 Amount of Investment in Associates/Joint Venture
252.8 - 867.6 0.0 444.6 1,436.4
Extend of Holding % 45.00% 50.00% 11.69% 28.76% 40.61% 19.99%3 Description of how there is significant
influence NA NA NA NA NA NA
4 Reason why the associate/joint venture is not consolidated
NA NA NA NA NA NA
5 Networth attributable to Shareholding as per latest audited Balance Sheet
55.7 - 1,003.5 0.0 0.2 (582.2)
6 Profit / Loss for the year i. Considered in Consolidation 7.6 (15.4) (250.1) (0.0) 132.1 (128.6)ii. Not Considered in Consolidation 9.3 (15.4) (1,889.1) 0.0 193.2 (514.7)
For and on behalf of the Board of Directors ofSun Pharmaceutical Industries Limited
DILIP S. SHANGHVIManaging Director
SUDHIR V. VALIA C. S. MURALIDHARANWholetime Director Chief Financial Officer
SAILESH T. DESAI SUNIL R. AJMERAWholetime Director Company SecretaryMumbai, May 25, 2018
FORM AOC - 1
Pursuant to First Proviso to Sub-Section (3) of Section 129 of Companies Act, 2013 with the Rule 5 of Companies (Accounts) Rules, 2014StatementContainingSalientFeaturesoftheFinancialStatementofSubsidiaries/AssociateCompanies/JointVentures