independent pricing and regulatory tribunal - ipart · independent pricing and regulatory tribunal...
TRANSCRIPT

Independent Pricing and Regulatory Tribunal
Case study 1 — Hip joint replacement
Hospital costs and outcomes study for NSW Health
Other Industries
July 2010


Case study 1 – Hip joint replacementHospital costs and outcomes study for NSW Health
Other Industries July 2010

ii IPART Case study 1 – Hip joint replacement
© Independent Pricing and Regulatory Tribunal of New South Wales 2010
This work is copyright. The Copyright Act 1968 permits fair dealing for study, research, news reporting, criticism and review. Selected passages, tables or diagrams may be reproduced for such purposes provided acknowledgement of the source is included.
ISBN 978-1-921628-48-1 S9-47
The Tribunal members for this review are:
Mr James Cox, Acting Chairman and Chief Executive Officer
Ms Sibylle Krieger, Part Time Member
Inquiries regarding this document should be directed to a staff member:
Alison Milne (02) 9290 8443
Bee Thompson (02) 9290 8496
Independent Pricing and Regulatory Tribunal of New South Wales PO Box Q290, QVB Post Office NSW 1230 Level 8, 1 Market Street, Sydney NSW 2000
T (02) 9290 8400 F (02) 9290 2061
www.ipart.nsw.gov.au

Contents
Case study 1 – Hip joint replacement IPART iii
Contents
1 Introduction and executive summary 1 1.1 Why did we select hip replacement as one of the case studies? 4 1.2 What was the scope of the hip replacement case study? 4 1.3 What were the key findings of the hip replacement case study? 5 1.4 Key implications of these findings? 12 1.5 List of recommendations 13 1.6 What does the rest of this report cover? 14
2 The main types of hip replacement patient 15 2.1 Main subgroups of hip replacement patient 15 2.2 Main types of hip replacement procedure 16
3 Number and mix of patients across study hospitals 17 3.1 Number of hip replacement cases at each study hospital 17 3.2 Comparison of casemix at the study hospitals 20
4 Length of stay across study hospitals 24 4.1 Comparing length of stay for all hip replacement patients 25 4.2 Comparing length of stay for fracture patients 26 4.3 Comparing length of stay for arthritis patients 28
5 Costs of providing inpatient care 29 5.1 Prosthesis costs 30 5.2 Cost of nursing staff in wards 39 5.3 Imaging costs 46 5.4 Pathology costs 48 5.5 Blood use costs 50 5.6 Operating theatre times 51
6 Configurations of care 53 6.1 Managing emergency and planned surgical workloads 54 6.2 Using different types of prostheses and managing selection of these types 56 6.3 Managing the rehabilitation phase of care 58

Contents
iv IPART Case study 1 – Hip joint replacement
7 Outcome, safety and quality indicators 59 7.1 How we developed a set of clinical indicators 60 7.2 Analysing indicators and risk-adjusting for patient characteristics 61 7.3 Clinical indicators for hip replacement 63 7.4 Issues for further consideration as part of Stages 5 and 6 of the broader NSW
Health study 76
Appendices 77 A Full list of recommendations from main report 79 B Types of hip replacements and hip prostheses components 89 C Sample of hip prostheses prices 92 D Hospital role delineation for orthopaedics 94 E Risk-adjusted indicators provided by NSW Health 95
Glossary 97

1 Introduction and executive summary
Case study 1 – Hip joint replacement IPART 1
1 Introduction and executive summary
NSW Health is currently coordinating a project that ultimately aims to improve clinical practice and efficiency consistently across the NSW hospital system. The project involves 6 components, and is designed to enable development of a methodology that makes better use of available data to compare patient mix, costs, clinical practice and outcomes and which can then be applied across other hospitals to improve performance. (See Box 1.1 for more information.)
NSW Health asked the Independent Pricing and Regulatory Tribunal of NSW (IPART) to conduct a costs and outcomes study that encompasses 3 components of this larger project. The aim of the study was to provide information and analysis that can be used by clinical experts to better understand the variation in clinical practice in NSW hospitals, and the extent to which this variation can lead to differences in hospital costs and clinical outcomes.
IPART’s study involved comparing costs, configurations of care and outcomes in 5 selected NSW hospitals:
Royal Prince Alfred Hospital (RPAH)
Royal North Shore Hospital (RNSH)
John Hunter Hospital (JHH)
Bankstown-Lidcombe Hospital (BLH), and
Gosford Hospital (GH).
To do this, we analysed management practices at the hospital-wide level, and did detailed case studies of 11 specific clinical areas. As costs, configurations of care and relevant indicators of outcome vary significantly depending on the condition of the patient and/or the procedure undertaken, these case studies allowed us to compare the hospitals on a more like-with-like basis. This document discusses our findings in one of these 11 clinical areas – hip joint replacement. (See Box 1.2 for the full list of clinical areas we examined, how they were selected, and how we conducted the case studies.)

1 Introduction and executive summary
2 IPART Case study 1 – Hip joint replacement
Box 1.1 NSW Health project
IPART’s hospital costs and outcomes study is part of a larger, multi-stage project NSW Health is coordinating with the assistance of other organisations. The terms of reference for this projectset out 6 components:
1. Audit the quality of current coding and costing data.
2. Analyse differences in costs between 3 principal tertiary referral hospitals and 2 otherprincipal referral hospitals.
3. Describe the different configurations of care that underpin different cost profiles.
4. Analyse available data on differences in adjusted admission rates and clinical outcomes for the 5 selected hospitals.
5. Determine whether variations in configurations of care lead to different clinical outcomes.
6. Identify the extent to which clinical variation exists, with the aim of achieving clinical bestpractice and maximum efficiency.
The first component is being completed by Health Outcomes International (audit of costing)and Pavilion Health (audit of coding). The results will assist the NSW Department of Health in further developing episode funding, in line with the national agreement by the Council of Australian Governments (COAG) to move to a more nationally consistent approach to activity-based funding. IPART has completed the second, third and fourth components through ourhospital costs and outcomes study. The results of this study will be used by clinical experts incompleting the fifth and sixth components.
The NSW Health project is part of its response to the findings and recommendations made inthe Report of the Special Commission of Inquiry into Acute Care Services by Commissioner Garling.a
a Flowing from the NSW Government’s response to the Garling Inquiry (Caring Together - The Health Action Plan for NSW (2009)), ‘four pillars’ of clinical improvement have been established – Clinical Excellence Commission (CEC), Agency for Clinical Innovation (ACI), Bureau of Health Information (BHI) and Clinical Education and Training Institute (CETI). IPART’s analysis on costs, clinical practice and outcomes is to be considered by the NSW Department of Health and clinical experts in these agencies to assess whether variations in configurations of care lead to different clinicaloutcomes and to identify the extent to which clinical variation exists, with the aim of achieving clinical best practiceand maximum efficiency.

1 Introduction and executive summary
Case study 1 – Hip joint replacement IPART 3
Box 1.2 IPART’s case studies
To compare costs, configurations of care and outcomes in the 5 study hospitals, we focused on11 specific conditions or procedures in detail (as well as undertaking a broad, hospital-wide analysis). These conditions/procedures are:
Hip joint replacement
Major chest procedures
Breast surgery
Cholecystectomy
Appendicectomy
Stroke
Cardiology – stents, pacemakers and defibrillators
Tracheostomy, or ventilation for greater than 95 hours
Cataract/lens procedures
Hysterectomy, and
Obstetric delivery.
In selecting these conditions/procedures, and the relevant indicators to compare for each, wewere advised by a clinical consultant (Dr Paul Tridgell) and a clinical reference group (ProfessorBruce Barraclough, Dr Anthony Burrell, Dr Patrick Cregan, Professor Phillip Harris, ProfessorClifford Hughes, Professor Brian McCaughan, Professor Peter McClusky, Dr Michael Nicholl, Professor Ron Penny, Professor Carol Pollock and Dr Hunter Watt).
The case studies were selected to provide a range of surgical procedures and a range ofmedical conditions that met one or more of the following criteria:
high volumes
high reported costs
high variability in reported costs
apparent differences in clinical practice, or
a range of models of care.
To conduct the case studies, we visited each of the hospitals and spoke with a range of staff,including clinical, nursing, management, finance, coding and administrative staff. We also collected a range of clinical and financial data from NSW Health, relevant area health servicesand hospitals. By analysing the data and speaking with clinical experts, we established themost suitable data available for comparing hospitals on a like-with-like basis.
For further information on our methodology and broad findings on costs, outcomes andconfigurations of care, see our main report, NSW Health costs and outcomes study by IPART for selected NSW hospitals. Our detailed findings on the other case study areas can be found in ourreports on each area.
1 Introduction and executive summary
4 IPART Case study 1 – Hip joint replacement
1.1 Why did we select hip replacement as one of the case studies?
Hip replacement was selected as one of the clinical areas for detailed study because it involves:
moderate volumes1
high costs, especially prosthesis costs
large differences in reported costs between hospitals, and
large differences in reported lengths of stay.
1.2 What was the scope of the hip replacement case study?
The hip replacement case study compared the costs, configurations of care and outcomes related to surgical procedures involving removing the hip joint (or part of the joint and part of the femur) and replacing it with a hip prosthesis, or replacing a pre-existing hip prosthesis with a new one (hip revision). We used diagnostic related groups (DRGs) to define the procedures and identify the data included in the scope of the case study (see Table 1.1).
Table 1.1 DRGs included in the scope of the hip replacement case study
DRG Description
I03A Hip revision with catastrophic or severe complication or comorbidity
I03B Hip replacement with catastrophic or severe complication or comorbidity or hip revision without catastrophic or severe complication or comorbidity
I03C Hip replacement without catastrophic or severe complication or comorbidity
For this case study, we found that it was necessary to further divide the DRGs into subgroups based on the patient’s principal diagnosis to meaningfully compare costs, configurations of care and outcomes (see Chapter 2 for more detail).
We also decided to include another hospital in the scope of the case study, in addition to the 5 hospital selected by NSW Health. To improve the comparability of costs, configurations of care and outcomes in relation to hip replacement, we included the Institute of Rheumatology and Orthopaedics (IRO) – an orthopaedic surgery centre adjacent to RPAH.
The IRO is a separate public facility, with a separate facility code; however, the management of hip replacement surgery at RPAH and IRO is closely linked. The 2 facilities operate in a closely coordinated fashion, and share senior medical staff plus clinical resources (such as junior medical staff, imaging and pathology). 1 In 2007/08, 31,354 hip replacements or revisions were undertaken in Australian hospitals. See
Australian Institute of Health and Welfare, AR-DRG Data Cubes, Separation, patient day and average length of stay statistics by Australian Refined Diagnosis Related Group (AR-DRG) Version 5.0/5.1, Australia, 1998-99 to 2007-08 (http://d01.aihw.gov.au/cognos/cgi-bin/ppdscgi.exe?DC=Q&E=/AHS/drgv5_9899-0708_v2).
1 Introduction and executive summary
Case study 1 – Hip joint replacement IPART 5
In general, we examined and reported on IRO separately from RPAH. But occasionally, we combined these 2 hospitals to allow more meaningful comparisons with other hospitals.
Similarly, JHH has an integrated public surgery centre – the Royal Newcastle Centre (RNC)2 – which undertakes most of the hospital’s planned hip replacement cases. However, the RNC has the same facility code as JHH, and is counted as the same facility for the purposes of the Health Information Exchange (HIE)3. Therefore, we examined and reported on all RNC’s hip replacement patient numbers as part of JHH.
There is also a private facility co-located with RNSH, called North Shore Private Hospital. However, this is a private hospital with a separate facility code. While RNSH orthopaedic staff also work at North Shore Private Hospital, the relationship between the 2 hospitals is not as close as that between RPAH and IRO. In addition, we did not have access to detailed cost and activity information from the private hospital. Therefore, we did not include this hospital in our hip replacement case study.
Unless specified otherwise in this case study, the data we analysed related to the 12-month period from 1 July 2008 to 30 June 2009.
1.3 What were the key findings of the hip replacement case study?
To compare the costs, configurations of care and outcomes of hip replacement procedures at the study hospitals (including IRO), we collected, analysed and compared data on:
the type, number and mix of hip replacement patients at each hospital
the average length of stay for these patients at each hospital
the costs, or major clinical resources used to provide acute inpatient care for these patients at each hospital
the configurations of care used to provide and manage hip replacement patient care at each hospital
indicators of outcome, safety and quality for hip replacement procedures for each hospital.
Our key findings are summarised below.
2 Formerly the Royal Newcastle Hospital. 3 The HIE is a NSW Health data system that is used as a State data warehouse for financial,
patient and clinical data from hospitals and area health services.
1 Introduction and executive summary
6 IPART Case study 1 – Hip joint replacement
1.3.1 Type, number and mix of patients
As noted above, we found that it was necessary to go beyond the DRG level to identify groups of reasonably similar patients. Therefore, we broke the data into 5 subgroups based on the patient’s principal diagnosis code. These subgroups were hip replacement for arthritis, for fracture, for secondary cancer, for joint infections and for ‘other’ diagnosis. We also distinguished between primary hip replacements and revisions of previous hip replacements because, on average, these types of hip replacement procedure involve different costs and outcomes. All joint infections and half of the patients in the ‘other’ diagnosis group are having hip replacement revisions.
We found that the number of hip replacement patients, and the proportion of this number in each subgroup, varied significantly across the study hospitals. One notable difference was that the proportions of patients having hip replacement surgery for secondary cancer or for joint infections were significantly higher at RPAH than the other hospitals. This is significant because other study findings indicated that patients in these subgroups were associated with longer average length of stay and higher costs associated with imaging, pathology and blood use at all the study hospitals.
1.3.2 Average length of stay
Our analysis indicates that the measure often used in the National Hospital Cost Data Collection (NHCDC) and DRG benchmarking – the average ‘acute episode length of stay’, which is the length of an acute episode – is not a consistent basis for comparing length of stay for hip replacement patients. This is because of differences in the way hospitals reclassify patients’ care from ‘acute’ to ‘rehabilitation’ care and differences in access to other rehabilitation facilities. Our analysis also indicates that for such comparisons to be meaningful:
the length of stay needs to include all consecutive episodes (acute, rehabilitation and other) at the study hospital, plus the length of related stays at other hospitals, and
the main patient subgroups need to be compared separately.
For our analysis, we have included 3 alternative measures of length of stay:
LOS1 – acute episode length of stay in study hospital
LOS2 – total stay in study hospital including acute episode and other consecutive episodes for hip DRG
LOS3 – total stay in study hospital (LOS2) plus length of stay for one adjoining previous stay in hospital (transfer in) and one adjoining subsequent hospital stay (transfer out).
1 Introduction and executive summary
Case study 1 – Hip joint replacement IPART 7
We found there was greater consistency in length of stay within each patient subgroup than for the hip replacement group as a whole. Stays were longer for patients with fractures, secondary cancers, joint infections and revisions, and shorter for those with arthritis.
We also found that differences in the average ‘acute episode length of stay’ across the study hospitals are partly due to differences in the way the hospitals reclassify patients from acute to rehabilitation care, rather than differences in clinical practice. We found that the average length of stay for fracture patients, who generally require some rehabilitation, was considerably longer than for arthritis patients in all hospitals and lengths of stay for fracture patients were more consistent using LOS3 than LOS1.
1.3.3 Costs of inpatient care
To compare the costs related to the case study areas at the study hospitals, we examined the management and use of a selection of clinical resources used directly for patient care in that area. For hip replacement, the main clinical resources we examined were prostheses, nursing staff in wards, imaging, pathology, blood use, and operating theatre time. We had aimed to also estimate medical staff costs and pharmacy costs for this case study, but were unable to obtain consistent comparisons within the timeframe for this review.4
Prosthesis costs
We found considerable variation in the total cost of hip joint prostheses among the study hospitals, and in the range and type of each prosthesis component the hospitals tended to use. The cost variations stemmed from several factors. In some cases, the price paid for identical or similar types of products varied between hospitals. In other cases, the hospitals purchased different types of products for different prices.
We found that hospitals had different arrangements and protocols for the selection of prostheses and the approval of new products. Some hospitals required management approval for purchases above a threshold value, others used approved product lists.
At the time of our study, the study hospitals did not usually share information on the prices they pay for prostheses with other hospitals, often not even with hospitals within the same area. As a result, some hospitals do not realise when other hospitals are paying much less for exactly the same items.5
4 Medical staff costs and pharmacy are discussed in Chapters 9 and 14 of our main report, NSW
Health costs and outcomes study by IPART for selected NSW hospitals. 5 We recognise that these findings are based on examination of a small sample of prices, and do
not take into account other benefits which hospitals may receive from the companies they buy hip prosthesis components from (such as additional technical or maintenance services offered, or price reductions on other items).
1 Introduction and executive summary
8 IPART Case study 1 – Hip joint replacement
These findings indicate that prosthesis purchasing is an area that provides immediate opportunities for cost savings. It indicates that potential savings could be made by all the study hospitals through the negotiation of lower prices for commonly purchased prosthesis components. In light of this, further effort to achieve price reductions – for example, by sharing information sharing across Area Health Services and hospitals, and using tender-based purchasing for the commonly used prostheses and components– appears to be warranted. However, clinical input and engagement in this process would be essential for these efforts to succeed.
Cost of nursing staff in wards
We found that average length of stay and the staff-to-patient ratio (ie, nursing hours per patient day) were the main drivers for nursing costs at the study hospitals. Hospitals with shorter stays or lower staff-to-patient ratios had lower nursing costs. The proportions of Enrolled Nurses (ENs) and Assistants in Nursing (AINs) in their staffing mix had a smaller influence on the nursing costs.
We found that nursing costs are highly sensitive to the inpatient fraction (IFRAC) the hospitals apply to them. When all nursing costs are attributed to inpatient care (ie, IFRAC=1), there is a much smaller variation in nursing costs across the study hospitals for like subgroups than is implied by the NHCDC.
Imaging and pathology costs
We found that within each patient subgroup, the average cost attributed to all imaging and pathology tests per patient during their acute episode was broadly consistent across the study hospitals. This cost was generally slightly lower for JHH than for the other study hospitals.
Comparing costs between the patient subgroups, we found that average imaging and pathology costs for fracture patients were generally at least 2 times higher than those for arthritis patients.
Blood use costs
We found that patients with a revision received an average of 2-4 units of blood. Patients with a diagnosis of a malignancy received on average almost 2 units of blood. Patients with fractures or elective (planned) hip replacements received on average less than 1 unit of blood.

1 Introduction and executive summary
Case study 1 – Hip joint replacement IPART 9
Operating theatre time
While we were unable to estimate operating theatre costs, we did compare the average time between surgery commencing and surgery finishing. We found that there was broad consistency in average operating theatre times between the hospitals for our patient subgroups. This was around 100 minutes for fractures and arthritis cases. The average theatre time increased to 140 minutes for joint revisions.
National Hospital Cost Data Collection
The NHCDC reports estimates of average hospital costs based on data it collects from hospitals around Australia.6 In this study, we had access to the study hospitals’ provisional de-identified patient-level data for 2008/09, as well as the overall averages publicly reported by the NHCDC for different hospital groupings in 2007/08.7 The final NHCDC estimates for study hospitals for 2008/09 became available towards the end of our study. We compared these to the provisional costs and found that some of the costs had changed substantially. Give the limited time available, we used the final costs only where these were substantially different from the provisional costs.
We were able to compare study hospitals’ NHCDC estimates with our estimates of nursing, prostheses, imaging and pathology costs. We used the final NHCDC costs for prostheses and to adjust the provisional pathology costs for GH and RNSH. We found that variation in cost estimates at the DRG level partly reflected variations in patient type within DRGs. We also observed that prosthesis costs reported in the NHCDC were unreliable when compared with actual prosthesis prices paid by hospitals. Further, we found a higher degree of consistency in the hospitals’ use of imaging and pathology for diagnostic purposes than reflected in the NHCDC.
1.3.4 Configurations of care
We identified 3 major differences in the way the study hospitals managed and provided care for hip replacement patients, comprising differences in the way they:
managed their emergency and planned surgical workloads
used prosthesis components, and managed the process for selecting those components
managed the rehabilitation phase of patient care.
6 In NSW, these cost estimates are often compiled by area health services, rather than individual
hospitals. 7 Commonwealth Department of Health and Ageing, National Hospital Cost Data Collection, Round
12, 2007-2008, September 2009.

1 Introduction and executive summary
10 IPART Case study 1 – Hip joint replacement
Managing emergency and planned surgical workloads
Some of the study hospitals separated their planned (or elective) surgical workload from their emergency workload through the use of dedicated elective surgical centres (eg, RPAH/IRO and JHH/RNC). We found that the use of dedicated surgical facilities for planned hip replacements was associated with slightly shorter average lengths of stay among arthritis patients (who generally have planned surgery). However, BLH also had a shorter average length of stay for these patients, and this may reflect the fact that there is less trauma surgery at this hospital and therefore a more predictable surgery workload.
Another way hospitals manage their planned and emergency surgery workload is through a networked service model. For example, some facilities within the network may handle more of the emergency work while other focus on the planned. GH used this model to a greater degree than the others.
Using different types of prostheses and managing selection of these types
We found substantial variation in the range and types of prosthesis components the hospitals used. Some of this variation was due to whether the hospitals had broad guidelines for prosthesis selection and clear processes for the approval of new prostheses. In general, we found that:
RPAH and BLH had good, clinician-led controls over prosthesis selection.
GH had some controls over prosthesis selection, such as divisional management sign-off required prior to new product purchases being made.
RNSH appeared to have the highest variability in prostheses selection and the least control over prosthesis selection.
We also found variation in the selection of the type of hip replacement procedure undertaken, based on individual clinician preference, usually related to clinician training or ‘what they were familiar with’.

1 Introduction and executive summary
Case study 1 – Hip joint replacement IPART 11
Managing the rehabilitation phase of care
The main difference in the study hospitals’ arrangements for providing rehabilitation care for hip replacement patients was the extent to which they transferred patients to a rehabilitation facility for this phase or provided rehabilitation care in-house. We found that some hospitals appeared to transfer almost half of their hip replacement patients to rehabilitation facilities, while others transferred as little as 10% and 2%. In some cases, this was due to differences in their access to rehabilitation facilities. While in other cases, it was because of an in-hospital rehabilitation ward (BLH).
1.3.5 Outcome, safety and quality indicators
The terms of reference for this study required us to analyse available data on differences in clinical outcomes across the 5 study hospitals. However, while there are a number of safety and quality indicators being collected locally, at the state level and through clinical registries, there are few clinically agreed outcome indicators. As such, we found that data on only a few indicators of clinical outcomes are collected consistently across hospitals, or on a state-wide (or national) basis. Therefore, we worked with clinical experts to establish a set of outcome, safety and quality indicators that are clinically relevant, and for which we could feasibly obtain data in the timeframe for our study.
We found that some of the outcome indicators were misleading or difficult to interpret for all hip replacement patients and that outcomes differ for fracture and arthritis patients. As such, data was obtained for arthritis patients and fracture patients separately for some of the indicators. Where necessary, we also adjusted the data to take account of differences in patient characteristics.
We considered the performance of the study hospitals against the clinical indicators. We found that:
There was no statistically significant difference in the study hospitals’ risk-adjusted 30-day mortality rates for fracture patients. The number of deaths too small to allow comparisons between the hospitals for arthritis patients.
IRO had the lowest risk-adjusted unplanned readmissions rate for arthritis patients. There was no statistically significant difference in the study hospitals’ rates for fracture patients.
RPAH had the highest risk-adjusted rate for wound infections. However, it also had a more complex casemix than the other hospitals.
RNSH had the highest proportion of fracture patients whose surgery commenced within 24 hours of their emergency admission.
RNSH and JHH had the highest proportions of emergency patients aged 75 years and over who were discharged to their usual place of residence.
1 Introduction and executive summary
12 IPART Case study 1 – Hip joint replacement
1.4 Key implications of these findings?
Variation in prosthesis selection
The wide variation in prosthesis selection for hip replacements should be addressed by NSW Health.
Variation in unplanned readmission and wound infection rates
There were significant differences between the study hospitals in relation to unplanned readmission and wound infection rates. Whilst these differences may simply reflect differences in measurement or casemix among the study hospitals, these differences should be investigated further by clinical expert groups to assess whether further action is warranted.
DRGs are not uniform groupings
Benchmarking studies of the performance of individual hospitals and the public and private hospital sectors often use DRGs as the basis for comparing length of stay and cost. This assumes that patients whose condition or procedure has been coded with the same DRG are relatively similar. Models for casemix or episode-based funding are based on similar assumptions. However, our analysis clearly indicates that such assumptions are not valid for all conditions or procedures.
For the hip replacement case study, we found that the three DRGs are not uniform and that there are subsets of patients that share more similarities than the DRG groups.8 We also found that using DRGs was not our preferred basis for comparing hospitals’ costs, and implicitly, may not be the best basis for setting episode funding levels.
The implication of this is that hospital comparisons based on DRGs can be misleading and may not provide the basis for reasonable comparisons. For some DRGs, it is necessary to test if they contain subsets of patients with similar resource requirements by ‘drilling down’ into DRGs.
Measurement of length of stay
A significant determinant of a patient’s cost of care is length of stay. The NHCDC is currently based on the episode length of stay. We found that episode lengths are not measured consistently by hospitals. In addition, episodes are not an appropriate length of stay measure for clinical groupings like hip replacements that involve transfers to or from other hospitals (eg, for rehabilitation care).
8 In some cases, it may be desirable to break the patient subgroups into further groups to allow a
better ‘like with like’ comparison. For example, the fracture patient subgroup could be split into subgroups based on the different type of fracture involved.
1 Introduction and executive summary
Case study 1 – Hip joint replacement IPART 13
When comparing hospitals with different patterns of transfers, it is desirable to consider the full journey of patients and all consecutive hospital stays. It is possible to calculate length of stay on a more consistent basis using the Australian Institute of Health and Welfare linkage key to link consecutive stays in different hospitals. Calculations on this basis provide a more consistent comparison of length of stay and allow for a more consistent comparison of cost.
Improve quality of cost collection
The reliability of cost estimates in the NHCDC can be improved. The range in cost estimates for hip replacement patients appear to be overstated and the current costing system does not provide a reliable source of comparative cost data at the DRG level. Improvements in cost estimates could be made by: using available clinical data; ensuring a consistent approach to inpatient fractions; and ensuring greater consistency in length of stay calculations.
Standard clinical feeds from existing clinical systems could assist in providing more meaningful, comparable data on resource use and performance. This data could also be used by clinicians to inform clinical practice. It is noted that data systems already generally exist for imaging, pathology and prosthesis costs, however, standardisation of reports that can be used for clinical practice is still required.
The hip replacement case study demonstrates the need to have linked episodes to identify type changes and also DRGs may include subgroups of more similar patients that provide a better basis for comparing costs or clinical practice.
It is suggested that NSW Health can establish more reliability in costing through clear guidelines and auditing – particularly in relation to inpatient fractions.
1.5 List of recommendations
1 That NSW Health notes that separation of planned and emergency cases may reduce lengths of stay for planned (arthritis) cases. 55
2 That NSW Health arranges for appropriate clinical expert groups to address the variation in the selection of hip prosthesis components (including press fit, cementless hip stems versus cemented hip stems and ceramic femoral heads versus metal femoral heads) among study hospitals. 56
3 That NSW Health and clinical expert groups review the variations in the following clinical indicators for hip joint replacement surgery at the study hospitals: 76
– unplanned readmission rates, and 76
– wound infection rates. 76

1 Introduction and executive summary
14 IPART Case study 1 – Hip joint replacement
1.6 What does the rest of this report cover?
The rest of this report discusses the findings of the hip replacement case study in more detail:
Chapters 2 and 3 discuss the main types of hip replacement patients the study identified, and compare the number and mix of these types of patients at the study hospitals.
Chapter 4 compares the length of stay for the different types of patients at the study hospitals, and describes the method we used to compare length of stay on a consistent basis.
Chapter 5 describes how we analysed the costs of hip replacement for each patient type by identifying the main clinical resources used to provide inpatient care, then estimating and comparing the level of each resource used at the study hospitals. It also compares our cost estimates with estimates based on the provisional or final data reported to NSW Health as part of the NHCDC.
Chapter 6 discusses and compares the configurations of care for hip replacement patients at the study hospitals and highlights key differences.
Chapter 7 discusses the indicators of outcome, safety and quality for hip replacement we identified as clinically meaningful. It then compares the available data on these indicators across the study hospitals.
The appendices contain the complete list of recommendations for our hospital costs and outcomes study and provide more detailed information on types of hip replacement and hip prostheses components, a sample of hip prostheses prices, the study hospitals’ role delineation for orthopaedics and data sources for risk-adjusted outcome indicators. A glossary is also included at the end of this report.

2 The main types of hip replacement patient
Case study 1 – Hip joint replacement IPART 15
2 The main types of hip replacement patient
To meaningfully compare data on the costs, configurations of care and outcomes for a particular condition or procedure, the patients to which the data relate must be reasonably similar – to allow ‘like with like’ comparisons. As Chapter 1 discussed, we initially used 3 DRGs to identify clinical and financial data related to patients who had undergone a hip replacement or hip revision at the study hospitals. However, our analysis of the data and discussions with clinicians indicated that the patients within these groups can vary significantly, and that it was necessary to go beyond the DRG level to identify groups of reasonably similar patients.
Patients undergo hip replacement to address a range of medical conditions, and their care requirements can be very different depending on their principal diagnosis. This influences the configurations of care, associated costs and outcomes. To reflect this, we broke the data on hip replacement into 5 subgroups based on the patient’s principal diagnosis code. We also distinguished between primary hip replacements and revisions of previous hip replacements because, on average, these types of hip replacement procedure involve different costs and outcomes.
The sections below describe the main subgroups of hip replacement patient we identified and the main types of hip replacement procedure, and highlight the differences between them.
2.1 Main subgroups of hip replacement patient
We identified 5 main subgroups of hip replacement patients, classified by their principal diagnosis:
1. Hip replacement for arthritis. This is the largest group of patients having hip replacements. These patients are almost exclusively planned admissions. The average age of patients in this group is in the late 60s. Diagnostic tests are minimal as these are generally done prior to admission. Length of stay is the shortest of any of the sub groups.
2. Hip replacement for fracture. Patients in this group are nearly all emergency admissions. Their average age is in the early 80s. Patients are frequently transferred to a rehabilitation ward or transferred to a rehabilitation hospital. Use of diagnostic services and blood is higher. Mortality rate is significantly higher than for the arthritis patients.

2 The main types of hip replacement patient
16 IPART Case study 1 – Hip joint replacement
3. Hip replacement for secondary cancer. This is a small group of patients. On average, those in this group have a longer length of stay, a longer operating theatre time and use more blood.
4. Hip replacement for joint infection. This is another small group of patients. Like the cancer patients, they tend to have a longer length of stay, have longer operations and use more blood.
5. Hip replacement for ‘other’ principal diagnosis. There are a large number of patients coded with other principal diagnoses.
2.2 Main types of hip replacement procedure
Hip replacement procedures are generally classified into 2 main types:
primary hip replacements, which are hip replacements undertaken for the first time, and
hip revisions, which are replacements of pre-existing prostheses with new ones.9
Compared to primary hip replacements, hip revisions can involve longer surgery, their prostheses can be significantly more costly and their outcomes are generally not as good.10 (See Appendix B for further information on the main types of hip replacement procedure and the different types of prostheses.)
Within the 5 groups of patients discussed above, those having a hip replacement for arthritis, fracture or secondary cancer usually have a primary hip replacement. However, those having a hip replacement for joint infection all have hip revisions, and around half those having the procedure for other diagnoses have revisions.
9 The National Joint Registry estimates that at 8 years after surgery, the risk of a hip revision for
any reason following a primary partial hip replacement is 6.1% and 4.9% for a primary conventional hip replacement. See Australian Orthopaedic Association National Joint Replacement Registry, 2009 Annual Report, p 10, (http://www.surfacehippy.info/pdf/aoanjrrreport2009.pdf).
10 Australian Orthopaedic Association National Joint Replacement Registry, 2009 Annual Report, p 8 (http://www.surfacehippy.info/pdf/aoanjrrreport2009.pdf).

3 Number and mix of patients across study hospitals
Case study 1 – Hip joint replacement IPART 17
3 Number and mix of patients across study hospitals
Once we had identified the patient subgroups that would enable meaningful comparison of the costs, configurations of care and outcomes across the study hospitals, we identified the total number of hip replacement cases at each hospital during the study period, and the proportions of these that were emergency or planned admissions. We then compared the mix of cases by identifying the number and proportion of each patient subgroup. We also compared the number of hip revisions by patient subgroup and the average patient age by patient subgroup at each hospital.
We found that the number and mix of hip replacement patient types the study hospitals treated varied significantly. One notable difference was that the proportions of patients having hip replacement surgery for secondary cancer or for joint infections were significantly higher at RPAH. This is significant, given other findings (to be discussed in Chapters 4 and 5) that patients in these subgroups were associated with longer average length of stay and higher diagnostic and blood costs at all hospitals.
The sections below discuss our analysis of patient numbers and mix in more detail.
3.1 Number of hip replacement cases at each study hospital
Our data indicate that the 6 study hospitals treated a total of 1,158 hip replacement cases during the study period. They also show that the number of cases at each hospital varied substantially, as did the proportion of cases that were emergency admissions. (See Table 3.1.)

3 Number and mix of patients across study hospitals
18 IPART Case study 1 – Hip joint replacement
Table 3.1 Hip replacement cases at study hospitals, DRGs 103A, 103B, 103C
RPAH IRO RPAH/ IRO combined GH RNSH BLH JHH
All study hospitals
Cases (no.) 80 247 327 244 123 134 330 1,158
Transfers in (%) 5 1 2 13 5 1 3 5
Transfers out (%) 43 12 19 26 46 2 10 19
Emergency admissions (%)
75 0 18 41 56 45 41 37
Planned admission (%)
16 97 77 45 37 54 56 57
Note: See Boxes 3.1 and 3.2 for details on how we calculated the number of cases, and identified emergency and planned admissions and transfers. Summing the proportion of patients in ‘Emergency admissions’, ‘planned admissions’, ‘transfers in’ and ‘transfers out’ will not necessarily equal 100% because the categories are not mutually exclusive. For example, some patients may be on the waiting list as a planned admission, but be admitted through the emergency department, and so also be categorised as an emergency admission.
Source: HIE inpatient statistics, 2008/09 and IPART analysis.
JHH and RPAH/IRO combined had the highest number of cases – 330 and 327 respectively. GH had the next highest – 244, which is a significant number for a hospital of its size. GH acts as an acute referral facility on the Central Coast and recorded the highest proportion of ‘transfers in’ among the study hospitals.
BLH and RNSH had the lowest number of cases. RNSH’s number – 123 – is low relative to the hospital’s size. This partly reflects the volume of private hip replacement cases undertaken in nearby private facilities.
Box 3.1 provides more detail on how we calculated the number of cases at each hospital.
3 Number and mix of patients across study hospitals
Case study 1 – Hip joint replacement IPART 19
Box 3.1 How we calculated the number of hip replacement cases
To calculate the number of hip replacement cases at the study hospitals, we:
used patient episode data for 2008/09
counted adjoining episodes as part of the same stay (ie, adjoining episodes counted as onecase)
only included patient data where the whole patient stay occurred within 2008/09 (ie, allepisodes and adjoining episodes had to start on or after 1 July 2008 and end on or before30 June 2009 to be counted)
only included patient data where the first episode in the year in the study hospital wascoded as a DRG for a hip replacement (ie, episode sequence number had to be 1).
The approach prevented double counting. It excluded cases where the patient was admittedfor a different procedure and later reclassified to a hip replacement DRG. This may occur, forexample, if the patient was admitted for another condition and had a fracture in hospital, or where there is miscoding.
Note that our approach means that the number of cases we identified will be less than the number of separations in 2008/09.
RPAH had the highest proportion of cases where the patient was admitted through the emergency department (75%). This reflects the fact that the adjacent IRO takes all RPAH’s planned admissions for hip replacements, while RPAH takes all the emergency admissions. When cases for these hospitals were combined, they had the lowest proportion of emergency cases (18%).
The other 4 study hospitals had relatively similar proportions of cases where the patient was an emergency admission, ranging from 41% (at GH and JHH) to 56% (at RNSH).
Box 3.2 describes the method we used to identify planned and emergency admissions.

3 Number and mix of patients across study hospitals
20 IPART Case study 1 – Hip joint replacement
Box 3.2 How we identified emergency and planned admissions and transfers
IPART has used information from the HIE to identify cases that were admitted through theemergency department (emergency admissions), as well as those that were on the ‘waiting list’ for surgery at the time of their admission to hospital for a hip replacement (planned admissions).
Emergency admissions were identified by linking emergency department attendance data withadmitted patient data where the time of arrival and departure in the emergency departmentmatched with the admission time. Note that some of the patients that are transferred in are not included in the emergency figures.
Planned admissions were identified by linking waiting list data with inpatient data where thewaiting list removal code was a planned admission and time on list was more than 1 day.
Due to data quality issues with the transfer in and transfer out fields in the admitted patientdata, transfers were calculated using a linkage key developed by the Australian Institute ofHealth and Welfare.
3.2 Comparison of casemix at the study hospitals
Our data indicates that the relative proportions of cases in each patient subgroup (ie, by principal diagnosis) varied across hospitals. There were also differences in the proportion of cases that were revisions across the hospitals, and the average age of patients at each hospital.
3.2.1 Hip replacement cases by principal diagnosis
Table 3.2 and Figure 3.1 show the number and proportion of cases by principal diagnosis across the study hospitals.

3 Number and mix of patients across study hospitals
Case study 1 – Hip joint replacement IPART 21
Table 3.2 Hip replacement cases by principal diagnosis
RPAH IRO
RPAH/ IRO GH RNSH BLH JHH
All study hospitals
Number of cases
Arthritis 7 185 192 87 34 65 152 530
Fracture 41 0 41 111 52 56 119 379
Secondary cancer 6 3 9 3 2 1 4 19
Joint infection 5 0 5 4 0 0 1 10
Other – not revision 16 23 39 18 15 8 29 109
Other – revision 5 36 41 21 20 4 25 111
% of cases by principal diagnosis
Arthritis 8.8 74.9 58.7 35.7 27.6 48.5 46.1 45.8
Fracture 51.3 0 12.5 45.5 42.3 41.8 36.1 32.7
Secondary cancer 7.5 1.2 2.8 1.2 1.6 0.7 1.2 1.6
Joint infection 6.3 0 1.5 1.6 0 0 0.3 0.9
Other – not revision 20.0 9.3 11.9 7.4 12.2 6.0 8.8 9.4
Other – revision 6.3 14.6 12.5 8.6 16.3 3.0 7.6 9.6
Total 100 100 100 100 100 100 100 100
Note: Totals may not add up due to rounding.
Source: HIE inpatient statistics, 2008/09 and IPART analysis.
Figure 3.1 Hip replacement cases by principal diagnosis
Data source: HIE inpatient statistics, 2008/09 and IPART analysis.
RPAH undertook a significantly higher proportion of cases for joint infection (6.3%) and secondary cancer (7.5%) than the other study hospitals (between 0 and 1.6% of cases in each of these patient subgroups).
0%
10%
20%
30%
40%
50%
60%
70%
80%
90%
100%
RPAH IRO RPAH/IROcombined
GH RNSH BLH JHH
Other –revision
Other - notrevision
Jointinfection
Secondarycancer
Fracture
Arthritis

3 Number and mix of patients across study hospitals
22 IPART Case study 1 – Hip joint replacement
3.2.2 Hip revision cases by principal diagnosis
National Joint Replacement Registry data indicates that approximately 12% of hip replacement cases in NSW public and private hospitals in 2007/08 were hip revisions11. Our data indicates that 127 cases (almost 11% of all cases across the study hospitals) were treated in the study hospitals were coded as revisions.12
Table 3.3 shows the number of hip revision cases by principal diagnosis.
Table 3.3 Number of hip revisions by principal diagnosis
Principal diagnosis RPAH IRO GH RNSH BLH JHH Total
Arthritis 1 2 3
Fracture 2 1 3
Secondary cancer 0
Joint infection 5 4 1 10
Other diagnosis codes 5 36 21 20 4 25 111
Total 10 36 27 21 5 28 127
Source: HIE inpatient statistics, 2008/09 and IPART analysis.
Most of these were hip replacements for other diagnosis. Ten were hip replacements for joint infections, which represents all the cases in this subgroup.
As a proportion of total hip replacement cases, hip revisions represented approximately:
15% of the cases undertaken at RPAH, IRO and RNSH
10%of the cases at JHH and GH.
5% of the cases at BLH.
3.2.3 Average age of patient by principal diagnosis
Table 3.4 shows the average age of patients who had hip replacements at each of the study hospitals by principal diagnosis.
11 Note that this is the number of revision cases undertaken at 8 years, not the percentage of all
cases that are revised (which range from 5% to 6%, on average – but vary by prostheses type) See Australian Orthopaedic Association, Lay Summary, 2009 Annual Report, Hip and Knee Replacement, October 2009, (http://www.dmac.adelaide.edu.au/aoanjrr/documents/aoanjrr_laysummary_2009.pdf).
12 This is relatively close to the state average for public and private hospitals.

3 Number and mix of patients across study hospitals
Case study 1 – Hip joint replacement IPART 23
Table 3.4 Average age of patients by principal diagnosis
Principal diagnosis
RPAH
IRO GH RNSH BLH JHH
All study hospitals
years years years years years years years
Arthritis 73 68 69 68 72 68 69
Fracture 79 83 84 80 84 83
Secondary cancer 60 68 74 55 75 70 66
Joint infection 57 86 74 70
Other – not revision 70 64 65 70 67 62 66
Other – revision 71 66 72 79 61 72 71
All diagnoses 73 67 76 77 75 74 73
Note: Age at date of admission.
Source: HIE inpatient statistics, 2008/09 and IPART analysis.
The average age of patients across all study hospitals was 73 years old. The average age was relatively similar for all hospitals, apart from IRO which had an age of 67. The patients at RNSH, GH and BLH were slightly older than at RPAH and JHH.
Within patient subgroups, the average age of patients with a principal diagnosis of arthritis was 69 years. Those having with fractures are generally an older age group – frequently in their 80s. Those with secondary cancer or joint infections are slightly younger groups.

4 Length of stay across study hospitals
24 IPART Case study 1 – Hip joint replacement
4 Length of stay across study hospitals
We examined the average length of stay of hip replacement patients because it is one of the factors that influence the cost of an individual’s hospital care. This is because a large component of this cost is nursing care (and this cost increases with the length of stay). In addition, differences in length of stay can point to differences in casemix or clinical practice between hospitals.
We calculated the average length of stay across all study hospitals for all hip replacement cases and for each patient subgroup (based on principal diagnosis) using 3 different measures:
episode length of stay in study hospital (LOS1)
total length of stay in study hospital (LOS2)
total length of stay in study hospital and 2 other hospitals – one transfer in and one transfer out (LOS3).
Box 4.1 provides more detail on these measures.
The sections below set out our analysis of length of stay for all hip replacement cases, as well as for fracture and arthritis cases, with a focus on LOS1 and LOS3. For fracture patients, we found that differences in the average episode length of stay across the study hospitals are likely to be due to differences in the way the hospitals reclassify patients from acute to rehabilitation care, rather than differences in clinical practice.

4 Length of stay across study hospitals
Case study 1 – Hip joint replacement IPART 25
Box 4.1 The 3 measures of length of stay we used for hip replacement patients
1. Episode length of stay in study hospital (LOS1)
This is the average number of days a patient stayed in the study hospital for a single acute episode. This measure is often used in NHCDC and DRG benchmarking analyses. We used this measure to enable comparisons to be made between our cost estimates and those included inthe NHCDC (discussed in Chapter 5).
2. Total length of stay in study hospital (LOS2)
This is the total number of days a patient stayed in the study hospital from admission to discharge. It includes all consecutive episodes including acute, rehabilitation and any othertypes of care. However, for some conditions/procedures, patients can be:
transferred to the study hospital from another hospital, and/or
transferred from the study hospital to another.
LOS2 does not include the length of stay in such other hospitals, so does not provide a consistent basis for comparing average length of stay required to care for certainconditions/procedures.
3. Total length of stay in study hospital plus up to 2 other hospitals – one transfer in and one transfer out (LOS3)
The third measure is the total length of stay in the study hospital (ie, LOS2), plus the totallength of stay at 2 other hospitals – one ‘transfer in’, and one ‘transfer out’. Ideally all related hospital stays would be linked, but we have only added up to one additional hospital stay at either end of the stay in the study hospital. We used the linkage key developed by the Australian Institute of Health and Welfare (AIHW) for use between all public and privatehospitals. This step is not routinely done in hospital comparisons.
We consider that LOS3 is a more consistent basis for comparing average length of stay forcertain conditions/procedures because it takes account of differences in hospital:
administrative practices for reclassifying patients between their acute care and other phases of care (type changes)
access to rehabilitation facilities (transfers out)
patterns of referral from other hospitals (transfers in).
4.1 Comparing length of stay for all hip replacement patients
Table 4.1 compares the average length of stay for all hip replacement patients across the study hospitals, using the LOS1 and LOS3 measures. This is included to show the variation in length of stay for the hip group as a whole. However, when we look at subgroups of like-patients (fractures and arthritis), length of stay is much more consistent between hospitals. These groups can be compared more meaningfully.

4 Length of stay across study hospitals
26 IPART Case study 1 – Hip joint replacement
Table 4.1 Average length of stay for all hip replacements cases
Hospital Cases LOS1 LOS3
no. days days
RPAH 80 15.7 23.6
IRO 247 7.3 9.7
GH 244 10.7 17.2
RNSH 123 10.4 19.9
BLH 134 9.9 14.0
JHH 330 10.6 14.4
All study hospitals 1,158 10.2 15.1
Note: DRGs I03A, I03B and I03C.
Source: HIE inpatient statistics, 2008/09 and IPART analysis.
Using both measures, the average length of stay at RPAH was notably longer than at the other study hospitals, while this length at IRO was notably shorter. This reflects RPAH treating the patients with the longest lengths of stay (fractures, cancers and infections), and IRO treating those with the lowest length of stay (arthritis cases). Average length of stay at the other study hospitals was reasonably similar using LOS1, but more varied when using LOS3.
4.2 Comparing length of stay for fracture patients
Table 4.2 compares the average length of stay for fracture patients across the study hospitals.
Table 4.2 Average length of stay for fracture patients
Hospital Cases LOS1 LOS3
no. days days
RPAH 41 12.9 23.1
GH 111 12.7 23.6
RNSH 52 10.3 21.4
BLH 56 13.4 21.9
JHH 119 13.5 21.5
All study hospitals 379 12.8 22.3
Note: DRGs I03A, I03B and I03C using fracture diagnosis code.
Source: HIE inpatient statistics, 2008/09 and IPART analysis.
Lengths of stay for this subgroup of patients are generally longer than those for all patients (see Table 4.1). The only exception is RPAH, because its casemix includes a higher proportion of secondary cancer and joint infection patients, which generally require longer care.
4 Length of stay across study hospitals
Case study 1 – Hip joint replacement IPART 27
It is interesting to note that there is a higher degree of variation in length of stay across hospitals using LOS1 than LOS3. For example, using LOS1, the average length of stay for fracture patients is highest at JHH and BLH (13.5 and 13.4 days respectively), and lowest at RNSH (10.3 days). However, using LOS3 (which takes into account differences in hospital transfers and differences in practices for reclassifying patients), the average length of stay at these 3 hospitals is very similar (21.5, 21.9 and 21.4 days respectively).
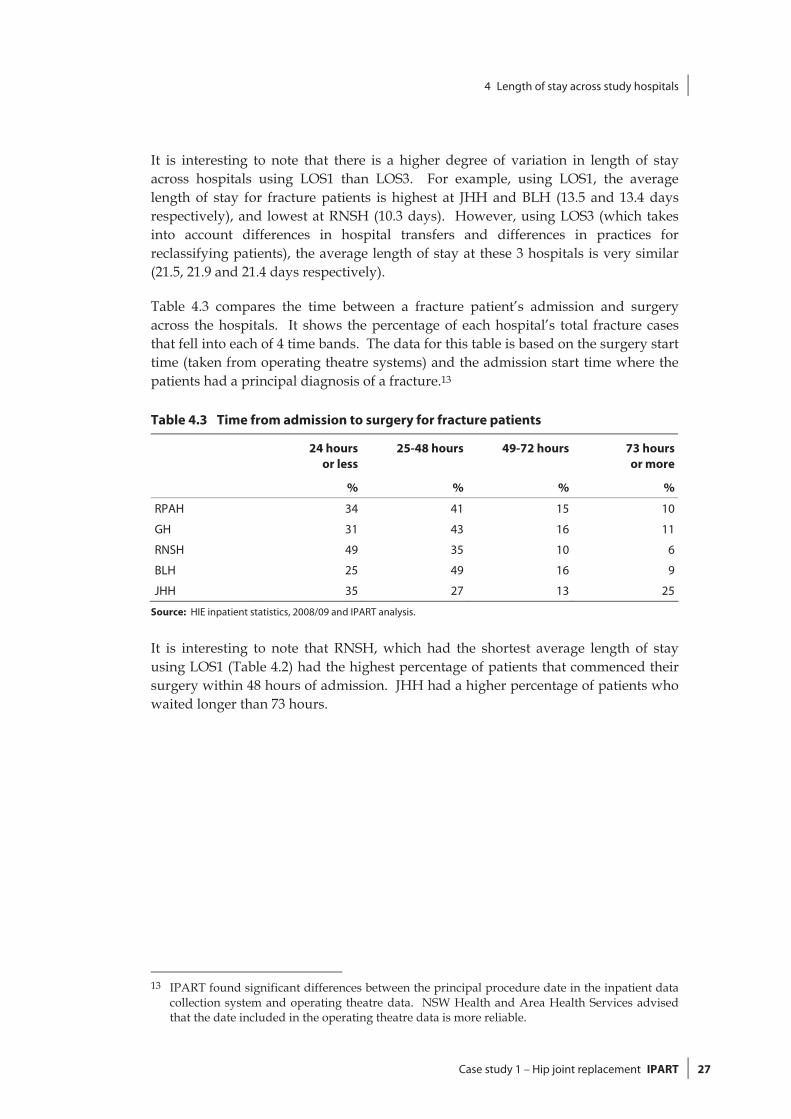
Table 4.3 compares the time between a fracture patient’s admission and surgery across the hospitals. It shows the percentage of each hospital’s total fracture cases that fell into each of 4 time bands. The data for this table is based on the surgery start time (taken from operating theatre systems) and the admission start time where the patients had a principal diagnosis of a fracture.13
Table 4.3 Time from admission to surgery for fracture patients
24 hours or less
25-48 hours 49-72 hours 73 hours or more
% % % %
RPAH 34 41 15 10
GH 31 43 16 11
RNSH 49 35 10 6
BLH 25 49 16 9
JHH 35 27 13 25
Source: HIE inpatient statistics, 2008/09 and IPART analysis.
It is interesting to note that RNSH, which had the shortest average length of stay using LOS1 (Table 4.2) had the highest percentage of patients that commenced their surgery within 48 hours of admission. JHH had a higher percentage of patients who waited longer than 73 hours.
13 IPART found significant differences between the principal procedure date in the inpatient data
collection system and operating theatre data. NSW Health and Area Health Services advised that the date included in the operating theatre data is more reliable.

4 Length of stay across study hospitals
28 IPART Case study 1 – Hip joint replacement
4.3 Comparing length of stay for arthritis patients
Table 4.4 shows the average length of stay for arthritis patients across the study hospitals, using LOS1 and LOS3.
Table 4.4 Average length of stay for arthritis patients
Hospital Cases LOS1 LOS3
no. days days
IROa 185 6.9 8.5
GHH 87 7.3 9.0
RNSH 34 8.1 12.0
BLH 65 7.1 7.7
JHH 152 7.5 7.4
Note: DRG I03A, I03B, I03C, arthritis diagnosis code. RPAH treated only 7 such cases during 2008/09, 2 of which were admitted through the emergency department, and these cases have been omitted from the data. Source: HIE inpatient statistics, 2008/09 and IPART analysis.
The average length of stay for arthritis patients was much shorter than for fracture patients across all hospitals using all measures, reflecting that these patients are younger, may not require a period of rehabilitation and tend to be having planned surgery.
5 Costs of providing inpatient care
Case study 1 – Hip joint replacement IPART 29
5 Costs of providing inpatient care
To compare the costs of caring for hip replacement patients at the study hospitals, we examined the major clinical resources used to provide inpatient care during their ‘acute episode’ (ie, using LOS1). The clinical resources we examined were:
prostheses
nursing staff in wards
imaging
pathology
blood use, and
operating theatre.
The sections below discuss our analysis of the estimated costs for each of these resources across the study hospitals. For nursing, prostheses, imaging and pathology costs, they also compare our estimated costs with estimates based on provisional or final data reported to NSW Health by Area Health Services as part of the NHCDC.14
Note that given the scope of our task for this study, we were not able to undertake a full bottom-up costing of all the above resource categories. Instead, we used a range of approaches, based on the most reliable and consistent data we could obtain in the time available. The methodologies we used are outlined in the sections below, and discussed in more detail in our main report, NSW Health costs and outcomes study by IPART for selected NSW hospitals. Also note that while junior and senior medical staff are a major cost for hip replacement cases, we were not able to compare the use and management of these clinical resources in the timeframe available due to the lack of consistent data.
In order to meaningfully compare costs across the study hospitals, we have focused on costs for the fracture and arthritis patient subgroups, rather than all hip replacement cases.
14 Due to time constraints, we used the final data only where there were substantial differences
between the provisional and final data. For this case study we used final NHCDC for prostheses and to adjust the provisional pathology costs for GH and RNSH.

5 Costs of providing inpatient care
30 IPART Case study 1 – Hip joint replacement
5.1 Prosthesis costs
Hip joint prostheses are a significant part of the total cost of hip replacements. The NHCDC indicates that the average cost of hip prostheses at public hospitals in Australia ranges from around $4,500 for hip replacements to $7,900 for hip revisions.15
To analyse the cost of hip prostheses, we examined information from study hospitals’ purchasing databases and determined the types of prosthesis components being purchased, how frequently different components were purchased and what prices were paid. More detail on IPART’s approach to analysing prosthesis costs is provided in Chapter 10 of our main report, NSW Health costs and outcomes study by IPART for selected NSW hospitals. Box 5.1 provides an overview of our approach to analysing the prosthesis costs. (Note that in this section, RPAH includes IRO because the bulk of RPAH’s planned hip joint replacement surgery is done at IRO.)
15 National Hospital Cost Data Collection, Public Sector Estimated Cost Weights Round 12 AR-
DRG v5.1, 2007/08.

5 Costs of providing inpatient care
Case study 1 – Hip joint replacement IPART 31
Box 5.1 How we analysed prosthesis costs
For each prosthesis, we examined as many of each study hospital’s purchases (includingsupplier, model and price paid) as possible in 2008/09. Then we compared: the relative use of different types of the item across study hospitals the prices paid for the item, including for the same or similar models of the item, across
hospitals the prices paid for each hospital’s most frequently purchased model of the item.
Given that we did not have complete information on the hospitals’ volumes of prosthesispurchases, we asked hospitals to check which particular type of prosthesis they purchasedmost frequently in 2008/09.
We also: ranked the study hospitals in terms of the prices paid for directly comparable types/models
of the item calculated the percentage differences between the prices paid by the hospitals for their
most frequently purchased models of the item and the lowest price paid for that same model by a study hospital
estimated the potential annual savings available to each hospital if it used only its most frequently purchased model of the item in 2008/09 and purchased this model at the lowestprice paid for that same model by any study hospital (as per the previous calculation).a
To rank the study hospitals, we used data on each model purchased by more than one studyhospital. For each of these models, we ranked the hospitals as either paying the lowest price, second lowest, third lowest or fourth lowest, depending on the relative prices they paid. If 2 ormore hospitals paid the same price, we gave them the same ranking (except where onehospital had purchased the item on behalf of the other(s) - in this case, only the purchasing hospital was included in the analysis). If only one hospital had purchased a particular model,this model was excluded from the analysis.
We cannot be sure that all item purchases and prices were included in this process. Forexample, some may have been omitted because they were called something other than theparticular item name we searched for in the hospitals’ purchasing databases (eg, somethingother than hip stem). In addition, as noted above, others were omitted because only one hospital purchased a particular model. However, we are confident that most purchases wereincluded in the analysis, and that the results provide a useful indication of which studyhospitals are paying more or less than others for the selected prosthesis.
Note that for hip procedures, a number of individual components of hip prostheses are used(eg, stems, liners, femoral heads etc) and not just one prosthesis. Therefore, we estimated thetotal prosthesis costs of a hip joint replacement by summing the prices paid for the total hip joint prostheses purchased most frequently by each hospital. Also note that in analysing hipprosthesis costs at RPAH we included data from IRO, because IRO treats most of RPAH’splanned hip joint replacement cases.
a For example, consider if one hospital purchased Item X more than any other hip stem and purchased it for $2,500,while another study hospital purchased it for $1,873. The first hospital could potentially save $627 or 25% on everypurchase of that item. This could translate to a total of $82,137 in annual savings based on a volume of 131 cases thatwould require hip stems.

5 Costs of providing inpatient care
32 IPART Case study 1 – Hip joint replacement
Our analysis indicates that prosthesis purchasing is an area that provides immediate opportunities for cost savings. Potential savings could be made by all the study hospitals through the negotiation of lower prices for commonly purchased prostheses. Therefore, further effort to achieve price reductions – for example, by sharing information across area health services and hospitals, and using tender-based purchasing for the commonly used types of each component – appear to be warranted. However, clinical input and engagement in this process would be essential for these efforts to succeed. As Chapter 10 of our main report16 highlights, BLH and RPAH both provide an example of effective clinical engagement in the prosthesis purchasing process when controls on choice and threshold pricing levels apply.
That said, we note that our analysis is indicative only and that there may be additional benefits to hospitals from certain prices for prostheses which have not been included in the analysis (eg, offsetting price reductions of other items and additional services included free of charge). We also recognise that different types and combinations of prostheses may be better suited to some patients than others, depending on their conditions and diagnosis.
5.1.1 Types of hip prostheses
There are 4 four main prosthesis components used in a total hip joint replacement procedure:
the acetabular shell
the liner or insert that goes between the acetabulum shell and the femoral head (which are often made of polyethylene, but can also be made of other materials)
the femoral head, and
the hip stem implant.
The number of components required depends on whether the patient requires a partial hip replacement or a total hip replacement. See Appendix B for further details on these components.
Each hip prosthesis component comes in a range of types, which vary in terms of the materials they are made of, the methods for fixing the individual components to each other and to the femur, and the price. There are also prostheses that do not involve separate components. These ‘all-in-one’ prostheses are known as monoprostheses.
In choosing between the different types, surgeons consider the condition and age of the patient, as some materials and fixing methods are considered preferable for younger patients (who typically have both longer lives ahead of them and more active lifestyles).
16 IPART, NSW Health costs and outcomes study by IPART for selected NSW hospitals, July 2010.

5 Costs of providing inpatient care
Case study 1 – Hip joint replacement IPART 33
For example, acetabular shells and femoral heads can be made of ceramic or metal, while the liner or insert between these components can be polyethylene, ceramic or metal. The combination of surface materials used on these articulating components can influence the durability of the prosthesis and thus the need for revisions. Different options include metal on polyethylene (most common), ceramic on polyethylene, ceramic on ceramic and metal on metal. Metal on metal is often used on younger patients with osteoarthritis or rheumatoid arthritis of the hip because it conserves femoral bone, provides anatomical bone loading and eliminates polyethylene.17
Whether or not the components require cement to fix them together and to the central core of femur can also influence durability. For example, using a cementless hip stem implant which fits tightly into the bone and is held in place by subsequent bone growth, is considered to have longer durability and to be especially suitable for younger patients. However, the cementless components are more expensive than those that require cement. Further, procedures which require cement have a lower risk of a revision.18
In partial hip replacements, Austin Moore and Thompson hemiarthroplasties are commonly used to manage subcapital neck of femur fractures, particularly in the frail elderly. The Austin Moore prostheses are also cementless but these are much less expensive than other the options and are only considered suitable for patients with limited mobility.19
5.1.2 Range of prices paid for hip prostheses components across study hospitals
We found that the prices paid for individual components varied significantly:
The price for most acetabular shell models ranged from $2,000 to $3,000, but was as high as $3,500 to $4,500 for porous coated, metal or cementless models.
The price for the liner (or insert) ranged from $1,500 to $1,800 for polyethylene models, and $2,000 to $2,500 for alumina models. The price for ceramic models was anywhere between $2,000 and $5,000 (though a common price was $3,500).
The price for femoral heads was as low as $400 to $600 for one particular model, but could cost anywhere up to around $2,500 for other models.
The price for hip stem implants was as low as $400 to $600 for 2 particular models, but were mostly between $2,000 to $5,000.
These variations underline how widely the total cost of a hip prosthesis can vary per patient, depending on the particular model of each component used.
17 Amstutz et al., “Hybrid metal-on-metal surface arthroplasty of the hip,” Operative Techniques in
Orthopaedics, Vol 11, Issue 4, October 2007, pp 253-262. 18 National Joint Replacement Registry, Lay Summary 2009 Annual Report Hip and Knee Replacement,
Supplementary Report, 2009, p 4. 19 National Joint Replacement Registry, Lay Summary 2009 Annual Report Hip and Knee Replacement,
Supplementary Report, 2009, p 4.

5 Costs of providing inpatient care
34 IPART Case study 1 – Hip joint replacement
Appendix C compares the price paid by the study hospitals for a sample of specific models of each of the 4 main components. Table 5.1 shows the type, model and price paid for each study hospital’s most frequently purchased model of each component in 2008/09. Figure 5.1 compares the price paid for these models in graph form. The table indicates that there was considerable consistency in the type and model of each component the hospitals’ most frequently purchased. In most cases, these models were supplied by the same global orthopaedic medical technology supplier.
However, for some components, there were some key differences. In particular, JHH’s most frequently purchased femoral head was the more expensive ceramic type, while other study hospitals’ were the metallic type. Also, RNSH’s most frequently purchased acetabular shell was the more expensive hemi porous coated type, while most hospitals’ were the hydroxyapatite covered type.
As noted above, a hospital’s patient mix is an important driver of the types of prostheses it most frequently uses. However, it is also clear that orthopaedic surgeons’ own preferences and philosophies can also influence their prostheses purchases.
Table 5.1 Most frequently purchased hip prosthesis components by study hospital, 2008/09
RPAH GH RNSH BLH JHH
Acetabular shell
Model Shell C (HA) Shell C (HA) Shell E (PC) Shell C (HA) Shell A (PC)
Supplier Supplier 2 Supplier 2 Supplier 4 Supplier 2 Supplier 1
Price ($) 2,300 2,900 3,094 2,600 2,450
Liner/insert
Model Liner/Insert B Liner/Insert B Liner/Insert B Liner/Insert B Liner/Insert B
Supplier Supplier 2 Supplier 2 Supplier 2 Supplier 2 Supplier 2
Price ($) 1,300 1,836 1,500 1,400 1,500
Femoral head
Model Femoral
Head E Femoral Head
EFemoral Head
EFemoral Head
EFemoral
Head B
Supplier Supplier 2 Supplier 2 Supplier 2 Supplier 2 Supplier 1
Price ($) 780 718 810 600 2,100
Hip stem implant
Model Hip Stem C Hip Stem C Hip Stem C Hip Stem C Hip Stem C
Supplier Supplier 2 Supplier 2 Supplier 2 Supplier 2 Supplier 2
Price ($) 2,000 1,873 2,500 2,390 2,100
Note: “HA”= Hydroxyapatite covered, “PC” =porous coated.
Data source: Study hospitals’ purchasing databases and direct advice to IPART. All frequent purchases and prices were checked by study hospitals.

5 Costs of providing inpatient care
Case study 1 – Hip joint replacement IPART 35
Figure 5.1 Prices study hospitals paid for their most frequently purchased model of each hip prosthesis component, dollars, 2008/09
0
500
1,000
1,500
2,000
2,500
3,000
3,500
JHH RPAH GH RNSH BLH
Acetabular Shell Insert Femoral Head Stem
$
Data source: Study hospitals’ purchasing databases. All frequent purchases and prices were checked by study hospitals.
5.1.3 Rankings of study hospitals based on prices paid for comparable hip prosthesis components
We used the ranking process described in Box 5.1 to provide a broad indication of whether the study hospitals tended to pay relatively high or low prices for the same products. This analysis indicated that:
GH and BLH paid relatively lower prices than the other study hospitals. They paid the lowest price for 55% and 50% of their comparable purchases of hip prosthesis components respectively.
JHH and RPAH both paid the lowest price for 38% of their comparable purchases.
RNSH paid the lowest price for only 13% of its comparable purchases.
5.1.4 Estimated potential annual from paying lowest price for most frequently purchased hip prosthesis components
As for the other prosthesis items, we looked at the potential savings available to each study hospital if it negotiated better prices for hip prostheses. For each component, we estimated the annual savings each hospital could hypothetically make if it purchased the total volume of the component it required in 2008/09 at the lowest price paid for its most frequently purchased model of that component by any study hospital. We calculated this volume by summing the total number of hip replacement cases each hospital treated that year (DRGs 103A, 103B and 103C).20 20 DRGs 103A, 103B and 103C include hip replacements and revisions.

5 Costs of providing inpatient care
36 IPART Case study 1 – Hip joint replacement
Our analysis indicated that all study hospitals could make savings on hip prosthesis components. However, GH, RNSH and JHH had the greatest potential savings:
GH could save a total of $323,532 on hip prosthesis components, including 21% on acetabular shells (for a hypothetical annual saving of $154,800), 29% on liners/inserts (for a hypothetical annual saving of $138,288) and 16% on femoral heads (for a hypothetical annual saving of $30,444).
JHH could save a total of $150,304 – including 13% on liner/inserts (for a hypothetical annual saving of $70,400) and 11% on hip stem implants (for a hypothetical annual saving of $79,904).
RNSH could save a total of $135,847 - including 13% on liners/inserts (for a hypothetical annual saving of $26,200), 26% on femoral heads (for a hypothetical annual saving of $27,510) and 25% on hip stem implants (for a hypothetical annual saving of $82,137).
BLH could save a total of $123,795 - including 12% on acetabular shells (for a hypothetical annual saving of $40,500), 7% on liners/inserts (for a hypothetical annual saving of $13,500) and 22% on hip stem implants (for a hypothetical annual saving of $69,795).
RPAH could save a total of $25,788 – including 23% on femoral heads (for a hypothetical annual saving of $15,120) and 6% on hip stem implants (for a hypothetical annual saving of $10,668).
5.1.5 Implications of our findings on prosthesis costs for study hospitals’ approach to prosthesis purchasing
Overall, our analysis highlights that potential savings in prosthesis purchasing costs can be made through negotiation of lower prices for frequently purchased prostheses. At the time of our study, the study hospitals did not usually share information on the prices they pay for prostheses with other hospitals, often not even with hospitals within the same area. As a result, some hospitals do not realise when other hospitals are paying much less for exactly the same items.
The hospitals that paid relatively low prices for prostheses were generally those that engaged in regular price agreements with suppliers. For example, RPAH and BLH benefited from lower costs as a result of an area-level threshold pricing policy which applies to the purchase of orthopaedic prostheses. This policy places a ceiling on the price each hospital can pay per total hip prosthesis (ie, all the required components per case).
During our hospital visits, hospital staff indicated that they consider there is scope for more organised purchasing or broader supply agreements of some prostheses items. They noted that the smaller hospitals, in particular, would benefit from area-wide tenders since they often lack the bargaining power that the larger hospitals have in price negotiations. In addition, they noted that area-wide tenders usually
5 Costs of providing inpatient care
Case study 1 – Hip joint replacement IPART 37
require fewer resources for negotiation compared to when hospitals negotiate prices themselves individually.
This raises the question as to whether or not some prosthesis items would be better purchased at the state-level, since the bargaining power would be even greater. The current state-wide tender process in health involves procurement of food, linen and other medical consumables being negotiated at the centralised level by NSW Health Supply.
On the other hand, clinicians put the view that state-wide tenders could potentially stifle competition and innovation in the supply of prostheses. They also emphasised the need for some flexibility in the system to allow clinicians some choice in meeting individual patient needs and, at times, to accommodate their own familiarity with certain types or models to ensure the safety of the patient. Further, we acknowledge that hospitals have varying needs for prosthesis items due to their different patient mix, and may have different interests to the state hospital system as a whole.
However, our pricing comparisons provide solid evidence that more organised approaches by hospitals or areas to purchasing, and some controls on clinicians’ product choices, do lead to savings on frequently purchased prostheses. These findings have informed our broader findings and recommendations on prostheses purchasing as presented in Chapter 10 of the main report (NSW Health costs and outcomes study by IPART for selected NSW hospitals). In addition, RPAH demonstrated the benefit of having a dedicated business manager to negotiate price reductions on behalf of an individual hospital (although we recognise that this approach may not be cost-effective at smaller hospitals).
5.1.6 Estimated prosthesis costs per patient across study hospitals, based on NHCDC data
All Australian hospitals provide estimates of their prosthesis costs per patient in the DRGs that involve prostheses as part of the information they submit annually for the NHCDC. We examined the study hospitals’ provisional and final estimates of their average prosthesis costs per patient for 2008/09 as reported by area health services to NSW Health for the NHCDC. This enabled us to gauge how reasonable the study hospitals’ estimates were.
As Table 5.2 shows, the study hospitals report a wide range of average prosthesis costs per patient. In some cases, the reported costs appear unreliable. For example, the average hip prosthesis cost per patient reported by BLH and JHH were very low. The costs reported by RNSH and GH appear to be the most reasonable among the study hospitals, which may reflect the access to patient-level expenditure data at these hospitals.
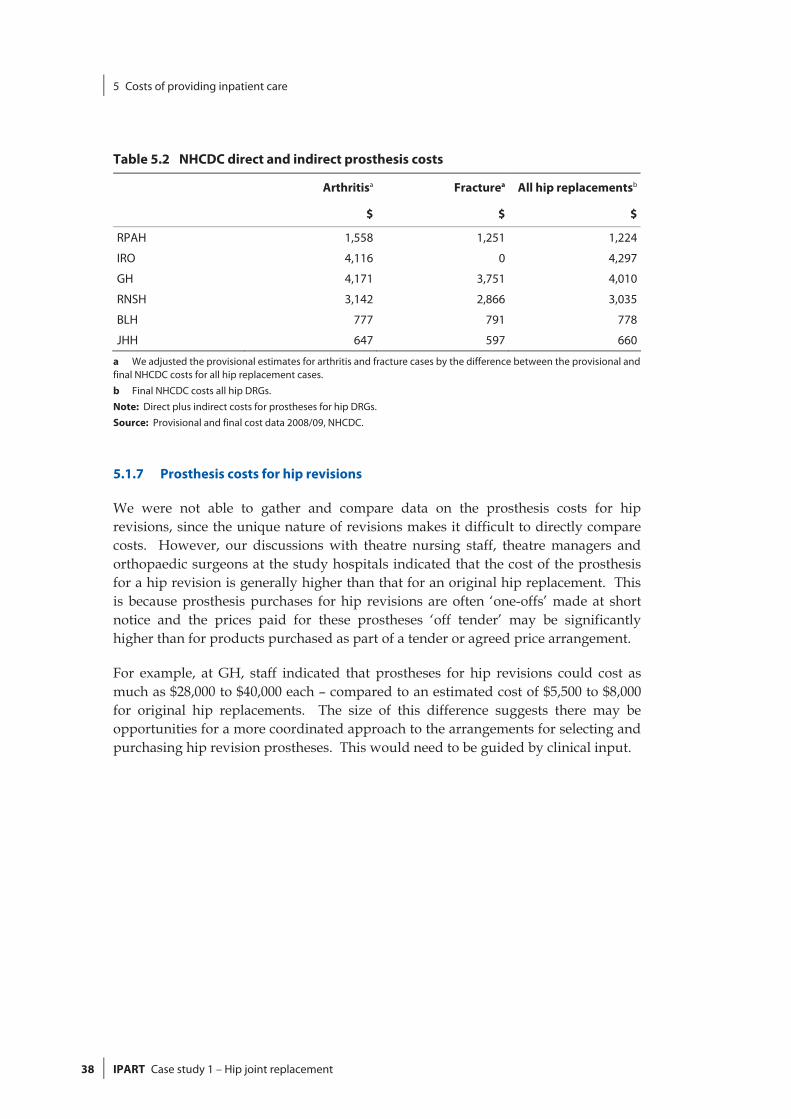
5 Costs of providing inpatient care
38 IPART Case study 1 – Hip joint replacement
Table 5.2 NHCDC direct and indirect prosthesis costs
Arthritisa Fracturea All hip replacementsb
$ $ $
RPAH 1,558 1,251 1,224
IRO 4,116 0 4,297
GH 4,171 3,751 4,010
RNSH 3,142 2,866 3,035
BLH 777 791 778
JHH 647 597 660
a We adjusted the provisional estimates for arthritis and fracture cases by the difference between the provisional and final NHCDC costs for all hip replacement cases.
b Final NHCDC costs all hip DRGs.
Note: Direct plus indirect costs for prostheses for hip DRGs.
Source: Provisional and final cost data 2008/09, NHCDC.
5.1.7 Prosthesis costs for hip revisions
We were not able to gather and compare data on the prosthesis costs for hip revisions, since the unique nature of revisions makes it difficult to directly compare costs. However, our discussions with theatre nursing staff, theatre managers and orthopaedic surgeons at the study hospitals indicated that the cost of the prosthesis for a hip revision is generally higher than that for an original hip replacement. This is because prosthesis purchases for hip revisions are often ‘one-offs’ made at short notice and the prices paid for these prostheses ‘off tender’ may be significantly higher than for products purchased as part of a tender or agreed price arrangement.
For example, at GH, staff indicated that prostheses for hip revisions could cost as much as $28,000 to $40,000 each – compared to an estimated cost of $5,500 to $8,000 for original hip replacements. The size of this difference suggests there may be opportunities for a more coordinated approach to the arrangements for selecting and purchasing hip revision prostheses. This would need to be guided by clinical input.

5 Costs of providing inpatient care
Case study 1 – Hip joint replacement IPART 39
5.2 Cost of nursing staff in wards
Nursing is one of the largest expenditure areas in hospital budgets and is a significant part of the cost of the acute care of patients having hip replacements.
5.2.1 Methodology
To analyse this cost and allow comparisons with the NHCDC, we focused on:
the cost of nursing staff in wards (ie, excluding those costs of nursing staff in operating theatres or senior nursing categories that provide area-wide or hospital-wide functions)
nursing costs for the acute episode only (ie, LOS1).
Our methodology for estimating nursing costs and its limitations are briefly described in Box 5.2 and in more detail in Chapter 8 of our main report, NSW Health costs and outcomes study by IPART for selected NSW hospitals. Further, these estimates should be considered in light of the discussion in Chapter 4 on the limitations of using LOS1 relative to LOS3 (the length of stay for the acute episode plus other episodes plus up to one transfer in and one transfer out).
5.2.2 Use of IFRACs
The hospitals use inpatient fractions (IFRACs) to allocate staff time to acute care and other staff responsibilities. We calculated two sets of inpatient nursing costs, the first using the hospitals’ IFRACs and the second setting all IFRACs to 1.21 We did this because we were concerned that IFRACs may not be consistently applied by the hospitals.
RPAH, IRO, BLH and JHH have IFRACs of close to 1, while GH and RNSH have IFRACs of 0.67 and 0.80 respectively. These IFRACs may be valid, because ward nursing staff at GH and RNSH spend time on non-inpatient activities (eg, staffing outpatient clinics). The purpose of our analysis is to show how sensitive the nursing cost estimates are to IFRACs. IFRACs also underlie the NHCDC estimates of ward costs.
21 Setting IFRACs to 1 means that we allocated 100% of the nursing time to inpatient care.

5 Costs of providing inpatient care
40 IPART Case study 1 – Hip joint replacement
5.2.3 Nursing costs for fracture patients
Average ward nursing costs per acute episode
Table 5.3 contains our estimates of the average ward nursing costs per acute episode for fracture patients. The last column shows the direct nursing costs from the provisional data for the NHCDC.
Using the existing IFRACs, the average ward nursing cost per acute episode ranges from $1,731 at RNSH to $2,928 at RPAH. When all nursing costs are attributed to inpatient care (ie, IFRAC=1), it leads to a smaller variation in nursing costs across the study hospitals, ranging from $2,175 at RNSH to $2,962 at RPAH.
When compared to our estimates, the NHCDC contains a much greater difference in nursing costs between the study hospitals. Direct nursing costs range from $2,553 at RNSH to $4,227 at JHH.
Main factors affecting nursing costs
Our analysis indicates that the average ward nursing cost per acute episode is affected by four main factors:
IFRACs
length of stay (ie, LOS1)
nursing staff-to-patient ratio (ie, nursing hours per patient day)
nursing staff mix.
IFRACs affect both the nursing costs per episode and the nursing costs per patient day (ie, per day of the acute episode). See Table 5.3 and Table 5.54. Setting IFRACs to 1 increases the costs at GH and RNSH, and significantly reduces the difference between their costs and those at the other hospitals. When all nursing costs are attributed to inpatient care (ie, IFRAC=1), there is a much smaller variation in nursing costs across the study hospitals for fracture patients than is implied by the NHCDC.
We found there is a direct relationship between the second factor, the length of stay, and episode costs. In general, when IFRACs are set to 1, hospitals with a longer length of stay are likely to have higher cost per acute episode than hospitals with a shorter length of stay. For example, when IFRACs = 1, RNSH has the shortest acute episode length of stay (10.3 days) and the lowest cost per episode ($2,175).22
Along with the episode length of stay, we found that the nursing cost per patient day has a strong influence on the episode cost. In turn, the staff-to-patient ratio (third factor) and the staff mix (fourth factor) affect the nursing cost per patient day.
22 We note that the length of stay is not consistently measured by the hospitals and is affected by
transfers.

5 Costs of providing inpatient care
Case study 1 – Hip joint replacement IPART 41
In principle, a hospital with a high staff-to-patient ratio is likely to have higher costs per patient day than a hospital with a lower staff-to-patient ratio. But a higher number of hours can be offset by lower costs per nursing hour if there is a high proportion of Enrolled Nurses (ENs) and Assistants in Nursing (AINs) in the staff mix. However, our analysis suggests that the average cost per patient day at the different hospitals depends more on staffing levels than the staff mix. The staff mix results in only a small variation in the average cost per nursing hour, from $34 at RPAH to $37 at JHH (Table 5.5).
To demonstrate the relative impacts of staffing levels versus staff mix, we note that GH and RNSH provide a very similar number hours of care per patient day (5.8 and 5.9 respectively, with IFRACs =1). But their staff mix is very different: at GH 33% of nurses are ENs or AINs, while at RNSH only 19% of nurses are ENs or AINs.23 Despite the differences in staff mix, the hospitals have the same nursing cost per patient day ($211, with IFRACs =1).24
Our analysis indicates that, with IFRACs set to 1, RPAH has the highest number of nursing hours per patient day (6.7 hours) and the highest cost per patient day ($230). JHH has the lowest number of nursing hours per patient day (5.4) and the lowest cost per patient day ($198).
Table 5.3 Ward nursing cost per acute episode for fracture patients, with and without IFRAC
LOS1 LOS3 Episode nursing
cost with IFRAC
IFRAC Episode nursing
cost, IFRAC =1
NHCDC direct
ward costs
days days $ no. $ $
RPAH 12.9 23.1 2,928 0.99 2,962 2,867
GH 12.7 23.6 1,875 0.70 2,680 3,023
RNSH 10.3 21.4 1,731 0.80 2,175 2,553
BLH 13.4 21.9 2,913 1.00 2,911 3,508
JHH 13.5 21.5 2,580 0.96 2,685 4,227
Note: Episode nursing cost calculated using acute episode LOS measure (LOS1).
Source: IPART analysis from HIE inpatient statistics, 2008/09, payroll data and provisional cost data 2008/09, NHCDC.
23 We have included student nurses with the ENs and AINs. The nursing categories are explained
in Chapter 8 of our main report, NSW Health costs and outcomes study by IPART for selected NSW hospitals.
24 We note however that the hourly cost of RNs is higher at GH ($40) than at RNSH ($37). This suggests that GH has a higher proportion of senior RNs than RNSH, and/or that RNs at GH do more overtime than RNs at RNSH.
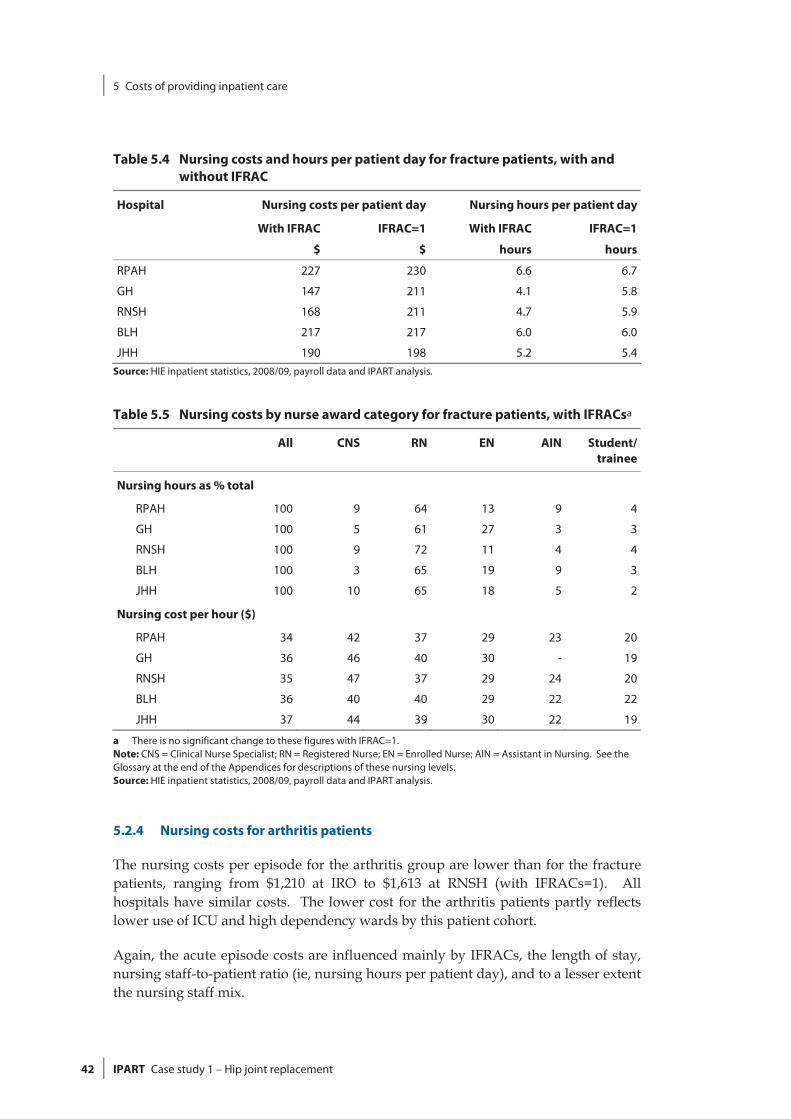
5 Costs of providing inpatient care
42 IPART Case study 1 – Hip joint replacement
Table 5.4 Nursing costs and hours per patient day for fracture patients, with and without IFRAC
Hospital Nursing costs per patient day Nursing hours per patient day
With IFRAC IFRAC=1 With IFRAC IFRAC=1
$ $ hours hours
RPAH 227 230 6.6 6.7
GH 147 211 4.1 5.8
RNSH 168 211 4.7 5.9
BLH 217 217 6.0 6.0
JHH 190 198 5.2 5.4 Source: HIE inpatient statistics, 2008/09, payroll data and IPART analysis.
Table 5.5 Nursing costs by nurse award category for fracture patients, with IFRACsa
All CNS RN EN AIN Student/ trainee
Nursing hours as % total
RPAH 100 9 64 13 9 4
GH 100 5 61 27 3 3
RNSH 100 9 72 11 4 4
BLH 100 3 65 19 9 3
JHH 100 10 65 18 5 2
Nursing cost per hour ($)
RPAH 34 42 37 29 23 20
GH 36 46 40 30 - 19
RNSH 35 47 37 29 24 20
BLH 36 40 40 29 22 22
JHH 37 44 39 30 22 19
a There is no significant change to these figures with IFRAC=1. Note: CNS = Clinical Nurse Specialist; RN = Registered Nurse; EN = Enrolled Nurse; AIN = Assistant in Nursing. See the Glossary at the end of the Appendices for descriptions of these nursing levels. Source: HIE inpatient statistics, 2008/09, payroll data and IPART analysis.
5.2.4 Nursing costs for arthritis patients
The nursing costs per episode for the arthritis group are lower than for the fracture patients, ranging from $1,210 at IRO to $1,613 at RNSH (with IFRACs=1). All hospitals have similar costs. The lower cost for the arthritis patients partly reflects lower use of ICU and high dependency wards by this patient cohort.
Again, the acute episode costs are influenced mainly by IFRACs, the length of stay, nursing staff-to-patient ratio (ie, nursing hours per patient day), and to a lesser extent the nursing staff mix.
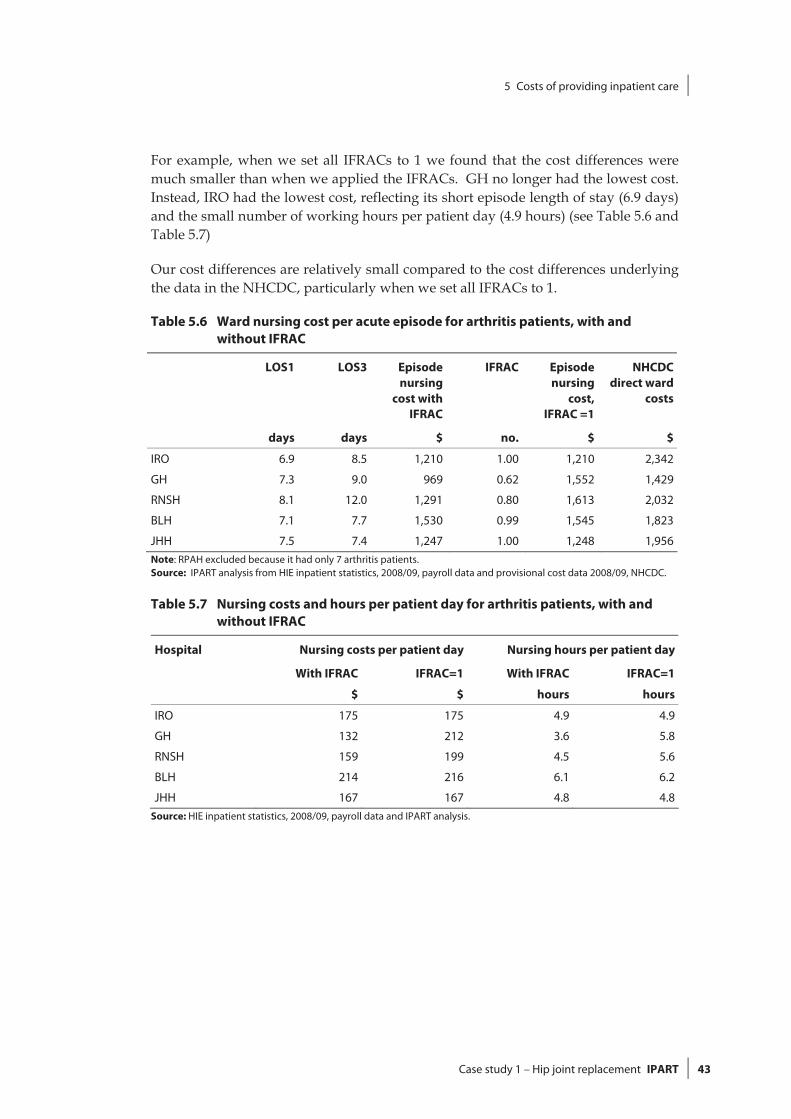
5 Costs of providing inpatient care
Case study 1 – Hip joint replacement IPART 43
For example, when we set all IFRACs to 1 we found that the cost differences were much smaller than when we applied the IFRACs. GH no longer had the lowest cost. Instead, IRO had the lowest cost, reflecting its short episode length of stay (6.9 days) and the small number of working hours per patient day (4.9 hours) (see Table 5.6 and Table 5.7)
Our cost differences are relatively small compared to the cost differences underlying the data in the NHCDC, particularly when we set all IFRACs to 1.
Table 5.6 Ward nursing cost per acute episode for arthritis patients, with and without IFRAC
LOS1 LOS3 Episode nursing
cost with IFRAC
IFRAC Episode nursing
cost, IFRAC =1
NHCDC direct ward
costs
days days $ no. $ $
IRO 6.9 8.5 1,210 1.00 1,210 2,342
GH 7.3 9.0 969 0.62 1,552 1,429
RNSH 8.1 12.0 1,291 0.80 1,613 2,032
BLH 7.1 7.7 1,530 0.99 1,545 1,823
JHH 7.5 7.4 1,247 1.00 1,248 1,956Note: RPAH excluded because it had only 7 arthritis patients. Source: IPART analysis from HIE inpatient statistics, 2008/09, payroll data and provisional cost data 2008/09, NHCDC.
Table 5.7 Nursing costs and hours per patient day for arthritis patients, with and without IFRAC
Hospital Nursing costs per patient day Nursing hours per patient day
With IFRAC IFRAC=1 With IFRAC IFRAC=1
$ $ hours hours
IRO 175 175 4.9 4.9
GH 132 212 3.6 5.8
RNSH 159 199 4.5 5.6
BLH 214 216 6.1 6.2
JHH 167 167 4.8 4.8Source: HIE inpatient statistics, 2008/09, payroll data and IPART analysis.

5 Costs of providing inpatient care
44 IPART Case study 1 – Hip joint replacement
Table 5.8 Nursing costs by nurse award category for arthritis patients, with IFRACa
All CNS RN EN AIN Student/ trainee
Nursing Hours as % Total
IRO 100 11 67 15 0 7
GH 100 7 65 25 0 3
RNSH 100 11 68 12 4 4
BLH 100 3 66 19 9 3
JHH 100 2 62 31 4 1
Nursing Cost Per Hour $
IRO 36 41 38 29 - 19
GH 37 46 39 30 22 18
RNSH 35 47 36 29 24 20
BLH 35 39 39 28 22 21
JHH 35 39 39 29 22 8 a There is no significant change to these figures with IFRAC=1. Note: CNS = Clinical Nurse Specialist; RN = Registered Nurse; EN = Enrolled Nurse; AIN = Assistant in Nursing. See the Glossary at the end of the Appendices for descriptions of these nursing levels. Source: HIE inpatient statistics, 2008/09, payroll data and IPART analysis.
5 Costs of providing inpatient care
Case study 1 – Hip joint replacement IPART 45
Box 5.2 How we estimated nursing costs
IPART used a model for each hospital to allocate ward nursing costs to each DRG grouping and compare nursing costs.
We calculated ‘nursing hours per patient day’, ‘nursing cost per patient hour’ and ‘nursing cost per acute episode’ for 2008/09 by: Mapping the wards in each hospital to cost centres – so we could use these to extract
relevant payroll information for each ward. Extracting information from the payroll on nursing classification, nursing pay and nursing
hours worked for each ward. Applying inpatient fractions to our total ward nursing cost – so we only included nursing
costs for acute patient care. Note that some hospitals have a fraction of ‘1’ where otherhospitals may have fractions like ‘0.95’ for similar wards.
Allocating ward nursing costs to all patients on the ward, based on their time on the ward and the nursing service weights for their DRG.
Allocating a cost of nursing care to each patient - for each step of the patient’s stay in acute care. Note that from patient level episode information we attributed a cost to each wardtransfer during their ‘acute’ episode.
We then applied our estimate of nursing cost per hour to the average length of the acuteepisode to obtain an estimate of the ‘nursing cost per episode’’. We also calculated costs withIFRAC = 1 for comparison.
Qualifications For our calculations, we included only direct costs of ordinary hours (excluding leave),
penalty rates and overtime, obtained from payroll data. The number of ‘nursing hours per patient day’ depends on the occupancy rates of the
wards. A higher occupancy rate reduces the hours per patient day but such a change cancause other issues, like outliers or access block.
The ‘nursing hours per patient day’ is the share of a patient’s use of the nursing staff basedon the nursing service weights. These service weights are not perfect and the mix of other patients on the ward may impact on the nursing hours attributed to a patient and hencetheir cost. The service weights do not take into account the generally higher cost ofpatients at the start of their hospital stay.
Some wards have a mix of more acute care with rehabilitation. Fewer nursing hours and lower costs are attributed to the ‘acute’ episode in such wards compared with wards inhospitals that have a greater separation of roles (acute wards separate from rehabilitation).
Our nursing methodology excludes ‘wards’ like emergency departments where it isparticularly difficult to determine the inpatient fraction, but allocated a nursing cost for the time spent in emergency.
Hospitals with a shorter reported length of stay for the ‘acute’ episode may be expected tohave a higher number of nursing hours per day and higher daily nursing costs.

5 Costs of providing inpatient care
46 IPART Case study 1 – Hip joint replacement
5.3 Imaging costs
Table 5.9 and Table 5.10 set out our calculations for the average cost of all imaging tests for hip replacement patients, during their acute episode and on the day of their admission. They also show the average costs for selected high-cost tests (ie, CT scans/MRIs, ultrasounds and fluoroscopies), as well as the direct and indirect imaging costs from the provisional data for the NHCDC.
Imaging costs are separated into the fracture and arthritis subgroups. Our methodology for calculating these costs is explained in Box 5.3.
Table 5.9 Average imaging cost per patient, fracture cases
All imaging tests
CT/MRI Ultrasound Fluoroscopy NHCDC direct and
indirect costs
$ $ $ $ $
Acute episode
RPAH 430 72 13 587
IRO - - - - -
GH 392 89 23 5 397
RNSH 328 113 4 3 292
BLH 456 95 0 6 607
JHH 317 66 4 2 350
Day of admission
RPAH 177 15 0 0 -
IRO - - - - -
GH 148 21 0 0 -
RNSH 96 16 0 2 -
BLH 176 21 0 0 -
JHH 159 30 0 0 -
Note: IRO has no fracture patients.
Source: IPART analysis using data from hospital imaging services and provisional cost data 2008/09, NHCDC.

5 Costs of providing inpatient care
Case study 1 – Hip joint replacement IPART 47
Table 5.10 Average imaging cost per patient, arthritis cases
All imaging tests
CT/MRI Ultrasound Fluoroscopy NHCDC direct and
indirect costs
$ $ $ $ $
Acute episode
RPAH 281 28 31 0 583
IRO 126 10 2 0 36
GH 157 21 31 1 175
RNSH 137 45 0 0 81
BLH 127 26 0 3 516
JHH 94 15 1 0 185
Day of admission
RPAH 20 0 0 0 -
IRO 1 0 0 0 -
GH 17 0 0 0 -
RNSH 10 0 0 0 -
BLH 52 0 0 3 -
JHH 54 0 0 0 -
Note: The arthritis group at RPAH is not a typical arthritis group, as it only includes 7 cases compared with over 100 for all other study hospitals. Most arthritis patients receive their procedure at IRO rather than RPAH. As such, the RPAH figures are not comparable with the other study hospitals.
Source: IPART analysis using data from hospital imaging services and provisional cost data 2008/09, NHCDC.
The average cost for all imaging tests for fracture patients during the acute episode ranged from $317 at JHH to $456 at BLH (see Table 5.9), while the average cost for arthritis patients ranged from $94 at JHH to $157 at GH (excluding RPAH – see Table 5.10). Overall, the average imaging costs for fracture patients were generally at least 2 times higher than those for arthritis patients.
However, within these patient subgroups, the figures show a broad consistency in practice. The figures are also far more consistent than the NHCDC direct and indirect imaging costs would suggest. The NHCDC indicates that imaging costs for hip DRGs range from:
$292 at RNSH to $607 at BLH for fracture patients, and
$36 at IRO to $516 at BLH (excluding RPAH) for arthritis patients.
Figure 5.2 shows the average imaging cost per patient for all study hospitals, by principal diagnosis.

5 Costs of providing inpatient care
48 IPART Case study 1 – Hip joint replacement
Figure 5.2 Average imaging cost per patient by principal diagnosis, all study hospitals ($)
125
373
780
461
287
189
0
100
200
300
400
500
600
700
800
900
Arthritis Fracture SecondaryCancer
Joint infection Other - notrevision
Other -revision
Data source: IPART analysis using data from hospital imaging services.
Secondary cancer and joint infection cases have the highest average imaging costs. However, these cases are generally uncommon at the study hospitals (except for RPAH – see Table 3.2).
Box 5.3 Our approach to estimating imaging costs
We did not use a bottom-up costing approach to calculate imaging costs. Instead, we used detailed information from imaging services on the number and type of tests performed, thetime and date. We use data for ‘acute’ episodes in 2008/09. As a proxy for cost, we attribute a value based on the Medicare Benefits Schedule (MBS). Each test is valued at 100% of the MBSfee.
More information is included in Chapter 11 of our main report, NSW Health costs and outcomes study by IPART for selected NSW hospitals.
5.4 Pathology costs
Table 5.11 shows the average pathology cost for hip replacement patients. Pathology costs are separated into the fracture and arthritis subgroups. Our methodology for calculating these costs is explained in Box 5.4.

5 Costs of providing inpatient care
Case study 1 – Hip joint replacement IPART 49
Table 5.11 Average pathology cost per patient, fracture and arthritis cases
Fracture Arthritis
Acute episode
Day of admission
NHCDC direct and
indirect costs
Acute episode
Day of admission
NHCDC direct and
indirect costsa
$ $ $ $ $ $
RPAH 707 121 937 755 78 931
IRO - - - 182 25 287
GH 716 133 769a 385 69 420 a
RNSH 752 175 663 a 254 32 261a
BLH 729 $82 747 322 106 625
JHH 583 101 744 193 20 353a We adjusted the provisional NHCDC costs for GH and RNSH to reflect the change between the provisional and final pathology costs. We used the average increase in pathology costs for all hip replacement cases to make the adjustment. Note: IRO has no fracture patients. Further, the arthritis group at RPAH is not a typical arthritis group, as it only includes 17 cases compared with over 100 for all other study hospitals. Most arthritis patients receive their procedure at IRO rather than RPAH. As such, the RPAH figures are not comparable with the other study hospitals.
Source: IPART analysis using data from hospital pathology services and provisional and final cost data 2008/09, NHCDC.
The average cost for pathology tests for fracture patients during the acute episode ranged from $583 at JHH to $752 at RNSH, while the average cost for arthritis patients ranged from $182 at IRO to $385 at GH (excluding RPAH). As with imaging costs, the average pathology costs for fracture patients were generally at least 2 times higher than those for arthritis patients.
Apart from JHH, pathology costs for fracture patients are broadly consistent across study hospitals. There is slightly more variation in costs for arthritis patients, with GH and BLH having slightly higher average usage.
The estimated NHCDC direct and indirect pathology costs for GH and RNSH are fairly consistent with our estimates for both fracture and arthritis patients.25 The NHCDC costs for RPAH are particularly high, compared with our costs as well as the other hospitals’ NHCDC costs (excluding IRO). The NHCDC costs for arthritis patients for BLH are also high compared with our costs as well as the NHCDC costs for GH, RNSH and JHH.
Figure 5.3 shows our estimates of the average pathology cost per patient for all study hospitals, by principal diagnosis.
25 We adjusted the provisional NHCDC costs for GH and RNSH to reflect the change between the
provisional and final pathology costs. We used the average increase in pathology costs for all hip replacement cases to make the adjustment.

5 Costs of providing inpatient care
50 IPART Case study 1 – Hip joint replacement
Figure 5.3 Average pathology cost per patient by principal diagnosis, all study hospitals ($)
248
680
1103 1094
503 545
0
200
400
600
800
1000
1200
Arthritis Fracture SecondaryCancer
Joint infection Other - notrevision
Other -revision
Data source: IPART analysis using data from hospital pathology services.
Consistent with our findings for imaging costs, secondary cancer and joint infection cases have the highest average pathology costs.
Box 5.4 Our approach to estimating pathology costs
We did not use a bottom-up costing for pathology. Instead, we attributed a value for pathologytests based on internal billing data between the hospitals and the pathology services. We alsoused information on the time and date of tests.
Charging arrangements at each hospital are similar, but are not identical. All pathologyservices base their charges on the MBS.
More information is included in Chapter 12 of our main report, NSW Health costs and outcomes study by IPART for selected NSW hospitals.
5.5 Blood use costs
We obtained detailed blood use data for each hospital and found that blood use varies by diagnosis group. Patients undergoing a revision procedure receive more blood (2-4 units). Patients with a diagnosis of a malignancy receive on average almost 2 units of blood while patients with fractures or elective hip replacements receive less than 1 unit of blood.

5 Costs of providing inpatient care
Case study 1 – Hip joint replacement IPART 51
Figure 5.4 shows the average blood use cost per patient for all study hospitals, by principal diagnosis.
Figure 5.4 Average blood use cost per patient by principal diagnosis, all study hospitals ($)
101218
421
1325
229347
0
200
400
600
800
1000
1200
1400
Arthritis Fracture SecondaryCancer
Joint infection Other - notrevision
Other -revision
Data source: IPART analysis using data from hospital blood services.
Blood use costs are on average significantly higher for joint infection cases than for other hip replacement cases.
5.6 Operating theatre times
Figure 5.5 shows the average operating theatre time – time from when surgery commenced to when surgery was completed – per patient for each study hospital, by principal diagnosis. It indicates that there was generally little difference in average operating times between the study hospitals.
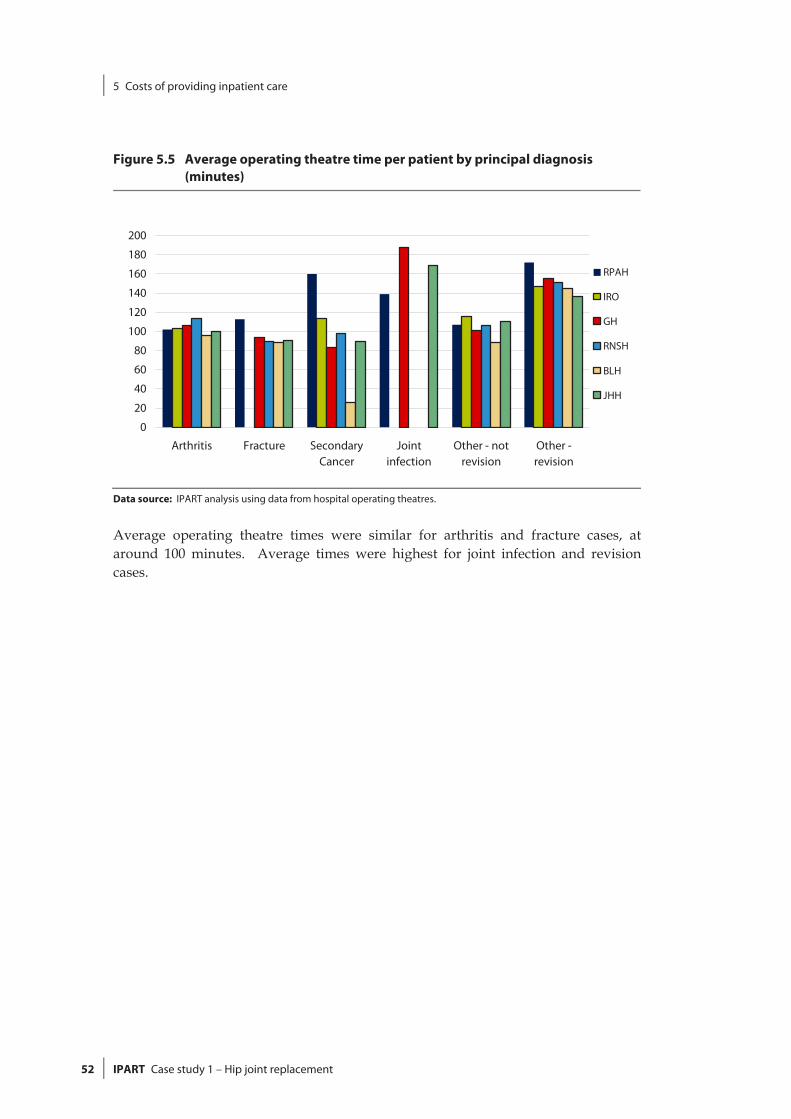
5 Costs of providing inpatient care
52 IPART Case study 1 – Hip joint replacement
Figure 5.5 Average operating theatre time per patient by principal diagnosis (minutes)
0
20
40
60
80
100
120
140
160
180
200
Arthritis Fracture SecondaryCancer
Jointinfection
Other - notrevision
Other -revision
RPAH
IRO
GH
RNSH
BLH
JHH
Data source: IPART analysis using data from hospital operating theatres.
Average operating theatre times were similar for arthritis and fracture cases, at around 100 minutes. Average times were highest for joint infection and revision cases.

6 Configurations of care
Case study 1 – Hip joint replacement IPART 53
6 Configurations of care
The term ‘configurations of care’ refers to the way that hospitals choose to manage and provide patient care, including their clinical practices. The particular configurations of care within a hospital can be influenced by a complex array of factors, including national or state-wide guidelines or protocols, the culture, practices and controls of the individual hospital, the culture and practices of each clinical unit and its leadership and the preferences of each clinician. Differences in the way hospitals manage and provide patient care can also lead to differences in the costs and outcomes of that care.
During our hospital visits, we identified and obtained information on 3 major differences in the way the study hospitals managed and provided care for hip replacement patients. These comprise differences in the way they:
managed their emergency and planned surgical workloads
used prosthesis components, and managed the process for selecting those components
managed the rehabilitation phase of patient care.
We found that the use of dedicated surgical facilities for planned hip replacements was associated with slightly shorter average lengths of stay among arthritis patients (who generally have planned surgery). However, one hospital without such facilities also had a shorter average length of stay for these patients, so other factors also appear to affect this length.
We also found substantial variation in the range and types of prosthesis components the hospitals used, and that the hospital with least control over the selection process had the highest variability. In addition, there was variation in the types of hip replacement procedure undertaken, which seemed to stem from individual clinician preferences. Finally, there were differences in the extent to which the hospitals transferred patients to specialised rehabilitation facilities for this phase of their care. In some cases this was due to differences in their access to rehabilitation facilities. In others it was due to the hospital having a rehabilitation ward and undertaking rehabilitation within the hospital (BLH).
The sections below discuss our findings on differences in configuration of care in more detail.

6 Configurations of care
54 IPART Case study 1 – Hip joint replacement
6.1 Managing emergency and planned surgical workloads
6.1.1 Dedicated elective surgical centres
Some study hospitals separate their planned (or elective) surgical workload from their emergency workload through the use of dedicated elective surgical centres. As Chapter 1 noted:
RPAH and IRO are separate facilities with separate facility codes, but the management of hip replacement surgery at these facilities is closely coordinated. In effect, IRO operates as RPAH’s dedicated elective surgical centre for hip replacement and other orthopaedic procedures, while RPAH handles all emergency surgery cases. There was also strong clinical management of theatre access.
JHH has an integrated public surgery centre (the RNC) which undertakes most of its planned hip replacement cases.
GH has a mix of planned and emergency surgery using common theatres. Due to the high volume of trauma and emergencies at the hospital, theatre access for planned cases was perceived as an issue by hospital staff.26
RNSH also has a mixture of planned and emergency surgery, including trauma cases, and surgeons also raised theatre access for planned surgery as an issue.
BLH has a mixture of planned and emergency surgery in its theatres, but receives less trauma cases, which are generally diverted to Liverpool Hospital or another hospital. Our overall observation from our visit was that there appeared to be less issue with theatre access than for GH or RNSH.
NSW Health has recently released a set of Emergency Surgery Guidelines to assist hospitals to better manage their emergency surgery workloads. See Box 6.1 for further details.
26 GH has advised that a recent increase in trauma theatre usage has lowered the incidence of
elective surgery being cancelled due to access issues.

6 Configurations of care
Case study 1 – Hip joint replacement IPART 55
Box 6.1 NSW Emergency Surgery Guidelinesa
NSW Health released the Emergency Surgery Guidelines in June 2009. The guidelines encourage hospitals to plan for the predictable emergency surgical workload for all specialities and toallocate the necessary operating theatre time.
To assist hospitals with this planning, the guidelines outline the principles for emergency surgery redesign. The benefits of redesign include improved patient outcomes, enhancedsurgical team satisfaction and increased trainee supervision in emergency surgery.
The principles include:
measuring the generally predictable emergency surgery workload
allocating operating theatre resources that are matched to the emergency surgeryworkload
designating hospitals for either elective or emergency surgery or for specific components ofeach
scheduling surgery to standard hours, where clinically appropriate
load balancing standard hours operating theatre sessions with emergency surgery demand.
Source: NSW Health, Emergency Surgery Guidelines (GL2009_09), June 2009, (http://www.health.nsw.gov.au/policies/gl/2009/pdf/GL2009_009.pdf).
One reason for adopting the dedicated elective surgery centre model is to improve the efficiency of theatre management and planning. For example, this model allows elective surgery to be undertaken as planned, without the risk of patients being deferred to give priority to emergency cases. Another is to separate patients where there is a greater risk of infection from those where this risk is lower (such as those undergoing elective procedures).
In addition, this approach may reduce patients’ length of stay, particularly those having elective surgery. Our analysis of average length of stay for arthritis cases – which are virtually all planned surgery cases – indicates that length of stay was lower at IRO and JHH, which both used dedicated elective surgery centres for the patients (see section 4.3). It was also lower at BLH, which may reflect the fact that this hospital treats a lower volume of trauma cases than other hospitals.
Recommendation
1. That NSW Health notes that separation of planned and emergency cases may reduce lengths of stay for planned (arthritis) cases.

6 Configurations of care
56 IPART Case study 1 – Hip joint replacement
6.1.2 Networked service models
Another way hospitals might manage their planned and emergency surgery workload is through a networked service model. For example, under this model, some facilities within the network may handle more of the emergency work while other focus on the planned. The Central Coast hospitals use this model, and GH tends to undertake more emergencies and trauma, while other hospitals, such as Wyong receive more planned work. Hospitals such as Woy Woy receive more patients during their rehabilitation phase. We found that GH treated 244 hip replacement cases over the study period, and of those 95 (or 39%) were transfers (either in and out). In contrast, BLH treated 134 patients, and only 4 (or 3%) of these were transfers. The percentage of transfers among the other study hospitals ranged from just over 10% (for IRO and JHH) to around 50% (for RPAH and RNSH).
6.2 Using different types of prostheses and managing selection of these types
As section 5.1 discussed, there are 4 main components in a hip joint prosthesis and several types of each component, and the price of the different types can vary substantially. In examining the use and management of the different types of prosthesis, we found that the surgeon operating on the patient usually selects which type of prosthesis is used, based on the individual patient’s principal diagnosis, age, level of mobility, level of health and their clinical preference (see Box 6.2 for more information). We also found there was substantial variation in the types of components selected by individual clinicians.
However, the degree of variation differed between study hospitals because some hospitals had broad guidelines for prosthesis selection and clear processes for the approval of new prostheses. In general, we found that:
RPAH and BLH had good controls over prosthesis selection with strong clinical input and governance.
GH had some controls over prosthesis selection, such as divisional management sign-off required prior to new product purchases being made.
RNSH appeared to have the least control over prosthesis selection, and also had the highest variability in the types of component selected.
There was individual variation in the selection of the type of hip replacement procedure undertaken, based on individual clinician preference, usually related to clinician training or ‘what they were familiar with’.
Recommendation
2. That NSW Health arranges for appropriate clinical expert groups to address the variation in the selection of hip prosthesis components (including press fit, cementless hip stems versus cemented hip stems and ceramic femoral heads versus metal femoral heads) among study hospitals.

6 Configurations of care
Case study 1 – Hip joint replacement IPART 57
This recommendation should be read in conjunction with Chapter 10 of our main report, NSW Health costs and outcomes study by IPART for selected NSW hospitals, where we recommend that NSW Health note the variation in prostheses use among the study hospitals, including different types of components for hip replacement procedures.
Box 6.2 Considerations in selecting type of hip joint prostheses to be used
Surgeons have many options when selecting the type and combination of prosthesiscomponents they will use for an individual hip replacement patient. As section 5.1 discussed,there are 4 main components which come in different types and materials. Because the hip is a joint, these components need to move and so will rub against each other. In making their selection, surgeons need to consider the material of these parts, because the different combination will affect how the prosthesis will wear, and so influence the future need for revisions. The material combination options include:
metal on polyethylene (the most common)
ceramic on polyethylene
ceramic on ceramic, and
metal on metal.
In general, metal on metal tends to be most suitable for younger patients with osteoarthritis or rheumatoid arthritis of the hip because it conserves femoral bone, provides anatomical boneloading and eliminates polyethylene. For these reasons, it usually provides a low-wear, long-lasting result. Similarly, ceramic-on-ceramic is also believed to help guarantee a low-wear result with no osteolysis.
Another consideration is whether to use cement to fix the prosthesis into the central core of thefemur or a more expensive cementless prosthesis. The cementless type of prosthesis hasmicroscopic pores that allow bony ingrowth from the normal femur into the prosthesis stem.This option is considered to be low-wear and long-lasting, and so more suitable for younger patients.
However, there are also cementless monoprotheses, such as the Austin Moore and Thompson models. These are long, narrow, essentially single prostheses that are commonly used for the neck of femur fractures, particularly in the frail elderly. They are much less expensive than other the options and are mainly used for patients with limited mobility.
6 Configurations of care
58 IPART Case study 1 – Hip joint replacement
6.3 Managing the rehabilitation phase of care
The main difference in the study hospitals’ arrangements for providing rehabilitation care for hip replacement patients we identified was the extent to which they transferred patients to a rehabilitation facility for this phase or provided rehabilitation care in-house.
We compared the proportion of all hip replacement patients transferred out of each hospital. (While transfers out can sometimes be for specialised treatment at another facility, for hip replacement patients, the majority are for rehabilitation.) We found that this proportion varied widely across the hospitals. The proportions for each hospital were as follows:
RPAH – 43%
IRO – 12%
GH – 26%
RNSH – 46%
BLH – 2%, and
JHH – 10%.
BLH had the lowest percentage of transfers out and tended to undertake rehabilitation in-house. In addition, we noted that this hospital’s rehabilitation ward policy was that patients could not be moved from acute beds to the ward until all drains and catheters were removed. This policy was raised in the hospital visit as a factor that could potentially increase the length of hip replacement patients’ stay in the hospital’s surgical wards and delay their discharge, but we did not see evidence of this from our length of stay comparisons. However, where patients have support at home or in a nursing home, the hospital’s policy was to discharge them and provide rehabilitation care through community nurse visits.
At the other study hospitals, hip replacement patients are more frequently transferred to other facilities for rehabilitation. For example, RNSH tends to transfer them to the Greenwich or Ryde rehabilitation facilities or private facilities. RPAH frequently transfers these patients to Balmain Hospital. GH transfers them to rehabilitation beds at Wyong Hospital or transitional beds at Woy Woy Hospital. JHH clinicians suggested that they had fewer options for access to rehabilitation facilities and this is reflected in its low percentage of transfers out.
During our hospital visits, staff at virtually all the study hospitals indicated that limits on their access to step-down or rehabilitation facilities may delay the transfer from acute beds of frail elderly patients who no longer need acute care.
7 Outcome, safety and quality indicators
Case study 1 – Hip joint replacement IPART 59
7 Outcome, safety and quality indicators
The terms of reference for this study required us to analyse available data on differences in clinical outcomes across the 5 study hospitals. However, while there are a number of safety and quality indicators being collected locally, at the state level and through clinical registries, there are few clinically agreed outcome indicators. As such, we found that data on only a few indicators of clinical outcomes are collected consistently across hospitals, or on a state-wide (or national) basis. Therefore, we worked with clinical experts to establish a set of outcome, safety and quality indicators that are clinically relevant, and for which we could feasibly obtain data in the timeframe for our study.
We found that some of the outcome indicators were misleading or difficult to interpret for all hip replacement patients and that outcomes differ for fracture and arthritis patients. As such, data was obtained for arthritis patients and fracture patients separately for some of the indicators. Where necessary, we also adjusted the data to take account of differences in patient characteristics.
The sections below describe the clinical indicators and consider the performance of the study hospitals against them. We found that:
There was no statistically significant difference in the study hospitals’ risk-adjusted 30-day mortality rates for fracture patients. The number of deaths too small to allow comparisons between the hospitals for arthritis patients.
IRO had the lowest risk-adjusted unplanned readmissions rate for arthritis patients. There was no statistically significant difference in the study hospitals’ rates for fracture patients.
RPAH had the highest risk-adjusted rate for wound infections. However, it also had a more complex casemix than the other hospitals.
RNSH had the highest proportion of fracture patients whose surgery commenced within 24 hours of their emergency admission.
RNSH and JHH had the highest proportions of emergency patients aged 75 years and over who were discharged to their usual place of residence.
7 Outcome, safety and quality indicators
60 IPART Case study 1 – Hip joint replacement
7.1 How we developed a set of clinical indicators
To identify the indicators we should focus on for this study, we worked with a number of eminent clinicians on our Clinical Reference Group27 to develop a set of outcome indicators. We also consulted clinicians in study hospitals and sought further advice from clinicians with specific expertise in the fields of interest, as well as other relevant organisations.
Essentially, we aimed to establish a list of indicators that were:
widely accepted as being clinically appropriate
likely to be available from NSW hospitals, the NSW Department of Health or other bodies, such as registries, and
feasible for IPART to collect or calculate.
Following this clinical consultation, we established the set of indicators discussed in section 7.3 below. Some of these indicators are not true outcome indicators, but are safety and quality or process indicators. We were not able to obtain data for all of these indicators.
Box 7.1 provides an overview of the Australian Orthopaedic Association National Joint Replacement Registry, which we consider is another source of data on outcomes for hip replacement patients.
27 In the early stages of the review, our Clinical Reference Group comprised Professor Bruce
Barraclough, Professor Clifford Hughes, Dr Michael Nicholl, Professor Ron Penny and Dr Hunter Watt. A number of other clinicians were consulted as part of this process.
7 Outcome, safety and quality indicators
Case study 1 – Hip joint replacement IPART 61
Box 7.1 Australian Orthopaedic Association National Joint Replacement Registry
Australia (along with Sweden, Finland, Norway, Denmark, and New Zealand) has aninternationally recognised registry for hip and knee replacement procedures. The Australian Orthopaedic Association National Joint Replacement Registry (AOANJRR) collects data toprovide the most up-to-date information on the outcome of hip and knee joint replacementsurgery in Australia. The registry commenced on 1 September 1999 and has had complete national data since 2003.
The AOANJRR contains useful outcome information on joint revision rates, by prostheses type.This is extremely useful information for health departments, organisations like the CEC, and clinical experts for evaluating appropriateness of prostheses types.
One limitation of registries like the AOANJRR is that the data is essentially controlled by clinicalgroups and the full range of outcome data maintained by the registry is not publicly available. For example, clinician or hospital level outcome data is not readily available.
The range and complexity of the AOANJRR’s data is increasing. Its minimum data set includes patient, surgeon, and hospital identifiers; core surgical data, date of surgery, diagnostic and treatment codes, laterality, and implant information, among other data.
The existence and use of the AOANJRR is critical, and some of our study hospitals collect data for the registry. For hip replacements in particular, the registry represents a better and more useful data collection than the general clinical information collected formally by theDepartment of Health, which is not targeted towards analysis of performance in jointreplacement surgery.
7.2 Analysing indicators and risk-adjusting for patient characteristics
It’s important to recognise that hospitals’ performance against many outcome indicators is not simple to interpret and, when considered in isolation, can be misleading. Therefore, this performance needs to be analysed within the appropriate context.
In addition, hospitals treat patients with different mixes of illnesses, which can influence the likelihood of adverse outcomes at the hospitals. To make meaningful and fair comparisons of the performance of the study hospitals on some outcome indicators, the analyses were risk-adjusted for factors outside the control of the hospitals (ie, differences in patient characteristics – see Box 7.2).
Appendix E provides further details for each risk-adjusted indicator provided by NSW Health, including the data sources used, the relevant time period for the data and the adjustment factors applied.

7 Outcome, safety and quality indicators
62 IPART Case study 1 – Hip joint replacement
Box 7.2 How data on indicators was risk-adjusted for differences in patient characteristics
To make meaningful and fair comparisons of the performance of the study hospitals on some outcome indicators, the analyses were risk-adjusted to account for differences in patient characteristics that can influence the likelihood of adverse outcomes. In particular, NSW Health adjusted the analyses on mortality, unplanned readmission and wound infection rates for the following patient characteristics:
age
sex
comorbidity, and
socio-economic status.a
To adjust for comorbidity, NSW Health used the Charlson index. This index simplifies the wide range of comorbidities that may affect patients. It groups clinical conditions together (using ICD 10), and assigns numerical weights (eg, 1, 2, 3) to them, based on the risk of dyingassociated with the condition.b Adding together the numerical weights for a patient’scomorbidities determines the patient’s combined Charlson index score, and therefore the severity of their comorbidities
To make these adjustments, NSW Health used logistic regression in SAS 9.2. Where there weresufficient numbers, it took repeated measures for the same person into account using multi-level modelling. Where the number of events was too low to allow the above adjustment to be carried out in full, the degree of adjustment was reduced and this was noted for each indicator.
a The ABS Index of Relative Socio-Economic Disadvantage (IRSD) was used to estimate socio-economic status. The IRSD was assigned at Local Government Area level and grouped into quintiles from least disadvantaged to mostdisadvantaged for analysis. b Australian Institute of Health and Welfare, D Ben-Tovim, R Woodman, J Harrison, S Pointer, P Hakendorf & G Henley, Measuring and reporting mortality in hospital patients, March 2009, p 18, (http://www.aihw.gov.au/publications/hse/hse-69-10729/hse-69-10729.pdf).
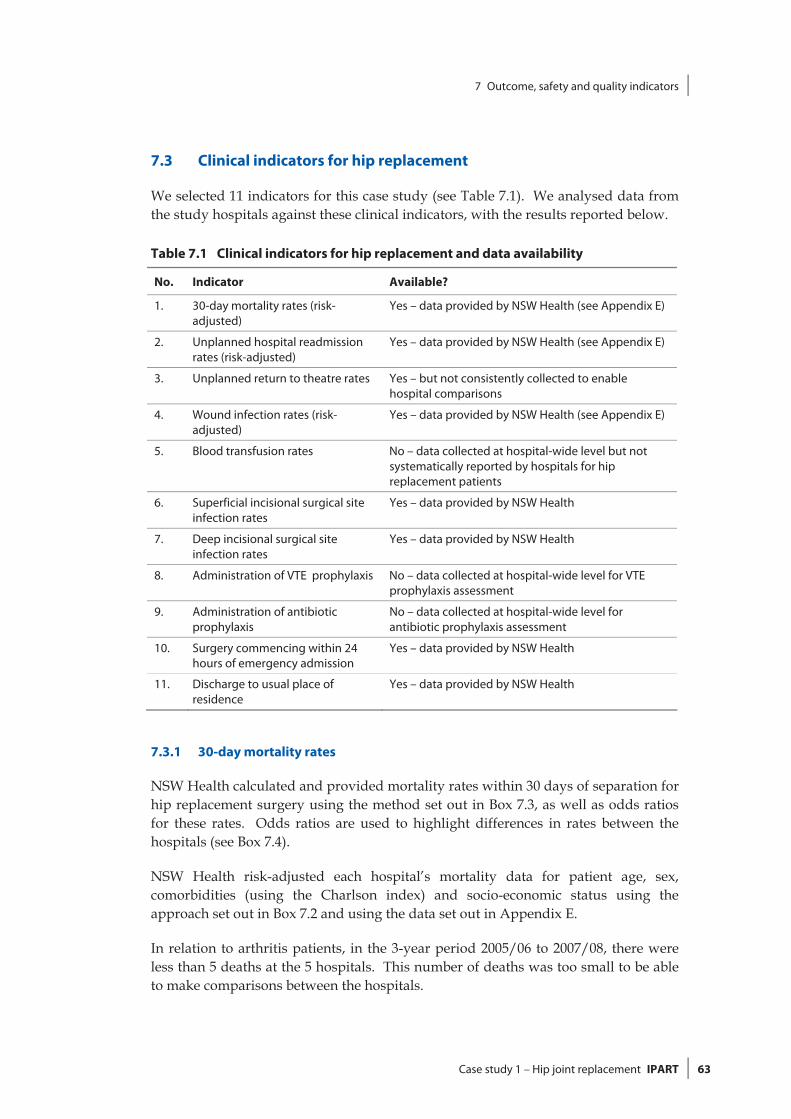
7 Outcome, safety and quality indicators
Case study 1 – Hip joint replacement IPART 63
7.3 Clinical indicators for hip replacement
We selected 11 indicators for this case study (see Table 7.1). We analysed data from the study hospitals against these clinical indicators, with the results reported below.
Table 7.1 Clinical indicators for hip replacement and data availability
No. Indicator Available?
1. 30-day mortality rates (risk-adjusted)
Yes – data provided by NSW Health (see Appendix E)
2. Unplanned hospital readmission rates (risk-adjusted)
Yes – data provided by NSW Health (see Appendix E)
3. Unplanned return to theatre rates Yes – but not consistently collected to enable hospital comparisons
4. Wound infection rates (risk-adjusted)
Yes – data provided by NSW Health (see Appendix E)
5. Blood transfusion rates No – data collected at hospital-wide level but not systematically reported by hospitals for hip replacement patients
6. Superficial incisional surgical site infection rates
Yes – data provided by NSW Health
7. Deep incisional surgical site infection rates
Yes – data provided by NSW Health
8. Administration of VTE prophylaxis No – data collected at hospital-wide level for VTE prophylaxis assessment
9. Administration of antibiotic prophylaxis
No – data collected at hospital-wide level for antibiotic prophylaxis assessment
10. Surgery commencing within 24 hours of emergency admission
Yes – data provided by NSW Health
11. Discharge to usual place of residence
Yes – data provided by NSW Health
7.3.1 30-day mortality rates
NSW Health calculated and provided mortality rates within 30 days of separation for hip replacement surgery using the method set out in Box 7.3, as well as odds ratios for these rates. Odds ratios are used to highlight differences in rates between the hospitals (see Box 7.4).
NSW Health risk-adjusted each hospital’s mortality data for patient age, sex, comorbidities (using the Charlson index) and socio-economic status using the approach set out in Box 7.2 and using the data set out in Appendix E.
In relation to arthritis patients, in the 3-year period 2005/06 to 2007/08, there were less than 5 deaths at the 5 hospitals. This number of deaths was too small to be able to make comparisons between the hospitals.

7 Outcome, safety and quality indicators
64 IPART Case study 1 – Hip joint replacement
For fracture patients during this period, there were 128 deaths among 1,155 hospital separations at the 5 hospitals, giving an overall crude mortality rate of 110.8 per 1,000. There were no statistically significant differences in risk-adjusted mortality rates between the 5 hospitals.
Box 7.3 Calculating risk-adjusted mortality rates
The NSW Department of Health’s Centre for Epidemiology and Research calculated risk-adjusted odds ratios for mortality for patients treated in each study hospital in the hipreplacement case study area, using the methodology outlined below. We note that the NSWDepartment of Health does not usually undertake this type of analysis.
Data sources
The analysis for mortality and survival, apart from in-hospital mortality, was carried out using linked records of the NSW Admitted Patient Data Collection (APDC) and NSW Registry of Births,Deaths and Marriages death registration data. The analysis for in-hospital mortality was carried out using linked records of the APDC. In-hospital deaths and deaths from all causes were included for all relevant indicators.
Case-based analysis
As one person may have more than one admission for a specified condition, the analyses were‘case-based’, where a case represents a hospital admission for a specified condition. Thismeans that, for example, if a person died after 2 hospital admissions for a specified conditionand the death occurred within the period specified by the indicator, then the case and therefore the death would be counted twice.
Adjusting for risk and comparing hospitals
Indicators were adjusted for patient age, sex, comorbidity and socio-economic status as described in Box 7.2. Hospitals that were not significantly different in the adjustment model (at p<0.05) were grouped.

7 Outcome, safety and quality indicators
Case study 1 – Hip joint replacement IPART 65
Box 7.4 Risk-adjusted odds ratios
Risk-adjusted odds ratios were calculated for hospitals in order to highlight differences in rates between the hospitals.a The ‘odds ratio’ is the ratio of the odds of an event occurring at onehospital to the odds of it occurring at another hospital.b
If the odds ratio between two hospitals is:
1 – the event is equally likely to occur at both hospitals
>1 – the event is more likely to occur at the first hospital
<1 – the event is less likely to occur at the first hospital.
As an example, assume Hospital A has 15 infections and Hospital B has 10 infections, out of 1,000 patients at each hospital. The odds of infection at Hospital A and Hospital B are 15/985and 10/990 respectively. The odds ratio of infection between Hospital A and Hospital B is(15/985) / (10/990) or 1.51. This odds ratio indicates that the odds of infection at Hospital A are around 50% higher than at Hospital B.
a Odds ratios are widely used in medical literature to examine the effects of other variables on the relationshipbetween two binary variables, using logistic regression (J Bland “The odds ratio”, British Medical Journal, 320, 2000, p 1468; S Simon “Understanding the Odds Ratio and the Relative Risk”, Journal of Andrology, 22, 2001, p 533). The odds ratios were risk-adjusted for patient characteristics using the approach discussed in Box 7.2. b The ‘odds of an event occurring’ is equal to the probability that the event occurs divided by the probability that itdoes not occur.
7.3.2 Unplanned hospital readmission rates
This indicator measures the rate of unplanned hospital readmissions to theatre for patients within 28 days of separation for hip replacement surgery. An ‘unplanned hospital readmission’ refers to an unexpected admission for:
further treatment of the same condition for which the patient was previously hospitalised
treatment of a condition related to one for which the patient was previously hospitalised
a complication of the condition for which the patient was previously hospitalised.28
The Australian Institute of Health and Welfare (AIHW) has noted that an unplanned hospital readmission may reflect less than optimal patient management and ineffective care pre-discharge, post discharge and/or during the transition between acute and community-based care. Good medical and/or surgical intervention, together with good discharge planning, will decrease the likelihood of unplanned
28 Australian Institute of Health and Welfare, Towards national indicators of safety and quality in
health care, September 2009, p 200, (http://www.aihw.gov.au/publications/hse/hse-75-10792/hse-75-10792.pdf).

7 Outcome, safety and quality indicators
66 IPART Case study 1 – Hip joint replacement
hospital readmissions.29 However, we note that unplanned readmissions can also relate to levels of primary care services such as access to GPs that bulk bill.
NSW Health is currently working with the Australian Commission on Safety and Quality in Health Care to develop a national definition on what constitutes an ‘unplanned readmission’ in order to collect data for this indicator. For the purposes of this study, NSW Health defined an ‘unplanned readmission’ using the approach set out in Box 7.5.
NSW Health provided unplanned readmission rates for arthritis and fracture patients for the period 2005/06 to 2007/08. These rates were calculated using the method set out in Box 7.5, and risk-adjusted for patient characteristics using the approach discussed in Box 7.2.
For arthritis patients at the 6 study hospitals (ie, including IRO), there were 195 unplanned readmissions among 1,499 hospital separations, giving an overall crude unplanned readmission rate of 130.1 per 1,000 (see Table 7.2).
Table 7.2 Arthritis group: unplanned readmission to hospital within 28 days for hip joint replacement, 2005/06 to 2007/08
Hospital Risk -adjusted odds ratio 95% confidence interval
RPAH, GH, RNSH, BLH and JHH 3.00 2.04-4.42
IRO 1
Note: See Box 7.4 for an explanation of the odds ratio. The odds ratio used in this table only compares the odds at the 5 study hospitals. It does not provide an indication of how these study hospitals compare with other hospitals.
Source: Linked records from the APDC (HOIST), Centre for Epidemiology and Research, NSW Department of Health.
We found no statistically significant differences in the unplanned readmission rates arthritis patients at RPAH, GH, RNSH, BLH and JHH, so results were grouped for these hospitals. Compared to these hospitals, the odds of unplanned readmission for arthritis patients were substantially lower at the IRO.
For fracture patients at the 5 study hospitals, there were 317 unplanned readmissions among 914 hospital separations in the 3-year period 2005/06 to 2007/08, giving an overall crude unplanned readmission rate of 336.9 per 1,000. There were no statistically significant differences in unplanned readmission rates between the 5 hospitals.
29 Australian Institute of Health and Welfare, Towards national indicators of safety and quality in
health care, September 2009, p 200, (http://www.aihw.gov.au/publications/hse/hse-75-10792/hse-75-10792.pdf).

7 Outcome, safety and quality indicators
Case study 1 – Hip joint replacement IPART 67
Box 7.5 Calculating unplanned hospital readmission rates
Data on unplanned readmission rates were obtained using linked records of the APDC for 2005/06 to 2007/08.
Readmissions included readmission to any public hospital. However, the following hospital stays were excluded:
stays for chemotherapy or dialysis
stays with any cancer diagnosis
stays which were transfers from another hospital
in-hospital deaths.
A stay was flagged as an ‘unplanned readmission’ if the following criteria were met:
the stay was ‘unplanned or unexpected’ (emergency status = ‘1’) and
the patient’s age at readmission was within 28 days of the age at separation of a previousstay for the same patient at any public hospital.
As one person may have more than one admission for a specified condition, the analysis was‘case-based’ where a case represents a hospital admission for a specified condition.
7.3.3 Unplanned return to theatre rates
This indicator measures the rate of unplanned returns to theatre for patients with complications relating to hip replacement surgery performed within the previous 72 hours during the same admission. The AIHW has noted that an unplanned return of a patient to the operating room during the same admission may reflect possible problems in the performance of procedures and/or less than optimal patient management.30
We were unable to compare the study hospitals’ performance in this area, due to problems with the quality of outcomes data provided. During our hospital visits, we reviewed a sample of clinical notes for patients who appeared from the data to have been readmitted to the same hospital for any reason within 48 hours. In this ‘audit’ of the clinical notes, we found unplanned returns to theatre that had not been reported in the HIE.
30 Australian Institute of Health and Welfare, Towards national indicators of safety and quality in
health care, September 2009, p 158, (http://www.aihw.gov.au/publications/hse/hse-75-10792/hse-75-10792.pdf).

7 Outcome, safety and quality indicators
68 IPART Case study 1 – Hip joint replacement
There are problems with the data quality for this indicator, as it is difficult to ensure hospitals are capturing data for this indicator in a consistent manner. In particular, there is no State or Commonwealth requirement for hospitals to routinely report unplanned returns to theatre:
Instead, some hospitals use their own local reports (rather than the HIE data set) to track unplanned returns to theatre for their internal review. Further, while data on this indicator is collected by the Australian Council on Healthcare Standards, this is only for hospitals participating in its programs.31
This indicator should only pick up those returns to theatre arising from less than optimal care. However, it is often difficult in practice to identify whether patients attending the emergency departments following procedures are actually planned or unplanned returns to theatre. The AIHW has noted that future development work for this indicator includes definitional work around how ‘unplanned returns’ are defined and recorded.32
Even with a more comprehensive definition of ‘unplanned return’, whether a particular incident falls within this definition will still involve some degree of subjective judgment. As such, regular audit of clinical notes may be required to ensure consistency in data collection between hospitals.
7.3.4 Wound infection rates
This indicator measures the rate of wound infections within 6 weeks of separation for hip replacement surgery. The reliability of this indicator depends on consistent reporting practices and patients re-attending hospital. We note that some infections will not be picked up if treated by a GP.
NSW Health provided information on wound infections for hip replacement patients to compare hospital outcomes. It sourced the data from the APDC, included infections reported within the hospital stay and risk-adjusted the data for patient characteristics using the approach discussed in Box 7.2.
We note that the wound infection data in this study does not differentiate between ‘clean’ wounds (ie, sterile wounds) and ‘contaminated’ wounds (eg, wounds already contaminated prior to surgery). This means that the study hospitals results need to be interpreted with caution, as their wound infection rates may not be directly comparable.
There were 99 infections among 2,542 hospital separations for the 5 study hospitals, giving an overall crude infection rate of 38.9 per 1,000 (see Table 7.3).
31 Australian Institute of Health and Welfare, Towards national indicators of safety and quality in
health care, September 2009, p 159, (http://www.aihw.gov.au/publications/hse/hse-75-10792/hse-75-10792.pdf).
32 Australian Institute of Health and Welfare, Towards national indicators of safety and quality in health care, September 2009, p 158, (http://www.aihw.gov.au/publications/hse/hse-75-10792/hse-75-10792.pdf).
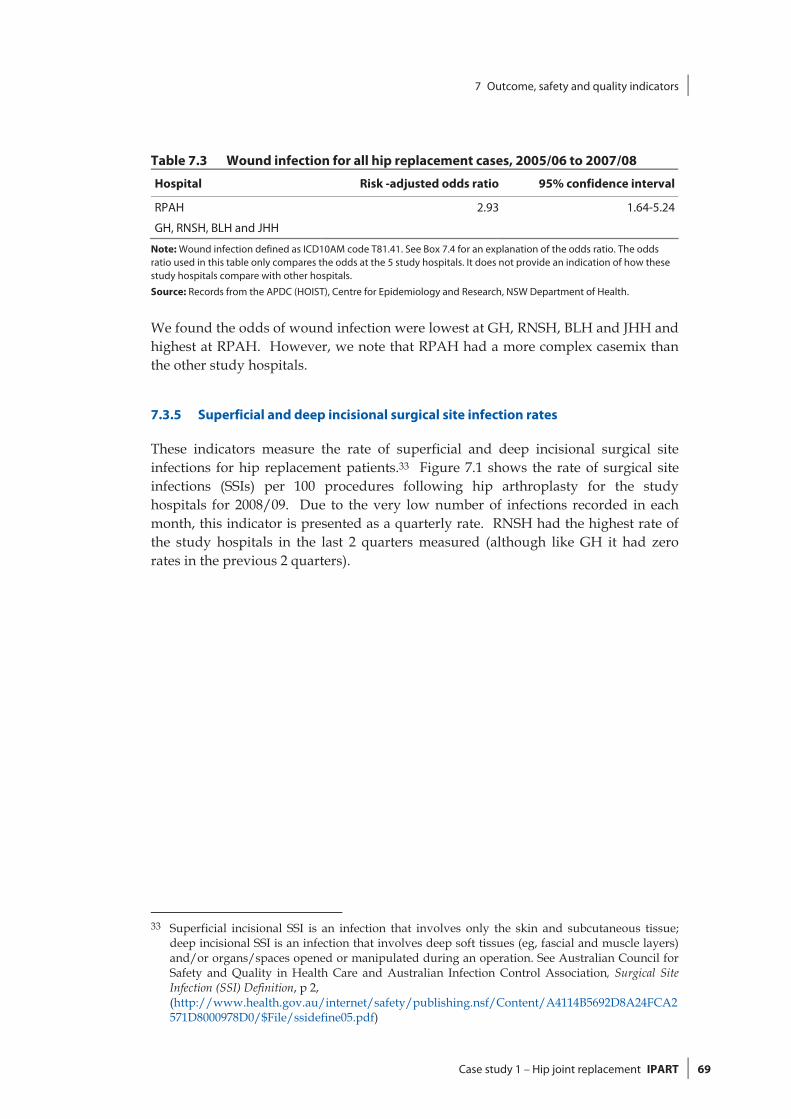
7 Outcome, safety and quality indicators
Case study 1 – Hip joint replacement IPART 69
Table 7.3 Wound infection for all hip replacement cases, 2005/06 to 2007/08
Hospital Risk -adjusted odds ratio 95% confidence interval
RPAH 2.93 1.64-5.24
GH, RNSH, BLH and JHH
Note: Wound infection defined as ICD10AM code T81.41. See Box 7.4 for an explanation of the odds ratio. The odds ratio used in this table only compares the odds at the 5 study hospitals. It does not provide an indication of how these study hospitals compare with other hospitals.
Source: Records from the APDC (HOIST), Centre for Epidemiology and Research, NSW Department of Health.
We found the odds of wound infection were lowest at GH, RNSH, BLH and JHH and highest at RPAH. However, we note that RPAH had a more complex casemix than the other study hospitals.
7.3.5 Superficial and deep incisional surgical site infection rates
These indicators measure the rate of superficial and deep incisional surgical site infections for hip replacement patients.33 Figure 7.1 shows the rate of surgical site infections (SSIs) per 100 procedures following hip arthroplasty for the study hospitals for 2008/09. Due to the very low number of infections recorded in each month, this indicator is presented as a quarterly rate. RNSH had the highest rate of the study hospitals in the last 2 quarters measured (although like GH it had zero rates in the previous 2 quarters).
33 Superficial incisional SSI is an infection that involves only the skin and subcutaneous tissue;
deep incisional SSI is an infection that involves deep soft tissues (eg, fascial and muscle layers) and/or organs/spaces opened or manipulated during an operation. See Australian Council for Safety and Quality in Health Care and Australian Infection Control Association, Surgical Site Infection (SSI) Definition, p 2,
(http://www.health.gov.au/internet/safety/publishing.nsf/Content/A4114B5692D8A24FCA2571D8000978D0/$File/ssidefine05.pdf)
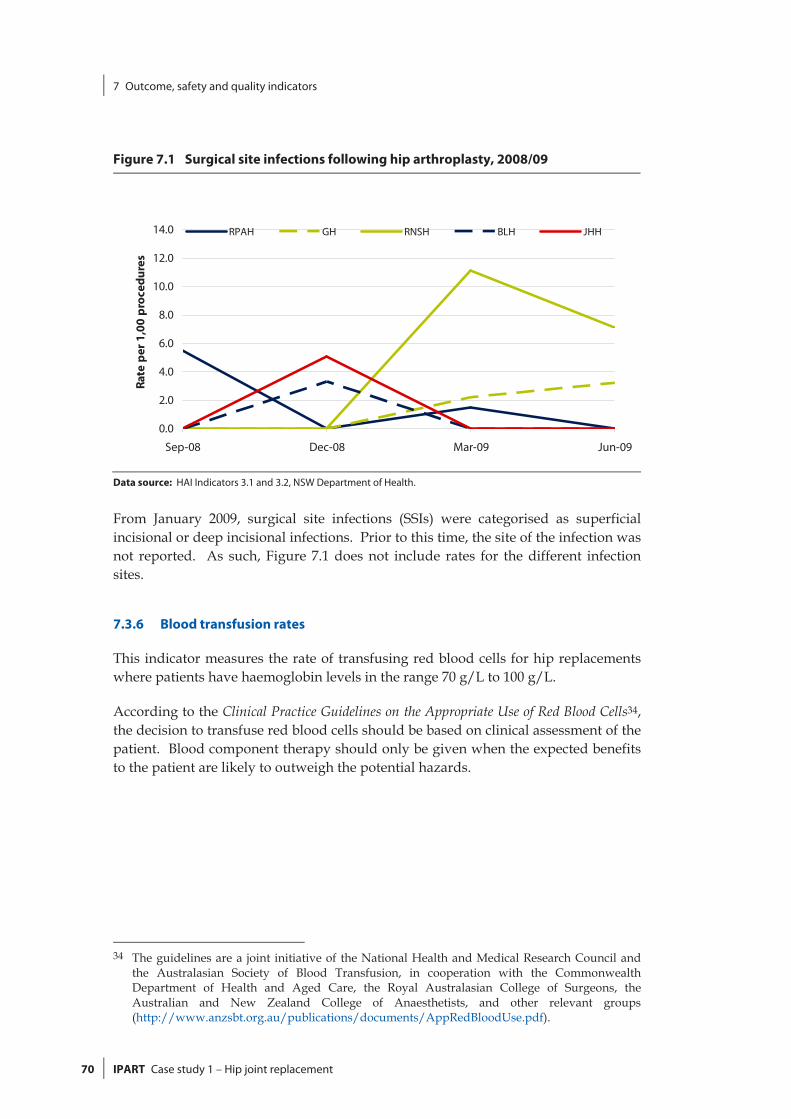
7 Outcome, safety and quality indicators
70 IPART Case study 1 – Hip joint replacement
Figure 7.1 Surgical site infections following hip arthroplasty, 2008/09
0.0
2.0
4.0
6.0
8.0
10.0
12.0
14.0
Sep-08 Dec-08 Mar-09 Jun-09
Rate
per
1,0
0 pr
oced
ures
RPAH GH RNSH BLH JHH
Data source: HAI Indicators 3.1 and 3.2, NSW Department of Health.
From January 2009, surgical site infections (SSIs) were categorised as superficial incisional or deep incisional infections. Prior to this time, the site of the infection was not reported. As such, Figure 7.1 does not include rates for the different infection sites.
7.3.6 Blood transfusion rates
This indicator measures the rate of transfusing red blood cells for hip replacements where patients have haemoglobin levels in the range 70 g/L to 100 g/L.
According to the Clinical Practice Guidelines on the Appropriate Use of Red Blood Cells34, the decision to transfuse red blood cells should be based on clinical assessment of the patient. Blood component therapy should only be given when the expected benefits to the patient are likely to outweigh the potential hazards.
34 The guidelines are a joint initiative of the National Health and Medical Research Council and
the Australasian Society of Blood Transfusion, in cooperation with the Commonwealth Department of Health and Aged Care, the Royal Australasian College of Surgeons, the Australian and New Zealand College of Anaesthetists, and other relevant groups (http://www.anzsbt.org.au/publications/documents/AppRedBloodUse.pdf).

7 Outcome, safety and quality indicators
Case study 1 – Hip joint replacement IPART 71
Table 7.4 Guidelines for appropriate use of red blood cells
Haemoglobin level Guideline
> 100 g/L Use of red blood cells is likely to be inappropriate, unless there are specific indications
70 g/L to 100 g/L Use of red blood cells may be appropriate
The decision to transfuse should be supported by the need to relieve clinical signs and symptoms and prevent significant morbidity and mortality
< 70 g/L
Use of red blood cells is likely to be appropriate
In some patients who are asymptomatic and/or where specific therapy is available, lower threshold levels may be acceptable
Source: National Health and Medical Research Council and the Australasian Society of Blood Transfusion, Clinical Practice Guidelines on the Appropriate Use of Red Blood Cells (http://www.anzsbt.org.au/publications/documents/AppRedBloodUse.pdf).
When the haemoglobin level is in the range 70g/L to 100 g/L, the Clinical Practice Guidelines on the Appropriate Use of Red Blood Cells note that clinical judgement about the risk of transfusion is of great importance. Use of red blood cells may be appropriate when:
the patient is undergoing an operative procedure associated with major blood loss
there are clinical signs, symptoms or evidence that the patient has associated impairment in oxygen transport that may be exacerbated by anaemia
to control anaemia-related symptoms in a patient on a chronic transfusion regimen or during marrow suppressive therapy and to maintain the haemoglobin level > 80 g/L.35
In relation to hip replacement surgery, clinicians advised that there are significant differences between arthritis and fracture patients in the use of blood transfusions. For example, fracture patients generally have greater comorbidities than arthritis patients. As such, they are generally less tolerant of lower haemoglobin levels when compared to arthritis patients.
The study hospitals collect this data at the hospital-wide level, but do not systematically report it for hip replacement patients. Refer to Chapter 16 of our main report for further information.36
35 National Health and Medical Research Council and the Australasian Society of Blood
Transfusion, Clinical Practice Guidelines on the Appropriate Use of Red Blood Cells (http://www.anzsbt.org.au/publications/documents/AppRedBloodUse.pdf).
36 IPART, NSW Health costs and outcomes study by IPART for selected NSW hospitals, July 2010.

7 Outcome, safety and quality indicators
72 IPART Case study 1 – Hip joint replacement
7.3.7 Administration of VTE prophylaxis
This indicator measures the proportion of patients who are administered venous thrombo-embolism (VTE) prophylaxis. The AIHW has noted that VTE can cause pain, loss of function and sometimes death. Further, the incidence of VTE is an indicator of the quality of postoperative care, and can reflect inappropriate or inadequate medical and nursing care. VTE invariably prolongs the duration of hospitalisation and requires additional medical intervention.37
The study hospitals do not systematically collect this data at the clinical level. Instead, they conduct hospital-wide audits to see whether VTE prophylaxis assessments are being conducted. Refer to Chapter 16 of our main report, NSW Health costs and outcomes study by IPART for selected NSW hospitals, for further information.
7.3.8 Administration of antibiotic prophylaxis
This indicator measures the proportion of patients who are administered antibiotic prophylaxis. Administering an appropriate prophylactic antibiotic at the time of surgery can significantly reduce post operative infections.
The study hospitals do not systematically collect this data at the clinical level. Instead, they conduct hospital-wide audits to see whether antibiotic prophylaxis assessments are being conducted. Refer to Chapter 16 of our main report, NSW Health costs and outcomes study by IPART for selected NSW hospitals, for further information.
7.3.9 Surgery commencing within 24 hours of emergency admission
This indicator measures the proportion of hip replacement patients with a fracture diagnosis whose surgery commences within 24 hours of their emergency admission.
The time it takes for hospitals to operate on patients with hip factures is recognised as an important factor in reducing mortality. However, patients need to be ‘stable’ before operating. In addition, study hospitals with longer times may be appropriately postponing surgery so that it takes place within ‘standard hours’.
37 Australian Institute of Health and Welfare, Towards national indicators of safety and quality in
health care, September 2009, p 155, (http://www.aihw.gov.au/publications/hse/hse-75-10792/hse-75-10792.pdf).

7 Outcome, safety and quality indicators
Case study 1 – Hip joint replacement IPART 73
NSW Health and the Royal Australasian College of Surgeons are both promoting the benefits of scheduling emergency surgery in standard hours where clinically appropriate.38 The standard hours operating period, usually between 8:00am and 5:00pm Monday to Friday, is when most hospitals have the maximum number of their health services operational and have maximum staffing levels.39 Operating outside these standard hours increases staff fatigue, may impair judgment at critical moments and carries a risk of error.40
Table 7.5 shows the percentage of patients with fractures that were operated on within the timeframes indicated in the table.
Table 7.5 Hip fracture diagnosis, time from admission to surgery commencement
<=24 hours
%
25-48 hours
%
<=48 hours
%
49-72 hours
%
>=73 hours
%
RPAH 34 41 76 15 10
GH 31 43 73 16 11
RNSH 49 35 84 10 6
BLH 25 49 75 16 9
JHH 35 27 63 13 25
Note: Numbers may not add due to rounding.
Source: IPART analysis using data from hospital operating theatres and HIE inpatient statistics, 2008/09.
RNSH had the highest proportion of patients whose surgery commenced within 24 hours of their emergency admission, with 49%. JHH, RPAH and GH had similar proportions, with 35%, 34% and 31% respectively. BLH had the lowest rate, with 25%.
It is unclear whether the time from admission to surgery commencing affects outcomes for fracture patients. For example, a recent Australian study of 222 hip fracture patients did not find a significant increase in mortality in patients whose surgery was delayed by more than 2 days from their admission. However, the study authors did note that the effect of delay on patient morbidity and mortality remains controversial, and continued to recommend early surgery to minimise length of stay and complications.41
38 NSW Health, Emergency Surgery Guidelines (GL2009_09), June 2009,
(http://www.health.nsw.gov.au/policies/gl/2009/pdf/GL2009_009.pdf); Royal Australasian College of Surgeons, Emergency Surgery – Acute and Trauma Surgery Workshop, Consensus Statement, 19 November 2009.
39 NSW Health, Emergency Surgery Guidelines (GL2009_09), June 2009, p 24, (http://www.health.nsw.gov.au/policies/gl/2009/pdf/GL2009_009.pdf).
40 Royal Australasian College of Surgeons, Emergency Surgery – Acute and Trauma Surgery Workshop, Consensus Statement, 19 November 2009, p 1.
41 HC Rae, IA Harris, L McEvoy, T Todorova, ‘Delay to surgery and mortality after hip fracture’, 77(10), ANZ Journal of Surgery, October 2007, pp 889-891.
7 Outcome, safety and quality indicators
74 IPART Case study 1 – Hip joint replacement
7.3.10 Discharge to usual place of residence
This indicator measures the proportion of hip replacement patients, aged 75 years and over and admitted through the emergency department, who are discharged from hospital to their usual place of residence.
When their acute episode concludes, hip replacement patients may be transferred or discharged to various locations. These include to a nursing home (as a new resident) or to their usual place of residence. The Australian Institute of Health and Welfare also notes that some patients leave hospital against medical advice and some die in hospital.42
Where a patient is transferred or discharged to is affected by various factors. These include the availability of nursing home places, as well as the extent of support in the community to assist with a patient’s recovery at their usual place of residence.
Table 7.6 shows the separation modes for hip replacement patients aged 75 years and over and admitted through the emergency department.
42 Australian Institute of Health and Welfare, The problem of osteoporotic hip fracture in Australia,
March 2010, p 11 (Bulletin Series Number 76).

7 Outcome, safety and quality indicators
Case study 1 – Hip joint replacement IPART 75
Table 7.6 Discharge destination after hip joint replacement, patients aged 75 years and over and admitted through the emergency department
2006/07 2007/08 2008/09
Hospital Separation mode no. % no. % no. %
RPAH Discharge to nursing home 5 16 5 13 4 11
Discharged to usual place of residence 6 19 8 21 7 19
Other destination or separation mode 20 65 25 66 25 70
GH Discharge to nursing home 12 16 12 14 11 14
Discharged to usual place of residence 13 17 14 16 12 15
Other destination or separation mode 50 67 59 70 58 71
RNSH Discharge to nursing home 3 5 10 17 5 9
Discharged to usual place of residence 6 10 8 13 19 33
Other destination or separation mode 50 85 42 70 34 58
BLH Discharge to nursing home 13 28 14 27 14 33
Discharged to usual place of residence 12 26 7 14 8 19
Other destination or separation mode 21 46 30 59 20 48
JHH Discharge to nursing home 7 6 3 3 5 4
Discharged to usual place of residence 40 33 34 30 39 31
Other destination or separation mode 76 61 75 67 80 65
Source: HIE inpatient statistics 2008/09 and IPART analysis.
In 2008/09, RNSH and JHH had the highest proportions of hip replacement patients aged 75 years and over who were discharged to their usual place of residence, with 33% and 31% respectively. RPAH, BLH and GH had similar proportions, with 19%, 19% and 15% respectively.

7 Outcome, safety and quality indicators
76 IPART Case study 1 – Hip joint replacement
7.4 Issues for further consideration as part of Stages 5 and 6 of the broader NSW Health study
There were significant differences between the study hospitals in relation to wound infection rates and unplanned readmission rates. As previously discussed, these differences may simply reflect differences in measurement or patient mix among the study hospitals. However, these differences in clinical indicators should be considered by clinical expert groups to assess whether further action is warranted.
Recommendation
3. That NSW Health and clinical expert groups review the variations in the following clinical indicators for hip joint replacement surgery at the study hospitals:
– unplanned readmission rates, and
– wound infection rates.

7 Outcome, safety and quality indicators
Case study 1 – Hip joint replacement IPART 77
Appendices

7 Outcome, safety and quality indicators
78 IPART Case study 1 – Hip joint replacement
A Full list of recommendations from main report
Case study 1 – Hip joint replacement IPART 79
A Full list of recommendations from main report
A.1 List of recommendations
Consistency of DRG groupings
Our recommendations in this area are mainly aimed at making users of hospital data aware of some of the limitations of using DRG groupings for hospital comparisons in certain clinical areas.
1. That users of hospital cost and outcome data note that DRGs may contain a range of patient types with varying clinical resource requirements, costs of care and expected clinical outcomes. Therefore DRGs may not always provide the optimal basis for comparing costs and outcomes among hospitals.
2. In light of Recommendation 1, that the NSW Department of Health, and other health research bodies at both the state and national level, consider whether DRGs are a suitable basis for determining funding and comparing performance among hospitals (for various different types of hospital activity). Where they are not suitable, continue research to develop better approaches for these areas.
Consistency of patient numbers
Our recommendations on patient numbers are aimed at making users of hospital data aware of differences in patient counting practices and patient datasets between hospitals that can affect hospital comparisons, to improve consistency of patient counting practices between hospitals and lead to better integration of patient datasets.
3. That users of hospital data note that there are differences in practices relating to counting of patients that can affect hospital patient numbers and average cost comparisons eg, counting differences relating to admission status, billing status, location of care and collaborative care arrangements.
4. In light of Recommendation 3, that NSW Health clarifies and standardises administrative procedures including guidelines for recording of non-inpatients of various types, as well as ‘collaborative care’ patients.

A Full list of recommendations from main report
80 IPART Case study 1 – Hip joint replacement
5. That NSW Health considers ways of better integrating patient information held locally by hospital clinical units (such as eye clinics and cardiac catheter labs) with the HIE data set.
Consistency of lengths of stay
Our recommendations aim to improve consistency between hospitals on length of stay measures, and to make users of hospital data aware of the limitations of measures based on ‘acute episodes’.
6. That NSW Health monitors hospital practices relating to the classification of episodes into care types and type-changing practices (eg, timing of type changes from acute to rehabilitation care) and provide clear and consistent guidelines to hospitals, so episode measures are more consistent among hospitals.
7. That users of hospital data note that 'acute episodes' often only represent a part of a patient's hospital stay. Therefore, comparisons among hospitals using acute length of stay measures or acute costs may produce misleading results. This is particularly important for conditions that involve both acute and sub-acute care and/or transfers between facilities.
Coding
We have made recommendations aimed at improving the quality of medical records documentation and clinical coding in hospitals to both improve the quality of data for clinical research as well as to more accurately reflect casemix complexity.
8. That NSW Health should continue to improve the quality of medical record documentation and the accuracy and consistency of coding.
9. That hospitals should encourage consistent education on coding and facilitate communication between clinical staff and coders regarding both the coding process and the documentation required to code common clinical conditions, diagnoses or complications, such as AMI, angina and chest pain.
10. Where pathology test information can be readily extracted (eg, Cerner sites), that systems be developed so this information can be used to validate coding and support work on variation in clinical practice and measuring clinical quality.
11. That NSW Health considers undertaking further analysis to identify pathology or imaging tests that can be used to help target audits of coding and support work on variation in clinical practice and measuring clinical quality – such as identifying types of pathology tests that correspond closely with diagnosis coding.

A Full list of recommendations from main report
Case study 1 – Hip joint replacement IPART 81
Clinical costing
Our recommendations are aimed at improving the quality and consistency of clinical costing data, and helping to ensure that quality costing data and clinical inputs to the costing process (such as data from prosthesis, pathology and imaging systems) can be used to inform hospital management about resource use, and clinicians about clinical practice.
12. That the NSW Department of Health works with the area health services and hospitals to apply a consistent set of rules for clinical costing covering cost centres and IFRACs so that data are consistent and comparable between the hospitals.
13. That NSW Health regularly audits the accuracy of cost centres and IFRACs used for clinical costing.
14. That NSW Health uses standard clinical data feeds (actual patient data) for clinical costing where this is feasible and useful.
15. That the data used for clinical costing purposes be available to hospitals and clinicians so they can undertake comparative analysis on clinical practices and performance.
Medical staff costs
Given our finding that there was a lack of consistency in the treatment of medical staff costs and the difficulty this created in estimating medical staff costs for our case study areas, we recommend:
16. That further work be undertaken to strengthen the quality and consistency of available information on medical staff costs.
Prosthesis costs
Our recommendations on prosthesis costs are aimed at improving prosthesis purchasing and making cost savings in this area. These should be considered in conjunction with our recommendation that clinical experts should review the appropriateness of clinical variation in prosthesis use and address this variation (see Recommendation 31).
17. That NSW Health notes the variation in prostheses use among the study hospitals including:
– drug-eluting stents versus bare metal stents
– single chamber pacemakers versus dual chamber pacemakers
– different types of components for hip replacement procedures.
18. That NSW Health notes the range of approaches to prosthesis controls and the variation in prices currently paid for prostheses, including for exactly the same models.
A Full list of recommendations from main report
82 IPART Case study 1 – Hip joint replacement
19. That NSW Health facilitates sharing of information on purchase prices for prostheses to assist price negotiations with suppliers.
20. That NSW Health optimises prosthesis cost savings through tenders, supplier price agreements and controlled approaches to prosthesis purchasing, noting that clinical consultation and cooperation is essential as is retaining some flexibility to allow for special orders when clinically indicated.
Imaging and pathology costs
Our recommendations are aimed at encouraging better use of imaging and pathology data, and consideration of whether there should be standard treatment of imaging and pathology within clinical costing and whether internal charges should reflect actual costs. These recommendations should be considered in conjunction with our clinical case studies, which include comparisons of imaging use, and Recommendation 31, relating to clinical variation in imaging use for diagnosing appendicitis.
21/25 That NSW Health notes that imaging and pathology data can be used to monitor changes in imaging use and inform clinical practice, and that:
– All hospitals obtain detailed reports from pathology and imaging services on their test ordering patterns, including the number of tests by major test type and the cost of these tests.
– Hospitals routinely provide data to heads of clinical units to help inform them on resource use and provision of care to improve patient outcomes and discuss trends at management meetings – for example, summary reports that include both the number of tests by test type, and the value (or preferably cost) of these tests.
– NSW Health develops reports comparing the use of imaging and pathology tests for clinical groupings and circulates these to area health services and hospitals.
22. That NSW Health considers whether, for clinical costing purposes, it is appropriate for hospitals and area health services to base the value of imaging tests on the MBS rate for these tests and, if so, what standard percentage of this rate is appropriate for use by all hospitals given the actual costs of providing the test.
23. That NSW Health seeks to obtain detailed information from the pathology services on the number and type of tests and the actual cost of undertaking a range of typical tests for future comparisons of pathology costs.
24. That NSW Health addresses issues that prevent the actual costs associated with specific pathology tests and ordering patterns being disclosed by pathology services.
26. That NSW Health considers whether the detailed cost estimates that pathology services prepare as part of the benchmarking pathology project could be used for more accurate pricing between pathology services and hospitals, to enable clinicians to consider the actual cost of their clinical decisions.
A Full list of recommendations from main report
Case study 1 – Hip joint replacement IPART 83
Operating theatre costs
Our recommendations in relation to operating theatres aim to facilitate improvements in theatre management arrangements, and the quality and consistency of theatre data.
27. That NSW Health notes the differences in approaches to theatre management among hospitals and consider if there is scope to share information about how the better theatre arrangements are organised.
28. That NSW Health notes the issues regarding theatre data and work with the hospitals to improve the completeness of datasheets and apply a consistent set of rules for recording operating theatre times.
29. That NSW Health considers routine auditing of the quality of data on returns to theatre and considers the best way for achieving accuracy and consistency in this indicator.
Pharmacy costs
As we were not able to undertake a detailed comparison of pharmacy services and costs, our recommendations focus on encouraging further analysis in this area.
30. That NSW Health:
– Notes the wide variation in the proportion of drugs dispensed versus held on imprest across the study hospitals.
– Monitors the value of expired pharmacy stock and compares this among hospitals.
– Considers standardised guidelines for the return of unused medication, principally to ensure patient safety but also to minimise wastage and reduce costs.
– Considers whether antimicrobial stewardship programs should be implemented at the major hospitals where such programs are not currently in place. The purpose of these programs would be to help prevent antimicrobial resistance and reduce costs by preventing inappropriate use of antimicrobials.

A Full list of recommendations from main report
84 IPART Case study 1 – Hip joint replacement
Configurations of care – Review of clinical variations during Stages 5 and 6 of the wider NSW Department of Health study
Our case studies identified a number of differences in the way care is provided among study hospitals in specific clinical areas. We recommend that clinical experts consider these clinical differences or clinical issues as part of Stages 5 and 6 of the wider health study. This recommendation should be dealt with in conjunction with Recommendation 36, relating to variation in indicators of safety, quality and outcomes.
31. That NSW Health arranges for appropriate clinical expert groups to consider the following clinical issues identified in our case studies; and that where appropriate, NSW Health and the expert groups take steps to address clinical differences.
– Hip joint replacement:
o Note that separation of planned and emergency cases may reduce lengths of stay for planned (arthritis) cases.
o Address the variation in the selection of hip prosthesis components (including press fit, cementless hip stems versus cemented hip stems and ceramic femoral heads versus metal femoral heads) among study hospitals.
– Major chest procedure:
o Note the different clinical pathways and high day of surgery admission rates for thoracic surgery patients at RPAH compared with other study hospitals.
o Consider whether aspects of the model of care at RPAH are suitable to be used in other hospitals.
– Breast surgery:
o Note the early discharge models at RNSH for breast surgery patients having mastectomies and
o Consider whether such models should be followed more widely in NSW hospitals and the types of patient cases they should be used for (eg, simpler, unilateral cases or younger patients).
– Cholecystectomy:
o Note the variation in the proportion of patients with cholelithiasis or cholecystitis who are operated on acutely as emergency admissions.
o Consider whether this variation has significant quality of care implications.
o Consider the relative costs and benefits of an emergency surgical services team model for ensuring early diagnosis and treatment of conditions like cholecystectomy and whether it should be more widely applied.
o Note that costing of cholecystectomy should take into account the costs of prior related emergency department attendances. A similar approach should be adopted for other clinical conditions that are likely to involve multiple prior emergency department attendances.
A Full list of recommendations from main report
Case study 1 – Hip joint replacement IPART 85
o Consider the relative costs and benefits of cholecystectomies with and without the use of fluoroscopy.
– Appendicectomy
o Note the variation in the use of imaging tests for diagnosing appendicitis.
o Consider establishing standard protocols for diagnosing appendicitis, indicating when it is appropriate to use CT scans, MRIs and ultrasounds.
o As part of establishing standard protocols for diagnosing appendicitis, consider whether CT scans, MRIs and ultrasounds should only be used for certain patient groups (eg, older patients who are more likely to be suffering from other conditions with symptoms similar to appendicitis).
o Consider the relative costs and benefits of laparoscopic versus open surgery for appendicitis.
– Stroke
o Consider ways to reduce the proportion of stroke patients coded with a principal diagnosis of 'stroke, not specified as haemorrhage or infarction' (ICD10 code I64).
o Consider developing consistent guidelines for the administration of tPA.
o Consider including tPA administration as a procedure in coding standards.
o Consider ways to improve transfers of suspected stroke patients to stroke units with minimum delay, including consultation with the Ambulance Service and Emergency Departments.
o Investigate whether it is useful and possible to combine Ambulance Service data on response time with hospital patient data to monitor time from call to ambulance to arrival at an appropriate hospital.
o Consider the costs and benefits of providing more rehabilitation care in the home.
o Pursue the collection of the data on outcome indicators from the National Stroke Research Institute.
– Cardiology – Stents, Pacemakers and Defibrillators:
o Address the variation in the use of drug-eluting stents versus bare metal stents among study hospitals.
o Address the variation in the types of pacemakers used among study hospitals.
o Investigate whether there are differences in treatment procedures, or waiting times between presentation and procedure, for patients who present to hospitals without a 24 hour cardiac catheter laboratory, compared to patients who present to hospitals with a 24 hour cardiac catheter laboratory, and whether any differences in procedure or waiting times have implications for clinical outcomes.
A Full list of recommendations from main report
86 IPART Case study 1 – Hip joint replacement
o Consider ways of better integrating information held in cardiac catheter laboratories with the HIE data set.
– Tracheostomy or ventilation greater than 95 hours:
o Note that at BLH, clinicians tend to perform surgical tracheostomies, whereas at the other hospitals, these are usually performed percutaneously.
– Cataract/lens procedure:
o Assess the costs and benefits of toric lenses and develop guidelines for their use in public hospitals.
– Hysterectomy:
o That any future studies of hysterectomy compare the costs and outcomes for hysterectomies with the costs and outcomes of other procedures such as endometrial ablation and uterine artery embolisation.
Improving outcome, safety and quality indicators
While current Commonwealth and State initiatives will improve outcomes data, we have made recommendations that will assist this process.
32. That NSW Health enhances understanding and use of mortality, survival, unplanned readmission and wound infection indicators and their risk adjustment by:
– continuing to contribute to the development of ACSQHC’s safety and quality standards for these indicators
– refining the methodology used for standardising or risk-adjusting these indicators
– continuing to consult with clinicians regarding the agreed presentation of mortality, survival unplanned readmission and wound infection information
– reporting this information on a more routine and regular basis consistent with ACSQHC data sets.
33. That NSW Health encourages hospitals to put in place systems to facilitate accurate coding of comorbidities and ensures that coding practices are consistent across hospitals.
34. That NSW Health works with ACSQHC to negotiate more streamlined arrangements for access to data held by third parties (such as clinical registries) for clinical analysis, and makes these data available to hospitals and clinicians.
35. That NSW Health explores the possibility of providing outcomes information to clinicians in a more systematic way as an aid to clinical improvement and a key indicator of performance.

A Full list of recommendations from main report
Case study 1 – Hip joint replacement IPART 87
Indicators of safety, quality or outcomes, - review of clinical variations during stages 5 and 6 of the wider NSW Department of Health project
We have also made a number of findings relating to variations in indicators of safety, quality or outcomes. Where we have observed apparent differences among hospitals, these should be considered by clinical expert groups in completing stages 5 and 6 of the Department of Health’s wider project. These differences should be considered in conjunction with differences in clinical practice (Recommendation 31).
36. That clinical expert groups consider the following clinical issues; and where appropriate, NSW Health and clinical expert groups take steps to address clinical variations as part of Stages 5 and 6 of the broader NSW Health review:
– Review the variations in outcome, safety and quality indicators among study hospitals, including their:
o unplanned readmission rates
o wound infection rates for selected surgical procedures.
– Review the variation in mortality and survival rates for all major chest surgery patients and consider whether to recommend changes to clinical practice or conduct further investigation involving:
o a larger sample of hospitals, and
o more detailed analyses for ‘like patients’ (ie, lung cancer, infection-related abscess/pyothorax and collapsed/punctured lung patients).
– Review the variation in the following clinical indicators for hip joint replacement surgery at the study hospitals:
o wound infection rates
o unplanned readmission rates.
– Review the variation in wound infection rates for appendicectomy and cholecystectomy surgery at the study hospitals.
– Note the variation in the following clinical indicators relating to obstetric delivery:
o caesarean section rates for ‘selected primipara’
o vaginal delivery rates following primary caesarean section
o caesarean section rates after induction of labour for ‘selected primipara’
o repeat caesarean section rates
o significant tear rates
and monitor changes arising from the implementation of the NSW Health policy directive, Maternity – Towards Normal Birth in NSW, to determine whether this policy effectively addresses the variation.
A Full list of recommendations from main report
88 IPART Case study 1 – Hip joint replacement
Additional outcome indicators
We made recommendations to consider the costs and benefits of collecting data for the following areas where indicators are not commonly used.
37. That NSW Health considers the costs and benefits of collecting data and monitoring performance against the following indicators:
– warfarin management
– visual outcomes for patients undergoing lens procedures.
We also made a recommendation to develop a set of standard indicators for measuring care and/or outcomes in ICUs.
38. That NSW Health undertakes further work to develop a set of standard indicators for measuring care and/or outcomes in ICUs.
Time Out audits
Finally, we made a recommendation to improve consistency in the number of cases audited as part of the Time Out process relative to the number of separations.
39. That NSW Health specifies the number or proportion of patient cases that should be audited as part of the Time Out process.
Next steps - wider application of this study
40. That NSW Health refines and develops useful aspects of this study for application more widely to other hospitals, other health settings and other clinical conditions.
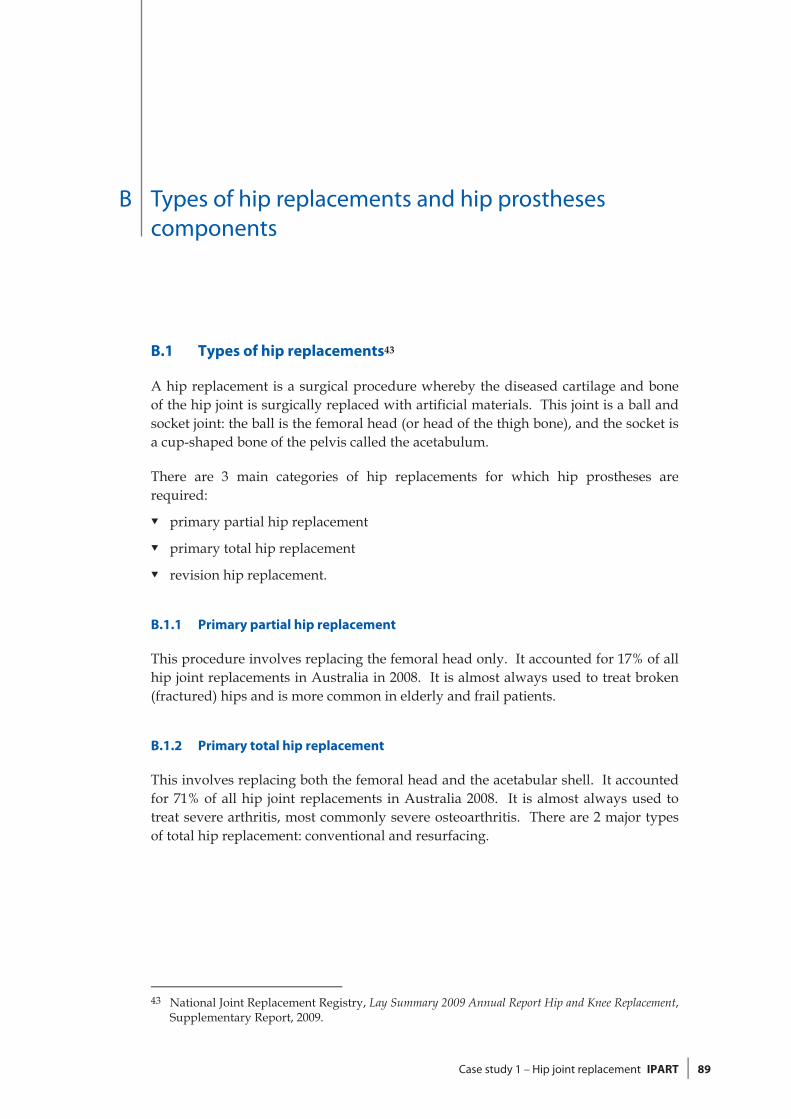
B Types of hip replacements and hip prostheses components
Case study 1 – Hip joint replacement IPART 89
B Types of hip replacements and hip prostheses components
B.1 Types of hip replacements43
A hip replacement is a surgical procedure whereby the diseased cartilage and bone of the hip joint is surgically replaced with artificial materials. This joint is a ball and socket joint: the ball is the femoral head (or head of the thigh bone), and the socket is a cup-shaped bone of the pelvis called the acetabulum.
There are 3 main categories of hip replacements for which hip prostheses are required:
primary partial hip replacement
primary total hip replacement
revision hip replacement.
B.1.1 Primary partial hip replacement
This procedure involves replacing the femoral head only. It accounted for 17% of all hip joint replacements in Australia in 2008. It is almost always used to treat broken (fractured) hips and is more common in elderly and frail patients.
B.1.2 Primary total hip replacement
This involves replacing both the femoral head and the acetabular shell. It accounted for 71% of all hip joint replacements in Australia 2008. It is almost always used to treat severe arthritis, most commonly severe osteoarthritis. There are 2 major types of total hip replacement: conventional and resurfacing.
43 National Joint Replacement Registry, Lay Summary 2009 Annual Report Hip and Knee Replacement,
Supplementary Report, 2009.

B Types of hip replacements and hip prostheses components
90 IPART Case study 1 – Hip joint replacement
B.1.3 Revision hip replacement
Revisions occur when there is a need to revise a hip joint replacement procedure previously undertaken. They usually occur many years after the initial operation, and require all or some of the prosthesis components. The most common reason for revising a hip replacement is a condition called aseptic (non infective) loosening. This means that the replacement eventually becomes loose in the bone, which makes it painful to walk. Most often this is thought to occur because of an inflammatory reaction that develops around the replacement.
Revisions accounted for 12% of all hip replacements in Australia in 2008. The rate of revision varies depending on the type of hip prosthesis originally used. Procedures that used cementless types have a higher rate of revision than those that used either cemented and hybrid prostheses.
B.2 Hip components
There are 4 main prosthesis components used in a total hip joint replacement procedure:
the acetabular shell
the liner or insert that goes between the acetabulum shell and the femoral head (which are often made of polyethylene, but can also be made of other materials)
the femoral head, and
the hip stem implant.
The number of components required depends on whether the patient requires a partial hip replacement or a total hip replacement.
These components are illustrated in Figure B.1.

B Types of hip replacements and hip prostheses components
Case study 1 – Hip joint replacement IPART 91
Figure B.1 Prosthesis Components used in Hip Replacement
Note: Not all hip components are required in all hip replacement or revision surgeries. Some components are single prosthesis components.
Source: Center for Minimally Invasive Surgery, Arkansas Orthopaedic Institute (http://www.misinstitute.com).

C Sample of hip prostheses prices
92 IPART Case study 1 – Hip joint replacement
C Sample of hip prostheses prices
The table below provides a sample of prices paid for hip prostheses by our study hospitals in 2008/09.

C Sample of hip prostheses prices
Case study 1 – Hip joint replacement IPART 93
Table C.1 Sample hip joint prosthesis prices paid by study hospitals, 2008/09
Product Supplier RPAH GH RNSH BLH JHH
Acetabular Shell $ $ $ $ $
Shell A Supplier 1 na 2,454 2,598 2,890 2,450Shell B Supplier 2 na 2,063 na 2,000 2,063
Shell C Supplier 2 2,300 2,9002,600 &
2,750 2,600 2,600 & 2,750Shell D Supplier 2 na na 3,400 2,300 3,345
Liner/Insert
Liner/Insert A Supplier 1 na 3,500 5,203 3,500 3,500Liner/Insert B Supplier 2 1,300 1,836 1,500 1,400 1,500 Liner/Insert C Supplier 2 2,187 2,083 2,558 2,560 2,083
Femoral head
Femoral head Aa Supplier 3/Supplier 2 na na 615 & 1,000 399 640 - 980
Femoral head B Supplier 1 na 2,100 2,226 2,100 2,100Femoral head C Supplier 4 na 919 919 827 naFemoral head D Supplier 2 na 718 na 950 676Femoral head E Supplier 2 780 718 810 600 718Femoral head F Supplier 2 780 1,873 2,500 2,390 1,873
Femoral head G Supplier 2 na2,100 &
2,5002,436 &
2,500 na 2,436 & 2,500
Femoral head H Supplier 5 na 944 800 & 987 987 944
Hip stem
Hip stem A Supplier 2 na 429 439 & 615 na naHip stem B Supplier 2 na na na na 660
Hip stem C Supplier 2 2,000 1,8732,300 &
2,500 2,390 1,873 & 2,300Hip stem D Supplier 2 na na 4,850 na 3,646
Hip stem E Supplier 2 na4,700 &
4,800 na 4,520 4,700 & 4,800
Hip stem F Supplier 2 4,1605,000 &
5,250 5,2504,850 &
5,250 4,850 & 5,250a The prices shown for Femoral head A includes models supplied by 2 suppliers: Supplier 2 and Supplier 3. While they are very similar models, they are not identical (which is unlike our other comparisons).
Note: This sample does not include all study hospitals’ purchased hip joint prosthesis components - just those where we could usefully compare prices. Where there are two or more prices, the hospital is understood to have made reasonable amounts of purchases of the prosthesis item at these different price levels in 2008/09. Most frequent purchases are highlighted in yellow. If a hospital is not highlighted for an item, we were not able to find that product in other hospital’s purchasing data.
Source: Study hospitals’ purchasing databases and direct advice to IPART. Hospitals were also asked to check prices.
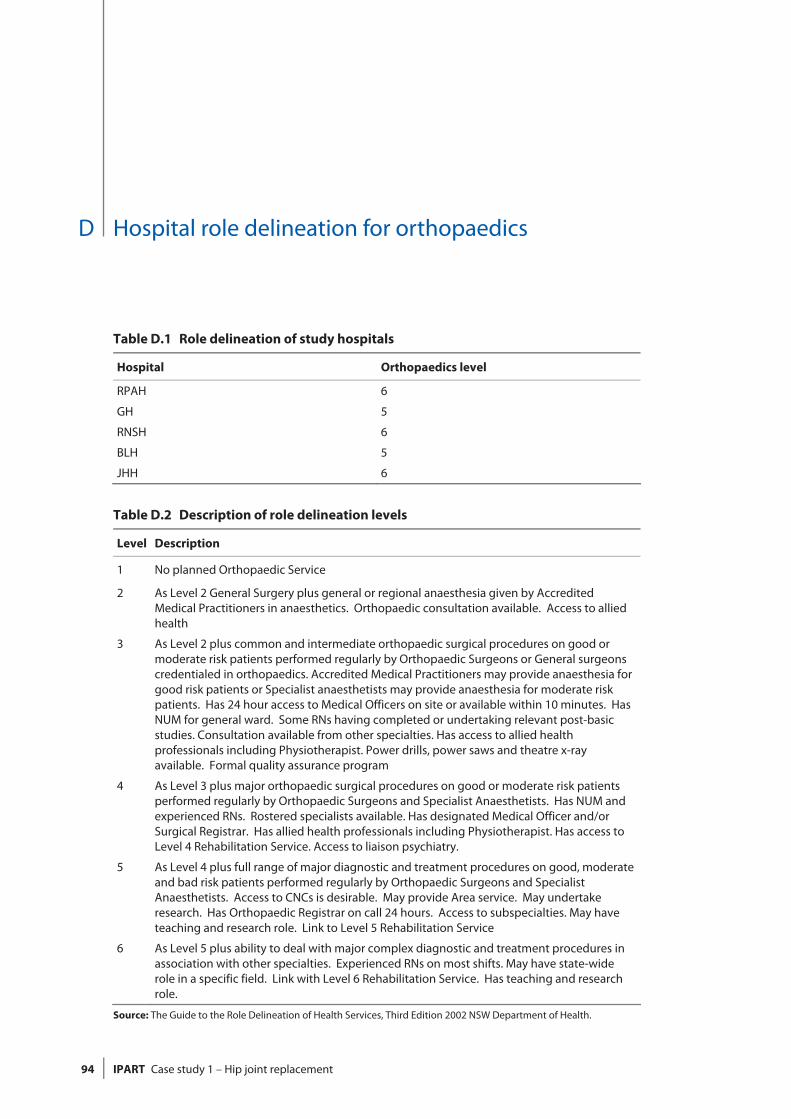
D Hospital role delineation for orthopaedics
94 IPART Case study 1 – Hip joint replacement
D Hospital role delineation for orthopaedics
Table D.1 Role delineation of study hospitals
Hospital Orthopaedics level
RPAH 6
GH 5
RNSH 6
BLH 5
JHH 6
Table D.2 Description of role delineation levels
Level Description
1 No planned Orthopaedic Service
2 As Level 2 General Surgery plus general or regional anaesthesia given by Accredited Medical Practitioners in anaesthetics. Orthopaedic consultation available. Access to allied health
3 As Level 2 plus common and intermediate orthopaedic surgical procedures on good or moderate risk patients performed regularly by Orthopaedic Surgeons or General surgeons credentialed in orthopaedics. Accredited Medical Practitioners may provide anaesthesia for good risk patients or Specialist anaesthetists may provide anaesthesia for moderate risk patients. Has 24 hour access to Medical Officers on site or available within 10 minutes. Has NUM for general ward. Some RNs having completed or undertaking relevant post-basic studies. Consultation available from other specialties. Has access to allied health professionals including Physiotherapist. Power drills, power saws and theatre x-ray available. Formal quality assurance program
4 As Level 3 plus major orthopaedic surgical procedures on good or moderate risk patients performed regularly by Orthopaedic Surgeons and Specialist Anaesthetists. Has NUM and experienced RNs. Rostered specialists available. Has designated Medical Officer and/or Surgical Registrar. Has allied health professionals including Physiotherapist. Has access to Level 4 Rehabilitation Service. Access to liaison psychiatry.
5 As Level 4 plus full range of major diagnostic and treatment procedures on good, moderate and bad risk patients performed regularly by Orthopaedic Surgeons and Specialist Anaesthetists. Access to CNCs is desirable. May provide Area service. May undertake research. Has Orthopaedic Registrar on call 24 hours. Access to subspecialties. May have teaching and research role. Link to Level 5 Rehabilitation Service
6 As Level 5 plus ability to deal with major complex diagnostic and treatment procedures in association with other specialties. Experienced RNs on most shifts. May have state-wide role in a specific field. Link with Level 6 Rehabilitation Service. Has teaching and research role.
Source: The Guide to the Role Delineation of Health Services, Third Edition 2002 NSW Department of Health.
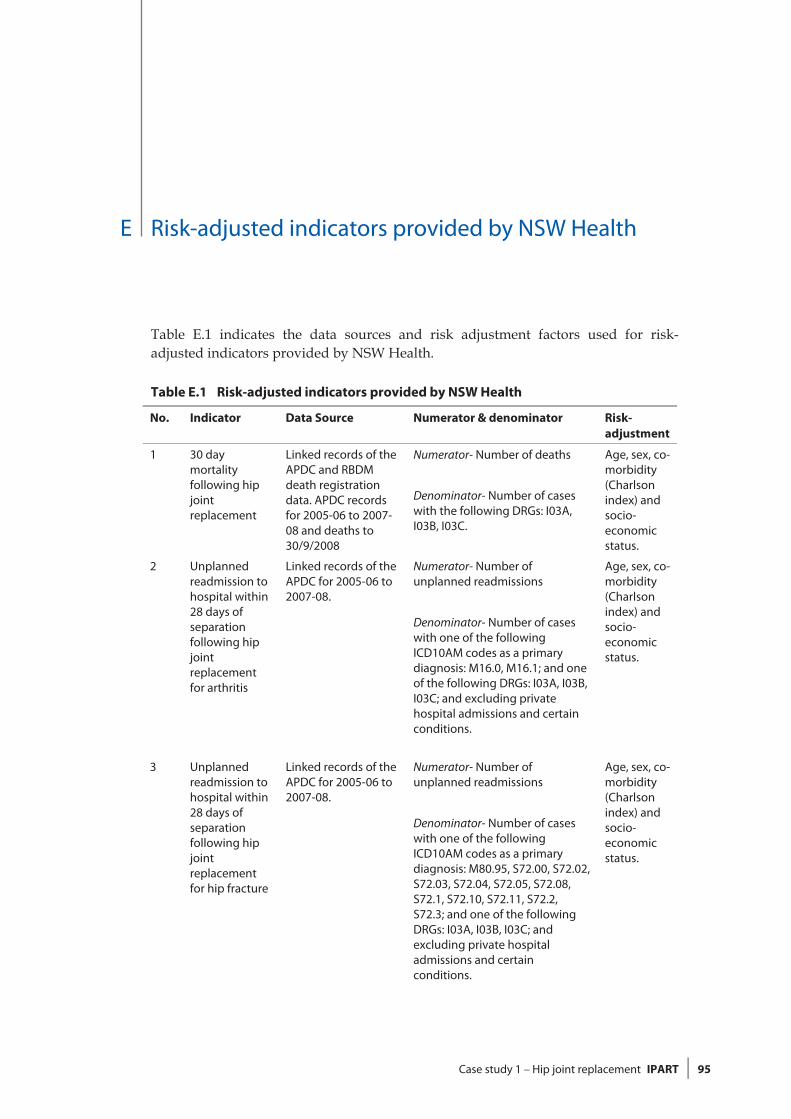
E Risk-adjusted indicators provided by NSW Health
Case study 1 – Hip joint replacement IPART 95
E Risk-adjusted indicators provided by NSW Health
Table E.1 indicates the data sources and risk adjustment factors used for risk-adjusted indicators provided by NSW Health.
Table E.1 Risk-adjusted indicators provided by NSW Health
No. Indicator Data Source Numerator & denominator Risk-adjustment
1 30 day mortality following hip joint replacement
Linked records of the APDC and RBDM death registration data. APDC records for 2005-06 to 2007-08 and deaths to 30/9/2008
Numerator- Number of deaths
Denominator- Number of cases with the following DRGs: I03A, I03B, I03C.
Age, sex, co-morbidity (Charlson index) and socio-economic status.
2 Unplanned readmission to hospital within 28 days of separation following hip joint replacement for arthritis
Linked records of the APDC for 2005-06 to 2007-08.
Numerator- Number of unplanned readmissions
Denominator- Number of cases with one of the following ICD10AM codes as a primary diagnosis: M16.0, M16.1; and one of the following DRGs: I03A, I03B, I03C; and excluding private hospital admissions and certain conditions.
Age, sex, co-morbidity (Charlson index) and socio-economic status.
3 Unplanned readmission to hospital within 28 days of separation following hip joint replacement for hip fracture
Linked records of the APDC for 2005-06 to 2007-08.
Numerator- Number of unplanned readmissions
Denominator- Number of cases with one of the following ICD10AM codes as a primary diagnosis: M80.95, S72.00, S72.02, S72.03, S72.04, S72.05, S72.08, S72.1, S72.10, S72.11, S72.2, S72.3; and one of the following DRGs: I03A, I03B, I03C; and excluding private hospital admissions and certain conditions.
Age, sex, co-morbidity (Charlson index) and socio-economic status.

E Risk-adjusted indicators provided by NSW Health
96 IPART Case study 1 – Hip joint replacement
No. Indicator Data Source Numerator & denominator Risk-adjustment
4 Wound infection
APDC 2006-07 to 2008-09
Numerator - Number of cases with a wound infection indicated by an ICD10-AM disease code in the following range: T81.41, T83.5, T83.6, T84.5, T84.6, T84.7.
Denominator-Number of cases with the following DRGs: I03A, I03B, I03C.
Age, sex, co-morbidity (Charlson index) and socio-economic status.
Note: APDC - NSW Admitted Patient Data Collection. RBDM - Registry of Births, Deaths and Marriages. A case represents a hospital admission for a specified condition. DRG - Diagnosis Related Group v 5.1. Charlson index (see Box 7.2). Socioeconomic status (see Box 7.2). Unplanned hospital readmissions (see Box 7.5)
Source: NSW Health.

Glossary
Case study 1 – Hip joint replacement IPART 97
Glossary
Term Abb. Definition
95% confidence interval
A statistical term describing a range of values within which we are 95% certain that the true population value lies.
Acetabular shell A prosthetic shell for the cup shaved cavity on the service of the hip bone that holds the femur (thigh) bone.
Activity-based funding
ABF Funding that is based on the projected amount and type of work of a facility, where standard prices are set for similar work undertaken. This has also been referred to as casemix or episode funding.
Acute care Clinical services provided to admitted or non-admitted patients, including managing labour, curing illness or treating injury, performing surgery, relieving symptoms and/or reducing the severity of illness or injury, and performing diagnostic and therapeutic procedures. Most patients have acute or temporary ailments. The average length of stay is relatively short.
Admission The process by which a person commences a period of residential care in a health facility.
Admitted Patient Data Collection
APDC A database that covers all inpatient separations (discharges, transfers and deaths) from all Public (including Psychiatric), Private, and Repatriation Hospitals, Private Day Procedures Centres and Public Nursing Homes in NSW.
Agency for Clinical Innovation
ACI A board-governed statutory health corporation that reports to the NSW Minister for Health and the Director-General of NSW Health.
Anaemia A reduced level of haemoglobin, the protein that carries oxygen in the red blood cells. It has many causes, including bleeding (loss of red blood cells), low production of red blood cells, and processes that damage them. It can cause paleness, tiredness and breathlessness.
Appendicectomy Surgical excision of the patient's appendix.
Arthritis A group of disorders in which there is inflammation of the joints, which can become stiff, painful, swollen or deformed. The two main types of arthritis are osteoarthritis and rheumatoid arthritis.
Assistant In Nursing AIN An employee who is not a registered nurse, enrolled nurse or trainee nurse, who assists the Enrolled Nurses and Registered Nurses by providing basic nursing care, working within a plan of care under the supervision and direction of a Registered Nurse.

Glossary
98 IPART Case study 1 – Hip joint replacement
Term Abb. Definition
Australian Council on Healthcare Standards
An independent organisation dedicated to improving the quality of health care through performance reviews, assessment and accreditation.
Australian Orthopaedic Association National Joint Replacement Registry
AOANJRR A specialist registry that defines, improves and maintains the quality of care of individuals receiving joint replacement surgery by collecting and analysing joint replacement data.
Average length of stay
ALOS The average number of days each admitted patient stays in hospital. This is calculated by dividing the total number of occupied bed days for the period by the number of actual separations in the period.
Bankstown-Lidcombe Hospital
BLH One of the study hospitals included in the review.
Bureau of Health Information
BHI An independent, board-governed organisation established by the NSW Government to be the leading source of information on the performance of the public health system in NSW.
Casemix The range and types of episodes of care of patients (the mix of cases) treated by a hospital. This provides a way of describing and comparing hospitals and other services for planning and managing health care. Casemix classifications put patients into DRGs with similar conditions that use similar health-care resources, so that the activity and cost-efficiency of different hospitals can be compared.
Casemix funding See Activity-based funding.
Cholecystectomy Excision of the gallbladder.
Clinical Excellence Commission
CEC A board-governed statutory health corporation with the CEO reporting directly to the NSW Minister for Health. A key role of the Clinical Excellence Commission is building capacity for quality and safety improvement in Health Services.
Clinical Nurse Specialist
CNS A Registered Nurse/Midwife who applies a high level of clinical nursing knowledge, experience and skills in providing complex nursing/midwifery care directed towards a specific area of practice, a defined population or defined service area, with minimum direct supervision.
Comorbidity When a person has two or more health problems at the same time.
Computed tomography
CT scan A non-invasive medical imaging method using X-rays and computer processing.
Deep incisional surgical site infections
Infection involving deep tissues such as fascia, muscle and organs.

Glossary
Case study 1 – Hip joint replacement IPART 99
Term Abb. Definition
Diagnosis Related Group
DRG A system used to classify hospital admissions into groups with similar clinical conditions (related diagnoses) and similar resource usage (hospital services). There are approximately 500 coding classes. In Australian acute hospitals, Australian refined DRGs are used (AR-DRGs). The classification categorises episodes into groups with similar conditions and similar usage of hospital resources, using information in the hospital morbidity record such as the diagnoses, procedures and demographic characteristics.
Enrolled Nurse EN A person holding an Enrolled Nurse qualification who works under the supervision of a Registered Nurse to provide nursing care for patients in hospitals, nursing homes and a variety of other health care organisations.
Episode funding See Activity-based funding.
Femoral head A prosthesis component replacing the top femur head that connects to the hip cavity.
Fluoroscopy An imaging technique that provides real-time moving images of the internal structures of a patient through the use of a fluoroscope.
Gosford Hospital GH One of the study hospitals included in the review.
Health Information Exchange
HIE A database maintained by the NSW Department of Health that contains a range of financial, patient and clinical information from hospitals and area health services.
Hip Stem A prosthetic component attached to the shaft of the femur bone to enhance stability.
Hysterectomy Surgical removal of the uterus.
Independent Pricing and Regulatory Tribunal of NSW
IPART The independent economic regulator for NSW that is undertaking this hospital study.
Inpatient fraction IFRAC A measure used in casemix costing. The proportion of total (or operating) costs that are attributed to admitted patients.
Institute of Rheumatology and Orthopaedics
IRO An orthopaedic surgery centre adjacent to the Royal Prince Alfred Hospital.
John Hunter Hospital
JHH One of the study hospitals included in the review.
Length of stay 1 LOS1 LOS1 is the episode length of stay in study hospital, ie, from the start of the episode to the end of the episode of care.
Length of stay 2 LOS2 LOS2 is the total length of stay in study hospital, ie, from admission to discharge at the study hospital.
Length of stay 3 LOS3 LOS3 is the total length of stay in study hospital plus up to 2 other hospitals - one transfer in and one transfer out.
Liner/insert A prosthesis component which fits inside the acetabular shell to allow smooth motion of the hip joint

Glossary
100 IPART Case study 1 – Hip joint replacement
Term Abb. Definition
Medical resonance imaging
MRI A medical imaging technique most commonly used in radiology to visualise detailed internal structures of the body using a magnetic field.
Medicare Benefits Schedule
MBS A listing of the Medicare services subsidised by the Australian Government.
National Hospital Cost Data Collection
NHCDC The NHCDC contains component costs per DRG based on patient-costed and cost-modelled information. The NHCDC enables DRG Cost Weights and average costs for DRGs for acute in-patients to be produced.
NSW Health The broad term encompassing operational and other structures including the NSW Department of Health, Area Health Services, the Agency for Clinical Innovation, the Clinical Excellence Commission and a range of clinical taskforces.
Odds ratio OR The odds of an event occurring. This is equal to the probability that the event occurs divided by the probability that it does not occur.
Orthopaedics A medical specialty dealing with bones and joints.
Osteoarthritis A chronic and common form of arthritis, affecting mostly the spine, hips, knees and hands. It first appears from the age of about 30 and is more common and severe with increasing age.
Principal referral hospital
Hospital within peer group (principal referral hospitals 1b) classified as an acute hospital, treating 25,000 or more acute casemix weighted separations per annum, with an average cost weight greater than 1 and 1 or fewer specialty services.
Principal tertiary referral hospital
Hospital within peer group (principal referral hospitals 1a) classified as an acute hospital, treating 25,000 or more acute casemix weighted separations per annum, with an average cost weight greater than 1 and having more than 1 specialty service.
Prophylaxis Disease prevention, also called preventive treatment.
Registered nurse RN A qualified nurse who provides care for patients in a variety of healthcare settings. These include public and private hospitals, community and home-based services, nursing homes and industry.
Royal Newcastle Centre
RNC The Royal Newcastle Centre is a health facility, which opened on Rankin Park campus next to John Hunter Hospital.
Royal North Shore Hospital
RNSH One of the study hospitals included in the review.
Royal Prince Alfred Hospital
RPAH One of the study hospitals included in the review.
Superficial incisional infections
Infection involving only skin and subcutaneous tissue.
Tracheostomy A surgical procedure to cut an opening into the trachea (windpipe) so that a tube can be inserted into the opening to assist breathing.

Glossary
Case study 1 – Hip joint replacement IPART 101
Term Abb. Definition
Venous Thrombo-embolism
VTE The process by which blood clots occur and travel through the veins. It is the collective term for deep vein thrombosis (the formation of a blood clot in one of the deep veins within the body, such as in the leg or pelvis) and pulmonary embolism (condition in which the arteries leading from the heart to the lungs becomes blocked).
