indepth™ for j2ee v8 technical brief -...
TRANSCRIPT

Symantec Technical Network White Paper
WH
ITE
PA
PE
R: A
PP
LIC
AT
ION
PE
RF
OR
MA
NC
E M
AN
AG
EM
EN
T
Indepth™ for J2EE v8
Technical Brief
Solving Performance Problems
Using Indepth for J2EE SmarTune™ Tim Isenhart Senior Principle Software Engineer Application Performance Management Group Michael Harding Senior Product Marketing Manager Application Performance Management Group
Content
Abstract................................................................................................................................................ 3
The challenge of Application Performance Management ................................................................ 3
Symantec Application Performance Management solution architecture....................................... 4
Symantec i3 for Web Applications...................................................................................................... 5
Key features and benefits of i3 for Web Applications .......................................................................... 5
Benefits of SmarTune within Indepth for J2EE .................................................................................... 6
Measuring and Managing Performance with Indepth for J2EE ....................................................... 7
Measuring a Baseline of Performance.................................................................................................. 7
Collecting Performance Data................................................................................................................ 8
Identifying Java Method Performance Contributors............................................................................ 9
Identifying Application Server Performance Contributors ................................................................10
Uncovering Method Details with Instrumentation Explorer and Adaptive Instrumentation ............12
Making Sense of Performance Measurement Details ........................................................................13
Automated Analysis of Performance Contributors by Technology Category ....................................16
Graphically Identifying Impacts of Performance............................................................................21
Advanced Analysis of Performance Using Packages and Methods Names .......................................23
Performance Contribution Categories of the Application Server ......................................................24
Customizing SmarTune displays ........................................................................................................27
Iterative Analysis for Evolving Applications .......................................................................................28
Infrastructure checklist ....................................................................................................................29
Application Servers.............................................................................................................................29
Operating Systems..............................................................................................................................29
Summary ............................................................................................................................................30
About the authors...............................................................................................................................31
Where to get more information ..........................................................................................................31
White Paper: Application Performance Management
Indepth™ for J2EE v8 Technical Brief Solving Performance Problems Using Indepth for
J2EE SmarTune™

Indepth™ for J2EE v8 Technical Brief
3
Abstract
Companies have a growing challenge to keep their business-critical applications running at peak
performance, and when they fail, potentially incur millions of dollars in losses. These complex
applications often include a J2EE tier. J2EE applications are complex systems and addressing
performance problems consumes an increasing amount of IT staff time. Symantec Indepth for
J2EE v8, a component of Symantec i3 for Web Applications, has improved the industry toolset by
providing SmarTune, an automated solution that increases the productivity of IT staff by
pinpointing J2EE performance problems, identifying their cause, and providing advice about
options available for their resolution.
The challenge of Application Performance Management
Organizations are more reliant on complex multi-tier applications than ever before in order to
conduct commerce, work with vendors and partners, and to communicate. Yet, serious
application problems occur daily in 15% of enterprises, and every week in 53% of enterprises1.
With the continuing evolution to online commerce, there will be more problems occurring as well
as more at stake for organizations.
At the core of the problem is growing application complexity. According to Forrester, “Many new
applications are actually the revamping or front-ending of old applications using J2EE application
servers, for example. The introduction of these technologies and the trends toward using service-
oriented architecture and Web services increase the complexity of applications, as the
dependency of enterprises on these applications is at least the same or increased.” 2
The cost of application performance problems and outages is significant, and drives the need for
Performance Management tools. Areas of cost include lost sales, lost customers, lost user
productivity and increased IT spend, along with less tangible impacts such as low user
satisfaction, inability to support new business, the business’s poor perception of IT and the
customer’s poor perception of the organization. For large enterprises doing much of their
critical business online and in real-time, such as Financial Services, Telecommunications and
Online retailing, the cost of application downtime can reach a million dollars per hour. Based on
Symantec sponsored research which estimates that 24% of IT time is spent troubleshooting, just
this payroll expense alone for the typical Global 2000 company, will equal $30 million annually.

Indepth™ for J2EE v8 Technical Brief
4
Symantec Application Performance Management solution architecture
Symantec Application Performance Management (APM) is an integrated offering that reduces the
costs of IT troubleshooting, lost revenues and lost end-user productivity. Symantec i3 is the core
component of the Symantec APM solution, which uses a real-user based performance
management approach. Symantec APM also includes Symantec Insight Inquire which takes a
synthetic approach for 24x7 active availability monitoring for business critical web applications,
along with Symantec Application Service Dashboard which integrates all your monitoring and
business performance metrics into user-relevant, consolidated portals.
Figure 1 Symantec APM suite is a comprehensive application management solution
ensuring the performance and availability of your most business-critical applications
Symantec Application Service Dashboard
Symantec Insight Inquire
Availability Monitoring
Symantec Application Service Dashboard
Symantec Insight Inquire
Availability Monitoring
Symantec Insight Inquire
Availability Monitoring
Symantec i3Performance Management
i3 for Databases - i3 for SQL Server, i3 for Oracle, i3 for Sybase, i3 for DB2
i3 for Web Applications - i3 for .NET, i3 for J2EE, i3 for Web Servers
i3 for ERP and CRM - i3 for SAP, i3 for Oracle Applications, i3 for PeopleSoft, i3 for Siebel
Symantec Storage Extensions – EMC, Hitachi, IBM, HP

Indepth™ for J2EE v8 Technical Brief
5
Symantec i3 for Web Applications
Symantec Indepth for J2EE is an underlying component of Symantec i³ for Web Applications. i³
for Web Applications is our comprehensive application performance management solution for
Web 2.0 and Service Oriented Architecture (SOA) applications that helps you detect,
communicate, and correct performance problems in an application before your business is
affected. Symantec i³ for Web Applications addresses the need to optimize application
performance during the development, testing, and production phases of the application lifecycle
and can be shared by all stakeholders involved. Whether your Web application is running on
JavaTM Enterprise Edition (Java EE) application servers or Microsoft® .NET, i³ uses optimized
collectors to gather performance and availability data. In addition, it provides visibility into
interactions between Web clients and Web servers.
Key features and benefits of i3 for Web Applications
• Review current and historical performance data from Web clients, Web servers,
Microsoft .NET, or Java EE
• Correlate activity across Web servers, multiple application servers, and databases
• Take advantage of SmarTune technology, which automatically drills down, analyzes, and
provides expert advice
• Use flexible instrumentation to automatically discover and instrument application
components to maximize visibility and minimize overhead
• Understand response time contributions from various application components:
o .NET: ASP.NET, ADO.NET, Web services, XML, Windows Forms, .NET Remoting
o Java EE: JavaServer Pages (JSP), Java Servlets, Java Database Connectivity
(JDBC), Enterprise JavaBeans (EJB), Java Message Service (JMS), XML, Web
services
• Correlate statistics from the Web server and the operating system
• Visually manage the health of Web applications by monitoring memory, CPU, threads
• Quickly isolate SQL statements generated by Web applications that are causing
problems, and then continue performance analysis in the database using Symantec i3
for Databases and Storage
• Build a dashboard view specific to administrator role (Java EE, .NET, or Web admin)
• Get an executive view of application health via the dashboard
• Visually manage Service Level Agreement (SLA) compliance per instance, service
request, or business transaction

Indepth™ for J2EE v8 Technical Brief
6
• Monitor and measure Web services in SOA environments
• Help ensure that the presentation and business logic layers of the application are
performing to service level expectations
• Isolate and focus on business-critical transactions
Figure 2 Symantec i3 for Web Applications includes Indepth for J2EE with its web-based GUI dashboard
that quickly and efficiently communicates performance problems within your J2EE environment.
Benefits of SmarTune within Indepth for J2EE
Indepth for J2EE boosts productivity with respect to identifying and solving J2EE application
performance problems. The SmarTune feature within Indepth for J2EE helps automate
performance analysis and focuses tuning efforts on the most significant performance
contributors.
Indepth for J2EE has been developed to minimize monitoring overhead to the point that it may be
used effectively within QA or production environments. Indepth for J2EE collects and stores
performance data that SmarTune uses to automatically identify the bottlenecks affecting user
service requests, other threads, individual methods, or application server runtime efficiency.

Indepth™ for J2EE v8 Technical Brief
7
Measuring and Managing Performance with Indepth for J2EE
IT Organizations face a daunting challenge in maintaining the peak performance of complex,
multi-tier applications, and a key link is the middleware-tier Java application server. Application
administrators need specialized data collection and analysis capabilities to make sure that new
J2EE applications scale properly and meet service level expectations. The following sections
portray a performance scenario along with a step-by-step, best-practice approach to identifying
and addressing performance bottlenecks, using Indepth for J2EE.
Measuring a Baseline of Performance
A good approach for performance management starts with a plan that includes proactive
performance testing of J2EE application software at one or more stages of development prior to
deployment, as well as on-going performance monitoring and testing throughout the application
life cycle. A typical plan includes staff and their roles, machine resources, application
transactions to be measured, and on-going performance goals. An example of a performance
goal is that the dynamic content for a specific online catalog transaction should complete loading
in less than 500 milliseconds with 20 concurrent users.
A good rule of thumb is to use a load test tool to execute performance tests that drive the
application with a consistent and repeatable load. The repeatable load allows transaction
performance to be compared from one test to the next. The test transaction mix should be
representative of typical user behavior, transaction types, frequency and concurrency. If you
measure a transaction one day, and the application environment doesn’t change, then the
performance should be similar the next day. Useful and currently free tools that you can use to
accomplish this include: JMeter, an HTTP load test tool from the Apache project
(http://jakarta.apache.org/jmeter/) and JUnit, a unit test development tool (http://junit.org)
and its extensions like HttpUnit and DBUnit, that allow you to build repeatable test scenarios for
application functionality.

Indepth™ for J2EE v8 Technical Brief
8
Collecting Performance Data
Indepth for J2EE monitors the performance of J2EE applications using in-memory byte-code
instrumentation and collects Java method invocation counts, response time, CPU time, Lock wait
time, and SQL statements, in real-time. Additionally, Indepth for J2EE collects other useful data
like Java object and Array memory leaks, URL parameters, Java method arguments, Heap
memory usage and JMX statistics.
Indepth for J2EE correlates the monitored Java methods into method invocation tree structures
where the tree branches are unique call paths to one or more methods. The invocation tree
allows Java method performance to be analyzed for each unique call path.
Figure 3, below, is an illustration of three Java invocation trees, with the trees showing Java
methods calling other Java methods. Each level of an invocation tree viewed from left to right
allows the caller response time to be decomposed by more detailed calls.
Figure 3
Example method invocation trees with top-level methods (roots) shown on the left and detailed methods (leaves) on the right.
This figure visualizes Response Time.
The top-level methods shown on the left of Figure 3 (e.g. worker threads or HTTP service request
invocations) are the entry points into the application and are the coarsest measurement of the
user experience. These are shown as the root of their invocation tree. As you follow the
invocation tree, the branches emanating from the top-level method lead you to the underlying
methods that account for the application time.

Indepth™ for J2EE v8 Technical Brief
9
A method located within an invocation tree accounts for all the time required to execute the
methods that it directly or indirectly invokes, and in Figure 3 the methods on the left account for
all the time to invoke the connected nodes on the right. The ends of the call paths are leaves of
the invocation trees and are the smallest invocation detail available. A method may be invoked
from many locations in the call tree. For example, a JDBC method executeQuery may be invoked
from several call paths in the application and Indepth for J2EE will monitor each executeQuery
invocation and collect data for each call in the path. The call paths are very valuable, for
example, to identify relatively few methods that are responsible for the majority of application
time. Fortunately, Indepth for J2EE SmarTune automates the call path analysis and finds every
occurrence of the methods that are significant performance contributors. You can even set the
minimum contribution threshold to ignore methods that contribute less than your desired target
(3% by default).
Many Application Servers provide a huge amount of information about server configuration and
runtime status using Java Management Extensions (JMX). JMX technology provides a standard
mechanism for the application server to store management information in objects called Mbeans
and allow it to be remotely accessible. The JMX statistics are collected by Indepth for J2EE,
correlated to the current time frame, and persisted to the database. The statistics are very
valuable to compare with other performance metrics of the application. SmarTune Application
Summary will automatically analyze 40 JMX Statistics and provide critical feedback if your
statistics cross targeted thresholds.
Identifying Java Method Performance Contributors
To analyze Java application performance we typically look at Java method Response Time and
CPU Time, call counts, Memory leaks and heap statistics, and Application Server JMX Statistics.
Response time is the time is takes to execute a Java method and is comprised of time executing
local calls, or time spent waiting for calls to other tiers or locks. CPU time is the processing time
needed to execute the method’s tasks and does not include time spent waiting. Lock time is wait
time to enter a critical (synchronized) section of code or acquire an exclusive access lock on a
Java object. Lock access time is displayed like a separate call to a Java method that has a call
path and response time.

Indepth™ for J2EE v8 Technical Brief
10
Analysis of the application call paths is useful to find significant performance contributors to
specific methods but it hides more pervasive application-wide performance contributors. To
identify application-wide contributors, SmarTune aggregates the total contributions of all
similarly named methods, ignoring recursion in certain cases, and compares the method
aggregates to the total application time to identify the overall contributions of many calls spread
throughout the application.
For example, consider an application where there are 10 top-level service requests and 2% of
each service request response time is spent in XML parsing. When looking at a single service
request, the parse() method at 2% would not appear be a significant performance contributor.
However, when considered over all 10 service requests, the parse() time is 20% of the
application’s time, so it deserves closer scrutiny.
Indepth for J2EE SmarTune automates analysis of specific paths as well as overall application
contributors. In the SmarTune Contributors by Category page it categorizes the application
methods as one of 22 Java technologies and displays context specific descriptions and tuning
advice about each technology category.
Identifying Application Server Performance Contributors
The application server provides many resources to the application such as thread pools, JDBC
and JCA connection pools, and JMS implementations, to name a few. The Java methods that
access those resources may be significant performance contributors. For example,
getConnection() obtains a connection from a JCA connection pool. Let’s say getConnection()
response time is not near zero, it may indicate a problem with the available capacity of the
connection pool. Furthermore, the SmarTune Application Summary page displays the available
capacity of each pool and shows severe alerts next to those pools with low available capacity.
SmarTune allows you to correlate the status of application server resources with Java method
performance.

Indepth™ for J2EE v8 Technical Brief
11
Java memory leaks may become a significant performance contributor. The Java Garbage
Collector typically allows unreferenced objects (garbage) to accumulate before reclaiming the
objects in an operation called Garbage Collection. An accumulation of referenced objects, that
are no-longer used, may become a leak. Leaks will eventually cause the application to fail when
new memory requirements can no longer be met. The Leak Seeker feature of Indepth for J2EE
analyzes the top accumulations of referenced Java Objects, Collections, StringBuffers, and Array
allocations and records their stack trace. You can analyze the accumulated size and allocation
trend of leaked objects and determine if they present a problem. However, if the free heap is
shrinking and leaks are increasing then it will likely become a catastrophic problem when the free
heap is exhausted. The SmarTune Application Summary page analyzes the Max Free Heap trend
and will display a red alert icon if the free heap falls below 10%
Inefficient memory usage may become a significant performance contributor when many objects
are created, and discarded, and the cycling causes the garbage collector to analyze the
fragmented heap with increased frequency. When the garbage is collected it may be incremental
or a major collection. Incremental garbage collection takes very little time but major garbage
collections pause the JVM’s threads during the garbage collection process. Your application may
benefit from tuning the JVM heap size or garbage collection parameters to collect incremental
garbage more frequently rather than rely on long running major garbage collections. Your
application may benefit by investigating caching strategies that generate less garbage by caching
frequently used objects. The SmarTune Application Summary page analyzes the Garbage
Collection Time and will display a red alert icon if the total Garbage Collection Time is over 1%.
SmarTune automates analysis of application server resource statistics from today’s leading
Application servers. The statistics are compared against recommended values and the analysis
results are displayed with application server-specific tuning advice, as well as a red alert icon if
the recommended threshold is exceeded.

Indepth™ for J2EE v8 Technical Brief
12
Uncovering Method Details with Instrumentation Explorer and Adaptive
Instrumentation
Indepth for J2EE instruments a default set of well-known method APIs in order to limit overhead
incurred. The default methods typically allow a good view of performance details. In most cases,
when the instrumented APIs show significant work time, an application has been constructed
with user-defined code called from the instrumented APIs. When code is called that is not
instrumented, its time is displayed as Work Time. SmarTune then automatically finds and
displays the methods with significant work time in the Application Methods category of the
Contributor by Category page. This custom code can then be instrumented to uncover the
performance details of the work time. Indepth for J2EE contains two tools to discover and
instrument more method details: Instrumentation Explorer and Adaptive Instrumentation.
Instrumentation Explorer may be used to instrument additional methods that are not part of the
default set of instrumented APIs. If you locate a method with work time you may open
Instrumentation Explorer to investigate and instrument that method’s calls. Instrumentation
Explorer allows you to investigate all method’s calls and compare their response time and
invocation counts. You can select additional calls to instrument, click Apply, and the
instrumentation will be enabled and persisted for those calls that you selected .
Adaptive Instrumentation automates the Instrumentation Explorer’s manual processes by
traversing the instrumentation call paths and automatically instrumenting all methods and calls
with significant performance contributions. Adaptive Instrumentation requires you to execute
application activity during a data collection period (i.e. running a load test on your application)
while it measures the significant call paths. Then it uses sophisticated rules to instrument
additional application entry methods and long response time paths, and removes
instrumentation that exceeds the overhead budget. You select a response time overhead budget
and data collection duration and Adaptive Instrumentation tracks as many methods as possible
to stay within the overhead budget.

Indepth™ for J2EE v8 Technical Brief
13
Making Sense of Performance Measurement Details
Indepth for J2EE has “workspaces” that allow you to select metrics to analyze. The metrics can
include invocation frequency, time, availability, memory and JMX metrics.
The traditional examination of just selecting and monitoring a few performance indicators is no
longer sufficient for modern complex application performance management. For example,
‘average response time’ is a metric that is often tracked, with the definition being the total
method response time divided by the number of invocations. Though interesting, just looking at
this one stat can hide the fact that short running methods may be called too often or that a few
methods are taking a relatively long time to run (i.e. skewed distribution).
SmarTune focuses on Java method total time contributions. Total response time is the average
time multiplied by the invocation frequency and includes two metrics, the response time and the
number of invocations. The benefit of this more data-rich approach is that total response time
and CPU time allows us to compare the total time for many short calls and fewer longer calls.
Figure 4 Example method invocation tree with execution times (T).

Indepth™ for J2EE v8 Technical Brief
14
The invocation tree in the previous diagram, Figure 4, displays total response time metrics (T).
Invocation trees are used to pinpoint the largest performance contributor to Servlet A, such as in
this example. We can see 80% of Servlet A’s response time is inside the call to JSP C whose
largest contributor is the call to XML F at 40% (actually two calls made to F). A cursory reading
would put Servlet A’s largest contributor as JSP C, but actually C itself only contributes 10% of
the work time to A. Most of the time comprised within C’s time is the result of call F. We have to
be careful not to count F twice because total response time cannot be summed along the call
path or else it becomes double counted. In order to automate this analysis, a lot of operations
must occur to find the largest performance contributor.
Table 1 Work Time analysis of methods shown in Figure 4
Contributors to Servlet A Work Time
XML F (call 2) 300 ms
XML F (call 1) 100 ms
JDBC H 200 ms
Servlet A 100 ms
JSP C 100 ms
EJB G 100 ms
Custom D 50 ms
XML E 50 ms
JSP B 0 ms
TOTAL Time 1000 ms
Another way to make sense of performance measurement is to consider Work Time. Work time is
the time unaccounted for by instrumentation and is derived by subtracting from a given method
call, the execution time or times of the adjoining method call(s) further along that branch. The
work time of the methods in Figure 4 are shown in Table 1. By calculating the total work time for
each method, and sorting the values in descending order, we can see the call to XML F is at the
top of Table 1 and the most significant contributor to Servlet A performance. This contribution is
calculated as 40%, or (XML F 400ms) / (Servlet A 1000ms). Work time can be summed along the
call path without regard to double counting. Notice the total of 1000 ms in Table 1 is the same as
the Servlet A time in Figure 4.

Indepth™ for J2EE v8 Technical Brief
15
Figure 5 Example method invocation tree showing Response Work Time.
Figures 3 and 5, which show invocation trees, are color coded. By incorporating the dimensions
of performance time contribution as we just reviewed, these colors can be used to represent the
percentages of the total application time. In this case, the red nodes contribute over 15% to the
application, yellow nodes over 7.5%, green nodes over 1% and grey just over 0.9%. The effect
enables an easy-to-comprehend visualization of method time contribution as the call paths
progress from left to right. There is a key advantage to the work time approach, however.
Figure 5 shows the same application as Figure 3, but Figure 5 displays Work time percentages
and indicates the highest response work time contributors to the application in red (i.e. as a root
and leaf on the tree). This visualization similarly applies to the contributions of XML F in Figure 4
where F would be displayed as a red node on the right side of Servlet A’s invocation tree. The
Work Time analysis, however, leads us directly to the significant consumers and avoids
invocation complexities of the data inherent to using response time.
SmarTune allows you to easily select Response Time, Response Work Time, CPU time, or CPU
Work Time to give the user flexibility in targeting and analyzing performance contributors.

Indepth™ for J2EE v8 Technical Brief
16
Automated Analysis of Performance Contributors by Technology Category
The SmarTune Workspace default view is the Contributors by Category page, shown in Figure 6,
below. This view automatically analyzes all the method invocations for the current context and
for the selected time frame. Each monitored method is compared to a list of Java technologies
and categorized by the technology matching the method’s name, class, and package as well as
the JVM vendor. This categorization allows SmarTune to customize the display for specific
methods while saving the user from the arduous task of mentally categorizing the methods. This
page is very useful for analyzing a new application because the automatic categorization lets you
quickly see the types of technology used by the application. If there are no matches for a
category, the page displays “no contributors found”. This page displays only the categories that
contribute more than the minimum contribution percentage in order to remove noise, and keep
the focus on just the significant contributors. In the case of the output shown in Figure 6, the %
Response Time contribution threshold is set to 3%.
Analyzed categories include: JDBC Connection Pool, SQL, JDBC, EJB, JNDI, HTTP Sessions, XML,
JMS, Java Transactions, Java IO, Web Services, Synchronized/Lock, and custom code Application
methods. Additionally, there are vendor-specific EJB lifecycle categories for WebLogic,
WebSphere and Oracle application servers.
Figure 6 Example of Contributors by Category page, showing significant Response Time contributors.

Indepth™ for J2EE v8 Technical Brief
17
In Figure 6, on the previous page, the technology categories are listed by their total percentage
contribution to performance and individual matched methods are listed by their contributions.
The top entry shows that 33 JDBC Connection Pool contributors are responsible for 44.5% of the
response time. We can see other significant contributors such as EJB, JNDI, and custom
application methods work time. Without knowing much about the application we can easily see
that JDBC Pool access is a large contributor. If we select the longest method, indicated by the
hyperlink com.ibm.eis.cm.JDBC1PhaseRF.getConnection(), a more detailed page is then
displayed, Contributor by Category Details, as shown in Figure 7 below.
Figure 7 Example of Contributor by Category Details page, showing JDBC Connection Pool response time.
The Contributor by Category Details page identifies the selected contributor and its technology
details. In this illustrated case, the identified performance problem is that the DB Connection
Pool is too small and this Contributor description is followed by related expert advice on
improving application performance. The advice itself describes the technology and issue in
detail, along with prescribed tuning activities. In this case the advice states that getConnection()
time should be zero and if it is not zero then the application is waiting to get a database
connection. If the concurrent load in the system causes more connections to be requested than
the pool contains, then the application will wait for an idle connection, resulting in the
performance problem.
Indepth™ for J2EE v8 Technical Brief
18
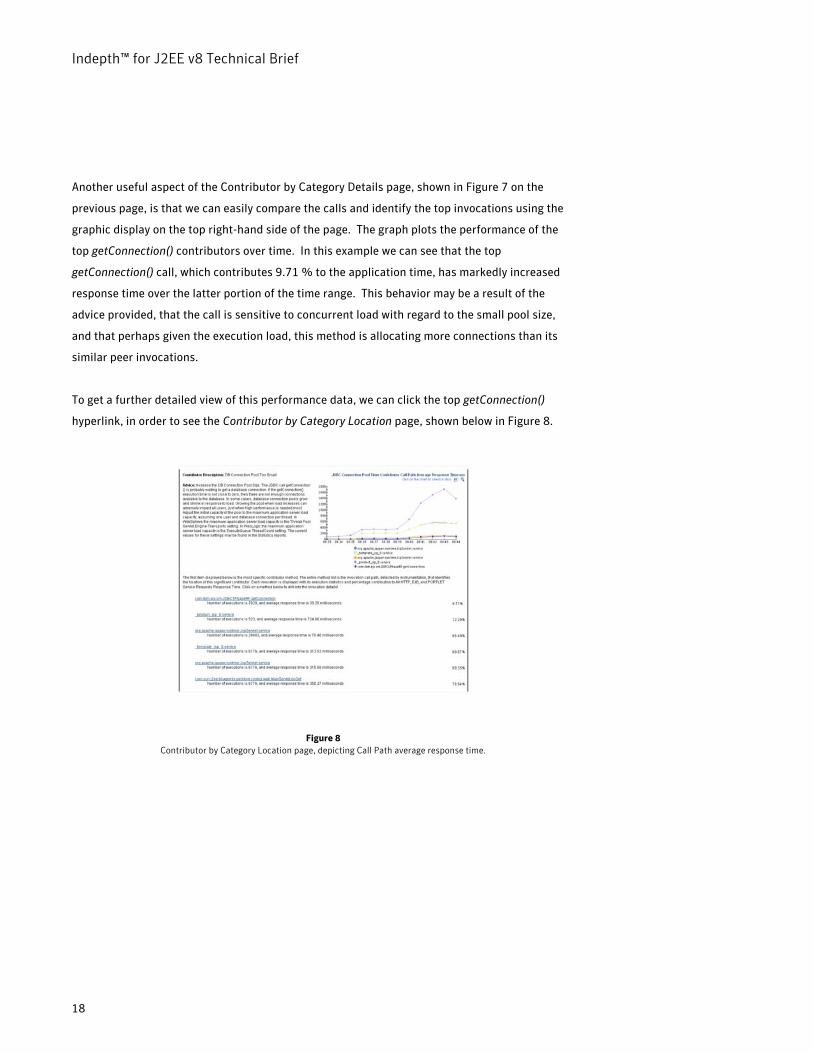
Another useful aspect of the Contributor by Category Details page, shown in Figure 7 on the
previous page, is that we can easily compare the calls and identify the top invocations using the
graphic display on the top right-hand side of the page. The graph plots the performance of the
top getConnection() contributors over time. In this example we can see that the top
getConnection() call, which contributes 9.71 % to the application time, has markedly increased
response time over the latter portion of the time range. This behavior may be a result of the
advice provided, that the call is sensitive to concurrent load with regard to the small pool size,
and that perhaps given the execution load, this method is allocating more connections than its
similar peer invocations.
To get a further detailed view of this performance data, we can click the top getConnection()
hyperlink, in order to see the Contributor by Category Location page, shown below in Figure 8.
Figure 8 Contributor by Category Location page, depicting Call Path average response time.

Indepth™ for J2EE v8 Technical Brief
19
The Contributor by Category Location page displays the instrumented call path of the selected
contributor. We previously learned that getConnection() is the longest total contributor at 9.71%
of the application time. Now looking at this report, shown in Figure 8 on the previous page,we
get the view “down the path” to the contributing callers. In this case, the graph on the top-right
quickly shows that the largest contributor is an application specific method product_jsp. It’s also
spelled out within the text, showing an average response time of 724 .66 milliseconds. The
remainder of the path is infrastructure. The description and advice confirm the connection pool is
too small with respect to concurrent load and for comparison, the Concurrent Active Threads
(CATs) page in the Activity workspace shows a large increase in concurrent load, Figure 9 below,
correlating exactly with the increase in getConnection() response time.
Figure 9 Example of HTTP Response Time, Concurrent Active Threads and HTTP Throughput
The Activity charts in Figure 9 above confirm that the HTTP Response time increases as the
Concurrent Active Threads (i.e. user request load) shown in the middle, increase. Throughput,
the chart on the far right, is constant as more work arrives, so it appears response time increases
only as load increases.
Now let’s switch to the DB Pool status reports found with the Indepth for J2EE Statistics
Workspace, shown on the next page, in Figure 10. In this view, we see, on the left side, that the
DB Pool is maxed for the same period that has long response times. And on the right-hand chart,
the Pool Size is 3. In figure 9, we learned the Concurrent Load is 8 threads, so if product_jsp used
1 connection per user, then 5 threads may wait for a connection. In this case, following the
advice to increase the Pool Size to 8 will allow more connections to service the load, and thus
solves our problem.

Indepth™ for J2EE v8 Technical Brief
20
Figure 10 DB Connection pool percent used and pool size.
The connection pool size may be easily changed by an operator without involving the
development team.
Our findings also point to a programmatic solution to the problem. The Contributor by Category
Location report, shown back in Figure 8, displayed getConnection() executions at 7,828 and
_product_jsp executions at 523. You can derive that about 15 (7,828 ÷ 523) connections are used
by each _product_jsp execution. So another solution is that the application developers could
cache results or in some way improve the efficiency of database usage, in order to save the need
for so many database connections to be allocated to the pool.
This scenario illustrated how SmarTune and its technology-specific categories are a valuable
guide to solving performance problems. SmarTune categorization portrays complex data in a
simple, yet effective way. It provides insight into significant method usage, and the related
description and advice provides guidance on what to next. You may add SmarTune Contributors
by Category results as a portlet in the Dashboard Workspace to help as a lookout for performance
problems.

Indepth™ for J2EE v8 Technical Brief
21
Graphically Identifying Impacts of Performance
The Method Call Graph view of the SmarTune Workspace allows us to visualize the invocation
performance metrics as a color coded hierarchical graph. In essence, this is a heat matrix for
application call paths. This view makes it easier to communicate about the instrumented
application and the impacts of performance, because it analyzes all the significant method
invocations for the current context within a selected time frame. The call graph, shown in Figure
11 below, is a response time graph for the same period analyzed in our just-completed
performance scenario. By default, the red colored nodes contribute over 15% to the application,
yellow nodes over 7.5%, and green nodes over 1% and grey over 0.9% (these percentages are
adjustable in the Settings page). The methods whose percentage does not meet the grey setting
threshold are hidden from view, with the exception being work time graphs where the call path to
significant nodes may be all gray.
Figure 11 Methods Call Graph displaying Response Time – with
Focus view, Full view, Method Details and Find Invocations panels.
In figure 11, the large Focus View panel on the left allows you to see a full size area of the graph
and displays method names and contribution statistics. The nodes are methods and the edges
are invocation relationships between the methods. The Response time graph shows the
percentage contribution of each call in the application along the lines.

Indepth™ for J2EE v8 Technical Brief
22
The Work Time graph, Figure 12 below, displays the percentage of work time found in each
method by annotating the nodes. You can pan the Focus View or click the Full View to move the
focus. Clicking a node in the Focus View shows the Method Details, and you can search for
methods in the graph using the Find panel on the bottom right.
Figure 12 Work Time graph example.
This work time graph example identifies the top contributing method work time as the yellow
filled getConnection() method, contributing 9%. The graph makes it easy to visually identify the
same significant node as we discovered in the Contributors by Category page earlier in the paper.
The Find tool sorts the nodes either by their measurement or name. In this case, the
measurement values are sorted, with getConnection() shown at the top.

Indepth™ for J2EE v8 Technical Brief
23
Advanced Analysis of Performance Using Packages and Methods Names
The SmarTune Workspace Method Hotspots view, shown below in Figure 13, is designed for users
who wish to see all the methods executed in their application for the current context within a
selected time frame. It displays the methods names and a variety of measurements.
Figure 13 Example of a Method HotSpots page displaying Response Work Time %.
You can see the getConnection() method has the top work time, with its low CPU Bound %
measurement indicating it is mostly waiting and not executing. When you select the methods in
the Method Hotspots page, you can drill down to the Contributor Details and Location pages
discussed in the previous sections.
The column headers in this page may be clicked to sort the methods by that metric. This example
shows results by Response Work Time %. Available HotSpot measurements are shown below.
Table 2 Method HotSpots measurements
Method HotSpots measurements Work Time
Total time % Response Time, Response Work Time, CPU Time, and CPU Work Time
Total invocation count Accumulated total number of invocations of this method for all call paths
Average response time Mean response time for each invocation
Average CPU time Mean CPU time for each invocation
CPU Bound % Percentage of response time spent running on the CPU; higher number indicates more processing time and less wait time
Number of invocation contexts Number of unique call paths of the invocation

Indepth™ for J2EE v8 Technical Brief
24
Performance Contribution Categories of the Application Server
The SmarTune Workspace Application Summary View is the page designed to pinpoint
Application Server resource constraints. The Application Summary page intelligently analyzes
Concurrent Load, Memory and Garbage Collection time for all application servers. Depending on
the application server version, there are additional pre-built categories for version specific JMX
statistics. A sample of the WebLogic 9.1 metrics is shown in Figure 14.
Figure 14 Example Application Summary page for WebLogic 9.1
The Application Summary categories are listed with the most severe performance-impacting
findings reported at the top of the page with red icons. A “severe” finding is one where the
analyzed metric is out of range, which is to say the value is greater or less than the built-in
recommended threshold value. Category statistics that are within the recommended range are
listed with a green checkmark icon. Categories where the statistics are not collected are listed as
“status unknown” in blue. In our severe example above, the report is showing that the
percentage of Idle Threads in the weblogic.socket.Muxer ExecuteQueue is below 20% of the
capacity (i.e. it is depleted to zero). Clicking the ExecuteQueue Idle Threads Shortage hyperlink
allows us to see more technology specific details about the observation, shown in Application
Summary Details on the following page.

Indepth™ for J2EE v8 Technical Brief
25
The Application Summary Details page provides analytical information related to an Application
Summary category. In Figure 15 below, the observation compares a recommended value, in this
case 20%, to the percentage of idle threads in the pool. The graph on the right shows the metric
values over time, plotting the total count of threads (blue line) at 2 and the current idle count
(green line) at 0. Hypothetically, if the current idle count was 1 and the total count of threads is 2
then the percent idle threads would be 50% and this category would not be listed as a problem.
Figure 15 Example Application Summary Details page for an ExecuteQueue Idle Threads Shortage
The Execute Thread capacity used or idle threads categories are very similar to the DB and JCA
Connection Pool categories and both are available for most application servers. In general, most
categories either compare a single statistic against a recommended value (e.g. some statistic
greater than zero) or allow the comparison of a capacity value (e.g. capacity used greater than
80%). The default recommended values are general rules of thumb and can be reconfigured if
desired for some implementations. The pre-built categories included by default are listed in
Table 3, below.
Table 3 Application Summary Categories by Application Server version

Indepth™ for J2EE v8 Technical Brief
26
Some categories are specialized. For example, the Garbage Collection time category computes
the time spent collecting garbage and compares it to the elapsed time displayed. If Garbage
Collections blocks the application more than 1% (default setting) of the elapsed time, then the
Garbage Collection may be a severe problem. Figure 16 below, shows Garbage Collection details
for an application with over 4% of its time spent collecting garbage.
Figure 16 Example Application Summary Details page
for excessive Garbage Collection time
The Concurrent Active Threads category computes a trend line of the concurrent active threads
count and compares the slope of the trend with a recommended slope of 0.1. If the load is flat or
decreasing, then the severity is green, yet if the trend begins increasing by over 10%, the
category will be denoted as a potentially severe problem. Figure 17 below shows the Concurrent
Active Threads category details for the application scenario described in the previous
Contributors By Category section of our performance scenario.
Figure 17 Example Application Summary Details page
for Concurrent Active Threads Increasing
Indepth™ for J2EE v8 Technical Brief
27
Customizing SmarTune displays
The Indepth for J2EE user can add the SmarTune Application Summary results as a portlet in the
Dashboard Workspace to help as a lookout for performance problems. You can also extend the
Application Summary analysis by adding your own categories for other JMX statistics that
interest you and by doing so allow the Application Summary analysis to become an indispensable
part of your performance monitoring plan of action.
The SmarTune Workspace Contributors By Category and Application Summary pages allow you to
add new categories to the analysis or customize the existing categories. The SmarTune settings
page allows both pages’ categories to be enabled or disabled as needed.
You may create custom statistics categories for the Application Summary page that specify: the
server vendor and version, the JMX statistics to compare and display in the chart, the comparison
operation (i.e. greater than or less than), as well as the recommended operation result. When the
observed result fails to meet the recommendation, a red severity is displayed, otherwise it will
show as green. The description and advice are completely customizable and accept Unicode
characters for non-English locales. Advice can be highly customized to include such things as
phone numbers and contact information.
The SmarTune settings page allows the minimum contribution percentage to be changed.
Changing this threshold setting will expand or contract the number of methods displayed in the
Contributors by Category page. The Method Call Graph percentages used to determine node
colors may be customized to assist for easy identification of significant method contributors.

Indepth™ for J2EE v8 Technical Brief
28
Iterative Analysis for Evolving Applications
The SmarTune Workspace provides a set of tools to analyze Java method and Application Server
contributors. SmarTune is typically used either in a regression testing approach to compare
performance of revisions of application code, or as an iterative troubleshooting tool to identify
problematic application configurations.
To assist with regression analysis, you may label a time range with a descriptive name and save it
to be loaded and referenced as needed for comparison with other time frames or against current
performance. Regression analysis involves running a consistent and repeatable load against the
application so you can compare the code performance consistently across revisions.
In troubleshooting mode, the easiest place to start is the Contributors By Category page and look
for significant contributors during the time frame. Iterate though the list of categories and
investigate the largest contributors first, so you spend your time focusing on the contributors
with the largest performance impact. Visually correlate Statistics and Activity information to
investigate complex scenarios to identify multiple factors involving concurrent load, memory
usage, and application configuration statistics. Often, long running Java methods are identified
that the application developers may not have anticipated taking so long. In many cases,
performance problems occur because of simple configuration issues and doing something like
increasing a pool size or available memory can have immediate and quantifiable results.
Indepth™ for J2EE v8 Technical Brief
29
Infrastructure checklist
Indepth for J2EE manages the performance of the following Application servers, on the following
operating system platforms:
Application Servers
• BEA WebLogic
• IBM WebSphere
• Oracle 9iAS, 10gAS
• JBoss
• Tomcat
• Macromedia JRun
• Sun iPlanet
• Sun Java Enterprise System (JES)
• ATG Dynamo
• Resin
• JEUS
Operating Systems
• Microsoft Windows
• Sun Solaris
• IBM AIX
• HP-UX
• Linux on Intel-based systems
Indepth™ for J2EE v8 Technical Brief
30
Summary
J2EE represents a complex environment often found within business-critical, multi-tier
applications. Symantec Indepth for J2EE v8 with SmarTune provides a valuable set of tools for IT
staff to analyze Java method and Application Server performance contributors, in order to keep
the J2EE tier up-and-running at peak performance. Indepth for J2EE isolates the root cause of
performance problems in minutes rather than days or weeks, and SmarTune automates analysis
that allows both Java gurus and non-developers to manage application performance by analyzing
contributions of common Java technologies, custom code, and application server configurations.
Footnotes:
1. “Avoiding Application Downtime: Best Practices for Ensuring the Availability and Performance of
Critical Applications”, Enterprise Management Associates, Inc., June 5, 2007
2. “The IT Application Management Software Market”, Forrester, June 6, 2007

Indepth™ for J2EE v8 Technical Brief
31
About the authors
Tim Isenhart is a Senior Principle Software Engineer at Symantec and one of the founders of the
Indepth for J2EE software engineering team. He has gathered 15 years of performance
monitoring and analysis experience and lives in Colorado.
Michael Harding is responsible for marketing emerging data center products for Symantec. He
has over 20 years of hardware, software and services marketing management experience, and
lives in Palo Alto, California.
This document would not be possible without the technical review contributions provided by
Steve Burton and Stan Gonsalves. Thank you!
Where to get more information
More information on Symantec Application Performance Management solutions is available at
http://www.symantec.com/apm.
About Symantec
Symantec is a global leader in
infrastructure software, enabling
businesses and consumers to
have confidence in a connected
world. The company helps
customers protect their
infrastructure, information, and
interactions by delivering
software and services that
address risks to security,
availability, compliance, and
performance. Headquartered in
Cupertino, Calif., Symantec has
operations in 40 countries. More
information is available at
www.symantec.com.
For specific country offices and
contact numbers, please visit
our Web site. For product
information in the U.S., call
toll-free 1 (800) 745 6054.
Symantec Corporation
World Headquarters
20330 Stevens Creek Boulevard
Cupertino, CA 95014 USA
+1 (408) 517 8000
1 (800) 721 3934
www.symantec.com
Copyright © 2007 Symantec Corporation. All rights reserved. Symantec and the Symantec logo are trademarks or
registered trademarks of Symantec Corporation or its affiliates in the U.S. and other countries. Other names may be trademarks of their respective owners.
12/07