index benchmarks for emerging markets debt · index benchmarks for emerging markets debt emerging...
TRANSCRIPT
INDEX BENCHMARKS
FOR EMERGING MARKETS DEBT
Emerging markets debt has, over the past decade, attracted growing attention from investors as a higher-yielding alternative. Investors had initially insisted on hard cur-rency emerging markets bonds but, increasingly, they have added local currency bonds to their portfolios.
The bond markets of the emerging markets have grown substantially over the past decade, and the investment universe has become broader. More and more countries, currencies, and issuers have been added, liquidity has increased substantially, investors’ diversification opportunities have been considerably expanded, and the quality of the issuers has improved.
When establishing an emerging markets debt (EMD) mandate, many questions have to be answered. Passive or active management? Hard or local currencies? Government and corporate bonds? Is a “blend” concept, which invests across investment options, the right solution? Or perhaps a total return strategy independent of index benchmarks? How to deal with the diverse currency risk?
J.P. Morgan emerging markets debt indices are the most widely followed among asset managers in the industry. Since most investors in emerging markets debt will have some exposure to these indices, it is important to understand how they are constructed as well as their potential benefits and drawbacks.
Among the most common representatives of the various EMD markets are the J.P. Morgan EMBI Global Diversified Index for government bonds in hard currencies, the J.P. Morgan CEMBI Broad Diversified Index for corporate bonds in hard currencies, and the J.P. Morgan GBI-EM Global Diversified Index for government bonds in local currencies.1
In historical terms, hard currency investments—as listed in the J.P. Morgan EMBI Global Diversified Index—received the greatest attention from investors. This is mainly because it had a large investable universe, the currency risk was relatively easy to manage for many investors, and the index is well diversified across 63 countries and 127 issuers.
For some years the strongest market growth has been in the J.P. Morgan CEMBI Broad Diversified Index for hard currency corporate bonds and the J.P. Morgan GBI-EM Global Diversified Index for local currency government bonds. These markets are often viewed as the “actual” emerging markets bond markets for investors and active managers over the long term, because investors can potentially exploit illiquidity and inefficiency premiums.
Currency management can play an important role for non-US investors. All emerging markets debt indices are listed in base form in US dollars, so investors must decide whether to hedge currency exposure.
2
The Global Bond Market
Political discussion in recent years has focused on the topics of “saving” and “austerity.” In Europe—but also in the United States, Japan, and many emerging markets—the global financial crisis appears to have inspired some rethinking, and many politicians have increasingly taken the position that “you can only spend what you’ve brought in.”
Some commentators argue that not only the state, but the banks, some enterprises, and private consump-tion as well, must deleverage. Other critics have complained that the austerity of recent years endan-gers growth, jobs, and prosperity. From this debate, it is reasonable to assume that the world bond markets have not grown in some time as less and less debt is being created.2
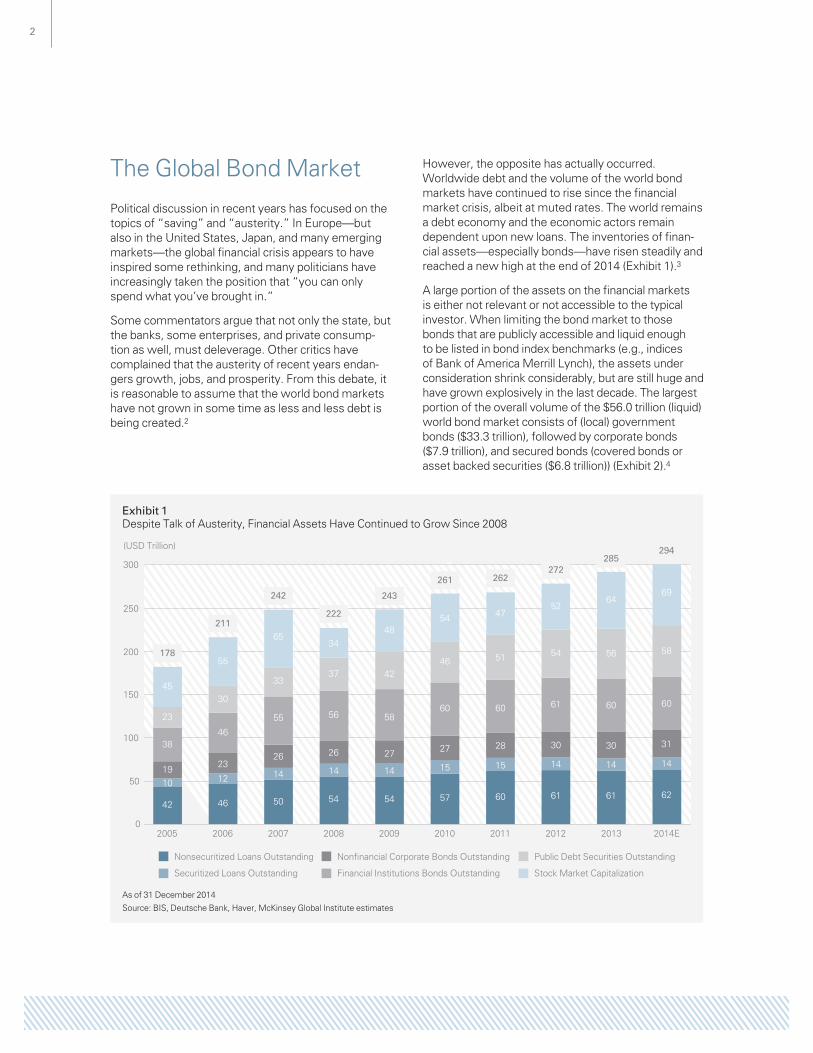
However, the opposite has actually occurred. Worldwide debt and the volume of the world bond markets have continued to rise since the financial market crisis, albeit at muted rates. The world remains a debt economy and the economic actors remain dependent upon new loans. The inventories of finan-cial assets—especially bonds—have risen steadily and reached a new high at the end of 2014 (Exhibit 1).3
A large portion of the assets on the financial markets is either not relevant or not accessible to the typical investor. When limiting the bond market to those bonds that are publicly accessible and liquid enough to be listed in bond index benchmarks (e.g., indices of Bank of America Merrill Lynch), the assets under consideration shrink considerably, but are still huge and have grown explosively in the last decade. The largest portion of the overall volume of the $56.0 trillion (liquid) world bond market consists of (local) government bonds ($33.3 trillion), followed by corporate bonds ($7.9 trillion), and secured bonds (covered bonds or asset backed securities ($6.8 trillion)) (Exhibit 2).4
Exhibit 1Despite Talk of Austerity, Financial Assets Have Continued to Grow Since 2008
(USD Trillion)
0
50
100
150
200
250
300
2005 2006 2007 2008 2009 2010 2011 2012 2013 2014E
Nonsecuritized Loans Outstanding
Securitized Loans Outstanding
Nonfinancial Corporate Bonds Outstanding
Financial Institutions Bonds Outstanding
Public Debt Securities Outstanding
Stock Market Capitalization
14 14 15 14
55 56 5860 60
6534
4854
64
50 54 54 57 61
26 26 27 27 30
3337 42
4656
10
38
45
42
19
23
178
12
46
55
46
23
30
211
242
222
243
261
15
60
47
60
28
51
262
14
61
52
61
30
54
272285
294
1414
60
69
62
31
58
As of 31 December 2014
Source: BIS, Deutsche Bank, Haver, McKinsey Global Institute estimates
3
Exhibit 2The World Bond Market Has Grown Significantly in the Past Decade
Face Value of Index-Qualifying Debt (USD Billion)
0
10
20
30
40
LocalGovernment
High GradeCorporates
High YieldCorporates
External/QuasiGovernment
Securitized/Collateralized
20142004
As of 31 December 2014
Source: BofA Merrill Lynch Indices
Emerging Markets Debt
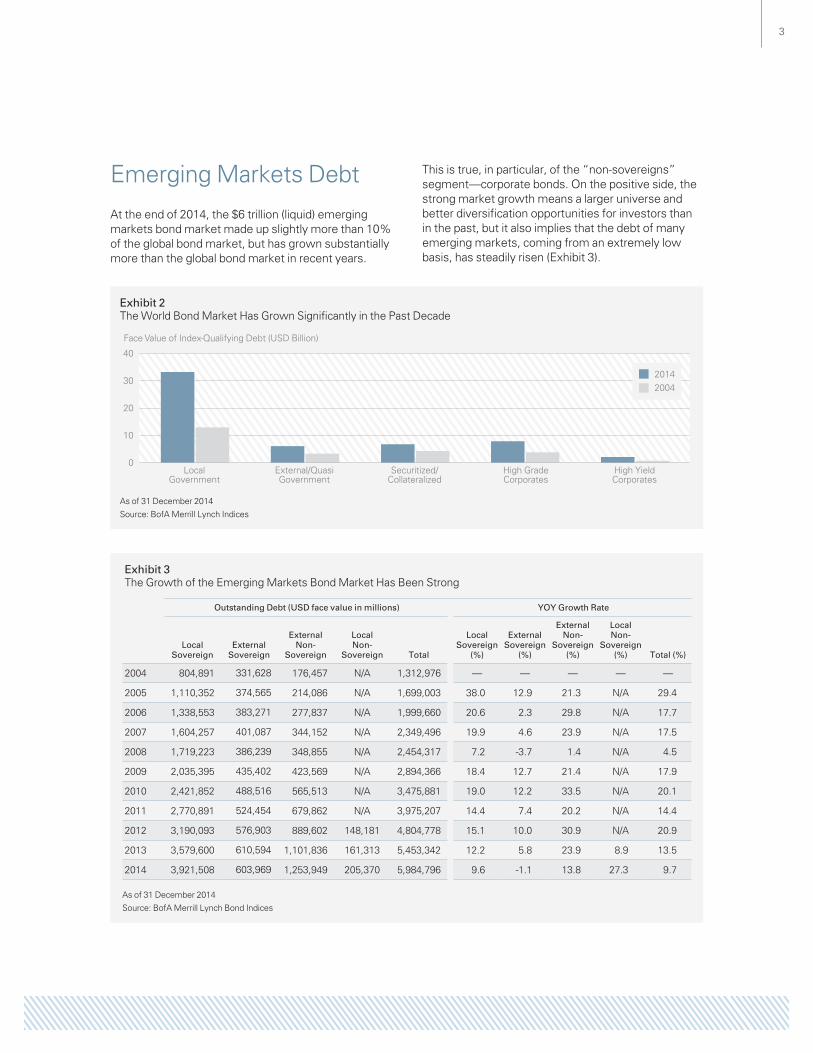
At the end of 2014, the $6 trillion (liquid) emerging markets bond market made up slightly more than 10% of the global bond market, but has grown substantially more than the global bond market in recent years.
This is true, in particular, of the “non-sovereigns” segment—corporate bonds. On the positive side, the strong market growth means a larger universe and better diversification opportunities for investors than in the past, but it also implies that the debt of many emerging markets, coming from an extremely low basis, has steadily risen (Exhibit 3).
Exhibit 3The Growth of the Emerging Markets Bond Market Has Been Strong
Outstanding Debt (USD face value in millions) YOY Growth Rate
Local Sovereign
External Sovereign
External Non-
Sovereign
Local Non-
Sovereign Total
Local Sovereign
(%)
External Sovereign
(%)
External Non-
Sovereign (%)
Local Non-
Sovereign (%) Total (%)
2004 804,891 331,628 176,457 N/A 1,312,976 — — — — —
2005 1,110,352 374,565 214,086 N/A 1,699,003 38.0 12.9 21.3 N/A 29.4
2006 1,338,553 383,271 277,837 N/A 1,999,660 20.6 2.3 29.8 N/A 17.7
2007 1,604,257 401,087 344,152 N/A 2,349,496 19.9 4.6 23.9 N/A 17.5
2008 1,719,223 386,239 348,855 N/A 2,454,317 7.2 -3.7 1.4 N/A 4.5
2009 2,035,395 435,402 423,569 N/A 2,894,366 18.4 12.7 21.4 N/A 17.9
2010 2,421,852 488,516 565,513 N/A 3,475,881 19.0 12.2 33.5 N/A 20.1
2011 2,770,891 524,454 679,862 N/A 3,975,207 14.4 7.4 20.2 N/A 14.4
2012 3,190,093 576,903 889,602 148,181 4,804,778 15.1 10.0 30.9 N/A 20.9
2013 3,579,600 610,594 1,101,836 161,313 5,453,342 12.2 5.8 23.9 8.9 13.5
2014 3,921,508 603,969 1,253,949 205,370 5,984,796 9.6 -1.1 13.8 27.3 9.7
As of 31 December 2014
Source: BofA Merrill Lynch Bond Indices
4
For the investor (as well as the issuer) in emerging markets, the distinction between “external debt” and “local debt” is of central importance. External debt comprises the bonds of issuers of emerging markets that have been issued in hard currencies—the US dollar, euro, British pound, or Japanese yen. About 75% of these bonds are listed in US dollars; for this reason, this is sometimes referred to as the dollar segment of emerging markets bonds. On the other hand, “local debt” consists of bonds that the issuer issues in its own currency.
If, for example, Brazil finances a bond that is denomi-nated in US dollars, this bond is external (sovereign) debt. If Brazil issues a bond in its own currency, the real, the bond is part of local (sovereign) debt. This logic applies not only to country issuers but compa-nies as well. If Petrobras, domiciled in Brazil, issues a bond in US dollars, this bond is part of external (non-sovereign) debt. If it finances itself in Brazilian reals, the bond is part of local (non-sovereign) debt.
External debt, or “emerging markets hard currency bonds,” was the dominant asset class for decades since the first debt was issued in the 1960s. Due to their underdevelopment and weakness, most emerging countries were not able to issue bonds in their own currency, but instead had to issue bonds in currencies of the developed world.
This has changed substantially in the last ten years. A great number of emerging markets now issue bonds that are denominated in local currencies. This “local sovereign market” has therefore been growing much more strongly than the traditional hard currency market for government bonds. At the end of 2014, the market for government bonds in local currencies was, at $3.9 trillion, more than six times as large as the government bond market in hard currencies (based on Bank of America Merrill Lynch indices, Exhibit 3).
The emerging markets corporate bond market is somewhat different. A growing market does exist for corporate bonds in local currencies, but it is highly fragmented, small in volume, and often not acces-sible to foreigners. Therefore, corporate bonds in hard currencies dominate the emerging markets corporate bond indices, while the corporate bond market in local currencies is under-represented in the indices.
Overview of the Emerging Markets Debt Index Benchmarks
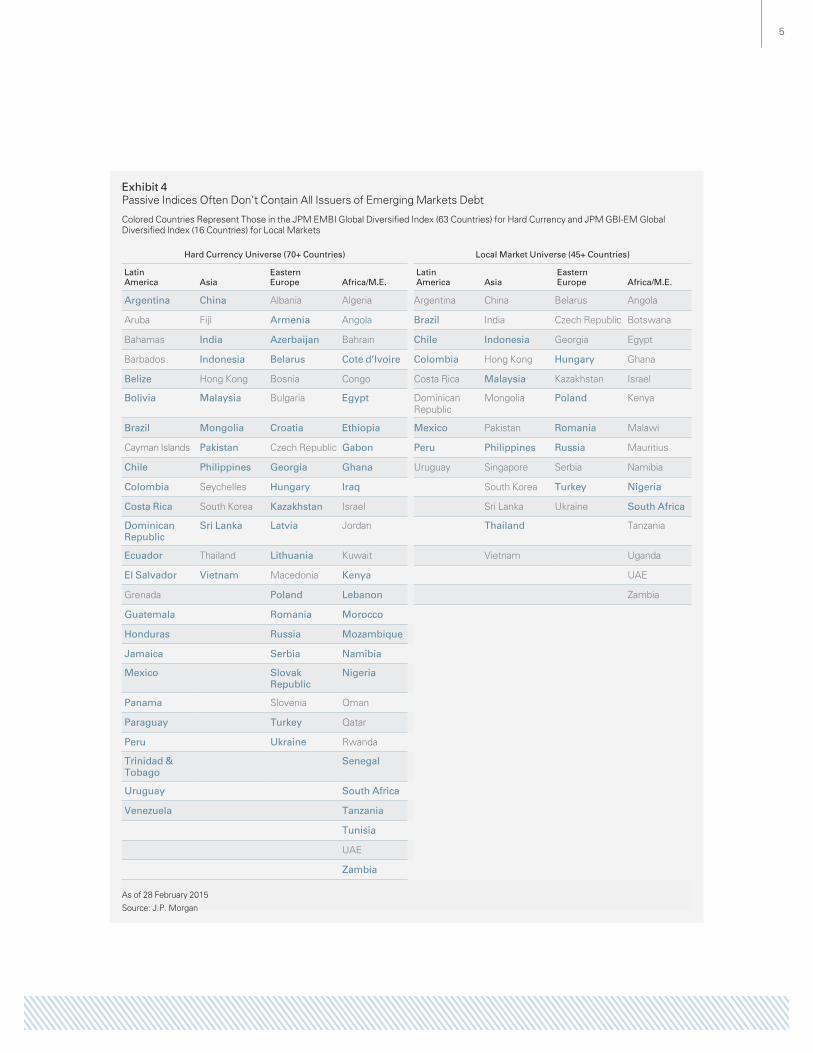
Most index providers offer a series of emerging markets debt indices. It is generally true that not all emerging markets bonds are reflected in the conven-tional indices. The index providers concentrate on the most liquid primary countries and currencies in order to make the indices not too complicated and somewhat flexible. In addition, corporate bonds and inflation-indexed bonds are not included in the “normal” emerging markets debt indices.
This means that passive ETF investments in emerging markets debt indices reflect only a small part of the actual investable universe. In particular, the areas of the markets where illiquidity and inefficiency premiums can be expected are not contained in index investments (Exhibit 4).
J.P. Morgan offers a diverse range of emerging markets indices, which are used by most asset managers and emerging markets debt investors.
J.P. Morgan distinguishes between three individual index groups. On the one hand, there is the J.P. Morgan GBI-EM index family, which encompasses six different indices and relates to the local currencies of emerging markets. This is distinguished from the J.P. Morgan EMBI family, which contains three emerging markets indices that relate to hard currencies. Finally, J.P. Morgan offers the J.P. Morgan CEMBI index family, which encompasses four indices that relate specifically to emerging markets corporate bonds (hard currency) and are not contained in the other emerging markets debt indices.
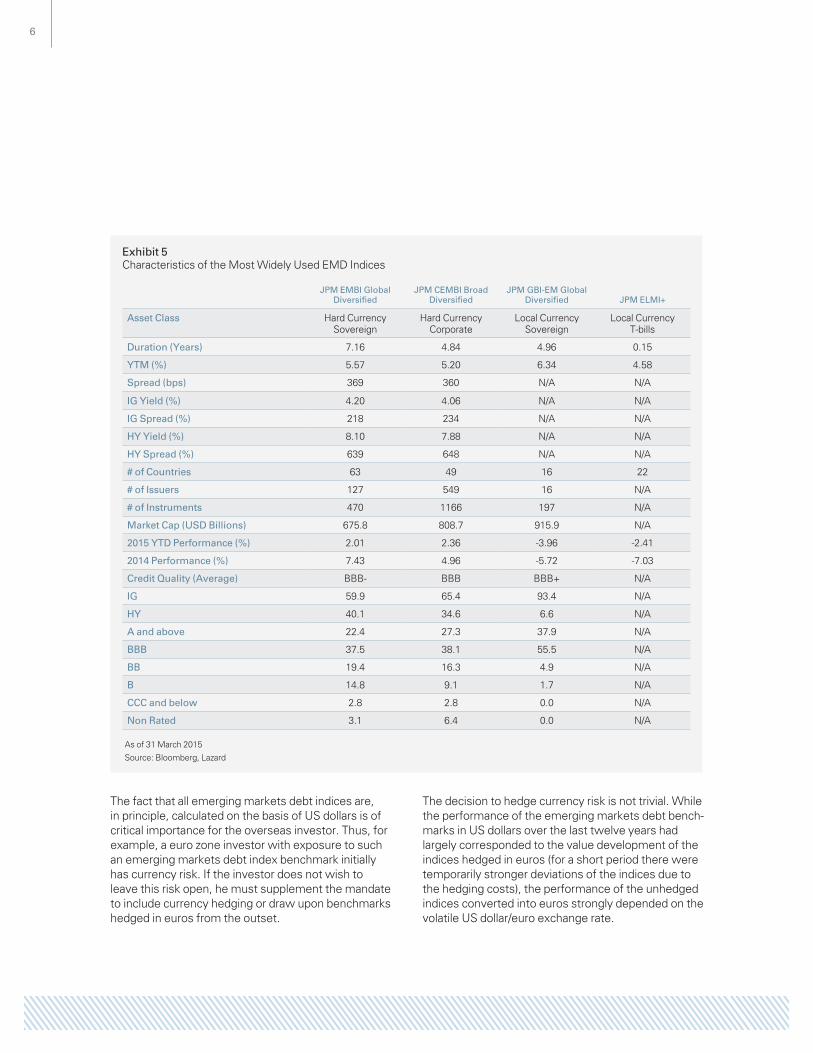
The most important representatives of the three index families are the investable “diversified” indices, which are heavily used in asset management, i.e., the J.P. Morgan EMBI Global Diversified Index for government bonds in hard currencies; the J.P. Morgan CEMBI Broad Diversified Index for corporate bonds in hard currencies; and the J.P. Morgan GBI-EM Global Diversified Index for government bonds in local currencies (Exhibit 5). (We do not address the money market index J.P. Morgan ELMI+ in this publication.)
5
Exhibit 4Passive Indices Often Don’t Contain All Issuers of Emerging Markets Debt
Colored Countries Represent Those in the JPM EMBI Global Diversified Index (63 Countries) for Hard Currency and JPM GBI-EM Global Diversified Index (16 Countries) for Local Markets
Hard Currency Universe (70+ Countries) Local Market Universe (45+ Countries)
Latin America Asia
Eastern Europe Africa/M.E.
Latin America Asia
Eastern Europe Africa/M.E.
Argentina China Albania Algeria Argentina China Belarus Angola
Aruba Fiji Armenia Angola Brazil India Czech Republic Botswana
Bahamas India Azerbaijan Bahrain Chile Indonesia Georgia Egypt
Barbados Indonesia Belarus Cote d’Ivoire Colombia Hong Kong Hungary Ghana
Belize Hong Kong Bosnia Congo Costa Rica Malaysia Kazakhstan Israel
Bolivia Malaysia Bulgaria Egypt Dominican Republic
Mongolia Poland Kenya
Brazil Mongolia Croatia Ethiopia Mexico Pakistan Romania Malawi
Cayman Islands Pakistan Czech Republic Gabon Peru Philippines Russia Mauritius
Chile Philippines Georgia Ghana Uruguay Singapore Serbia Namibia
Colombia Seychelles Hungary Iraq South Korea Turkey Nigeria
Costa Rica South Korea Kazakhstan Israel Sri Lanka Ukraine South Africa
Dominican Republic
Sri Lanka Latvia Jordan Thailand Tanzania
Ecuador Thailand Lithuania Kuwait Vietnam Uganda
El Salvador Vietnam Macedonia Kenya UAE
Grenada Poland Lebanon Zambia
Guatemala Romania Morocco
Honduras Russia Mozambique
Jamaica Serbia Namibia
Mexico Slovak Republic
Nigeria
Panama Slovenia Oman
Paraguay Turkey Qatar
Peru Ukraine Rwanda
Trinidad & Tobago
Senegal
Uruguay South Africa
Venezuela Tanzania
Tunisia
UAE
Zambia
As of 28 February 2015
Source: J.P. Morgan
6
Exhibit 5Characteristics of the Most Widely Used EMD Indices
JPM EMBI Global Diversified
JPM CEMBI Broad Diversified
JPM GBI-EM Global Diversified JPM ELMI+
Asset Class Hard Currency Sovereign
Hard CurrencyCorporate
Local Currency Sovereign
Local CurrencyT-bills
Duration (Years) 7.16 4.84 4.96 0.15
YTM (%) 5.57 5.20 6.34 4.58
Spread (bps) 369 360 N/A N/A
IG Yield (%) 4.20 4.06 N/A N/A
IG Spread (%) 218 234 N/A N/A
HY Yield (%) 8.10 7.88 N/A N/A
HY Spread (%) 639 648 N/A N/A
# of Countries 63 49 16 22
# of Issuers 127 549 16 N/A
# of Instruments 470 1166 197 N/A
Market Cap (USD Billions) 675.8 808.7 915.9 N/A
2015 YTD Performance (%) 2.01 2.36 -3.96 -2.41
2014 Performance (%) 7.43 4.96 -5.72 -7.03
Credit Quality (Average) BBB- BBB BBB+ N/A
IG 59.9 65.4 93.4 N/A
HY 40.1 34.6 6.6 N/A
A and above 22.4 27.3 37.9 N/A
BBB 37.5 38.1 55.5 N/A
BB 19.4 16.3 4.9 N/A
B 14.8 9.1 1.7 N/A
CCC and below 2.8 2.8 0.0 N/A
Non Rated 3.1 6.4 0.0 N/A
As of 31 March 2015
Source: Bloomberg, Lazard
The fact that all emerging markets debt indices are, in principle, calculated on the basis of US dollars is of critical importance for the overseas investor. Thus, for example, a euro zone investor with exposure to such an emerging markets debt index benchmark initially has currency risk. If the investor does not wish to leave this risk open, he must supplement the mandate to include currency hedging or draw upon benchmarks hedged in euros from the outset.
The decision to hedge currency risk is not trivial. While the performance of the emerging markets debt bench-marks in US dollars over the last twelve years had largely corresponded to the value development of the indices hedged in euros (for a short period there were temporarily stronger deviations of the indices due to the hedging costs), the performance of the unhedged indices converted into euros strongly depended on the volatile US dollar/euro exchange rate.
7
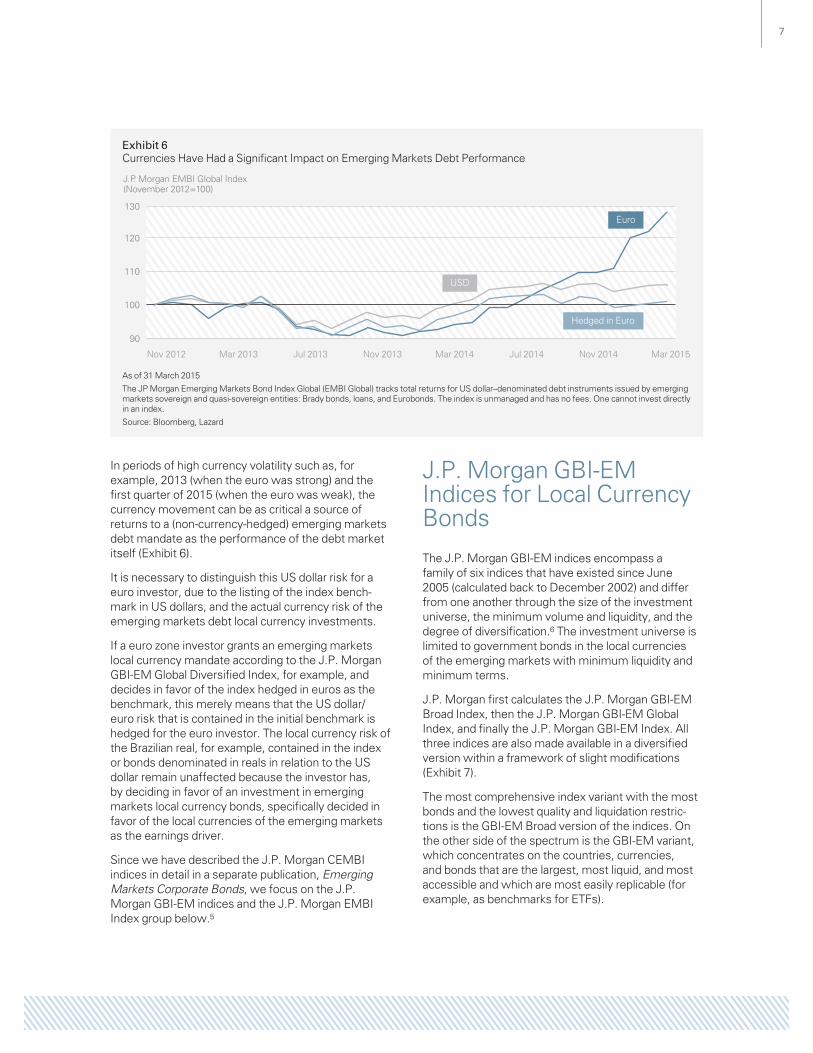
Exhibit 6Currencies Have Had a Significant Impact on Emerging Markets Debt Performance
J.P. Morgan EMBI Global Index(November 2012=100)
90
100
110
120
130
Nov 2012 Mar 2013 Jul 2013 Nov 2013 Mar 2014 Jul 2014 Nov 2014 Mar 2015
Hedged in Euro
Euro
USD
As of 31 March 2015
The JP Morgan Emerging Markets Bond Index Global (EMBI Global) tracks total returns for US dollar–denominated debt instruments issued by emerging markets sovereign and quasi-sovereign entities: Brady bonds, loans, and Eurobonds. The index is unmanaged and has no fees. One cannot invest directly in an index.
Source: Bloomberg, Lazard
In periods of high currency volatility such as, for example, 2013 (when the euro was strong) and the first quarter of 2015 (when the euro was weak), the currency movement can be as critical a source of returns to a (non-currency-hedged) emerging markets debt mandate as the performance of the debt market itself (Exhibit 6).
It is necessary to distinguish this US dollar risk for a euro investor, due to the listing of the index bench-mark in US dollars, and the actual currency risk of the emerging markets debt local currency investments.
If a euro zone investor grants an emerging markets local currency mandate according to the J.P. Morgan GBI-EM Global Diversified Index, for example, and decides in favor of the index hedged in euros as the benchmark, this merely means that the US dollar/euro risk that is contained in the initial benchmark is hedged for the euro investor. The local currency risk of the Brazilian real, for example, contained in the index or bonds denominated in reals in relation to the US dollar remain unaffected because the investor has, by deciding in favor of an investment in emerging markets local currency bonds, specifically decided in favor of the local currencies of the emerging markets as the earnings driver.
Since we have described the J.P. Morgan CEMBI indices in detail in a separate publication, Emerging Markets Corporate Bonds, we focus on the J.P. Morgan GBI-EM indices and the J.P. Morgan EMBI Index group below.5
J.P. Morgan GBI-EM Indices for Local Currency Bonds
The J.P. Morgan GBI-EM indices encompass a family of six indices that have existed since June 2005 (calculated back to December 2002) and differ from one another through the size of the investment universe, the minimum volume and liquidity, and the degree of diversification.6 The investment universe is limited to government bonds in the local currencies of the emerging markets with minimum liquidity and minimum terms.
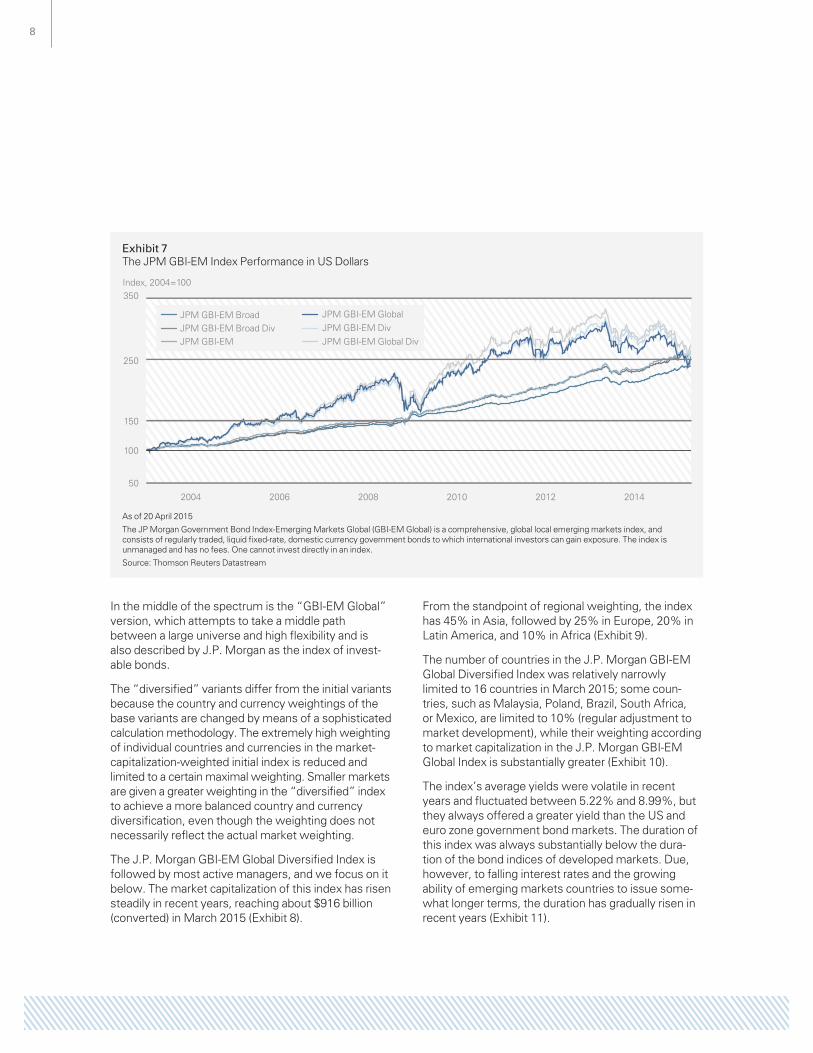
J.P. Morgan first calculates the J.P. Morgan GBI-EM Broad Index, then the J.P. Morgan GBI-EM Global Index, and finally the J.P. Morgan GBI-EM Index. All three indices are also made available in a diversified version within a framework of slight modifications (Exhibit 7).
The most comprehensive index variant with the most bonds and the lowest quality and liquidation restric-tions is the GBI-EM Broad version of the indices. On the other side of the spectrum is the GBI-EM variant, which concentrates on the countries, currencies, and bonds that are the largest, most liquid, and most accessible and which are most easily replicable (for example, as benchmarks for ETFs).
8
In the middle of the spectrum is the “GBI-EM Global” version, which attempts to take a middle path between a large universe and high flexibility and is also described by J.P. Morgan as the index of invest-able bonds.
The “diversified” variants differ from the initial variants because the country and currency weightings of the base variants are changed by means of a sophisticated calculation methodology. The extremely high weighting of individual countries and currencies in the market-capitalization-weighted initial index is reduced and limited to a certain maximal weighting. Smaller markets are given a greater weighting in the “diversified” index to achieve a more balanced country and currency diversification, even though the weighting does not necessarily reflect the actual market weighting.
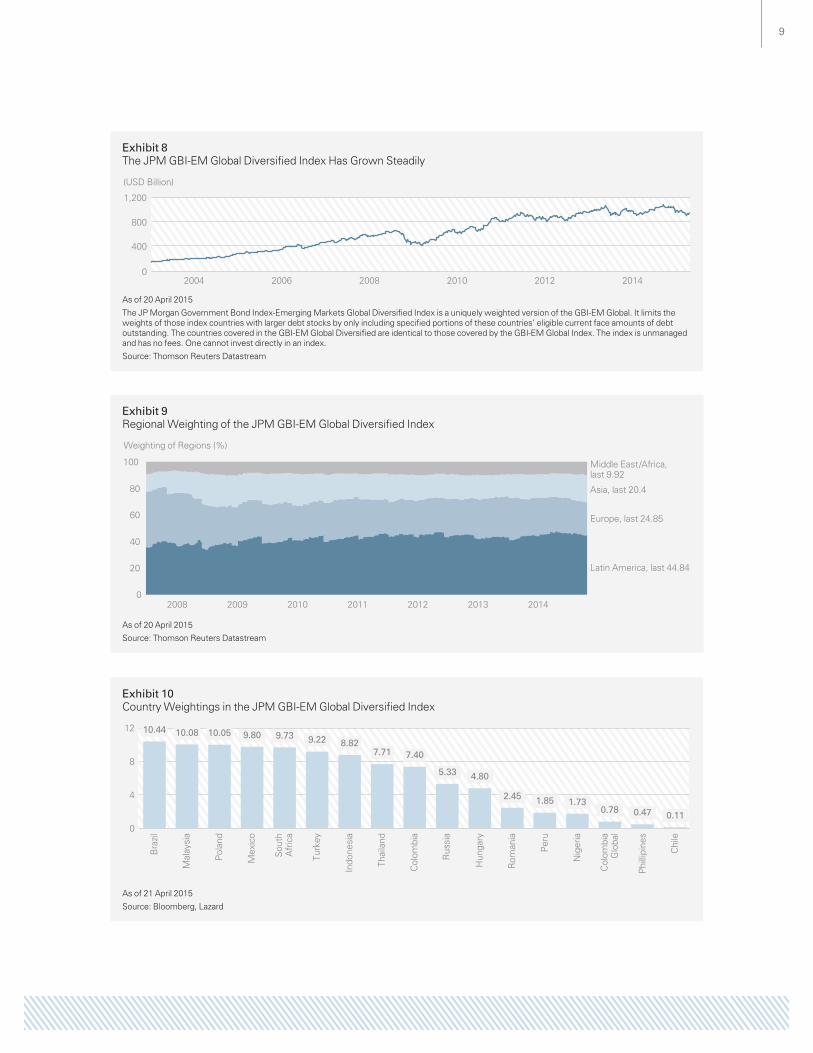
The J.P. Morgan GBI-EM Global Diversified Index is followed by most active managers, and we focus on it below. The market capitalization of this index has risen steadily in recent years, reaching about $916 billion (converted) in March 2015 (Exhibit 8).
From the standpoint of regional weighting, the index has 45% in Asia, followed by 25% in Europe, 20% in Latin America, and 10% in Africa (Exhibit 9).
The number of countries in the J.P. Morgan GBI-EM Global Diversified Index was relatively narrowly limited to 16 countries in March 2015; some coun-tries, such as Malaysia, Poland, Brazil, South Africa, or Mexico, are limited to 10% (regular adjustment to market development), while their weighting according to market capitalization in the J.P. Morgan GBI-EM Global Index is substantially greater (Exhibit 10).
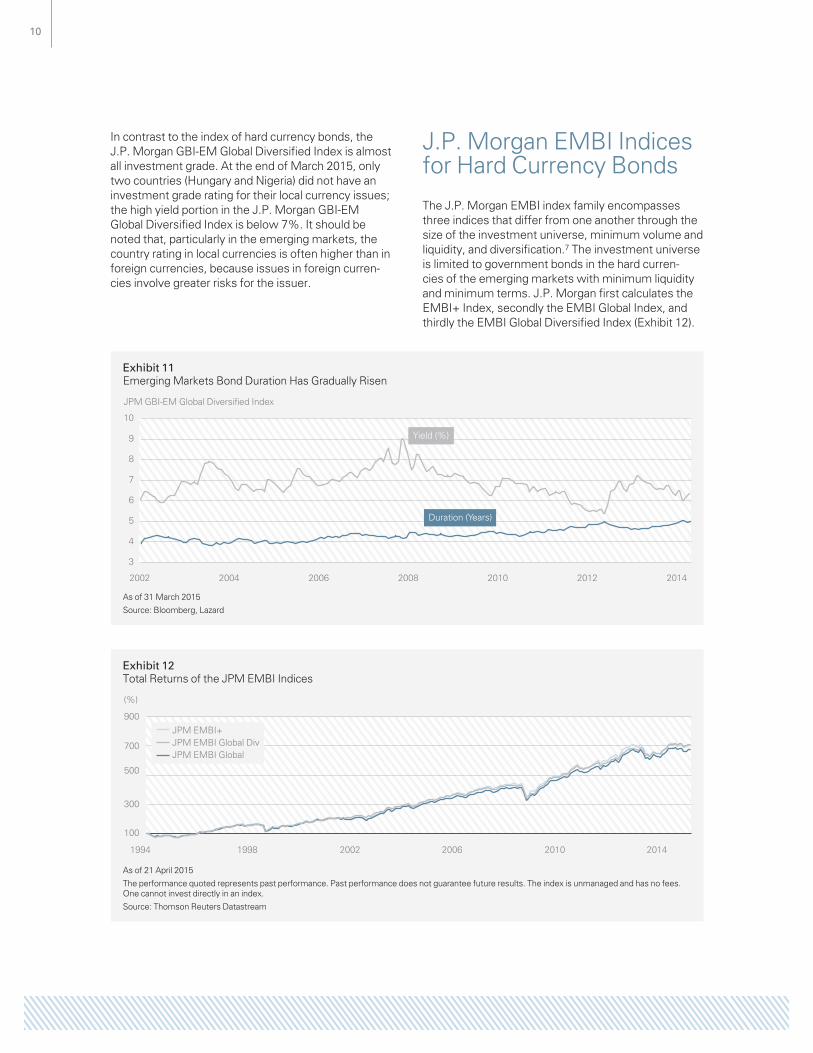
The index’s average yields were volatile in recent years and fluctuated between 5.22% and 8.99%, but they always offered a greater yield than the US and euro zone government bond markets. The duration of this index was always substantially below the dura-tion of the bond indices of developed markets. Due, however, to falling interest rates and the growing ability of emerging markets countries to issue some-what longer terms, the duration has gradually risen in recent years (Exhibit 11).
Exhibit 7The JPM GBI-EM Index Performance in US Dollars
Index, 2004=100
2004 2006 2008 2010 2012 201450
150
100
250
350
JPM GBI-EM BroadJPM GBI-EM Broad DivJPM GBI-EM
JPM GBI-EM GlobalJPM GBI-EM DivJPM GBI-EM Global Div
As of 20 April 2015
The JP Morgan Government Bond Index-Emerging Markets Global (GBI-EM Global) is a comprehensive, global local emerging markets index, and consists of regularly traded, liquid fixed-rate, domestic currency government bonds to which international investors can gain exposure. The index is unmanaged and has no fees. One cannot invest directly in an index.
Source: Thomson Reuters Datastream
9
Exhibit 8The JPM GBI-EM Global Diversified Index Has Grown Steadily
(USD Billion)
2004 2006 2008 2010 2012 20140
400
800
1,200
As of 20 April 2015
The JP Morgan Government Bond Index-Emerging Markets Global Diversified Index is a uniquely weighted version of the GBI-EM Global. It limits the weights of those index countries with larger debt stocks by only including specified portions of these countries’ eligible current face amounts of debt outstanding. The countries covered in the GBI-EM Global Diversified are identical to those covered by the GBI-EM Global Index. The index is unmanaged and has no fees. One cannot invest directly in an index.
Source: Thomson Reuters Datastream
Exhibit 9Regional Weighting of the JPM GBI-EM Global Diversified Index
Weighting of Regions (%)
2008 2009 2010 2011 2012 2013 20140
20
40
60
80
100
Latin America, last 44.84
Europe, last 24.85
Asia, last 20.4
Middle East/Africa,last 9.92
As of 20 April 2015
Source: Thomson Reuters Datastream
Exhibit 10Country Weightings in the JPM GBI-EM Global Diversified Index
Bra
zil
Mal
aysi
a
Pola
nd
Mex
ico
Sout
hA
fric
a
Indo
nesi
a
Thai
land
Col
ombi
a
Rus
sia
Hun
gary
Rom
ania
Peru
Nig
eria
Col
ombi
aG
loba
l
Phill
ipin
es
Chi
le
Turk
ey
0
4
8
12 10.08 10.05 9.80 9.73 9.22 8.827.71 7.40
5.33 4.80
2.45 1.85 1.730.78 0.47
10.44
0.11
As of 21 April 2015
Source: Bloomberg, Lazard
10
Exhibit 11Emerging Markets Bond Duration Has Gradually Risen
JPM GBI-EM Global Diversified Index
2002 2004 2006 2008 2010 2012 2014
3
4
5
6
7
8
9
10
Yield (%)
Duration (Years)
As of 31 March 2015
Source: Bloomberg, Lazard
Exhibit 12Total Returns of the JPM EMBI Indices
(%)
300
100
500
700
900
1994 1998 2002 2006 2010 2014
JPM EMBI+JPM EMBI Global DivJPM EMBI Global
As of 21 April 2015
The performance quoted represents past performance. Past performance does not guarantee future results. The index is unmanaged and has no fees. One cannot invest directly in an index.
Source: Thomson Reuters Datastream
In contrast to the index of hard currency bonds, the J.P. Morgan GBI-EM Global Diversified Index is almost all investment grade. At the end of March 2015, only two countries (Hungary and Nigeria) did not have an investment grade rating for their local currency issues; the high yield portion in the J.P. Morgan GBI-EM Global Diversified Index is below 7%. It should be noted that, particularly in the emerging markets, the country rating in local currencies is often higher than in foreign currencies, because issues in foreign curren-cies involve greater risks for the issuer.
J.P. Morgan EMBI Indices for Hard Currency Bonds
The J.P. Morgan EMBI index family encompasses three indices that differ from one another through the size of the investment universe, minimum volume and liquidity, and diversification.7 The investment universe is limited to government bonds in the hard curren-cies of the emerging markets with minimum liquidity and minimum terms. J.P. Morgan first calculates the EMBI+ Index, secondly the EMBI Global Index, and thirdly the EMBI Global Diversified Index (Exhibit 12).
11
J.P. Morgan’s first emerging markets hard currency index, which was introduced in July 1995 and calcu-lated back to December 1993, was the J.P. Morgan EMBI+ Index. Like all EMBI indices, it is weighted on the basis of the market capitalization of government bonds, but it is the sub-index with the greatest liquidity requirements, so some markets are excluded.
The J.P. Morgan EMBI Global Index was introduced in July 1999, but likewise is calculated back to December 1993. It is somewhat more comprehensive, broader, and thus more representative than the EMBI+ Index. It also contains quasi government bonds and its country weightings are based on the normal market capitalization without weighting restrictions.
This distinguishes it from the J.P. Morgan EMBI Global Diversified Index, which was simultaneously introduced with the same back-calculation, but reflects a restriction of country weightings, such that the large markets are weighted lower and the small markets are weighted higher than in the J.P. Morgan EMBI Global Index.
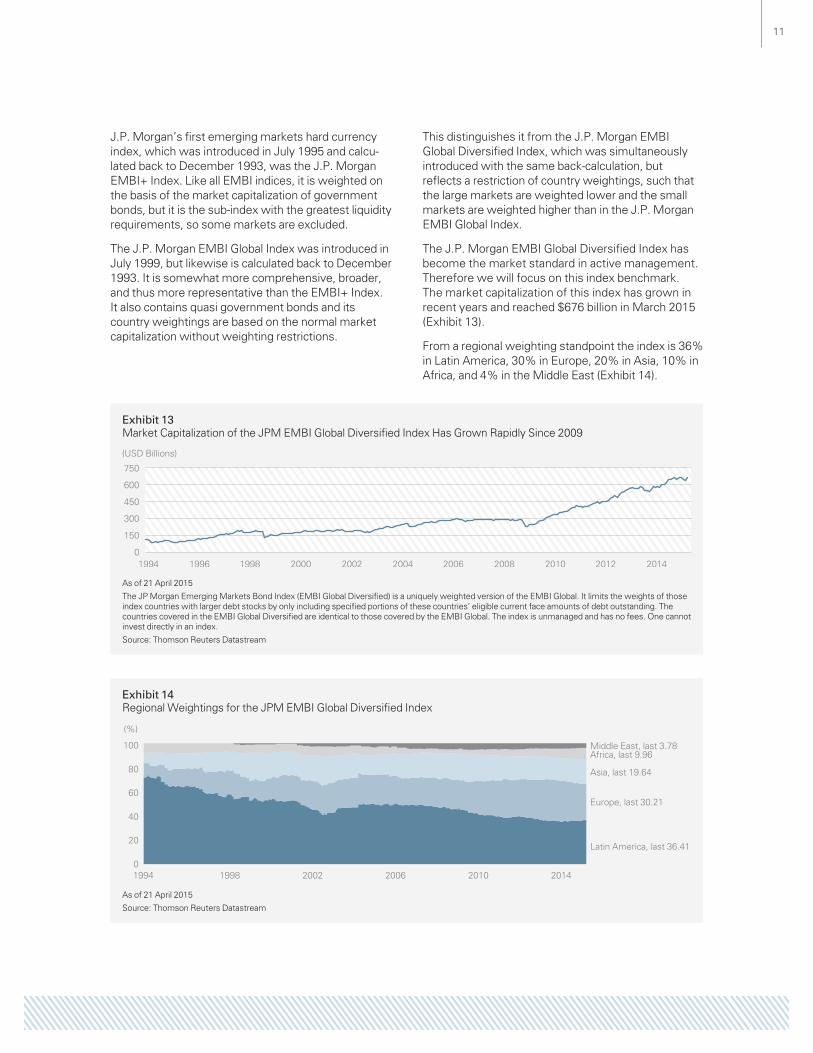
The J.P. Morgan EMBI Global Diversified Index has become the market standard in active management. Therefore we will focus on this index benchmark. The market capitalization of this index has grown in recent years and reached $676 billion in March 2015 (Exhibit 13).
From a regional weighting standpoint the index is 36% in Latin America, 30% in Europe, 20% in Asia, 10% in Africa, and 4% in the Middle East (Exhibit 14).
Exhibit 13Market Capitalization of the JPM EMBI Global Diversified Index Has Grown Rapidly Since 2009
(USD Billions)
1994 1996 1998 2000 2002 2004 2006 2008 2010 2012 20140
150
300
450
600
750
As of 21 April 2015
The JP Morgan Emerging Markets Bond Index (EMBI Global Diversified) is a uniquely weighted version of the EMBI Global. It limits the weights of those index countries with larger debt stocks by only including specified portions of these countries’ eligible current face amounts of debt outstanding. The countries covered in the EMBI Global Diversified are identical to those covered by the EMBI Global. The index is unmanaged and has no fees. One cannot invest directly in an index.
Source: Thomson Reuters Datastream
Exhibit 14Regional Weightings for the JPM EMBI Global Diversified Index
(%)
0
20
40
60
80
100
1994 1998 2002 2006 2010 2014
Latin America, last 36.41
Europe, last 30.21
Asia, last 19.64
Africa, last 9.96Middle East, last 3.78
As of 21 April 2015
Source: Thomson Reuters Datastream
12
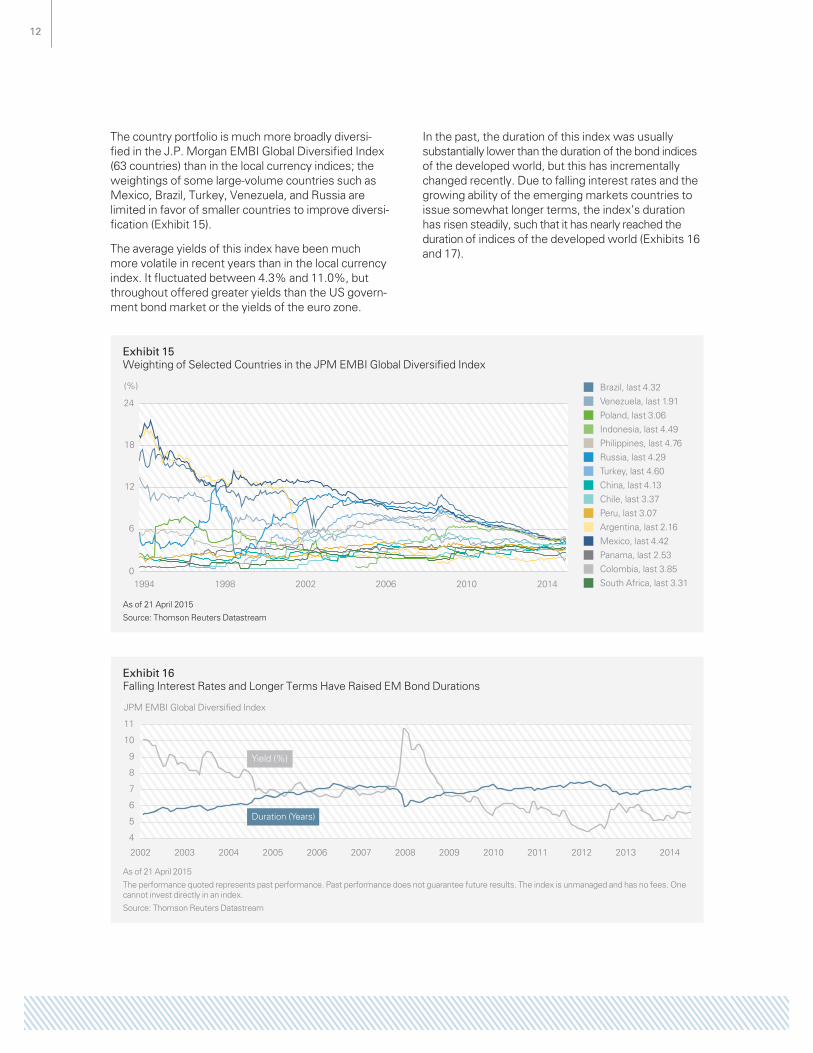
Exhibit 15Weighting of Selected Countries in the JPM EMBI Global Diversified Index
(%) Brazil, last 4.32
1994 1998 2002 2006 2010 20140
6
12
18
24
Russia, last 4.29
Argentina, last 2.16
Venezuela, last 1.91
Turkey, last 4.60
Mexico, last 4.42
Poland, last 3.06
China, last 4.13
Panama, last 2.53
Indonesia, last 4.49
Chile, last 3.37
Colombia, last 3.85
Philippines, last 4.76
Peru, last 3.07
South Africa, last 3.31
As of 21 April 2015
Source: Thomson Reuters Datastream
The country portfolio is much more broadly diversi-fied in the J.P. Morgan EMBI Global Diversified Index (63 countries) than in the local currency indices; the weightings of some large-volume countries such as Mexico, Brazil, Turkey, Venezuela, and Russia are limited in favor of smaller countries to improve diversi-fication (Exhibit 15).
The average yields of this index have been much more volatile in recent years than in the local currency index. It fluctuated between 4.3% and 11.0%, but throughout offered greater yields than the US govern-ment bond market or the yields of the euro zone.
In the past, the duration of this index was usually substantially lower than the duration of the bond indices of the developed world, but this has incrementally changed recently. Due to falling interest rates and the growing ability of the emerging markets countries to issue somewhat longer terms, the index’s duration has risen steadily, such that it has nearly reached the duration of indices of the developed world (Exhibits 16 and 17).
Exhibit 16Falling Interest Rates and Longer Terms Have Raised EM Bond Durations
JPM EMBI Global Diversified Index
4
5
6
7
8
9
10
11
2002 2003 2004 2005 2006 2007 2008 2009 2010 2011 2012 2013 2014
Yield (%)
Duration (Years)
As of 21 April 2015
The performance quoted represents past performance. Past performance does not guarantee future results. The index is unmanaged and has no fees. One cannot invest directly in an index.
Source: Thomson Reuters Datastream
13
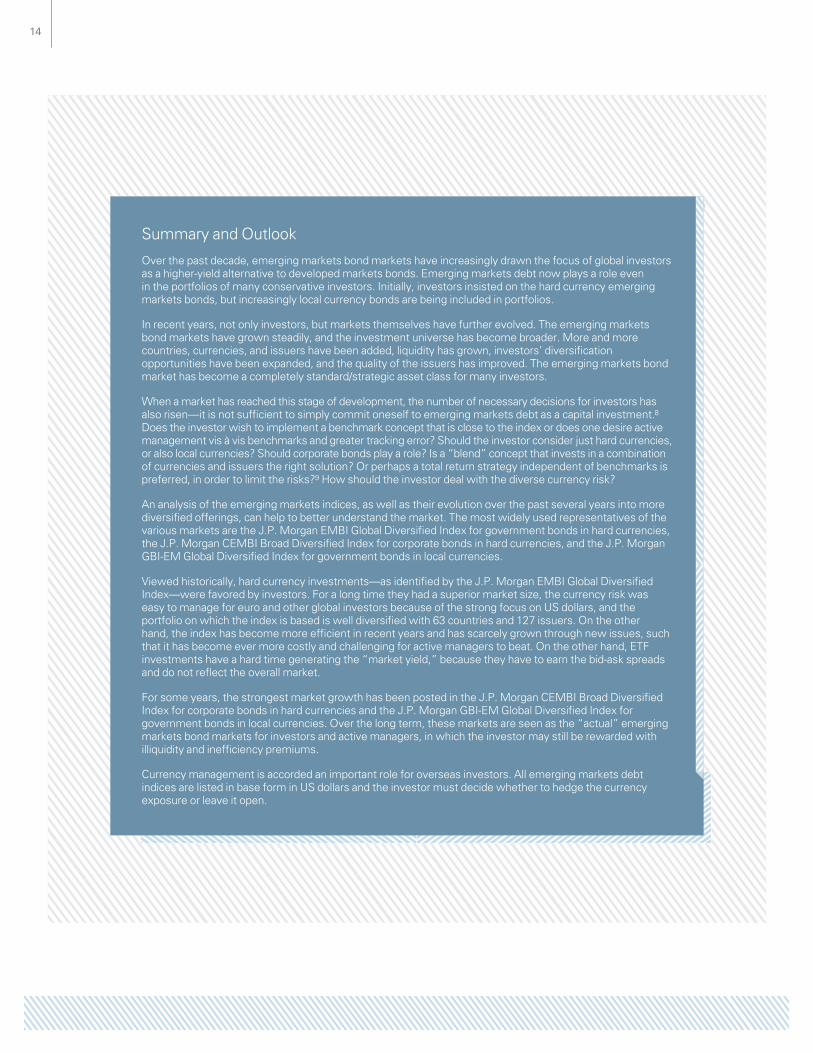
The quality of the government bonds in the J.P. Morgan GBI-EM Global Diversified Index has steadily improved. This is a result of the positive structural development of the emerging markets, and the percentage of securities with investment grade ratings has risen substantially, although this trend
has declined somewhat in the course of the changed monetary policy in the United States since mid-2013 and the drop in the price of oil since mid-2014. But at any rate, about 60% of all bonds in the J.P. Morgan EMBI Global Diversified are investment grade today, and 40% are high yield (Exhibit 18).
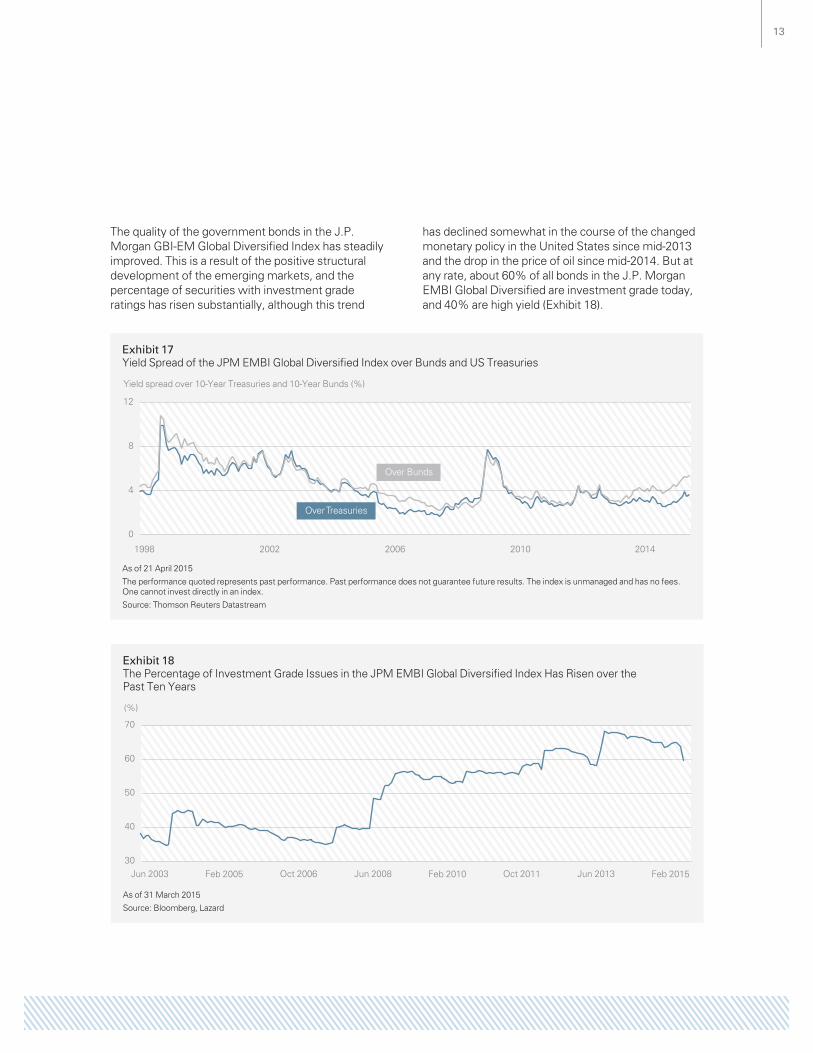
Exhibit 17Yield Spread of the JPM EMBI Global Diversified Index over Bunds and US Treasuries
Yield spread over 10-Year Treasuries and 10-Year Bunds (%)
1998 2002 2006 2010 2014
0
4
8
12
Over Bunds
Over Treasuries
As of 21 April 2015
The performance quoted represents past performance. Past performance does not guarantee future results. The index is unmanaged and has no fees. One cannot invest directly in an index.
Source: Thomson Reuters Datastream
Exhibit 18The Percentage of Investment Grade Issues in the JPM EMBI Global Diversified Index Has Risen over the Past Ten Years
(%)
30
40
50
60
70
Jun 2003 Feb 2005 Oct 2006 Jun 2008 Feb 2010 Oct 2011 Jun 2013 Feb 2015
As of 31 March 2015
Source: Bloomberg, Lazard
14
Summary and Outlook
Over the past decade, emerging markets bond markets have increasingly drawn the focus of global investors as a higher-yield alternative to developed markets bonds. Emerging markets debt now plays a role even in the portfolios of many conservative investors. Initially, investors insisted on the hard currency emerging markets bonds, but increasingly local currency bonds are being included in portfolios.
In recent years, not only investors, but markets themselves have further evolved. The emerging markets bond markets have grown steadily, and the investment universe has become broader. More and more countries, currencies, and issuers have been added, liquidity has grown, investors’ diversification opportunities have been expanded, and the quality of the issuers has improved. The emerging markets bond market has become a completely standard/strategic asset class for many investors.
When a market has reached this stage of development, the number of necessary decisions for investors has also risen—it is not sufficient to simply commit oneself to emerging markets debt as a capital investment.8 Does the investor wish to implement a benchmark concept that is close to the index or does one desire active management vis à vis benchmarks and greater tracking error? Should the investor consider just hard currencies, or also local currencies? Should corporate bonds play a role? Is a “blend” concept that invests in a combination of currencies and issuers the right solution? Or perhaps a total return strategy independent of benchmarks is preferred, in order to limit the risks?9 How should the investor deal with the diverse currency risk?
An analysis of the emerging markets indices, as well as their evolution over the past several years into more diversified offerings, can help to better understand the market. The most widely used representatives of the various markets are the J.P. Morgan EMBI Global Diversified Index for government bonds in hard currencies, the J.P. Morgan CEMBI Broad Diversified Index for corporate bonds in hard currencies, and the J.P. Morgan GBI-EM Global Diversified Index for government bonds in local currencies.
Viewed historically, hard currency investments—as identified by the J.P. Morgan EMBI Global Diversified Index—were favored by investors. For a long time they had a superior market size, the currency risk was easy to manage for euro and other global investors because of the strong focus on US dollars, and the portfolio on which the index is based is well diversified with 63 countries and 127 issuers. On the other hand, the index has become more efficient in recent years and has scarcely grown through new issues, such that it has become ever more costly and challenging for active managers to beat. On the other hand, ETF investments have a hard time generating the “market yield,” because they have to earn the bid-ask spreads and do not reflect the overall market.
For some years, the strongest market growth has been posted in the J.P. Morgan CEMBI Broad Diversified Index for corporate bonds in hard currencies and the J.P. Morgan GBI-EM Global Diversified Index for government bonds in local currencies. Over the long term, these markets are seen as the “actual” emerging markets bond markets for investors and active managers, in which the investor may still be rewarded with illiquidity and inefficiency premiums.
Currency management is accorded an important role for overseas investors. All emerging markets debt indices are listed in base form in US dollars and the investor must decide whether to hedge the currency exposure or leave it open.

15
Notes1 The JP Morgan Emerging Markets Bond Index Global (EMBI Global) tracks total returns for US dollar–denominated debt instruments issued by emerging markets sovereign
and quasi-sovereign entities: Brady bonds, loans, and Eurobonds. The JP Morgan Corporate Emerging Markets Bond Index Global (CEMBI Global) tracks total returns for US–denominated corporate bonds issued by emerging markets entities. The JP Morgan Government Bond Index-Emerging Markets Global Diversified Index is a uniquely weighted version of the GBI-EM Global. It limits the weights of those index countries with larger debt stocks by only including specified portions of these countries’ eligible current face amounts of debt outstanding. The countries covered in the GBI-EM Global Diversified are identical to those covered by the GBI-EM Global Index. These indices are unmanaged and have no fees. One cannot invest directly in an index.
2 As of 2014. Source: F. Schui: Austerität – Politik der Sparsamkeit: Die kurze Geschichte eines grossen Fehlers [Austerity – Policy of Frugality: The Short Story of a Big Mistake], Karl Blessing Verlag.
3 As of11 February 2015. Source: S. Sanyal: The Random Walk – Mapping the World’s Financial Market 2015, Deutsche Bank Research, White Paper.
4 As of 14 January 2015. Source: P. Galdi: World Bond Market Growth Trends, Bank of America Merrill Lynch Bond Index Almanac, White Paper.
5 As of August 2013. Source: W. Krämer; Emerging Markets Corporate Bonds, Lazard Asset Management, Hintergrund [Background].
6 As of February 2015. Source: G. Kim / S. Pithavadian: GBI-EM, JPMorgan Global Index Research, White Paper.
7 G. Kim: EMBI Global and EMBI Global Diversified, Rules and Methodology, JPMorgan Global Index Research, White Paper, May 2013: G. Kim et al: EMBI+, EMBI Global, EMBI Global Diversified, JPM Global Index Research, JPM Fixed Income Index Products Guides, January 2013.
8 As of March 2012. Source: JPM: Digging Deeper, Emerging Market Debt Choices, J.P. Morgan Asset Management, White Paper.
9 As of July 2011. Source: W. Krämer: Total Return-Konzepte mit Emerging Markets Debt [Total Return Concepts with Emerging Markets Debt], Lazard Asset Management, Hintergrund [Background].
Important InformationPublished on 15 September 2017.
This document reflects the views of Lazard Asset Management LLC or its affiliates (“Lazard”) based upon information believed to be reliable as of 16 November 2015. There is no guarantee that any forecast or opinion will be realized. This document is provided by Lazard Asset Management LLC or its affiliates (“Lazard”) for informational purposes only. Nothing herein constitutes investment advice or a recommendation relating to any security, commodity, derivative, investment management service or investment product. Investments in securities, derivatives, and commodities involve risk, will fluctuate in price, and may result in losses. Certain assets held in Lazard’s investment portfolios, in particular alternative investment portfolios, can involve high degrees of risk and volatility when compared to other assets. Similarly, certain assets held in Lazard’s investment portfolios may trade in less liquid or efficient markets, which can affect investment performance. Past performance does not guarantee future results. The views expressed herein are subject to change, and may differ from the views of other Lazard investment professionals.
This document is intended only for persons residing in jurisdictions where its distribution or availability is consistent with local laws and Lazard’s local regulatory authorizations. Please visit www.lazardassetmanagement.com/globaldisclosure for the specific Lazard entities that have issued this document and the scope of their authorized activities.
Equity securities will fluctuate in price; the value of your investment will thus fluctuate, and this may result in a loss. Securities in certain non-domestic countries may be less liquid, more volatile, and less subject to governmental supervision than in one’s home market. The values of these securities may be affected by changes in currency rates, appli-cation of a country’s specific tax laws, changes in government administration, and economic and monetary policy. Emerging markets securities carry special risks, such as less developed or less efficient trading markets, a lack of company information, and differing auditing and legal standards. The securities markets of emerging markets countries can be extremely volatile; performance can also be influenced by political, social, and economic factors affecting companies in emerging markets countries. An investment in bonds carries risk. If interest rates rise, bond prices usually decline. The longer a bond’s maturity, the greater the impact a change in interest rates can have on its price. If you do not hold a bond until maturity, you may experience a gain or loss when you sell. Bonds also carry the risk of default, which is the risk that the issuer is unable to make further income and principal payments.
Certain information included herein is derived by Lazard in part from an MSCI index or indices (the “Index Data”). However, MSCI has not reviewed this product or report, and does not endorse or express any opinion regarding this product or report or any analysis or other information contained herein or the author or source of any such information or analysis. MSCI makes no express or implied warranties or representations and shall have no liability whatsoever with respect to any Index Data or data derived therefrom. The MSCI Index Data may not be further redistributed or used as a basis for other indices or any securities or financial products.
HB25676