index of economic freedom - heritage.org · ˜˜˙ sri lanka ˘˝ ... ˜ ˇ india ˙˝ˆ ˜ egypt...
TRANSCRIPT

2017INDEX OF
INSTITUTE FOR ECONOMIC FREEDOM
ECONOMICFREEDOM
Terry MillerAnthony B. Kimwith James M. Roberts, Bryan Riley, and Tori Whiting
HIGHLIGHTS OF THE

80–100 Free70–79.9 Mostly Free60–69.9 Moderately Free50–59.9 Mostly Unfree0–49.9 RepressedNot Graded
●
●
●
●
●
●
Economic Freedom Scores
Rank Country Overall Score Rank Country Overall Score Rank Country Overall Score
RANKING THE WORLD BY ECONOMIC FREEDOM
1 Hong Kong 89.8 2 Singapore 88.6 3 New Zealand 83.7 4 Switzerland 81.5 5 Australia 81.0 6 Estonia 79.1 7 Canada 78.5 8 United Arab Emirates 76.9 9 Ireland 76.7 10 Chile 76.5 11 Taiwan 76.5 12 United Kingdom 76.4 13 Georgia 76.0 14 Luxembourg 75.9 15 Netherlands 75.8 16 Lithuania 75.8 17 United States 75.1 18 Denmark 75.1 19 Sweden 74.9 20 Latvia 74.8 21 Mauritius 74.7 22 Iceland 74.4 23 South Korea 74.3 24 Finland 74.0 25 Norway 74.0 26 Germany 73.8 27 Malaysia 73.8 28 Czech Republic 73.3 29 Qatar 73.1 30 Austria 72.3 31 Macedonia 70.7 32 Macau 70.7 33 Armenia 70.3 34 Botswana 70.1 35 Brunei Darussalam 69.8 36 Israel 69.7 37 Colombia 69.7 38 Uruguay 69.7 39 Romania 69.7 40 Japan 69.6 41 Jamaica 69.5 42 Kazakhstan 69.0 43 Peru 68.9 44 Bahrain 68.5 45 Poland 68.3 46 Kosovo 67.9 47 Bulgaria 67.9 48 Cyprus 67.9 49 Belgium 67.8 50 Malta 67.7 51 Rwanda 67.6 52 Vanuatu 67.4 53 Jordan 66.7 54 Panama 66.3 55 Thailand 66.2 56 Hungary 65.8 57 Slovak Republic 65.7 58 Philippines 65.6 59 St. Vincent and the Grenadines 65.2 60 Turkey 65.2 61 Kuwait 65.1 62 St. Lucia 65.0 63 Costa Rica 65.0
64 Saudi Arabia 64.4 65 Albania 64.4 66 El Salvador 64.1 67 Dominica 63.7 68 Azerbaijan 63.6 69 Spain 63.6 70 Mexico 63.6 71 Fiji 63.4 72 France 63.3 73 Tonga 63.0 74 Guatemala 63.0 75 Côte d'Ivoire 63.0 76 Dominican Republic 62.9 77 Portugal 62.6 78 Namibia 62.5 79 Italy 62.5 80 Paraguay 62.4 81 South Africa 62.3 82 Oman 62.1 83 Montenegro 62.0 84 Indonesia 61.9 85 Seychelles 61.8 86 Morocco 61.5 87 Trinidad and Tobago 61.2 88 Swaziland 61.1 89 Kyrgyz Republic 61.1 90 Bahamas 61.1 91 Uganda 60.9 92 Bosnia and Herzegovina 60.2 93 Burkina Faso 59.6 94 Cambodia 59.5 95 Croatia 59.4 96 Benin 59.2 97 Slovenia 59.2 98 Nicaragua 59.2 99 Serbia 58.9 100 Honduras 58.8 101 Belize 58.6 102 Mali 58.6 103 Gabon 58.6 104 Belarus 58.6 105 Tanzania 58.6 106 Guyana 58.5 107 Bhutan 58.4 108 Samoa 58.4 109 Tajikistan 58.2 110 Moldova 58.0 111 China 57.4 112 Sri Lanka 57.4 113 Madagascar 57.4 114 Russia 57.1 115 Nigeria 57.1 116 Cabo Verde 56.9 117 Congo, Dem. Rep. of 56.4 118 Ghana 56.2 119 Guinea-Bissau 56.1 120 Senegal 55.9 121 Comoros 55.8 122 Zambia 55.8 123 Tunisia 55.7 124 São Tomé and Príncipe 55.4 125 Nepal 55.1 126 Solomon Islands 55.0 127 Greece 55.0
128 Bangladesh 55.0 129 Mongolia 54.8 130 Barbados 54.5 131 Mauritania 54.4 132 Micronesia 54.1 133 Lao P.D.R. 54.0 134 Lesotho 53.9 135 Kenya 53.5 136 Gambia 53.4 137 Lebanon 53.3 138 Togo 53.2 139 Burundi 53.2 140 Brazil 52.9 141 Pakistan 52.8 142 Ethiopia 52.7 143 India 52.6 144 Egypt 52.6 145 Sierra Leone 52.6 146 Burma 52.5 147 Vietnam 52.4 148 Uzbekistan 52.3 149 Malawi 52.2 150 Cameroon 51.8 151 Central African Republic 51.8 152 Papua New Guinea 50.9 153 Kiribati 50.9 154 Niger 50.8 155 Iran 50.5 156 Argentina 50.4 157 Maldives 50.3 158 Mozambique 49.9 159 Haiti 49.6 160 Ecuador 49.3 161 Liberia 49.1 162 Chad 49.0 163 Afghanistan 48.9 164 Sudan 48.8 165 Angola 48.5 166 Ukraine 48.1 167 Suriname 48.0 168 Bolivia 47.7 169 Guinea 47.6 170 Turkmenistan 47.4 171 Djibouti 46.7 172 Algeria 46.5 173 Timor-Leste 46.3 174 Equatorial Guinea 45.0 175 Zimbabwe 44.0 176 Eritrea 42.2 177 Congo, Rep. of 40.0 178 Cuba 33.9 179 Venezuela 27.0 180 North Korea 4.9
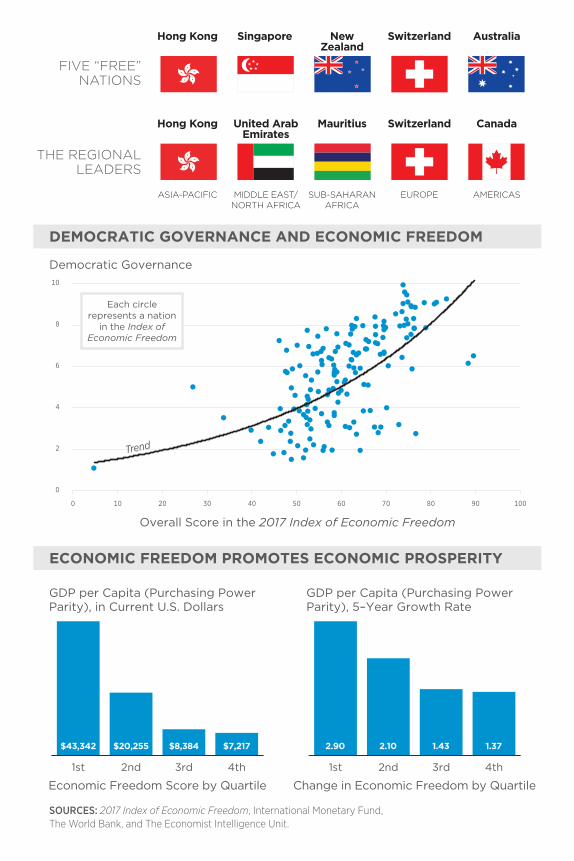
ECONOMIC FREEDOM PROMOTES ECONOMIC PROSPERITY
GDP per Capita (Purchasing Power Parity), in Current U.S. Dollars
Economic Freedom Score by Quartile
1st 2nd 3rd 4th
SOURCES: 2017 Index of Economic Freedom, International Monetary Fund, The World Bank, and The Economist Intelligence Unit.
GDP per Capita (Purchasing Power Parity), 5–Year Growth Rate
Change in Economic Freedom by Quartile
1st 2nd 3rd 4th
$43,342 $20,255 $8,384 $7,217 2.90 2.10 1.43 1.37
DEMOCRATIC GOVERNANCE AND ECONOMIC FREEDOM
Democratic Governance
Overall Score in the 2017 Index of Economic Freedom
Singapore New Zealand
Switzerland Australia
FIVE “FREE” NATIONS
Hong Kong
AMERICAS
Canada
EUROPE
Switzerland
MIDDLE EAST/ NORTH AFRICA
United Arab Emirates
SUB-SAHARAN AFRICA
Mauritius
ASIA-PACIFIC
Hong Kong
THE REGIONAL LEADERS
0
2
4
6
8
10
0 10 20 30 40 50 60 70 80 90 100
Trend
Each circle represents a nation
in the Index of Economic Freedom
2 2017 Index of Economic Freedom HIGHLIGHTS
THE PROVEN POWER OF ECONOMIC FREEDOMThe results of the 2017 Index of
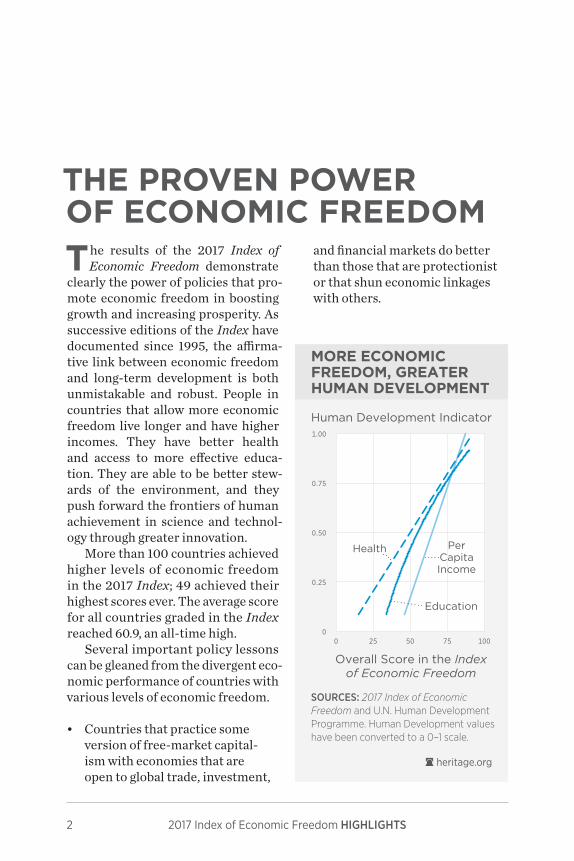
Economic Freedom demonstrate clearly the power of policies that pro-mote economic freedom in boosting growth and increasing prosperity. As successive editions of the Index have documented since 1995, the affirma-tive link between economic freedom and long-term development is both unmistakable and robust. People in countries that allow more economic freedom live longer and have higher incomes. They have better health and access to more effective educa-tion. They are able to be better stew-ards of the environment, and they push forward the frontiers of human achievement in science and technol-ogy through greater innovation.
More than 100 countries achieved higher levels of economic freedom in the 2017 Index; 49 achieved their highest scores ever. The average score for all countries graded in the Index reached 60.9, an all-time high.
Several important policy lessons can be gleaned from the divergent eco-nomic performance of countries with various levels of economic freedom.
• Countries that practice some version of free-market capital-ism with economies that are open to global trade, investment,
and financial markets do better than those that are protectionist or that shun economic linkages with others.
heritage.org
SOURCES: 2017 Index of Economic Freedom and U.N. Human Development Programme. Human Development values have been converted to a 0–1 scale.
MORE ECONOMIC FREEDOM, GREATER HUMAN DEVELOPMENT
Human Development Indicator
Overall Score in the Index of Economic Freedom
00
0.25
0.50
0.75
1.00
25 50 75 100
Health Per Capita Income
Education

3The Heritage Foundation | heritage.org/Index
• Countries that encourage private ownership of property through effective titling and registra-tion and with honest and even-handed judicial protection encourage more entrepreneurial initiative than do countries that require collective or govern-ment ownership or control of economic resources.
• Governments that impose heavy taxation or that incur excessive debt to fund high levels of govern-ment spending crowd out private economic activity and job-creat-ing investment.
• A consistently applied regulatory scheme that encourages compe-tition and dispersed decision-making, innovation, productivity gains, and economic efficiency promotes a better allocation of resources than is achieved by systems of central planning.
Economic Freedom Alleviates Poverty and Promotes Overall Human Development
Policies that promote economic freedom, whether through improve-ments in the rule of law, the promotion of efficiency and openness, or suitable restraints on the size and reach of government, create an environment in which people are encouraged and trusted to develop practical solutions to the economic and social challenges that confront them on a daily basis.
The free-market system that is based on the principles of economic freedom has been fueling unprec-edented economic growth around the world. As the global economy has moved toward greater economic free-dom over the past two decades, real world gross domestic product (GDP) has increased by about 80 percent, and the global poverty rate has been cut in half, lifting hundreds of millions of people out of poverty.
AS ECONOMIC FREEDOM RISES, THE GLOBAL ECONOMY EXPANDS AND POVERTY FALLS
Average Score in the Index of Economic Freedom
heritage.orgSOURCES: 2017 Index of Economic Freedom and The World Bank.
56
58
60
62
1995 2017
Global GDP, in Trillions of 2010 U.S. Dollars
$30
$40
$50
$60
$70
$80
1993 2015
Percentage of Global Population in Poverty
0%
10%
20%
30%
40%
1993 2013
60.9$74.6
10.7%

4 2017 Index of Economic Freedom HIGHLIGHTS
ECONOMIC FREEDOM, INNOVATION, AND THE ENVIRONMENT
Innovation Index Score
heritage.org
SOURCES: 2017 Index of Economic Freedom, The Global Innovation Index 2016, and 2016 Environmental Performance Index.
20 30 40 50 60 70 80 90 100
0
10
20
30
40
50
60
70
REPRESSED MOSTLY UNFREE
MODERATELY FREE
MOSTLY FREE FREE
58.3 59.3 73.5 81.4 87.3
Environmental Performance Index
Overall Score in the 2017 Index of Economic Freedom
Correlation: 0.73
Each circle represents a nation
in the Index of Economic Freedom

5The Heritage Foundation | heritage.org/Index
Achieving greater overall prosper-ity that goes beyond the materialistic and monetary dimensions of well-be-ing is equally important. The societal benefits of economic freedom extend far beyond reductions in poverty. Countries with higher levels of eco-nomic freedom enjoy higher levels of human development in terms of life expectancy, literacy, education, and overall quality of life.
Economic Freedom Facilitates Innovation and Better Environmental Protection
The positive link between eco-nomic freedom and higher levels of innovation ensures greater economic dynamism in coping with various developmental challenges by spur-ring a virtuous cycle of investment,
innovation (including in greener tech-nologies), and dynamic entrepreneur-ial growth.
The fact that the most remarkable improvements in clean-energy use and energy efficiency over the past decades have occurred not as a result of government regulation, but rather as a result of advances in technology and trade should not be overlooked. Around the world, economic freedom has been a key factor in enhancing countries’ capacity for innovation and, by so doing, in improving their overall environmental performance.
Economic Freedom Ensures Greater Societal Progress
Economic freedom is critical to generating the broader-based eco-nomic growth that brings more
ECONOMIC FREEDOM AND SOCIAL PROGRESS
Social Progress
Index Score
Overall Score in the 2017 Index of Economic Freedom
SOURCES: 2017 Index of Economic Freedom and Social Progress Index 2015. heritage.org
25 35 45 55 65 75 85
20
40
60
80
100
Each circle represents a nation
in the Index of Economic Freedom
Correlation: 0.73
Trend

6 2017 Index of Economic Freedom HIGHLIGHTS
THE 12 ECONOMIC FREEDOMS: A GLOBAL LOOK
SOURCE: 2017 Index of Economic Freedom. heritage.org
RULE OF LAW GOVERNMENT SIZE
REGULATORY EFFICIENCY OPEN MARKETS
While some governments made progress in improving property rights and judicial eectiveness by increasing institutional competency, transparency, and accountabili-ty, serious corruption scandals—some of them related to narcotics tra�cking and money laundering—had harmful eects on the rule of law in a number of other countries.
The average top individual income tax rate for all of the world’s countries is about 28.1 percent, and the average top corporate tax rate is 23.9 percent. The average overall tax burden as a percentage of GDP corresponds to around 24.2 percent. The average level of government spending as a percentage of GDP is equal to 34 percent. The average level of gross public debt for countries covered in the Index is equivalent to about 53.7 percent of GDP.
Many countries continue to implement regulatory reforms, although the overall pace of reform in developed countries has generally lagged behind the pace in developing countries. For the world as a whole, a movement toward higher minimum wages continues with a risk of pushing some workers out of the labor force and increasing poverty and dependence on government. Monetary freedom registered a continued improvement as a result of low inflationary pressures in general.
Worldwide, the average trade freedom score continues to improve, benefiting a greater number of people. The average investment freedom score remains essentially unchanged from the previous year. Investment policy measures in many countries remain geared toward promotion of sectoral investment rather than general market openness. Despite some progress in stability, financial institutions in many countries continue to face uncertain regulatory environments.
Property Rights
Judicial E�ectiveness
Government Integrity
TaxBurden
Government Spending
FiscalHealth
Business Freedom
Labor Freedom
Monetary Freedom
Trade Freedom
Investment Freedom
Financial Freedom
80
60
70
100
50
0
80
60
70
100
50
0
80
60
70
100
50
0
80
60
70
100
50
048.357.375.976.359.464.8
66.363.077.342.444.452.2

7The Heritage Foundation | heritage.org/Index
opportunities for a greater number of people to work, produce, and save. In other words, ensuring greater eco-nomic freedom is directly related to preserving and enhancing dynamic upward mobility.
Not surprisingly, societies based on economic freedom are the ones that have demonstrated the strongest social progress. As shown in Chart 7, countries that more fully embrace economic freedom have provided the institutional environments that are most conducive to societal progress. Countries that have improved their competitiveness and opened their societies to new ideas have largely achieved the high levels of societal progress that their citizens demand. It is not massive redistributions of wealth or government dictates on income levels that produce the most positive societal outcomes. Instead, mobility and progress require lower barriers to market entry, freedom to engage with the world, and less gov-ernment intrusion.
The AmericasThe overall population of the Amer-
icas is 965 million, second only to Asia. Among the five regions, the Americas has the second highest population-weighted average income per capita. Across the region, economies have ex-panded at an average rate of 2.4 percent over the past five years. Regional aver-age rates of unemployment and infla-tion have been more than 8 percent.
An examination of the various components of economic freedom evaluated in the Index reveals that the countries of the Americas as a whole perform better than the world aver-age in only four of the 12 categories. Scores for tax burden and government
spending indicate broad regional ac-ceptance of the principle of limited government, and levels of market open-ness are consistent with world stan-dards. On the other hand, the rule of law and regulatory efficiency are major problem areas, reflecting long-standing weakness in the protection of property rights, ineffectiveness in the judiciary, and lack of government integrity.
It is noteworthy that after a pro-longed period of populist domination, the pendulum has swung back to the center-right in a number of the re-gion’s countries, including Argentina, Brazil, Chile, and Peru, but the region remains ideologically in flux overall.
Notable Countries• Argentina has implemented a
number of significant changes in its economic policies since De-cember 2015. President Mauricio Macri’s administration has swiftly adopted critical reforms such as modernization of the import regime, measures against infla-tion, and reform of the national statistics system. The 2016 settle-ment with creditors has allowed Argentina to access international capital markets for the first time in 15 years.
• Cuba’s bloated government sector continues to account for much of that country’s economic activ-ity, although the government has eased the rules on private employment in an effort to im-prove efficiency. In the absence of significant future oil subsidies from nearly bankrupt Venezuela, Cuba’s dysfunctional economy is even more dependent on external assistance such as remittances from Cuban émigrés.

8 2017 Index of Economic Freedom HIGHLIGHTS
• The United States continued its string of discouraging trends in the 2017 Index, registering its lowest economic freedom score ever and now not even one of the world’s 15 freest economies. The substantial expansion of the U.S. government’s size and scope, increased regulatory and tax burdens in many sectors, and the loss of trust and confidence that has accompanied a grow-ing perception of cronyism have severely undermined America’s global competitiveness.
Asia and the PacificThe Asia–Pacific region spans the
world’s largest surface area, stretching from Japan and New Zealand in the East to Azerbaijan in the West. With 3.6 billion inhabitants, this region con-tains over half of the world’s popula-tion: one-third in China and nearly another third in India.
Despite the challenging global economic environment, the region has achieved an average annual eco-nomic growth rate of close to 6.5 per-cent over the past five years, driven largely by China, India, and other trade-oriented economies. The re-gion also has one of the lowest aver-age unemployment rates (4.3 per-cent) and the lowest average inflation rate (3.3 percent).
The Asia–Pacific region continues to score higher than world averages in five of the 12 categories of economic freedom related to government size and regulatory efficiency: tax burden, government spending, fiscal health, business freedom, and labor freedom.
Typically lower government expen-ditures result in a regional government spending score that is over five points
better than the world average. The re-gion’s labor freedom score also beats the world average by about five points, although many small Pacific island economies still lack fully developed formal labor markets. In other criti-cal areas of economic freedom such as protection of property rights, judicial effectiveness, government integrity, investment freedom, and financial freedom, the Asia–Pacific region as a whole lags behind world averages.
Notable Countries• Burma’s economy has undergone
significant changes. Economic sanctions have been eased or lifted, and the government has launched reforms to modern-ize the economic system. A new banking and finance law that lays the foundations for more efficient licensing of financial institutions has been ratified. In 2016, the lower house of parlia-ment also approved a new invest-ment law.
• China, with low deficits and a moderate level of public debt, benefited significantly in the rankings this year from the incor-poration of those two factors into the Index methodology. Regret-tably, there seems to be little mo-mentum for significant economic reform, and the government, confronting a period of economic slowdown, has increased its expansionary fiscal and mon-etary interventions. Deep-seated structural problems, including a state-controlled financial sec-tor and regulatory inefficiency, remain unaddressed.
• Capitalizing on its gradual inte-gration into the global trade and

9The Heritage Foundation | heritage.org/Index
investment system, Vietnam is transforming itself into a more market-oriented economy. Re-forms have included partial priva-tization of state-owned enter-prises, liberalization of the trade regime, and increasing recogni-tion of private property rights.
EuropeThe European region encompasses
nations as diverse as Russia, Switzer-land, Iceland, and Greece. The region’s population-weighted average GDP per capita stands at $31,661, and inflation is generally under control. However, the European continent is plagued by higher unemployment rates than are historically typical and by a growing level of public debt.
Relatively extensive and long-es-tablished free-market institutions in a number of countries allow the region to score far above the world average in most categories of economic free-dom. It is over 10 points ahead in both investment freedom and financial freedom. The region’s average scores for property rights, judicial effective-ness, and government integrity lead the world averages by about 15 points or more.
However, taken as a whole, the European region still struggles with a variety of policy barriers to dynamic economic expansion, such as overly protective and costly labor regulations, higher tax burdens, various market-distorting subsidies, and continuing problems in public finance caused by years of public-sector expansion. The result has been stagnant economic growth, which has exacerbated the burden of fiscal deficits and mount-ing debt in a number of countries in the region.
Notable Countries• The increasing dynamism of Lat-
via’s economy has been facilitated by openness to global trade and investment. Supported by ef-ficient business regulations that promote entrepreneurial activity, the overall commercial environ-ment has become conducive to business creation and risk-taking. Fiscal consolidation in recent years has kept government spend-ing under control and ensured macroeconomic stability.
• The United Kingdom has contin-ued its efforts to improve eco-nomic performance by reducing taxes and containing government spending, and growth rates have picked up somewhat. The loom-ing prospect of an exit from the European Union presents both major challenges and opportuni-ties to improve regulatory and other policies that bear on eco-nomic freedom.
• Russia’s economy is severely hampered by blatant disdain for the rule of law and rejection of any concept of limited govern-ment. The private sector remains marginalized by structural and institutional constraints caused by ever-growing gov-ernment encroachment into the marketplace. Rising infla-tionary pressure jeopardizes macroeconomic stability.
Middle East and North AfricaThe Middle East and North Africa
(MENA) region encompasses some of the world’s most ancient civilizations. Today, however, most of its economies are not free. Most notably, the region continues to be a critical global hot

10 2017 Index of Economic Freedom HIGHLIGHTS
spot for economic, political, and se-curity vulnerabilities.
The population-weighted average GDP per capita for the region is ap-proximately $18,803, and monetary stability is relatively well maintained. However, in recent years, the MENA region has been suffering from low economic growth and plagued by a high level of unemployment.
Since early 2011, many countries in the region have experienced so-cioeconomic upheaval or outright conflict, and outcomes have been far from certain. The lives of many ordi-nary people have yet to change for the better. Of the Arab Spring economies, Tunisia and Egypt have shown the most encouraging results over the past year. However, grading of economic freedom for Iraq, Libya, Syria, and Yemen remains suspended because of ongoing violence and unrest.
The MENA region is the absolute world leader in one notable category: tax policy. The region’s tax burden score is more than 10 points above the world average, a level reached because of the low income tax rates that are typical in the oil kingdoms. The region also scores slightly above the world average in such other areas as rule of law and regulatory efficiency, in part reflecting ongoing reform efforts that regional leaders are making to reduce bribery and government malfeasance.
Notable Countries• Israel’s economy has been on
a path of economic expansion. With the productive base increas-ingly diversified and structural reforms ongoing, steady growth has averaged over 3 percent an-nually over the past five years. Economic competitiveness has
been anchored in strong protec-tion of property rights and facili-tated by openness to global trade and investment.
• Morocco continues to make gradual but notable progress in economic liberalization. The country’s commitment to eco-nomic reform has encouraged the development of a dynamically evolving private sector. Policies that facilitate competitiveness and diversification of the pro-ductive base have contributed to economic expansion that has averaged approximately 4 percent annually over the past five years.
• Recent years’ broad-based and dynamic growth in the United Arab Emirates has been under-pinned by continuous efforts to strengthen the business climate, boost investment, and foster the emergence of a more vibrant and diverse private sector. The generally liberal trade regime has helped to sustain the momentum for growth.
Sub-Saharan AfricaSub-Saharan African countries are
distributed primarily within the lower ranks of economic freedom. Nonethe-less, a number of countries in the re-gion have benefited from substantial growth momentum, and the positive economic results achieved through limited advances in economic freedom have created valuable impetus for the additional institutional reforms that are needed to ensure long-term eco-nomic development.
However, the region as a whole continues to underperform in follow-ing through on policy changes that would encourage the emergence of a

11The Heritage Foundation | heritage.org/Index
more dynamic private sector. Struc-tural transformation and moderniza-tion remain patchy in many African countries. Limited diversification has resulted in less broad-based growth, with exports often concentrated in sectors with little scope for sustained increases in productivity.
Regrettably, in some cases, the signs of repeated government failure continue to be overwhelming. The population-weighted average GDP per capita for the region is only $5,334, the lowest level of any region. Unemploy-ment hovers at 7.7 percent.
More critically, uneven economic playing fields exacerbated by the weak rule of law continue to leave those who lack political connections with only limited prospects for a brighter future. The region’s scores for property rights, judicial effectiveness, and government integrity are lower than world aver-ages by 10 points or more.
Notable Countries• Côte d’Ivoire’s economic expan-
sion has been notable with a robust GDP growth rate averag-ing around 6 percent over the past five years. The government has undertaken much-needed reforms to maintain and further enhance the potential for growth. These measures include strength-ening management of public finances and regulatory reforms to foster the emergence of a more dynamic private sector.
• Performing far below its potential, South Africa’s economy has been stifled by political instability and a weakening rule of law. The ju-dicial system has become vulner-able to political interference, and numerous scandals and frequent political infighting have severely undermined government integri-ty. Private-sector growth remains constrained by structural and institutional impediments caused by growing government encroach-ment into the marketplace.
• Grading of Sudan’s economic freedom has resumed in the 2017 Index, reflecting the improved availability and quality of key eco-nomic data. The petroleum sector provides some economic stability and foreign exchange earnings, but other parts of the economy are underdeveloped and face seri-ous structural and institutional headwinds.

12 2017 Index of Economic Freedom HIGHLIGHTS
80–100 Free70–79.9 Mostly Free60–69.9 Moderately Free50–59.9 Mostly Unfree0–49.9 RepressedNot Graded
●
●
●
●
●
●
Economic Freedom Scores
ECONOMIC FREEDOM: REGIONAL VARIATIONS (REGIONAL AVERAGE)
Regional Ranking
The Americas
(60.0)Asia-Pacifi c
(60.3)Europe (68.0)
Middle East +North Africa
(61.9)
Sub-Saharan Africa (55.0)
1 Canada Hong Kong Switzerland United Arab Emirates Mauritius2 Chile Singapore Estonia Qatar Botswana3 United States New Zealand Ireland Israel Rwanda4 Colombia Australia United Kingdom Bahrain Côte d'Ivoire5 Uruguay Taiwan Georgia Jordan Namibia6 Jamaica South Korea Luxembourg Kuwait South Africa7 Peru Malaysia Netherlands Saudi Arabia Seychelles8 Panama Macau Lithuania Oman Swaziland
9Saint Vincent and the Grenadines
Brunei Darussalam
Denmark Morocco Uganda
10 Costa Rica Japan Sweden Tunisia Burkina Faso11 Saint Lucia Kazakhstan Latvia Lebanon Benin12 El Salvador Vanuatu Iceland Egypt Mali13 Dominica Thailand Finland Iran Gabon14 Mexico Philippines Norway Algeria Tanzania15 Guatemala Azerbaijan Germany Iraq Madagascar16 Dominican Republic Fiji Czech Republic Libya Nigeria17 Paraguay Tonga Austria Syria Cabo Verde18 Trinidad and Tobago Indonesia Macedonia Yemen Congo, Dem. Rep. of19 Bahamas Kyrgyz Republic Armenia Ghana
20 Nicaragua Cambodia Romania Guinea-Bissau
21 Honduras Bhutan Poland Senegal
22 Belize Samoa Kosovo Comoros
23 Guyana Tajikistan Bulgaria Zambia
24 Barbados China Cyprus São Tomé and Príncipe
25 Brazil Sri Lanka Belgium Mauritania
26 Argentina Nepal Malta Lesotho
27 Haiti Solomon Islands Hungary Kenya
28 Ecuador Bangladesh Slovak Republic Gambia
29 Suriname Mongolia Turkey Togo
30 Bolivia Micronesia Albania Burundi
31 Cuba Laos Spain Ethiopia
32 Venezuela Pakistan France Sierra Leone
33 India Portugal Malawi
34 Burma Italy Cameroon
35 Vietnam Montenegro Central African Republic
36 Uzbekistan Bosnia and Herzegovina Niger37 Papua New Guinea Croatia Mozambique38 Kiribati Slovenia Liberia39 Maldives Serbia Chad40 Afghanistan Belarus Sudan41 Turkmenistan Moldova Angola42 Timor-Leste Russia Guinea43 North Korea Greece Djibouti44 Ukraine Equatorial Guinea45 Liechtenstein Zimbabwe
46 Eritrea
47 Congo, Rep. of48 Somalia

Founded in 1973, The Heritage Foundation is a research and educational institution—a think tank—whose mission is to formulate and promote conservative public policies based on the principles of free enterprise, limited government, individual freedom, traditional American values, and a strong national defense.
We believe the principles and ideas of the American Founding are worth conserving and renewing. As policy entrepreneurs, we believe the most effective solutions are consistent with those ideas and principles. Our vision is to build an America where freedom, opportunity, prosperity, and civil society flourish.
Heritage’s staff pursues this mission by performing timely, accurate research on key policy issues and effectively marketing these findings to our primary audiences: members of Congress, key congressional staff members, policymakers in the executive branch, the nation’s news media, and the academic and policy communities.
Governed by an independent Board of Trustees, The Heritage Foundation is an independent, tax-exempt institution. Heritage relies on the private financial support of the general public—individuals, foundations, and corporations—for its income, and accepts no government funds and performs no contract work. Heritage is one of the nation’s largest public policy research organizations. Hundreds of thousands of individual members make it one of the most broadly supported think tanks in America.
For more information, or to support our work, please contact The Heritage Foundation at (800) 544-4843 or visit heritage.org.

Building an Americawhere freedom,
opportunity,prosperity, and
civil society flourish.