indexing sustainability: defining, measuring and managing ... · indexing sustainability: defining,...
TRANSCRIPT
Indexing Sustainability: Defining, Measuring and Managing the Performance of
Urban Development
Joyce Hsiang and Bimal Mendis (joint first authors)
School of Architecture,
Yale University, New Haven, CT, USA
email: [email protected]
email: [email protected]
Daniel Markiewicz and Ryan Welch (joint second authors)
School of Architecture,
Yale University, New Haven, CT, USA
email: [email protected]
email: [email protected]
Key Words: sustainable development, urban planning, index, performance indicators, cartography
Abstract
Future urban development is positioned to critically overwhelm global resources. Despite the need for
standards, a comprehensive and objective system for measuring and managing the sustainability of urban
development does not exist. This article investigates how sustainable development is defined; how its
performance can be measured through indexing and indicators; and how comparative and spatial indexing
methods have the potential to change the way cities are designed. The first section examines the complex
and reciprocal relationship between sustainability and urban development through a historic overview of its
definition. Key issues, objectives and challenges related to defining sustainability are discussed for the
purpose of helping establish general guidelines and principles of consideration when assigning value and
assessing urban development. The second section analyzes and compares existing sustainability indexes
and development indicators from multiple scales and sectors as a means of understanding how performance
of development can be assessed and accounted for with objective quantifiable measures. Differences,
strengths, and weaknesses are revealed through an analysis of index composition, scale and relative
measures of existing systems. The final section suggests and describes two new strategies for indexing the
sustainability of urban development: comparative indexing and spatial indexing. Comparative indexing
offers a more robust holistic approach and privileges use as an adaptable and discipline-bridging tool.
Spatial indexing allows for finer-grain site-specific analysis. The ability to locate and comprehensively
quantify the future performance of a proposed urban development within a larger network offers the
capacity for indexing to serve as a projective planning tool.
1. Sustainability & Urban Development How is Sustainable Development Defined?
1.1 Resource Management & Production In 1713, a mining administrator, Hans Carl von Carlowitz, coined the term, sustainability, or
“Nachhaltigkeit” in German. The over-exploitation of forests and scarcity of timber had created an energy
crisis that incapacitated the growing demands of the Saxon mining industry and more broadly, the
production of Germany’s emerging industries.1 Von Carlowitz’s publication, Silvicultura Oeconomica,
considered one of the first treatises on forestry, advocated for the effective management of forest resources
as a means of safeguarding an adequate supply of timber to viably fuel the economic vitality of the mining
industry, and by extension the livelihood of the community. Concern for the environment and the
management of natural resources arose as a necessary measure for sustaining production and thereby
protecting economic, social and political interests, rather than as a direct concern for the environment.
This early reference to “sustainability” before the forces of the Industrial Revolution had even begun to
exert its full strength, established the inextricable link between natural resources, capital, time and
development. The issue of defining “sustainability” immediately raises the question, “sustainability of
what?” Von Carlowitz’s answer might have been “sustainability of production,” or more generally,
development.
1.2 Sustainability vs. Development It is impossible to separate issues of sustainability from issues of development. The condition of
development – a pronounced state of growth or advancement – must, by definition, push and exceed
seemingly static limits, inevitably challenging the equilibrium of requisite inputs and resources required to
foster growth. Von Carlowitz’s proto-environmentalist conception of “sustainability” acknowledged the
limits of natural resources as a confining boundary that restricted development and therefore required
effective management. The concept of “sustainability” – its reason for being – emerged from the issue of
‘limits,’2 and the seemingly antithetical relationship between development and sustainability. The onset of
industrialization, unprecedented growth and an increasing appetite for resources were a pivotal context for
the materialization and evolution of a parallel and oppositional relationship between sustainability and
development.
1.3 Limits & the City Nowhere is this dialectic more evidently manifested than in the development of the post-industrial city. For
pre-industrialized settlements, sustainability was not a choice but an organizational imperative.3 Cities and
societies formed a self-regulating system, forced to balance human production and consumption. During
the Industrial Revolution, the city materialized as industrialization’s production center; it was also its
product. Urban growth simultaneously fueled and was fueled by the enlarged production systems, and the
city expanded beyond an economy of local subsistence. Traditional limits and boundaries of cities were
tested, enlarged, transgressed and dissolved as the rise of urbanization paralleled that of industrialization.4
The complex networks and intricate supply and production structures of the post-industrial city could no
longer be contained within discrete identifiable boundaries.
1.4 Shifting Priorities If von Carlowitz’s call for action was to manage natural resources for the larger objective of supporting
development, the increasing rate and scale of urbanization has resulted in a gradual reversal of this
paradigm. Rather than manage natural resource in order to sustain development, there is a shift in call to
manage development in order to sustain natural resources and the environment. This conflict in
determining the hierarchy of value between natural resources and development, or more generally capital,
is frequently referred to as “strong” vs. “weak” sustainability.5 The answer in current popular belief to the
question “sustainability of what?” might be “sustainability of the environment.” What were the various
threads that led to this critical shift in priorities?
Environmentalism is a relatively recent phenomenon in the trajectory towards the multiplicity of issues that
fall under the current conception of ‘sustainable development.’ The challenge of reconstruction and
economic and social development dominated the international agenda following the large-scale destruction
of the Second World War and the subsequent nation-building of newly-independent countries. Rebuilding
efforts directed new attention towards issues of human settlement, provision of basic needs, improvement
in quality of life and humane living conditions.6 Concern for the environment as a discrete objective only
gained global attention and momentum in the 60’s and early 70’s.7
While these issues of human settlement, and environmental management were initially treated as distinctly
separate, albeit related, concerns8 that linked to social and economic development, this schism was bridged
when in 1987 the Brundtland Report effectively synthesized the preexisting needs and concerns
surrounding development with environmental issues under one comprehensive term: sustainable
development. Authored by the United Nations’ World Commission on Environment and Development
(WCED), the report sought to “propose long-term environmental strategies for achieving sustainable
development” and marked two significant shifts in attitude towards the environment: the environment was
no longer treated as a separate entity,9 nor regarded as a supporting issue of second priority. Further, the
Commission synthesized goals of environment and development, describing an agenda of “common and
mutually supportive objectives that take account of the interrelationships between people, resources,
environment and development.”10
Entitled “Our Common Future,” the report equally weights development
and environment focusing on their mutually beneficial links and relationships and the need for a synthetic
strategy that integrats various objectives.11
The acknowledgement of a need for a unified holistic approach
reflects an important change in attitude. It however, inevitably creates difficulty in assessing relative
importance and value.
1.5 Global Consensus As the world’s foremost consensus-building apparatus, the “global agenda for change” of the United
Nation’s Brundtland report established the issue of “sustainable development” as one of global concern and
responsibility. This globally-coordinated effort arose from the general realization that the impact of human
action was no longer local or regional, but had created a predicament of massive scale and complexity.12
Additionally, it resulted in the creation of what is still the most commonly referenced definition of
sustainability, that which “meets the needs of the present without compromising the ability of future
generations to meet their own needs.”13
1.6 Time At the core of the Brundtland report’s definition of sustainability is the identification of time as a value.
Brundtland effectively took the collective concern for the use and abuse of resources and framed the issues
within a generational timeline. By alluding to considerations of “future generations” the span of time to
consider is stretched from a day or a year to decades and centuries. Precisely how far in advance is
indeterminate and the already complicated task of assessing the value of development related to the value
of the environment is compounded by the differences embedded in multiple timescales. In all cases, the
Brundtland definition and its valuation of the future recasts sustainability as a projective practice of
planning for the future.
1.7 Synthesis & Multiplicity The ambitious task of defining a unified global vision for sustainable development also served as an
apparatus for building consensus. Following the Brundtland Report, the United Nations has continued to
assume leadership in brokering consensus on sustainable development through the often laborious yet
important mechanism of international conferences, conventions and summits, yielding a relentless arsenal
of reports, agendas, goals, plans, strategies, recommendations, resolutions and protocols. The UN has
continued even further along this path of synthesizing global issues under a single set of objectives,
creating even more added complexity and multiplicity to the objectives of development. The United
Nations Summit on Environment and Development in Rio de Janerio in 1992, which produced Agenda 21,
addressed not only environmental issues, for which it is well known, but also identified poverty, changing
consumption patterns, and sustainable settlement as important areas in need of attention. Similarly, the
2000 U.N. Millennium Goals combined a diverse but specific set of objectives including primary
education, gender equality and “environmental sustainability”.
This strategy of synthesis has also been paralleled in disciplines outside international policy, where three
all-encompassing categories are frequently identified as the defining pillars of sustainability – the Social,
Economic and Environmental.14
Central to the vision of the three pillars of sustainability is the idea of the
Triple Bottom Line. Conceived in 1998, the concept attempts to expand business responsibility to include
not just shareholders but stakeholders. 15
The complex triangulation of the triple bottom line is further
compounded by the frequent inclusion of a fourth pillar, often integrated to address shortcomings of the
other three. Culture is often cited as a fourth and all-encompassing pillar, while natural resources,
institutions and politics often substitute.
1.8 Appropriation
The simplicity and flexibility of early definitions of “sustainable development” has made it accessible
enough for a wide array of fields and disciplines to adopt the term. A multitude of definitions have been
put forward since Brundtland’s initial report. The escalating number of available disciplinary-specific
definitions has led one scholar to cynically label the definitions pursuit, “a favorite pastime for some
academics,” and its successful acquisition, “the holy grail of environmental economics.”16
The word
“sustainable” gained so much attention that it was the most popular word in 2006, and earned the title of
one of the Top 25 Most Popular Words of the Decade according to the Global Language Monitor, a
language-analytics annual global survey that uses algorithmic methods to track the popularity of word use

in both online and print media.17
Their assessment of the definition of “sustainable” according to current
conventional wisdom and media use surmises, “Originally a ‘green’ term, [‘sustainable’] has moved into
the mainstream meaning ‘self-generating’ as in ‘wind power is a sustainable power supply’. Can apply to
populations, marriages, agriculture, economies, and the like. The opposite of ‘disposable’.” Indeed,
government and corporate organizations have been cited as notable proponents of the use and misuse of the
term, claiming everything from coffee cups to foreign policy strategies ‘sustainable.’
1.9 Visualizing Value
The increased popularity and appropriation of “sustainability” has resulted in a wide-ranging complexity
and multiplicity of meaning. Generated to help clarify the meaning and visualize the desired hierarchy of
relationships between the competing interests of the social, economic and environmental, the proliferation
of diagrams borders on confusion. These sustainability diagrams, often seen as three equivalent and
competing spheres linked through a ubiquitous structural diagram, attempt to objectively categorize and
express an over-arching vision for sustainability: three intersecting circles, with sustainability at the center.
Variations in organization including intersecting venn diagrams, concentric circles, pie charts, molecular
skeletal diagrams, helixes, and wind roses, expanding from the basic three competing factors to include an
enormous number of competing interests. These additional criteria often reflect the different ideals and
agendas of the author of each diagram. Overall, these various diagrams visualize attempts at quantitatively
assessing and attributing value to competing interests as a means of defining and measuring sustainability.
Figure 1: A Multiplicity of Sustainability Diagrams
1.10 The Worst is Yet to Come: Urban Growth Since von Carlowitz’s time, urban growth has prevailed as a constant defining force, from the industrial
city and the modern metropolis to the identification of regional conurbations, urban agglomerations and the
rising count of megacities.18
Unprecedented rates of urbanization and massive urban growth that surpass
expectations, forecasts or preceding trends, has been a recurring event throughout history. The most recent global urbanization statistics predict nearly 70% of the world’s 9.3 billion people will live
in urban areas by 2050.19
Each week, the urban population rises by over a million people a week. The
tipping point of a global urban majority, reached for the first time in 2008, is a mere precursor to an
accelerating phenomenon of relentless and rapid urban population growth. More significantly, this urban
growth will be concentrated in new and expanding megacities of the developing world, where
industrialization, modernization and significant growth are still burgeoning forces that have yet to mete out
their full impact.20
Sustainability and urban development have become increasingly critical counterpoints,
as the economic, social, political and environmental infrastructure of cities must bear unprecedented loads.
Urban development is increasingly the locus of resource consumption worldwide; globally, cities are not
only responsible for approximately 75% of all the energy used, they also account for 60% of all water
consumption and 80% of all greenhouse gases produced.21
Urban areas simultaneously account for a
disproportionate percentage of a country’s national output. In the US, cities contain 83% of the nation’s
residents, 85% of its jobs, and generate 90% of its economic production and federal tax revenue. The
White House’s newly formulated Office of Urban Affairs states that the 363 metropolitan areas of the US
create and produce the bulk of the country’s assets and human capital. A new national urban policy further
describes cities as the “critical engines of the economy, the locus of national assets, and the vehicle by
which we solve the most pressing national issues of our time.” 22
As cities around the world formulate sustainable agendas, eliciting a growing and varied battery of green
master plans, ecological towns, and zero carbon cities23
, the urban condition is no longer a cautionary tale
for inevitable collapse, re-emerging instead as a contested terrain injected with renewed possibility.
How can value be assessed and quantified?
2. Index and Indicator Analysis How is Sustainable Development Measured?
2.1 Background
The long-term growth and development of urban areas will depend on how efficiently they can organize
and operate.24
Cities vying for a competitive advantage relative to the twin demands of efficiency and
equilibrium need a methodology for evaluating their performance. The research examines how the
performance of development can be measured and translated into a quantifiable and objective measure of
accountability.
2.1.1 Existing Indexes of Sustainability
Indexing provides information to enable decision-making and offers an apparatus for benchmarking
performance and directing development. The Dow Jones Industrial Average (DJIA), for example, indexes
the trading activity of 30 specifically selected companies, their general value thereby representing the
market average of the US economy and the collective health of the stock market.25
Many sustainability
indexes for development already exist, albeit with less absolute value, general acceptance, or clarity as the
Dow Jones.
Indexes operate with a particular bias defined by each institution’s objectives and goals. In many cases, the
indexes privilege a singular method, focusing on either leading (issue-based) or lagging (result-based)
measures. Issue-based systems of leading indicators are geared towards policy-makers and city officials
(United Nations-Habitat, United Nations Development Programme) with issues ranging from human rights
and poverty levels to literacy and government stability. End-result based systems of lagging indicators, on
the other hand, privilege outcomes for accounting and bench marking. In contrast to publicly available
frameworks by the UN and other agencies, indexes are frequently trademarked with restricted access, such
as ARUP’s, “Sustainable Project Appraisal Routine” (SPeAR)®, which is marketed as a private product – a
professional service for purchase by paying clients. Also, while indexes give the semblance of
transparency, they are also subject to biases stemming from national interest and pride that may impede
objectivity.26
2.1.2 Indicators Indexes typically consist of sets of indicators. Indicators simplify, refine, synthesize and calibrate a breadth
of information into exact and comparable measures. Within any index, similar indicators are often grouped
into broader categories that indicate a general quality, characteristic or attribute. For example, levels of
CO2, air pollutants, etc., tend to be grouped together under general categories such as atmosphere or air
quality. The selection of specific indicators into an index is contingent on the objectives of the authoring
institution or agency. It not only influences results, but also helps direct policy and influences attitudes.
According to the United Nation’s Sustainable Development: Guidelines and Methodologies, indicators help
to make informed decisions concerning sustainable development, and perform multiple functions.27
These
include the identification of issues and trends, compilation and clarification of information for planning and
decision-making, communication of ideas for policies and resource allocation, and utilization of early
warning systems.28
By measuring both the tangible and intangible, they can be important instruments in
evaluating the performance of urban development. Underscoring the role of indicators, the UN
Conference on Environment and Development in Rio de Janeiro called for countries, organizations and
non-governmental groups to develop indicators of sustainable development that can provide a solid basis
for decision making at all levels.29
2.2 Analysis
Over 670 different indicators of sustainability from a variety of existing sustainability indexes were
analyzed to deconstruct and reveal differences in visions and strategies across indexes and create
transparency through comparison. Indexes were analyzed relative to their scale, indicator composition,
indicator groupings, and units of measure. These measures range from absolute metrics (i.e., units such as
volume, area, population, etc.) to relative metrics (i.e., ratios such as per capita, per land area, per GDP, per
time, etc.). Most sustainability indexes are targeted for a specific scale from national, city, development
and building scale indexes to business and product indexes. These include indicator sets from agencies
such as the United Nations Commission on Sustainable Development (UN-CSD), World Bank,
Organisation for Economic Co-operation and Development (OECD), The Economist Intelligence Unit,
Siemens and Walmart (Table 1). 30
Index Year Author Scale Indicators
Dow Jones Sustainability Index (DJSI) 2010 Dow Jones Business 12
Walmart Supplier Sustainability Assessment 2009 Walmart Business 17
Environmental Data Compendium 2008 OECD, Environmental Performance & Info.
Division
National 135
Indicators of Sustainable Development (ISD) 2007 UN Commission on Sustainable Development
(UN-CSD)
National 94
Environmental Sustainability Index (ESI) 2005 Yale Center for Environmental Law & Policy,
Columbia Center for International Earth
Science Info, European Commission Joint
Research Center, World Economic Forum
National 76
Purchasing Power Parity Index (PPP) 2008 World Bank National 1
Human Development Index (HDI) 2009 United Nations National 4
GINI Index Equity of Income Distribution 2009 United Nations Development Program National 1
China Development Bank (CDB) N/A China Development Bank City 107
European Green City Index EGCI) 2009 The Economist Intelligence Unit & Siemens City 30
Urban Sustainability Indicators (USI) 1998 European Foundation City 40
Land & Natural Development Code (LAND) 2007 Diana Balmori & Gaboury Benoit Development 99
LEED Neighborhood Development Rating
System (LEED-ND)
2009 LEED and USGBC Development 56
672
Table 1: Over 670 indicators in 13 indexes were analyzed.
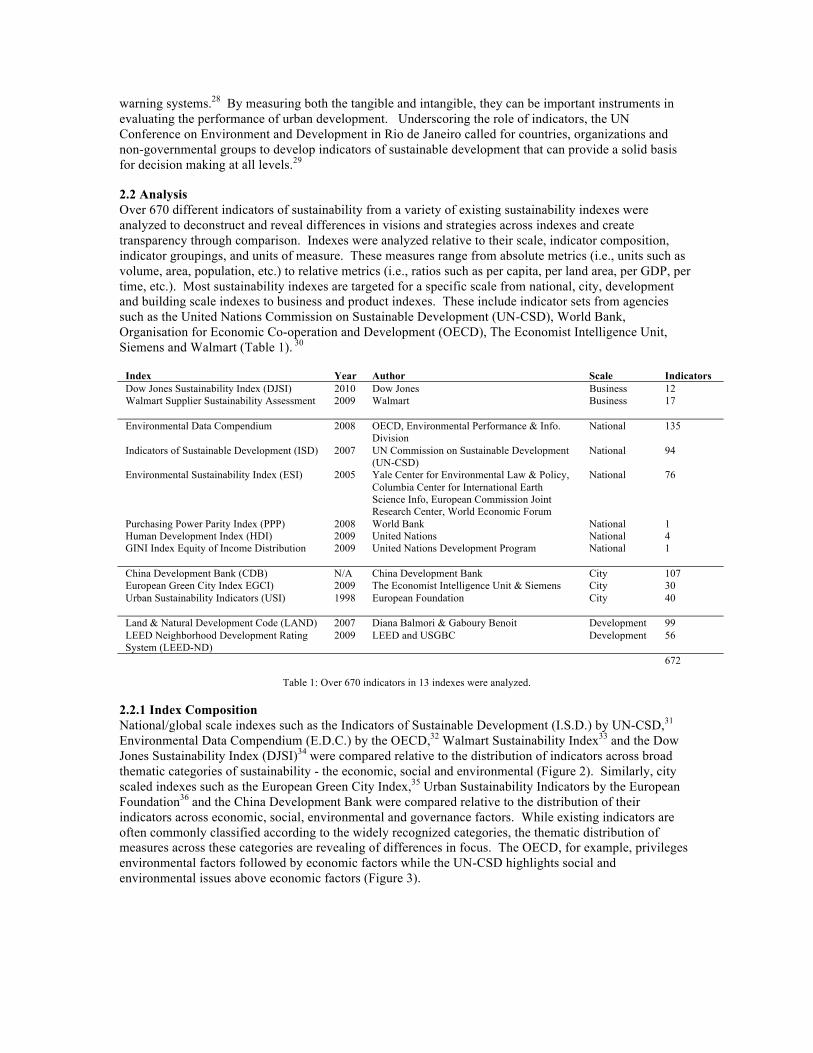
2.2.1 Index Composition
National/global scale indexes such as the Indicators of Sustainable Development (I.S.D.) by UN-CSD,31
Environmental Data Compendium (E.D.C.) by the OECD,32
Walmart Sustainability Index33
and the Dow
Jones Sustainability Index (DJSI)34
were compared relative to the distribution of indicators across broad
thematic categories of sustainability - the economic, social and environmental (Figure 2). Similarly, city
scaled indexes such as the European Green City Index,35
Urban Sustainability Indicators by the European
Foundation36
and the China Development Bank were compared relative to the distribution of their
indicators across economic, social, environmental and governance factors. While existing indicators are
often commonly classified according to the widely recognized categories, the thematic distribution of
measures across these categories are revealing of differences in focus. The OECD, for example, privileges
environmental factors followed by economic factors while the UN-CSD highlights social and
environmental issues above economic factors (Figure 3).
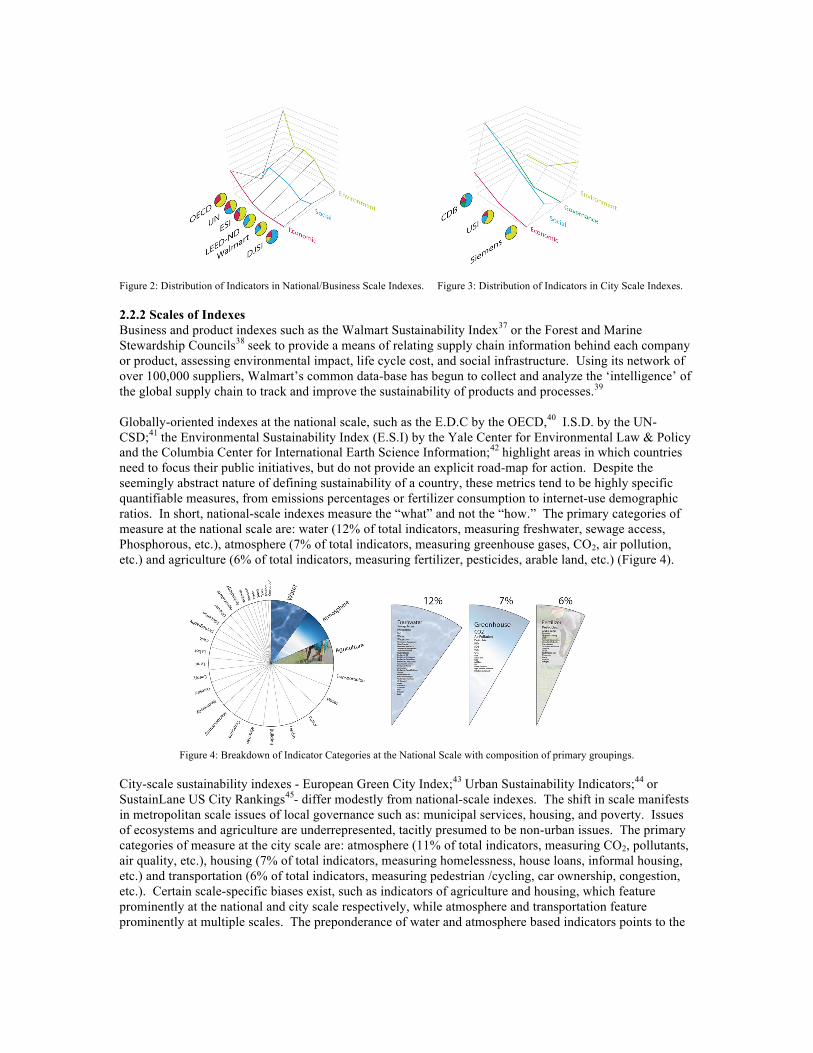
Figure 2: Distribution of Indicators in National/Business Scale Indexes. Figure 3: Distribution of Indicators in City Scale Indexes.
2.2.2 Scales of Indexes
Business and product indexes such as the Walmart Sustainability Index37
or the Forest and Marine
Stewardship Councils38
seek to provide a means of relating supply chain information behind each company
or product, assessing environmental impact, life cycle cost, and social infrastructure. Using its network of
over 100,000 suppliers, Walmart’s common data-base has begun to collect and analyze the ‘intelligence’ of
the global supply chain to track and improve the sustainability of products and processes.39
Globally-oriented indexes at the national scale, such as the E.D.C by the OECD,40
I.S.D. by the UN-
CSD;41
the Environmental Sustainability Index (E.S.I) by the Yale Center for Environmental Law & Policy
and the Columbia Center for International Earth Science Information;42
highlight areas in which countries
need to focus their public initiatives, but do not provide an explicit road-map for action. Despite the
seemingly abstract nature of defining sustainability of a country, these metrics tend to be highly specific
quantifiable measures, from emissions percentages or fertilizer consumption to internet-use demographic
ratios. In short, national-scale indexes measure the “what” and not the “how.” The primary categories of
measure at the national scale are: water (12% of total indicators, measuring freshwater, sewage access,
Phosphorous, etc.), atmosphere (7% of total indicators, measuring greenhouse gases, CO2, air pollution,
etc.) and agriculture (6% of total indicators, measuring fertilizer, pesticides, arable land, etc.) (Figure 4).
Figure 4: Breakdown of Indicator Categories at the National Scale with composition of primary groupings.
City-scale sustainability indexes - European Green City Index;43
Urban Sustainability Indicators;44
or
SustainLane US City Rankings45
- differ modestly from national-scale indexes. The shift in scale manifests
in metropolitan scale issues of local governance such as: municipal services, housing, and poverty. Issues
of ecosystems and agriculture are underrepresented, tacitly presumed to be non-urban issues. The primary
categories of measure at the city scale are: atmosphere (11% of total indicators, measuring CO2, pollutants,
air quality, etc.), housing (7% of total indicators, measuring homelessness, house loans, informal housing,
etc.) and transportation (6% of total indicators, measuring pedestrian /cycling, car ownership, congestion,
etc.). Certain scale-specific biases exist, such as indicators of agriculture and housing, which feature
prominently at the national and city scale respectively, while atmosphere and transportation feature
prominently at multiple scales. The preponderance of water and atmosphere based indicators points to the
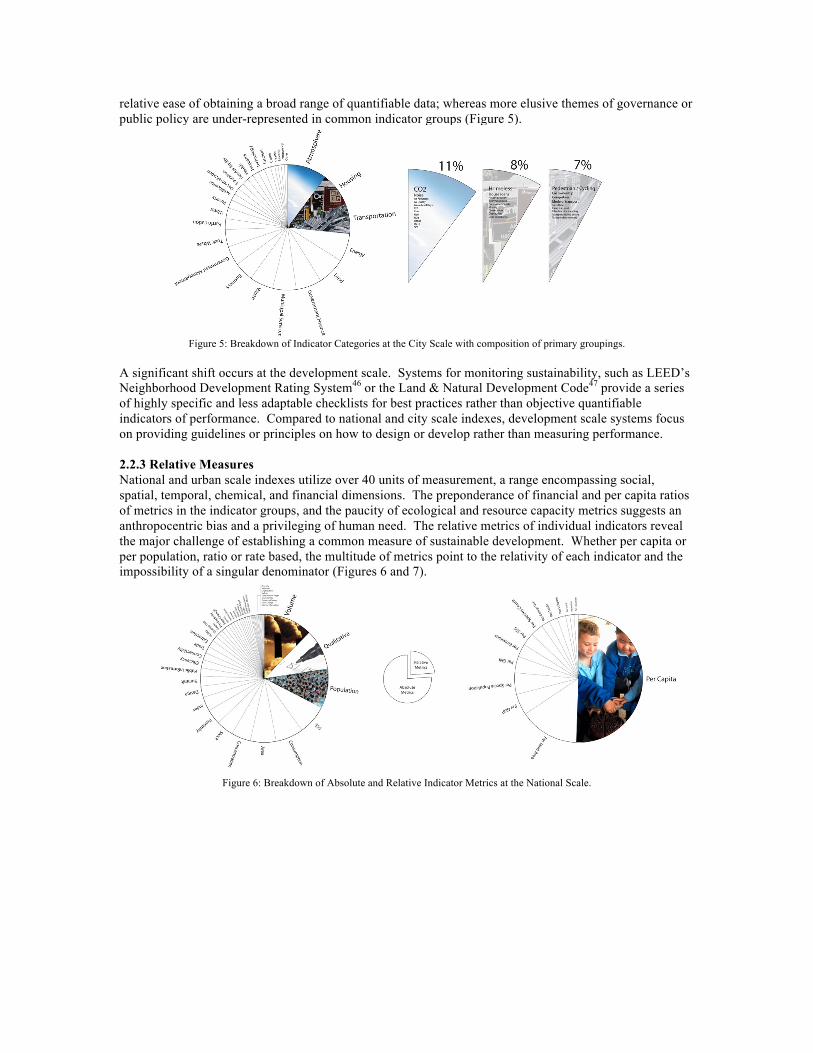
relative ease of obtaining a broad range of quantifiable data; whereas more elusive themes of governance or
public policy are under-represented in common indicator groups (Figure 5).
Figure 5: Breakdown of Indicator Categories at the City Scale with composition of primary groupings.
A significant shift occurs at the development scale. Systems for monitoring sustainability, such as LEED’s
Neighborhood Development Rating System46
or the Land & Natural Development Code47
provide a series
of highly specific and less adaptable checklists for best practices rather than objective quantifiable
indicators of performance. Compared to national and city scale indexes, development scale systems focus
on providing guidelines or principles on how to design or develop rather than measuring performance.
2.2.3 Relative Measures
National and urban scale indexes utilize over 40 units of measurement, a range encompassing social,
spatial, temporal, chemical, and financial dimensions. The preponderance of financial and per capita ratios
of metrics in the indicator groups, and the paucity of ecological and resource capacity metrics suggests an
anthropocentric bias and a privileging of human need. The relative metrics of individual indicators reveal
the major challenge of establishing a common measure of sustainable development. Whether per capita or
per population, ratio or rate based, the multitude of metrics point to the relativity of each indicator and the
impossibility of a singular denominator (Figures 6 and 7).
Figure 6: Breakdown of Absolute and Relative Indicator Metrics at the National Scale.
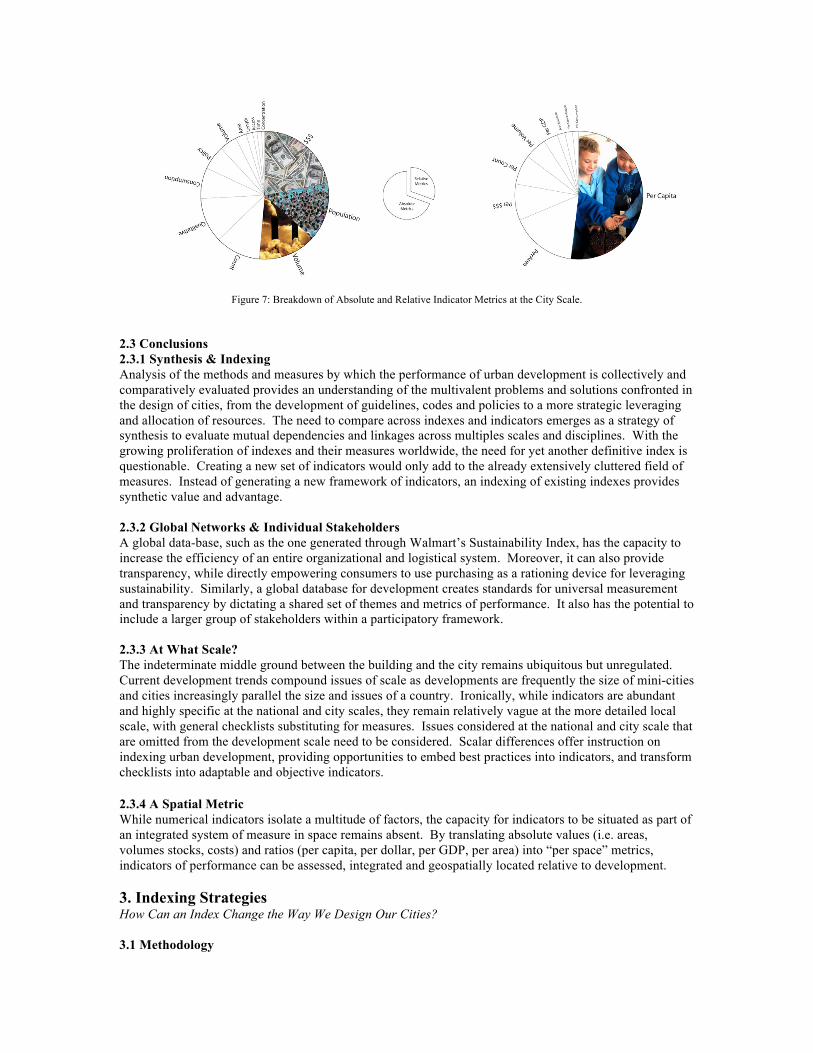
Figure 7: Breakdown of Absolute and Relative Indicator Metrics at the City Scale.
2.3 Conclusions 2.3.1 Synthesis & Indexing Analysis of the methods and measures by which the performance of urban development is collectively and
comparatively evaluated provides an understanding of the multivalent problems and solutions confronted in
the design of cities, from the development of guidelines, codes and policies to a more strategic leveraging
and allocation of resources. The need to compare across indexes and indicators emerges as a strategy of
synthesis to evaluate mutual dependencies and linkages across multiples scales and disciplines. With the
growing proliferation of indexes and their measures worldwide, the need for yet another definitive index is
questionable. Creating a new set of indicators would only add to the already extensively cluttered field of
measures. Instead of generating a new framework of indicators, an indexing of existing indexes provides
synthetic value and advantage.
2.3.2 Global Networks & Individual Stakeholders
A global data-base, such as the one generated through Walmart’s Sustainability Index, has the capacity to
increase the efficiency of an entire organizational and logistical system. Moreover, it can also provide
transparency, while directly empowering consumers to use purchasing as a rationing device for leveraging
sustainability. Similarly, a global database for development creates standards for universal measurement
and transparency by dictating a shared set of themes and metrics of performance. It also has the potential to
include a larger group of stakeholders within a participatory framework.
2.3.3 At What Scale?
The indeterminate middle ground between the building and the city remains ubiquitous but unregulated.
Current development trends compound issues of scale as developments are frequently the size of mini-cities
and cities increasingly parallel the size and issues of a country. Ironically, while indicators are abundant
and highly specific at the national and city scales, they remain relatively vague at the more detailed local
scale, with general checklists substituting for measures. Issues considered at the national and city scale that
are omitted from the development scale need to be considered. Scalar differences offer instruction on
indexing urban development, providing opportunities to embed best practices into indicators, and transform
checklists into adaptable and objective indicators.
2.3.4 A Spatial Metric
While numerical indicators isolate a multitude of factors, the capacity for indicators to be situated as part of
an integrated system of measure in space remains absent. By translating absolute values (i.e. areas,
volumes stocks, costs) and ratios (per capita, per dollar, per GDP, per area) into “per space” metrics,
indicators of performance can be assessed, integrated and geospatially located relative to development.
3. Indexing Strategies How Can an Index Change the Way We Design Our Cities?
3.1 Methodology
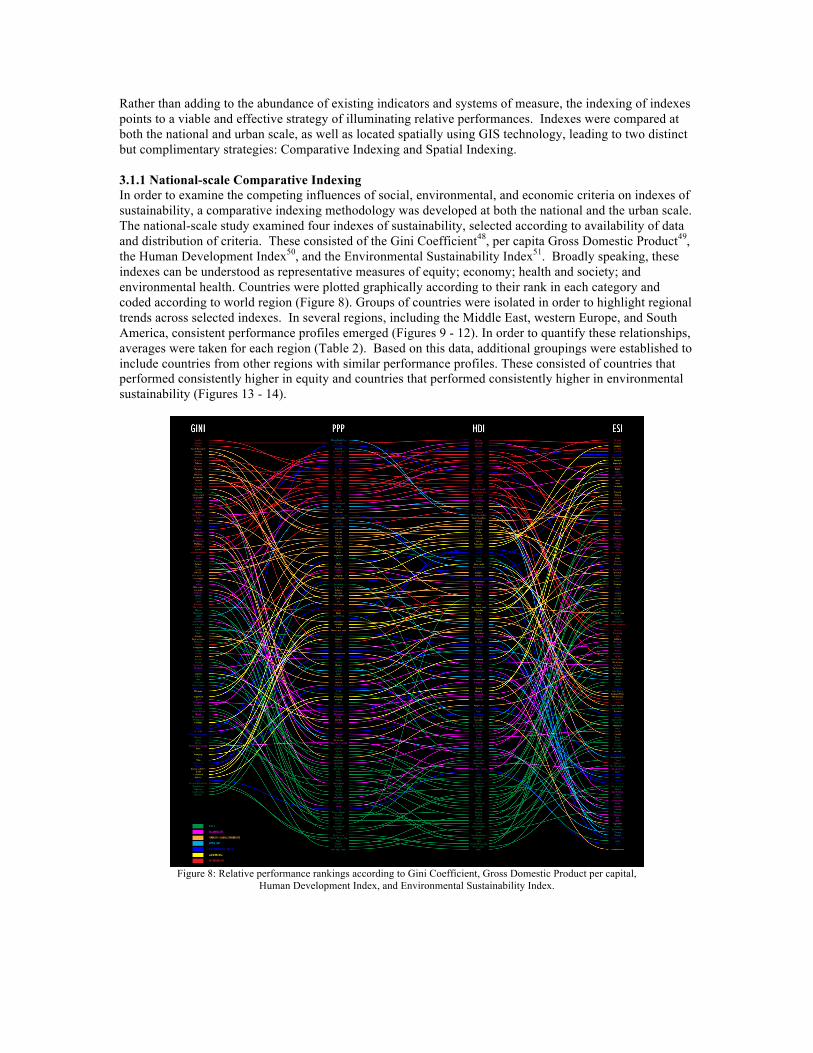
Rather than adding to the abundance of existing indicators and systems of measure, the indexing of indexes
points to a viable and effective strategy of illuminating relative performances. Indexes were compared at
both the national and urban scale, as well as located spatially using GIS technology, leading to two distinct
but complimentary strategies: Comparative Indexing and Spatial Indexing.
3.1.1 National-scale Comparative Indexing
In order to examine the competing influences of social, environmental, and economic criteria on indexes of
sustainability, a comparative indexing methodology was developed at both the national and the urban scale.
The national-scale study examined four indexes of sustainability, selected according to availability of data
and distribution of criteria. These consisted of the Gini Coefficient48
, per capita Gross Domestic Product49
,
the Human Development Index50
, and the Environmental Sustainability Index51
. Broadly speaking, these
indexes can be understood as representative measures of equity; economy; health and society; and
environmental health. Countries were plotted graphically according to their rank in each category and
coded according to world region (Figure 8). Groups of countries were isolated in order to highlight regional
trends across selected indexes. In several regions, including the Middle East, western Europe, and South
America, consistent performance profiles emerged (Figures 9 - 12). In order to quantify these relationships,
averages were taken for each region (Table 2). Based on this data, additional groupings were established to
include countries from other regions with similar performance profiles. These consisted of countries that
performed consistently higher in equity and countries that performed consistently higher in environmental
sustainability (Figures 13 - 14).
Figure 8: Relative performance rankings according to Gini Coefficient, Gross Domestic Product per capital,
Human Development Index, and Environmental Sustainability Index.
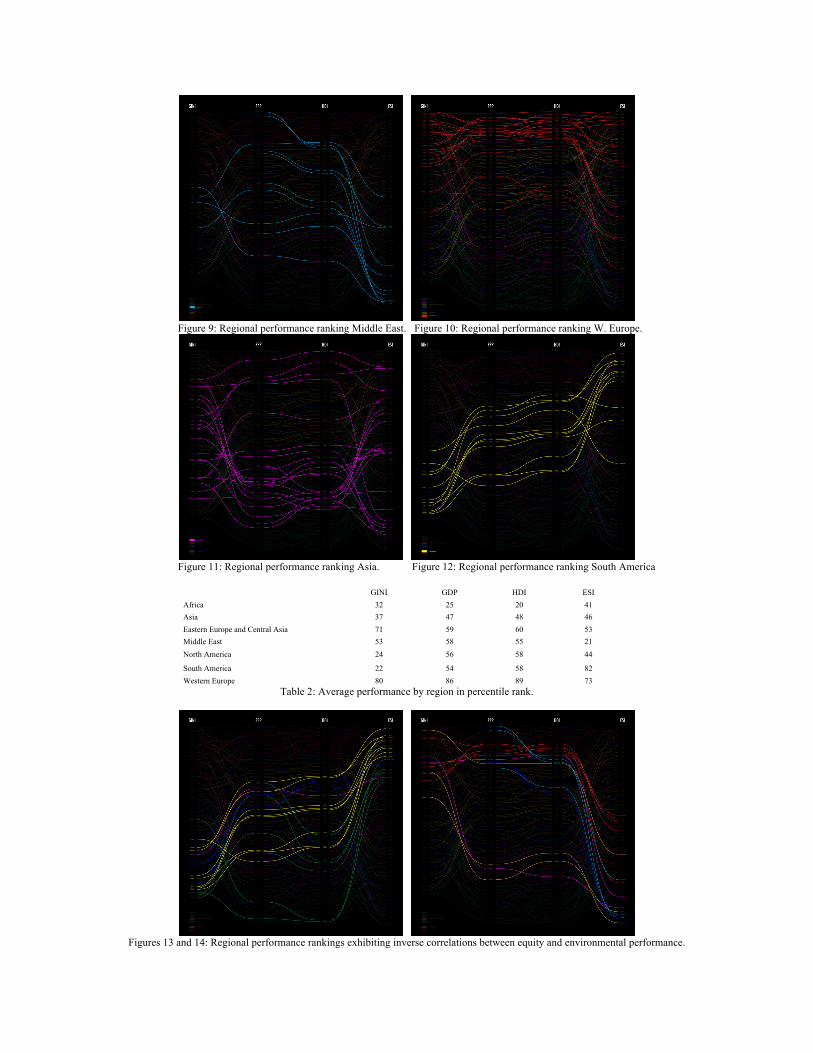
Figure 9: Regional performance ranking Middle East. Figure 10: Regional performance ranking W. Europe.
Figure 11: Regional performance ranking Asia. Figure 12: Regional performance ranking South America
GINI GDP HDI ESI
Africa 32 25 20 41
Asia 37 47 48 46
Eastern Europe and Central Asia 71 59 60 53
Middle East 53 58 55 21
North America 24 56 58 44
South America 22 54 58 82
Western Europe 80 86 89 73
Table 2: Average performance by region in percentile rank.
Figures 13 and 14: Regional performance rankings exhibiting inverse correlations between equity and environmental performance.
The national-scale comparative indexing exhibited strong regional trends, particularly with regard to
disparities between environmental performance (ESI) and either economy (GDP per capita) or equity (Gini
coefficient). South American countries collectively performed the worst of all regions in terms of income
distribution, averaging in the 22nd
percentile, yet exhibited the strongest environmental performance of any
region, averaging in the 82nd
percentile, nine points above Western Europe. The Middle East exhibited the
reverse trend, a moderately strong performance in equity (53rd
percentile), economy (58th
percentile), and
heath/society (55th
percentile), compared to the worst environmental performance (21st percentile).
These findings point to the need for further investigation into the sources of such consistent regional trends.
For instance, latent regional biases may exist for certain indicators, particularly those directly dependent on
natural resources. Conversely, the inverse correlation of equitable income distribution and environmental
performance may be indicative of real-world behavior: that prosperity yields a greater ecological footprint.
These trends also point to the potential for new peer group designations in further studies. South American
countries may be grouped with Costa Rica, Panama, Malaysia, Botswana, and Namibia, which have higher
environmental but lower equity performance. Likewise, Middle Eastern countries may be grouped with the
Czech Republic, Belgium, South Korea, Italy, Spain, Greece, and the United Kingdom, which have higher
performance in equity and economy but markedly lower performance in environment.
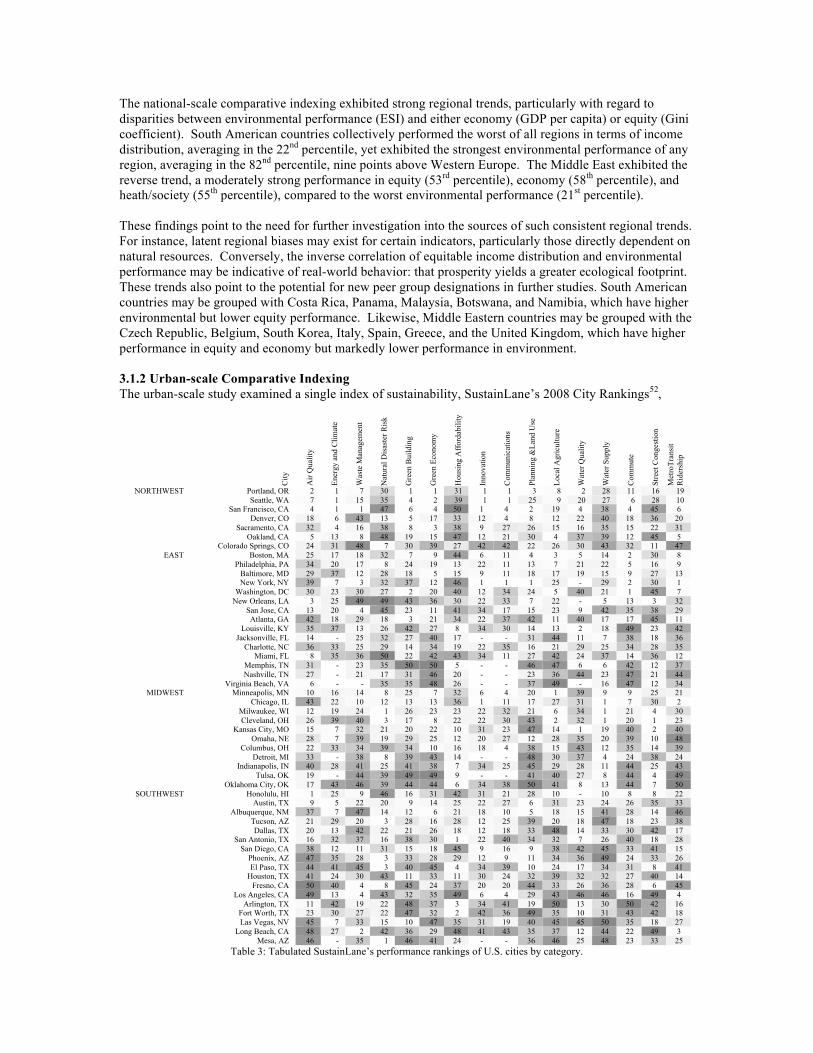
3.1.2 Urban-scale Comparative Indexing
The urban-scale study examined a single index of sustainability, SustainLane’s 2008 City Rankings52
,
Cit
y
Air
Qual
ity
Ener
gy a
nd C
lim
ate
Was
te M
anag
emen
t
Nat
ura
l D
isas
ter
Ris
k
Gre
en B
uil
din
g
Gre
en E
conom
y
Ho
usi
ng
Aff
ord
abil
ity
Innovat
ion
Com
munic
atio
ns
Pla
nnin
g &
Lan
d U
se
Loca
l A
gri
cult
ure
Wat
er Q
ual
ity
Wat
er S
upply
Com
mute
Str
eet
Conges
tion
Met
roT
ran
sit
Rid
ersh
ip
Portland, OR 2 1 7 30 1 1 31 1 1 3 8 2 28 11 16 19
Seattle, WA 7 1 15 35 4 2 39 1 1 25 9 20 27 6 28 10 San Francisco, CA 4 1 1 47 6 4 50 1 4 2 19 4 38 4 45 6
Denver, CO 18 6 43 13 5 17 33 12 4 8 12 22 40 18 36 20
Sacramento, CA 32 4 16 38 8 3 38 9 27 26 15 16 35 15 22 31
Oakland, CA 5 13 8 48 19 15 47 12 21 30 4 37 39 12 45 5
NORTHWEST
Colorado Springs, CO 24 31 48 7 30 39 27 42 42 22 26 30 43 32 11 47
Boston, MA 25 17 18 32 7 9 44 6 11 4 3 5 14 2 30 8
Philadelphia, PA 34 20 17 8 24 19 13 22 11 13 7 21 22 5 16 9
Baltimore, MD 29 37 12 28 18 5 15 9 11 18 17 19 15 9 27 13 New York, NY 39 7 3 32 37 12 46 1 1 1 25 - 29 2 30 1
Washington, DC 30 23 30 27 2 20 40 12 34 24 5 40 21 1 45 7
New Orleans, LA 3 25 49 49 43 36 30 22 33 7 22 - 5 13 3 32
San Jose, CA 13 20 4 45 23 11 41 34 17 15 23 9 42 35 38 29 Atlanta, GA 42 18 29 18 3 21 34 22 37 42 11 40 17 17 45 11
Louisville, KY 35 37 13 26 42 27 8 34 30 14 13 2 18 49 23 42
Jacksonville, FL 14 - 25 32 27 40 17 - - 31 44 11 7 38 18 36
Charlotte, NC 36 33 25 29 14 34 19 22 35 16 21 29 25 34 28 35 Miami, FL 8 35 36 50 22 42 43 34 11 27 42 24 37 14 36 12
Memphis, TN 31 - 23 35 50 50 5 - - 46 47 6 6 42 12 37
Nashville, TN 27 - 21 17 31 46 20 - - 23 36 44 23 47 21 44
EAST
Virginia Beach, VA 6 - - 35 35 48 26 - - 37 49 - 16 47 12 34 Minneapolis, MN 10 16 14 8 25 7 32 6 4 20 1 39 9 9 25 21
Chicago, IL 43 22 10 12 13 13 36 1 11 17 27 31 1 7 30 2
Milwaukee, WI 12 19 24 1 26 23 23 22 32 21 6 34 1 21 4 30
Cleveland, OH 26 39 40 3 17 8 22 22 30 43 2 32 1 20 1 23 Kansas City, MO 15 7 32 21 20 22 10 31 23 47 14 1 19 40 2 40
Omaha, NE 28 7 39 19 29 25 12 20 27 12 28 35 20 39 10 48
Columbus, OH 22 33 34 39 34 10 16 18 4 38 15 43 12 35 14 39
Detroit, MI 33 - 38 8 39 43 14 - - 48 30 37 4 24 38 24 Indianapolis, IN 40 28 41 25 41 38 7 34 25 45 29 28 11 44 25 43
Tulsa, OK 19 - 44 39 49 49 9 - - 41 40 27 8 44 4 49
MIDWEST
Oklahoma City, OK 17 43 46 39 44 44 6 34 38 50 41 8 13 44 7 50
Honolulu, HI 1 25 9 46 16 31 42 31 21 28 10 - 10 8 8 22 Austin, TX 9 5 22 20 9 14 25 22 27 6 31 23 24 26 35 33
Albuquerque, NM 37 7 47 14 12 6 21 18 10 5 18 15 41 28 14 46
Tucson, AZ 21 29 20 3 28 16 28 12 25 39 20 18 47 18 23 38
Dallas, TX 20 13 42 22 21 26 18 12 18 33 48 14 33 30 42 17 San Antonio, TX 16 32 37 16 38 30 1 22 40 34 32 7 26 40 18 28
San Diego, CA 38 12 11 31 15 18 45 9 16 9 38 42 45 33 41 15
Phoenix, AZ 47 35 28 3 33 28 29 12 9 11 34 36 49 24 33 26
El Paso, TX 44 41 45 3 40 45 4 34 39 10 24 17 34 31 8 41 Houston, TX 41 24 30 43 11 33 11 30 24 32 39 32 32 27 40 14
Fresno, CA 50 40 4 8 45 24 37 20 20 44 33 26 36 28 6 45
Los Angeles, CA 49 13 4 43 32 35 49 6 4 29 43 46 46 16 49 4
Arlington, TX 11 42 19 22 48 37 3 34 41 19 50 13 30 50 42 16 Fort Worth, TX 23 30 27 22 47 32 2 42 36 49 35 10 31 43 42 18
Las Vegas, NV 45 7 33 15 10 47 35 31 19 40 45 45 50 35 18 27
Long Beach, CA 48 27 2 42 36 29 48 41 43 35 37 12 44 22 49 3
SOUTHWEST
Mesa, AZ 46 - 35 1 46 41 24 - - 36 46 25 48 23 33 25
Table 3: Tabulated SustainLane’s performance rankings of U.S. cities by category.
by comparing the performance of 50 US cities in each of the study’s 16 constituent categories. Cities were
plotted graphically according to their relative performance in each category, using numerical rank and a
color gradient to visualize ranking, with lighter colors representing higher rank and darker colors
representing lower rank (Table 3).
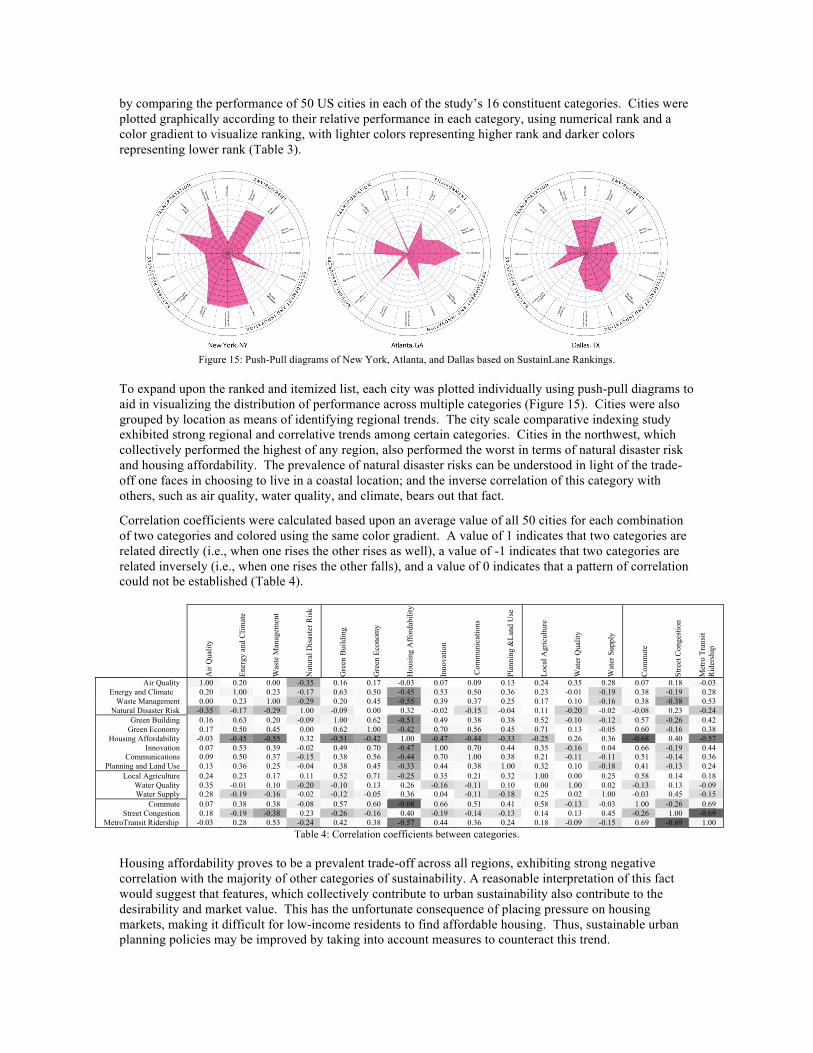
Figure 15: Push-Pull diagrams of New York, Atlanta, and Dallas based on SustainLane Rankings.
To expand upon the ranked and itemized list, each city was plotted individually using push-pull diagrams to
aid in visualizing the distribution of performance across multiple categories (Figure 15). Cities were also
grouped by location as means of identifying regional trends. The city scale comparative indexing study
exhibited strong regional and correlative trends among certain categories. Cities in the northwest, which
collectively performed the highest of any region, also performed the worst in terms of natural disaster risk
and housing affordability. The prevalence of natural disaster risks can be understood in light of the trade-
off one faces in choosing to live in a coastal location; and the inverse correlation of this category with
others, such as air quality, water quality, and climate, bears out that fact.
Correlation coefficients were calculated based upon an average value of all 50 cities for each combination
of two categories and colored using the same color gradient. A value of 1 indicates that two categories are
related directly (i.e., when one rises the other rises as well), a value of -1 indicates that two categories are
related inversely (i.e., when one rises the other falls), and a value of 0 indicates that a pattern of correlation
could not be established (Table 4).
Table 4: Correlation coefficients between categories.
Housing affordability proves to be a prevalent trade-off across all regions, exhibiting strong negative
correlation with the majority of other categories of sustainability. A reasonable interpretation of this fact
would suggest that features, which collectively contribute to urban sustainability also contribute to the
desirability and market value. This has the unfortunate consequence of placing pressure on housing
markets, making it difficult for low-income residents to find affordable housing. Thus, sustainable urban
planning policies may be improved by taking into account measures to counteract this trend.
Air
Qual
ity
Ener
gy a
nd C
lim
ate
Was
te M
anag
emen
t
Nat
ura
l D
isas
ter
Ris
k
Gre
en B
uil
din
g
Gre
en E
conom
y
Housi
ng A
fford
abil
ity
Innovat
ion
Com
munic
atio
ns
Pla
nnin
g &
Lan
d U
se
Loca
l A
gri
cult
ure
Wat
er Q
ual
ity
Wat
er S
upply
Com
mute
Str
eet
Conges
tion
Met
ro T
ran
sit
Rid
ersh
ip
Air Quality 1.00 0.20 0.00 -0.35 0.16 0.17 -0.03 0.07 0.09 0.13 0.24 0.35 0.28 0.07 0.18 -0.03
Energy and Climate 0.20 1.00 0.23 -0.17 0.63 0.50 -0.45 0.53 0.50 0.36 0.23 -0.01 -0.19 0.38 -0.19 0.28
Waste Management 0.00 0.23 1.00 -0.29 0.20 0.45 -0.55 0.39 0.37 0.25 0.17 0.10 -0.16 0.38 -0.38 0.53
Natural Disaster Risk -0.35 -0.17 -0.29 1.00 -0.09 0.00 0.32 -0.02 -0.15 -0.04 0.11 -0.20 -0.02 -0.08 0.23 -0.24
Green Building 0.16 0.63 0.20 -0.09 1.00 0.62 -0.51 0.49 0.38 0.38 0.52 -0.10 -0.12 0.57 -0.26 0.42
Green Economy 0.17 0.50 0.45 0.00 0.62 1.00 -0.42 0.70 0.56 0.45 0.71 0.13 -0.05 0.60 -0.16 0.38
Housing Affordability -0.03 -0.45 -0.55 0.32 -0.51 -0.42 1.00 -0.47 -0.44 -0.33 -0.25 0.26 0.36 -0.68 0.40 -0.57
Innovation 0.07 0.53 0.39 -0.02 0.49 0.70 -0.47 1.00 0.70 0.44 0.35 -0.16 0.04 0.66 -0.19 0.44 Communications 0.09 0.50 0.37 -0.15 0.38 0.56 -0.44 0.70 1.00 0.38 0.21 -0.11 -0.11 0.51 -0.14 0.36
Planning and Land Use 0.13 0.36 0.25 -0.04 0.38 0.45 -0.33 0.44 0.38 1.00 0.32 0.10 -0.18 0.41 -0.13 0.24
Local Agriculture 0.24 0.23 0.17 0.11 0.52 0.71 -0.25 0.35 0.21 0.32 1.00 0.00 0.25 0.58 0.14 0.18
Water Quality 0.35 -0.01 0.10 -0.20 -0.10 0.13 0.26 -0.16 -0.11 0.10 0.00 1.00 0.02 -0.13 0.13 -0.09 Water Supply 0.28 -0.19 -0.16 -0.02 -0.12 -0.05 0.36 0.04 -0.11 -0.18 0.25 0.02 1.00 -0.03 0.45 -0.15
Commute 0.07 0.38 0.38 -0.08 0.57 0.60 -0.68 0.66 0.51 0.41 0.58 -0.13 -0.03 1.00 -0.26 0.69
Street Congestion 0.18 -0.19 -0.38 0.23 -0.26 -0.16 0.40 -0.19 -0.14 -0.13 0.14 0.13 0.45 -0.26 1.00 -0.69
MetroTransit Ridership -0.03 0.28 0.53 -0.24 0.42 0.38 -0.57 0.44 0.36 0.24 0.18 -0.09 -0.15 0.69 -0.69 1.00
One counter-intuitive trend worth noting is that cities that ranked higher in metro transit ridership ranked
poorly in street congestion. If one presumes that an efficient system of public transportation reduces the
number of private vehicles in use, it indicates that this relationship is not causal. Rather it is indicative of
densely populated urban areas, which exhibit high congestion in spite of their public transportation systems.
3.1.3 Geospatial Indexing
In order to examine how individual indicators exhibit a non-uniform spatial distribution over an urban or
regional setting, a geospatial indexing methodology was developed, employing GIS technology. Whereas a
non-spatial indicator is typically published as a single number representing an aggregate quantity over an
entire region, a geospatial indicator is represented as a cartographic map. Each region in space is
associated with a set of numerical quantities, and operations on those quantities are performed on each
region independently. The resulting indicator therefore retains a local specificity and is represented
graphically according to a range of indicator values.
Essential to this methodology is the uniform formatting of region boundaries and associated data across
multiple cities. The US Census provides extensive census-block-level household data for the entire country
and was therefore selected as the sole data source for this study. Three cities, New York City, Dallas, and
Atlanta, were selected as test case studies for this methodology due to their diverse scales, difference in
regions, urban morphology and availability of information.
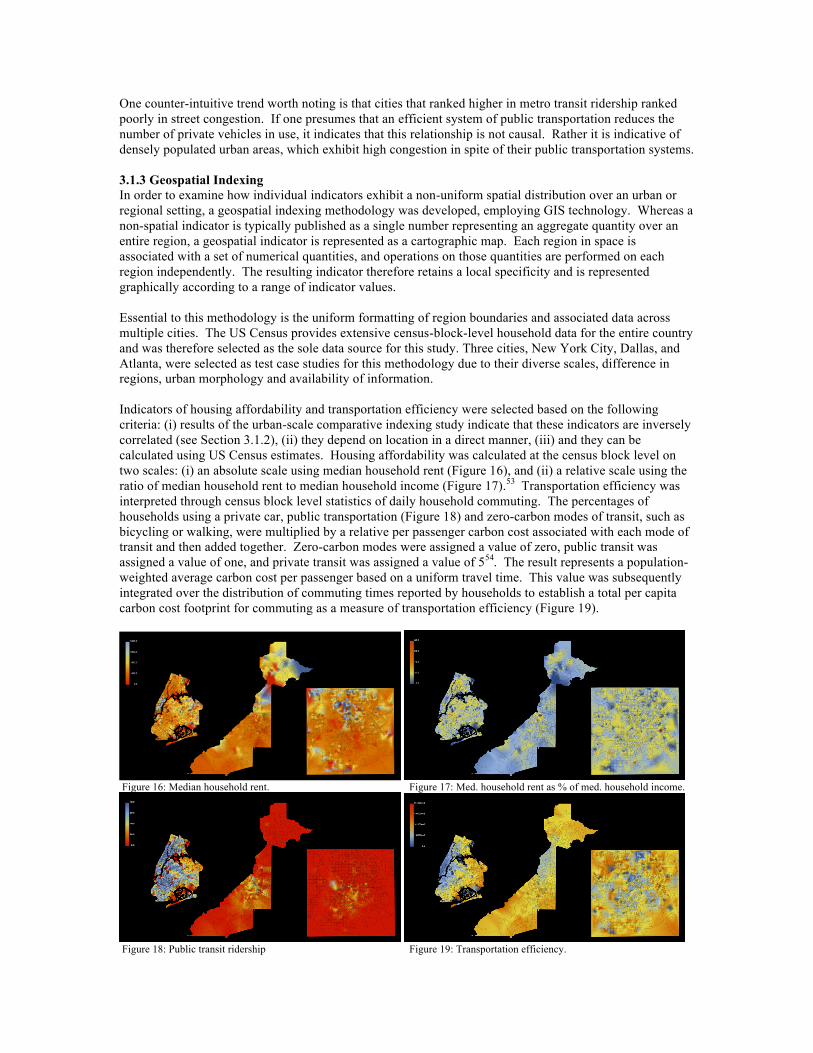
Indicators of housing affordability and transportation efficiency were selected based on the following
criteria: (i) results of the urban-scale comparative indexing study indicate that these indicators are inversely
correlated (see Section 3.1.2), (ii) they depend on location in a direct manner, (iii) and they can be
calculated using US Census estimates. Housing affordability was calculated at the census block level on
two scales: (i) an absolute scale using median household rent (Figure 16), and (ii) a relative scale using the
ratio of median household rent to median household income (Figure 17).53
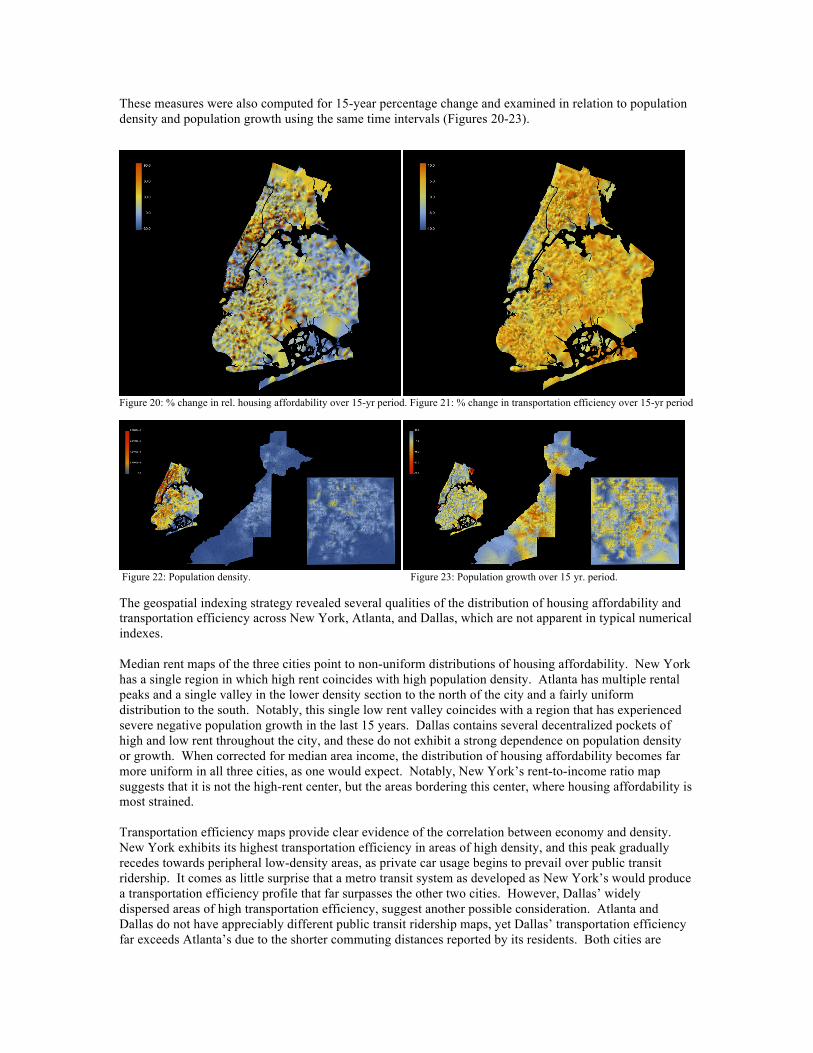
Transportation efficiency was
interpreted through census block level statistics of daily household commuting. The percentages of
households using a private car, public transportation (Figure 18) and zero-carbon modes of transit, such as
bicycling or walking, were multiplied by a relative per passenger carbon cost associated with each mode of
transit and then added together. Zero-carbon modes were assigned a value of zero, public transit was
assigned a value of one, and private transit was assigned a value of 554
. The result represents a population-
weighted average carbon cost per passenger based on a uniform travel time. This value was subsequently
integrated over the distribution of commuting times reported by households to establish a total per capita
carbon cost footprint for commuting as a measure of transportation efficiency (Figure 19).
Figure 16: Median household rent. Figure 17: Med. household rent as % of med. household income.
Figure 18: Public transit ridership Figure 19: Transportation efficiency.
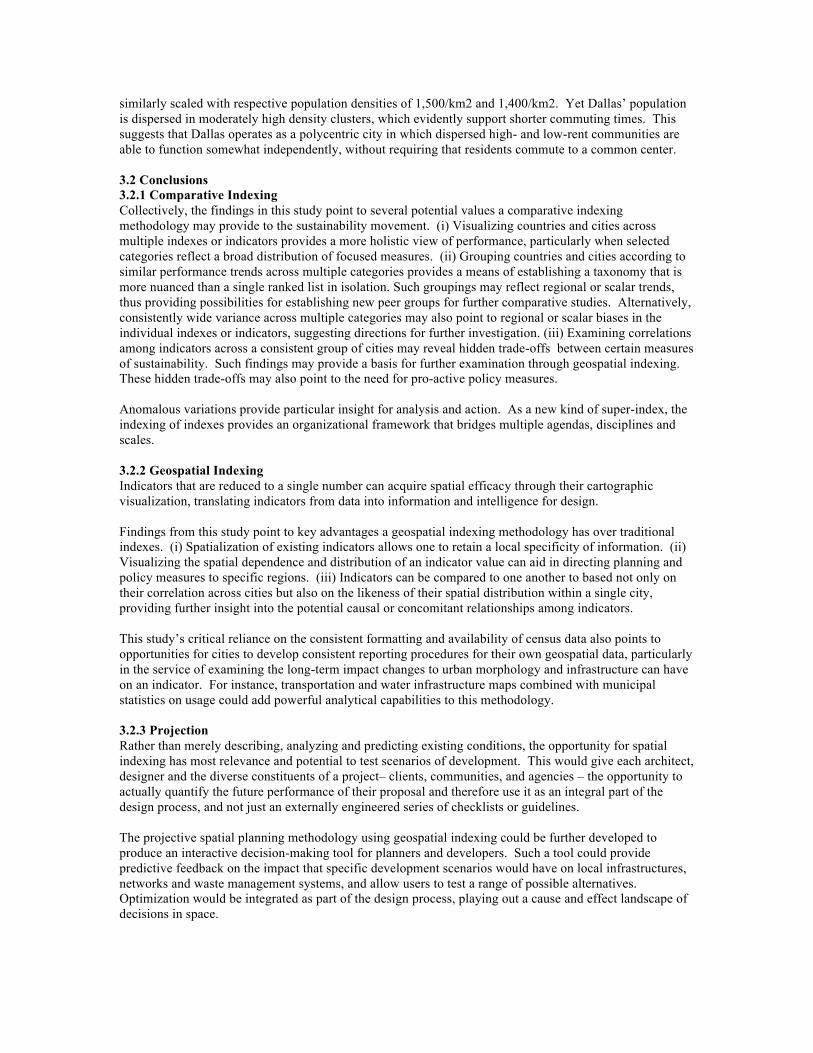
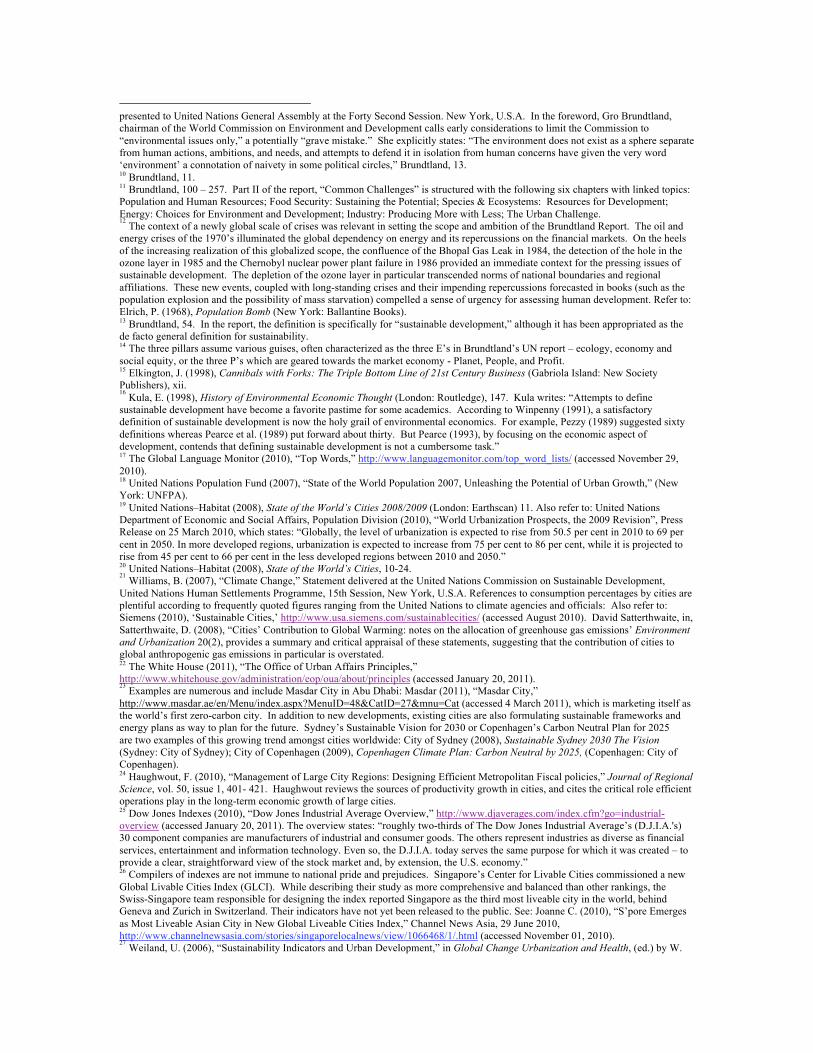
These measures were also computed for 15-year percentage change and examined in relation to population
density and population growth using the same time intervals (Figures 20-23).
Figure 20: % change in rel. housing affordability over 15-yr period. Figure 21: % change in transportation efficiency over 15-yr period
Figure 22: Population density. Figure 23: Population growth over 15 yr. period.
The geospatial indexing strategy revealed several qualities of the distribution of housing affordability and
transportation efficiency across New York, Atlanta, and Dallas, which are not apparent in typical numerical
indexes.
Median rent maps of the three cities point to non-uniform distributions of housing affordability. New York
has a single region in which high rent coincides with high population density. Atlanta has multiple rental
peaks and a single valley in the lower density section to the north of the city and a fairly uniform
distribution to the south. Notably, this single low rent valley coincides with a region that has experienced
severe negative population growth in the last 15 years. Dallas contains several decentralized pockets of
high and low rent throughout the city, and these do not exhibit a strong dependence on population density
or growth. When corrected for median area income, the distribution of housing affordability becomes far
more uniform in all three cities, as one would expect. Notably, New York’s rent-to-income ratio map
suggests that it is not the high-rent center, but the areas bordering this center, where housing affordability is
most strained.
Transportation efficiency maps provide clear evidence of the correlation between economy and density.
New York exhibits its highest transportation efficiency in areas of high density, and this peak gradually
recedes towards peripheral low-density areas, as private car usage begins to prevail over public transit
ridership. It comes as little surprise that a metro transit system as developed as New York’s would produce
a transportation efficiency profile that far surpasses the other two cities. However, Dallas’ widely
dispersed areas of high transportation efficiency, suggest another possible consideration. Atlanta and
Dallas do not have appreciably different public transit ridership maps, yet Dallas’ transportation efficiency
far exceeds Atlanta’s due to the shorter commuting distances reported by its residents. Both cities are
similarly scaled with respective population densities of 1,500/km2 and 1,400/km2. Yet Dallas’ population
is dispersed in moderately high density clusters, which evidently support shorter commuting times. This
suggests that Dallas operates as a polycentric city in which dispersed high- and low-rent communities are
able to function somewhat independently, without requiring that residents commute to a common center.
3.2 Conclusions
3.2.1 Comparative Indexing
Collectively, the findings in this study point to several potential values a comparative indexing
methodology may provide to the sustainability movement. (i) Visualizing countries and cities across
multiple indexes or indicators provides a more holistic view of performance, particularly when selected
categories reflect a broad distribution of focused measures. (ii) Grouping countries and cities according to
similar performance trends across multiple categories provides a means of establishing a taxonomy that is
more nuanced than a single ranked list in isolation. Such groupings may reflect regional or scalar trends,
thus providing possibilities for establishing new peer groups for further comparative studies. Alternatively,
consistently wide variance across multiple categories may also point to regional or scalar biases in the
individual indexes or indicators, suggesting directions for further investigation. (iii) Examining correlations
among indicators across a consistent group of cities may reveal hidden trade-offs between certain measures
of sustainability. Such findings may provide a basis for further examination through geospatial indexing.
These hidden trade-offs may also point to the need for pro-active policy measures.
Anomalous variations provide particular insight for analysis and action. As a new kind of super-index, the
indexing of indexes provides an organizational framework that bridges multiple agendas, disciplines and
scales.
3.2.2 Geospatial Indexing
Indicators that are reduced to a single number can acquire spatial efficacy through their cartographic
visualization, translating indicators from data into information and intelligence for design.
Findings from this study point to key advantages a geospatial indexing methodology has over traditional
indexes. (i) Spatialization of existing indicators allows one to retain a local specificity of information. (ii)
Visualizing the spatial dependence and distribution of an indicator value can aid in directing planning and
policy measures to specific regions. (iii) Indicators can be compared to one another to based not only on
their correlation across cities but also on the likeness of their spatial distribution within a single city,
providing further insight into the potential causal or concomitant relationships among indicators.
This study’s critical reliance on the consistent formatting and availability of census data also points to
opportunities for cities to develop consistent reporting procedures for their own geospatial data, particularly
in the service of examining the long-term impact changes to urban morphology and infrastructure can have
on an indicator. For instance, transportation and water infrastructure maps combined with municipal
statistics on usage could add powerful analytical capabilities to this methodology.
3.2.3 Projection
Rather than merely describing, analyzing and predicting existing conditions, the opportunity for spatial
indexing has most relevance and potential to test scenarios of development. This would give each architect,
designer and the diverse constituents of a project– clients, communities, and agencies – the opportunity to
actually quantify the future performance of their proposal and therefore use it as an integral part of the
design process, and not just an externally engineered series of checklists or guidelines.
The projective spatial planning methodology using geospatial indexing could be further developed to
produce an interactive decision-making tool for planners and developers. Such a tool could provide
predictive feedback on the impact that specific development scenarios would have on local infrastructures,
networks and waste management systems, and allow users to test a range of possible alternatives.
Optimization would be integrated as part of the design process, playing out a cause and effect landscape of
decisions in space.

While master plans for development typically project fixed end-state scenarios, the need to account for
urban growth that is continually changing demands a holistic and comprehensive strategy of spatial
planning. A more robust spatial strategy is needed to manage the sites of resource consumption in order to
meet the demands of the increasingly complex networks of globalization and systems of exchange.
Consideration of land use, density, distribution and zoning often ignore dynamic and durational
phenomena, which are critical in managing the scale and speed of urban development. Using both
geospatial indexing and remote sensing technology, mapping can evolve from real-time analysis to real
time-design. The capacity to see real-time consequences and effects and feed back into design will provide
a means to further integrate the role of design into urban policy and planning processes.
Acknowledgements
This research was funded by the Yale School of Architecture and the Hines Research Fund for Advanced
Sustainability in Architecture; and the AIA Board Knowledge Committee and the AIA College of Fellows
of The American Institute of Architects, as recipient of a 2009 AIA Upjohn Research Initiative Grant. The
authors wish to thank Michelle Addington, Yale School of Architecture and Dr. Richard Hayes, AIA for
their support. The authors also wish to thank the United Nations Division for Sustainable Development and
C. Dana Tomlin for their advice. Notes 1 Pretzsch, H. et al., (2008), “Models for Forest Ecosystem Management: A European Perspective,” Annals of Botany 101, 1066 – 68
2 Meadows, D. et al., (1972), The Limits to Growth (New York: Universe Books). Silvicultura Oeconomica’s implicit
acknowledgment of the limits of global resources was progressive. Limits to Growth, published in 1972 and considered a benchmark
in defining sustainability, acted as both a catalyst and indicator of the concern for the limits of natural resources. By modeling the
impact of population growth, pollution and industrialization on resource depletion, Limits to Growth projected a global disaster
scenario where the carrying capacity of the earth is undermined leading to a cataclysmic global collapse. The publication was both
influential and controversial in critiquing unlimited and unrestrained growth in a world of finite resources. 3 The common thread linking the diverse range of subsistence communities was their resourcefulness in balancing human production
and consumption. The careful calibration of resources to the specifics of the ecology and population can be seen in pre-industrial
settlements around the world, where sustainability was as implicit as architects were absent. In his book, Architecture without
Architects, Bernard Rudofsky presents a range of “non-pedigreed Architecture,” where communities such as the troglodyte villages
near Loyang in China and Dogon villages in Mali were shaped and fashioned by anonymous builders. Refer to: Rudofsky, B. (1964),
Architecture without Architects (New York: Museum of Modern Art) 4 Mumford, L. (1961), The City in History (New York: Harcourt, Brace & World), 410. Lewis Mumford describes the growth of the
city as “new forces [favoring] expansion and dispersal in every direction, from overseas colonization to the building up of new
industries, whose technological improvements simply canceled out all medieval restrictions. The demolition of their urban walls was
both practical and symbolic.” 5 Grafton, R. et al., (2001) A Dictionary of Environmental Economics, Science and Policy (Cheltenham: Edward Elgar). Grafton
defines the difference in sustainability paradigms as “a program of resource use over time that modifies traditional cost-benefit
approaches to maintain either constant capital assets (weak sustainability paradigm) or constant critical natural capital assets (strong
sustainability paradigm).” Weak sustainability argues that natural capital can be replaced by manufactured capital. Strong
sustainability argues that natural capital has irreplaceable value and their stocks must be retained. 6 The pressing need for housing was met with a global proliferation of top-down formal western approach to planning, the
effectiveness of which was challenged in following decades. An ever-increasing developing world population led to the growth of
informal settlements in the 1960s. Development efforts focused on provision and adequacy of housing, resulting in slum clearance
projects, urban renewal initiatives and public housing proposals funded by the World Bank and newly formed regional banks.
Rudofsky’s MoMA exhibition and book Architecture without Architects reflects a shift in favor of informal or spontaneous approaches
toward human settlement. By the 1970s self-generating and self-regulating systems were argued for: Turner, J. (1974), Housing by
People (New York: Pantheon Books) and Lovelock, J. (1979), GAIA: A New Look at Life on Earth (Oxford: Oxford University Press).
Turner’s investigation in Peru led to the conclusion that informal approaches to housing were not only viable but in fact necessary,
while Lovelock posited that the global environment was a self-regulating and self-correcting system. The growing world population
and significant housing shortage of the 70’s culminated in Habitat, the first UN conference on Human Settlements in Vancouver in
1976, demonstrating the organization’s recognition of the pressing nature of the issue. 7 Carson, R. (1962), Silent Spring (Greenwich: Fawcett Publications). Published in 1962, 249 years after Silvicultura Oecnomica
Carson’s book Silent Spring is often cited as the beginning of the environment movement widely publicizing the environmental
consequences of pesticide use. Within a decade, the environmental movement gained recognition on a global scale and was codified
as international policy. The first Earth Day in 1970 was followed two years later by the UN’s first conference on environmental
issues. The Stockholm Conference brought together 113 countries and an even larger body of inter- and non-governmental
organizations, and led to a declaration with 26 principles and 109 recommendations and the establishment of the UN Environment
Program (UNEP). For a list of detailed events, refer to: United Nations Department of Economic and Social Affairs, Division for
Sustainable Development, (2010), “Milestones,” http://www.un.org/esa/dsd/dsd/dsd_milestones.shtml (accessed November 10, 2010). 8 United Nations Habitat, (1976), “Vancouver Declaration on Human Settlements,” Report presented at the United Nations Conference
on Human Settlements, Vancouver Canada, 3–10. The report acknowledged that “social economic and environmental deterioration”
was exemplified by social inequalities and “the increasing degradation of life-supporting resources of air, water and land.” However,
the document reflected a hierarchy of priorities that privileged development: “Planning is a process to achieve the goals and objectives
of national development, through the rational and efficient use of available resources.” 9 Brundtland, G. (1987), “Report of the World Commission on Environment and Development: Our Common Future,” Report
presented to United Nations General Assembly at the Forty Second Session. New York, U.S.A. In the foreword, Gro Brundtland,
chairman of the World Commission on Environment and Development calls early considerations to limit the Commission to
“environmental issues only,” a potentially “grave mistake.” She explicitly states: “The environment does not exist as a sphere separate
from human actions, ambitions, and needs, and attempts to defend it in isolation from human concerns have given the very word
‘environment’ a connotation of naivety in some political circles,” Brundtland, 13. 10 Brundtland, 11. 11 Brundtland, 100 – 257. Part II of the report, “Common Challenges” is structured with the following six chapters with linked topics:
Population and Human Resources; Food Security: Sustaining the Potential; Species & Ecosystems: Resources for Development;
Energy: Choices for Environment and Development; Industry: Producing More with Less; The Urban Challenge. 12
The context of a newly global scale of crises was relevant in setting the scope and ambition of the Brundtland Report. The oil and
energy crises of the 1970’s illuminated the global dependency on energy and its repercussions on the financial markets. On the heels
of the increasing realization of this globalized scope, the confluence of the Bhopal Gas Leak in 1984, the detection of the hole in the
ozone layer in 1985 and the Chernobyl nuclear power plant failure in 1986 provided an immediate context for the pressing issues of
sustainable development. The depletion of the ozone layer in particular transcended norms of national boundaries and regional
affiliations. These new events, coupled with long-standing crises and their impending repercussions forecasted in books (such as the
population explosion and the possibility of mass starvation) compelled a sense of urgency for assessing human development. Refer to:
Elrich, P. (1968), Population Bomb (New York: Ballantine Books). 13 Brundtland, 54. In the report, the definition is specifically for “sustainable development,” although it has been appropriated as the
de facto general definition for sustainability. 14 The three pillars assume various guises, often characterized as the three E’s in Brundtland’s UN report – ecology, economy and
social equity, or the three P’s which are geared towards the market economy - Planet, People, and Profit. 15 Elkington, J. (1998), Cannibals with Forks: The Triple Bottom Line of 21st Century Business (Gabriola Island: New Society
Publishers), xii. 16
Kula, E. (1998), History of Environmental Economic Thought (London: Routledge), 147. Kula writes: “Attempts to define
sustainable development have become a favorite pastime for some academics. According to Winpenny (1991), a satisfactory
definition of sustainable development is now the holy grail of environmental economics. For example, Pezzy (1989) suggested sixty
definitions whereas Pearce et al. (1989) put forward about thirty. But Pearce (1993), by focusing on the economic aspect of
development, contends that defining sustainable development is not a cumbersome task.” 17 The Global Language Monitor (2010), “Top Words,” http://www.languagemonitor.com/top_word_lists/ (accessed November 29,
2010). 18 United Nations Population Fund (2007), “State of the World Population 2007, Unleashing the Potential of Urban Growth,” (New
York: UNFPA). 19 United Nations–Habitat (2008), State of the World’s Cities 2008/2009 (London: Earthscan) 11. Also refer to: United Nations
Department of Economic and Social Affairs, Population Division (2010), “World Urbanization Prospects, the 2009 Revision”, Press
Release on 25 March 2010, which states: “Globally, the level of urbanization is expected to rise from 50.5 per cent in 2010 to 69 per
cent in 2050. In more developed regions, urbanization is expected to increase from 75 per cent to 86 per cent, while it is projected to
rise from 45 per cent to 66 per cent in the less developed regions between 2010 and 2050.” 20 United Nations–Habitat (2008), State of the World’s Cities, 10-24. 21
Williams, B. (2007), “Climate Change,” Statement delivered at the United Nations Commission on Sustainable Development,
United Nations Human Settlements Programme, 15th Session, New York, U.S.A. References to consumption percentages by cities are
plentiful according to frequently quoted figures ranging from the United Nations to climate agencies and officials: Also refer to:
Siemens (2010), ‘Sustainable Cities,’ http://www.usa.siemens.com/sustainablecities/ (accessed August 2010). David Satterthwaite, in,
Satterthwaite, D. (2008), “Cities’ Contribution to Global Warming: notes on the allocation of greenhouse gas emissions’ Environment
and Urbanization 20(2), provides a summary and critical appraisal of these statements, suggesting that the contribution of cities to
global anthropogenic gas emissions in particular is overstated. 22 The White House (2011), “The Office of Urban Affairs Principles,”
http://www.whitehouse.gov/administration/eop/oua/about/principles (accessed January 20, 2011). 23
Examples are numerous and include Masdar City in Abu Dhabi: Masdar (2011), “Masdar City,”
http://www.masdar.ae/en/Menu/index.aspx?MenuID=48&CatID=27&mnu=Cat (accessed 4 March 2011), which is marketing itself as
the world’s first zero-carbon city. In addition to new developments, existing cities are also formulating sustainable frameworks and
energy plans as way to plan for the future. Sydney’s Sustainable Vision for 2030 or Copenhagen’s Carbon Neutral Plan for 2025
are two examples of this growing trend amongst cities worldwide: City of Sydney (2008), Sustainable Sydney 2030 The Vision
(Sydney: City of Sydney); City of Copenhagen (2009), Copenhagen Climate Plan: Carbon Neutral by 2025, (Copenhagen: City of
Copenhagen). 24 Haughwout, F. (2010), “Management of Large City Regions: Designing Efficient Metropolitan Fiscal policies,” Journal of Regional
Science, vol. 50, issue 1, 401- 421. Haughwout reviews the sources of productivity growth in cities, and cites the critical role efficient
operations play in the long-term economic growth of large cities. 25 Dow Jones Indexes (2010), “Dow Jones Industrial Average Overview,” http://www.djaverages.com/index.cfm?go=industrial-
overview (accessed January 20, 2011). The overview states: “roughly two-thirds of The Dow Jones Industrial Average’s (D.J.I.A.'s)
30 component companies are manufacturers of industrial and consumer goods. The others represent industries as diverse as financial
services, entertainment and information technology. Even so, the D.J.I.A. today serves the same purpose for which it was created – to
provide a clear, straightforward view of the stock market and, by extension, the U.S. economy.” 26 Compilers of indexes are not immune to national pride and prejudices. Singapore’s Center for Livable Cities commissioned a new
Global Livable Cities Index (GLCI). While describing their study as more comprehensive and balanced than other rankings, the
Swiss-Singapore team responsible for designing the index reported Singapore as the third most liveable city in the world, behind
Geneva and Zurich in Switzerland. Their indicators have not yet been released to the public. See: Joanne C. (2010), “S’pore Emerges
as Most Liveable Asian City in New Global Liveable Cities Index,” Channel News Asia, 29 June 2010,
http://www.channelnewsasia.com/stories/singaporelocalnews/view/1066468/1/.html (accessed November 01, 2010). 27
Weiland, U. (2006), “Sustainability Indicators and Urban Development,” in Global Change Urbanization and Health, (ed.) by W.
Wuyi, T. Krafft & F. Kraas (Beijing: China Meteorological Press) 241-250. 28
United Nations Department of Economic and Social Affairs (2007), “Indicators of Sustainable Development: Guidelines and
Methodologies,” (New York: United Nations) 40-42. 29
United Nations Division for Sustainable Development (1992), Agenda 21, Chapter 40 (New York: United Nations). Agenda 21 can
be accessed at http://www.un.org/esa/dsd/agenda21/res_agenda21_00.shtml 30
Westfall, M. & de Villa, V. (2001), Urban Indicators for Managing Cities (Manila: Asian Development Bank) 428-429. 31 United Nations Department of Economic and Social Affairs (2007) 9-27. 32 Economic Co-operation and Development (OECD) Environmental Performance and Information Division (2008), “OECD
Environmental Data Compendium, 2006-2008”
http://www.oecd.org/document/49/0,3343,en_2649_37465_39011377_1_1_1_37465,00.html (accessed on July 2010). 33 Walmart (2010), “Supplier Sustainability Assessment,” http://walmartstores.com/sustainability/9292.aspx
(accessed in August 2010). 34 Dow Jones Sustainability Indexes (2010), “Dow Jones Sustainability World Index Guide Book,” version 11.4 35Siemens (2010), “European Green City Index,” http://www.siemens.com/entry/cc/en/urbanization.htm?section=green_index
(accessed in August 2010). 36
Mega, V. & Pedersen, J. (1998), Urban Sustainability Indicators, European Foundation for the Improvement of Living and
Working Conditions, (Luxembourg: Office for Publications of the European Communities). 37 Walmart (2010), “Supplier Sustainability Assessment.” 38 Forest stewardship Council (2011), “FSC Principles and Criteria,” FSC Certification, http://www.fsc.org/pc.html (accessed in 9
January 2011); Marine Stewardship Council (2011), ‘Use the MSC Ecolabel, Get Certified,’ http://www.msc.org/get-certified/use-the-
msc-ecolabel (accessed 9 January 2011). The Marine and Forestry Stewardship Councils are two of the most recognized organizations
that operate in the field of certification and regulate sustainable labeling. 39 LeCavalier, J (2010), ‘All Those Numbers: Logistics, Territory and Walmart,’ posted on Design Observer Group,
http://places.designobserver.com/entry.html?entry=13598 (accessed on 15 April 2011); also refer to Walmart’s site:
and http://walmartstores.com/sustainability/9292.aspx 40 OECD Environmental Performance and Information Division (2008) 41 United Nations Department of Economic and Social Affairs (2007) 9-27. 42 Yale Center for Environmental Law and Policy and Center for International Earth Science Information Network, (2005), 2005
Environmental Sustainability Index, Benchmarking National Environmental Stewardship, (New Haven: Yale center for Environmental
Policy). 43 Siemens (2010), “European Green City Index.” 44 Westfall, M., Urban Indicators for Managing Cities. 45 SustainLane (2008), “2008 US City Sustainability Rankings,” http://www.sustainlane.com/us-city-rankings/overall-rankings
(accessed in August 2010). 46 U.S. Green Building Council, Congress for New Urbanism, Natural Resources Defense Council, (2011), LEED 2009 for
Neighborhood Development (Washington D.C.: USGBC); also refer to: U.S. Green Building Council (2009), “LEED 2009 for
Neighborhood Development Rating System,” (http://www.usgbc.org/DisplayPage.aspx?CMSPageID=148 (accessed on 2 May 2011) 47 Balmori, D. et al., (2007), Land and Natural Development (LAND) Code: Guidelines for Sustainable Land Development (Hoboken:
John Wiley & Sons), 1-119. 48 Central Intelligence Agency (2008), “World Fact Book,” https://www.cia.gov/library/publications/the-world-
factbook/fields/2172.html (accessed in August 2010). Retrieved from C.I.A. World Fact Book database in years ranging from 1989-
2008, using the most recently recorded value. 49 The World Bank (2009), “World Development Indicators,” http://data.worldbank.org/indicator/NY.GNP.PCAP.PP.CD (accessed
in August 2010). Data retrieved from the World Bank’s World Development Indicators database, http://data.worldbank.org/indicator
using 2009 values of GDP per capita at purchasing power parity. 50 United Nations Development Program (2009), Human Development Report (New York: Palgrave Macmillan) 143-146. Report
retrieved from U.N.D.P.’s “Human Development Reports” at http://hdr.undp.org/en/media/HDR_2009_EN_Complete.pdf 51 Yale Center for Environmental Law and Policy and Center for International Earth Science Information Network, 4-5 52 SustainLane (2008) 53 2009 U.S. Census Bureau data was retrieved through SimplyMap: Geographic Research Inc. (2011), “SimplyMap Data,”
http://www.geographicresearch.com/simplymap/ (accessed January 15, 2011) 54 Refinement of this methodology in future studies may include reference to published statistical data on carbon cost per passenger
mile for different modes of transit.
References Balmori, D. and Gaboury, B. (2007). Land and Natural Development (LAND) Code: Guidelines for
Sustainable Land Development. Hoboken: John Wiley & Sons.
Brundtland, G. (1987). “Report of the World Commission on Environment and Development: Our
Common Future.” Report presented to United Nations General Assembly at the Forty Second Session.
New York, U.S.A.
Carson, R. (1962). Silent Spring. Greenwich: Fawcett Publications.
Central Intelligence Agency (2008). “World Fact Book.” https://www.cia.gov/library/publications/the-
world-factbook/fields/2172.html (accessed August 2010).
Dow Jones Indexes (2010). “Dow Jones Industrial Average Overview.”
http://www.djaverages.com/index.cfm?go=industrial-overview (accessed 20 January 2011)
Dow Jones Sustainability Indexes (2011). “Dow Jones Sustainability World Index Guide Book ver.11.5.
January 2011.” http://www.sustainability-index.com/07_htmle/publications/guidebooks.html
(accessed March 2011)
Economic Co-operation and Development Environmental Performance and Information Division (2008).
“OECD Environmental Data Compendium 2006-2008”
http://www.oecd.org/document/49/0,3343,en_2649_37465_39011377_1_1_1_37465,00.html
(accessed July 2010)
Elkington, J. (1998). Cannibals with Forks: The Triple Bottom Line of 21st Century Business. Gabriola
Island: New Society Publishers.
Elrich, P. (1968). Population Bomb. New York: Ballantine Books.
The Global Language Monitor (2010). “Top Words.” http://www.languagemonitor.com/top_word_lists/
(accessed November 29, 2010).
Geographic Research Inc. (2011), “SimplyMap Data,” http://www.geographicresearch.com/simplymap/
(accessed January 15, 2011)
Grafton, R., Pendleton, L. and Nelson, H. (2001). A Dictionary of Environmental Economics, Science and
Policy. Cheltenham: Edward Elgar.
Haughwout, F. (2010). “Management of Large City Regions: Designing Efficient Metropolitan Fiscal
Policies.” Journal of Regional Science. vol. 50, issue 1.
Joanne C. (2010). “S’pore Emerges as Most Liveable Asian City in New Global Liveable Cities Index.”
Channel News Asia. Posted 29 June 2010.
http://www.channelnewsasia.com/stories/singaporelocalnews/view/1066468/1/.html (accessed
November 01, 2010).
Kula, E. (1998). History of Environmental Economic Thought. London: Routledge.
Lovelock, J. (1979). GAIA: A New Look at Life on Earth. Oxford: Oxford University Press
Meadows, D. et al., (1972). The Limits to Growth. New York: Universe Books.
Mega, V. and Pedersen, J. (1998). Urban Sustainability Indicators. European Foundation for the
Improvement of Living and Working Conditions. Luxembourg: Office for Publications of the
European Communities.
Mumford, L. (1961). The City in History. New York: Harcourt, Brace & World
Pretzsch, H. et al., (2008). “Models for forest Ecosystem Management: A European Perspective.” Annals of
Botany. 101, 1065-1087.
Rudofsky, B. (1964). Architecture without Architects. New York: Museum of Modern Art.
Siemens (2010). “European Green City Index.”
http://www.siemens.com/entry/cc/en/urbanization.htm?section=green_index (accessed August 2010).
Siemens (2010). “Sustainable Cities,” http://www.usa.siemens.com/sustainablecities/ (accessed August,
2010).
Satterthwaite, D. (2008), “Cities’ Contribution to Global Warming: Notes on the Allocation of Greenhouse
Gas Emissions.” Environment and Urbanization. 20(2).
Turner, J. (1974). Housing by People. New York: Pantheon Books.
United Nations Department of Economic and Social Affairs (2007). Indicators of Sustainable
Development: Guidelines and Methodologies. New York: United Nations.
United Nations Department of Economic and Social Affairs, Division for Sustainable Development,
(2010). “Milestones,” http://www.un.org/esa/dsd/dsd/dsd_milestones.shtml (accessed November 10,
2010).
United Nations Department of Economic and Social Affairs, Population Division (2010). “World
Urbanization Prospects, the 2009 Revision.” Press Release on 25 March 2010.
United Nations Development Program (2009). Human Development Report. New York: Palgrave
Macmillan.
United Nations Division for Sustainable Development (1992), Agenda 21, Chapter 40. New York: United
Nations.
United Nations-Habitat, (1976). “Vancouver Declaration on Human Settlements.” Report presented at the
United Nations Conference on Human Settlements. Vancouver, Canada.
United Nations–Habitat (2008). State of the World’s Cities 2008/2009. London: Earthscan.
United Nations Population Fund (2007). “State of the World Population 2007, Unleashing the Potential of
Urban Growth.” New York: UNPFA.
U.S. Green Building Council, Congress for New Urbanism, Natural Resources Defense Council, (2011).
LEED 2009 for Neighborhood Development. Washington D.C.: USGBC.
Walmart (2010). “Supplier Sustainability Assessment,” http://walmartstores.com/sustainability/9292.aspx (accessed in August 2010).
Weiland, U. (2006). “Sustainability Indicators and Urban Development,” in Global Change Urbanization
and Health, (ed.) by Wuyi, W., Krafft., T. & Kraas., F. Beijing: China Meteorological Press.
Westfall, M. and de Villa, V. (2001). Urban Indicators for Managing Cities. Manila: Asian Development
Bank.
The White House (2011), “The Office of Urban Affairs Principles.”
http://www.whitehouse.gov/administration/eop/oua/about/principles (accessed January 20, 2011).
Williams, B. (2007). “Climate Change.” Statement delivered at the United Nations Commission on
Sustainable Development, United Nations Human Settlements Programme.15th Session. New York,
U.S.A.
The World Bank (2009). “World Development Indicators.”
http://data.worldbank.org/indicator/NY.GNP.PCAP.PP.CD (accessed August 2010).
Yale Center for Environmental Law and Policy and Center for International Earth Science Information
Network, (2005). 2005 Environmental Sustainability Index, Benchmarking National Environmental
Stewardship. New Haven: Yale Center for Environmental Policy.