india corporate health tracker - credit suisse
TRANSCRIPT

DISCLOSURE APPENDIX AT THE BACK OF THIS REPORT CONTAINS IMPORTANT DISCLOSURES, ANALYST CERTIFICATIONS, LEGAL ENTITY DISCLOSURE AND THE STATUS OF NON-US ANALYSTS. US Disclosure: Credit Suisse does and seeks to do business with companies covered in its research reports. As a result, investors should be aware that the Firm may have a conflict of interest that could affect the objectivity of this report. Investors should consider this report as only a single factor in making their investment decision.
16 February 2017 Asia Pacific/India Equity Research
Banks
India Corporate Health Tracker Research Analysts
Ashish Gupta
91 22 6777 3895
Kush Shah
91 22 6777 3862
Prashant Kumar
91 22 6777 3942
SECTOR REVIEW
Stress rising, resolutions stalled
Figure 1: Share of debt with IC<1 at 41%
Source: Prowess, Company data, Credit Suisse
■ NPL formation likely to remain elevated. Our 3Q corporate health tracker
highlights that share of debt with companies with IC<1 stays high at 41%,
and 35% of debt is with chronically stressed corporates. Moreover,
companies with IC<1 are still witnessing a contraction in their profitability
(EBITDA -10% YoY). Even as operating profitability of some steel
companies improved, 65% still have IC<1. Additionally, 67% of power
companies' debt in our sample and 45% of telecom now has IC<1. In
addition to the 9.5% Gross NPAs, Indian banks have 4-8% of loans parked
in various stress classifications (restructured/SDR but standard) and as
most of these forbearances expire over next 12-18 months, it will keep
corporate NPA addition elevated.
■ Wall of provisioning ahead, without a Bad Bank. We estimate that
Indian banks need Rs860 bn of provisions on existing NPAs over the next
12 months as regulatory provisions are based on NPL vintage. As the NPA
spike from the RBI's AQR a year ago now migrates to next buckets,
provisioning needs will rise. Resolutions on most of the large NPLs have
not progressed even in sectors like steel that witnessed a cyclical upswing,
given the need for large haircuts and multiplicity of lenders. Therefore,
unless a government-sponsored bad bank is created to house a significant
share of the US$108 bn NPAs, provision costs will be high.
■ Raising provision estimates, cutting earnings; Cut Axis to NEUTRAL.
We are therefore cutting our earnings estimates for corporate lenders by 5-
10%, as we raise corporate impairment & provisioning estimates. We also
factor potential gains from stake sales in subs (general insurance) for ICICI
and SBI, resulting in lower earnings cuts. While, for Axis we still estimate
FY18 provisioning will be lower than FY17 we cut earnings and TP by ~7-
10%. Continue to prefer retail private banks (HDFCB, IIB)
10%
15%
20%
25%
30%
35%
40%
45%
10%
15%
20%
25%
30%
35%
40%
45%
1Q13 2Q13 3Q13 4Q13 1Q14 2Q14 3Q14 4Q14 1Q15 2Q15 3Q15 4Q15 1Q16 2Q16 3Q16 4Q16 1Q17 2Q17 3Q17
% of sample debt with companies with IC <1 % not covering interest in at least 4 quarters

16 February 2017
India Corporate Health Tracker 2
Focus charts
Figure 2: 37% of loans with IC<1 in the past 12 qtrs Figure 3: Overall EBITDA declined 2% QoQ
Source: Company data, Credit Suisse estimates Source: Company data, Credit Suisse estimates
Figure 4: IC<1 firms' EBITDA declined 10% YoY Figure 5: 52% of steel debt has debt/EBITDA > 12x
Source: Company data, Credit Suisse estimates Source: Company data, Credit Suisse estimates
Figure 6: 67% of power debt with IC<1 companies Figure 7: 45% of telecom debt with IC<1 companies
Source: Company data, Credit Suisse estimates Source: Company data, Credit Suisse estimates
Figure 8: Ageing provs to result in 100bp credit cost Figure 9: Earnings cut 5-10% on higher credit cost
Source: Company data, Credit Suisse estimates Source: Company data, Credit Suisse estimates
0%
5%
10%
15%
20%
25%
30%
35%
40%
1 2 3 4 5 6 7 8 9 10 11 12
% of debt with companies corresponding to quarters when they had IC<1
-10
-5
0
5
10
15
20
25
0.0
1.0
2.0
3.0
4.0
5.0
4Q11
2Q12
4Q12
2Q13
4Q13
2Q14
4Q14
2Q15
4Q15
2Q16
4Q16
2Q17
EBITDA growth (% qoq) (RHS) IC coverage
-20%
-15%
-10%
-5%
0%
5%
10%
15%
Sales EBITDA
All companies Co's with IC<1 in 2Q17
<6x, 1,325 , 32%
6x-12x, 649 , 16%
>12x, 2,117 , 52%
3Q17 Total Loans - Rs 4.1 tn
Down from 62% in 2Q
40%
45%
50%
55%
60%
65%
70%
2,200
2,400
2,600
2,800
3,000
3,200
3,400
3,600
3,800
1Q16 2Q16 3Q16 4Q16 1Q17 2Q17 3Q17
Power sector debt with IC<1 (Rs bn) Share of debt with IC<1 (%) (RHS)
15%
20%
25%
30%
35%
40%
45%
50%
-
500
1,000
1,500
2Q15 3Q15 4Q15 1Q16 2Q16 3Q16 4Q16 1Q17 2Q17 3Q17
Telecom sector debt with IC<1 (Rs bn) Share of debt with IC<1 (%) (RHS)
0.0%
0.5%
1.0%
1.5%
2.0%
2.5%
IDBI
UCO
Unite
d
IOB
BoI
PNB
ALBK
BOM
CBoI
OBC
Andh
ra
Corp
BoB
Cana
ra
Union
India
n
PSB
SBI
ICIC
I
Synd
i…
Vijay
a
Axis
Ageing Credit Cost (%) - FY18E
-8% -8% -8%
-6%
-10%
-3%
-5%-5%
-6%
-8%
-12%
-8%
-4%
0%
SBI PNB BOI ICICI Axis
Change in earnings (%) FY18E FY19E

16 February 2017
India Corporate Health Tracker 3
3Q17: Stress rising, resolutions stalled
NPL formation likely to remain elevated
Our 3Q corporate health tracker highlights that share of debt with companies with IC<1 is
still high at 42%, and 35% of debt is with chronically stressed corporates. Moreover,
companies with IC<1 are still witnessing a contraction in their profitability (EBITDA -10%
YoY). Even as the operating profitability of some steel companies improved, 65% still have
IC<1. Additionally, 67% of our power companies' debt in our sample and 45% of telecom
debt now has IC<1. In addition to the 9.5% gross NPAs, Indian banks have 4-8% of loans
parked in various stress classifications (standard but restructured/SDR). As many of these
forbearances expire over the next 12-18 months it will keep corporate NPA addition
elevated, in our view.
Wall of provisioning ahead, without a Bad Bank
Over the past two quarters, the use of the strategic debt restructuring (SDR) structure has
been increasing by the banks. This is surprising given the lack of resolutions that have
been achieved through this structure. In addition, of the 30 cases that it was implemented
in, it has been successfully completed in none of the companies, with partial success only
in one company. The primary incentive appears to be the 18-month standstill on asset
classification that is available under this. Given the limited success in identifying buyers for
these assets, we expect that as the 18-month period expires, a large portion of these
loans will move from standard SDR to NPL classification.
We estimate that Indian banks need Rs860 bn of provisions on existing NPAs over the
next 12 months as regulatory provisions are based on NPL vintage. As the spike in NPAs
from RBI's AQR a year ago now migrates from sub-standard to doubtful, provisioning
needs will rise. Resolutions on most of the large NPLs have not progressed even in
sectors like steel that witnessed a cyclical upswing, given the need for large haircuts and
multiplicity of lenders. Therefore, unless a government sponsored bad bank is created to
house a significant share of the $108 bn NPAs, provision costs will be high.
Raising provision estimates, cutting earnings
Provisioning needs for the banks are likely to stay high on account of slippages from the
existing pool of recognized problem loans (SDR / Restructured / watch list) and ageing
related provisions post one year of the RBI's AQR exercise. As a result, we increase our
credit cost estimates for coverage banks to 1.5-1.9% with ageing-related provisions at 60-
160bp and as a result, our EPS goes down by 5-10% for corporate lenders. We also factor
potential gains from stake sales in subs (general insurance) for ICICI and SBI, resulting in
lower earnings cuts, while Axis sees larger FY18 cuts, as we increase NPL slippage
estimates as well.
Downgrade Axis to Neutral
Corporate stress has been higher than initially expected resulting in elevated slippages
from Axis watch list. Stress outside of watch list has stayed high as well and as the bank
recognize most of the corporate stress from the watch list & outside of it by Mar-18, we
expect slippages to stay elevated (~3.2% of loans) in FY18. We increase our credit cost
estimate to 180bps for FY18 and cut EPS by 8-10% for FY18/19E. Our TP moves down to
Rs490 and at 1.8x FY18 book, given limited upside, we downgrade the stock to
NEUTRAL.
35% of debt is with chronically
stressed corporates
Ageing provision of Rs860bn in FY18E

1
6 F
eb
rua
ry 2
01
7
Ind
ia C
orp
ora
te H
ea
lth T
rac
ker
4
Valuation summary
Figure 10: Valuation summary
CS
Rating
CMP
(Rs)
Target
(Rs)
+/-
(%)
Mkt cap
($ bn)
P/B (x) P/Adj B (x) EPS (Rs) EPS growth (%) P/E (x) ROE (%) P/PPoP (x)
FY18E FY19E FY18E FY19E FY18E FY19E FY18E FY19E FY18E FY19E FY18E FY19E FY18E FY18E
Private Sector
HDFC Bank O 1,322 1,470 11% 50.6 3.5 3.0 3.5 3.0 68 83 22 22 20 16 19 20 12 9
ICICI O 281 316 13% 24.4 1.6 1.5 1.8 1.6 19 23 7 19 15 12 11 13 9 7
Kotak Mahindra N 784 827 5% 21.6 3.3 2.8 3.3 2.8 32 39 20 23 24 20 14 15 15 12
Axis N 488 490 0% 17.5 1.9 1.7 2.0 1.7 29 39 81 33 17 13 12 14 8 6
IndusInd O 1,316 1,400 6% 11.8 3.4 2.9 3.5 3.0 62 77 25 25 21 17 17 19 12 10
Yes Bank N 1,431 1,273 -11% 9.1 2.5 2.2 2.6 2.2 91 116 15 27 16 12 20 19 9 7
IDFC Bank N 62 68 10% 3.1 1.3 1.2 1.4 1.3 4 5 16 17 16 14 9 10 15 11
J&K Bank N 68 68 -1% 0.5 0.5 0.5 0.8 0.7 9 14 nm 63 8 5 7 10 2 2
Public Sector
SBI N 269 247 -8% 32.0 1.1 1.0 1.4 1.3 22 28 60 25 12 10 9 11 6 5
Bank of Baroda N 163 162 -1% 5.6 0.9 0.9 1.1 1.0 15 20 99 35 11 8 9 11 4 4
PNB U 140 94 -33% 4.5 0.7 0.7 1.2 1.1 14 19 52 35 10 7 7 9 3 3
Bank of India U 124 92 -26% 1.9 0.4 0.4 0.7 0.6 11 19 nm 68 11 6 4 6 2 2
Union Bank U 142 124 -12% 1.5 0.4 0.4 0.7 0.6 22 28 49 31 7 5 7 9 2 1
IOB U 26 19 -26% 0.9 0.5 0.5 1.1 0.8 1 2 nm 334 50 12 1 4 3 3
Non-bank fin
HDFC Ltd O 1,398 1,548 11% 33.2 5.4 4.9 5.4 4.9 54 62 10 16 26 23 22 23 18 15
Bajaj Finance U 1,040 670 -36% 8.5 4.7 3.8 4.8 3.9 39 47 12 18 26 22 20 19
Indiabulls O 813 885 9% 5.2 2.5 2.1 2.6 2.3 79 104 25 31 10 8 26 29
LIC Housing Fin O 550 635 16% 4.1 2.1 1.8 2.2 1.8 53 63 31 20 10 9 22 22
Shriram Transport O 934 1,070 15% 3.2 1.6 1.4 1.9 1.6 97 112 56 16 10 8 18 18 4 4
M&M Finance O 287 325 13% 2.4 2.1 1.8 3.8 3.1 18 29 66 62 16 10 14 20
Cholamandalam O 992 1,200 21% 2.3 3.1 2.5 3.9 3.2 59 83 32 40 17 12 19.9 23.2 8 6
SCUF O 1,894 2,210 17% 1.9 2.1 1.8 2.6 2.2 134 209 24 57 14 9 16 21
Bharat Financial N 820 720 -12% 1.7 3.2 2.6 3.3 2.7 55.9 56.8 26 2 15 14 25 20
Core Business
ICICI O 201 236 17.5 1.3 1.2 1.4 1.3 16 19 8 22 13 10 11 12 6 5
HDFC O 665 814 15.8 3.2 2.8 3.2 2.8 43 51 18 18 15 13 23 23 7 6
Source: Company data, Credit Suisse estimates

16 February 2017
India Corporate Health Tracker 5
NPL formation likely to remain elevated Corporate health continues to remain stressed, as our corporate health tracker does not
show any signs of recovery. With 3Q17 share of debt with interest cover (IC) < 1 having
increased to 41% (flat QoQ at 39% excluding the slip of Tata Motors in 3Q). Our sample of
3,700 companies has aggregate debt of ~US$520 bn.
The share of chronically stressed debt (having IC<1 for four or more of the past eight
quarters) increased further to 35%, despite the increase in share of debt with companies
that entered the list for the first time in the past two years (Tata Motors, JSW Energy), as
existing stressed companies continue to remain on the list as performance remains weak.
Share of debt with loss making companies remains stable at 32%.
Figure 11: Share of chronically stressed debt increased to ~35%
Source: Prowess, Company data, Credit Suisse
While share of debt with IC<1 was largely stable at ~30%, the share of chronic stress has
increased and is now at ~27%.
Figure 12: Share of chronic debt with IC<1 based on EBITDA also increased
Source: Prowess, Company data, Credit Suisse
The share of debt with companies not covering interest for the past 12 consecutive
quarters remains high at 37%. The quantum of debt with companies having an IC<1 for
the past eight consecutive quarters increased from Rs5.7 tn in 2Q to Rs7.1 tn in 3Q.
10%
15%
20%
25%
30%
35%
40%
45%
10%
15%
20%
25%
30%
35%
40%
45%
1Q13 2Q13 3Q13 4Q13 1Q14 2Q14 3Q14 4Q14 1Q15 2Q15 3Q15 4Q15 1Q16 2Q16 3Q16 4Q16 1Q17 2Q17 3Q17
% of sample debt with companies with IC <1 % not covering interest in at least 4 quarters
0%
5%
10%
15%
20%
25%
30%
35%
0%
5%
10%
15%
20%
25%
30%
35%
1Q13 2Q13 3Q13 4Q13 1Q14 2Q14 3Q14 4Q14 1Q15 2Q15 3Q15 4Q15 1Q16 2Q16 3Q16 4Q16 1Q17 2Q17 3Q17
% of sample debt with companies with IC <1 % not covering interest in at least 4 quarters
41% of debt with companies having
IC<1 in 3Q17
30% of debt with IC<1 based on EBITDA

16 February 2017
India Corporate Health Tracker 6
Figure 13: Rs7.1 tn of debt with companies having IC<1 for 12 consecutive qtrs
Source: Company data, Credit Suisse estimates
Metals, Power & construction remain major contributors
While stress is spread across sectors, metals, utilities and infra & construction continue to
contribute ~50% of the total stress of Rs15 tn. The share of industrials has increased on
account of Tata Motors' addition to the list.
Some of the other companies to be added are: JSW Energy, JBF Ind, Indiabulls Real
Estate and BGR Energy. Some of the companies that exited the list were Adani
Enterprises, IL&FS transport, Shipping Corp, Zuari Agro and Indian Hotels.
Figure 14: Stress remains concentrated in .. Figure 15: … infra and const and metal sectors
Source: Company data, Credit Suisse estimates Source: Company data, Credit Suisse estimates
0%
5%
10%
15%
20%
25%
30%
35%
40%
1 2 3 4 5 6 7 8 9 10 11 12
% of debt with companies corresponding to quarters when they had IC<1
Infra & construction
22%
Services4%
Airlines1%
Industrials12%
Diversified5%IT/ Telecom
10%
Metals17%
Textiles5%
Energy0%
Agri3%
Utilities14%
Pharma1%
CRE3%
Consumer3%
Total debt of Rs 15.1 tn
3Q17
Infra & construction
24%
Services7%
Airlines2%
Industrials8%Diversified
5%IT/ Telecom10%
Metals18%
Textiles4%
Energy0%
Agri3%
Utilities13%
Pharma1%
CRE2%
Consumer3%
Total debt of Rs 14.5 tn
2Q17
37% of IC<1 had IC<1 for 12 consecutive
quarters
Metals, Power and construction contribute
to ~50% of stress

16 February 2017
India Corporate Health Tracker 7
Figure 16: Larger stressed companies are yet to be recognised as NPAs
FY14 gross
borrowings
(Rs mn)
FY15 gross
borrowings
(Rs mn)
FY16 gross
borrowings
(Rs mn)
3Q EBIT 3Q Interest 3Q interest
cover
No. of quarters with
IC<1 0←→12*
Jaiprakash Associates Ltd. 729,792 761,804 691,366 -2,428 9,047 -0.3 ████████████
Tata Motors Ltd. 608,919 751,490 690,374 5,861 8,707 0.7 █
Adani Power Ltd. 443,969 448,993 532,002 10,413 14,302 0.7 ██████████
G M R Infrastructure Ltd. 437,787 479,766 498,014 1,127 1,964 0.6 ████████████
Idea Cellular Ltd. 206,519 268,770 482,806 2,002 9,669 0.2 ██
Videocon Industries Ltd. 407,681 454,055 476,795 361 6,342 0.1 ████████████
Reliance Communications Ltd. 408,910 395,000 473,320 -590 9,580 -0.1 ██████
Jindal Steel & Power Ltd. 365,321 457,184 470,250 2,493 8,353 0.3 ████████
Lanco Infratech Ltd. 375,370 399,024 454,362 -1,720 7,315 -0.2 ███████████
Bhushan Steel Ltd. 334,655 395,293 448,858 5,348 13,774 0.4 ████████████
Tata Power Co. Ltd. 403,092 421,473 416,446 6,518 7,010 0.9 ███
Steel Authority Of India Ltd. 253,067 298,980 344,312 -7,127 6,108 -1.2 ████████
G V K Power & Infrastructure Ltd. 226,268 251,988 271,709 31 112 0.3 ████████████
Jaiprakash Power Ventures Ltd. 275,029 321,951 257,264 1,047 4,472 0.2 █████████
Reliance Infrastructure Ltd. 242,891 257,660 254,729 -855 11,474 -0.1 █████████
Alok Industries Ltd. 200,217 182,092 229,192 -2,999 8,561 -0.4 ███████
K S K Energy Ventures Ltd. 143,453 191,874 203,468 114 5,405 0.0 ███████████
Mahanagar Telephone Nigam 144,344 167,004 179,424 -5,835 3,823 -1.5 ████████████
J S W Energy Ltd. 101,065 92,941 155,231 4,131 4,229 1.0 █
Amtek Auto Ltd. 152,269 176,630 147,043 -462 3,662 -0.1 ████████
Aban Offshore Ltd. 132,555 140,671 146,458 641 2,746 0.2 █████
Rattanindia Power Ltd. 102,164 109,837 137,948 1,429 2,491 0.6 ███████████
Monnet Ispat & Energy Ltd. 107,621 125,074 127,371 -1,142 2,771 -0.4 ███████████
Hindustan Construction Co. Ltd. 111,500 121,708 114,466 1,304 1,947 0.7 ██████████
Jet Airways (India) Ltd. 105,851 122,509 108,904 2,030 2,208 0.9 ██████████
Electrosteel Steels Ltd. 97,620 102,933 113,040 -1,552 2,827 -0.5 ████████████
I V R C L Ltd. 81,984 91,681 108,626 -820 1,754 -0.5 ████████████
J B F Industries Ltd. 63,952 86,962 106,112 336 388 0.9 █████
Tata Teleservices 64,145 71,568 104,267 -698 3,510 -0.2 ████████████
Jindal Stainless Ltd. 117,258 113,260 102,916 2,632 2,677 1.0 ████████████
Era Infra Engg. Ltd. 84,469 94,869 65,091 -949 2,326 -0.4 ████████████
Jaypee Infratech Ltd. 83,962 91,018 101,064 1,242 1,888 0.7 ██████
Unitech Ltd. 77,536 91,031 100,929 487 578 0.8 █████████
Shree Renuka Sugars Ltd. 98,087 93,238 90,049 161 891 0.2 ██████████
Bharati Defence & Infrastructure 13,858 65,023 89,384 -293 287 -1.0 ████████████
Ballarpur Industries Ltd. 68,902 73,883 85,557 -2,417 2,408 -1.0 █████████
Sadbhav Infrastructure Project 50,205 64,483 82,107 1,814 2,623 0.7 ████████
Reliance Defence & Engg. Ltd. 53,356 72,394 80,164 -461 1,425 -0.3 ███████████
Punj Lloyd Ltd. 53,324 71,622 80,581 -217 2,245 -0.1 ████████████
Sterling Biotech Ltd. 58,678 45,985 79,197 -608 969 -0.6 ████████████
Bajaj Hindusthan Sugar Ltd. 62,747 77,585 70,766 1,243 2,009 0.6 ██████████
Binani Industries Ltd. 51,217 58,769 64,481 -57 137 -0.4 ███████████
Moser Baer India Ltd. 45,063 48,085 61,962 -380 535 -0.7 ████████████
Indiabulls Real Estate Ltd. 35,538 60,720 61,809 109 1,402 0.1 ██
Castex Technologies Ltd. 45,617 57,462 57,033 -724 2,082 -0.3 ███████
S E L Manufacturing Co. Ltd. 45,377 58,503 59,191 -1,710 158 -10.8 ████████████
Essar Shipping Ltd. 53,581 53,383 56,423 64 940 0.1 ████████████
Ruchi Soya Inds. Ltd. 38,635 37,480 55,446 185 2,587 0.1 ████████
Kesoram Industries Ltd. 46,248 46,248 50,425 -248 688 -0.4 ████████████
* Column length indicates no. of qtrs for which IC is <1 ranging from 1 to 12; companies marked in red have turned NPA, while in orange are restructured accounts, blue are accounts that have been partially recognised as NPA and the ones in green have had strategic debt restructuring undertaken by the banks Source: Prowess, Company data, Credit Suisse Estimates

16 February 2017
India Corporate Health Tracker 8
Overall profitability remains weak
Overall EBITDA growth was stable at 9% YoY (on a low base) but remained weak,
declining 2% QoQ. EBIT declined 4% QoQ, while interest costs increased 4% QoQ
resulting in interest cover falling to 2.2x versus 2.4x in 2Q17. Net profit was also down
12% QoQ.
Figure 17: EBITDA growth remained negative QoQ, as aggregate IC eased to
2.2x
Source: Prowess, Company data, Credit Suisse
No improvement in performance of stressed firms
While overall corporate sector EBITDA grew ~9% YoY, the performance of stressed
companies (with an IC<1 in 2Q17) remained weak declining 10% YoY with sales falling
15% YoY. Profitability remained weak, as the net loss for the companies with IC<1 in
2Q17 remained large at ~Rs170 bn in 3Q17 and these companies have reported losses
for 14 of the past 15 quarters.
Figure 18: Performance of IC<1 firms still weak ... Figure 19: … as losses continue to remain large
Source: Prowess, Company data, Credit Suisse Source: Prowess, Company data, Credit Suisse
-10
-5
0
5
10
15
20
25
0.0
1.0
2.0
3.0
4.0
5.0EBITDA growth (% qoq) (RHS) IC coverage
-20%
-15%
-10%
-5%
0%
5%
10%
15%
Sales EBITDA
All companies Co's with IC<1 in 2Q17
-200,000
-150,000
-100,000
-50,000
0
50,000
100,000
150,000
4Q11
1Q12
2Q12
3Q12
4Q12
1Q13
2Q13
3Q13
4Q13
1Q14
2Q14
3Q14
4Q14
1Q15
2Q15
3Q15
4Q15
1Q16
2Q16
3Q16
4Q16
1Q17
2Q17
3Q17
Net profit (Rs mn)
Aggregate Interest cover declined to 2.2x
Ebitda for co's with IC<1 in 2Q declined 10% yoy, net loss at
Rs170bn

16 February 2017
India Corporate Health Tracker 9
'House of debt' still to see a turnaround
Performance of our "house of debt" companies continues to remain weak. Overall
profitability has declined further, with EBITDA down 4% QoQ and net profits declined 41%
YoY. Aggregate interest cover remained weak at 0.9x with debt to EBITDA at 7.8x. Eleven
of the 19 companies reported losses this quarter, with 13 companies having an IC<1.
Figure 20: Performance of house of debt companies remains weak, with aggregate interest cover < 1x
3Q17 2Q17 3Q16
EBITDA Net profit Debt/
EBITDA (x)
Int. cover
(x)
EBITDA Net profit Debt/
EBITDA (x)
Int. cover
(x)
EBITDA Net profit Debt/
EBITDA(x)
Int. cover
(x)
Adani Power 16,490 (3,236) 8.1 0.7 18,211 (1,134) 7.4 0.9 20,077 1,018 6.5 1.1
Adani Ports & SEZ 13,707 8,482 4.1 3.6 14,515 10,959 3.9 3.9 10,531 6,373 4.7 2.9
Adani Enterprises 5,573 2,755 8.6 1.0 3,874 363 12.3 0.7 4,383 1,754 11.4 1.0
Adani Transmission 4,714 993 5.0 1.6 4,731 995 5.0 1.3 4,743 799 4.1 1.4
Essar Shipping 407 (836) 19.4 0.1 517 (620) 15.3 0.2 676 (1,096) 19.8 (0.4)
G M R Infra * 1,167 (3,814) 106.7 0.6 2,532 (7,003) 49.2 1.4 13,566 (3,480) 8.9 0.7
G V K Power & Infra * 31 (7) 2,163.3 0.3 (88) (134) (771.0) (0.7) 3,962 (3,747) 16.5 0.3
Jaiprakash Ass (234) (10,950) (309.9) (0.3) (859) (7,812) (84.2) (0.3) 2,419 (8,306) 31.9 0.0
Jaiprakash Power 2,325 (1,730) 27.5 0.2 2,791 (1,617) 22.9 0.3 3,732 (1,403) 16.1 0.5
Jaypee Infra 1,354 (414) 16.9 0.7 110 (1,318) 208.9 0.0 2,077 (207) 11.6 0.8
JSW Steel 28,669 7,157 3.8 2.1 29,469 6,469 3.7 2.1 8,892 (9,844) 11.5 0.1
JSW Energy 6,575 180 5.6 1.0 9,627 2,149 3.8 1.6 11,913 3,219 3.3 2.1
Lanco Infra 501 (8,842) 226.1 (0.2) 4,443 (2,931) 25.5 0.3 4,275 1,512 22.4 0.3
Reliance Infra 4,328 3,659 17.3 (0.1) 9,906 5,598 7.5 0.6 6,541 4,442 10.2 0.7
Reliance Power 11,546 2,757 7.3 1.2 11,443 2,721 7.3 1.4 12,297 3,518 6.9 1.6
Reliance Comm 11,060 (4,880) 10.7 (0.1) 15,000 620 7.9 0.8 17,820 1,980 6.0 1.3
Reliance Defence 41 (1,327) 525.5 (0.3) 115 (1,163) 185.2 (0.3) (1,270) (2,936) (15.5) (1.5)
Vedanta 58,775 29,851 3.4 2.9 46,632 22,782 4.3 2.2 31,141 4,997 6.3 1.0
Videocon Ind 1,830 (5,098) 65.1 0.1 2,227 (3,819) 53.5 0.1 4,088 (844) 27.8 0.4
Total 168,859 14,700 8.9 0.9 175,192 25,106 8.5 1.0 161,863 (2,251) 8.9 0.8
Total (ex. GMR & GVK) 167,661 18,521 7.8 0.9 172,749 32,243 7.5 1.0 144,335 4,976 8.7 0.8
*1Q & 2Q results for GMR & GVK are standalone and hence yoy numbers are not comparable Source: Prowess, Company data, Credit Suisse
16 February 2017
India Corporate Health Tracker 10
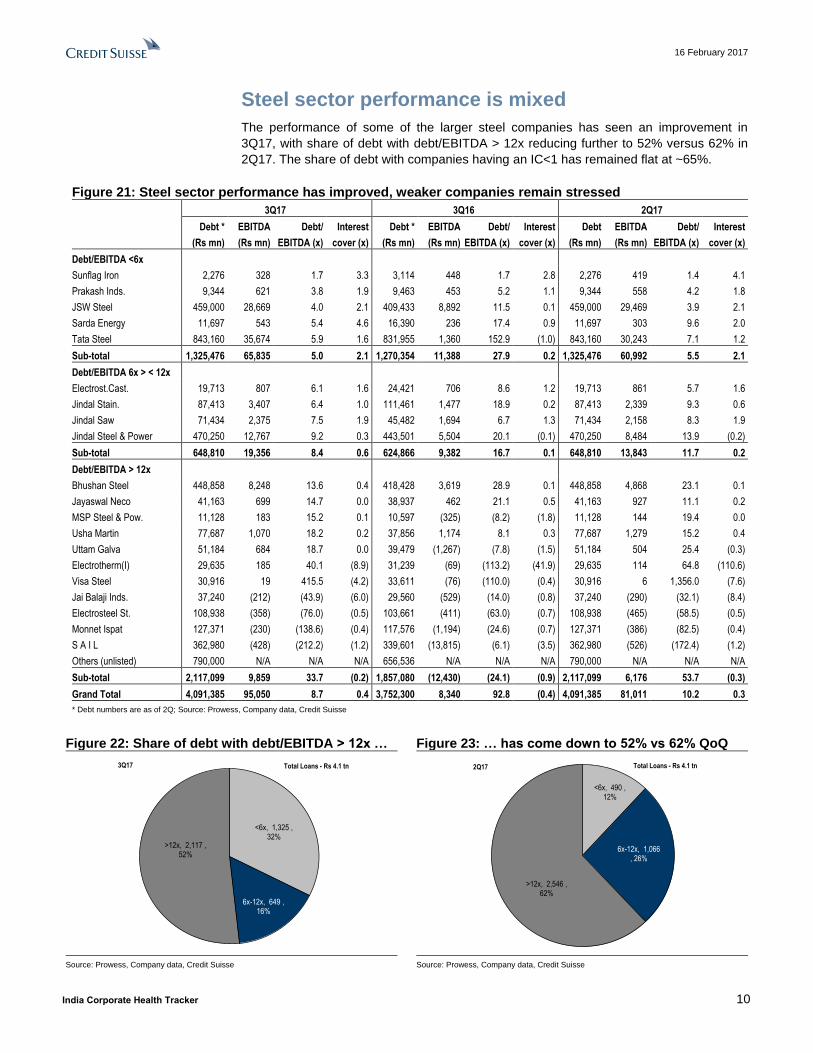
Steel sector performance is mixed
The performance of some of the larger steel companies has seen an improvement in
3Q17, with share of debt with debt/EBITDA > 12x reducing further to 52% versus 62% in
2Q17. The share of debt with companies having an IC<1 has remained flat at ~65%.
Figure 21: Steel sector performance has improved, weaker companies remain stressed
3Q17 3Q16 2Q17
Debt *
(Rs mn)
EBITDA
(Rs mn)
Debt/
EBITDA (x)
Interest
cover (x)
Debt *
(Rs mn)
EBITDA
(Rs mn)
Debt/
EBITDA (x)
Interest
cover (x)
Debt
(Rs mn)
EBITDA
(Rs mn)
Debt/
EBITDA (x)
Interest
cover (x)
Debt/EBITDA <6x
Sunflag Iron 2,276 328 1.7 3.3 3,114 448 1.7 2.8 2,276 419 1.4 4.1
Prakash Inds. 9,344 621 3.8 1.9 9,463 453 5.2 1.1 9,344 558 4.2 1.8
JSW Steel 459,000 28,669 4.0 2.1 409,433 8,892 11.5 0.1 459,000 29,469 3.9 2.1
Sarda Energy 11,697 543 5.4 4.6 16,390 236 17.4 0.9 11,697 303 9.6 2.0
Tata Steel 843,160 35,674 5.9 1.6 831,955 1,360 152.9 (1.0) 843,160 30,243 7.1 1.2
Sub-total 1,325,476 65,835 5.0 2.1 1,270,354 11,388 27.9 0.2 1,325,476 60,992 5.5 2.1
Debt/EBITDA 6x > < 12x
Electrost.Cast. 19,713 807 6.1 1.6 24,421 706 8.6 1.2 19,713 861 5.7 1.6
Jindal Stain. 87,413 3,407 6.4 1.0 111,461 1,477 18.9 0.2 87,413 2,339 9.3 0.6
Jindal Saw 71,434 2,375 7.5 1.9 45,482 1,694 6.7 1.3 71,434 2,158 8.3 1.9
Jindal Steel & Power 470,250 12,767 9.2 0.3 443,501 5,504 20.1 (0.1) 470,250 8,484 13.9 (0.2)
Sub-total 648,810 19,356 8.4 0.6 624,866 9,382 16.7 0.1 648,810 13,843 11.7 0.2
Debt/EBITDA > 12x
Bhushan Steel 448,858 8,248 13.6 0.4 418,428 3,619 28.9 0.1 448,858 4,868 23.1 0.1
Jayaswal Neco 41,163 699 14.7 0.0 38,937 462 21.1 0.5 41,163 927 11.1 0.2
MSP Steel & Pow. 11,128 183 15.2 0.1 10,597 (325) (8.2) (1.8) 11,128 144 19.4 0.0
Usha Martin 77,687 1,070 18.2 0.2 37,856 1,174 8.1 0.3 77,687 1,279 15.2 0.4
Uttam Galva 51,184 684 18.7 0.0 39,479 (1,267) (7.8) (1.5) 51,184 504 25.4 (0.3)
Electrotherm(I) 29,635 185 40.1 (8.9) 31,239 (69) (113.2) (41.9) 29,635 114 64.8 (110.6)
Visa Steel 30,916 19 415.5 (4.2) 33,611 (76) (110.0) (0.4) 30,916 6 1,356.0 (7.6)
Jai Balaji Inds. 37,240 (212) (43.9) (6.0) 29,560 (529) (14.0) (0.8) 37,240 (290) (32.1) (8.4)
Electrosteel St. 108,938 (358) (76.0) (0.5) 103,661 (411) (63.0) (0.7) 108,938 (465) (58.5) (0.5)
Monnet Ispat 127,371 (230) (138.6) (0.4) 117,576 (1,194) (24.6) (0.7) 127,371 (386) (82.5) (0.4)
S A I L 362,980 (428) (212.2) (1.2) 339,601 (13,815) (6.1) (3.5) 362,980 (526) (172.4) (1.2)
Others (unlisted) 790,000 N/A N/A N/A 656,536 N/A N/A N/A 790,000 N/A N/A N/A
Sub-total 2,117,099 9,859 33.7 (0.2) 1,857,080 (12,430) (24.1) (0.9) 2,117,099 6,176 53.7 (0.3)
Grand Total 4,091,385 95,050 8.7 0.4 3,752,300 8,340 92.8 (0.4) 4,091,385 81,011 10.2 0.3
* Debt numbers are as of 2Q; Source: Prowess, Company data, Credit Suisse
Figure 22: Share of debt with debt/EBITDA > 12x … Figure 23: … has come down to 52% vs 62% QoQ
Source: Prowess, Company data, Credit Suisse Source: Prowess, Company data, Credit Suisse
<6x, 1,325 , 32%
6x-12x, 649 , 16%
>12x, 2,117 , 52%
3Q17 Total Loans - Rs 4.1 tn
<6x, 490 , 12%
6x-12x, 1,066 , 26%
>12x, 2,546 , 62%
Total Loans - Rs 4.1 tn2Q17

16 February 2017
India Corporate Health Tracker 11
While the recognition of steel sector stress has been higher at banks compared to other
sectors, with NPA recognition at ~30-50% for the larger banks, stress within the steel
sector remains high, with ~52% of debt having debt/EBITDA > 12x and 60% of debt with
companies having IC<1.
Figure 24: Share of debt with companies having
debt / EBITDA > 12x has come down to 52% …
Figure 25: … while share of debt with IC<1
companies has remained at ~60%
Source: Prowess, Company data, Credit Suisse Source: Prowess, Company data, Credit Suisse
Stressed steel companies continue to report losses
While some of the larger companies (Tata Steel and JSW Steel) reported a profit this
quarter, the stressed steel companies continue to report losses, with companies like SAIL,
Bhushan Steel, Monnet Ispat and Electrosteel continued to report large losses. The
aggregate net loss for the steel sector for 3Q17 was ~Rs26 bn.
Figure 26: Interest costs rosed YoY, resulting in … Figure 27: … stressed firms still making losses
Source: Prowess, Company data, Credit Suisse Source: Prowess, Company data, Credit Suisse
48%
86% 86% 88%
53%
62%
52%
0
100
200
300
400
500
600
0%
10%
20%
30%
40%
50%
60%
70%
80%
90%
100%
1Q16 2Q16 3Q16 4Q16 1Q17 2Q17 3Q17
Share of debt with Debt / Ebitda > 12x Avg Steel Price US$/t (RHS)
15%
25%
35%
45%
55%
65%
75%
85%
95%
0
500
1,000
1,500
2,000
2,500
3,000
3,500
4,000
1Q16 2Q16 3Q16 4Q16 1Q17 2Q17 3Q17
Steel sector debt with IC<1 (Rs bn) Share of debt with IC<1 (%) (RHS)
-
2
4
6
8
10
12
14
16
Bhushan Steel JSPL SAIL ElectrosteelSteel
Monnet Ispat
3Q16 3Q17Interest expense (Rs bn)
(18)
(16)
(14)
(12)
(10)
(8)
(6)
(4)
(2)
-
JSPL ElectrosteelSteel
Monnet Ispat Bhushan Steel SAIL
3Q16 2Q17 3Q17Net profit (Rs bn)
60% of steel debt has IC<1 in 3Q, 52% had
Debt/Ebitda > 12x

16 February 2017
India Corporate Health Tracker 12
Power sector stress rising
Stress within the power sector continues to rise, as most of the larger companies saw
EBITDA decline in 3Q, with EBITDA for the sector declining 13% YoY and 18% QoQ and
net profit falling 7% YoY and 34% QoQ. Private sector plant load factors (PLF) increased
QoQ, but were lower YoY and remain weak at ~56%, with merchant tariffs remaining low
at <Rs2.5/kWh. There have been no PPAs signed during the quarter either and stress is
likely to continue rising.
Figure 28: PLF and merchant tariffs remain low Figure 29: EBITDA has fallen for most companies
Source: Prowess, Company data, Credit Suisse Source: Prowess, Company data, Credit Suisse
As profitability remains muted, the share of debt with interest cover < 1 increased to 67%
in 3Q versus 63% in 2Q, with Rs3.8 tn of debt now with companies having IC<1. Most of
the larger companies have seen interest cover decline this quarter, with IC<1 for
companies such as Reliance Infra, JP Power, Rattan India, Adani Power (despite
compensatory tariff's) Tata Power and JSW Energy.
Figure 30: Share of power sector debt with IC<1
increased further to 67%
Figure 31: As most of the larger companies saw
interest cover fall this quarter
Source: Prowess, Company data, Credit Suisse Source: Prowess, Company data, Credit Suisse
57.4%
64.5%63.7%
58.9%
53.5%
56.2%
-
0.5
1.0
1.5
2.0
2.5
3.0
3.5
40.0%
45.0%
50.0%
55.0%
60.0%
65.0%
70.0%
2Q16 3Q16 4Q16 1Q17 2Q17 3Q17
Private Sector PLF (%) Merchat Price (Rs/Mw) (RHS)
-
5
10
15
20
25
Adani Power R Power Tata Power JSW Energy R Infra JP Power Rattan India
3Q16 2Q17 3Q17EBITDA (Rs bn)
40%
45%
50%
55%
60%
65%
70%
2,200
2,400
2,600
2,800
3,000
3,200
3,400
3,600
3,800
1Q16 2Q16 3Q16 4Q16 1Q17 2Q17 3Q17
Power sector debt with IC<1 (Rs bn) Share of debt with IC<1 (%) (RHS)
(0.5)
-
0.5
1.0
1.5
2.0
2.5
R Power JSWEnergy
TataPower
AdaniPower
RattanIndia
JP Power R Infra
3Q16 2Q17 3Q17Interest Cover (x)
Private power sector PLF remains low
at ~56%
67% of power sector debt has IC<1
in 3Q vs 63% in 2Q

16 February 2017
India Corporate Health Tracker 13
Telecom sector performance deteriorates
The performance of telecom companies has continued to worsen, with sector interest
cover turning negative in the 3Q. Losses for the stressed telecom companies widened
further. Sector EBITDA declined 16% YoY and 14% QoQ, and the sector posted a net loss
of Rs11 bn this quarter. Share of debt within the telecom sector with IC<1 companies
remained high at 45%. With recent spectrum auctions, debt levels for the sector would
increase further also resulting in increase in interest costs, impacting debt servicing.
Figure 32: Sector EBITDA has fallen 14% QoQ Figure 33: Share of debt with IC<1 firms high at 45%
Source: Prowess, Company data, Credit Suisse Source: Prowess, Company data, Credit Suisse
The performance of stressed companies weakened further, with EBITDA declining 24%
QoQ and EBIT turning negative in 3Q, while interest costs were up 63% YoY. Losses
widened for most of the stressed companies, as they reported an aggregate loss of
Rs21 bn.
Figure 34: Stressed telcos saw negative EBIT in 3Q Figure 35: With losses widening for most firms
Source: Prowess, Company data, Credit Suisse Source: Prowess, Company data, Credit Suisse
0.0
0.5
1.0
1.5
2.0
2.5
0.0
20.0
40.0
60.0
80.0
100.0
120.0
140.0
160.0
180.0
1Q16 2Q16 3Q16 4Q16 1Q17 2Q17 3Q17
EBITDA (Rs bn) Interest expenses IC coverageTelecom sector
Rs bn
15%
20%
25%
30%
35%
40%
45%
50%
-
200
400
600
800
1,000
1,200
1,400
1,600
2Q15 3Q15 4Q15 1Q16 2Q16 3Q16 4Q16 1Q17 2Q17 3Q17
Telecom sector debt with IC<1 (Rs bn) Share of debt with IC<1 (%) (RHS)
-0.4
-0.2
0.0
0.2
0.4
0.6
0.8
1.0
1.2
1.4
0
10
20
30
40
50
60
1Q16 2Q16 3Q16 4Q16 1Q17 2Q17 3Q17
EBITDA Interest expenses IC coverageStressed telecom co's
Rs bn
(10)
(8)
(6)
(4)
(2)
-
2
4
6
8
10
Tata Comm Idea Tata Tele R Comm MTNL
3Q16 2Q17 3Q17Net profit (Rs bn)
45% of telecom sector debt had IC<1 in 3Q.
Losses for the weaker telecom companies widened

16 February 2017
India Corporate Health Tracker 14
Wall of provisioning ahead, without a Bad Bank
Forbearances to expire in 12-18 months
Currently, 4-8% of stressed loans are sitting as standard under various classifications. As
many of these forbearances expire in the next 12-18 months, we expect corporate NPL
slippages to remain elevated.
Figure 36: Reported standard restructured & SDR loans at 4-8% for PSU banks
Source: Company data, Credit Suisse estimates
As highlighted, the power sector remains stressed, with 67% of debt with companies
having IC<1, and as per our bottom-up analysis, ~Rs1.2 tn of debt is with stressed power
projects.
Figure 37: Infrastructure constitutes ~40% of
system restructured loans Figure 38: Infra restructured is ~34-57% of total
Source: RBI, Credit Suisse * Only power for SBI & IOB; Source: Company data, Credit Suisse estimates;
On a bottom-up basis, we have identified some of the larger stressed power projects,
which have seen large cost overruns or where PLFs are low. We have also included the
gas-based plants which continue to operate at low PLFs given the lack of gas availability.
This list of projects has debt amounting to ~Rs1.3 tn and while some are classified as
restructured and very few as NPLs at some banks, a majority continue to be classified as
standard.
0.0%
2.0%
4.0%
6.0%
8.0%
10.0%
12.0%
Standard Restrd Standard SDR Standard Watch list(%) of loans
Power 21%
Steel10%
Other Infra 17%
Textile 3%
Others49%
Total Restructured Loans of Rs2,000bn57%
46%
37%36%
34%
29%
0%
10%
20%
30%
40%
50%
60%
PNB BOI Canara Union IOB* SBI*
Infra/power as % of restructured
4-8% of loans are classified as standard
and in various classifications

16 February 2017
India Corporate Health Tracker 15
Figure 39: Power projects with total debt of ~Rs1,200 bn being stressed
Company Project Capacity Operational /
CoD
Recognitio
n
Debt (Rs bn)
Coal Based
Projects
GMR Chattisgarh - Raikheda 1,370 Operational SDR 94
GVK Alaknanda 330 Operational 35
GVK Goindwal Sahib 540 Operational 34
Jaypee Bara I 1,980 Operational 110
Lanco Amarkantak III & IV 1,320 FY18 80
Lanco Vidarbha 1,320 FY19 55
Lanco Babandh 1,320 FY18 55
Essar Mahan 1,200 Operational 77
Essar Tori 1,200 FY18 65
JP Power Bara 1,980 Operational 110
KSK Mahanadi 3,600 Operational 124
ACPL Athena Chhattisgarh 1,200 Operational 60
East Coast Energy Kakarapalli 1,320 FY18 40
DB Power Limited 582 Operational 30
Meenakshi Energy 1,000 Operational 40
Total 1,009
Gas Based
Projects
GMR Kakinada 220 Operational 10
GMR Vemagiri I 370 Operational 8
GMR Rajahmundry 768 Operational SDR 35
GVK Jegurupadu - Phase I 455 Operational 13
GVK Gautami Power 469 Operational 13
Lanco Kondapalli I 368 Operational 23
Lanco Kondapalli II 366 Operational 8
Lanco Kondapalli III 742 Operational 23
Reliance Power Samalkot expansion 2,400 Operational 50
Essar Vadinar 890 Operational 18
Essar Hazira 270 Operational 7
Reliance Samalkot 2,620 50
Total 258
Source: Company data, Credit Suisse estimates
Figure 40: Power sector recognised
impaired loans at ~17%
Figure 41: Recognition of NPA
remains low in the power sector
Source: Company data, Credit Suisse estimates Source: Company data, Credit Suisse estimates
NPLs, 355, 7%
Restructured , 519, 10%
Stressed -unrecognised ,
716, 14%
Standard, 3,710, 70%
Total Power sector loans - Rs 5,300bn
17%
4%
23%
8% 6%3% 5% 3%
17%
26%
2%
0%
10%
20%
30%
40%
ICICI Axis PNB Union BOB SBI OBC BOI
Power sector NPLs Watchlist (%)
Rs1.2tn of debt with stressed
power projects

16 February 2017
India Corporate Health Tracker 16
Increasing use of SDR
Over the past two quarters, the use of the strategic debt restructuring (SDR) structure has
been increasing by the banks. This is surprising given the lack of resolutions that have
been achieved through this structure. In addition, of the 30 cases that it was implemented
in, it has been successfully completed in none of the companies, with partial success only
in one company. The primary incentive appears to be the 18-month standstill on asset
classification that is available under this. Given the limited success in identifying buyers for
these assets, we expect that as the 18-month period expires, a large portion of these
loans will move from standard SDR to NPL classification.
While the declared SDR of banks adds up to ~Rs700 bn as of 31st Dec'16, based on the
list of companies where SDR has been announced, it amounts to Rs2.4tn, of which ~50%
are standard.
Figure 42: List of standard accounts is growing rapidly
Companies under SDR
Total debt (Rs bn) Debt to mkt cap (x)
Bhushan Power 373
Jaiprakash Associates 300 11.1
Alok Industries 260 56.0
Jaiprakash Power 250 16.1
Monnet Ispat 118 49.6
Gammon India 113 24.4
Electrosteel Steel 106 10.6
GMR Chhattisgarh 94 5.8
IVRCL 93 21.6
Ballarpur Industries 72 6.6
ABG Shipyard 70 46.4
Patel Engg 54 4.3
Transtroy 43
Coastal Projects 40
GMR Rajahmundry 40 5.8
Essar Projects 38
Shiv-Vani Oil 36 29.0
Adhunik Power and Natural Resources 31
Visa Steel 31 13.9
Educomp Solutions 31 21.8
Jyoti structures 30 29.5
Surana Industries 28 173.2
Diamond Power 23 2.1
Rohit Ferrotech 23 27.3
Lanco Teesta 22 44.5
GOL Offshore 20 11.4
AMW 14
Usher Agro 9 9.8
Tilaknagar Industries 8 4.4
Total 2,369
Of which now NPA 1,253
% already NPA 53%
Source: Company data, Credit Suisse estimates
Declared SDR by banks is ~Rs700bn, while
based on list of co's with SDR announced
amounts to Rs2.4tn

16 February 2017
India Corporate Health Tracker 17
ARC sales have dropped off
The private ARCs' role in the resolution of the stress loans has also not expanded despite
the government relaxing foreign ownership for ARCs (100% FDI in ARCs was allowed in
May-16). The sale of NPAs to ARCs declined 50% in FY16 and has likely fallen further in
FY17.
The change in regulations regarding the sale of NPA's to ARC's in Sep-16, caps the
maximum holding of SR's by the seller bank to 50% from Apr-17 and 10% from Apr-18 will
result in sale of assets to ARC's slowing down even further. If the bank hold more than
50% or 10% respectively, provisioning would need to be made treating the SR's as NPAs.
Figure 43: Sales to ARCs slowed in FY16
Figure 44: SRs outstanding are <1% of loans for
most banks
Source: EnY, Company data, Credit Suisse estimates Source: Company data, Credit Suisse
0
50
100
150
200
250
300
350
400
450
FY08 FY09 FY10 FY11 FY12 FY13 FY14 FY15 FY16
Book value of assets acquired by ARC's
0.0%
0.5%
1.0%
1.5%
2.0%
2.5%
CB
oI
Indi
an
UC
O
ALB
K
BoI
ICIC
I
Den
a
Can
ara
Syn
dica
te
IDB
I
Axi
s
Uni
ted
Uni
on
Kot
ak SB
I
PN
B
IOB
Vija
ya
Yes
Indu
sInd
BoB
BO
M
SR's o/s as a % of advances
ARC sales have slowed and likely to
slow further

16 February 2017
India Corporate Health Tracker 18
RBI tools have not worked as planned
While the RBI has announced several schemes for dealing with stressed assets, these
have not been successful in dealing with the stressed loan problem.
Figure 45: RBI dispensations have not worked as expected
Scheme Quantum Step Pros Cons Failure
Sale to Asset
Reconstruction
Companies
Only ~Rs200
bn of the Rs7.3
tn of NPAs
were sold in
FY16
Increase in share of cash
component in ARC sale
from 5% to 15%.
(1) Increase in cash
component to 15%
resulted in more realistic
valuations
(1) Depreciation in value of
investment will only be realised after
a year
(1) Asset sales have happened largely in the
form of Security receipts, with cash component
remaining small
Allowing banks to write off
losses on ARC sales over
8 quarters.
(2) Allowing loss to be
spread over 8 quarters
resulted in wider
adoption
(2) Higher cash component has
resulted in banks requiring to take
larger losses, as ARC's are willing
to pay less
(2) Quantum of assets sold has also been small
and less than 1% of loans
Cap on holding of SRs by
seller banks.
(3) To result in better
pricing of sales
(3) With quantum of SRs that can be held to be
reduced to 50% and further to 10% by selling
banks, sales to ARCs are likely to slow further.
Strategic Debt
Restructuring
(SDR)
~50% of SDR
cases have
already turned
NPA
SDR allows banks to take
over 51% equity of
stressed companies by
conversion of interest or
principal, and gives them
18 months to find a new
buyer or management
(1) Lenders can force
management change in
stressed companies
(1) Banks misuse SDR to delay
NPA recognition, as asset
classification remains stand-still for
18 months
(1) Majority of the companies on which SDR
has been implemented have been failed cases
of corporate debt restructuring (CDR)
(2) Lenders can acquire
majority shareholding in
the company
(2) Banks end up with equity
ownership of bad companies
(2) Banks have been unable to find new buyers
for these assets, with the government now
looking to force PSUs to acquire stakes.
(3) % of debt converted to acquire
51% equity would be extremely
small as a % of total debt, leaving
debt levels unsustainably high
(3) With debt being significantly higher than
market cap, share of debt to be converted has
also been smaller.
5:25 refinancing Allows refinancing of large
(> Rs 500 crore) long-
gestation operational
projects in infrastructure
and core industries, with
periodic re-financing every
5-7 years.
(1) Allows refinancing for
operating infrastructure
projects that have a
longer gestation period
(1) Delaying recognition of problem,
even for projects which are clearly
stressed
(1) 5:25 has been used in a large no. of cases
where the asset was stressed and despite
pushing back of principal repayments, the firms
were unable to meet interest obligations.
(2) Does not bifurcate unsustainable
debt of over-leveraged companies,
resulting in refinancing of
unserviceable debt
(2) Has resulted in additional loans being given
to stressed companies and the required haircut
has not been taken.
Scheme for
Sustainable
Structuring of
Stressed Assets
(S4A)
Only one case
has been
completed
successfully till
date
Scheme for large (> Rs
500 crore) projects that
have commenced
operations and where
sustainable debt through
independent techno
economic viability study is
not < 50% of total debt.
Part A as sustainable
portion and Part B as
unsustainable.
(1) Right sizes deb, by
splitting it into
sustainable and
unsustainable portion
(1) Unsustainable portion of debt
(Part B) is converted to equity /
convertible preference shares
(1) Banks have yet to implement S4A, with only
a couple of companies undertaking this
scheme.
(2) Requires outside
agencies to arrive at the
serviceable levels of
debt
(2) No fresh moratorium or
extension of interest / principal
repayments on Part A.
(3) Allows lenders to
take over the project
(3) If there is a change in
management, there is no change in
asset classification as per SDR
rules; if no change in promoters,
asset classification stays same for
90 days, pushing back recognition
by banks.
Source: Company data, Credit Suisse estimates

16 February 2017
India Corporate Health Tracker 19
Ageing to result in >100bp of credit cost
We estimate that Indian banks need Rs860 bn of provisions on existing NPAs over the
next 12 months, as regulatory provisions are based on NPL vintage. As the spike in NPAs
from the RBI's AQR a year ago now migrates from sub-standard to doubtful, provisioning
needs will rise. Resolutions on most of the large NPLs have not progressed even in
sectors such as steel that witnessed a cyclical upswing, given the need for large haircuts
and multiplicity of lenders. Therefore, unless a government-sponsored bad bank is created
to house a significant share of the US$108 bn of NPAs, provision costs will be high.
Figure 46: Large share of sub-standard assets will move to doubtful category
Source: Company data, Credit Suisse estimates
RBI conducted its AQR in 2H16, which resulted in banks recognising ~Rs2.8 tn of loans as NPLs. As a year has now passed, the loans would move into the next bucket, which would result in significant provisions only on account of ageing. We estimate that banks would need to provide ~Rs860 bn in FY18 and another Rs720 bn in FY19 only on account of ageing.
Figure 47: Ageing to keep credit costs in FY18 and FY19 at > 100bp for PSUs
Source: Company data, Credit Suisse estimates
Figure 48: Regulatory provisioning requirements on NPAs
Sub Standard Doubtful 1 Doubtful 2 Doubtful 3
Provisioning requirement 15% 25% 40% 100%
Ageing of NPA 0-1 year 1-2 years 2-4 years > 4 years
Source: RBI, Credit Suisse
0%
10%
20%
30%
40%
50%
60%
70%
80%
90%
100%
Sub Standard Doutbful 1 Doubtful 2 Doubtful 3 Loss
0.0%
0.5%
1.0%
1.5%
2.0%
2.5%
3.0%
FY18E FY19EAgeing Credit Cost (%)
Ageing to result in ~Rs860bn of provisions
for FY18E

16 February 2017
India Corporate Health Tracker 20
Bad Banks: Decisive measures needed to tackle
problem loans
The resolution process has slowed primarily due to reluctance by bank's management to
take decisions on large haircuts. Given the quantum of problem loans and complexity
involved in resolving these problem loans, the creation of bad banks can significantly
simplify the process with consolidation of loans and final decision making in the hands of
one entity. Only a bad bank/bailout can help meet the provisioning need for the banks.
Figure 49: Pros and Cons of bad banks
Pros for bad banks
Decision making – Usually decision making around an account stands still once an account is classified NPA
Multiplicity of lenders – Single point of decision making
Haircut need on the problem loans – One of the biggest contentious points currently with the lenders. Under a bad bank
structure, decisions on haircuts can be taken at the time of transfer or post transfer in a transparent way
Funding requirement – Bad banks can provide last-mile funding to projects stuck in the last phase
Sectoral complexities – Focused management with clear specific skills needed to resolve these problem loans
Clarity on progress – Structured approach towards resolution
Improved transparency to regain markets trust
Cons for bad banks
Capital infusion to the bad bank or the banking system – Depending on who takes the haircut, the government would need
to put in additional capital and will have to raise resources for it.
Funding requirement – Bad banks may need to raise debt at competitive rates to provide funding to stuck projects.
Skillset required – Bad banks need skilled professionals specialising in the stressed sectors for effective resolution.
Management acceptance – This would require management to accept that the magnitude of the problem is large.
Political challenges – Creation of bad banks may create a backlash.
Source: Company data, Credit Suisse estimates
Bankruptcy code: Long-term structural positive
The Insolvency and Bankruptcy code became functional from December 2016 with most of
the key regulations in place and a large number of Investment Professionals (IPs) having
already registered. The first large case filed with the board was Innoventive Industries by
ICICI Bank, which was challenged in the court as the company claimed to have protection
under state labour laws. The bank's lawyers expect a favorable judgment from the
Supreme Court and this would set the precedent for Bankruptcy law preceding all the state
laws. In the near term, most of the laws are likely to be challenged, however as more
precedents are set and law stabilizes over a period of time, it can act as a potent tool for
recovery and resolution of stressed loans.
Without a bad bank, capital needs for PSU
banks would be significantly higher
Bankruptcy code could help resolve some
of the stress

16 February 2017
India Corporate Health Tracker 21
Raising provision estimates, earnings cut Provisioning needs for the banks are likely to stay high on account of slippages from the
existing pool of recognized problem loans (SDR/Restructured/watchlist) and ageing
related provisions post one year of the RBI's AQR exercise. As a result, we increase our
credit cost estimates for coverage banks to ~1.5-1.9% with ageing-related provisions at
60-160bp and as a result, our EPS goes down by by 5-10% for corporate lenders. We also
factor potential gains from stake sales in subs (general insurance) for ICICI and SBI,
resulting in lower earnings cuts, while Axis sees larger FY18 cuts, as we increase NPL
slippage estimates on larger stress outside of watchlist.
Figure 50: Increasing credit cost estimates to 150-
190bp for FY18E on ageing-related provisions
Figure 51: Cutting EPS by 5-10% on an increase in
NPL provisions
Source: Company data, Credit Suisse estimates Source: Company data, Credit Suisse estimates
Figure 52: Summary change in estimates and target price
EPS
Financials Rating Old TP New TP % upside
(downside) FY17E % change FY18E % change
Pvt Banks
Axis Bank N 527 490 0% 29 -10% 39 -8%
ICICI Bank O 316 316 13% 19 -6% 23 -6%
PSU Banks
SBI N 247 246 -8% 18 -8% 24 -3%
PNB U 94 93 -33% 14 -8% 19 -5%
Bank of Baroda N 162 148 -9% 15 0% 20 0%
Bank of India U 92 92 -26% 11 -8% 19 -5%
Union Bank U 124 123 -13% 20 0% 26 0%
Source: Company data, Credit Suisse estimates
Downgrading Axis to NEUTRAL
The slower-than-expected pace of recovery and resolution for the banking system has
meant that slippages from the Axis watchlist have been higher than initially expected.
Stress outside of the watchlist has stayed high as well and as the bank is expected to
recognise most of the problem loans from inside and outside of the watchlist by March
2018, we expect slippages to stay elevated (~3.2% of loans) in FY18. We increase our
credit cost estimate to 180bp for FY18 and cut EPS by 8-10% for FY18/19E. Our TP
moves down to Rs490 and at 1.8x FY18 book, given limited upside, we downgrade the
stock to a NEUTRAL.
2.6
3.3
2.8
2.6
2.2 2.2 2.1
1.9 1.8 1.8 1.7
1.6 1.5 1.5
0.0
0.5
1.0
1.5
2.0
2.5
3.0
3.5
PNB Axis ICICI BOI Union SBI BOB
Credit cost (%) FY17E FY18E
-8% -8% -8%
-6%
-10%
-3%
-5%-5%
-6%
-8%
-12%
-8%
-4%
0%
SBI PNB BOI ICICI Axis
Change in earnings (%) FY18E FY19E

16 February 2017
India Corporate Health Tracker 22
Figure 53: Price to adj book Figure 54: Price to earnings
Source: Company data, Credit Suisse estimates Source: Company data, Credit Suisse estimates
3.0 3.02.8
2.2
1.71.6
1.3 1.3
1.0 1.1
0.7 0.7 0.6
0
1
2
3
4P / Adj BV FY18E FY19E 21
20
1617
16
13 1211
9 10
78
1716
1413 12
10 108 7
65 5
0
5
10
15
20
25
P / E (x)FY18E FY19E

16 February 2017
India Corporate Health Tracker 23
Asia Pacific/India Regional Banks
ICICI Bank (ICBK.BO / ICICIBC IN) Rating OUTPERFORM Price (14-Feb-17, Rs) 284.90 Target price (Rs) 316.00 Upside/downside (%) 10.9 Mkt cap (Rs/US$ mn) 1,658,514/ 24,824 Number of shares (mn) 5,821 Free float (%) 57.0 52-wk price range 292.55-183.35 ADTO-6M (US$ mn) 73.3 Target price is for 12 months.
Research Analysts
Ashish Gupta
91 22 6777 3895
Prashant Kumar
91 22 6777 3942
Kush Shah
91 22 6777 3862
Support from subsidiaries
■ Stress recognition to stay elevated. NPL slippages have stayed high as
the bank continue to recognize problem assets from the watchlist at an
accelerated pace. While slippages from and outside of watchlist are likely to
remain on the higher side in FY18 as well (~4.2% of loans), with resolution of
some of the large known stress accounts nearing completion, it should lead
to meaningful contraction in watchlist (residual exposure of ~4% of loans).
■ Operating performance stabilizing. Domestic loan growth picked-up in 3Q
with retail loan growth healthy (+18%) and corporate loan growth (ex-stress
segments) in mid-teens as well. NIMs stabilized even with elevated slippages
(~3.1%) and fee income picked-up on strong retail fee income growth
(+18%). With growth being driven by retail segment and steady margins
supported by strong CASA inflows, we expect pre-provisions profit growth to
return to double-digit growth in FY18 (14% yoy).
■ Gains from subs stake sale may help offset provisioning requirements.
The bank is exploring options to sell stake in subs and non-core assets,
which could partially offset our increase in provisioning estimate for FY18. We
increase our credit cost estimate on ageing related provisions, while also
factor gains from stake sale in non-life subs, resulting in net earnings cut of
~5-6% for FY18/19E. As the legacy stress is recognized (& provided) and
with loan mix shift to retail, the stock can trade at better multiples. At 1.2x
FY19 core book, maintain OUTPERFORM.
Share price performance
The price relative chart measures performance against the
S&P BSE SENSEX IDX which closed at 28,339.31 on
14/02/17. On 14/02/17 the spot exchange rate was
Rs66.81/US$1
Performance 1M 3M 12M Absolute (%) 4.3 4.8 42.6 Relative (%) 1.1 -2.5 21.2
Financial and valuation metrics
Year 3/16A 3/17E 3/18E 3/19E Pre-provision Op profit (Rs mn) 236,043.3 270,058.8 246,960.7 263,669.1 Pre-tax profit (Rs mn) 119,365.1 123,812.4 152,850.2 187,737.8 Net attributable profit (Rs mn) 94,670.8 102,764.3 110,052.1 131,416.5 EPS (CS adj.) (Rs) 16.28 17.67 18.92 22.60 Change from previous EPS (%) n.a. 1.5 (5.5) (5.7) Consensus EPS (Rs) n.a. 17.43 19.50 23.67 EPS growth (%) (15.2) 8.5 7.1 19.4 P/E (x) 17.5 16.1 15.1 12.6 Dividend yield (%) 1.9 2.1 2.5 2.6 BVPS (CS adj.) (Rs) 149.44 161.01 172.93 188.03 P/B (x) 1.91 1.77 1.65 1.52 ROE (%) 11.3 11.4 11.3 12.5 ROA (%) 1.4 1.4 1.3 1.4 Tier 1 Ratio (%) 13.1 13.3 12.4 11.6
Source: Company data, Thomson Reuters, Credit Suisse estimates
16 February 2017
India Corporate Health Tracker 24
Asia Pacific/India Regional Banks
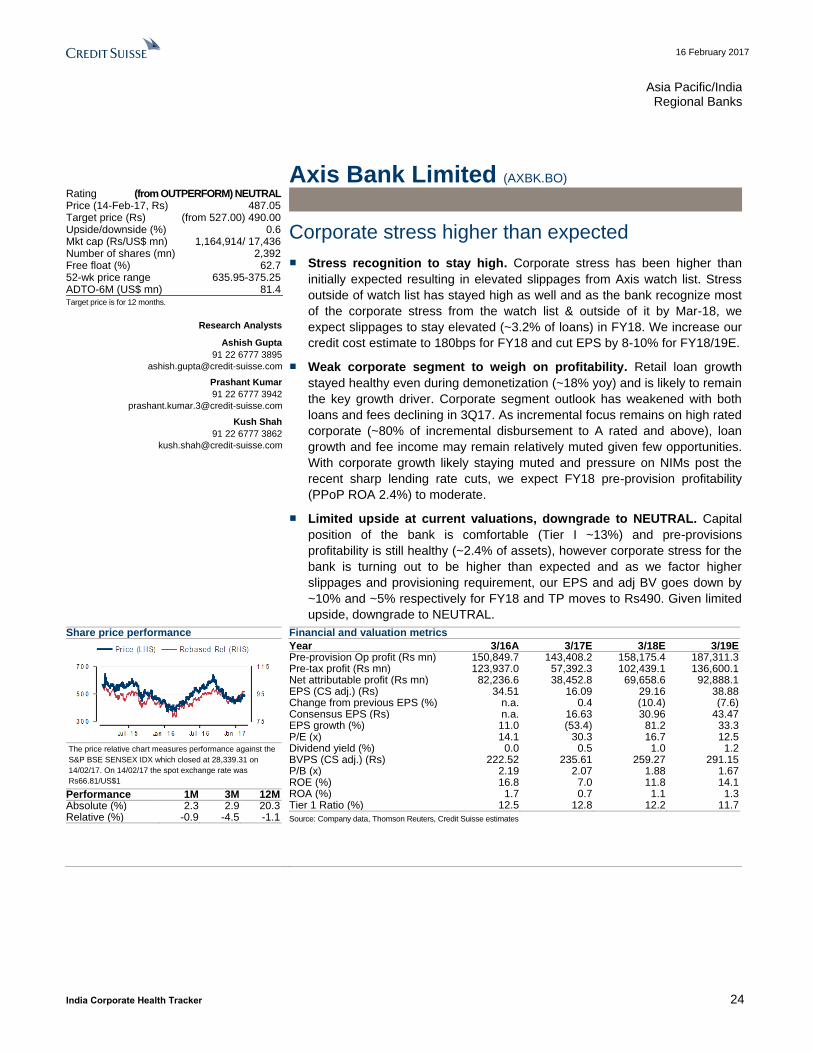
Axis Bank Limited (AXBK.BO) Rating (from OUTPERFORM) NEUTRAL Price (14-Feb-17, Rs) 487.05 Target price (Rs) (from 527.00) 490.00 Upside/downside (%) 0.6 Mkt cap (Rs/US$ mn) 1,164,914/ 17,436 Number of shares (mn) 2,392 Free float (%) 62.7 52-wk price range 635.95-375.25 ADTO-6M (US$ mn) 81.4 Target price is for 12 months.
Research Analysts
Ashish Gupta
91 22 6777 3895
Prashant Kumar
91 22 6777 3942
Kush Shah
91 22 6777 3862
Corporate stress higher than expected
■ Stress recognition to stay high. Corporate stress has been higher than
initially expected resulting in elevated slippages from Axis watch list. Stress
outside of watch list has stayed high as well and as the bank recognize most
of the corporate stress from the watch list & outside of it by Mar-18, we
expect slippages to stay elevated (~3.2% of loans) in FY18. We increase our
credit cost estimate to 180bps for FY18 and cut EPS by 8-10% for FY18/19E.
■ Weak corporate segment to weigh on profitability. Retail loan growth
stayed healthy even during demonetization (~18% yoy) and is likely to remain
the key growth driver. Corporate segment outlook has weakened with both
loans and fees declining in 3Q17. As incremental focus remains on high rated
corporate (~80% of incremental disbursement to A rated and above), loan
growth and fee income may remain relatively muted given few opportunities.
With corporate growth likely staying muted and pressure on NIMs post the
recent sharp lending rate cuts, we expect FY18 pre-provision profitability
(PPoP ROA 2.4%) to moderate.
■ Limited upside at current valuations, downgrade to NEUTRAL. Capital
position of the bank is comfortable (Tier I ~13%) and pre-provisions
profitability is still healthy (~2.4% of assets), however corporate stress for the
bank is turning out to be higher than expected and as we factor higher
slippages and provisioning requirement, our EPS and adj BV goes down by
~10% and ~5% respectively for FY18 and TP moves to Rs490. Given limited
upside, downgrade to NEUTRAL.
Share price performance
The price relative chart measures performance against the
S&P BSE SENSEX IDX which closed at 28,339.31 on
14/02/17. On 14/02/17 the spot exchange rate was
Rs66.81/US$1
Performance 1M 3M 12M Absolute (%) 2.3 2.9 20.3 Relative (%) -0.9 -4.5 -1.1
Financial and valuation metrics
Year 3/16A 3/17E 3/18E 3/19E Pre-provision Op profit (Rs mn) 150,849.7 143,408.2 158,175.4 187,311.3 Pre-tax profit (Rs mn) 123,937.0 57,392.3 102,439.1 136,600.1 Net attributable profit (Rs mn) 82,236.6 38,452.8 69,658.6 92,888.1 EPS (CS adj.) (Rs) 34.51 16.09 29.16 38.88 Change from previous EPS (%) n.a. 0.4 (10.4) (7.6) Consensus EPS (Rs) n.a. 16.63 30.96 43.47 EPS growth (%) 11.0 (53.4) 81.2 33.3 P/E (x) 14.1 30.3 16.7 12.5 Dividend yield (%) 0.0 0.5 1.0 1.2 BVPS (CS adj.) (Rs) 222.52 235.61 259.27 291.15 P/B (x) 2.19 2.07 1.88 1.67 ROE (%) 16.8 7.0 11.8 14.1 ROA (%) 1.7 0.7 1.1 1.3 Tier 1 Ratio (%) 12.5 12.8 12.2 11.7
Source: Company data, Thomson Reuters, Credit Suisse estimates

16 February 2017
India Corporate Health Tracker 25
Asia Pacific/India Regional Banks
State Bank Of India (SBI.BO / SBIN IN) Rating NEUTRAL Price (14-Feb-17, Rs) 270.50 Target price (Rs) 247.00 Upside/downside (%) -8.7 Mkt cap (Rs/US$ mn) 2,156,833/ 32,283 Number of shares (mn) 7,974 Free float (%) 40.6 52-wk price range 281.60-151.90 ADTO-6M (US$ mn) 68.6 Target price is for 12 months.
Research Analysts
Ashish Gupta
91 22 6777 3895
Prashant Kumar
91 22 6777 3942
Kush Shah
91 22 6777 3862
Core profitability outlook remains muted
■ Muted growth, NIM pressure to weigh on pre-provisions profitability.
Loan growth for the bank is likely to remain muted (6% for FY17 & ~11% in
FY18), as corporate loan growth remains weak even as retail growth picks up
(~18%). CASA inflows were strong during 3Q (CASA ratio at ~46.6%),
however given sharp lending rate cuts (MCLR cut of 90bps in jan'17), NIM is
likely to moderate 10-15bps in FY18. Strong treasury gains have been
supporting overall profitability, however as the bank step up pension
provisioning post actuarial valuations in 4Q, pre-prov profitability could come
under further pressure (~1.5% in FY18).
■ Provisioning requirement to stay high. NPL slippages were high (~3.0%)
in 3Q17 even as the bank deferred recognition for small ticket accounts
(~Rs20 bn) under RBI dispensation. Addition to SDR and S4A account were
high (~Rs70 bn during the quarter) and total SDR+S4A now at at ~1.1% of
loans. Consolidated NPLs for the bank stabilized after a period of sharp rise
at ~8.6%. Given continued pressure on corporate segment and total stressed
watchlist (Restrd+SDR/S4A+watchist) at ~4% of loans, NPL slippages are
unlikely to moderate quickly. Further the bank would need to step up ageing
related provisions and we expect total credit cost to remain high at ~150bps.
■ Recovery in profitability to be gradual. Merger related disruptions with
associate banks may take few quarters to stabilize and may impact FY18
profitability. With pre-prov profitability (PPoP ROA at just ~1.5%) under
pressure, even after building in a moderation in credit cost, ROAs remain at
55 bp & ROEs at ~9% (though more equity dilution likely in FY18). We
increase our credit cost estimate (to ~1.5%) as we factor higher ageing
related provisions. We also factor potential gains from stake sale in general
insurance sub resulting in net EPS cut of 3-6% for FY18/19. At 1.3x FY18 adj
book, maintain NEUTRAL.
Share price performance
The price relative chart measures performance against the
S&P BSE SENSEX IDX which closed at 28,339.31 on
14/02/17. On 14/02/17 the spot exchange rate was
Rs66.81/US$1
Performance 1M 3M 12M Absolute (%) 5.0 -3.2 71.8 Relative (%) 1.9 -10.6 50.4
Financial and valuation metrics
Year 3/16A 3/17E 3/18E 3/19E Pre-provision Op profit (Rs mn) 377,648.6 371,308.0 383,439.0 458,314.3 Pre-tax profit (Rs mn) 139,257.3 149,893.4 217,437.6 284,166.2 Net attributable profit (Rs mn) 101,023.3 106,424.3 147,857.6 191,812.2 EPS (CS adj.) (Rs) 13.27 13.71 18.71 23.86 Change from previous EPS (%) n.a. 0.0 (6.4) (3.2) Consensus EPS (Rs) n.a. 14.58 20.17 26.40 EPS growth (%) (24.4) 3.3 36.5 27.5 P/E (x) 20.4 19.7 14.5 11.3 Dividend yield (%) 1.0 1.2 1.7 1.9 BVPS (CS adj.) (Rs) 185.85 195.94 211.78 229.79 P/B (x) 1.46 1.38 1.28 1.18 ROE (%) 7.4 7.2 9.2 10.8 ROA (%) 0.5 0.4 0.6 0.7 Tier 1 Ratio (%) 9.9 10.6 11.0 10.5
Source: Company data, Thomson Reuters, Credit Suisse estimates

16 February 2017
India Corporate Health Tracker 26
Asia Pacific/India Regional Banks
Punjab National Bank Ltd (PNBK.BO) Rating UNDERPERFORM [V] Price (14-Feb-17, Rs) 144.10 Target price (Rs) 94.00 Upside/downside (%) -34.8 Mkt cap (Rs/US$ mn) 306,640/ 4,590 Number of shares (mn) 2,128 Free float (%) 37.2 52-wk price range 159.35-71.30 ADTO-6M (US$ mn) 26.6 Target price is for 12 months.
[V] = Stock Considered Volatile (see Disclosure Appendix)
Research Analysts
Ashish Gupta
91 22 6777 3895
Prashant Kumar
91 22 6777 3942
Kush Shah
91 22 6777 3862
Under-provisioning remains large
■ Operating performance remains weak. Operating performance has
remained weak in 3Q, as top line growth was muted, with loan book
contracting (-ve 2% yoy) and NII declining 9% yoy. PPoP to assets continues
to fall, at 1.5% in 3Q vs 1.7% yoy. NPL slippages remained elevated, with net
slippage at 1.85% in 3Q vs 1.55%, even as the management used RBI
dispensation to defer recognition of Rs12-15bn of retail small ticket loans.
With total stress watchlist (restructured +SDR/S4A+ SMA2) staying high at
~9% of loans, NPL slippages would stay elevated.
■ Under-provisioning remains high. Despite 8% dilution earlier this year,
CET-1 remains weak at 8.5% and problem asset cover is weak at < 30% on
its stressed book and pre-provision profit has weakened (PPoP RoA 1.6%).
Even assuming credit costs revert to FY09-11 levels of 75 bp, RoAs would
remain muted, at 0.8% and ROEs. Increase our credit cost estimate and cut
EPS by 5-8% for FY18/19. Maintain UNDERPERFORM.
Share price performance
The price relative chart measures performance against the
S&P BSE SENSEX IDX which closed at 28,339.31 on
14/02/17. On 14/02/17 the spot exchange rate was
Rs66.81/US$1
Performance 1M 3M 12M Absolute (%) 8.9 -5.3 92.8 Relative (%) 5.7 -12.7 71.4
Financial and valuation metrics
Year 3/16A 3/17E 3/18E 3/19E Pre-provision Op profit (Rs mn) 122,163.5 137,286.6 124,097.4 125,454.0 Pre-tax profit (Rs mn) (57,378.8) 26,945.1 42,413.2 57,109.8 Net attributable profit (Rs mn) (39,743.9) 18,592.1 29,265.1 39,405.7 EPS (CS adj.) (Rs) (20.24) 8.83 13.91 18.73 Change from previous EPS (%) n.a. (2.0) (8.0) (4.5) Consensus EPS (Rs) n.a. 8.10 13.89 18.28 EPS growth (%) 57.4 34.7 P/E (x) (7.1) 16.3 10.4 7.7 Dividend yield (%) 0.0 1.3 1.6 2.0 BVPS (CS adj.) (Rs) 180.61 185.29 196.63 212.19 P/B (x) 0.80 0.78 0.73 0.68 ROE (%) (10.9) 5.0 7.3 9.2 ROA (%) (0.6) 0.3 0.4 0.5 Tier 1 Ratio (%) 8.4 8.6 9.0 8.9
Source: Company data, Thomson Reuters, Credit Suisse estimates

16 February 2017
India Corporate Health Tracker 27
Asia Pacific/India Regional Banks
Bank of India (BOI.BO / BOI IN) Rating UNDERPERFORM Price (14-Feb-17, Rs) 128.75 Target price (Rs) 92.00 Upside/downside (%) -28.5 Mkt cap (Rs/US$ mn) 135,792/ 2,033 Number of shares (mn) 1,055 Free float (%) 25.0 52-wk price range 136.75-80.35 ADTO-6M (US$ mn) 8.3 Target price is for 12 months.
Research Analysts
Ashish Gupta
91 22 6777 3895
Prashant Kumar
91 22 6777 3942
Kush Shah
91 22 6777 3862
Capital position remains weak despite infusion
■ Weak core performance. The bank's core profitability remains one of the
weakest among banks (PPoP ROA Of ~95bps) given low margins (~2.2%)
and high opex ratio (~58%). Loan book continue to contract (-5% yoy) as the
bank goes through a period of consolidation and recovery in growth is likely
to be gradual. Given weak core profitability and high level of under-
provisioning, the bank would need significant external capital support for
profitability to recover.
■ Asset quality remains a concern. Even post the capital infusion of ~Rs26.4
bn since March 2016, the bank's CET-1 declined to ~7.7% despite negative
loan growth as the bank continues to report losses. Even with the
improvement in 3Q, PPoP ROA remained at 95 bp and is one of the lowest
among PSU banks. Further, given large under-provisioning (~180% of NW)
and low CET-1 (~7.7%), frequent dilutions are likely. Maintain Underperform.
Cut FY18/19 EPS further by 5-8% as increase credit cost estimate.
Share price performance
The price relative chart measures performance against the
S&P BSE SENSEX IDX which closed at 28,339.31 on
14/02/17. On 14/02/17 the spot exchange rate was
Rs66.81/US$1
Performance 1M 3M 12M Absolute (%) 6.9 3.1 44.2 Relative (%) 3.7 -4.3 22.8
Financial and valuation metrics
Year 3/16A 3/17E 3/18E 3/19E Pre-provision Op profit (Rs mn) 54,067.5 56,367.7 68,095.8 79,917.7 Pre-tax profit (Rs mn) (76,526.6) (8,481.6) 14,864.9 25,125.5 Net attributable profit (Rs mn) (59,511.0) (6,021.9) 10,702.7 17,964.8 EPS (CS adj.) (Rs) (80.26) (6.87) 11.45 19.22 Change from previous EPS (%) n.a. - (8.2) (5.2) Consensus EPS (Rs) n.a. (3.93) 10.33 16.63 EPS growth (%) 67.9 P/E (x) (1.6) (18.7) 11.2 6.7 Dividend yield (%) 0.0 0.0 2.0 2.7 BVPS (CS adj.) (Rs) 321.92 288.97 297.42 312.64 P/B (x) 0.40 0.45 0.43 0.41 ROE (%) (22.0) (2.3) 3.9 6.3 ROA (%) (1.0) (0.1) 0.2 0.3 Tier 1 Ratio (%) 9.4 9.3 8.8 8.3
Source: Company data, Thomson Reuters, Credit Suisse estimates

16 February 2017
India Corporate Health Tracker 28
Companies Mentioned (Price as of 15-Feb-2017) 3i Infotech (TIIN.NS, Rs5.25) ABG Shipyard (ABGS.BO, Rs26.85) ARSS (ARSS.BO, Rs62.8) Adani Enterprises Ltd. (ADEL.BO, Rs92.3) Adani Ports & SEZ (APSE.BO, Rs300.5) Adani Power Ltd (ADAN.BO, Rs34.7) Adhunik Metaliks (ADME.BO, Rs7.34) Allahabad Bank (ALBK.BO, Rs70.35) Alok Indus (ALOK.BO, Rs3.32) Amtek Auto (AMTK.BO, Rs34.45) Andhra Bank (ADBK.BO, Rs53.55) ArcelorMitta (ISPA.AS, €8.75) Arshiya (ARSH.BO, Rs47.65) Axis Bank Limited (AXBK.BO, Rs487.95, OUTPERFORM, TP Rs527.0) BGR Energy (BGRE.BO, Rs137.75) Bajaj Finance Ltd (BJFN.BO, Rs1040.05) Bajaj Hindusthan Limited (BJHN.BO, Rs14.44) Ballarpur Indu (BILT.BO, Rs16.0) Bank of Baroda (BOB.BO, Rs163.2) Bank of India (BOI.BO, Rs123.55, UNDERPERFORM, TP Rs92.0) Bharat Financial Inclusion Ltd. (BHAF.BO, Rs819.65) Bharati Defence (BHAR.BO, Rs15.35) Bhushan Steel (BSSL.NS, Rs52.45) Bhushan Steel (BSSL.BO, Rs52.85) Bk Maharashtra (BMBK.BO, Rs32.65) Bombay Rayon (BRFL.BO, Rs155.6) C & C Constr (CCCL.BO, Rs21.65) Cairn India Ltd (CAIL.BO, Rs274.55) Canara Bank (CNBK.BO, Rs292.5) Central Bank IN (CBI.BO, Rs85.75) Century Textiles (CNTY.BO, Rs890.0) Chennai Petro (CHPC.BO, Rs357.8) Cholamandalam Finance (CHLA.BO, Rs991.75) Corporation Bank (CRBK.BO, Rs46.65) Cox & Kings (COKI.BO, Rs192.6) Dena Bank (DENA.BO, Rs37.25) Diamond Power (DIAC.BO, Rs39.55) EID Parry (EIDP.BO, Rs282.15) Educomp Solutions Ltd (EDSO.BO, Rs11.03) Electrosteel (ELST.BO, Rs27.7) Electrosteel Stl (ELES.NS, Rs4.6) Electrotherm (ELTH.BO, Rs186.0) Entegra (ENTI.NS, Rs2.8) Era Infra (ERCI.BO, Rs1.43) Essar Shipping (ESPL.BO, Rs26.65) GAIL (India) Ltd (GAIL.BO, Rs494.3) GIPL (GAIN.BO, Rs3.65) GIPL (GAIN.NS, Rs3.65) GMR Infrastructure Ltd (GMRI.BO, Rs13.76) GOL Offshore (GOFS.BO, Rs21.25) GTL (GTL.BO, Rs16.3) GTL Infrastructr (GTLI.BO, Rs4.1) GVK Power & Infrastructure (GVKP.BO, Rs6.87) Gammon India Ltd (GAMM.BO, Rs12.19) Gerdau (GGBR4.SA, R$13.36) Gitanjali Gems (GTGM.BO, Rs66.3) Gujarat NRE Coke (GJNC.BO, Rs2.83) HDFC Bank (HDBK.BO, Rs1322.45) HTTL (HATT.BO, Rs4.92) Hindustan Constr (HCNS.BO, Rs38.75) Hindustan Zinc Limited (HZNC.BO, Rs293.15) Hotel Leela (HTLE.BO, Rs16.55) Housing Development Finance Corp (HDFC.BO, Rs1398.2) ICICI Bank (ICBK.BO, Rs280.65, OUTPERFORM, TP Rs316.0) IDBI Bank (IDBI.BO, Rs81.0) IDFC Bank (IDFB.BO, Rs61.65) IDFC Ltd (IDFC.BO, Rs52.45) ITNL (ILFT.BO, Rs102.45) IVRCL Ltd (IVRC.BO, Rs5.34) Idea Cellular Ltd (IDEA.BO, Rs107.15) Indiabulls Housing Finance Ltd (INBF.BO, Rs813.4) Indiabulls Real Estate Limited (INRL.BO, Rs75.4) Indian Bank (INBA.BO, Rs279.1) Indian Hotel (IHTL.BO, Rs118.8) Indian Overseas Bank (IOBK.BO, Rs25.6) IndusInd Bank (INBK.BO, Rs1315.55) JBF Industries (JBFI.BO, Rs240.0) JSW Energy (JSWE.BO, Rs60.0) JSW Steel Ltd (JSTL.BO, Rs183.55) Jai Balaji (JAIB.BO, Rs13.5) Jain Irrigation (JAIR.BO, Rs94.6) Jaiprakash Associates Ltd. (JAIA.BO, Rs12.08) Jaiprakash Power Ventures Ltd (JAPR.BO, Rs5.0) Jammu and Kashmir Bank (JKBK.BO, Rs68.45) Jayaswal Neco (JAYN.BO, Rs8.39) Jaypee Infra (JYPE.BO, Rs8.82)

16 February 2017
India Corporate Health Tracker 29
Jet Airways (JET.BO, Rs356.45) Jindal Photo (JINP.BO, Rs79.65) Jindal SAW (JIND.NS, Rs65.5) Jindal Stainless (JIST.BO, Rs48.9) Jindal Steel (JNSP.NS, Rs89.75) Jindal Steel & Power Ltd (JNSP.BO, Rs89.75) Jubilant Life Sciences Limited (JULS.BO, Rs660.1) Jyoti Structures (JYTS.BO, Rs9.09) K S Oils (KSOI.BO, Rs0.51) KSK Energy Ventures Ltd (KSKE.BO, Rs15.7) KSL and Indus (KSLR.BO, Rs18.0) Kalyani Steels (KLSL.BO, Rs346.15) Kesoram Inds (KSRM.BO, Rs135.75) Kotak Mahindra Bank Ltd (KTKM.BO, Rs784.45) L&T Finance Holdings Limited (LTFH.BO, Rs110.0) LIC Housing Finance Ltd (LICH.BO, Rs549.6) Lanco Infratech Ltd. (LAIN.BO, Rs3.75) MRPL (MRPL.BO, Rs102.05) MSP Steel (MSPO.BO, Rs13.63) MTNL (MTNL.BO, Rs21.8) Madhucon Pro (MAPR.BO, Rs45.05) Magma Fincorp Ltd (MAGM.NS, Rs98.0) Mahindra and Mahindra Financial Services Ltd (MMFS.BO, Rs287.35) Malayan Banking (MBBM.KL, RM8.37) Marg (MARG.BO, Rs9.66) Mercat (MRCT.BO, Rs45.15) Monnet Ispat (MNET.BO, Rs35.7) Moser Baer India (MOSR.BO, Rs6.91) NCC Ltd (NCCL.BO, Rs80.55) NHPC (NHPC.BO, Rs30.6) Natl Fertilizers (NAFT.BO, Rs67.55) Nitco (NCOT.BO, Rs59.05) Nucor Corporation (NUE.N, $63.87) Orchid Pharma (ORCD.BO, Rs27.2) Orient Bank Comm (ORBC.BO, Rs119.95) PSL (PSLH.BO, Rs5.65) Patel Eng (PENG.BO, Rs78.55) Plethico Pharma (PLPH.BO, Rs7.94) Prakash Inds (PRKI.BO, Rs74.8) Punj Lloyd Ltd (PUJL.BO, Rs20.0) Punjab National Bank Ltd (PNBK.BO, Rs139.8, UNDERPERFORM[V], TP Rs94.0) Punjab Sind (PUNA.BO, Rs51.4) REI Agro (REAG.BO, Rs0.48) Ramky Infra (RAMK.BO, Rs80.6) RattanIndia (RTNI.NS, Rs3.3) Reliance Capital Ltd (RLCP.BO, Rs472.7) Reliance Communication Ltd (RLCM.BO, Rs32.7) Reliance Infrast (RLIN.BO, Rs541.55) Reliance Power Ltd (RPOL.BO, Rs43.0) Rohit Ferro (ROHT.NS, Rs7.0) Rosneft (ROSN.MM, Rbl360.0) Ruchi Soya (RCSY.BO, Rs26.35) SURANA IND (SRIN.BO, Rs3.02) SVOGL Oil (SVOG.BO, Rs2.95) Sakthi Sugars (SKSG.NS, Rs35.2) Sarda Ener (SAEM.BO, Rs240.9) Shree Renuka Sugars Limited (SRES.BO, Rs15.05) Shriram City Union Finance Ltd (SHCU.BO, Rs1894.3) Shriram EPC (SHRI.BO, Rs27.9) Shriram Transport Finance Co Ltd (SRTR.BO, Rs934.15) State Bank Of India (SBI.BO, Rs268.65, NEUTRAL, TP Rs247.0) Steel Authority of India Ltd (SAIL.BO, Rs59.0) Sterling Bio (STBI.NS, Rs4.45) Sterlite Tech (STTE.BO, Rs126.2) Sunflag Iron (SFLG.NS, Rs34.8) Suzlon Energy Ltd (SUZL.BO, Rs16.65) Syndicate Bnk (SBNK.BO, Rs67.75) TI (TILK.BO, Rs14.55) Tantia (TANC.BO, Rs21.05) Tata Communications Ltd (TATA.BO, Rs729.3) Tata Motors Ltd. (TAMO.BO, Rs436.55) Tata Power Company Ltd (TTPW.BO, Rs81.65) Tata Steel Ltd (TISC.BO, Rs460.1) Tata Teleservice (TTML.BO, Rs6.04) UCO (UCBK.BO, Rs36.0) Union Bank of India (UNBK.BO, Rs141.7) Unitech Ltd (UNTE.BO, Rs5.79) United Bank of India (UBOI.BO, Rs24.35) United Brew (UBBW.BO, Rs783.5) United Spirits Ltd. (UNSP.BO, Rs2313.35) United States Steel Corp. (X.N, $39.42) Unity Infra (UTIL.BO, Rs8.49) Usha Martin (USBL.BO, Rs17.7) Usher Agro (USAG.BO, Rs11.22) Uttam Galva (UTTM.BO, Rs30.65) Vedanta Limited (VDAN.BO, Rs247.6) Vedanta Resources PLC (VED.L, 1100.0p) Videocon (VEDI.BO, Rs103.6)

16 February 2017
India Corporate Health Tracker 30
Vijaya Bank (VJBK.BO, Rs63.95) Visa Steel (VISA.BO, Rs20.1) Winsome Diamonds (WINO.BO, Rs0.44) Yes Bank Ltd (YESB.BO, Rs1431.45) Zuari Agro (ZUAR.NS, Rs316.35) shipping corp (SCI.BO, Rs63.0)
Disclosure Appendix
Analyst Certification I, Ashish Gupta, certify that (1) the views expressed in this report accurately reflect my personal views about all of the subject companies and securities and (2) no part of my compensation was, is or will be directly or indirectly related to the specific recommendations or views expressed in this report.
3-Year Price and Rating History for Axis Bank Limited (AXBK.BO)
AXBK.BO Closing Price Target Price
Date (Rs) (Rs) Rating
28-Apr-14 306.00 360.00 O
19-May-14 370.97 432.00
11-Jun-14 388.26 472.00
18-Nov-14 473.95 567.00
13-Jan-15 502.80 593.00
27-Jan-15 592.30 680.00
21-Apr-15 523.65 614.00
30-Apr-15 567.85 654.00
27-Oct-15 521.30 626.00
20-Jan-16 388.65 478.00
21-Apr-16 467.60 528.00
29-Jun-16 517.35 592.00
22-Sep-16 591.95 685.00
04-Oct-16 546.80 625.00
25-Oct-16 529.05 550.00
03-Jan-17 455.20 527.00
* Asterisk signifies initiation or assumption of coverage.
O U T PERFO RM
3-Year Price and Rating History for Bank of India (BOI.BO)
BOI.BO Closing Price Target Price
Date (Rs) (Rs) Rating
15-May-14 263.55 175.00 U
19-May-14 299.10 210.00
18-Nov-14 288.95 228.00
08-Jan-15 295.65 235.00
12-Feb-15 227.65 178.00
28-May-15 191.40 154.00
28-Jul-15 154.50 130.00
09-Nov-15 133.45 113.00
12-Feb-16 84.75 70.00
24-May-16 80.35 62.00
15-Aug-16 114.00 75.00
22-Sep-16 119.55 80.00
09-Feb-17 136.75 92.00
* Asterisk signifies initiation or assumption of coverage.
UN D ERPERFO RM

16 February 2017
India Corporate Health Tracker 31
3-Year Price and Rating History for ICICI Bank (ICBK.BO)
ICBK.BO Closing Price Target Price
Date (Rs) (Rs) Rating
28-Apr-14 254.77 236.00 N
19-May-14 294.22 285.00
30-Oct-14 322.30 314.80
18-Nov-14 336.20 342.40
13-Jan-15 341.00 363.00
21-Apr-15 310.85 306.00
29-Jan-16 230.10 258.00
21-Apr-16 253.05 295.00 O
29-Jun-16 236.50 308.00
07-Sep-16 278.15 316.00
22-Sep-16 275.55 328.00
03-Jan-17 254.30 316.00
* Asterisk signifies initiation or assumption of coverage.
N EU T RA L
O U T PERFO RM
3-Year Price and Rating History for Punjab National Bank Ltd (PNBK.BO)
PNBK.BO Closing Price Target Price
Date (Rs) (Rs) Rating
14-May-14 167.14 144.00 N
19-May-14 202.75 159.80
18-Nov-14 196.79 170.80
08-Jan-15 206.70 192.00
03-Feb-15 176.75 150.00 U
21-Apr-15 160.95 142.00
08-May-15 145.65 110.00
09-Feb-16 87.85 75.00
18-May-16 76.20 62.00
28-Jul-16 129.00 78.00
22-Sep-16 141.05 86.00
07-Nov-16 140.25 102.00
03-Jan-17 118.20 94.00
* Asterisk signifies initiation or assumption of coverage.
N EU T RA L
U N D ERPERFO RM
3-Year Price and Rating History for State Bank Of India (SBI.BO)
SBI.BO Closing Price Target Price
Date (Rs) (Rs) Rating
17-Feb-14 147.34 137.40 N
19-May-14 257.00 204.90
26-May-14 269.98 240.50
18-Nov-14 293.96 263.00
08-Jan-15 304.70 294.00
21-Apr-15 289.05 263.00
25-May-15 277.70 247.00
11-Feb-16 154.20 162.00
29-May-16 195.55 185.00
15-Aug-16 243.20 227.00
22-Sep-16 257.35 247.00
* Asterisk signifies initiation or assumption of coverage.
N EU T RA L
The analyst(s) responsible for preparing this research report received Compensation that is based upon various factors including Credit Suisse's total revenues, a portion of which are generated by Credit Suisse's investment banking activities
As of December 10, 2012 Analysts’ stock rating are defined as follows: Outperform (O) : The stock’s total return is expected to outperform the relevant benchmark* over the next 12 months. Neutral (N) : The stock’s total return is expected to be in line with the relevant benchmark* over the next 12 months. Underperform (U) : The stock’s total return is expected to underperform the relevant benchmark* over the next 12 months.

16 February 2017
India Corporate Health Tracker 32
*Relevant benchmark by region: As of 10th December 2012, Japanese ratings are based on a stock’s total return relative to the analyst's coverage universe which consists of all companies covered by the analyst within the relevant sector, with Outperforms representing the most attractive, Neutrals the less attractive, and Underperforms the least attractive investment opportunities. As of 2nd October 2012, U.S. and Canadian as well as European ra tings are based on a stock’s total return relative to the analyst's coverage universe which consists of all companies covered by the analyst within the relevant sector, with Outperforms representing the most attractive, Neutrals the less attractive, and Underperforms the least attractive investment opportunities. For Latin Ame rican and non-Japan Asia stocks, ratings are based on a stock’s total return relative to the average total return of the relevant country or regional benchmark; prior to 2nd October 2012 U.S. and Canadian ratings were based on (1) a stock’s absolute total return potent ial to its current share price and (2) the relative attractiveness of a stock’s total return potential within an analyst’s coverage universe. For Australian and New Zealand stocks, the expected total return (ETR) calculation includes 1 2-month rolling dividend yield. An Outperform rating is assigned where an ETR is greater than or equal to 7.5%; Underperform where an ETR less than or equal to 5%. A Neutral may be assigned where the ETR is between -5% and 15%. The overlapping rating range allows analysts to assign a rating that puts ETR in the context of associated risks. Prior to 18 May 2015, ETR ranges for Outperform and Underperform ratings did not overlap with Neutral thresholds between 15% and 7.5%, wh ich was in operation from 7 July 2011. Restricted (R) : In certain circumstances, Credit Suisse policy and/or applicable law and regulations preclude certain types of communications, including an investment recommendation, during the course of Credit Suisse's engagement in an investment banking transaction and in certain other circumstances. Not Rated (NR) : Credit Suisse Equity Research does not have an investment rating or view on the stock or any other securities related to the company at this time. Not Covered (NC) : Credit Suisse Equity Research does not provide ongoing coverage of the company or offer an investment rating or investment view on the equity security of the company or related products.
Volatility Indicator [V] : A stock is defined as volatile if the stock price has moved up or down by 20% or more in a month in at least 8 of the past 24 months or the analyst expects significant volatility going forward.
Analysts’ sector weightings are distinct from analysts’ stock ratings and are based on the analyst’s expectations for the fundamentals and/or valuation of the sector* relative to the group’s historic fundamentals and/or valuation: Overweight : The analyst’s expectation for the sector’s fundamentals and/or valuation is favorable over the next 12 months. Market Weight : The analyst’s expectation for the sector’s fundamentals and/or valuation is neutral over the next 12 months. Underweight : The analyst’s expectation for the sector’s fundamentals and/or valuation is cautious over the next 12 months. *An analyst’s coverage sector consists of all companies covered by the analyst within the relevant sector. An analyst may cover multiple sectors.
Credit Suisse's distribution of stock ratings (and banking clients) is:
Global Ratings Distribution
Rating Versus universe (%) Of which banking clients (%) Outperform/Buy* 45% (64% banking clients) Neutral/Hold* 38% (60% banking clients) Underperform/Sell* 14% (52% banking clients) Restricted 2% *For purposes of the NYSE and NASD ratings distribution disclosure requirements, our stock ratings of Outperform, Neutral, and Underperform most closely correspond to Buy, Hold, and Sell, respectively; however, the meanings are not the same, as our stock ratings are determined on a relative basis. (Please refer to definitions above.) An investor's decision to buy or sell a security should be based on investment objectives, current holdings, and other individual factors.
Important Global Disclosures Credit Suisse’s research reports are made available to clients through our proprietary research portal on CS PLUS. Credit Suisse research products may also be made available through third-party vendors or alternate electronic means as a convenience. Certain research products are only made available through CS PLUS. The services provided by Credit Suisse’s analysts to clients may depend on a specific client’s preferences regarding the frequency and manner of receiving communications, the client’s risk profile and investment, the size and scope of the overall client relationship with the Firm, as well as legal and regulatory constraints. To access all of Credit Suisse’s research that you are entitled to receive in the most timely manner, please contact your sales representative or go to https://plus.credit-suisse.com . Credit Suisse’s policy is to update research reports as it deems appropriate, based on developments with the subject company, the sector or the market that may have a material impact on the research views or opinions stated herein. Credit Suisse's policy is only to publish investment research that is impartial, independent, clear, fair and not misleading. For more detail please refer to Credit Suisse's Policies for Managing Conflicts of Interest in connection with Investment Research: https://www.credit-suisse.com/sites/disclaimers-ib/en/managing-conflicts.html . Credit Suisse does not provide any tax advice. Any statement herein regarding any US federal tax is not intended or written to be used, and cannot be used, by any taxpayer for the purposes of avoiding any penalties.
Target Price and Rating Valuation Methodology and Risks: (12 months) for Axis Bank Limited (AXBK.BO)
Method: Our target price of Rs527 is based on 2x Sep-18 book value, at a 10%discount to historical average (10-year) trading multiple. Our OUTPERFORM rating is driven by: (1) strong traction in retail business with change in mix towards retail and (2) healthy pre-provisions profitability allowing the bank to create NPL provisions without impacting profitability.
Risk: Key risks to our Rs527 target price and OUTPERFORM rating for Axis Bank include: (1) a significant slowdown in lending in a high interest rate environment; (2) a substantial deterioration in the asset quality environment; (3) a significant increase in competition; and (4) a sharp rise in wholesale deposit rates.
Target Price and Rating Valuation Methodology and Risks: (12 months) for Bank of India (BOI.BO)

16 February 2017
India Corporate Health Tracker 33
Method: We are valuing Bank of India at 0.5x FY18E adjusted book value (based on historical multiple) to arrive at our target price of Rs92. Our Underperform rating is driven by (1) Continued asset quality stress, (2) weak loan growth and operating profitability and (3) high under provisioning for recognised stress loans.
Risk: Key upside risks to our target price of Rs92 and Underperform rating for Bank of India are (1) a significant pick-up in economic growth; (2) a sharp slow down in its slippages and sustained pickup in recoveries; and (3) higher-than-expected margins.
Target Price and Rating Valuation Methodology and Risks: (12 months) for ICICI Bank (ICBK.BO)
Method: We value ICICI Bank based on sum-of-the-parts to arrive at our target price of Rs316. We value the core bank at 1.7x FY18E adj book value at a 20% discount to the historical average multiple on rising asset quality concerns. Our OUTPERFORM rating is driven by: (1) accelerated NPL recognition leading to de-risking and (2) better pre-provision profitability and capital buffer against problem loans.
Risk: Key risks to our Rs316 target price and OUTPERFORM rating for ICICI Bank are: (1) significant slowdown in corporate loan demand, (2) substantial deterioration in the asset quality environment, and (3) deterioration in the retail asset quality cycle.
Target Price and Rating Valuation Methodology and Risks: (12 months) for Punjab National Bank Ltd (PNBK.BO)
Method: We are valuing Punjab National Bank at 0.8x FY18 adjusted book value (25% discount to historical avg) to arrive at our target price of Rs94. Our Underperform rating is driven by 1) Continued asset quality stress, 2) weak loan growth and 3) high under provisioning for recognised stress loans.
Risk: Key upside risk to our target price of Rs94 and Underperform rating for PNB is sharp improvement in economic outlook resulting in improvement in corporate asset quality and pick-up in corporate loan demand.
Target Price and Rating Valuation Methodology and Risks: (12 months) for State Bank Of India (SBI.BO)
Method: Our target price for State Bank of India of Rs247 is based on sum-of-the-parts, valuing the core banking book at 1x FY18 adj consolidated book, at 25% discount to its historical average multiple. Our NEUTRAL rating is driven by: (1) lower core operating profit growth comapared to peers on weaker topline momentum, and (2) rising asset quality stress from unrecognised corporate stress loans.
Risk: Key risks to our Rs247 target price and NEUTRAL rating for SBI on the downside are: (1) significant slowdown in lending in high interest rate environment, (2) substantial deterioration in asset quality environment and (3) slower international growth. Key risks to the upside are: (1) sharper-than-expected pick-up in economic growth, (2) quick recovery in corporate profitability & asset quality, and (3) sharp pick-up in corporate credit demand.
Please refer to the firm's disclosure website at https://rave.credit-suisse.com/disclosures for the definitions of abbreviations typically used in the target price method and risk sections.
See the Companies Mentioned section for full company names
The subject company (ICBK.BO, CHLA.BO, INBK.BO, INBF.BO, BJFN.BO, HDBK.BO, IDFB.BO, IOBK.BO, MMFS.BO, HDFC.BO, BHAF.BO, JSTL.BO, GGBR4.SA, UNSP.BO, CAIL.BO, MBBM.KL, ROSN.MM, APSE.BO, X.N, JSWE.BO, JNSP.BO, VED.L, GMRI.BO, NUE.N, RLCM.BO, TAMO.BO, UNBK.BO) currently is, or was during the 12-month period preceding the date of distribution of this report, a client of Credit Suisse. Credit Suisse provided investment banking services to the subject company (ICBK.BO, INBF.BO, HDBK.BO, MMFS.BO, HDFC.BO, BHAF.BO, JSTL.BO, ROSN.MM, APSE.BO, X.N, JSWE.BO, VED.L, TAMO.BO) within the past 12 months. Credit Suisse provided non-investment banking services to the subject company (IDFB.BO, MBBM.KL, X.N) within the past 12 months Credit Suisse has managed or co-managed a public offering of securities for the subject company (INBF.BO, HDFC.BO, APSE.BO, X.N) within the past 12 months. Credit Suisse has received investment banking related compensation from the subject company (ICBK.BO, INBF.BO, HDBK.BO, MMFS.BO, HDFC.BO, BHAF.BO, JSTL.BO, ROSN.MM, APSE.BO, X.N, JSWE.BO, VED.L, TAMO.BO) within the past 12 months Credit Suisse expects to receive or intends to seek investment banking related compensation from the subject company (ICBK.BO, AXBK.BO, PNBK.BO, SBI.BO, CHLA.BO, INBK.BO, INBF.BO, BJFN.BO, HDBK.BO, IDFB.BO, BOB.BO, IOBK.BO, LICH.BO, YESB.BO, MMFS.BO, HDFC.BO, SHCU.BO, BHAF.BO, JSTL.BO, GGBR4.SA, UNSP.BO, CAIL.BO, MBBM.KL, ROSN.MM, APSE.BO, X.N, JSWE.BO, JNSP.BO, VED.L, GMRI.BO, NUE.N, RLCM.BO, IDEA.BO, TAMO.BO, UNBK.BO) within the next 3 months. Credit Suisse has received compensation for products and services other than investment banking services from the subject company (IDFB.BO, MBBM.KL, X.N) within the past 12 months Credit Suisse may have interest in (MBBM.KL) Please visit https://credit-suisse.com/in/researchdisclosure for additional disclosures mandated vide Securities And Exchange Board of India (Research Analysts) Regulations, 2014 Credit Suisse may have interest in (VJBK.BO, LTFH.BO, DENA.BO, ADBK.BO, UCBK.BO, ORBC.BO, MAGM.NS, BMBK.BO, ALBK.BO, CNBK.BO, UBOI.BO, SBNK.BO, PUNA.BO, CRBK.BO, IDBI.BO, IDFC.BO, INBA.BO, CBI.BO, MOSR.BO, SCI.BO, IVRC.BO, TIIN.NS, WINO.BO, STTE.BO, SRES.BO, UTIL.BO, TANC.BO, ERCI.BO, ELTH.BO, JINP.BO, PSLH.BO, USBL.BO, RCSY.BO, VISA.BO, EIDP.BO, EDSO.BO, PRKI.BO, CHPC.BO, RPOL.BO, JAIB.BO, HATT.BO, KSKE.BO, CNTY.BO, STBI.NS, INRL.BO, UNTE.BO, ESPL.BO, KLSL.BO, SKSG.NS, MARG.BO, JAYN.BO, JNSP.NS, NAFT.BO, BRFL.BO, UBBW.BO, RLIN.BO, HCNS.BO, JET.BO, NHPC.BO, MRCT.BO, KSOI.BO, JYPE.BO, KSLR.BO, ARSS.BO, ADAN.BO, BILT.BO, ARSH.BO, GAIN.BO, AMTK.BO, BSSL.NS, GTL.BO, CCCL.BO, NCCL.BO, ALOK.BO, UTTM.BO, GAMM.BO,

16 February 2017
India Corporate Health Tracker 34
VEDI.BO, MRPL.BO, SHRI.BO, IHTL.BO, JAPR.BO, JAIA.BO, RLCP.BO, BJHN.BO, PUJL.BO, MNET.BO, PLPH.BO, MAPR.BO, JAIR.BO, JIND.NS, ELES.NS, GAIN.NS, TTML.BO, REAG.BO, PENG.BO, ORCD.BO, SFLG.NS, GJNC.BO, ELST.BO, HTLE.BO, TATA.BO, ENTI.NS, MTNL.BO, MSPO.BO, KSRM.BO, ADME.BO, LAIN.BO, GTLI.BO, GTGM.BO, GVKP.BO, SUZL.BO, JIST.BO, RAMK.BO, NCOT.BO, JULS.BO, BSSL.BO, SAEM.BO, COKI.BO, ADEL.BO, JBFI.BO, ROHT.NS, JYTS.BO, BHAR.BO, USAG.BO, GOFS.BO, SRIN.BO, BGRE.BO, TTPW.BO, DIAC.BO, SVOG.BO, ILFT.BO, TILK.BO, ZUAR.NS, RTNI.NS, ABGS.BO, ICBK.BO, AXBK.BO, PNBK.BO, SBI.BO, BOI.BO, CHLA.BO, JKBK.BO, INBK.BO, INBF.BO, BJFN.BO, HDBK.BO, IDFB.BO, BOB.BO, IOBK.BO, LICH.BO, SRTR.BO, YESB.BO, MMFS.BO, HDFC.BO, KTKM.BO, SHCU.BO, BHAF.BO, JSTL.BO, VDAN.BO, UNSP.BO, HZNC.BO, CAIL.BO, APSE.BO, JSWE.BO, SAIL.BO, JNSP.BO, GMRI.BO, TISC.BO, RLCM.BO, GAIL.BO, IDEA.BO, TAMO.BO, UNBK.BO) As of the end of the preceding month, Credit Suisse beneficially own 1% or more of a class of common equity securities of (AXBK.BO, INBF.BO, LICH.BO, YESB.BO, BHAF.BO). Credit Suisse beneficially holds >0.5% long position of the total issued share capital of the subject company (INBF.BO, JSTL.BO). Credit Suisse has a material conflict of interest with the subject company (GGBR4.SA) . The analyst Ivano Westin has a relationship with a natural person who may provide remunerated services to one or more of the companies covered in this report
For other important disclosures concerning companies featured in this report, including price charts, please visit the website at https://rave.credit-suisse.com/disclosures or call +1 (877) 291-2683. For date and time of production, dissemination and history of recommendation for the subject company(ies) featured in this report, disseminated within the past 12 months, please refer to the link: https://rave.credit-suisse.com/disclosures/view/report?i=284703&v=-41sdippzu3vis0507funpe5j5 .
Important Regional Disclosures Singapore recipients should contact Credit Suisse AG, Singapore Branch for any matters arising from this research report. The analyst(s) involved in the preparation of this report may participate in events hosted by the subject company, including site visits. Credit Suisse does not accept or permit analysts to accept payment or reimbursement for travel expenses associated with these events. Restrictions on certain Canadian securities are indicated by the following abbreviations: NVS--Non-Voting shares; RVS--Restricted Voting Shares; SVS--Subordinate Voting Shares. Individuals receiving this report from a Canadian investment dealer that is not affiliated with Credit Suisse should be advised that this report may not contain regulatory disclosures the non-affiliated Canadian investment dealer would be required to make if this were its own report. For Credit Suisse Securities (Canada), Inc.'s policies and procedures regarding the dissemination of equity research, please visit https://www.credit-suisse.com/sites/disclaimers-ib/en/canada-research-policy.html. The following disclosed European company/ies have estimates that comply with IFRS: (ROSN.MM, VED.L). An analyst involved in the preparation of this report received third party benefits in connection with this research report from the subject company (JSTL.BO) Credit Suisse has acted as lead manager or syndicate member in a public offering of securities for the subject company (INBK.BO, INBF.BO, HDBK.BO, IDFB.BO, IOBK.BO, HDFC.BO, BHAF.BO, JSTL.BO, UNSP.BO, APSE.BO, X.N, JSWE.BO, RLCM.BO, TAMO.BO, UNBK.BO) within the past 3 years. Principal is not guaranteed in the case of equities because equity prices are variable. Commission is the commission rate or the amount agreed with a customer when setting up an account or at any time after that. This research report is authored by: Credit Suisse Securities (India) Private Limited ................................................................................ Ashish Gupta ; Kush Shah ; Prashant Kumar To the extent this is a report authored in whole or in part by a non-U.S. analyst and is made available in the U.S., the following are important disclosures regarding any non-U.S. analyst contributors: The non-U.S. research analysts listed below (if any) are not registered/qualified as research analysts with FINRA. The non-U.S. research analysts listed below may not be associated persons of CSSU and therefore may not be subject to the NASD Rule 2711 and NYSE Rule 472 restrictions on communications with a subject company, public appearances and trading securities held by a research analyst account. Credit Suisse Securities (India) Private Limited ................................................................................ Ashish Gupta ; Kush Shah ; Prashant Kumar
For Credit Suisse disclosure information on other companies mentioned in this report, please visit the website at https://rave.credit-suisse.com/disclosures or call +1 (877) 291-2683.

16 February 2017
India Corporate Health Tracker 35
This report is produced by subsidiaries and affiliates of Credit Suisse operating under its Global Markets Division. For more information on our structure, please use the following link: https://www.credit-suisse.com/who-we-are This report may contain material that is not directed to, or intended for distribution to or use by, any person or entity who is a citizen or resident of or located in any locality, state, country or other jurisdiction where such distribution, publication, availability or use would be contrary to law or regulation or which would subject Credit Suisse or its affiliates ("CS") to any registration or licensing requirement within such jurisdiction. All material presented in this report, unless specifically indicated otherwise, is under copyright to CS. None of the material, nor its content, nor any copy of it, may be altered in any way, transmitted to, copied or distributed to any other party, without the prior express written permission of CS. All trademarks, service marks and logos used in this report are trademarks or service marks or registered trademarks or service marks of CS or its affiliates.The information, tools and material presented in this report are provided to you for information purposes only and are not to be used or considered as an offer or the solicitation of an offer to sell or to buy or subscribe for securities or other financial instruments. CS may not have taken any steps to ensure that the securities referred to in this report are suitable for any particular investor. CS will not treat recipients of this report as its customers by virtue of their receiving this report. The investments and services contained or referred to in this report may not be suitable for you and it is recommended that you consult an independent investment advisor if you are in doubt about such investments or investment services. Nothing in this report constitutes investment, legal, accounting or tax advice, or a representation that any investment or strategy is suitable or appropriate to your individual circumstances, or otherwise constitutes a personal recommendation to you. CS does not advise on the tax consequences of investments and you are advised to contact an independent tax adviser. Please note in particular that the bases and levels of taxation may change. Information and opinions presented in this report have been obtained or derived from sources believed by CS to be reliable, but CS makes no representation as to their accuracy or completeness. CS accepts no liability for loss arising from the use of the material presented in this report, except that this exclusion of liability does not apply to the extent that such liability arises under specific statutes or regulations applicable to CS. This report is not to be relied upon in substitution for the exercise of independent judgment. CS may have issued, and may in the future issue, other communications that are inconsistent with, and reach different conclusions from, the information presented in this report. Those communications reflect the different assumptions, views and analytical methods of the analysts who prepared them and CS is under no obligation to ensure that such other communications are brought to the attention of any recipient of this report. Some investments referred to in this report will be offered solely by a single entity and in the case of some investments solely by CS, or an associate of CS or CS may be the only market maker in such investments. Past performance should not be taken as an indication or guarantee of future performance, and no representation or warranty, express or implied, is made regarding future performance. Information, opinions and estimates contained in this report reflect a judgment at its original date of publication by CS and are subject to change without notice. The price, value of and income from any of the securities or financial instruments mentioned in this report can fall as well as rise. The value of securities and financial instruments is subject to exchange rate fluctuation that may have a positive or adverse effect on the price or income of such securities or financial instruments. Investors in securities such as ADR's, the values of which are influenced by currency volatility, effectively assume this risk. Structured securities are complex instruments, typically involve a high degree of risk and are intended for sale only to sophisticated investors who are capable of understanding and assuming the risks involved. The market value of any structured security may be affected by changes in economic, financial and political factors (including, but not limited to, spot and forward interest and exchange rates), time to maturity, market conditions and volatility, and the credit quality of any issuer or reference issuer. Any investor interested in purchasing a structured product should conduct their own investigation and analysis of the product and consult with their own professional advisers as to the risks involved in making such a purchase. Some investments discussed in this report may have a high level of volatility. High volatility investments may experience sudden and large falls in their value causing losses when that investment is realised. Those losses may equal your original investment. Indeed, in the case of some investments the potential losses may exceed the amount of initial investment and, in such circumstances, you may be required to pay more money to support those losses. Income yields from investments may fluctuate and, in consequence, initial capital paid to make the investment may be used as part of that income yield. Some investments may not be readily realisable and it may be difficult to sell or realise those investments, similarly it may prove difficult for you to obtain reliable information about the value, or risks, to which such an investment is exposed. This report may provide the addresses of, or contain hyperlinks to, websites. Except to the extent to which the report refers to website material of CS, CS has not reviewed any such site and takes no responsibility for the content contained therein. Such address or hyperlink (including addresses or hyperlinks to CS's own website material) is provided solely for your convenience and information and the content of any such website does not in any way form part of this document. Accessing such website or following such link through this report or CS's website shall be at your own risk.
This report is issued and distributed in European Union (except Switzerland): by Credit Suisse Securities (Europe) Limited, One Cabot Square, London E14 4QJ, England, which is authorised by the Prudential Regulation Authority and regulated by the Financial Conduct Authority and the Prudential Regulation Authority. Germany: Credit Suisse Securities (Europe) Limited Niederlassung Frankfurt am Main regulated by the Bundesanstalt fuer Finanzdienstleistungsaufsicht ("BaFin"). United States and Canada: Credit Suisse Securities (USA) LLC; Switzerland: Credit Suisse AG; Brazil: Banco de Investimentos Credit Suisse (Brasil) S.A or its affiliates; Mexico: Banco Credit Suisse (México), S.A. (transactions related to the securities mentioned in this report will only be effected in compliance with applicable regulation); Japan: by Credit Suisse Securities (Japan) Limited, Financial Instruments Firm, Director-General of Kanto Local Finance Bureau ( Kinsho) No. 66, a member of Japan Securities Dealers Association, The Financial Futures Association of Japan, Japan Investment Advisers Association, Type II Financial Instruments Firms Association; Hong Kong: Credit Suisse (Hong Kong) Limited; Australia: Credit Suisse Equities (Australia) Limited; Thailand: Credit Suisse Securities (Thailand) Limited, regulated by the Office of the Securities and Exchange Commission, Thailand, having registered address at 990 Abdulrahim Place, 27th Floor, Unit 2701, Rama IV Road, Silom, Bangrak, Bangkok10500, Thailand, Tel. +66 2614 6000; Malaysia: Credit Suisse Securities (Malaysia) Sdn Bhd; Singapore: Credit Suisse AG, Singapore Branch; India: Credit Suisse Securities (India) Private Limited (CIN no.U67120MH1996PTC104392) regulated by the Securities and Exchange Board of India as Research Analyst (registration no. INH 000001030) and as Stock Broker (registration no. INB230970637; INF230970637; INB010970631; INF010970631), having registered address at 9th Floor, Ceejay House, Dr.A.B. Road, Worli, Mumbai - 18, India, T- +91-22 6777 3777; South Korea: Credit Suisse Securities (Europe) Limited,
Seoul Branch; Taiwan: Credit Suisse AG Taipei Securities Branch; Indonesia: PT Credit Suisse Securities Indonesia; Philippines:Credit Suisse Securities (Philippines ) Inc., and elsewhere in the world by the relevant authorised affiliate of the above. Additional Regional Disclaimers Hong Kong: Credit Suisse (Hong Kong) Limited ("CSHK") is licensed and regulated by the Securities and Futures Commission of Hong Kong under the laws of Hong Kong, which differ from Australian laws. CSHKL does not hold an Australian financial services licence (AFSL) and is exempt from the requirement to hold an AFSL under the Corporations Act 2001 (the Act) under Class Order 03/1103 published by the ASIC in respect of financial services provided to Australian wholesale clients (within the meaning of section 761G of the Act). Research on Taiwanese securities produced by Credit Suisse AG, Taipei Securities Branch has been prepared by a registered Senior Business Person. Australia (to the extent services are offered in Australia): Credit Suisse Securities (Europe) Limited (“CSSEL”) and Credit Suisse International (“CSI”) are authorised by the Prudential Regulation Authority and regulated by the Financial Conduct Authority (“FCA”) and the Prudential Regulation Authority under UK laws, which differ from Australian Laws. CSSEL and CSI do not hold an Australian Financial Services Licence (“AFSL”) and are exempt from the requirement to hold an AFSL under the Corporations Act (Cth) 2001 (“Corporations Act”) under Class Order 03/1099 published by the Australian Securities and Investments Commission (“ASIC”), in respect of the financial services provided to Australian wholesale clients (within the meaning of section 761G of the Corporations Act). This material is not for distribution to retail clients and is directed exclusively at Credit Suisse's professional clients and eligible counterparties as defined by the FCA, and wholesale clients as defined under section 761G of the Corporations Act. Credit Suisse (Hong Kong) Limited (“CSHK”) is licensed and regulated by the Securities and Futures Commission of Hong Kong under the laws of Hong Kong, which differ from Australian laws. CSHKL does not hold an AFSL and is exempt from the requirement to hold an AFSL under the Corporations Act under Class Order 03/1103 published by the ASIC in respect of financial services provided to Australian wholesale clients (within the meaning of section 761G of the Corporations Act). Credit Suisse Securities (USA) LLC (CSSU) and Credit Suisse Asset Management LLC (CSAM LLC) are licensed and regulated by the Securities Exchange Commission of the United States under the laws of the United States, which differ from Australian laws. CSSU and CSAM LLC do not hold an AFSL and is exempt from the requirement to hold an AFSL under the Corporations Act under Class Order 03/1100 published by the ASIC in respect of financial services provided to Australian wholesale clients (within the meaning of section 761G of the Corporations Act). Malaysia: Research provided to residents of Malaysia is authorised by the Head of Research for Credit Suisse Securities (Malaysia) Sdn Bhd, to whom they should direct any queries on +603 2723 2020. Singapore: This report has been prepared and issued for distribution in Singapore to institutional investors, accredited investors and expert investors (each as defined under the Financial Advisers Regulations) only, and is also distributed by Credit Suisse AG, Singapore Branch to overseas investors (as defined under the Financial Advisers Regulations). Credit Suisse AG, Singapore Branch may distribute reports produced by its foreign entities or affiliates pursuant to an arrangement under Regulation 32C of the Financial Advisers Regulations. Singapore recipients should contact Credit Suisse AG, Singapore Branch at +65-6212-2000 for matters arising from, or in connection with, this report. By virtue of your status as an institutional investor, accredited investor, expert investor or overseas investor, Credit Suisse AG, Singapore Branch is exempted from complying with certain compliance requirements under the Financial Advisers Act, Chapter 110 of Singapore (the “FAA”), the Financial Advisers Regulations and the relevant Notices and Guidelines issued thereunder, in respect of any financial advisory service which Credit Suisse AG, Singapore Branch may provide to you. UAE: This information is being distributed by Credit Suisse AG (DIFC Branch), duly licensed and regulated by the Dubai Financial Services Authority (“DFSA”). Related financial services or products are only made available to Professional Clients or Market Counterparties, as defined by the DFSA, and are not intended for any other persons. Credit Suisse AG (DIFC Branch) is located on Level 9 East, The Gate Building, DIFC, Dubai, United Arab Emirates. EU: This report has been produced by subsidiaries and affiliates of Credit Suisse operating under its Global Markets Division This research may not conform to Canadian disclosure requirements. In jurisdictions where CS is not already registered or licensed to trade in securities, transactions will only be effected in accordance with applicable securities legislation, which will vary from jurisdiction to jurisdiction and may require that the trade be made in accordance with applicable exemptions from registration or licensing requirements. Non-US customers wishing to effect a transaction should contact a CS entity in their local jurisdiction unless governing law permits otherwise. US customers wishing to effect a transaction should do so only by contacting a representative at Credit Suisse Securities (USA) LLC in the US. Please note that this research was originally prepared and issued by CS for distribution to their market professional and institutional investor customers. Recipients who are not market professional or institutional investor customers of CS should seek the advice of their independent financial advisor prior to taking any investment decision based on this report or for any necessary explanation of its contents. This research may relate to investments or services of a person outside of the UK or to other matters which are not authorised by the Prudential Regulation Authority and regulated by the Financial Conduct Authority and the Prudential Regulation Authority or in respect of which the protections of the Prudential Regulation Authority and Financial Conduct Authority for private customers and/or the UK compensation scheme may not be available, and further details as to where this may be the case are available upon request in respect of this report. CS may provide various services to US municipal entities or obligated persons ("municipalities"), including suggesting individual transactions or trades and entering into such transactions. Any services CS provides to municipalities are not viewed as "advice" within the meaning of Section 975 of the Dodd-Frank Wall Street Reform and Consumer Protection Act. CS is providing any such services and related information solely on an arm's length basis and not as an advisor or fiduciary to the municipality. In connection with the provision of the any such services, there is no agreement, direct or indirect, between any municipality (including the officials,management, employees or agents thereof) and CS for CS to provide advice to the municipality. Municipalities should consult with their financial, accounting and legal advisors regarding any such services provided by CS. In addition, CS is not acting for direct or indirect compensation to solicit the municipality on behalf of an unaffiliated broker, dealer, municipal securities dealer, municipal advisor, or investment adviser for the purpose of obtaining or retaining an engagement by the municipality for or in connection with Municipal Financial Products, the issuance of municipal securities, or of an investment adviser to provide investment advisory services to or on behalf of the municipality. If this report is being distributed by a financial institution other than Credit Suisse AG, or its affiliates, that financial institution is solely responsible for distribution. Clients of that institution should contact that institution to effect a transaction in the securities mentioned in this report or require further information. This report does not constitute investment advice by Credit Suisse to the clients of the distributing financial institution, and neither Credit Suisse AG, its affiliates, and their respective officers, directors and employees accept any liability whatsoever for any direct or consequential loss arising from their use of this report or its content. Principal is not guaranteed. Commission is the commission rate or the amount agreed with a customer when setting up an account or at any time after that. Copyright © 2017 CREDIT SUISSE AG and/or its affiliates. All rights reserved.
Investment principal on bonds can be eroded depending on sale price or market price. In addition, there are bonds on which investment principal can be eroded due to changes in redemption amounts. Care is required when investing in such instruments. When you purchase non-listed Japanese fixed income securities (Japanese government bonds, Japanese municipal bonds, Japanese government guaranteed bonds, Japanese corporate bonds) from CS as a seller, you will be requested to pay the purchase price only.