india human development survey technical paper...
TRANSCRIPT
India Human Development Survey: Design and Data Quality
Sonalde Desai
Amaresh Dubey B.L. Joshi Mitali Sen
Abusaleh Shariff Reeve Vanneman
India Human Development Survey
Technical Paper No. 1
1
India Human Development Survey: Design and Data Quality
India Human Development Survey 2005 (IHDS) is collaborative project of researchers
from the University of Maryland and National Council of Applied Economic Research, New
Delhi. It is a household survey whose primary goal is to deepen our understanding of human
development in India. The IHDS was administered to a nationally representative sample of
41,554 households located across all states and union territories of India with the exception of
Andaman Nicobar and Lakshadweep and contains an urban as well as rural sample. This note
describes our data collection methods and sample selection and assesses the quality of the data.
A survey that encompasses a full range of human development issues faces practical
challenges not encountered by more single focus projects. Every issue from questionnaire design
to data cleaning to statistical analysis is complicated by the decision to broaden the range of
human development issues addressed. The analytic gains are substantial, but the practical costs
are also real. After a careful consideration of these issues it was decided to field the IHDS to
over 41,000 Indian households residing in rural and urban areas selected from 33 states and
union territories. The sample extends to 384 out of 593 districts identified in 2001 census.
The IHDS benefited from a rich history of survey research in India generally and at
NCAER and its collaborating institutions in particular. Questionnaire design borrowed as needed
from Indian and international household surveys. Some of the important Indian sources include
the National Sample Surveys, the National Family and Health Surveys, and the 1994 Human
Development Profile of India; international sources include five countries Status of Women and
2
Fertility Survey, the World Bank Living Standard Measurement Surveys and Indonesian and
Malaysian Family Life Surveys. Organisation of fieldwork and oversight was in the capable
hands of professionals with a generation of practical experience culled from a wide variety of
surveys. Data cleaning and analysis enlisted a small army of personnel with well-developed,
often obsessive, attention to detail. At its best, most of this work is invisible, thus permitting the
analyst and the reader to focus on the central research questions. But the success of those
analyses and the validity of their conclusions depend on the competent execution of the survey
itself. This note reviews the major issues of that execution.
Sampling The IHDS is a nationally representative survey of 41,554 urban and rural households. It
covers all states and union territories of India – with the exception of Andaman/Nicobar and
Lakshadweep. These households are spread across 33 states and union territories, 384 districts,
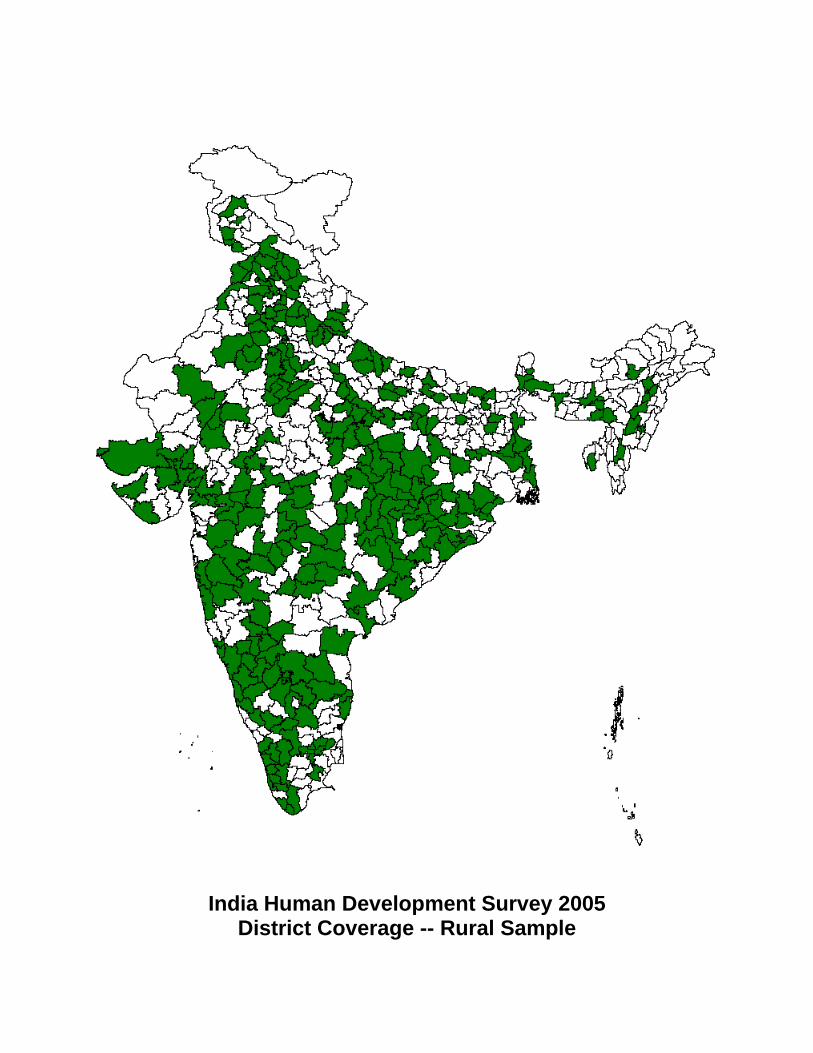
1503 villages and 971 urban blocks located in 276 towns and cities. District-wise coverage for
total, rural and urban sample is shown in Figures 1, 2 and 3. These 41,554 households include
215,754 individuals. State-wise distribution of sampled households and individuals is presented
in Table 1.
Villages and urban blocks (comprising of 150-200 households) formed the primary
sampling unit (PSU) from which the households were selected. Urban and rural PSUs were
selected using a different design. In order to draw a random sample of urban households, all
urban areas in a state were listed in the order of their size with number of blocks drawn from
each urban area allocated based on probability proportional to size. Once the numbers of blocks
for each urban area were determined, the enumeration blocks were selected randomly with help
3
from Registrar General of India. From these Census Enumeration Blocks of about 150-200
households, a complete household listing were conducted and household sample of 15
households was selected per block. For sampling purposes, some smaller states were combined
with nearby larger states.
The rural sample contains about half the households that were interviewed initially by
NCAER in 1993-94 in a survey titled Human Development Profile of India -- HDPI (Shariff,
1999) and the other half of the samples were drawn from both districts surveyed in HDPI as well
as from the districts located in the states and union territories not covered in HDPI. The original
HDIP was a random sample of 33,230 households, located in 16 major states, 195 districts and
1,765 villages. In states where the 1993-94 survey was conducted and recontact details were
available, 13,593 households were randomly selected for re-interview in 2005.
After a gap of 11-12 years, about 82% of the households were contactable for re-
interview resulting in a resurvey of 11,153 original households as well as 2,440 households
which separated from these root households but were still living in the village. In order to check
the representativeness of the sample, in each district where re-interviews were conducted, two
fresh villages were randomly selected using a probability proportional to size technique. In the
villages selected for survey in this manner, 20 randomly selected households were interviewed.
Comparing the panel sample with this randomly selected refresher sample allows us to determine
whether this panel sample is overrepresented among certain segments of the society. A
comparison of the reinterview sample and refresher sample in districts where both samples are
present, suggests that on most variables of interest such as caste, religion, education and
economic status, the re-interviewed sample does not differ substantially from the fresh sample
4
(Appendix Table 1). Additionally 3,993 rural households were randomly selected from the states
where the 1993-94 survey was not conducted, or where re-contact information was not available.
This approach to combining a randomly selected panel sample while refreshing it with another
random sample has been used in a variety of surveys including the Panel Study of Income
Dynamics in the U.S. and Malaysian Family Life Survey.i
Comparative Results
However, given the potential for
significant sampling and non-sampling errors, we present a detailed analysis of the quality of
IHDS data below.
IHDS was not intended to provide national or certainly state wise estimates of levels of
human development outcomes. There are already many excellent Indian surveys that fill that
mission. IHDS’s main purpose is to provide a means for gaining insight by analyzing the
relationships among these human development outcomes and the connections between human
development and its background causes.
Nevertheless, it is useful to compare IHDS estimates of human development levels with
estimates from other more narrowly focused surveys that usually have larger sample sizes and
smaller sampling errors. The National Sample Surveys and the National Family Health Surveys
are obvious comparisons because of their excellent quality and wide use. The Indian Census
provides another useful reference. The Census and these surveys differ not only in their
objectives and design, but their question wording, sampling design, coding decisions, and
government sponsorship – all of which should be expected to provoke somewhat differ answers
from respondents and yield different frequencies.
5
However, a comparison of IHDS data with the National Sample Survey (2004-2005),
National Family Health Survey III (2005-2006) and Census (2001) presented in Table 2 provides
considerable reassurance for the robustness of IHDS data. IHDS sample distribution on urban
residence, caste and religion is remarkably similar to NSS and NFHS-III, although all three
surveys (IHDS, NSS and NFHS) have higher proportion of households claiming Scheduled
Caste status than enumerated in Census. IHDS has a slightly higher proportion of households
falling in Scheduled Caste category and slightly lower proportion in Scheduled Tribe category
than NSS or NFHS. On other variables of interest, we find literacy and school enrolment in
IHDS to be very similar to those in NSS. On work participation rate for males, IHDS falls in
between NSS and Census estimates, however, given the special effort made to obtain estimates
of women’s unpaid work, it is not surprising that IHDS estimates for women’s work
participation are higher than both NSS and Census. Family size estimates range from 4.7 in NSS
to 5.3 in Census. Average family size in IHDS was 5.2. Of particular interest is the poverty rate
estimated at 25.7% in IHDS, close to 27.5% estimated by NSS. The IHDS records higher
proportion of households owning TV, using electricity and LPG gas than the NSS, possibly due
to differences in question wording. But on most other variables, IHDS results seem to be fairly
consistent with the results from other surveys.
However, it is important to note that these broad similarities between IHDS data and
other data sources do not remain quite so robust when we look at sub-national levels. Hence, we
caution the users about not over-interpreting IHDS estimates for state wise or other smaller
samples. The IHDS sample sizes are large enough to investigate the general patterns that
determine human development outcomes, but if readers desire a precise point estimate of the
6
level of some particular indicator for a sub-sample of the Indian population, they are better
referred to the sources such as the National Sample Surveys or Census.
Questionnaire Design The one hundred pages of questions used in IHDS were carefully selected from items
successfully administered in previous surveys in India and other developing countries, although
some were modified after fielding these in the pre-testing of IHDS questionnaire. Some topics
on which IHDS has special perspective (e.g., marriage and gender relations) required the
development of new set of questions. But all questions, even those adopted from previous work,
went through rigorous pre-testing and screening. The final questionnaires were the result of a
careful, often painful, process of selection and revision in order to keep the questions
understandable by respondents as well as interview length manageable with an eye on
minimizing their burden as far as possible without sacrificing the required detail.
Some parts of the questionnaire attempted to replicate other work as precisely as possible
in order to maximize comparability. The consumption questions used for calculation of poverty
incidenc for instance, were copied from the short form of the consumption module developed for
National Sample Survey’s (NSS) employment/unemployment survey. The 61st Round NSS
survey was administered in 2004-2005, allowing us to test the reliability of the IHDS estimates.
One goal of IHDS was to compare a household’s relative position on this much-used
consumption index with data on income and on household amenities, two other measures of
economic position. Comparability required replicating the NSS measures as far as possible.
Other parts of the interview borrowed substantially from past work but had to be adapted
to the IHDS format. Reading, writing and arithmetic tests were developed in conjunction with
7
PRATHAM, although adapted for the IHDS use. Since PRATHAM’s Annual Status of
Education Report was prepared in 2005, once again, this allows for considerable data quality
evaluation and comparability.
Some often used questions had to be replaced by alternatives that our respondents found
more understandable. The social network questions, for example, first used a relational format
(“with whom do you talk when you seek advice”) but were changed to a more direct although
less common positional format (“do you know anyone in …”) which our respondents found
easier to answer (and proved to be far more easily coded for analysis).
Some questions, even those used in many previous surveys, proved too ambiguous in pre-
testing and had to be deleted altogether because no suitable alternative could be devised. For
example, a question on interpersonal trust – one of the most widely cited questions around the
globe – asked “Would you say that most people can be trusted or that you need to be careful in
dealing with people?” Too many of our pre-test respondents asserted, not unreasonably, that
both propositions were true and they could not choose between them.
The survey made specific effort at obtaining information for women’s and children’s
work. Building on work done by the International Labour Organisation as well as time allocation
studies done in India, special effort was made to determine women’s and children’s participation
in caring for livestock or in farm related activities.
The questions finally fielded in IHDS were organised into two separate questionnaires,
household and women. The household questionnaires were administered to the individual most
knowledgeable about income and expenditure, frequently the male head of the household; the
questionnaire for health and education was administered to a woman in the household – most

8
often the spouse of the household head. Each interview required between forty-five minutes and
an hour and a half to complete, a length that seemed the outer limits of what we could reasonably
ask from our respondents. Questions on fertility, marriage, and gender relations in the
households were addressed to an ever-married woman between 15 and 49 in the household. If
no household member fit these criteria, that portion of the questionnaire was skipped (about 19%
of all households); if the household had more than one ever married woman between 15 and 49,
one woman was selected randomly to answer those questions.
Because IHDS recognizes that all human development is nurtured within local and
institutional contexts, separate questionnaires were developed to measure village characteristics
and to assess the functioning of up to two schools and two medical facilities located within the
selected villages. In cases where there were no school and/or medical facilities within the
selected village, the nearest school(s) and medical facility(ies) were surveyed.
Fieldwork The survey questions were originally drafted in English. However, given the multilingual
diversity of India and large disparities in literacy levels, the questionnaires were then translated
into Hindi for pre-testing, and then after revisions translated from the Hindi and English versions
into eleven additional languages. The questionnaires translated in other languages were again
pre-tested during training in respective areas before these were used by the field teams to gather
the information.
Field work was performed by 25 agencies throughout the country selected for their
experience with administering large scale scientific surveys. The length and diversity of IHDS
required more extensive training than is needed for single topic surveys. NCAER staff, assisted

9
by researchers from the University of Maryland, organized eleven two-week training sessions
across the country, each for 15-50 interviewers. Classroom reviews of each questionnaire
section alternated with supervised field experience. In addition to written interviewer manuals,
training films were developed in which interviewers could see actual survey administration.
Once trained, interviewers went into the field typically in teams of five: two pairs of male
and female interviewers and a team leader. The team leader was responsible for supervising and
assisting with the household interviews and usually conducted the village, school, and medical
facility interviews. After arriving at a PSU, the team would contact local leaders to describe the
survey, secure permissions, and develop a map of the area. Urban neighbourhoods and new
villages selected in IHDS required creation of a sampling frame first. Large villages were
divided into hamlets or sections within the village, and two opposite sections were randomly
selected for complete canvassing. Villages interviewed in the 1994 HDPI did not require
canvassing and sampling, but the previous households had to be tracked, each member accounted
for, and split households located.
Once the sample had been drawn or the 1993-94 HDPI households located, pairs of
interviewers began arranging interviews. After obtaining consent, the household roster was
filled out in duplicate. Separate households were defined as people living under one roof and
sharing the same kitchen. Joint families often required specific probing since two married
brothers might share the same dwelling but maintain separate kitchens and food budgets. Absent
family members had to be identified as either temporarily absent household members (i.e., living
outside the household for less than six months) or residents of other households (e.g., students
living in nearby towns to pursue their education).
10
Once the household roster was completed, the two copies were divided between the two
interviewers, and the female interviewer then completed the education and health questionnaire,
usually with the help from a senior woman in the household. If the household included more
than one eligible woman for the marriage and fertility sections, one was selected using a standard
random number procedure. After completing the two main household interviews, the
interviewers administered the learning tests to any child in the in the age group 8-11 years, and
his/her height and weight measurements were taken. Often, more than one visit was needed to
complete all sections of the household interview.
Completed interviews were checked by the team supervisor, re-checked by the agency
coordinator, and sent to NCAER headquarters in New Delhi where editing staff again reviewed
the skip patterns, looked for missing data, and checked coding. These multilevel reviews
enabled prompt identification of problems and feedback to interview teams. NCAER also
maintained its own field staff in each state for random re-interview checks for data quality and
for troubleshooting of problems encountered by interview teams. Phone contact between agency
field staff and NCAER headquarters also resolved many issues before they became major
problems.
Data entry was centralized at NCAER’s New Delhi offices and was undertaken as
completed interviews arrived. The questionnaire form was mostly self-coded for ease of data
entry. The 1400 variables from the household interview were checked for consistency (e.g., no 5
year old mothers of three children) and problems resolved by consulting the originally filled
questionnaire or occasionally telephone calls back to the interview site. The main data files are
publicly available for downloading and further analyses by all interested scholars. IHDS should

11
become a premier resource for understanding the complexities of the human development
process.
Sample Characteristics:
Gender
Each of the individual characteristics (gender, age, and education) was reported by the
main household respondent. This results in some imprecision for age and education, including
the usual age “heaping” at round ages (20, 30, etc.). Some corrections have been made based on
other information in the survey (e.g., birth histories), but for comparisons of most human
development outcomes, even imprecise measures are sufficient to reveal the strong patterns.
Measurement problems are not an issue for gender although difficulties in locating
transient and homeless populations may result in an undercount of men. India is well known for
its imbalanced sex ratios and “missing women”. IHDS also recorded fewer females than males,
especially among younger ages for whom the effects of sex selective abortions have become
more apparent. Because women and men live in the same households, they don’t differ greatly
on household characteristics (although somewhat more women live in low income households).
Individual differences are substantial, however; men average 6.3 years of education, for instance,
compared to women’s 3.6.
Age
India’s fertility decline is fairly recent so India is still a young country: 45% of the IHDS
household members are under 21.The young are somewhat more concentrated in poorer states
where the fertility decline has been the weakest and in poorer households. There are more
12
elderly (age 60 or more) in states with an early fertility decline (e.g., Kerala) or where out-
migration of the working-age population leaves a higher concentration of the elderly (e.g.,
Himachal Pradesh). Age is correlated inversely with years of schooling since education has
expanded manifold since Independence. This correlation needs to be kept in mind in evaluating
results from this survey since several human development outcomes tend to increase with both
more education and older ages.
Education
Education is one of the most consistent predictors of favourable human development
outcomes. Everything from incomes, to health, to social connections is higher among the better
educated. Because of educational expansion, India has many highly qualified graduates whose
future is promising; the country also still has many illiterates whose struggles are often poorly
rewarded. The tables that follow divide years of education into groups according to the school
system’s natural break points. More than two in five adults have had no schooling. A small
group, 9%, started primary school without finishing. Over a quarter of adults finished primary
school without completing secondary school. Almost a quarter of adults, however, have
completed their 10th standard matriculation: 10% finished at that level; 6% finished higher
secondary school; and 7% are college graduates.
Higher levels of education are more common among every advantaged group. Urban
residents are more educated than rural residents; high income households have more educated
members than poor households; forward castes and non-Muslim minority religions have
considerably more education on average than other groups while dalits and adivasis have the

13
least. Some of the many advantages of urban, affluent, forward castes result from their higher
education; but some part of their higher education results from their many other advantages.
States
Regional inequalities have provoked growing debate as parts of India have grown
especially rapidly in recent years. Differences across states are a recurring theme in IHDS results
– often overwhelming differences by class and social group. But there are limitations to the
extent of state differences that can be reliably reported. The survey was fielded in 33 states and
union territories; only the offshore territories of Lakshadweep and the Andaman and Nicobar
Islands were omitted from the sampling design (0.05% of the Indian population).
Sample sizes vary substantially across these states and territories (see Table 1). Care
must always be taken not to rely too heavily on the position of any one state in the distribution of
state outcomes; sampling errors almost always overlap between states with similar positions on
any human development measure. Rather, much of the usefulness of state differences is to
observe the pattern of state differences: rich versus poor; North versus South; high versus low
education.
Some of the union territories and states have samples too small to reliably report separate
results. Therefore, these smaller samples should be combined with neighbouring areas for
reporting purposes (e.g. Goa with Maharashtra). All the smaller North-eastern states (Arunachal
Pradesh, Manipur, Meghalaya, Tripura, etc.) are typically reported as a single entity. These
states share some common features but are quite heterogeneous on many other dimensions. The
other smaller states and territories were combined with larger neighbours: Chandigarh with
14
Punjab; Daman and Diu and Dadra and Nagar Haveli with Gujarat; Goa with Maharashtra; and,
Pondicherry with Tamil Nadu. The Delhi sample is large enough to report separately for most
purposes, but the rural sample in Delhi is based on only 7 semi-urban villages so Delhi.
This organization leaves 22 “states” that are compared in many analyses based on the
IHDS data. Urbanization, income, and education are a coherent “package” that distinguishes
states like Delhi and Kerala from states like Orissa and Jharkhand. There are exceptions, even
within this development cluster, but it will be useful to think of this as one (among several)
organizing principle for regional inequalities. However, other outcomes demonstrate a quite
different pattern. Some social groups have strong state associations (e.g., Muslims in Jammu and
Kashmir; Christians in the Northeast) but these are not usually development related (although
tribal’s more often reside in rural, less developed states and Sikhs in the wealthy Punjab). Some
dimensions of gender inequality also cross-cut development levels. For example, unbalanced sex
ratios are found in wealthy Punjab and poor U.P. while more balanced sex ratios are found in
affluent Kerala and poorer Orissa. The lesson here is that development levels are an important
but not the only dimension along which states in India differ.
Rural – Urban Residence
Village – city differences are a second type of regional inequality generally thought to be
growing in recent years. Urban residents have higher incomes; their children stay in school
longer; when sick they have better access to medical care. While India has been slowly
urbanizing throughout the last century, the pace of urbanization is only modest by world
standards. In 2005, India had 41 urban areas with over a million population; China had 95.

15
Villages still hold much staying power, and even urban migrants maintain ties with their native
villages. The perception of growing rural – urban disparities could threaten this stability.
IHDS uses the Census 2001 definitions which classify as urban, places with a dense
population of 5000 or more where most male employment is outside agriculture.ii 28% of India
was urban in 2001; IHDS slightly over sampled (34%) urban areas but all analyses have been
weighted back to the census proportions.
Both urban and rural areas encompass great diversity. India’s major metropolitan areas
are global cities: Mumbai’s Bollywood is familiar to most of the world; Bangalore’s IT industry
and Chennai’s call centres daily influence the lives of millions of people outside India. At the
other end of the spectrum, thousands of small towns are barely distinguishable from large
villages. To capture these differences, IHDS reports urban results in two categories: the six
largest metropolitan areasiii
Town and especially metropolitan households have higher incomes and education than
rural households. Urban areas also differ on their caste and religious composition. Forward
(Mumbai, Kolkata, Delhi, Chennai, Hyderabad, and Bangalore) (7%)
and all other urban areas (21%). Similarly, some villages have substantial infrastructure: paved
roads with easy access to urban centres, postal and telephone connections, electricity to power
lights and televisions. Others lack most of the conveniences of modern life and can be reached
only by narrow footpaths, in some cases even one has to use some unconventional means, like
camel or boat. IHDS divides villages into two approximately equal groups according to an index
of infrastructural development. The more developed villages generally appear closer to urban
areas on most human development outcomes.

16
castes and minority religions are especially concentrated in urban areas; dalits and especially
adivasis are more rural.
Income
IHDS is the first major Indian survey to measure detailed income. The National Sample
Surveys measure consumption expenditures and the National Family Health Surveys measure the
ownership of consumer goods. IHDS measured these too. Each provides a somewhat different
aspect of economic position but is closely related. The IHDS measure of income is summed
across over fifty separate components including wages and salaries, net farm income, family
business net income, property and pension incomes.
The average Indian household had an annual income of Rs. 29,009 in 2004; but because
some households earned much more than this median, the mean was Rs. 49,442. For all tables,
households are divided into five quintiles with cutting points at 14,155; 23,168; 36,486 and
69,000. A small number of households (2%) reported negative or very low incomes because of
agricultural or business losses. Although these households are undergoing current economic
distress, in many other ways (e.g., consumer goods owned, educational levels) they appear more
like moderate income households than the poor households in the bottom quintile.
Household Education
Many of the human development outcomes benefit the entire household. An indoor
water tap, access to nearby medical clinics, and connections to government officials are
resources the entire household can take advantage of. To see how these advantages are related to
educational levels, many analyses with IHDS use a measure of the highest adult (i.e., age 21 or
17
older) education in the household when appropriate.iv
Social Groups
The same schooling categories are used as
for individual education, but the distribution is higher. Only a quarter of Indian households have
no adult without any formal education, but 37% have an adult who has matriculated 10th standard
or gone further. At the top, 13% of households have an adult with a college degree. This
measure of household education is associated with the same advantages as individual education:
urban residence, higher incomes, and forward castes are more common in well-educated
households.
Perhaps no other country in the world offers such a rich diversity of religious, caste,
ethnic, and linguistic identities as it is found in India. Any useable grouping for a review of
human development is bound to ignore important distinctions that the people themselves would
never overlook. Much of the analyses based on IHDS follow a six-fold classification:
• Forward castes
• Other Backward Castes (OBC)
• Dalits (Scheduled Castes)
• Adivasis (Scheduled Tribes)
• Muslims
• Other minority religions (Christians, Sikhs, Buddhists, Jains)
Obvious questions for such a scheme are where one classifies Muslim OBCs, Christian
adivasis, Sikh dalits, and other groups that easily fit more than one category. Muslim OBCs
differ from Hindu OBCs and from other Muslims on most human development outcomes;
18
likewise for Christian adivasis, Sikh dalits, and other groups. Independent religion and caste
classifications would avoid these ambiguities but would create too many categories for the
compact presentation needed here. The compromise result is this six-category schemev; more
detailed classifications are available from the public data for analysts requiring more precision.
However, caste and religion data are available in two separate questions for analysts to construct
their own categories.
Religion and caste classifications are based on the main respondent’s self-identification.
Self-identification yields somewhat different information from official data which use detailed
but state wise government schedules. The official schedules often miss migrants from other
states. Self-identification also encourages marginal groups to claim scheduled caste or tribe
membership in order to qualify for government reservations. As a result IHDS ends up with
somewhat higher proportions of the population as dalits and adivasis than the census and slightly
higher than the NSS.
The groups differ greatly on almost every measure of economic and social standing.
Forward castes and non-Muslim minority religions are more urban, educated, and wealthy; dalits
and adivasis are more often rural, illiterate, and poor. OBCs are somewhere between but usually
closer to dalits than to forward castes. Muslims are also somewhere between but much closer to
dalits on education, closer to forward castes on urbanization, and in between on incomes but
slightly better off than OBCs. These groups differ also on most of the human development
outcomes; sometimes these differences are a result of the economic, educational, and regional
differences but sometimes some groups differences remain even when comparing otherwise
equivalent households.

19
i 1 Leslie Kish and Alastair Scott were the first to describe the probability sampling procedures which are designed to optimize the reselection or “retention” of sample units during a transition from an old to a new sample design. A description of this can be found in: Kish, Leslie, and Scott, Alastair “Retaining units after changing strata and probabilities.” Journal of the American Statistical Association, Vol. 667, Number 335, Applications Section, Sept. 1971. ii The official Census definition of urban areas are “(a) All statutory places with a municipality, corporation, cantonment board or notified town area committee, etc. or (b) A place satisfying the following three criteria simultaneously: i) a minimum population of 5,000; ii) at least 75 per cent of male working population engaged in non-agricultural pursuits; and iii) a density of population of at least 400 per sq. km. (1,000 per sq. mile)”. iii IHDS follows loosely follows the Census definitions of “Urban Agglomeration” which include areas outside the official municipal boundaries but which are integrated into the urban core. All urban residents in districts identified as part of the urban agglomeration are counted as living in the metropolitan area. Census rules do not allow urban agglomerations to cross state boundaries, but we have included Gurgaon (Haryana) and Ghaziabad and Gautam Buddha Nagar (U.P.) districts with the Delhi metropolitan area. iv In households without any adult 21 years or older, the highest education is substituted. v The rules used for these tables assign households to dalit and adivasi categories regardless of religion; only Hindu and Sikh OBCs to the OBC group; Muslims, Christians, and other minority religions to the appropriate religious group unless they are dalits or adivasis; and Hindus who are not dalits, adivasis, or OBCs to forward castes.
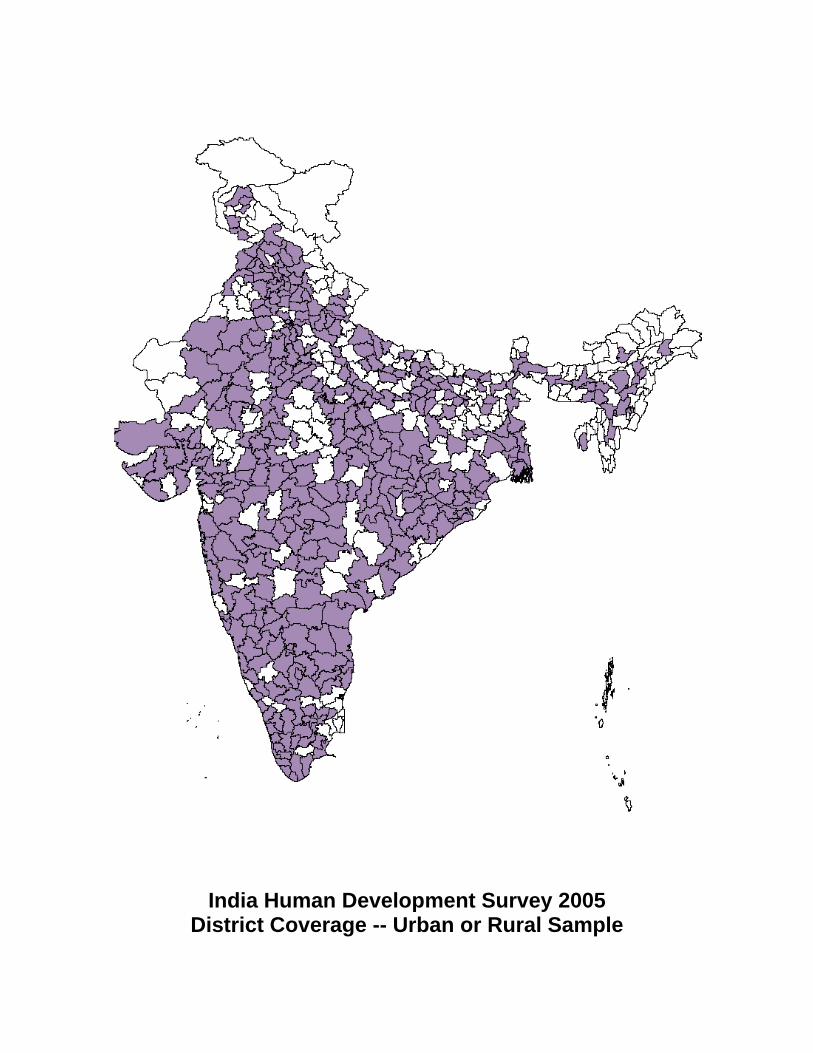
India Human Development Survey 2005 District Coverage -- Urban or Rural Sample
India Human Development Survey 2005
District Coverage -- Rural Sample

India Human Development Survey 2005
District Coverage -- Urban Sample

Table 1: State-wise Distribution of IHDS Sample
Disctrictsin 2001 Districts Urban Blocks Villages Rural Urban Total Rural Urban TotalCensus areas
Jammu & Kashmir 14 5 5 21 20 400 315 715 2,528 1,702 4,230HP 12 9 7 21 52 1,057 315 1,372 5,663 1,503 7,166Punjab 17 13 11 36 61 1,033 560 1,593 6,202 2,831 9,033Chandigarh 1 1 1 6 0 0 90 90 0 383 383Uttaranchal 13 6 3 9 20 309 149 458 1,757 736 2,493Haryana 19 14 6 18 79 1,350 268 1,618 8,112 1,291 9,403Delhi 9 10 7 56 6 60 900 960 329 4,291 4,620Rajasthan 32 23 17 60 88 1,590 895 2,485 9,663 4,805 14,468UP 70 43 24 75 138 2,389 1,123 3,512 14,966 6,499 21,465Bihar 37 17 10 31 61 965 465 1,430 5,950 2,856 8,806Sikkim 4 1 1 3 3 60 45 105 293 212 505Arunachal Pradesh 13 1 1 3 6 120 45 165 623 209 832Nagaland 8 4 1 2 5 100 30 130 480 84 564Manipur 9 3 1 3 3 60 45 105 359 239 598Mizoram 8 1 1 3 3 60 45 105 263 239 502Tripura 4 2 1 3 7 184 45 229 818 190 1,008Meghalaya 7 3 1 3 6 116 45 161 505 250 755Assam 23 8 7 21 38 699 318 1,017 3,286 1,404 4,690WB 18 14 21 75 66 1,247 1,133 2,380 6,170 4,788 10,958Jharkhand 18 6 9 27 26 519 405 924 2,913 2,095 5,008Orissa 30 26 13 40 84 1,464 600 2,064 7,710 2,886 10,596Chhattisgarh 16 15 6 18 49 905 270 1,175 4,833 1,377 6,210MP 45 31 13 42 121 2,177 628 2,805 12,392 3,409 15,801Gujarat 25 17 14 60 70 1,167 911 2,078 5,926 4,234 10,160Diu & Daman 2 2 0 0 3 60 0 60 281 0 281Dadra & Nagar Haveli 1 1 0 0 3 60 0 60 315 0 315Mahrashtra 35 27 18 75 115 2,078 1,125 3,203 10,881 5,721 16,602AP 23 19 18 60 94 1,526 909 2,435 6,669 3,992 10,661Karnataka 27 26 21 78 144 2,832 1,189 4,021 14,184 5,675 19,859Goa 2 2 1 3 6 100 65 165 475 307 782Lakshadweep 1 0 0 0 0 0 0 0 0 0 0Kerala 14 12 14 42 61 1,089 642 1,731 4,892 3,089 7,981Tamil Nadu 30 21 22 74 62 898 1,200 2,098 3,691 4,855 8,546Pondicherry 4 1 1 3 3 60 45 105 245 228 473Andaman & Nicobar 2 0 0 0 0 0 0 0 0 0 0Total 593 384 276 971 1503 26734 14820 41554 143374 72380 215754
Included in IHDS Households Surveyed Individuals Surveyed
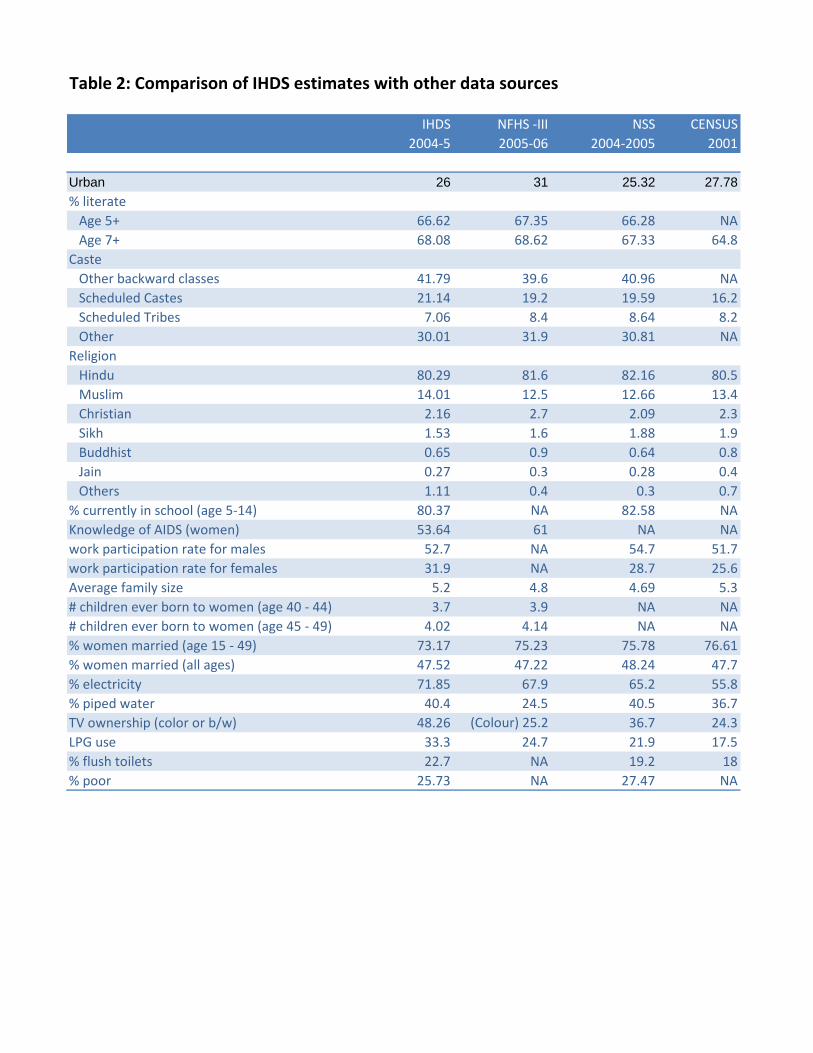
Table 2: Comparison of IHDS estimates with other data sources
IHDS NFHS -III NSS CENSUS2004-5 2005-06 2004-2005 2001
Urban 26 31 25.32 27.78% literate Age 5+ 66.62 67.35 66.28 NA Age 7+ 68.08 68.62 67.33 64.8Caste Other backward classes 41.79 39.6 40.96 NA Scheduled Castes 21.14 19.2 19.59 16.2 Scheduled Tribes 7.06 8.4 8.64 8.2 Other 30.01 31.9 30.81 NAReligion Hindu 80.29 81.6 82.16 80.5 Muslim 14.01 12.5 12.66 13.4 Christian 2.16 2.7 2.09 2.3 Sikh 1.53 1.6 1.88 1.9 Buddhist 0.65 0.9 0.64 0.8 Jain 0.27 0.3 0.28 0.4 Others 1.11 0.4 0.3 0.7% currently in school (age 5-14) 80.37 NA 82.58 NAKnowledge of AIDS (women) 53.64 61 NA NAwork participation rate for males 52.7 NA 54.7 51.7work participation rate for females 31.9 NA 28.7 25.6Average family size 5.2 4.8 4.69 5.3# children ever born to women (age 40 - 44) 3.7 3.9 NA NA# children ever born to women (age 45 - 49) 4.02 4.14 NA NA% women married (age 15 - 49) 73.17 75.23 75.78 76.61% women married (all ages) 47.52 47.22 48.24 47.7% electricity 71.85 67.9 65.2 55.8% piped water 40.4 24.5 40.5 36.7TV ownership (color or b/w) 48.26 (Colour) 25.2 36.7 24.3LPG use 33.3 24.7 21.9 17.5% flush toilets 22.7 NA 19.2 18% poor 25.73 NA 27.47 NA
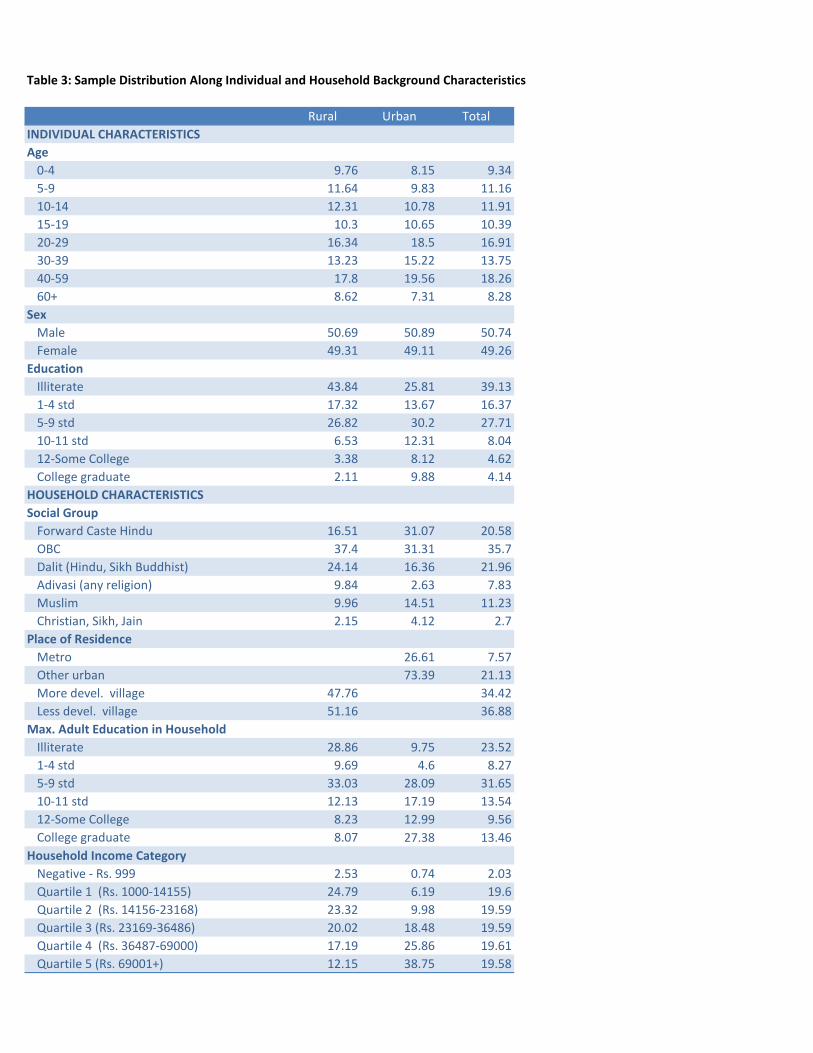
Table 3: Sample Distribution Along Individual and Household Background Characteristics
Rural Urban TotalINDIVIDUAL CHARACTERISTICSAge
0-4 9.76 8.15 9.345-9 11.64 9.83 11.1610-14 12.31 10.78 11.9115-19 10.3 10.65 10.3920-29 16.34 18.5 16.9130-39 13.23 15.22 13.7540-59 17.8 19.56 18.2660+ 8.62 7.31 8.28
SexMale 50.69 50.89 50.74Female 49.31 49.11 49.26
EducationIlliterate 43.84 25.81 39.131-4 std 17.32 13.67 16.375-9 std 26.82 30.2 27.7110-11 std 6.53 12.31 8.0412-Some College 3.38 8.12 4.62College graduate 2.11 9.88 4.14
HOUSEHOLD CHARACTERISTICSSocial Group
Forward Caste Hindu 16.51 31.07 20.58OBC 37.4 31.31 35.7Dalit (Hindu, Sikh Buddhist) 24.14 16.36 21.96Adivasi (any religion) 9.84 2.63 7.83Muslim 9.96 14.51 11.23Christian, Sikh, Jain 2.15 4.12 2.7
Place of ResidenceMetro 26.61 7.57Other urban 73.39 21.13More devel. village 47.76 34.42Less devel. village 51.16 36.88
Max. Adult Education in HouseholdIlliterate 28.86 9.75 23.521-4 std 9.69 4.6 8.275-9 std 33.03 28.09 31.6510-11 std 12.13 17.19 13.5412-Some College 8.23 12.99 9.56College graduate 8.07 27.38 13.46
Household Income CategoryNegative - Rs. 999 2.53 0.74 2.03Quartile 1 (Rs. 1000-14155) 24.79 6.19 19.6Quartile 2 (Rs. 14156-23168) 23.32 9.98 19.59Quartile 3 (Rs. 23169-36486) 20.02 18.48 19.59Quartile 4 (Rs. 36487-69000) 17.19 25.86 19.61Quartile 5 (Rs. 69001+) 12.15 38.75 19.58
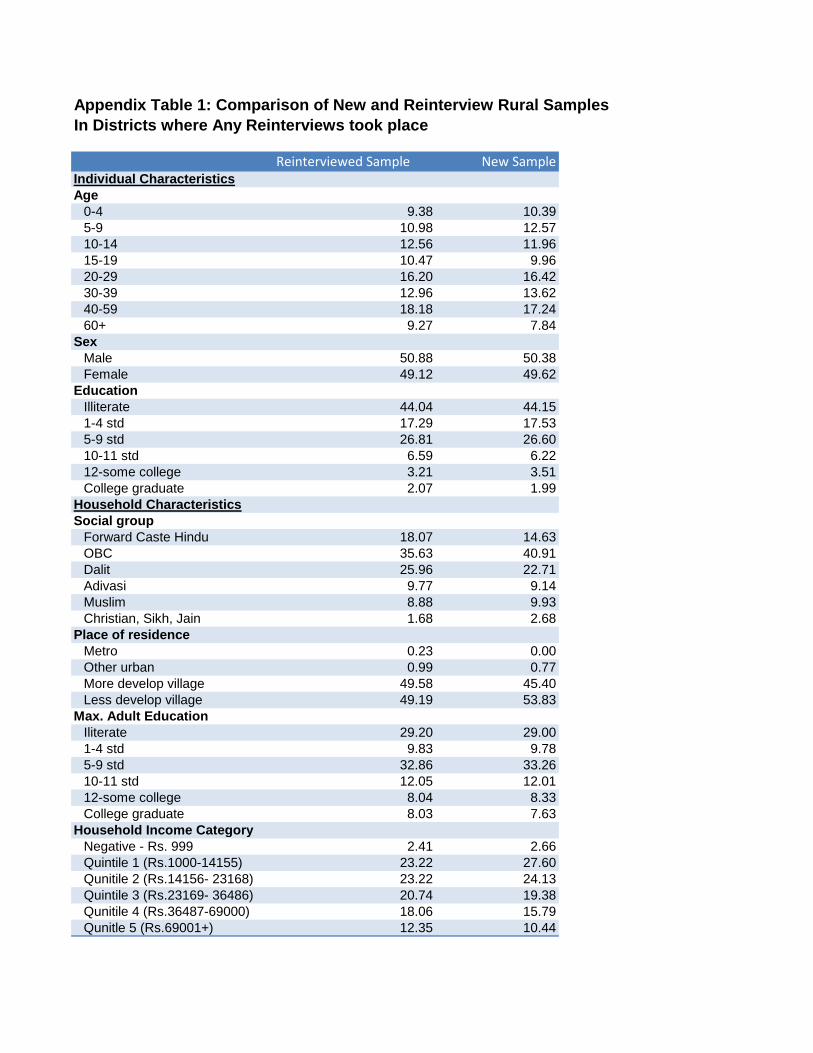
Appendix Table 1: Comparison of New and Reinterview Rural SamplesIn Districts where Any Reinterviews took place
Reinterviewed Sample New SampleIndividual CharacteristicsAge
0-4 9.38 10.395-9 10.98 12.5710-14 12.56 11.9615-19 10.47 9.9620-29 16.20 16.4230-39 12.96 13.6240-59 18.18 17.2460+ 9.27 7.84
SexMale 50.88 50.38Female 49.12 49.62
EducationIlliterate 44.04 44.151-4 std 17.29 17.535-9 std 26.81 26.6010-11 std 6.59 6.2212-some college 3.21 3.51College graduate 2.07 1.99
Household CharacteristicsSocial group
Forward Caste Hindu 18.07 14.63OBC 35.63 40.91Dalit 25.96 22.71Adivasi 9.77 9.14Muslim 8.88 9.93Christian, Sikh, Jain 1.68 2.68
Place of residenceMetro 0.23 0.00Other urban 0.99 0.77More develop village 49.58 45.40Less develop village 49.19 53.83
Max. Adult EducationIliterate 29.20 29.001-4 std 9.83 9.785-9 std 32.86 33.2610-11 std 12.05 12.0112-some college 8.04 8.33College graduate 8.03 7.63
Household Income CategoryNegative - Rs. 999 2.41 2.66Quintile 1 (Rs.1000-14155) 23.22 27.60Qunitile 2 (Rs.14156- 23168) 23.22 24.13Quintile 3 (Rs.23169- 36486) 20.74 19.38Qunitile 4 (Rs.36487-69000) 18.06 15.79Qunitle 5 (Rs.69001+) 12.35 10.44