india - ibge · india - ibge ... india
TRANSCRIPT
INDIA
INDIA 2
CONCEPTUALISATION, MEASUREMENT AND DIMENSIONALASPECTS OF POVERTY IN INDIA
by
P.D. JoshiDepartment of Statistics
India
for presentation at
Seminar on Poverty StatisticsSantiago
7-9 May 1997
INDIA 3
National Sample Survey OrganisationDepartment of Statistics, New Delhi
Abstract
This paper focuses mainly on the conceptual and measurement aspects of poverty anddescribes the methods of estimating the incidence of poverty in India. The sensitivity ofmovements in poverty to the methods used employing National Sample Survey data onconsumer expenditure as available from different rounds at the all India level separately forthe rural and urban sector has been presented for (a) judging the robustness in the pattern ofpoverty to the manner in which poverty is measured and (b) for drawing conclusion aboutprogress in poverty alleviation. Trend in relative poverty employing different inequalitymeasures has been presented. Lastly, efforts made on pilot basis for obtaining profile of thepoor utilising National Sample Survey data on consumer expenditure and identification ofpoor families through below poverty line (BPL) census have been reported.
Introduction
Poor and poverty are historical in nature and their concern appears to be as old as humanhistory. Generally, the terms are used as if their meanings are clear, but this is not so. Theword “poor” is adjectival to the word “Poverty” and is realised as economic and or socialdifference between the human beings.
A poor person is one who does not have command over or access to the basic physicalneeds like adequate food, drinking water, clothing and shelter and social needs like educationand health.
Poverty is visualised as “The state or condition of having little or no money, goods, ormeans of support or to a condition of being in want of something that is needed, desired orgenerally recognised as having value”. The meaning of poverty, therefore, not only variesfrom society to society but it also varies within the same society at different points of time.
Traditionally, poverty had been thought of in terms of relative deprivation. However, itsounds differently depending upon its context. Poverty exists in all countries and in allsocieties and has various aspects viz., lack of income, productive resources, hunger andmalnutrition, illiteracy, homelessness and inadequate housing, unsafe environment, socialdiscrimination and exclusion.
Study on the extent of poverty and a constant watch on it is therefore of great importancefor (i) direction of effort required to alleviate poverty (ii) evaluation of the success or failureof government programmes and policies and the need for modifications in them and (iii)identification of the poor.
Conceptualisation, measurement and dimensional aspects of poverty in India
INDIA 4
In a developing country like India, the problems of assessing the incidence of poverty areenormous, primarily because poverty is a multi-dimensional concept and the extent ofpoverty differs from one part of the country to the other. No single symptom of poverty canbe relied upon for getting a realistic idea of the true incidence of poverty.
Conceptual and Measurement Approach
Poverty many be measured either in relative or in absolute terms depending upon whetherit is related to the relative or the absolute concept of deprivation. This involves someelement of arbitrariness for making it operational. The arbitrariness comes in determining“need” and in specifying the irreducible level of each need. In the absolute concept someabsolute norm of income or consumption which determines the cut-off point or the line ofdemarcation between the poor and the non poor are laid down and all persons belowdemarcation line are considered as poor. The concept of relative poverty is related toinequality. Thus, whereas an absolute -poverty view point defines poverty as the inability ofan individual’s income to meet the subsistence needs, a relativist view point defines povertyas a situation in which an individual’s income is low relative to some social standard.
Poverty reflects the deficiencies in the essential requirements of individuals. It refers to asituation in which the overall needs of an individual are not satisfied due to lack of adequatepurchasing power. Monetary cut-off therefore could be fixed in terms of income orexpenditure. Certainly, per capita income indicates the purchasing power of person but theindividual utility depends on consumption expenditure. There is no consensus on thedefinition of poverty in India in terms of minimum per capita per month income. Reliableincome data at the household level is not available as may be seen in Joshi (1996a). Further,income (even after correcting for prices) measures the potential consumption of thehousehold or the individual. Poverty is not directly associated with regular cash incomeflow. On the other hand it is associated with the actual consumption of the individual orhousehold. Consequently, expenditure is more immediate proxy measure than income.Further, income may be generated by individuals but the consumption is shared among themember of the household. It is unlikely that the household will be poor but not theindividuals in it. Moreover, expenditure is more stable over time and probably reflects thepermanent income of the household. Also, for the agricultural and other self employedhouseholds, it is broadly easier to recall expenditure. On the other side, income fluctuatesaccording to season. Actual consumption expenditure determines the living standard and isnot always met wholly out of current income and can also come from assets, debt and dis-savings. Thus, consumption expenditure is considered to be more appropriate and relevantthan income for the purpose of directional idea on the level of poverty. The procedurefollowed is to define or fix a poverty line in terms of overall monthly per capita consumptionexpenditure, to update the same over time for price change employing price deflator andfinally the dimension of poverty in absolute terms utilising the size distribution of ConsumerExpenditure.
INDIA 5
Several criteria may be used to define the Poverty Line. Important among them include:
i. the proportion of expenditure taken up by specified essential items.ii. the Calorie value of food.iii. the cost of balanced diet.iv. the cost of essentials of a tolerable human existence.
The poverty line determined on the basis of first two criteria is independent of prices andhence comparable over time and space which is not the case with the last two ways of settingthe poverty line. Again the monetary cut-off could be explicitly fixed in terms of calorieintake or in terms of balanced diet.
The available literature shows that the definition of poverty line has been viewed from twoangles viz., the minimum level of living i.e. the cost of bundle of goods at the relevant pricesand the inadequacy in food consumption expressed as the shortage of necessary energyintake in terms of nutritional requirement for healthy living. Given a “balanced” or“minimum” diet, the poverty line may be defined as that expenditure level at whichhouseholds, on an average seem to have the specified diet which is not easy in practice tofollow item by item. Further the cost of the specified diet as poverty line based on valuejudgement may not necessarily confirm to its prescribed composition. However, it onlyensures amount of spending enough to provide balanced diet and it is by no means certainthat balanced diet are purchased and consumed.
Poverty needs to be identified with deficiency in the total level of living which not onlyincludes energy requirement but also balanced diet needed for health and the other basicneeds essential for human existence at a tolerable level which would be difficult to define interms of specified quantities and services.
In India, the derivation of the minimum normative absolute living standard in terms of percapita total expenditure (PCTE) or the absolute poverty line has also been focused from twoalternative approaches viz., different descriptions of the minimum normative food basket andthe calorie norm. However, there is no optimal diet and there is very little correlationbetween prices and calorie content of different food items as food habits of differentindividuals differ considerably.
Statistical Dimensions
The statistical dimension of poverty measured in terms of both absolute and relativeemploying expenditure approach have been focused from time to time by the national andinternational organisations, government bodies, social scientists, economists and researchersin their individual capacities. But these studies are based on different concepts of povertyline, different methods of estimation and measurement indicators. There has been adifference of opinion on the conceptualisation and measurement of poverty and in turn on theways of setting the poverty line. The variations in conceptualisation and measurementapproaches in defining the poverty line for a geographical area affects the spatial and inter
INDIA 6
temporal comparison in regard to incidence of poverty. One should therefore be very carefulwhile presenting data on incidence of poverty as the methodology and data used by differentagencies/organisations are diverse.
The concepts, measurement and methodological issues relating to estimating of poverty inthe Indian Context have been debated by a number of distinguished groups on the subjectviz., Working Group (1962), Task Force (1979), Study Group (1984), Expert Group (1993)set up by the Government and also individual researchers. We, therefore present the changesin methodology of poverty estimates employing Head Count Ratio (HCR) and its implicationunder official and individual approaches. The sensitivity analysis on different measures ofpoverty has been presented in Joshi (1997).
Official Source
Concepts, methodologies and dimensions
Officially, the estimates of poverty are worked out by Planning Commission (PC), anofficial agency of the Government of India. Accordingly, the first attempt for ensuring aminimum standard of living was made in 1962 through a Seminar on “Some Aspects ofPlanning and a Study Group” on the subject. The group recommended:
“(i) The national minimum for each household of five persons (4 adult consumption units)should be not less than Rs.100 per month in terms of 1960-61 prices or Rs.20 per capita permonth. For urban areas, this figure will have to be raised to Rs.125 per month per householdor Rs.25 per capita to cover the higher prices of the physical volume of commodities onwhich the national minimum is calculated.
(ii) This national minimum excludes expenditure on health and education both of whichare expected to be provided by the state according to the Constitution and in the lightof the commitment.
(iii) An element of subsidy in urban housing will have to be included after taking Rs.10 permonth or 10 percent as the rent element payable from the proposed national minimumof Rs.100 per month.
(iv) As a first exercise the target period by which the national minimum should be attainedmay be taken as fifteen years from 1960-61 to 1975-76”.
The basis of arriving at the monetary norms and the definition of minimum level of living isnot available in published form. However a note from Planning Commission (1978) and Pant(1978) point out that the Working Group took into account the recommendations of abalanced diet made by the Nutrition Advisory Committee (NAC) of the Indian Council ofMedical Research (ICMR) in 1958 and came to hold the above view. Later, the concept ofpoverty line was introduced on the recommendation of Task Force on “Minimum Needs andEffective Consumption Demands” as may be seen in Planning Commission (1979). The
INDIA 7
contribution of the task force was to estimate daily per capita calorie requirement separatelyfor rural and urban areas on the basis of age, sex and activity specific calorie allowancerecommended by the Nutrition Expert Group (1968). Accordingly, norms of nutritionalrequirement for the rural and urban sectors were obtained as 2435 K-cal and 2095 K-calrespectively. These norms were derived by first deriving the age-sex activity specificcomposition of the rural and urban population by super imposing the census based activitypattern according to the age and sex on the projected rural and urban population.
The official approach to measurement of poverty therefore started by fixing a standard ofcalorie intake and observing the level of per capita consumption expenditure with which onthe average, this calorie intake level is associated. Thus, an allowance for non foodconsumption also exist in the construction of poverty line through not on normative basis buton a behavioural basis. The poverty line at 1973-74 (base year) prices for the rural and urbansectors were worked out as Rs.49.09 and Rs.56.64 respectively utilising National SampleSurvey data on consumer expenditure and using inverse interpolation method. This isincidentally in line with Bhattacharya, Roy Chaudhary and Joshi’s (1980) estimate on thesectoral difference to the order of 16.5%, 15.2% in cost of living with Laspeyres, Paasche’sand Fisher type indices respectively.
The poverty line so defined was updated over time by taking care of change in the pricelevels. Initially, the Wholesale price index was used to reflect the price changes for updatingthe poverty line over time and later shifted to implicit private consumption deflator fromNational Accounts Statistics for the year 1977-78 and onwards on the basis of therecommendation of a study group on “The Concept and Estimation of Poverty Line” set upby the Planning Commission (1984). In fact the recommendation of the Study Group was forthe use of a price index approximately weighted by the consumption basket of the poor as anindex for reflecting price changes relevant to the poor which was found, at that time to bevery close to implicit private consumption deflator. Further for estimation of incidence ofpoverty in term of head count ration the use of National Sample Survey (NSS) data on sizedistribution of consumer expenditure with adjustment for differences in the two sets ofestimate as available from National Accounts Statistics (NAS) and NSS was followed. Thereason behind this was to have compatibility between the two sets of data in order to ensureconsistency between the two important components of the plan model i.e. input - output table(based on NAS) and consumption sub model (based on NSS data). The procedure followedhas been to adjust the expenditure level reported by the NSS uniformally across allexpenditure classes by a factor equal to the ratio of the total private consumption expenditureobtained from the NAS to that obtained from the NSS. The old NAS series was used forderiving the adjustment factor for the estimate up to year 1983 and the new NAS series hasbeen used for the year 1987-88. The population below poverty line was thus estimated byapplying the updated poverty line to the corresponding adjusted NSS distribution ofpopulation by levels of consumption expenditure. To estimate the incidence of poverty at thestate level all India poverty line and the adjustment factor were used on the state specific NSSdistribution of population by level of consumption expenditure uniformly across the state.Planning Commission (1981) has also used the NSS 32nd round (July 1972-June 1978) dataon consumer expenditure and applied a similar procedure resulting in rural poverty line of
INDIA 8
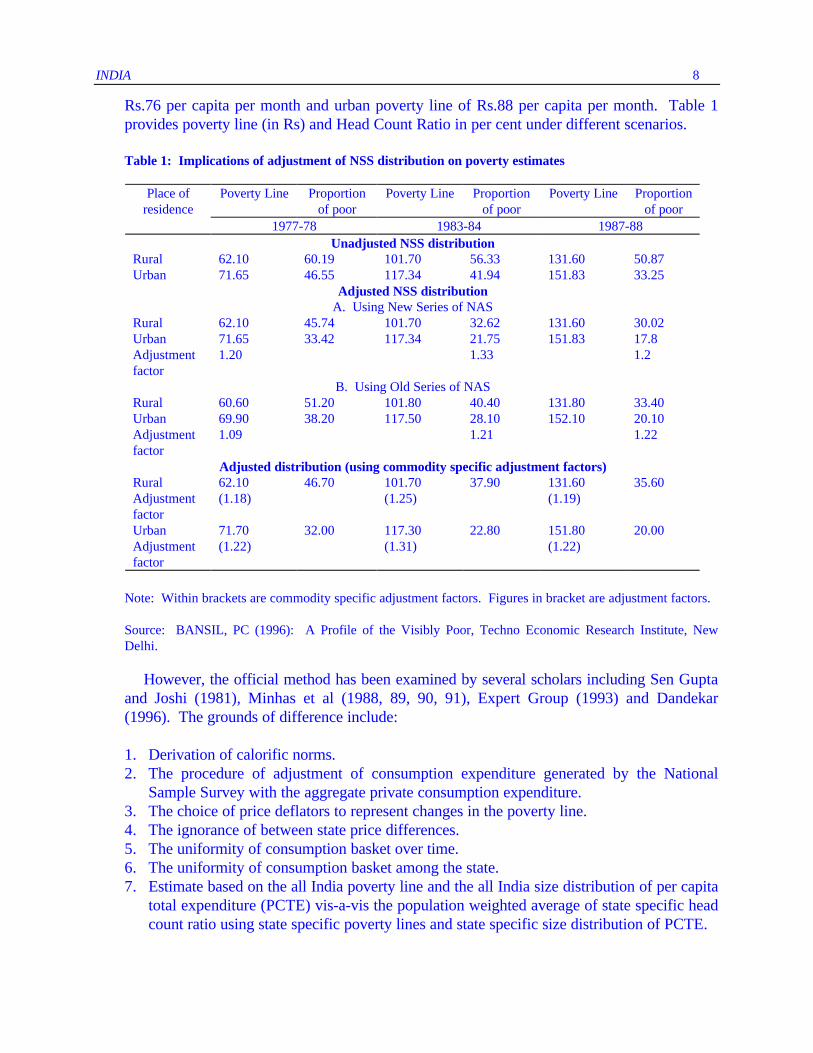
Rs.76 per capita per month and urban poverty line of Rs.88 per capita per month. Table 1provides poverty line (in Rs) and Head Count Ratio in per cent under different scenarios.
Table 1: Implications of adjustment of NSS distribution on poverty estimates
Place ofresidence
Poverty Line Proportionof poor
Poverty Line Proportionof poor
Poverty Line Proportionof poor
1977-78 1983-84 1987-88Unadjusted NSS distribution
Rural 62.10 60.19 101.70 56.33 131.60 50.87Urban 71.65 46.55 117.34 41.94 151.83 33.25
Adjusted NSS distributionA. Using New Series of NAS
Rural 62.10 45.74 101.70 32.62 131.60 30.02Urban 71.65 33.42 117.34 21.75 151.83 17.8Adjustmentfactor
1.20 1.33 1.2
B. Using Old Series of NASRural 60.60 51.20 101.80 40.40 131.80 33.40Urban 69.90 38.20 117.50 28.10 152.10 20.10Adjustmentfactor
1.09 1.21 1.22
Adjusted distribution (using commodity specific adjustment factors)Rural 62.10 46.70 101.70 37.90 131.60 35.60Adjustmentfactor
(1.18) (1.25) (1.19)
Urban 71.70 32.00 117.30 22.80 151.80 20.00Adjustmentfactor
(1.22) (1.31) (1.22)
Note: Within brackets are commodity specific adjustment factors. Figures in bracket are adjustment factors.
Source: BANSIL, PC (1996): A Profile of the Visibly Poor, Techno Economic Research Institute, NewDelhi.
However, the official method has been examined by several scholars including Sen Guptaand Joshi (1981), Minhas et al (1988, 89, 90, 91), Expert Group (1993) and Dandekar(1996). The grounds of difference include:
1. Derivation of calorific norms.2. The procedure of adjustment of consumption expenditure generated by the National
Sample Survey with the aggregate private consumption expenditure.3. The choice of price deflators to represent changes in the poverty line.4. The ignorance of between state price differences.5. The uniformity of consumption basket over time.6. The uniformity of consumption basket among the state.7. Estimate based on the all India poverty line and the all India size distribution of per capita
total expenditure (PCTE) vis-a-vis the population weighted average of state specific headcount ratio using state specific poverty lines and state specific size distribution of PCTE.
INDIA 9
The Planning Commission constituted an Expert Group in 1989 for looking themethodology of poverty estimation at national and state level and also to go in to thequestion of re-defining the poverty line. The group in their report submitted in 1993recommended
(i) Abandonment of NSS-NAS adjustment procedure.(ii) Derivation and application of state specific poverty lines as against an all India poverty line
for rural and urban areas for working out state specific poverty estimates and its aggregationto derive national level poverty estimate.
(iii) Use of state specific cost of living indices for updating the poverty line separately for ruraland urban areas.
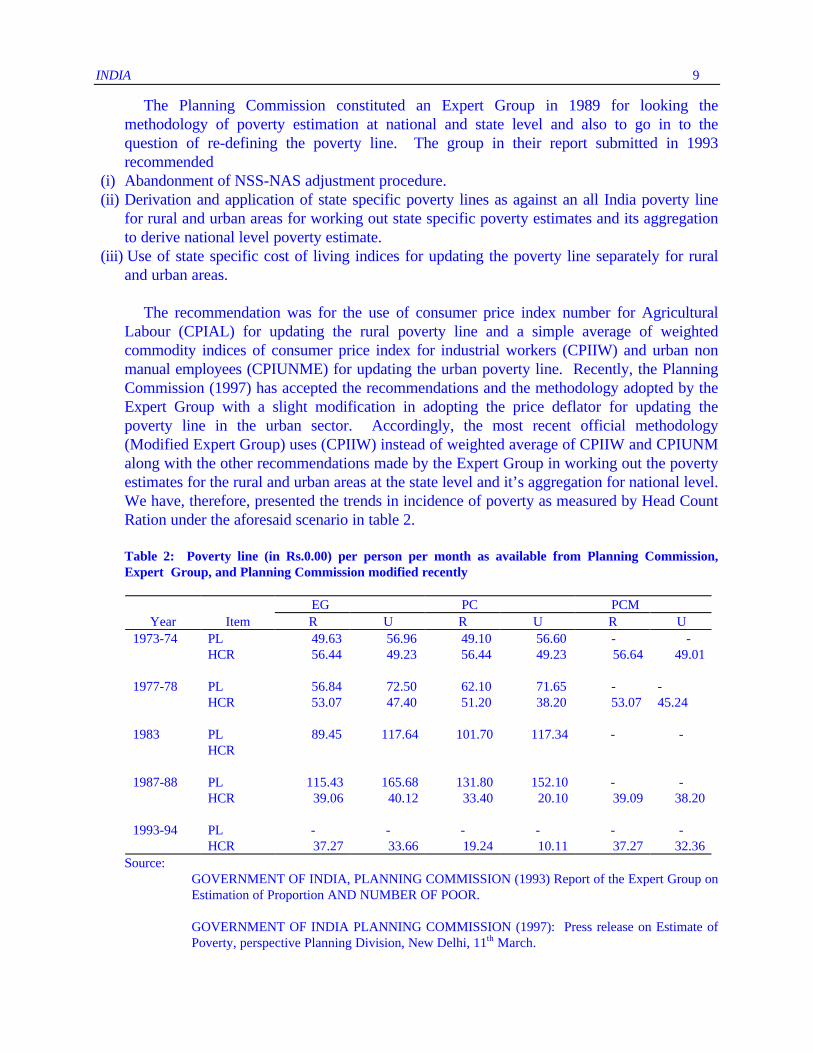
The recommendation was for the use of consumer price index number for AgriculturalLabour (CPIAL) for updating the rural poverty line and a simple average of weightedcommodity indices of consumer price index for industrial workers (CPIIW) and urban nonmanual employees (CPIUNME) for updating the urban poverty line. Recently, the PlanningCommission (1997) has accepted the recommendations and the methodology adopted by theExpert Group with a slight modification in adopting the price deflator for updating thepoverty line in the urban sector. Accordingly, the most recent official methodology(Modified Expert Group) uses (CPIIW) instead of weighted average of CPIIW and CPIUNMalong with the other recommendations made by the Expert Group in working out the povertyestimates for the rural and urban areas at the state level and it’s aggregation for national level.We have, therefore, presented the trends in incidence of poverty as measured by Head CountRation under the aforesaid scenario in table 2.
Table 2: Poverty line (in Rs.0.00) per person per month as available from Planning Commission,Expert Group, and Planning Commission modified recently
EG PC PCMYear Item R U R U R U
1973-74 PL 49.63 56.96 49.10 56.60 - -HCR 56.44 49.23 56.44 49.23 56.64 49.01
1977-78 PL 56.84 72.50 62.10 71.65 - -HCR 53.07 47.40 51.20 38.20 53.07 45.24
1983 PL 89.45 117.64 101.70 117.34 - -HCR
1987-88 PL 115.43 165.68 131.80 152.10 - -HCR 39.06 40.12 33.40 20.10 39.09 38.20
1993-94 PL - - - - - -HCR 37.27 33.66 19.24 10.11 37.27 32.36
Source:GOVERNMENT OF INDIA, PLANNING COMMISSION (1993) Report of the Expert Group onEstimation of Proportion AND NUMBER OF POOR.
GOVERNMENT OF INDIA PLANNING COMMISSION (1997): Press release on Estimate ofPoverty, perspective Planning Division, New Delhi, 11th March.
INDIA 10
Alternative source
Several studies on conceptual and measurement aspects pointing dimensional differencesin incidence of poverty have been reported as may be seen in Sen Gupta and Joshi (1981) andJoshi (1997). Important among them include Dandekar and Rath (1971), Minhas (1970,1971), Bardhan (1970, 1973, 1974), Ojha (1970), Bhatty (1974), Rudra (1974), Ahluwalia(1978), Rao (1977), Sen (1973), Srinivasan (1977), Sen Gupta and Joshi (1981).
Minhas (1970, 71) assumed the minimum level of consumption i.e. the cut-off point atRs.200 and Rs.240 per capita per annum for the base year 1960-1961 and obtained theestimated number of poor persons. Bardhan (1970) considered Rs.15 per person per monthas the minimum at 1960-61 prices. Dandekar and Rath (1971) utilised nutritional norm of2250 K.Cal for defining poverty line and the population lying below this level of expenditurewas estimated for 1960-61. Sukhatme (1977, 78) criticised the use of average nutritionalrequirement in defining the poverty line and thereby deriving the extent of poverty. Heargued for considering the minimum requirement for accounting intra individual variation incalorie requirement in defining the poverty line which has not been supported for workingout poverty estimates utilising NSS Consumer expenditure data as may be seen in Sen Guptaand Joshi (1981), Dandekar (1981, 82, 1996).
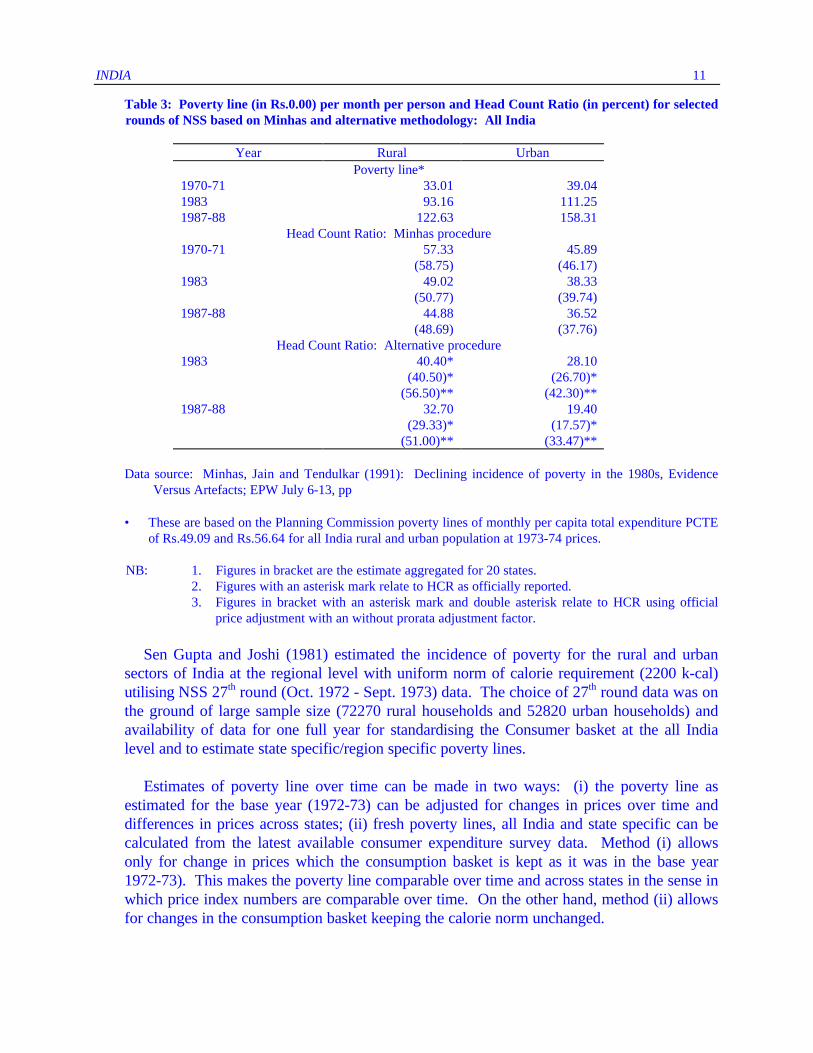
Minhas etal (1987, 89, 90, 91) constructed the cost of living indices for the middle rangeof the rural (CPIMR) and urban population (CPIMU) and applied for updating the povertyline for obtaining the Head Count Ratio. The indices relate to the periods of National SampleSurvey for the year 1970-71 to 1987-88 and are based on retail price data for two alternativeweighting diagram relating to the base year or 1970-71 and 1983. Table 3 presents povertyline per person per month and head count ratio under alternative estimation procedure.
INDIA 11
Table 3: Poverty line (in Rs.0.00) per month per person and Head Count Ratio (in percent) for selectedrounds of NSS based on Minhas and alternative methodology: All India
Year Rural UrbanPoverty line*
1970-71 33.01 39.041983 93.16 111.251987-88 122.63 158.31
Head Count Ratio: Minhas procedure1970-71 57.33 45.89
(58.75) (46.17)1983 49.02 38.33
(50.77) (39.74)1987-88 44.88 36.52
(48.69) (37.76)Head Count Ratio: Alternative procedure
1983 40.40* 28.10(40.50)* (26.70)*
(56.50)** (42.30)**1987-88 32.70 19.40
(29.33)* (17.57)*(51.00)** (33.47)**
Data source: Minhas, Jain and Tendulkar (1991): Declining incidence of poverty in the 1980s, EvidenceVersus Artefacts; EPW July 6-13, pp
• These are based on the Planning Commission poverty lines of monthly per capita total expenditure PCTEof Rs.49.09 and Rs.56.64 for all India rural and urban population at 1973-74 prices.
NB: 1. Figures in bracket are the estimate aggregated for 20 states.2. Figures with an asterisk mark relate to HCR as officially reported.3. Figures in bracket with an asterisk mark and double asterisk relate to HCR using official
price adjustment with an without prorata adjustment factor.
Sen Gupta and Joshi (1981) estimated the incidence of poverty for the rural and urbansectors of India at the regional level with uniform norm of calorie requirement (2200 k-cal)utilising NSS 27th round (Oct. 1972 - Sept. 1973) data. The choice of 27th round data was onthe ground of large sample size (72270 rural households and 52820 urban households) andavailability of data for one full year for standardising the Consumer basket at the all Indialevel and to estimate state specific/region specific poverty lines.
Estimates of poverty line over time can be made in two ways: (i) the poverty line asestimated for the base year (1972-73) can be adjusted for changes in prices over time anddifferences in prices across states; (ii) fresh poverty lines, all India and state specific can becalculated from the latest available consumer expenditure survey data. Method (i) allowsonly for change in prices which the consumption basket is kept as it was in the base year1972-73). This makes the poverty line comparable over time and across states in the sense inwhich price index numbers are comparable over time. On the other hand, method (ii) allowsfor changes in the consumption basket keeping the calorie norm unchanged.
INDIA 12
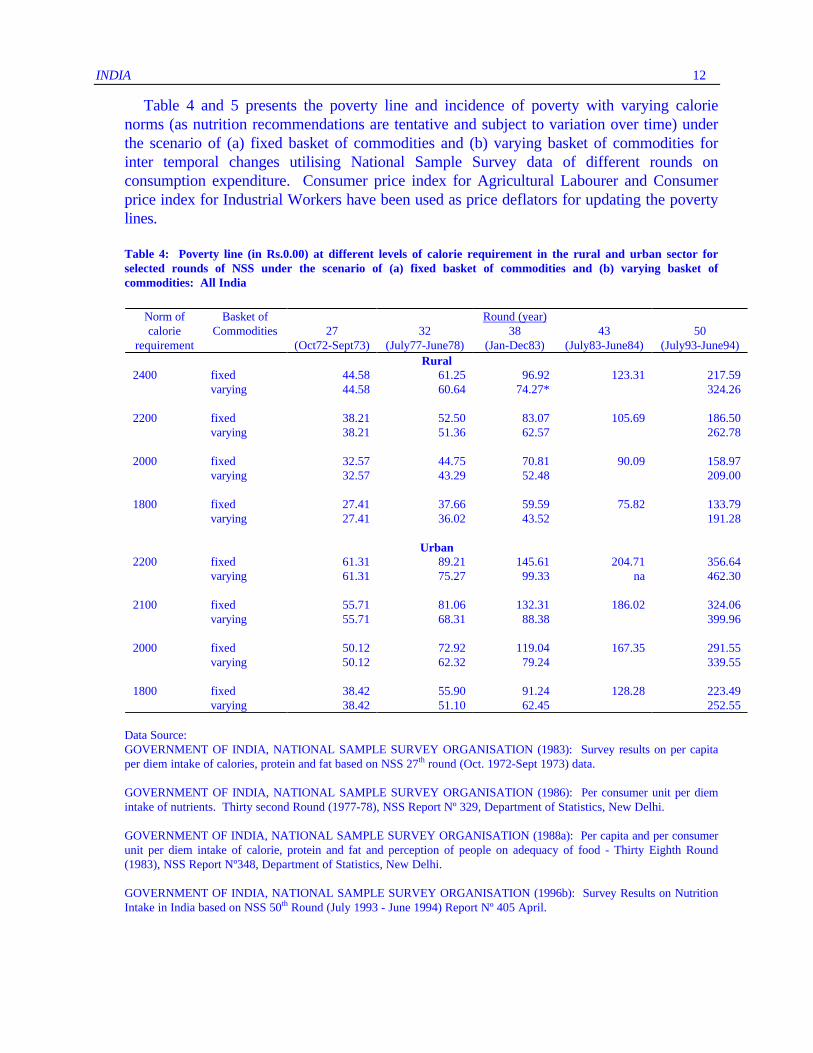
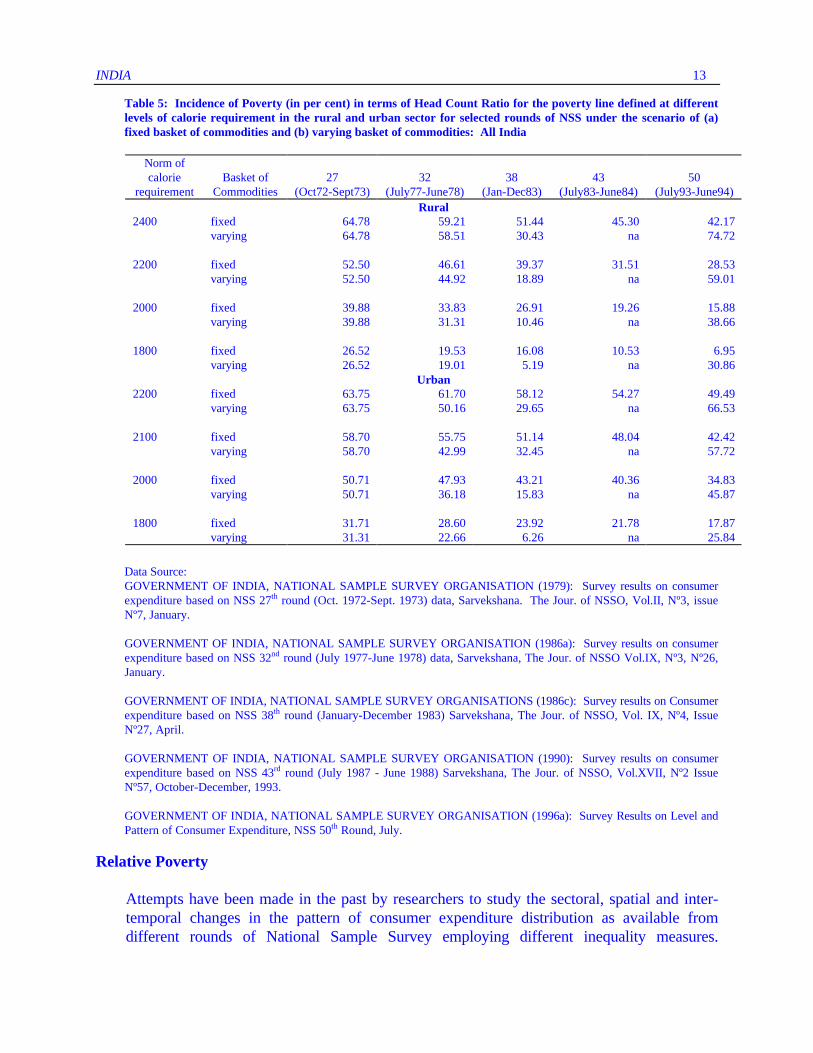
Table 4 and 5 presents the poverty line and incidence of poverty with varying calorienorms (as nutrition recommendations are tentative and subject to variation over time) underthe scenario of (a) fixed basket of commodities and (b) varying basket of commodities forinter temporal changes utilising National Sample Survey data of different rounds onconsumption expenditure. Consumer price index for Agricultural Labourer and Consumerprice index for Industrial Workers have been used as price deflators for updating the povertylines.
Table 4: Poverty line (in Rs.0.00) at different levels of calorie requirement in the rural and urban sector forselected rounds of NSS under the scenario of (a) fixed basket of commodities and (b) varying basket ofcommodities: All India
Norm ofcalorie
requirement
Basket ofCommodities 27
(Oct72-Sept73)32
(July77-June78)
Round (year)38
(Jan-Dec83)43
(July83-June84)50
(July93-June94)Rural
2400 fixed 44.58 61.25 96.92 123.31 217.59varying 44.58 60.64 74.27* 324.26
2200 fixed 38.21 52.50 83.07 105.69 186.50varying 38.21 51.36 62.57 262.78
2000 fixed 32.57 44.75 70.81 90.09 158.97varying 32.57 43.29 52.48 209.00
1800 fixed 27.41 37.66 59.59 75.82 133.79varying 27.41 36.02 43.52 191.28
Urban2200 fixed 61.31 89.21 145.61 204.71 356.64
varying 61.31 75.27 99.33 na 462.30
2100 fixed 55.71 81.06 132.31 186.02 324.06varying 55.71 68.31 88.38 399.96
2000 fixed 50.12 72.92 119.04 167.35 291.55varying 50.12 62.32 79.24 339.55
1800 fixed 38.42 55.90 91.24 128.28 223.49varying 38.42 51.10 62.45 252.55
Data Source:GOVERNMENT OF INDIA, NATIONAL SAMPLE SURVEY ORGANISATION (1983): Survey results on per capitaper diem intake of calories, protein and fat based on NSS 27th round (Oct. 1972-Sept 1973) data.
GOVERNMENT OF INDIA, NATIONAL SAMPLE SURVEY ORGANISATION (1986): Per consumer unit per diemintake of nutrients. Thirty second Round (1977-78), NSS Report Nº 329, Department of Statistics, New Delhi.
GOVERNMENT OF INDIA, NATIONAL SAMPLE SURVEY ORGANISATION (1988a): Per capita and per consumerunit per diem intake of calorie, protein and fat and perception of people on adequacy of food - Thirty Eighth Round(1983), NSS Report Nº348, Department of Statistics, New Delhi.
GOVERNMENT OF INDIA, NATIONAL SAMPLE SURVEY ORGANISATION (1996b): Survey Results on NutritionIntake in India based on NSS 50th Round (July 1993 - June 1994) Report Nº 405 April.
INDIA 13
Table 5: Incidence of Poverty (in per cent) in terms of Head Count Ratio for the poverty line defined at differentlevels of calorie requirement in the rural and urban sector for selected rounds of NSS under the scenario of (a)fixed basket of commodities and (b) varying basket of commodities: All India
Norm ofcalorie
requirementBasket of
Commodities27
(Oct72-Sept73)32
(July77-June78)38
(Jan-Dec83)43
(July83-June84)50
(July93-June94)Rural
2400 fixed 64.78 59.21 51.44 45.30 42.17varying 64.78 58.51 30.43 na 74.72
2200 fixed 52.50 46.61 39.37 31.51 28.53varying 52.50 44.92 18.89 na 59.01
2000 fixed 39.88 33.83 26.91 19.26 15.88varying 39.88 31.31 10.46 na 38.66
1800 fixed 26.52 19.53 16.08 10.53 6.95varying 26.52 19.01 5.19 na 30.86
Urban2200 fixed 63.75 61.70 58.12 54.27 49.49
varying 63.75 50.16 29.65 na 66.53
2100 fixed 58.70 55.75 51.14 48.04 42.42varying 58.70 42.99 32.45 na 57.72
2000 fixed 50.71 47.93 43.21 40.36 34.83varying 50.71 36.18 15.83 na 45.87
1800 fixed 31.71 28.60 23.92 21.78 17.87varying 31.31 22.66 6.26 na 25.84
Data Source:GOVERNMENT OF INDIA, NATIONAL SAMPLE SURVEY ORGANISATION (1979): Survey results on consumerexpenditure based on NSS 27th round (Oct. 1972-Sept. 1973) data, Sarvekshana. The Jour. of NSSO, Vol.II, Nº3, issueNº7, January.
GOVERNMENT OF INDIA, NATIONAL SAMPLE SURVEY ORGANISATION (1986a): Survey results on consumerexpenditure based on NSS 32nd round (July 1977-June 1978) data, Sarvekshana, The Jour. of NSSO Vol.IX, Nº3, Nº26,January.
GOVERNMENT OF INDIA, NATIONAL SAMPLE SURVEY ORGANISATIONS (1986c): Survey results on Consumerexpenditure based on NSS 38th round (January-December 1983) Sarvekshana, The Jour. of NSSO, Vol. IX, Nº4, IssueNº27, April.
GOVERNMENT OF INDIA, NATIONAL SAMPLE SURVEY ORGANISATION (1990): Survey results on consumerexpenditure based on NSS 43rd round (July 1987 - June 1988) Sarvekshana, The Jour. of NSSO, Vol.XVII, Nº2 IssueNº57, October-December, 1993.
GOVERNMENT OF INDIA, NATIONAL SAMPLE SURVEY ORGANISATION (1996a): Survey Results on Level andPattern of Consumer Expenditure, NSS 50th Round, July.
Relative Poverty
Attempts have been made in the past by researchers to study the sectoral, spatial and inter-temporal changes in the pattern of consumer expenditure distribution as available fromdifferent rounds of National Sample Survey employing different inequality measures.
INDIA 14
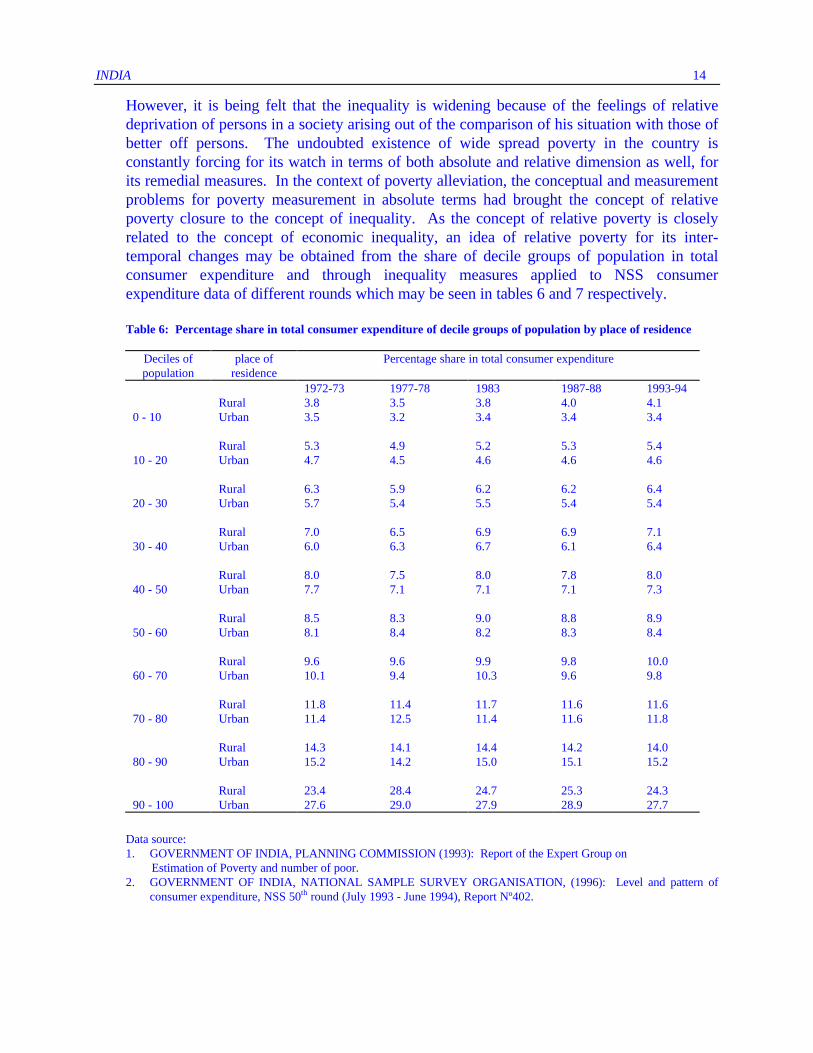
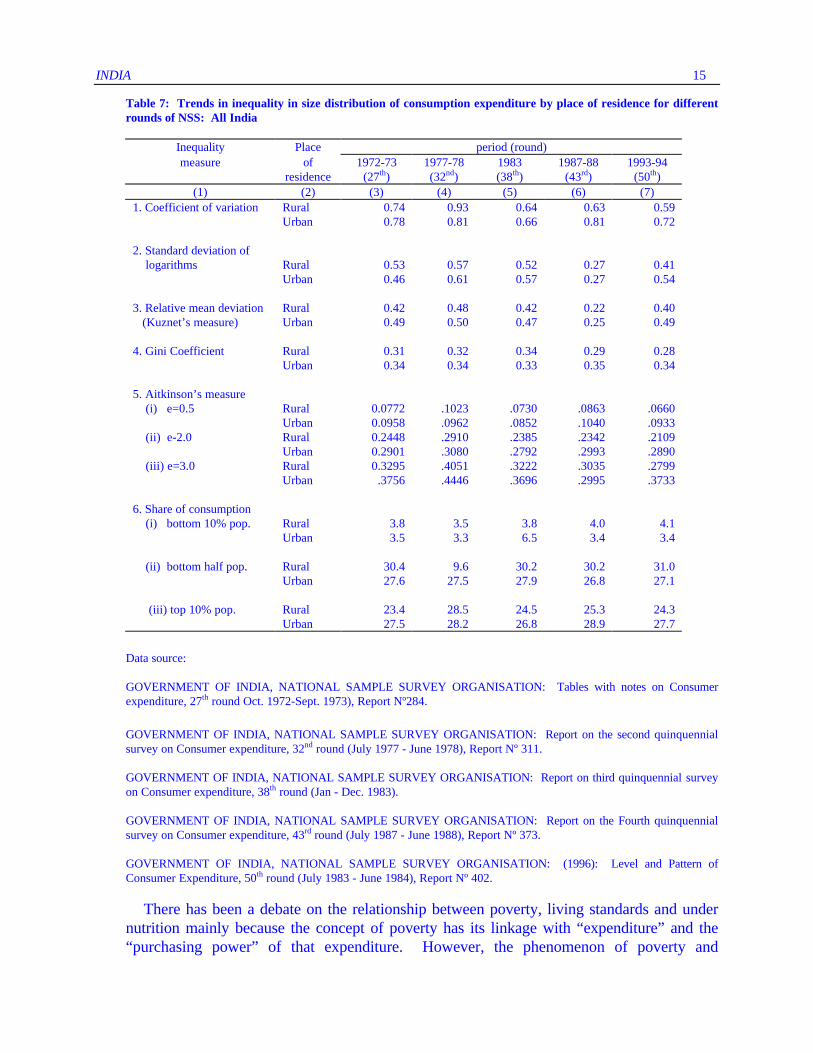
However, it is being felt that the inequality is widening because of the feelings of relativedeprivation of persons in a society arising out of the comparison of his situation with those ofbetter off persons. The undoubted existence of wide spread poverty in the country isconstantly forcing for its watch in terms of both absolute and relative dimension as well, forits remedial measures. In the context of poverty alleviation, the conceptual and measurementproblems for poverty measurement in absolute terms had brought the concept of relativepoverty closure to the concept of inequality. As the concept of relative poverty is closelyrelated to the concept of economic inequality, an idea of relative poverty for its inter-temporal changes may be obtained from the share of decile groups of population in totalconsumer expenditure and through inequality measures applied to NSS consumerexpenditure data of different rounds which may be seen in tables 6 and 7 respectively.
Table 6: Percentage share in total consumer expenditure of decile groups of population by place of residence
Deciles ofpopulation
place ofresidence
Percentage share in total consumer expenditure
1972-73 1977-78 1983 1987-88 1993-94Rural 3.8 3.5 3.8 4.0 4.1
0 - 10 Urban 3.5 3.2 3.4 3.4 3.4
Rural 5.3 4.9 5.2 5.3 5.410 - 20 Urban 4.7 4.5 4.6 4.6 4.6
Rural 6.3 5.9 6.2 6.2 6.420 - 30 Urban 5.7 5.4 5.5 5.4 5.4
Rural 7.0 6.5 6.9 6.9 7.130 - 40 Urban 6.0 6.3 6.7 6.1 6.4
Rural 8.0 7.5 8.0 7.8 8.040 - 50 Urban 7.7 7.1 7.1 7.1 7.3
Rural 8.5 8.3 9.0 8.8 8.950 - 60 Urban 8.1 8.4 8.2 8.3 8.4
Rural 9.6 9.6 9.9 9.8 10.060 - 70 Urban 10.1 9.4 10.3 9.6 9.8
Rural 11.8 11.4 11.7 11.6 11.670 - 80 Urban 11.4 12.5 11.4 11.6 11.8
Rural 14.3 14.1 14.4 14.2 14.080 - 90 Urban 15.2 14.2 15.0 15.1 15.2
Rural 23.4 28.4 24.7 25.3 24.390 - 100 Urban 27.6 29.0 27.9 28.9 27.7
Data source:1. GOVERNMENT OF INDIA, PLANNING COMMISSION (1993): Report of the Expert Group on
Estimation of Poverty and number of poor.2. GOVERNMENT OF INDIA, NATIONAL SAMPLE SURVEY ORGANISATION, (1996): Level and pattern of
consumer expenditure, NSS 50th round (July 1993 - June 1994), Report Nº402.
INDIA 15
Table 7: Trends in inequality in size distribution of consumption expenditure by place of residence for differentrounds of NSS: All India
Inequality Place period (round)measure of 1972-73 1977-78 1983 1987-88 1993-94
residence (27th) (32nd) (38th) (43rd) (50th)(1) (2) (3) (4) (5) (6) (7)
1. Coefficient of variation Rural 0.74 0.93 0.64 0.63 0.59Urban 0.78 0.81 0.66 0.81 0.72
2. Standard deviation of logarithms Rural 0.53 0.57 0.52 0.27 0.41
Urban 0.46 0.61 0.57 0.27 0.54
3. Relative mean deviation Rural 0.42 0.48 0.42 0.22 0.40 (Kuznet’s measure) Urban 0.49 0.50 0.47 0.25 0.49
4. Gini Coefficient Rural 0.31 0.32 0.34 0.29 0.28Urban 0.34 0.34 0.33 0.35 0.34
5. Aitkinson’s measure (i) e=0.5 Rural 0.0772 .1023 .0730 .0863 .0660
Urban 0.0958 .0962 .0852 .1040 .0933 (ii) e-2.0 Rural 0.2448 .2910 .2385 .2342 .2109
Urban 0.2901 .3080 .2792 .2993 .2890 (iii) e=3.0 Rural 0.3295 .4051 .3222 .3035 .2799
Urban .3756 .4446 .3696 .2995 .3733
6. Share of consumption (i) bottom 10% pop. Rural 3.8 3.5 3.8 4.0 4.1
Urban 3.5 3.3 6.5 3.4 3.4
(ii) bottom half pop. Rural 30.4 9.6 30.2 30.2 31.0Urban 27.6 27.5 27.9 26.8 27.1
(iii) top 10% pop. Rural 23.4 28.5 24.5 25.3 24.3Urban 27.5 28.2 26.8 28.9 27.7
Data source:
GOVERNMENT OF INDIA, NATIONAL SAMPLE SURVEY ORGANISATION: Tables with notes on Consumerexpenditure, 27th round Oct. 1972-Sept. 1973), Report Nº284.
GOVERNMENT OF INDIA, NATIONAL SAMPLE SURVEY ORGANISATION: Report on the second quinquennialsurvey on Consumer expenditure, 32nd round (July 1977 - June 1978), Report Nº 311.
GOVERNMENT OF INDIA, NATIONAL SAMPLE SURVEY ORGANISATION: Report on third quinquennial surveyon Consumer expenditure, 38th round (Jan - Dec. 1983).
GOVERNMENT OF INDIA, NATIONAL SAMPLE SURVEY ORGANISATION: Report on the Fourth quinquennialsurvey on Consumer expenditure, 43rd round (July 1987 - June 1988), Report Nº 373.
GOVERNMENT OF INDIA, NATIONAL SAMPLE SURVEY ORGANISATION: (1996): Level and Pattern ofConsumer Expenditure, 50th round (July 1983 - June 1984), Report Nº 402.
There has been a debate on the relationship between poverty, living standards and undernutrition mainly because the concept of poverty has its linkage with “expenditure” and the“purchasing power” of that expenditure. However, the phenomenon of poverty and
INDIA 16
phenomenon of under nutrition are not the same. Depending upon the consumer behaviourof different households, some households even with relatively low income are able to providethemselves with adequate nutrition while the some had income but do not do so because ofignorance and improvidence. The definition of calorie based poverty line rests on theargument that consumer behaviour varies from household to household and therefore anexpenditure level at which actual data show that on an average a household with that level ofconsumption expenditure providing adequate nutrition to its members may be chosen asadequate calorie intake. Usually adequate calorie intake also insures adequate supply ofother nutrients. It is being argued that the concept of poverty needs to be broadened anddelinked with the concept of food poverty from poverty in general. This is possible byobservable characteristics and may be checked through socio-economic parameters as manyof the parameters are not dependent on the individual viz. social group, principal occupationof the household etc. Further the cash out flows incurred by the household on health,education and housing gets birth to some extent in the concept of poverty line but theconcept of free and subsidised goods and services such as water, sanitation, health andeducation provided by the Government and/or charitable institutions do not get reflected inthe concept of poverty line. The reason being that the elements of living environment such ashealth services, education, drinking water, access to transportation, communication andinformation, which contribute significantly to social and human development, cannot bequantified.
Expectation of a society changes with the passage of time and therefore inter temporalcomparison or comparison between different societies will not be valid if poverty is thoughtof in terms of relative deprivation defined with reference to some average expectation ofsociety.
Let us now look in to the problem. The first question is why should there be an attempt todetermine a poverty line and to estimate the population below the poverty line? In a welfarestate, it is always and should always be a matter of great concern if a large chunck of thepopulation remains under nourished. The population of a country is not only a consumingmass but it is also a productive asset. Hence there should be a continuous watch with a viewto maintain the quality of the population. We have seen that the population estimate belowthe poverty line is quite high in India. so the question naturally arises whether any furthersophistication is immediately needed for relatively more precise and objective definition ofpoverty line compared to the on going concept which has several advantages:
1. It is a well defined indicator and can be determined on more or less objective basis.2. Nutrition is the basic need which has to be met by the household itself, hence facilities are
needed to identify the households or the population not being able to meet thatrequirement.
3. The specific advantage with the method is that the estimate are based directly on thequantity of various food articles, hence the inter regional variations can be directlymeasured (in money terms however the poverty line may differ in different regionsbecause of the existence of price differential).
INDIA 17
4. It takes into account the money value required to purchase the food items for meeting therecommended energy level with the experience on other non food items.
5. Moreover, in a consumer expenditure survey, the expenditure on food and non fooditems are collected and hence it is possible to determine the total household expenditureand also the expenditure on non food items at the critical level of nutritional intakesdefining the poverty line. Thus, there is a built in provision to get a dimensional ideaabout the consumption expenditure incurred on non food items.
6. Whereas there is scientific basis for deriving the minimum basic need for food, there ishardly any method to determine the norms for the non food items. Clothing is a basicneed but what should be the minimum requirement of clothing is anybody’s guess. Itdepends upon the quality of the cloth, climatic condition of the place of living, workingstatus of the person, the society in which the person lives and so on. All these factorscomplicate the situation making it all the more difficult for evaluation of the minimumrequirement of the basic need.
Thus, in the absence of any other suitable life index and looking towards the limitations ofNSS data on consumer expenditure, the poverty line approach using available NSS data fordetermining the extent of poverty may be considered as the best one.
Identification of Poor
Official Approach
In the context of poverty alleviation programme in India, the official approach foridentification of poor and the allocation of funds to the state Government under social sectordevelopment scheme, rests on Below Poverty Line (BPL) Surveys (actually census) in therural sector and the official estimate of poverty. BPL census is being conducted by the stateas per guidelines given by the centre which involves a cut-off point of an annual householdincome equivalent to expenditure per family for segregating the families (a) above povertyline and (b) below poverty line classified in to four categories viz., destitute; very very poor,very poor and poor.
The procedure adopted is as under:
i. The priority list of poor families is prepared by Block Development Officer (BDO) givingspecial emphasis to outlying hamlets, women headed households and nomadic families.
ii. The said list is then placed for approval in the meeting of the village assembly (GramSabha). This meeting is convened by BDO giving sufficient publicity through localmeans.
iii. The village assembly is attended by local people, non officials, Blocks Officers and BankOfficers. Prominent voluntary action groups etc. are also associated with these meetings.
iv. The list of beneficiaries selected at this village assembly is displayed on the notice boardof the village Panchayat and Block office. Sufficient time is given for filling objections.In case of any dispute regarding any name in the list it is decided by the Project Directorin consultation with BDO.
INDIA 18
v. The list of beneficiaries finally selected (master list) is got printed block wise by theProgramme Implementation authorities and copies are made available to the field staff,block officials, bank and other concerned authorities.
This approach has posed serious questions in the identification of poor from the point ofproblems associated with the ascertainment of annual income of household which is knownto be extremely difficult for many types of (rural) households. Even today, the NSSorganisation has not evolved a satisfactory methodology for conducting household incomesurvey in the country as may be seen in Joshi (1996a). Further the approach followed sufferfrom the point of widely varying household size and inherent bias of the respondents in givinginformation which would enable them to obtain the prescribed benefit. Much of the suchclassification of households are likely therefore, to arrive through a neglect of prescribedprocedure, perception of the methodology used for estimation purposes, survey design andnature of data collected resulting in favour of non poor households for assistance under theprogramme. Attempts are therefore being made for including information on severalidentification variables for inclusion/exclusion criterion and also on consumption expenditurefor launching a fresh BPL census in the rural sector.
Another approach for identification of poor households followed on pilot basis in the stateof West Bengal as reported in Rudra etal (1994) included canvassing of two sets ofschedules, one on “Household Expenditure” and the other on “Fulfilment of Basic Needs”.The survey was conducted in the rural areas or 5 districts (19 villages) covering four regionsduring June 1990 - May 1991. Out of 4 regions covered in the surveys, the two regions werecomprised of mainly non tribal cultivation based communities. The other two regions werecomprised of partly hilly with some tribals and many tribals dependent on the forest. Goodrepresentation of households belonging to different social groups was ensured. The samplewas drawn with a view to take in to account the various environmental, socio-economic andcultural factors. The Complete list of all households residing in each sample village wasprepared and the non poor households were eliminated using several criteria viz., thepossession of a pucca (well built) residential house, more than one set of plough, electricity inthe house, etc. Finally, the sample households were chosen from the remaining households -the relatively poor households - separately for each village by circular systematic sampling inthe form of two independent and interpenetrating sub samples. The total number ofhouseholds, the number of relatively poor households and the number of households selectedwere 2598; 987 and 632 respectively.
Information through questionnaire approach in the forms of Yes/No were obtained fromthe basic needs enquiry viz..,
1. Consumption of meat, fish and egg during last month.2. Nº of bedrooms (<1) per family.3. Room height (<1.68 meters).4. Adequacy of dwelling for protection against room shows.5. Woolen garments in the household.6. Nº of woolen garments (<1) per person.

INDIA 19
7. Number of saris or similar garments (<2) per adult female.8. Matresses in the bedding.9. Lack of blankets, quilts in the households.10. Nº of dining plates (<1) per adult member.11. School education for child of age group 6-14.12. Availability of two squares meals a day through out the last year and if not, whether the
number of months when they did not get this was >2.13. Availability of milk every day for children in the age group (0-4).14. Member of household engaged in begging.15. Availability of special food before and after delivery for female member who conceived
during last three years.16. Whether or not the household procured food items as gift or loan from some other
household during last month.17. Whether or not the household usually obtained food items by free collection from months
or from land belonging to other.
The above 17 poverty indicators were closely related. The households were assigned bythe deprivation score and simple criteria based on pragmatic consideration was followed forthe 1st, 2nd and 3rd level of poverty.
The first level of poverty was defined as ultra poor on the basis of non meeting of at leastone of the following three criteria.
1. Availability of two squares meals a day for more than two months during the last 365days.
2. Availability of saris or similar garments per adult female in the housing falling short of 2.3. Member of household reporting begging.
The second level of poverty was arrived by classifying few indicators and deprivationscore of identified indicators were obtained for households which did not have two squaremeals a day by number of months. The second level of poverty included the households withdeprivation score 4 or more and the number of months without two square meals a day was2. The third level of poverty was defined by deprivation score of 1-3 and the number ofmonths without two square meals a day was 0 or 1.
Other Approaches
Recently Bansil (1996) has made a study sponsored by Planning Commission, an officialagency of the Government of India, on “Profile of the Visibly Poor” utilising the informationon characteristics of households as available from the Household Consumption ExpenditureSurvey (HCES) conducted by National Sample Survey Organisation (NSSO) in its 43rd round(July 1987 - June 1988) for the purpose of identification of poor in formulating appropriatepolicies in the context of poverty alleviation.
INDIA 20
The study has been carried out at the regional level for the rural and urban areas in threestates viz., Bihar, Maharashtra and Himachal Pradesh. These states were chosen on theground of varying levels of development and poverty. The study is based on 24characteristics viz., Caste, Religion, Activity, Sex, Family Size, House, type of dwelling, typeof house, floor type, condition of house, source of energy, source of high living, milkanimals, draught animals, land, land possessed categories, crops grown, income source,member working on public work, assistance during the last 5 years under IRDP, householdpurchases from rationshop, consumption of alcoholic beverages, consumption of fruits andjourney undertaken in last 30 days. In all 17 items in the rural sector and 12 items in theurban sector were identified.
The available items of information was analysed for bottom and top 20 percent ofhouseholds ranked by monthly per capita household total expenditure and the contrast hasbeen measured in terms of ratio and the difference from the mean. Accordingly, two indicesviz., Indicator Ratio (IR) and Distance Index (DI) were computed. Indicator Ratio (IR) wasdefined as the ratio for the indicator of the bottom two deciles and top two deciles expressedin percent. Distance Index was defined as the ratio of the distance of the value of two topand bottom deciles from the mean value expressed in percent. The higher value of theseindices have been attributed for higher prevalence of that attribute among the poor ascompared to the non poor and vice versa. For the state studied, the values of (1) IR greaterthan 130 and less than 70 (ii) DR greater than 150 and less than 75 were considered criterionfor inclusion and exclusion of indicator respectively.
INDIA 21
Bibliography
AHLUWALIA. M.S. (1976): Inequality, poverty and Development. Journal ofDevelopment Economics. Vol.3. Nº3.
AHLUWALIA, M.S. (1978a): Rural Poverty in India: 1756-57 to 1973-74 in India:Occasional Papers. Staff Working Paper. Washington, D.C., World Bank, pp 1-92.
AHLUWALIA, M.S. (1978b): Rural poverty and Agricultural Performance in India. Journalof Development Studies, 14, 298-323.
AHLUWALIA, M.S., CARTER N.G. AND CHENERY, H.B. (1979): Growth and Povertyin developing countries. Journal of Development Economics vol. 6. pp 349-361.
AITKINSON, A.B. (1970): On the Measurement of Inequality. Journal of EconomicTheory. Vol. 2. pp 244-263.
AITKINSON, A.B. (1975): The Economics of Inequality, Oxford University Press.
AITKINSON, A.B. (1991): Comparing poverty rates internationally: lesson from recentstudies in developed countries. World Bank Economic Review, 5: 3-22.
AITKINSON, A.B. (1992): Measuring Poverty and Differences in Family, EconomicResearch Institute, New Delhi.
BANSIL, P.C. (1996): A Profile of the Visibly Poor, Techno Economic Research Institute,New Delhi.
BARDHAN, P.K. AND SRINIVASAN, T.N. (1971): Income Distribution. Pattern Trendsand Policies, E.P.W. April 24. Vol. VI.
BARDHAN P.K. (1970): On The Minimum Level of Living and The Rural Poor IndianEconomic Review. Vol. 5. Nº 1.
BARDHAN, P.K. (1973): “On the Incidence of Rural Poverty in Rural India in the Sixties”,Economic and Political WEEKLY, ANNUAL Nº 8, 245-255.
BARDHAN, P.K. (1974), “Pattern of Income Distribution in India, a Review”, Sankhaya,Series-C. 36. 103-138.
BARDHAN, P.K. (1976): Poverty and trickle down in Rural India - A Quantitative Analysisin J.W. Mellor and M. Desai (eds) Agricultural Change and rural poverty variationson a theme by Dharam Narayan. Oxford University press.
INDIA 22
BHATTACHARYA, S.S., A.B. ROY CHOUDHURY AND P.D. JOSHI (1980): RegionalConsumer price indices based on NSS Household Expenditure Data, SarvekshanaVol. 3, Nº4: pp 107-12.
BHATTY, I.Z. (1974): Inequality and poverty in rural India in Poverty and IncomeDistribution in India (eds.) T.N. Srinivasan and P.K. Bardhan. Statistical PublishingSociety. Calcutta.
CHATTORPADHYAY. M., BHATTACHARYA, N. AND RUDRA, A. (1988): Changes inlevel of Living in Rural West Bengal: Variations Across Socio-Economic Groups.Economic and Political Weekly.
DANDEKAR, V.M. AND N. RATH, 1971: Poverty in India, Indian School of PoliticalEconomy. Pune. First published in Economic and Political Weekly. Vol. 6 Nos. 1 &2 and 9. January 1971. Bombay.
DANDEKAR, V.M. (1981): On Measurement of Poverty, EPW, Vol. XVI. Nº30 July 25.pp 1241-1250.
DANDEKAR, V.M. (1982): On Measurement of Under-nutrition. EPW. Feb. 6.
DANDEKAR, V.M. (1996): The Indian Economy. 1947-1992. Population, Poverty andEmployment. Sage publications, New Delhi.
GOVERNMENT OF INDIA. PLANNING COMMISSION (1962): Perspectives ofDevelopment. India 1960-61 to 1975-76: Implications of Planning for a minimumlevel of living. Also in Poverty and Income Distribution in India eds. T.N. Srinivasanand P.K. Bardhan, Statistical Publishing Society. Calcutta.
GOVERNMENT OF INDIA. PLANNING COMMISSION (1979): Report of the TaskForce on Projections of Minimum Needs and Effective Consumption Demand.
GOVERNMENT OF INDIA. PLANNING COMMISSION (1981): A Technical Note onthe Sixth Plan of India (1980-1985) Annexe-III. pp 81-84.
GOVERNMENT OF INDIA. PLANNING COMMISSION (1982): Report of the ExpertGroup on programme for alleviation of Poverty. Government of India. New Delhi.
GOVERNMENT OF INDIA. PLANNING COMMISSION (1984): The concept andestimation of Poverty Line. Perspective Planning Division. Government of India.New Delhi.
GOVERNMENT OF INDIA. PLANNING COMMISSION (1993): Report of the ExpertGroup on Estimation of Proportion and number of Poor.
INDIA 23
GOVERNMENT OF INDIA. PLANNING COMMISSION (1997): Press release onEstimate of Poverty. Perspective Planning Division. New Delhi, 11th March.
GOVERNMENT OF INDIA. NATIONAL SAMPLE SURVEY ORGANISATION (1978):Calorie and Protein Values of Food items consumed per diem per consumer unit -Twenty sixth Round (1971-72). NSS Report Nº 238. Vol I & II. Department ofStatistics. New Delhi.
GOVERNMENT OF INDIA. NATIONAL SAMPLE SURVEY ORGANISATION (1979):Survey results on consumer expenditure based on NSS 27th round (Oct. 1972-Sept.1973) data. Sarvekshana. The Jour. of NSSO Vol. I Nº 3, Nº 7, January.
GOVERNMENT OF INDIA. NATIONAL SAMPLE SURVEY ORGANISATION (1983):Survey results on per capita per diem intake of calorie, protein and fat based on NSS27th round (Oct. 1972-Sept. 1973) data. Sarvekshana. The Jour. of NSSO Vol. 6.Nº 3 - 4. Nº 18.
GOVERNMENT OF INDIA. NATIONAL SAMPLE SURVEY ORGANISATION(1986a): Survey results on consumer expenditure based on NSS 32nd round (July1977-June 1978) data. Sarvkshana. The Jour. of NSSO Vol. IX. Nº 3. Nº 26January.
GOVERNMENT OF INDIA. NATIONAL SAMPLE SURVEY ORGANISATION(1986b): Per consumer unit per diem intake of nutrients - Thirty second Round(1977-78). NSS Report Nº 329. Department of Statistics. New Delhi.
GOVERNMENT OF INDIA. NATIONAL SAMPLE SURVEY ORGANISATION(1986c): Survey results on Consumer expenditure based on NSS 38th round(January-December 1983) Sarvekshana. The Jour. of NSSO. Vol. IX. Nº 4. Issue Nº27, April.
GOVERNMENT OF INDIA. NATIONAL SAMPLE SURVEY ORGANISATION(1988a): Per capita and per consumer unit per diem intake of calorie, protein and fatand perception of people on adequacy of food - Thirty Eighth Round (1983). NSSReport Nº 348. Department of Statistics. New Delhi.
GOVERNMENT OF INDIA. NATIONAL SAMPLE SURVEY ORGANISATION(1988b): Level of Nutritional Intake of Population distributed over differentexpenditure classes - Thirty Eighth Round (1983). NSS Report Nº 353. Departmentof Statistics. New Delhi.
INDIA 24
GOVERNMENT OF INDIA. NATIONAL SAMPLE SURVEY ORGANISATION (1989):Survey Results on per capita and per consumer unit per diem intake of calorie,protein and fat and perception of the people on adequacy of food based on NSS 38th
round (January-December 1983). Sarvekshana. The Jour. of NSSO. Vol.XIII. Nº 2.Issue Nº 41 Oct.-Dec.
GOVERNMENT OF INDIA. NATIONAL SAMPLE SURVEY ORGANISATION (1990):Survey results on consumer expenditure based on NSS 43rd round (July 1987-June1988) Sarvekshana. The Jour. of NSSO.
GOVERNMENT OF INDIA. NATIONAL SAMPLE SURVEY ORGANISATION(1996a): Survey Results on Level and Pattern of consumer Expenditure. NSS 50th
Round (July 1993-June 1994) Report Nº 402, May.
GOVERNMENT OF INDIA. NATIONAL SAMPLE SURVEY ORGANISATION(1996b): Survey Results on Nutrition Intake in India based on NSS 50th Round (July1993-June 1994) Report Nº 405. April.
JOSHI, P.D. (1979): On the Suitability of Displaced Log-normal Distribution In Graduatingthe Size Distribution of Total Consumer Expenditure. Sarvekshana. The Jour. ofNSSO. Vol. 3. Nº 1. pp 4-8.
JOSHI, P.D. (1996a): Household Expenditure and Income Survey: Indian Experience.Paper presented at the firs meeting of the U.N. Expert Group on Household IncomeStatistics. Canberra. December.
JOSHI, P.D. (1996b): A bibliography of the literature on measurement of poverty(Unpublished).
JOSHI, P.D. (1997a): Statistical Dimensions of Poverty in India. Invited lecture in first P.V.Sukhatme Memorial Session in the XVII Annual Conference of the Indian Society forProbability and Statistics held in B.H.U. Varanasi during 10-13 February.
JOSHI, P.D. (1997b): Sensitivity Analysis on Measures of Poverty (Unpublished).
MINHAS, B.S. (1970): “Rural Poverty. Land Redistribution and Development Strategy.Indian Economic Review. Vol. 5, Nº 1. Also Sankhya Series C. Vol. 36 (1974), pp252-263.
MINHAS, B.S. (1971a): Rural Poverty and Minimum Level of Living - A Reply. IndianEconomic Review. April.
MINHAS, B.S. (1971b): More on Rural Poverty. A Glimmer of Progress. IndianEconomic Review. Nº 6.
INDIA 25
MINHAS, B.S. (1971c): The poor, the weak and the Fourth Plan in A.J. Fonseca (Ed.),Challenge of Poverty in India. New Delhi. Vikas Publishing.
MINHAS, B.S. (1974): Planning and the Rural Poor. S. Chand & Co., Delhi 9.
MINHAS, B.S., KANSAL, S.M., KUMAR, J. AND JOSHI, P.D. (1986): On the Reliabilityof the Available Estimates of Private Consumption Expenditure in India. Journal ofIncome and Wealth. Vol. 9 Nº 2. pp 71-93.
MINHAS, B.S., JAIN, L.R., KANSAL, S.M. AND SALUJA, M.R. (1987): On the Choiceof appropriate Consumer Price Indices and Data Sets for Estimating the Incidence ofPoverty in India. Indian Economic Review. Vol. XXII. Nº 7, pp 19-50.
MINHAS, B.S., JAIN, L.R., KANSAL, S.M. AND SALUJA, M.R. (1988): “Measurementof general cost of living for urban India, all-India and different states”, Sarvekshana.The Jour. of NSSO XII. I. 1-23.
MINHAS, B.S. (1988): “Validation of Large Scale Sample Survey Data-Case of NSSEstimates of Household Consumption Expenditure”. Sankhya. Series B. Vol. 50.Part 3. Supplement. pp 1-63.
MINHAS, B.S., JAIN, L.R., KANSAL, S.M. AND SALUJA, M.R. (1989a): Cost of livingin rural India: 1970-71 to 1983: State-wise and All India. Technical Report Nº8904, ISI, New Delhi.
MINHAS, B.S., KANSAL, S.M. (1989b): “Comparison of the NSS and the CSO Estimatesof Private Consumption: Some Observations Based on 1983 Data”. The Journal ofIncome and Wealth. Vol. II. Nº 1. January, 1989, pp 7-24.
MINHAS, B.S., KANSAL, S.M. AND JAIN, L.R. (1989c): “Incidence of Urban Poverty inDifferent States (1970-71 to 1983)”. Indian Statistical Institute. Technical ReportNº 8902. January.
MINHAS, B.S., JAIN, L.R. (1990): Incidence of Rural Poverty in Different States and AllIndia 1970-71 to 1983”. Agricultural Development Policy: Adjustments andReorientation (Golden Jubilee Volume of Indian Society of Agricultural Economics),Oxford and IBH Publishing Co. New Delhi, pp. 342-81.
MINHAS, B.S., JAIN, L.R. AND TENDULKAR, S.D. (1991a): Declining Incidence ofPoverty in the 1980s: Evidence from Artefacts. Economic and Political Weekly (6-13 July 1991). Table 3, p. 1675.
MINHAS, B.S., JAIN. L.R. AND TENDULKAR, S.D. (1991b): “Rural and Urban cost ofliving: 1983 to 1987-88. Statewise and All India”. Journal of Indian School ofPolitical Economy. Vol. 3. Nº 3. July-Sept 1991. 420-442.
INDIA 26
OJHA, P.D. (1970): “A Configuration of Indian Poverty: Inequality and Levels of Living”.Reserve Bank of India Bulletin, January.
RUDRA, A. (1974): Minimum Level of Living - A Statistical Examination in Poverty andIncome Distribution (ed). P.K. Bardhan and T.N. Srinivasan. Statistical PublishingSociety. Calcutta.
RUDRA, A., CHAKRABORTY, S., MAZUMDAR, K. AND BHATTACHARYA, N.(1995): Criterion for identification of rural poor-Preliminary Results based on asurvey in West Bengal in Foreign Capital-Welfare implications of growth (ed) M.Chattopadhyay.
SEN, A.K. (1973): “Poverty, Inequality and Unemployment”. Economic and PoliticalWeekly. Special Number. Reprinted in Bardhan and Srinivasan: Poverty andIncome Distribution in India. Statistical Publishing Society, 1974. p. 67.
SENGUPTA, S. AND JOSHI, P.D. (1978): Consumption of Cereals and Energy Content ofFood Consumed. Sarvekshana - The Jour. of NSSO Vol. 2. Nº 1 July.
SENGUPTA, S. AND JOSHI, P.D. (1979): A Note on Determination of Poverty LineBased on NSS 27th Round Data, Sarvekshana - The Jour. of NSSO, Vol. 3, Nº 1,July.
SENGUPTA, S. AND JOSHI, P.D. (1981): Concept of Poverty line and estimate of Povertyat the regional level in India. Paper presented in the first National Conference onSocial Science Research and problem of poverty organised by Indian Association ofSocial Science Institution. New Delhi. Also Social Science Research and Problem ofPoverty (ed) Tarlok Singh. Concept Publishing Company. New Delhi. 1990.
SRINIVASAN. T.N. (1977): Poverty: Some measurement problems, Bull, Int. Stat.Institute 47 (4).
SUKHATME, P.V. (1961): The World’s Hunger and Future Needs in Food Supply. Jour.Roy. Stat. Soc. Series A. Vol 124. pp 463-525.
SUKHATME, P.V. (1965): Feeding India’s Growing Millions. Asia Publishing House.Bombay.
SUKHATME, P.V. (1977a): Incidence of Under-nutrition in India. Journal of Economics.Vol. XXXVIII. Nº 3. July-Sept. 1977.
SUKHATME, P.V. (1977b): Measurement of Poverty Based on Nutritional Needs. Bull.Int. Stat. Inst. 47(4) pp 553-56.
INDIA 27
SUKHATME, P.V. (1978): Assessment of Adequacy of Diets at Different Income Level.EPW. Vol. XIII. pp 1373-1384.
SUKHATME, P.V. (1980): Nutrition Policy - Need for Re-orientation. EPW. Vol. XV. Nº26, pp 1101-1105 and Its Implication for Social Policy - Report on the SummerInstitute. M.A.C.S. Pune.
SUKHATME, P.V. (1981a): On Measurement of poverty. EPW Vol. XVI. Nº 32. Aug. 8.pp 1311-1324.
SUKHATME, P.V. (1981b): Measuring the Incidences of Under Nutrition - A comment.EPW. Vol. XVI. pp 1034-1036.
SUKHATME, P.V. (1989): Nutrition Adoption and Variability. European journal ofClinical Nutrition Vol. 43. pp 75-87 and three commentaries on the paper of Prof.P.V. Sukhatme by J.C. Waterlow. WPT James and Mrs. Healy in the same issue pp203-10.
TENDULKAR, S. (1993): Social Welfare. Social Deprivation and Economic Growth.Some reflections on the Indian Experience; paper presented at the P.C. Mahalanobisbirth Centenary Conference on “Planning and Economic Policy in India” held at I.S.I.Calcutta on June 29-31.