india oilseeds and products annual 2018 · adviser (ppa), goi. the management of handling,...
TRANSCRIPT
THIS REPORT CONTAINS ASSESSMENTS OF COMMODITY AND TRADE ISSUES MADE BY
USDA STAFF AND NOT NECESSARILY STATEMENTS OF OFFICIAL U.S. GOVERNMENT
POLICY
Date:
GAIN Report Number:
Approved By:
Prepared By:
Report Highlights:
Assuming a normal monsoon season (June-September) and favorable weather conditions, India’s total
oilseed production in Marketing Year (MY) 2018/19 (Oct-Sep) is forecast to rise 10 percent to 38.8
million metric tons (MMT) on 38.4 million hectares. Improving oilseed supply conditions in MY
2018/19 will help Indian oilmeal production to rebound to 17.3 MMT from 15.9 MMT estimated in MY
2017/18. Assuming Indian meal prices stay competitive, oilmeal export sales will rise modestly from
2.1 MMT to 2.9 MMT. Concurrently, a widening gap between growing edible oil consumption and
limited domestic production will increase vegetable oil imports from 16.3 MMT to 17.4 MMT.
Amit Aradhey
Tiffany Landry
2018
Oilseeds and Products Annual
India
IN8040
4/18/2018
Required Report - public distribution

Executive Summary:
Assuming a normal monsoon, favorable weather conditions and near normal yields, India’s MY 2018/19
(forecast year) oilseed production, which includes soybean, rapeseed, mustard, peanut, sunflower seed,
cottonseed and copra is forecast to rise to 38.8 million metric tons (MMT) on 38.4 million hectares.
Current year’s oilseed production is however estimated at 35.4 MMT from 37 million hectares, slightly
lower than last year due to lower than anticipated yield.
Improving oilseed supply conditions in the forecast year will help Indian oilmeal production to rebound
to 17.3 MMT from 15.9 MMT estimated in MY 2017/18. (Incidentally, oilmeal production was at a
decade low of 13 MMT in MY 2015/16.) Assuming normal market conditions and competitive pricing,
Indian oilmeal exports in the forecast year will rise modestly to 2.9 MMT compared to the 2.1 MMT
estimate of MY 2017/18. The first quarter of MY 2017/18 witnessed Indian soymeal prices becoming
more competitive (with some export incentive) to gain export sales, but any further uptick in its prices
will trim total export sales below 2 MMT and divert additional supplies, if any, to domestic use.
Concurrently, there is a strong demand for vegetable oils, forecast in MY 18/19 at 24.8 MMT. And
while local edible oil production is seen rising to 7.5 MMT, there is a widening gap which will be filled
through imports, projected to rise from 16.3 MMT to 17.4 MMT in the forecast year. A strong demand
from bulk buyers, food business operators, households, and a fast moving, younger consumer generation
with more disposable income is pushing consumption growth in India. In spite of the fact that India is
the third largest consumer of edible oils after China and the European Union, India’s per capita
consumption is currently estimated at 18 kg for MY 2017/18, still below the world average per capita
consumption estimated at 25 kg.
Commodities:

Production:
OILSEEDS SECTION
Table1. INDIA: TOTAL OILSEEDS PSD
OILSEEDS (1000 metric tons) MY 2016/17 MY 2017/18 MY 2018/19
Revised Estimate Forecast
Area 37563 37087 38430
Beginning Stocks 1078 2094 1130
Production 36750 35441 38775
MY Imports 97 74 83
Total Supply 37925 37609 40224
MY Exports 1230 1174 1323
Crush 26913 27281 29225
Food Use Dom. Cons. 2650 2650 2850
Feed Waste Dom. Cons. 5038 5238 5403
Total Dom. Cons. 34601 35069 37478
Ending Stocks 2094 1366 1423
Total Distribution 37925 37609 40224
Yield 0.98 0.96 1.01
Area Harvested
Assuming a normal 2018 southwest monsoon (June-September) and favorable weather conditions, the
total oilseed area in MY 2018/19 is forecast to rise 3.6 percent to 38.4 million hectares. The prevailing
strong market price of oilseeds should incentivize farmers to reclaim some area lost to competing crops
in the past, in addition to newer areas being explored in non-traditional areas1. Note: The forecast covers
soybean, rapeseed and mustard, peanut, sunflower seed, cottonseed and copra. Minor oilseed crops such
as niger, sesamum and safflower are not covered in this report.
Production
1 Generally speaking, the area planted and area harvested for crops differ only in years when there is a
significant and accounted crop loss reported for incidence such as drought, flood, disease, pest or
similar.
Oilseed, Copra
Oilseed, Sunflowerseed
Oilseed, Cottonseed
Oilseed, Peanut
Oilseed, Rapeseed
Oilseed, Soybean

Anticipating larger oilseed area and near normal yield, the total oilseed production in MY 2018/19 is
forecast to rise 9.4 percent to 38.8 MMT. MY 2017/18 oilseed production is now estimated at 35.4
MMT, 3.6 percent below last year. Continued dependence on rain-fed production systems coupled with
inadequate and erratic rainfall in the past have typically resulted in lower than anticipated oilseed
production (as seen from the second advance estimate of 2017/18).
On February 1, 2018, the Indian Minister of Finance presented the Union Budget for fiscal year 2018/19
(April/March) that focused on strengthening the agricultural and rural economy through measures to
generate higher incomes for farmers. Major policy announcements were made on bolstering farm
produce prices and improving marketing infrastructure. Tariffs on several
imported agricultural products, including refined edible vegetable oils, were increased and an additional
levy (social welfare charge) of 10 percent of the aggregate import duty was proposed. The above
measure should encourage oilseed farmers to grow more oilseeds and help augment their income
particularly when more than 70 percent of vegetable oil demand is met through imports. As agriculture
is a state subject, the government of India’s (GOI) central government program is also supplemented by
state government’s efforts to enhance oilseed production and productivity.
Since Indian fiscal year (IFY) 2014/15, the National Mission on Oilseeds and Palm (NMOOP) has
conducted three Mini Missions to address oilseed productivity issues and find ways to meet India’s
ever-increasing oil demand. According to NMOOP’s mission statement, its short-term targets (IFY
2017/18 to IFY 2021/22) are specified below. Incidentally, their time frame coincides with the
government initiative to double farmers’ income by year 2022. (Double Farmers Income)
Table 2. India: Oilseeds and Vegetable Oil Production Targets by IFY 2021/12 (MMT)
Crops Short-term Target through IFY* (2021-22)
Oilseeds Oil
Groundnut 10.75 2.47
Soybean 16.50 2.64
Rapeseed and Mustard 9.75 3.02
Sesame 1.10 0.33
Others 4.00 1.50
Total 42.1 9.96
Source: NMOOP
* IFY: (April-March)
Table 3. India: Targets for ‘Other Sources’ of Vegetable Oils (MMT)
Commodities Vision Short-term Target through IFY 2021-22
Rice bran 1.10 1.15
Cotton seed 1.30 1.35
Oil Palm 0.30 0.40

Tree Borne Oilseeds (TBO) 0.20 0.22
Others * 1.00 1.10
Total 3.90 4.22
Source: NMOOP
*: other tree-borne oilseeds
Consumption:
i) Crush The total oilseed crush in the forecast year will rise 7 percent to 29.2 MMT due to rising demand for its
derivatives, food, feed, and seed use in line with the rise in oilseed supply.
ii) Food Use Consumption
Food use of oilseeds will rise 7.5 percent to 2.9 MMT; driven by steady growth in demand for value-
added food products made from oilseeds. The category of food products includes savory products,
candy bars, snack foods, curries, and sauces made from peanuts, rapeseed, mustard, and soybean.
iii) Feed, Seed, Waste Consumption
This category is expected to rise upwards of 3 percent to 5.4 MMT, driven by cottonseed, soybean and
peanut waste, which are forecast at 3.3 MMT, 1.1 MMT, 0.6 MMT respectively. “Waste” broadly also
includes seeds retained for sowing/re-sowing operations, feed and industrial use.
Trade:
MY 2018/19 oilseeds export is anticipated to grow upwards of 12 percent to 1.3 MMT worth $1 billion
based on prevailing international prices. The export basket will include high value hand-picked-select
(HPS) peanuts, soybean (non-GM), cottonseed, rapeseed, mustard, sunflower seed and copra. An
estimated 80 percent of total export sales will come from peanut, 17 percent from soybeans and the
remaining from other oilseeds.
The Agricultural Produce and Export Development Authority (APEDA) issued guidelines for the export
of peanut and peanut products, which can be accessed through the link provided. Indian peanuts are in
great demand from countries such as Indonesia, Vietnam, Malaysia, Philippines, Russia and neighboring
countries. Similarly, United States, Canada, Spain, Belgium and France import non-GM Indian
soybeans. Copra, cottonseed and sunflower seed are imported mostly by neighboring countries.
Oilseeds imports are yet to reach 100,000 MT mark but are growing at a steady pace. Based on recent
trade trends, an estimated 83,000 MT (estimated value >$40 million) is estimated for import in MY
2018/19. India’s five year annual average is 50,000 MT.
a) Trade in Soybean is growing…
India is a net exporter of soybeans. Trade in soybean has grown, but at a slower pace in the last 6 years.
Prior to that trade was negligible, except in 2009 when some trade was reported. According to the latest
Global Trade Atlas data, in MY 2016/17 India exported 269,275 MT of soybean valued at $156.7
million and imported 78,515 MT valued at $39 million.
In recent years, India has imported soybeans from Benin, Ethiopia, Togo, Malawi, Mozambique and
some quantity of Identity Preserved food-grade U.S. No. 1 Non-GMO soybeans from United States (656
MT, $588,131 in MY 2016/17); these imports were mostly for food use. India also exported soybeans
(non-GM) to the United States, Canada, Spain, Belgium, France, and Germany.
b) Policy for soybean imports into India:
India’s trade policy effectively prohibits import of Genetically Modified (GM) soybeans. However,
non-GM soybeans are eligible for import from any country for consumption and processing. These
imports are allowed provided additional declarations stating freedom from Bruchidius spp; weed seed-
free certifications; zero dockage certifications in respect of weed seeds in the phytosanitary certificate;
heat treatment at 1200C for 15 minutes; or any other treatment as advised by the Plant Protection
Adviser (PPA), GOI. The management of handling, transportation, milling and processing of import
consignment and manner of disposal will be as advised by the PPA, GOI.
c) Import Duty on Soybeans now at 49.5 Percent:
The total import duty on soybeans is now 49.5 percent which includes a 10% social welfare tax (basic
customs duty is 45 percent). Generally, oilseeds can be imported into India without any quantity
restrictions, but typically face high tariffs (30 percent) and complex phytosanitary requirements (also see
policy requirements under subheading ‘Oils’).
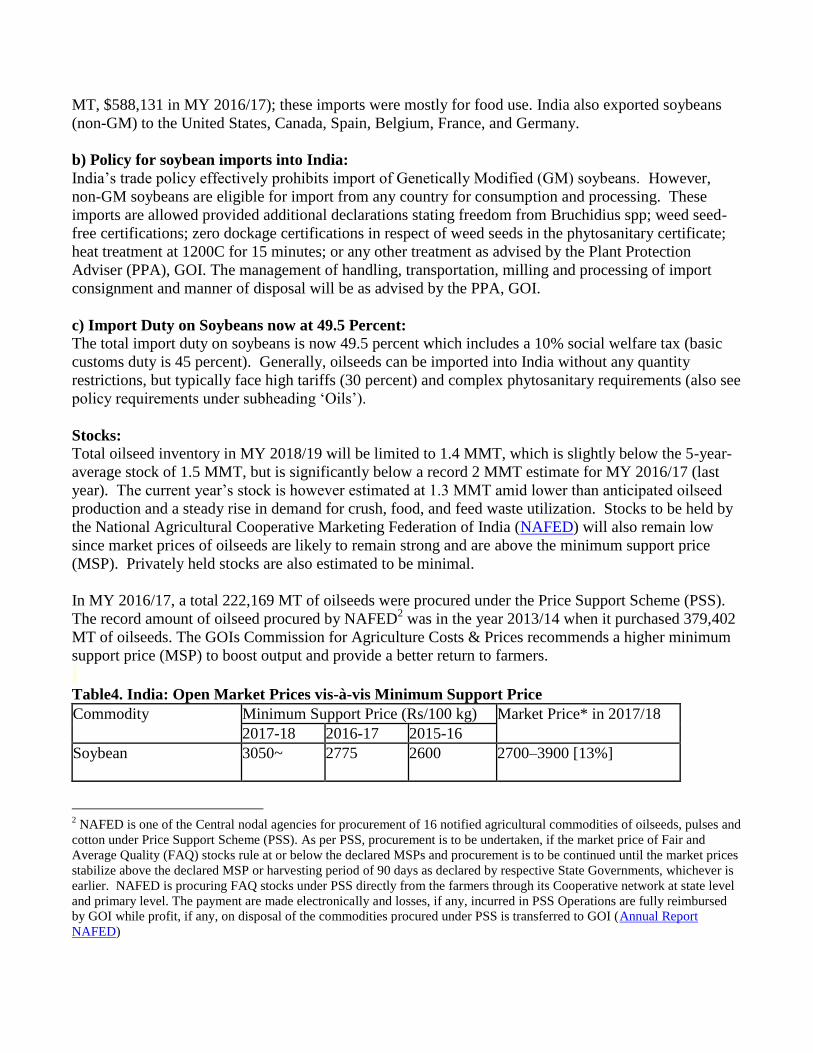
Stocks:
Total oilseed inventory in MY 2018/19 will be limited to 1.4 MMT, which is slightly below the 5-year-
average stock of 1.5 MMT, but is significantly below a record 2 MMT estimate for MY 2016/17 (last
year). The current year’s stock is however estimated at 1.3 MMT amid lower than anticipated oilseed
production and a steady rise in demand for crush, food, and feed waste utilization. Stocks to be held by
the National Agricultural Cooperative Marketing Federation of India (NAFED) will also remain low
since market prices of oilseeds are likely to remain strong and are above the minimum support price
(MSP). Privately held stocks are also estimated to be minimal.
In MY 2016/17, a total 222,169 MT of oilseeds were procured under the Price Support Scheme (PSS).
The record amount of oilseed procured by NAFED2 was in the year 2013/14 when it purchased 379,402
MT of oilseeds. The GOIs Commission for Agriculture Costs & Prices recommends a higher minimum
support price (MSP) to boost output and provide a better return to farmers.
Table4. India: Open Market Prices vis-à-vis Minimum Support Price
Commodity Minimum Support Price (Rs/100 kg) Market Price* in 2017/18
2017-18 2016-17 2015-16
Soybean 3050~ 2775
2600 2700–3900 [13%]
2 NAFED is one of the Central nodal agencies for procurement of 16 notified agricultural commodities of oilseeds, pulses and
cotton under Price Support Scheme (PSS). As per PSS, procurement is to be undertaken, if the market price of Fair and
Average Quality (FAQ) stocks rule at or below the declared MSPs and procurement is to be continued until the market prices
stabilize above the declared MSP or harvesting period of 90 days as declared by respective State Governments, whichever is
earlier. NAFED is procuring FAQ stocks under PSS directly from the farmers through its Cooperative network at state level
and primary level. The payment are made electronically and losses, if any, incurred in PSS Operations are fully reimbursed
by GOI while profit, if any, on disposal of the commodities procured under PSS is transferred to GOI (Annual Report
NAFED)

Rapeseed, and Mustard 4000^ 3700 3350 3970-4200 [21%]
Peanut (in shell) 4450 ^^ 4220 4030 NA
Sunflower seed 4100* 3950 3800 NA
Bonus of ^: INR 100, ^^: INR 200, *: INR 100 and ~ INR 200 included
Figure in square brackets indicate appreciation/depreciation in prevailing market prices in relation to
corresponding period last year.
Source: Directorate of Economics and Statistics and Directorate of Agricultural Marketing, GOI.
Additional note on Minimum Support Price (MSP) Policy
On February 1, 2018, Finance Minister (FM) Arun Jaitley presented the Indian fiscal year (IFY) 2018/19
(April/March) budget before the parliament that focused on farmers and rural India. The ruling National
Democratic Alliance (NDA) government has been criticized for not adopting its 2014 Parliamentary
Election manifesto that promised farmers a minimum support price (MSP) 1.5 times the cost of
production. The Finance Minister (FM) claimed that the government declared the MSP for a majority of
the 2017/18 rabi (winter planted) crops (e.g., wheat, chickpeas, rapeseed, mustard, and barley) by at
least one and a half times the cost of production. The government has decided to implement this
formula as a principle for determining the MSP for all crops during the upcoming 2018/19 kharif (fall
harvested) crops (e.g., rice, maize and various coarse grains, oilseeds and pulses).
In the past year, some state governments have experimented with differential pricing compensation
schemes, where registered farmers sell in the open market, and the government compensates the farmers
by paying the differential between the MSP and modal market prices (average market prices in major
markets) in cases when market prices are below MSP. The FM announced that the government intends
to set up an institutional mechanism with participation from various concerned ministries to develop
policies and practices for price and demand forecasting, the use of futures and options markets, and to
decide on specific export and import related measures. The FM stated that this will help farmers make
better decisions based on price expectations after harvest to improve overall price realization (Excerpt
from IN8014).
Production, Supply and Demand Data Statistics:
Table 5. India: Commodity, Oilseed, Soybean, PSD
(Area in 1000 hectares and production in 1000 metric tons)
Oilseed, Soybean 2016/2017 2017/2018 2018/2019
Market Begin Year Oct 2016 Oct 2017 Oct 2018
India USDA
Official
New
Post
USDA
Official
New
Post
USDA
Official
New
Post
Area Planted 11700 11400 10500 10600 0 11500
Area Harvested 11400 11400 10500 10600 0 11500
Beginning Stocks 138 138 816 947 0 207
Production 11500 10600 9500 9000 0 11500
MY Imports 77 78 120 60 0 70
Total Supply 11715 10816 10436 10007 0 11777
MY Exports 269 269 180 150 0 200
Crush 9200 8000 8770 8300 0 9700
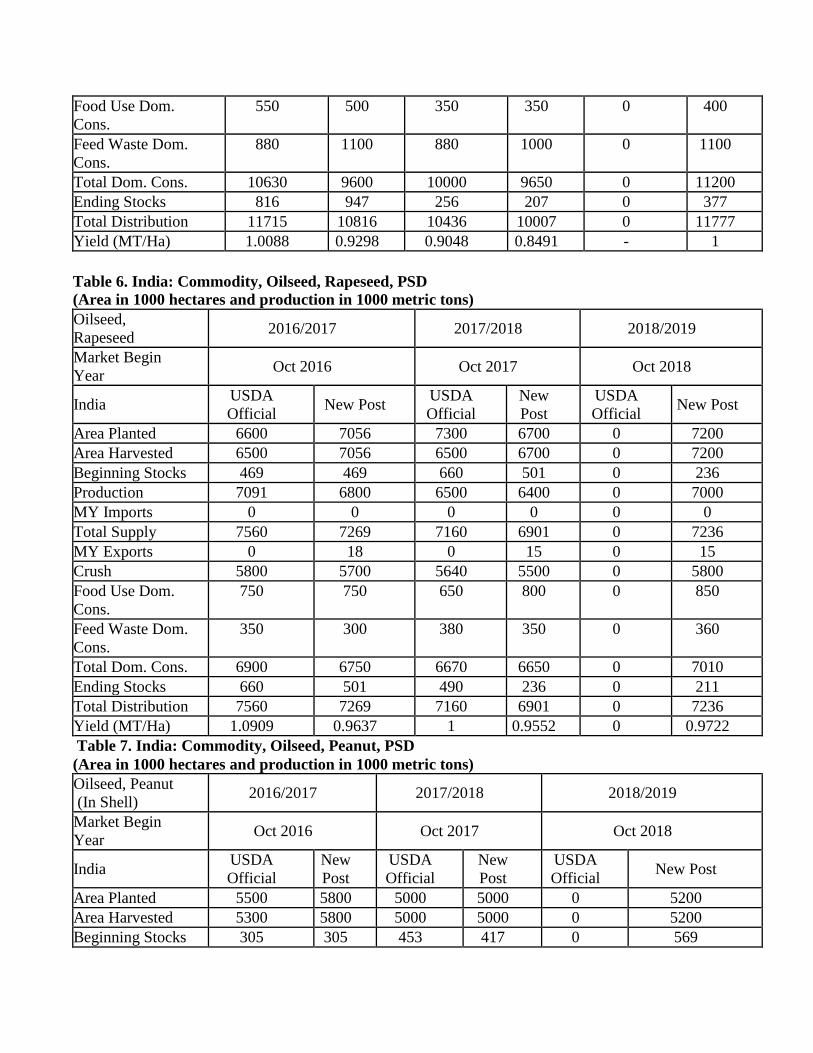
Food Use Dom.
Cons.
550 500 350 350 0 400
Feed Waste Dom.
Cons.
880 1100 880 1000 0 1100
Total Dom. Cons. 10630 9600 10000 9650 0 11200
Ending Stocks 816 947 256 207 0 377
Total Distribution 11715 10816 10436 10007 0 11777
Yield (MT/Ha) 1.0088 0.9298 0.9048 0.8491 - 1
Table 6. India: Commodity, Oilseed, Rapeseed, PSD (Area in 1000 hectares and production in 1000 metric tons)
Oilseed,
Rapeseed 2016/2017 2017/2018 2018/2019
Market Begin
Year Oct 2016 Oct 2017 Oct 2018
India USDA
Official New Post
USDA
Official
New
Post
USDA
Official New Post
Area Planted 6600 7056 7300 6700 0 7200
Area Harvested 6500 7056 6500 6700 0 7200
Beginning Stocks 469 469 660 501 0 236
Production 7091 6800 6500 6400 0 7000
MY Imports 0 0 0 0 0 0
Total Supply 7560 7269 7160 6901 0 7236
MY Exports 0 18 0 15 0 15
Crush 5800 5700 5640 5500 0 5800
Food Use Dom.
Cons.
750 750 650 800 0 850
Feed Waste Dom.
Cons.
350 300 380 350 0 360
Total Dom. Cons. 6900 6750 6670 6650 0 7010
Ending Stocks 660 501 490 236 0 211
Total Distribution 7560 7269 7160 6901 0 7236
Yield (MT/Ha) 1.0909 0.9637 1 0.9552 0 0.9722
Table 7. India: Commodity, Oilseed, Peanut, PSD
(Area in 1000 hectares and production in 1000 metric tons)
Oilseed, Peanut
(In Shell) 2016/2017 2017/2018 2018/2019
Market Begin
Year Oct 2016 Oct 2017 Oct 2018
India USDA
Official
New
Post
USDA
Official
New
Post
USDA
Official New Post
Area Planted 5500 5800 5000 5000 0 5200
Area Harvested 5300 5800 5000 5000 0 5200
Beginning Stocks 305 305 453 417 0 569

Production 6700 6700 6500 6800 0 6800
MY Imports 2 2 2 2 0 2
Total Supply 7007 7007 6955 7219 0 7371
MY Exports 904 890 950 1000 0 1100
Crush 3750 3800 3600 3600 0 3600
Food Use Dom.
Cons.
1400 1400 1600 1500 0 1600
Feed Waste Dom.
Cons.
500 500 500 550 0 600
Total Dom. Cons. 5650 5700 5700 5650 0 5800
Ending Stocks 453 417 305 569 0 471
Total Distribution 7007 7007 6955 7219 0 7371
Yield (MT/Ha) 1.2642 1.15 1.30 1.36 0 1.30
Table 8. India: Commodity, Oilseed, Cottonseed, PSD
(Area in 1000 hectares and production in 1000 metric tons)
Oilseed, Cottonseed 2016/2017 2017/2018 2018/2019
Market Begin Year Oct 2016 Oct 2017 Oct 2018
India USDA
Official
New
Post
USDA
Official
New
Post
USDA
Official
New
Post
Area Planted
(Cotton)
10850 10850 12300 12300 0 11900
Area Harvested
(Cotton)
10850 10850 12300 12300 0 11900
Seed to Lint Ratio 0 0 0 0 0 0
Beginning Stocks 166 166 444 229 0 354
Production 11463 11450 12100 12115 0 12200
MY Imports 15 14 10 10 0 10
Total Supply 11644 11630 12554 12354 0 12564
MY Exports 0 1 1 0 0 0
Crush 8100 8300 8900 8800 0 8900
Food Use Dom.
Cons.
0 0 0 0 0 0
Feed Waste Dom.
Cons.
3100 3100 3100 3200 0 3300
Total Dom. Cons. 11200 11400 12000 12000 0 12200
Ending Stocks 444 229 553 354 0 364
Total Distribution 11644 11630 12554 12354 0 12564
Yield 1.0565 1.0553 0.9837 0.985 0 1.0252
Table 9. India: Commodity, Oilseed, Sunflowerseed, PSD
(Area in 1000 hectares and production in 1000 metric tons)
Oilseed,
Sunflowerseed 2016/2017 2017/2018 2018/2019

Market Begin Year Oct 2016 Oct 2017 Oct 2018
India USDA
Official
New
Post
USDA
Official
New
Post
USDA
Official
New
Post
Area Planted 381 347 330 387 0 430
Area Harvested 381 347 330 387 0 430
Beginning Stocks 0 0 0 0 0 0
Production 275 285 277 326 0 370
MY Imports 3 3 2 2 0 1
Total Supply 278 288 279 328 0 371
MY Exports 5 5 4 4 0 3
Crush 240 245 240 286 0 325
Food Use Dom.
Cons.
0 0 0 0 0 0
Feed Waste Dom.
Cons.
33 38 35 38 0 43
Total Dom. Cons. 273 283 275 324 0 368
Ending Stocks 0 0 0 0 0 0
Total Distribution 278 288 279 328 0 371
Yield (MT/Ha) 0.72 0.82 0.83 0.84 0 0.86
Table 10. India: Commodity, Oilseed, Copra, PSD
(Area in 1000 hectares and production in 1000 metric tons)
Oilseed, Copra 2016/2017 2017/2018 2018/2019
Market Begin Year Oct 2016 Oct 2017 Oct 2018
India USDA
Official
New
Post
USDA
Official
New
Post
USDA
Official
New
Post
Area Planted 0 0 0 0 0 0
Area Harvested 2210 2110 2230 2100 0 2200
Trees 0 0 0 0 0 0
Beginning Stocks 715 915 750 800 0 905
Production 0 0 0 0 0 0
MY Imports 715 915 750 800 0 905
Total Supply 47 5 15 5 0 5
MY Exports 668 910 735 795 0 900
Crush 0 0 0 0 0 0
Food Use Dom.
Cons.
0 0 0 0 0 0
Feed Waste Dom.
Cons.
668 910 735 795 0 900
Total Dom. Cons. 0 0 0 0 0 0
Ending Stocks 715 915 750 800 0 905
Total Distribution 0.3235 0.4336 0.3363 0.381 0 0.4114
Yield (MT/Ha) 0.32 0.43 0.33 0.38 0 0.41

Commodities:
Production:
MEALS SECTION
Table 11. INDIA: TOTAL OILMEALS PSD
OILMEALS (1000 metric tons) MY 2016/17 MY 2017/18 MY 2018/19
Revised Estimate Forecast
Crush 26,913 27,281 29,225
Beginning Stocks 364 650 602
Production 15,615 15,883 17,323
MY Imports 430 307 300
Total Supply 16,409 16,840 18,225
MY Exports 2053 2,102 2,852
Industrial Dom. Cons. 0 0 0
Food Use Dom. Cons. 416 414 468
Feed Waste Dom. Cons. 13,290 13,722 14,386
Total Dom. Cons. 13,706 14,136 14,854
Ending Stocks 650 602 519
Total Distribution 16,409 16,840 18,225
Production
Indian oilmeal production in the forecast year is expected to rebound to 17.3 MMT up from the 15.9
MMT estimate in MY 17/18. This growth has been slow but consistent since Indian oilmeal production
dropped to a decade low of 13 MMT in MY 2015/16. This was a phase when oilseed prices were strong
on limited availability and processing margins were weak. Anticipated resumption in oilseed supply
amid moderate growth in oilmeal consumption demand will support a rise in meal production.
Generally, an estimated 80 percent of India’s total oilseed supply is crushed for meal and oil; oil meal
is then utilized for feed and food. However, the specific end-use allocation can vary according to
available domestic supplies and export demand for Indian oil meal during the marketing year.
Consumption:
Meal, Copra
Meal, Sunflowerseed
Meal, Cottonseed
Meal, Peanut
Meal, Rapeseed
Meal, Soybean

Total oilmeal consumption in MY 2018/19 is forecast to rise to 14.9 MMT in MY 2018/19, five percent
above the current year’s estimate. The feed waste consumption being a major component of total feed
use, will grow from the current year’s estimate of 13.7 MMT to 14.4 MMT in the forecast year. The
feed use is comprised of 5 MMT of soybean meal, 4.2 MMT cottonseed meal (mostly used for livestock
feed), 3 MMT of rapeseed meal, 1.4 MMT million tons of peanut meal, and 800,000 metric tons of
other oil meals. In terms of soybean meal equivalent (SME), the protein meal consumption for feed use
is expected to grow by more than 4 percent from 12 MMT last year to 12.6 MMT in the forecast year.
This is likely due to rising consumer preference towards healthy and protein rich foods including animal
proteins. Though the feed waste consumption is slated to rise 3 percent from 13.3 MMT to 13.7 MMT
this year, but in terms of SME, it will remain flat (see Figure 1 below).
Figure 1. India: Soybean Meal Equivalent (SME) Production in 1000 MTs, Marketing Years
Oilmeals 2016/17 2017/18 2018/19
Soybean Meal 4750 4700 5000
Rapeseed Meal 2061 2063 2135
Peanut Meal 1755 1613 1652
Sunflowerseed Meal 279 158 171
Cottonseed Meal 3029 3241 3403
Copra Meal 185 203 208
Total 12059 11979 12568
Source: FAS Database
Favorable socio-economic conditions backed by steady growth in demand of poultry and poultry based
products (poultry meat and eggs, in particular) should help contain a recent rise in feed prices
particularly of soymeal and, more recently, corn. According to industry sources, India’s feed industry is
growing at a CAGR of 5-7% with poultry, cattle and aqua feed sectors emerging as major growth
drivers. Experts report the demand for animal protein and dairy products will increase the compound
feed consumption demand. Generally, high feed prices lead to lower demand and will prompt feed
manufacturers to shift to unconventional feed ingredients, as well as put pressure on prices of daily
protein supplements such as eggs, milk, meat etc.
India’s organized feed industry primarily uses soy meal, as well as peanut, sunflower seed and rapeseed
meal in various formulations. In addition to animal feed use, oil meals like soymeal are increasingly
used in processed food products, healthcare products, and also as low-cost high-protein supplements.
Soymeal is widely used as texturized protein (chunks, flakes, and nuggets), to fortify other food
products (wheat flours, biscuits etc), or for the extraction of protein isolates (with a 90 percent or more
protein content, it is a good substitute for animal protein). Note: the industrial domestic consumption is
reported to be zero (defined as the amount of oilseed meal that is not intended for nutritional purposes
(neither feed for animals nor food for humans), it can include use as a soil additive, fertilizer, or burned
as fuel).
Trade:
Assuming normal market conditions and competitive pricing, Indian oilmeal exports in MY 2018/19 is
forecast to rise modestly from 2.1 MMT this year to 2.9 MMT. The first quarter of MY 2017/18
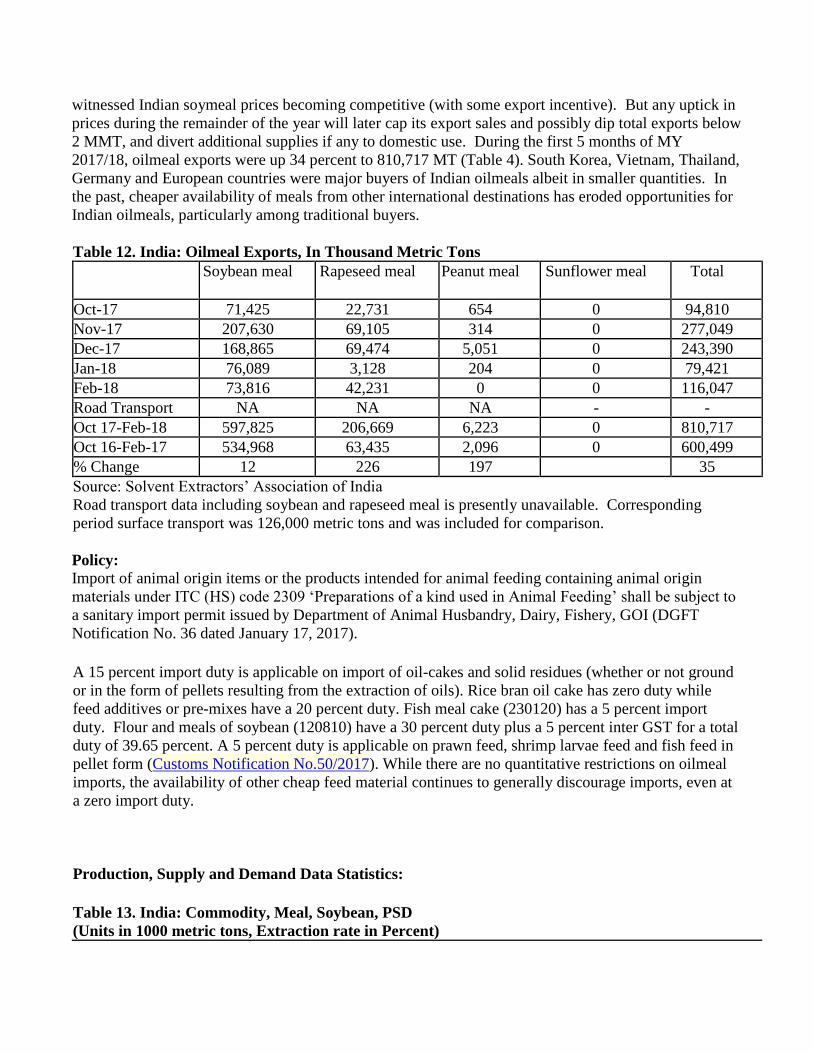
witnessed Indian soymeal prices becoming competitive (with some export incentive). But any uptick in
prices during the remainder of the year will later cap its export sales and possibly dip total exports below
2 MMT, and divert additional supplies if any to domestic use. During the first 5 months of MY
2017/18, oilmeal exports were up 34 percent to 810,717 MT (Table 4). South Korea, Vietnam, Thailand,
Germany and European countries were major buyers of Indian oilmeals albeit in smaller quantities. In
the past, cheaper availability of meals from other international destinations has eroded opportunities for
Indian oilmeals, particularly among traditional buyers.
Table 12. India: Oilmeal Exports, In Thousand Metric Tons
Soybean meal Rapeseed meal Peanut meal Sunflower meal Total
Oct-17 71,425 22,731 654 0 94,810
Nov-17 207,630 69,105 314 0 277,049
Dec-17 168,865 69,474 5,051 0 243,390
Jan-18 76,089 3,128 204 0 79,421
Feb-18 73,816 42,231 0 0 116,047
Road Transport NA NA NA - -
Oct 17-Feb-18 597,825 206,669 6,223 0 810,717
Oct 16-Feb-17 534,968 63,435 2,096 0 600,499
% Change 12 226 197
35
Source: Solvent Extractors’ Association of India
Road transport data including soybean and rapeseed meal is presently unavailable. Corresponding
period surface transport was 126,000 metric tons and was included for comparison.
Policy:
Import of animal origin items or the products intended for animal feeding containing animal origin
materials under ITC (HS) code 2309 ‘Preparations of a kind used in Animal Feeding’ shall be subject to
a sanitary import permit issued by Department of Animal Husbandry, Dairy, Fishery, GOI (DGFT
Notification No. 36 dated January 17, 2017).
A 15 percent import duty is applicable on import of oil-cakes and solid residues (whether or not ground
or in the form of pellets resulting from the extraction of oils). Rice bran oil cake has zero duty while
feed additives or pre-mixes have a 20 percent duty. Fish meal cake (230120) has a 5 percent import
duty. Flour and meals of soybean (120810) have a 30 percent duty plus a 5 percent inter GST for a total
duty of 39.65 percent. A 5 percent duty is applicable on prawn feed, shrimp larvae feed and fish feed in
pellet form (Customs Notification No.50/2017). While there are no quantitative restrictions on oilmeal
imports, the availability of other cheap feed material continues to generally discourage imports, even at
a zero import duty.
Production, Supply and Demand Data Statistics:
Table 13. India: Commodity, Meal, Soybean, PSD
(Units in 1000 metric tons, Extraction rate in Percent)

Meal, Soybean 2016/2017 2017/2018 2018/2019
Market Begin Year Oct 2016 Oct 2017 Oct 2018
India USDA
Official
New
Post
USDA
Official
New
Post
USDA
Official
New
Post
Crush 9200 8000 8770 8300 0 9700
Extr. Rate, 999.9999 0.8 0.8 0.79 0.8 0.00 0.8
Beginning Stocks 119 119 483 125 0 72
Production 7360 6400 7015 6640 0 7760
MY Imports 11 106 7 7 0 100
Total Supply 7490 6625 7505 6772 0 7932
MY Exports 2000 1600 1700 1600 0 2300
Industrial Dom. Cons. 0 0 0 0 0 0
Food Use Dom. Cons. 257 400 350 400 0 450
Feed Waste Dom.
Cons.
4750 4500 5100 4700 0 5000
Total Dom. Cons. 5007 4900 5450 5100 0 5450
Ending Stocks 483 125 355 72 0 182
Total Distribution 7490 6625 7505 6772 0 7932
SME 4750 4500 5100 4700 0 5000
Table 14. India: Commodity, Meal, Rapeseed, PSD
(Units in 1000 metric tons, Extraction rate in Percent)
Meal, Rapeseed 2016/2017 2017/2018 2018/2019
Market Begin
Year Oct 2016 Oct 2017 Oct 2018
India USDA
Official
New
Post
USDA
Official
New
Post
USDA
Official
New
Post
Crush 5800 5700 5640 5500 0 5800
Extr. Rate,
999.9999
0.5966 0.5905 0.594 0.59 0 0.59
Beginning Stocks 245 245 405 411 0 306
Production 3460 3366 3350 3245 0 3422
MY Imports 0 0 0 0 0 0
Total Supply 3705 3611 3755 3656 0 3728
MY Exports 403 400 275 450 0 500
Industrial Dom.
Cons.
0 0 0 0 0 0
Food Use Dom.
Cons.
0 0 0 0 0 0
Feed Waste Dom.
Cons.
2897 2800 3235 2900 0 3000
Total Dom. Cons. 2897 2800 3235 2900 0 3000
Ending Stocks 405 411 245 306 0 228
Total Distribution 3705 3611 3755 3656 0 3728
SME 2061.216 1992.2 2301.703 2063.35 0 2134.5
Table 15. India: Commodity, Meal, Peanut, PSD
(Units in 1000 metric tons, Extraction rate in Percent)
Meal, Peanut 2016/2017 2017/2018 2018/2019
Market Begin
Year Oct 2016 Oct 2017 Oct 2018
India USDA
Official
New
Post
USDA
Official
New
Post
USDA
Official
New
Post
Crush 3750 3800 3600 3600 0 3600
Extr. Rate,
999.9999
0.42 0.4 0.4208 0.4 0.0000 0.4097
Beginning Stocks 0 0 0 0 0 0
Production 1575 1520 1515 1440 0 1475
MY Imports 0 0 0 0 0 0
Total Supply 1575 1520 1515 1440 0 1475
MY Exports 9 3 8 2 0 2
Industrial Dom.
Cons.
0 0 0 0 0 0
Food Use Dom.
Cons.
5 5 5 3 0 3
Feed Waste Dom.
Cons.
1561 1512 1502 1435 0 1470
Total Dom. Cons. 1566 1517 1507 1438 0 1473
Ending Stocks 0 0 0 0 0 0
Total Distribution 1575 1520 1515 1440 0 1475
SME 1754.56 1699.48 1688.24 1612.94 0 1652.28
Table 16. India: Commodity, Meal, Cottonseed, PSD
(Units in 1000 metric tons, Extraction rate in Percent)
Meal, Cottonseed 2016/2017 2017/2018 2018/2019
Market Begin
Year Oct 2016 Oct 2017 Oct 2018
India USDA
Official
New
Post
USDA
Official
New
Post
USDA
Official
New
Post
Crush 8100 8300 8900 8800 0 8900
Extr. Rate,
999.9999
0.4691 0.469 0.4691 0.47 0.0000 0.4702
Beginning Stocks 0 0 0 43 0 129
Production 3800 3893 4175 4136 0 4185
MY Imports 2 0 0 0 0 0
Total Supply 3802 3893 4175 4179 0 4314
MY Exports 64 50 35 50 0 50

Industrial Dom.
Cons.
0 0 0 0 0 0
Food Use Dom.
Cons.
0 0 0 0 0 0
Feed Waste Dom.
Cons.
3738 3800 4140 4000 0 4200
Total Dom. Cons. 3738 3800 4140 4000 0 4200
Ending Stocks 0 43 0 129 0 64
Total Distribution 3802 3893 4175 4179 0 4314
SME 3028.901 3079.14 3354.642 3241.2 0 3403.26
Table 17. India: Commodity, Meal, Sunflowerseed, PSD
(Units in 1000 metric tons, Extraction rate in Percent)
Meal,
Sunflowerseed 2016/2017 2017/2018 2018/2019
Market Begin Year Oct 2016 Oct 2017 Oct 2018
India USDA
Official
New
Post
USDA
Official
New
Post
USDA
Official
New
Post
Crush 240 245 240 286 0 325
Extr. Rate, 999.9999 0.4792 0.4816 0.4792 0.479 0.0000 0.48
Beginning Stocks 0 0 0 0 0 0
Production 115 118 115 137 0 156
MY Imports 306 150 265 100 0 100
Total Supply 421 268 380 237 0 256
MY Exports 2 0 5 0 0 0
Industrial Dom.
Cons.
0 0 0 0 0 0
Food Use Dom.
Cons.
0 0 0 0 0 0
Feed Waste Dom.
Cons.
419 268 375 237 0 256
Total Dom. Cons. 419 268 375 237 0 256
Ending Stocks 0 0 0 0 0 0
Total Distribution 421 268 380 237 0 256
SME 279.473 178.756 250.125 158.079 0 170.752
Table 18. India: Commodity, Meal, Copra, PSD
(Units in 1000 metric tons, Extraction rate in Percent)
Meal, Copra 2016/2017 2017/2018 2018/2019
Market Begin
Year Oct 2016 Oct 2017 Oct 2018
India USDA
Official
New
Post
USDA
Official
New
Post
USDA
Official
New
Post
Crush 668 868 735 795 0 900

Extr. Rate,
999.9999
0.36 0.36 0.35 0.35 0.00 0.36
Beginning Stocks 0 0 0 71 0 95
Production 245 318 262 285 0 325
MY Imports 174 174 120 200 0 100
Total Supply 419 492 382 556 0 520
MY Exports 0 0 0 0 0 0
Industrial Dom.
Cons.
0 0 0 0 0 0
Food Use Dom.
Cons.
10 11 10 11 0 15
Feed Waste Dom.
Cons.
409 410 372 450 0 460
Total Dom. Cons. 419 421 382 461 0 475
Ending Stocks 0 71 0 95 0 45
Total Distribution 419 492 382 556 0 520
SME 184.66 185.11 167.95 203.17 0 207.69
Commodities:
Production:
Table 19. INDIA: TOTAL OILS PSD
OILS (‘000 metric tons) MY 2016/17 MY 2017/18 MY 2018/19
Revised Estimate Forecast
Crush 26,913 27,281 29,225
Beginning Stocks 1,622 1,672 1,514
Production 7,091 7,067 7,507
MY Imports 15,137 16,300 17,400
Total Supply 23,850 25,039 26,421
MY Exports 18 17 10
Industrial Dom. Cons. 860 1,058 1,036
Food Use Dom. Cons. 21,300 22,450 23,730
Feed Waste Dom. Cons. 0 0 0
Oil, Palm
Oil, Coconut
Oil, Sunflowerseed
Oil, Cottonseed
Oil, Peanut
Oil, Rapeseed
Oil, Soybean
Total Dom. Cons. 22,160 23,508 24,766
Ending Stocks 1,672 1,514 1,645
Total Distribution 23,850 25,039 26,421
After remaining flat since last year, domestic vegetable (edible) oil production is expected to rise 6.2
percent to 7.5 MMT in MY 2018/19 on a net rise in availability of oilseeds for crush-to-oil. The
forecast includes 2.3 MMT of rapeseed oil, 1.7 MMT soybean oil, 1.3 MMT of cottonseed oil, 1.2
MMT of peanut oil, 570,000 metric tons (MT) of coconut oil, 250,000 MT of palm oil and 117,000 MT
of sunflower oil. Since the oil content in rapeseed and mustard seed varies from 37% to 42% (at 5%
moisture level) depending on quality and variety of seeds, Post has revised the oil extraction rate from
0.38 to 0.40 to indicate the average rate. Oil content above or below the acceptable range are either sold
at premium or at discount (or even rejected).
Consumption:
Vegetable oil consumption in the forecast year will rise 5.3 percent to 24.8 MMT. A strong demand
from bulk buyers, food business operators, households, and a fast moving consumer generation with
more disposable income are pushing consumption growth. Bulk buyers find its wide application across
food processing (i.e. ingredient for margarines, biscuits, breads, breakfast cereals, instant noodle) and
the non-food sector (shampoos, lipsticks, candles, detergents, chocolates and ice creams).
Almost 70 percent of total consumption demand (food and industrial use) is met through imports (60%
palm and 40% soft oils). Taking into consideration that total domestic consumption includes imported
and locally produced oils, the market share of palm, soybean and sunflower oil is 44%, 23% and 11%,
respectively. India’s per capita consumption which is currently estimated at 18 kg for MY 2017/18 is
still below the world average per capita consumption estimated at 25 kg; in spite of the fact that India is
the third largest consumer of edible oils after China and the European Union.
Key drivers for Rising Edible Oil Consumption:
Growing awareness on health, wellness, food safety and hygiene have led to consumption growth of
cooking oils, such as fortified refined palm, safflower, olive and rice bran oil. Recently, the Food Safety
and Standards Authority of India issued directions allowing food business operators (FBOs) the use of
stickers to place fortification logos on existing labels for edible vegetable oil fortified with vitamin A or
D. This will be in effect until June 30, 2018 and is subject to compliance with other provisions of the
Food Safety and Standards (Fortification of Foods) Regulations, 2017 (IN8009). Cooking oils have
almost 99 percent market penetration in Indian households and is therefore a viable and potent vehicle
for fortification.
Regional Preference is still Paramount: Coconut, peanut and sunflower oil continue to be widely
consumed in south India; peanut and cottonseed oils are more prevalent in Gujarat and Maharashtra;
rapeseed oil is popular in northeast, eastern and northwest India; soybean oil prevails in central India;
and rice bran oil is picking up across eastern India. Cottonseed oil is finding acceptability due to its
light color, neutral odor and blending characteristics with other oils.
Trade:
Edible oil import in MY 2018/19 is forecast at 17.4 MMT of which 10.5 MMT will be palm oil followed
by 4.2 MMT of soybean, 2.2 MMT of sunflower seed oil and 0.5 MMT of rapeseed (canola) oil. Since

consumption is growing at a much faster pace than production, the appetite for imports is also rising
exponentially. As a result, India still is the largest importer of edible oils followed by European Union,
China, and United States.
In the first 5 months of the current marketing year (Table 6), vegetable oil imports have risen marginally
to 5.8 MMT. Based on the current trend, India is likely to import additional 10.5 MMT through
September 2018, thereby lifting total imports in MY 2017/18 to 16.3 MMT. Both soybean and rapeseed
oil imports have declined by more than 15 percent due to a higher import duty on refined oil discouraged
imports. A 3-month temporary suspension of export tax on crude palm imposed by Malaysia
government has helped increased sales of crude palm oil (CPO) to India.
However, industry experts indicate that the direction of future sales will be decided only if there remains
an incentive (for both buyer and seller) past April 7, when the export tax holiday expires. In addition to
the above mentioned imports, the stock at ports and in the pipeline as of March 1, 2018, is reported at
2.2 MMT which is equal to 36 days requirement. India’s monthly requirement is 1.82 MMT (SEA Press
release).
Table 20. India: Edible Oil Imports, In Thousand Metric Tons
Oct-
17
Nov-
17
Dec-
17
Jan-
18
Feb-
18
Oct 2017-
Feb 2018
Oct 2016 –
Feb 2017
%
Change
RBD palmolein 147 147 107 151 202 755 1,138 34
Crude palm oil 597 560 608 673 546 2,984 2,451 22
Crude
palmolein
0 0 0 0 0 0 0
Crude Palm
ker-oil
3 10 8 11 12 43 19 129
Total palm oil 748 717 723 834 760 3,782 3,609 5
Crude soy oil 220 274 79 225 134 932 1,093 15
Refined soy oil 0 0 0 0 0 0 0 0
Total soy oil 220 274 79 225 134 932 1,093 15
Crude sun oil 129 194 237 171 213 943 865 9
Refined sun oil 0 0 0 0 0 0 0 0
Total sun oil 129 194 237 171 213 943 865 9
Rapeseed oil
(Canola)
37 41 20 17 18 133 164 19
Cottonseed Oil 0 0 0 0 0 0 0 0
Safflower oil 0 0 0 0 0 0 0
Coconut oil 0 0 0 0 0 0 0
Grand Total 1,134 1,225 1,058 1,247 1,125 5,790 5,730 1
Stocks:
The ending stock forecast for MY 2018/19 is 1.6 MMT, which is slightly lower than its five year
average of 1.8 MMT and also below the monthly requirement forecast of 2 MMT. Tight stocks will
continue to support growing demand for imported oil to fill the consumption gap. Despite larger
imports, current year stock is also expected to be tight at 1.5 MMT.

Policy:
On March 28, 2018, the Cabinet Committee on Economic Affairs has approved the proposal of the
Ministry of Commerce & Industry to lift the prohibition on export of all varieties of edible oils except
mustard oil. Mustard oil will continue to be exported only in consumer packs up to 5 Kgs and with a
minimum export price (MEP) of US $900 per ton. The Inter-Ministerial Committee, headed by the
Commerce Secretary, mandate to review the export of edible oils in consumer packs & calibrate the
MEP from time to time, has been discontinued. At present, only certain edible oils can be exported in
bulk and other oils only in consumer packs up to 5 Kg with MEP (Source: PIB Press Release).
According to DGFT Notification No. 43/2015-2020, dated March 27, 2017, the following exemptions
are permitted from the prohibition on export of edible oils:
a. Castor oil
b. Coconut oil from all electronic data interchange (EDI) Ports and through all Land Custom
Stations (LCS) on Indo-Nepal, Indo-Bangladesh, Indo-Bhutan and Indo-Pakistan borders.
c. Deemed exports of edible oils (as a raw material input) from a Domestic Tariff Area (DTA) to
100% export oriented units EOUs for production of non-edible goods to be exported
d. Edible oils from a Domestic Tariff Area (DTA) to Special Economic Zones (SEZs) to be
consumed by SEZ units for the manufacture of processed food products, subject to applicable
value addition norms
e. Edible oils produced out of minor forest produce, ITC (HS) Code 15159010,
15159020, 15159030, 15159040, 15179010 and 15219020.
f. Organic edible oils subject to export contracts being registered and certified as
‘organic’ by APEDA
g. Rice Bran oil in bulk irrespective of any pack size.
h. Export of groundnut oil, sesame oil, soybean oil, maize (corn) oil in bulk,
irrespective of any pack size,
Timeline of import duty In addition to the revision of import duty (see Table 7 below), the government also announced a 10
percent social welfare surcharge on all imported goods, including edible oils; which will increase
marginally the import duty (SEA). For example, the import duty on crude soybean oil and crude palm
will now be 33 percent each, while for refined palm oil the duty will be 44 percent. The move was
meant to encourage domestic refining production by taxing Malaysian palm oil imports, and
encouraging fair prices of fall-harvested and winter-planted oilseeds for Indian farmers.
Table 21. India: Import Duty on Edible Oils

Products23rd Sept.
2016
Edu.
Cess
Effective
Duty
11th Aug.
2017
Edu.
Cess
Effective
Duty
17th Nov.
2017
Edu.
Cess
Effective
Duty
2nd Feb.
2018
Social
Welfare
Cess
Effective
Duty
1st March
2018
Social
Welfare
Cess
Effective
Duty
Crude Palm Oil 7.50% 3% 7.73% 15.00% 3% 15.45% 30.00% 3% 30.90% 30.00% 10% 33.00% 44.00% 10% 48.40%
RBD Palmolein 15.00% 3% 15.45% 25.00% 3% 25.75% 40.00% 3% 41.20% 40.00% 10% 44.00% 54.00% 10% 59.40%
RBD Palm Oil 15.00% 3% 15.45% 25.00% 3% 25.75% 40.00% 3% 41.20% 40.00% 10% 44.00% 54.00% 10% 59.40%
Crude Soybean Oil 12.50% 3% 12.87% 17.50% 3% 18.03% 30.00% 3% 30.90% 30.00% 10% 33.00% 30.00% 10% 33.00%
Crude Sunflower Oil 12.50% 3% 12.87% 12.50% 3% 12.87% 25.00% 3% 25.75% 25.00% 10% 27.50% 25.00% 10% 27.50%
Crude Rapeseed Oil 12.50% 3% 12.87% 12.50% 3% 12.87% 25.00% 3% 25.75% 25.00% 10% 27.50% 25.00% 10% 27.50%
Refined Soybean Oil 20.00% 3% 20.60% 20% 3% 20.60% 35.00% 3% 36.05% 35.00% 10% 38.50% 35.00% 10% 38.50%
Refined Sunflower Oil 20.00% 3% 20.60% 20% 3% 20.60% 35.00% 3% 36.05% 35.00% 10% 38.50% 35.00% 10% 38.50%
Refined Rapeseed Oil 20.00% 3% 20.60% 20% 3% 20.60% 35.00% 3% 36.05% 35.00% 10% 38.50% 35.00% 10% 38.50%
Crude Cottonseed Oil -- -- -- -- -- -- 12.50% 3% 12.87% 30.00% 10% 33.00% 30.00% 10% 33.00%
Refined Cottonseed Oil -- -- -- -- -- -- 20.00% 3% 20.60% 35.00% 10% 38.50% 35.00% 10% 38.50%
Table 7. India: Import Duty on Edible Oils
Source: SEA Data Bank
Source: Adopted from SEA of India
The TRQ on refined rape, colza or mustard oil is 150,000 tons in a financial year (Indian fiscal year,
April-March), at an in-quota tariff rate of 45 percent. The TRQ on crude sunflower seed oil and
safflower seed oil is also 150,000 tons in a financial year, with an in-quota tariff rate of 50 percent.
The only genetically engineered (GE) food products currently authorized for import into India are
soybean oil derived from GE soybeans (glyphosate tolerant and five other events) and canola oil derived
from a GE canola (a select herbicide tolerant event). India imports significant quantities of soybean oil,
mainly from Argentina, Brazil, and Paraguay and small quantities of canola oil, mainly from Canada.
All other GE crops, processed products or seeds are technically banned.
On June 22, 2007, the Genetic Engineering and Appraisal Committee (GEAC) granted permanent
approval for importation of soybean oil derived from glyphosate-tolerant soybeans for consumption
after refining. On July 17, 2014, the GEAC also approved importation of soybean oil derived from four
other GE events. Then on September 3, 2015, the GEAC allowed imports of soybean oil derived from
another HT tolerant event (Event FG72 from Bayer Bioscience) and Canola oil derived from HT canola
(Event Ms8xRF3 by Bayer Bioscience Private Ltd). Also, as Bt cotton now accounts for over 90
percent of the total cotton produced in India, most of the cottonseed oil produced and consumed in India
is GM (more info on GAIN Report No. IN6157).
Table 22, India: Vegetable Oil Reference Price as on March 28, 2018 Vegetable Oils $/Metric Ton
Crude Palm Oil 679
RBD Palm Oil 694
Other-Palm Oil 687
Crude Palmolein 698
RBD Palmolein 701
Other-Palmolein 700
Crude Soybean Oil 810
Note: Tariff values are revised from time to time by the GOI to reflect changes in international prices.
The import duty is applied to the current tariff value rather than to the actual invoice value.
Source: http://www.cbec.gov.in/customs/cs-act/notifications/notfns-2013/cs-nt2013/csnt30-2013.htm

Production, Supply and Demand Data Statistics:
Table 23. India: Commodity, Oil, Soybean, PSD
(Unit in 1000 metric tons and Extraction rate in Percent)
Oil, Soybean 2016/2017 2017/2018 2018/2019
Market Begin Year Oct 2016 Oct 2017 Oct 2018
India USDA
Official
New
Post
USDA
Official
New
Post
USDA
Official
New
Post
Crush 9200 8000 8770 8300 0 9700
Extr. Rate, 999.9999 0.1799 0.175 0.1796 0.1795 0.0000 0.1794
Beginning Stocks 512 512 300 311 0 201
Production 1655 1400 1575 1490 0 1740
MY Imports 3534 3700 3645 3900 0 4200
Total Supply 5701 5612 5520 5701 0 6141
MY Exports 1 1 0 0 0 0
Industrial Dom.
Cons.
0 0 0 0 0 0
Food Use Dom.
Cons.
5400 5300 5200 5500 0 5800
Feed Waste Dom.
Cons.
0 0 0 0 0 0
Total Dom. Cons. 5400 5300 5200 5500 0 5800
Ending Stocks 300 311 320 201 0 341
Total Distribution 5701 5612 5520 5701 0 6141
Table 24. India: Commodity, Oil, Rapeseed, PSD
(Unit in 1000 metric tons and Extraction rate in Percent)
Oil, Rapeseed 2016/2017 2017/2018 2018/2019
Market Begin Year Oct 2016 Oct 2017 Oct 2018

India USDA
Official
New
Post
USDA
Official
New
Post
USDA
Official
New
Post
Crush 5800 5700 5640 5500 0 5800
Extr. Rate, 999.9999 0.3793 0.4105 0.3723 0.4091 0.0000 0.4
Beginning Stocks 222 222 219 275 0 233
Production 2200 2340 2100 2250 0 2320
MY Imports 317 300 430 400 0 500
Total Supply 2739 2862 2749 2925 0 3053
MY Exports 3 2 3 2 0 0
Industrial Dom.
Cons.
85 85 80 90 0 0
Food Use Dom.
Cons.
2432 2500 2475 2600 0 2700
Feed Waste Dom.
Cons.
0 0 0 0 0 0
Total Dom. Cons. 2517 2585 2555 2690 0 2700
Ending Stocks 219 275 191 233 0 353
Total Distribution 2739 2862 2749 2925 0 3053
Table 25. India: Commodity, Oil, Peanut, PSD
(Unit in 1000 metric tons and Extraction rate in Percent)
Oil, Peanut 2016/2017 2017/2018 2018/2019
Market Begin Year Oct 2016 Oct 2017 Oct 2018
India USDA
Official
New
Post
USDA
Official
New
Post
USDA
Official
New
Post
Crush 3750 3800 3600 3600 0 3600
Extr. Rate, 999.9999 0.3307 0.34 0.3306 0.34 0.0000 0.3431
Beginning Stocks 82 82 142 249 0 300
Production 1240 1292 1190 1224 0 1235
MY Imports 0 0 0 0 0 0
Total Supply 1322 1374 1332 1473 0 1535
MY Exports 20 15 15 15 0 10
Industrial Dom.
Cons.
10 10 10 8 0 6
Food Use Dom.
Cons.
1150 1100 1235 1150 0 1200
Feed Waste Dom.
Cons.
0 0 0 0 0 0
Total Dom. Cons. 1160 1110 1245 1158 0 1206
Ending Stocks 142 249 72 300 0 319
Total Distribution 1322 1374 1332 1473 0 1535

Table 26. India: Commodity, Oil, Cottonseed, PSD
(Unit in 1000 metric tons and Extraction rate in Percent)
Oil, Cottonseed 2016/2017 2017/2018 2018/2019
Market Begin Year Oct 2016 Oct 2017 Oct 2018
India USDA
Official
New
Post
USDA
Official
New
Post
USDA
Official
New
Post
Crush 8100 8300 8900 8800 0 8900
Extr. Rate, 999.9999 0.1432 0.143 0.1433 0.1432 0.0000 0.1433
Beginning Stocks 37 37 32 89 0 109
Production 1160 1187 1275 1260 0 1275
MY Imports 0 0 0 0 0 0
Total Supply 1197 1224 1307 1349 0 1384
MY Exports 0 0 0 0 0 0
Industrial Dom.
Cons.
45 35 45 40 0 0
Food Use Dom.
Cons.
1120 1100 1220 1200 0 1300
Feed Waste Dom.
Cons.
0 0 0 0 0 0
Total Dom. Cons. 1165 1135 1265 1240 0 1300
Ending Stocks 32 89 42 109 0 84
Total Distribution 1197 1224 1307 1349 0 1384
Table 27. India: Commodity, Oil, Sunflower seed, PSD
(Unit in 1000 metric tons and Extraction rate in Percent)
Oil, Sunflowerseed 2016/2017 2017/2018 2018/2019
Market Begin Year Oct 2016 Oct 2017 Oct 2018
India USDA
Official
New
Post
USDA
Official
New
Post
USDA
Official
New
Post
Crush 240 245 240 286 0 325
Extr. Rate, 999.9999 0.375 0.3673 0.375 0.3601 0.0000 0.36
Beginning Stocks 260 260 398 487 0 390
Production 90 90 90 103 0 117
MY Imports 2151 2137 1850 2000 0 2200
Total Supply 2501 2487 2338 2590 0 2707
MY Exports 3 0 3 0 0 0
Industrial Dom.
Cons.
0 0 0 0 0 0
Food Use Dom.
Cons.
2100 2000 2100 2200 0 2400
Feed Waste Dom.
Cons.
0 0 0 0 0 0

Total Dom. Cons. 2100 2000 2100 2200 0 2400
Ending Stocks 398 487 235 390 0 307
Total Distribution 2501 2487 2338 2590 0 2707
Table 28. India: Commodity, Oil, Coconut, PSD
(Unit in 1000 metric tons and Extraction rate in Percent)
Oil, Coconut 2016/2017 2017/2018 2018/2019
Market Begin Year Oct 2016 Oct 2017 Oct 2018
India USDA
Official
New
Post
USDA
Official
New
Post
USDA
Official
New
Post
Crush 668 868 735 795 0 900
Extr. Rate, 999.9999 0.6362 0.635 0.6259 0.628 0.0000 0.633
Beginning Stocks 10 10 7 32 0 12
Production 425 552 460 500 0 570
MY Imports 0 0 5 0 0 0
Total Supply 435 562 472 532 0 582
MY Exports 23 0 30 0 0 0
Industrial Dom.
Cons.
185 230 200 220 0 230
Food Use Dom.
Cons.
220 300 232 300 0 330
Feed Waste Dom.
Cons.
0 0 0 0 0 0
Total Dom. Cons. 405 530 432 520 0 560
Ending Stocks 7 32 10 12 0 22
Total Distribution 435 562 472 532 0 582
Table 29. India: Commodity, Oil, Palm, PSD
(Unit in 1000 metric tons and Extraction rate in Percent)
Oil, Palm 2016/2017 2017/2018 2018/2019
Market Begin Year Oct 2016 Oct 2017 Oct 2018
India USDA
Official
New
Post
USDA
Official
New
Post
USDA
Official
New
Post
Area Planted 0 296 0 310 0 315
Area Harvested 80 80 80 0 0 0
Beginning Stocks 499 499 390 229 0 269
Production 200 230 200 240 0 250
MY Imports 9341 9000 10600 10000 0 10500
Total Supply 10040 9729 11190 10469 0 11019

MY Exports 0 0 0 0 0 0
Industrial Dom.
Cons.
550 500 600 700 0 800
Food Use Dom.
Cons.
9100 9000 10200 9500 0 10000
Feed Waste Dom.
Cons.
0 0 0 0 0 0
Total Dom. Cons. 9650 9500 10800 10200 0 10800
Ending Stocks 390 229 390 269 0 219
Total Distribution 10040 9729 11190 10469 0 11019
Yield 2.5 2.875 2.5 0 0 0
Commodities:
Select