india on the global dynamism index
TRANSCRIPT
Grant Thornton Dynamism Index: Model developed by the Economist Intelligence Unit (EIU)
Global Dynamism Index 2013
India: Business growth fundamentals
© Grant Thornton India LLP. All rights reserved.

© Grant Thornton India LLP. All rights reserved. 2
© Grant Thornton India LLP. All rights reserved. 3
Contents
Page 4 | A word from our Global CEO
Page 5 | Foreword
Page 6 | Introducing GDI 2013
Page 7 | Methodology
Page 8 | Key findings: Overall dynamism
Page 10 | India's scores on GDI
Page 11| Economics & growth
Page 14 | Business operating environment
Page 17| Financing environment
Page 20 | Labour & human capital
Page 23 | Science & technology
Page 27 | Appendices
Page 30 | About Grant Thornton
Page 32 | Contact us

© Grant Thornton India LLP. All rights reserved. 4
A word from our Global CEO
I am delighted to present the Grant Thornton Global
Dynamism Index (GDI) 2013. The index ranks 60 of the
largest economies in the world on 22 indicators of dynamism
to reveal where business growth environments have improved
most over the past 12 months. The global economy has
undoubtedly entered a new phase following the financial crisis.
As central banks in developed markets begin to taper huge
asset-buying programmes, the era of easy money is drawing to
a close. It looks set to be replaced by a period of slower
growth in both emerging and mature markets.
Despite an improvement in the dynamism of the financing
environment, a difficult year for the economy – the rate of
growth was the slowest in a decade – means India dropped
down the rankings to 48th place this year. The sharp fall in the
rupee has stoked inflation and hampered importing
businesses. But the hope is that recent reforms, such as the
Companies Act and opening of certain sectors to foreign
investment, will boost the dynamism of the economy. Ed Nusbaum
CEO
Grant Thornton International Ltd.
© Grant Thornton India LLP. All rights reserved. 5
Foreword
Over the first decade of the new millennium, the global economy witnessed an epochal shift in power
from the West to East. The extraordinary rise of the emerging markets over the last decade has
redefined the balance of power in the global economy. The fact is mirrored by the Grant Thornton
Global Dynamism Index (GDI), wherein the Philippines (25), China (17), Malaysia (11) and Japan (10)
have all scaled the rankings.
However, the spillover of the economic crises in the developed markets has manifested weaker growth
prospects in emerging markets, which in turn, is expected to critically impact the global growth
forecasts, at least in the short term. This, together with rebalancing of the mass of economic activity,
has entrusted greater responsibility on the emerging economies in the new global economic world
order. India, with its magnitude of economic growth and development in the recent years, continues to
play a critical role in reinforcing the health of the global economy.
The GDI Index model was developed by the Economist Intelligence Unit (EIU) to assess the
dynamism of 60 of the world's largest economies on 22 indicators of dynamism across five categories:
economics & growth, business operating environment, financing environment, labour & human capital
and science & technology. The index underscores the need for an inclusive growth strategy for an
economy. What is particularly alarming is that this year, India has fallen 16 places to 21, from being the
5th most dynamic country in terms of economics & growth in the last year's index. Clearly, the
sentiment has changed quite dramatically.
The top rank in terms of the overall measure of dynamism is occupied by Australia, which performed
consistently across all five categories: economics & growth, business operating environment, financing
environment, labour & human capital and science & technology. Australia performed strongly in 2012
as well, and has climbed seven places in 2013 to the top position, driven largely by the relative
improvements in labour productivity and real Gross Domestic Product (GDP) growth.
As the growing economic uncertainties continue to pose a risk to derail the overall global economic
development, I am hopeful that the GDI results will provide economies the requisite foresight to
inculcate best practices, address the ease of doing business and thereby attempt to overcome growth
challenges.
With best regards,
Vishesh C. Chandiok
National Managing Partner
Grant Thornton India LLP
© Grant Thornton India LLP. All rights reserved. 6
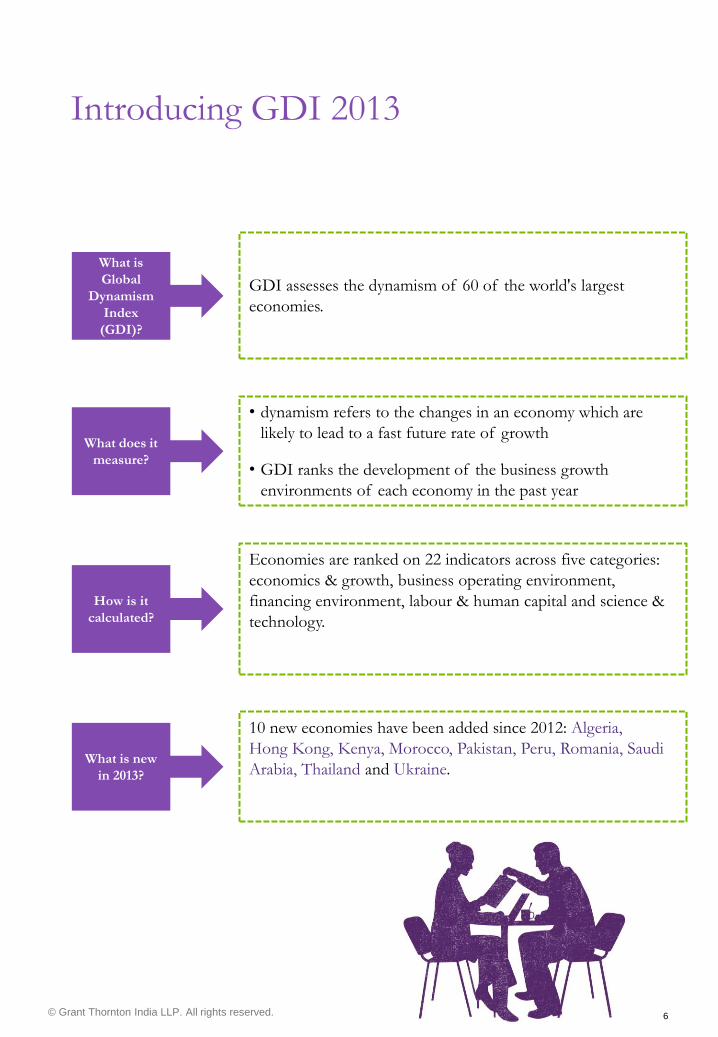
Introducing GDI 2013
What is
Global
Dynamism
Index
(GDI)?
GDI assesses the dynamism of 60 of the world's largest
economies.
What does it
measure?
• dynamism refers to the changes in an economy which are
likely to lead to a fast future rate of growth
• GDI ranks the development of the business growth
environments of each economy in the past year
How is it
calculated?
Economies are ranked on 22 indicators across five categories:
economics & growth, business operating environment,
financing environment, labour & human capital and science &
technology.
What is new
in 2013?
10 new economies have been added since 2012: Algeria,
Hong Kong, Kenya, Morocco, Pakistan, Peru, Romania, Saudi
Arabia, Thailand and Ukraine.
© Grant Thornton India LLP. All rights reserved. 7
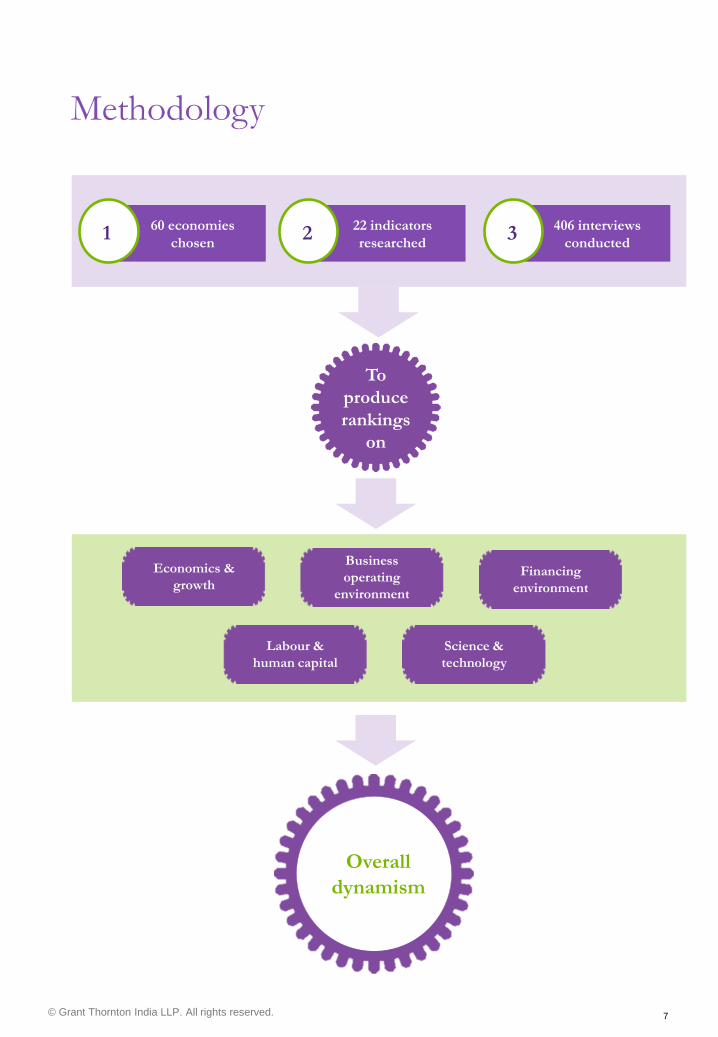
Methodology
1 60 economies
chosen 2
22 indicators
researched 3
406 interviews
conducted
To
produce
rankings
on
Financing
environment
Labour &
human capital
Business
operating
environment
Science &
technology
Economics &
growth
Overall
dynamism
© Grant Thornton India LLP. All rights reserved. 8
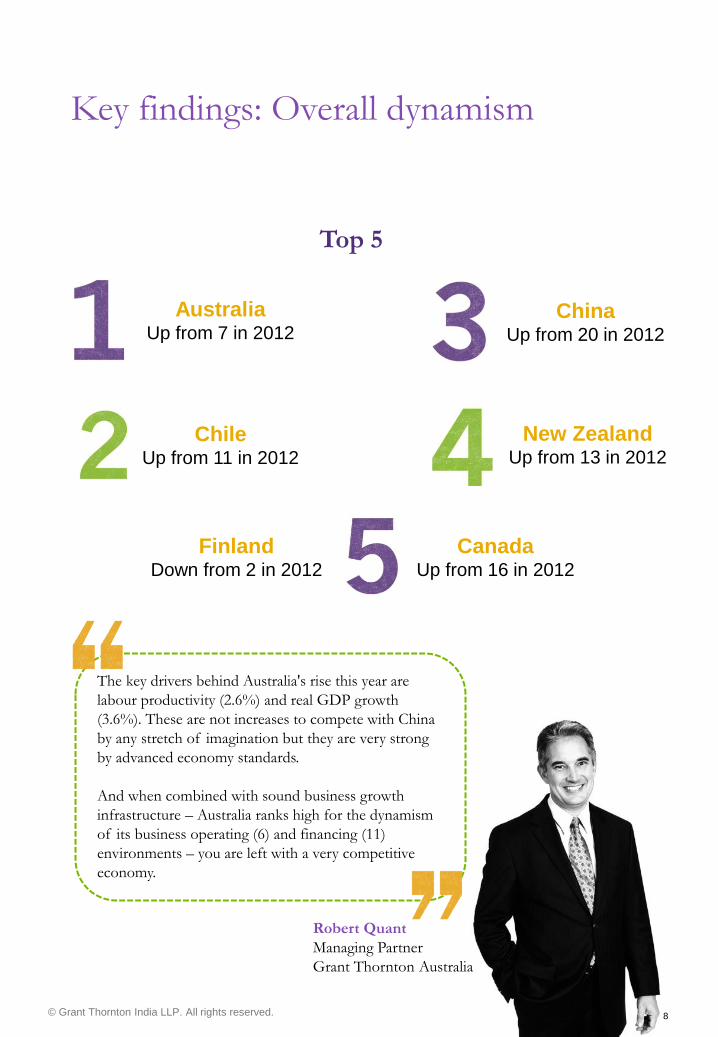
Key findings: Overall dynamism
Top 5
Australia Up from 7 in 2012
Chile Up from 11 in 2012
New Zealand Up from 13 in 2012
Canada Up from 16 in 2012
Finland Down from 2 in 2012
China Up from 20 in 2012
The key drivers behind Australia's rise this year are
labour productivity (2.6%) and real GDP growth
(3.6%). These are not increases to compete with China
by any stretch of imagination but they are very strong
by advanced economy standards.
And when combined with sound business growth
infrastructure – Australia ranks high for the dynamism
of its business operating (6) and financing (11)
environments – you are left with a very competitive
economy.
Robert Quant
Managing Partner
Grant Thornton Australia
© Grant Thornton India LLP. All rights reserved. 9
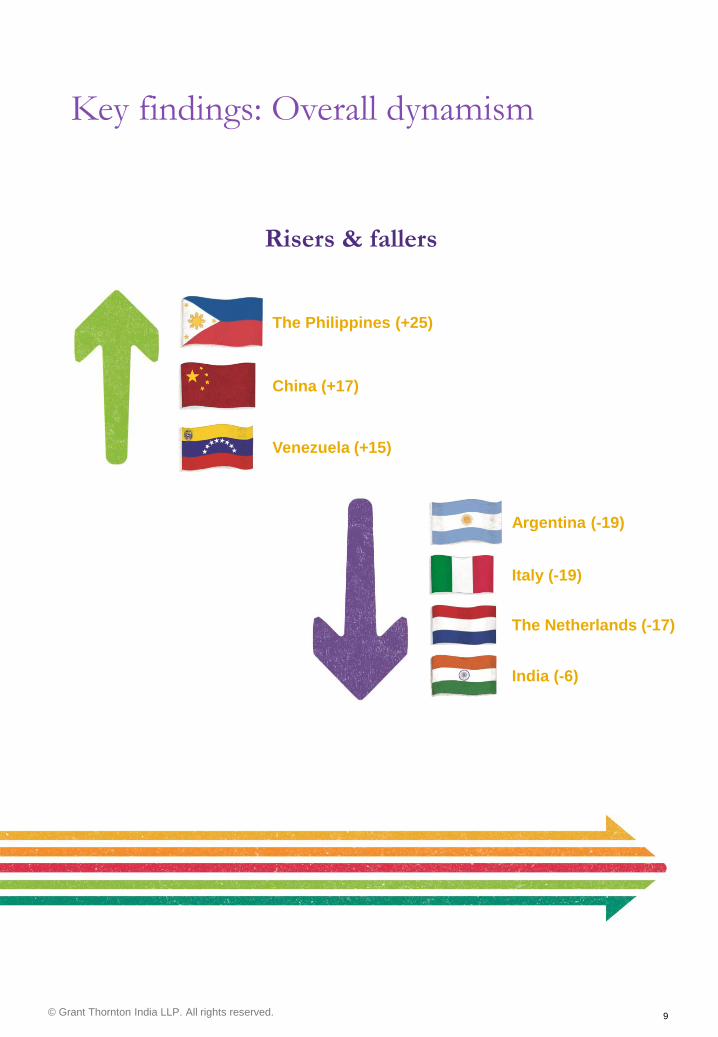
Key findings: Overall dynamism
Risers & fallers
The Philippines (+25)
China (+17)
Venezuela (+15)
Argentina (-19)
Italy (-19)
The Netherlands (-17)
India (-6)
© Grant Thornton India LLP. All rights reserved. 10
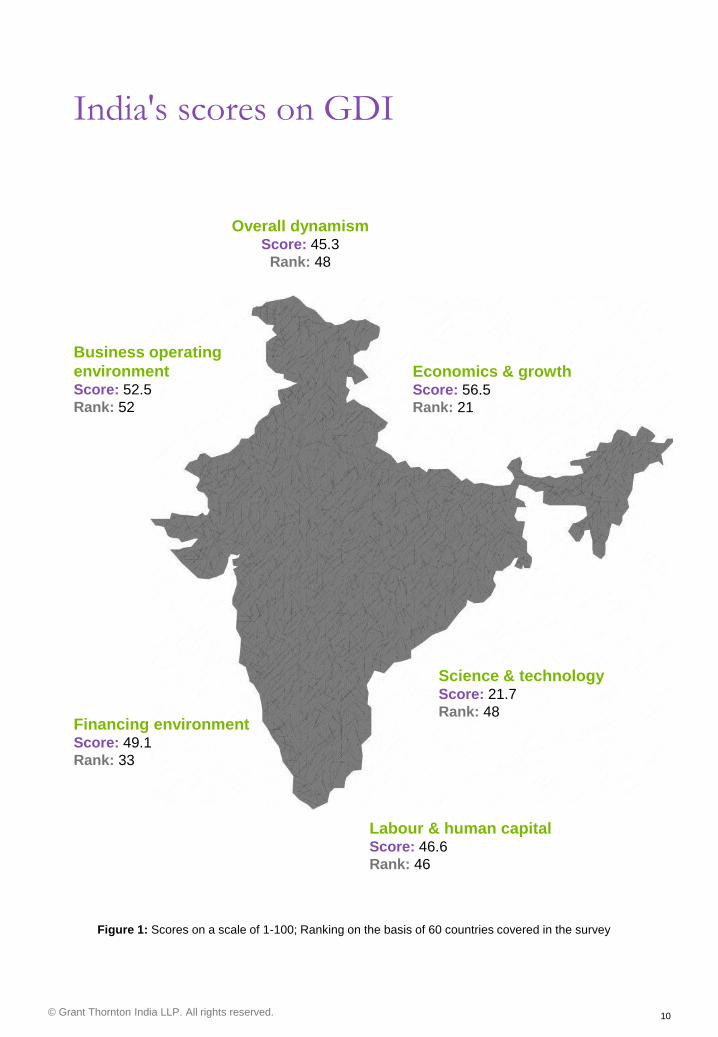
India's scores on GDI
Figure 1: Scores on a scale of 1-100; Ranking on the basis of 60 countries covered in the survey
Economics & growth Score: 56.5
Rank: 21
Overall dynamism Score: 45.3
Rank: 48
Business operating
environment Score: 52.5
Rank: 52
Science & technology Score: 21.7
Rank: 48
Labour & human capital Score: 46.6
Rank: 46
Financing environment Score: 49.1
Rank: 33
© Grant Thornton India LLP. All rights reserved. 11
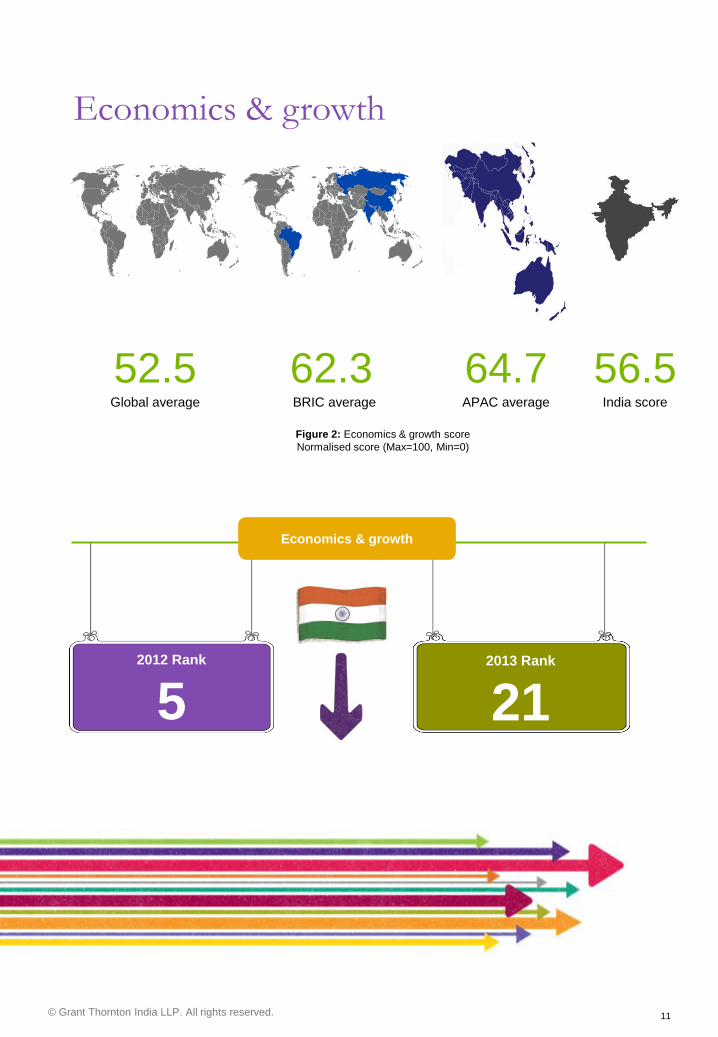
Economics & growth
Figure 2: Economics & growth score
Normalised score (Max=100, Min=0)
62.3 BRIC average
64.7 APAC average
56.5 India score
52.5 Global average
Economics & growth
2012 Rank
5
2013 Rank
21
© Grant Thornton India LLP. All rights reserved. 12
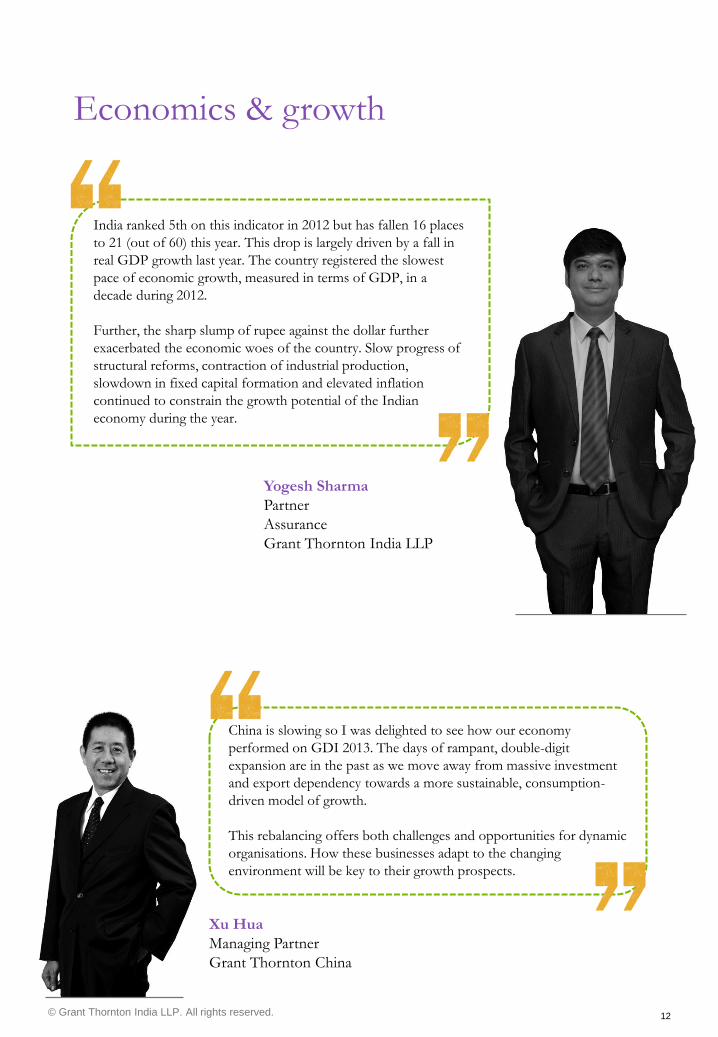
Yogesh Sharma
Partner
Assurance
Grant Thornton India LLP
China is slowing so I was delighted to see how our economy
performed on GDI 2013. The days of rampant, double-digit
expansion are in the past as we move away from massive investment
and export dependency towards a more sustainable, consumption-
driven model of growth.
This rebalancing offers both challenges and opportunities for dynamic
organisations. How these businesses adapt to the changing
environment will be key to their growth prospects.
Xu Hua
Managing Partner
Grant Thornton China
India ranked 5th on this indicator in 2012 but has fallen 16 places
to 21 (out of 60) this year. This drop is largely driven by a fall in
real GDP growth last year. The country registered the slowest
pace of economic growth, measured in terms of GDP, in a
decade during 2012.
Further, the sharp slump of rupee against the dollar further
exacerbated the economic woes of the country. Slow progress of
structural reforms, contraction of industrial production,
slowdown in fixed capital formation and elevated inflation
continued to constrain the growth potential of the Indian
economy during the year.
Economics & growth
© Grant Thornton India LLP. All rights reserved. 13
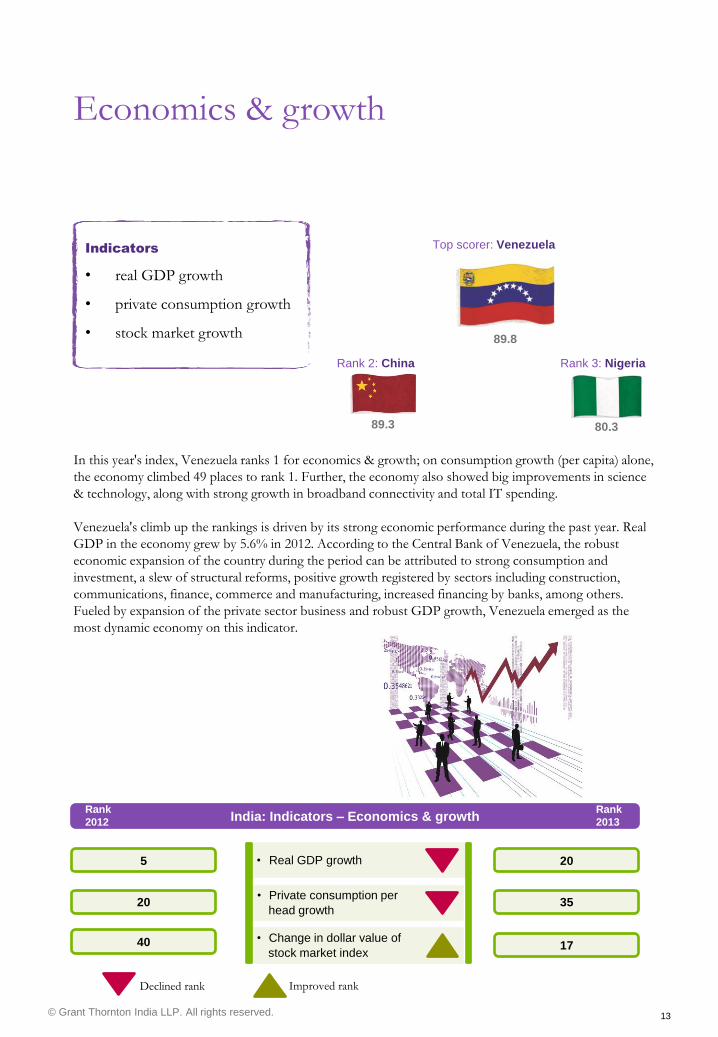
Indicators
• real GDP growth
• private consumption growth
• stock market growth
• Change in dollar value of
stock market index
• Private consumption per
head growth
• Real GDP growth
India: Indicators – Economics & growth Rank
2012
Rank
2013
5 20
20 35
40 17
In this year's index, Venezuela ranks 1 for economics & growth; on consumption growth (per capita) alone,
the economy climbed 49 places to rank 1. Further, the economy also showed big improvements in science
& technology, along with strong growth in broadband connectivity and total IT spending.
Venezuela's climb up the rankings is driven by its strong economic performance during the past year. Real
GDP in the economy grew by 5.6% in 2012. According to the Central Bank of Venezuela, the robust
economic expansion of the country during the period can be attributed to strong consumption and
investment, a slew of structural reforms, positive growth registered by sectors including construction,
communications, finance, commerce and manufacturing, increased financing by banks, among others.
Fueled by expansion of the private sector business and robust GDP growth, Venezuela emerged as the
most dynamic economy on this indicator.
Top scorer: Venezuela
89.8
Rank 2: China
89.3
Rank 3: Nigeria
80.3
Improved rank Declined rank
Economics & growth
© Grant Thornton India LLP. All rights reserved. 14
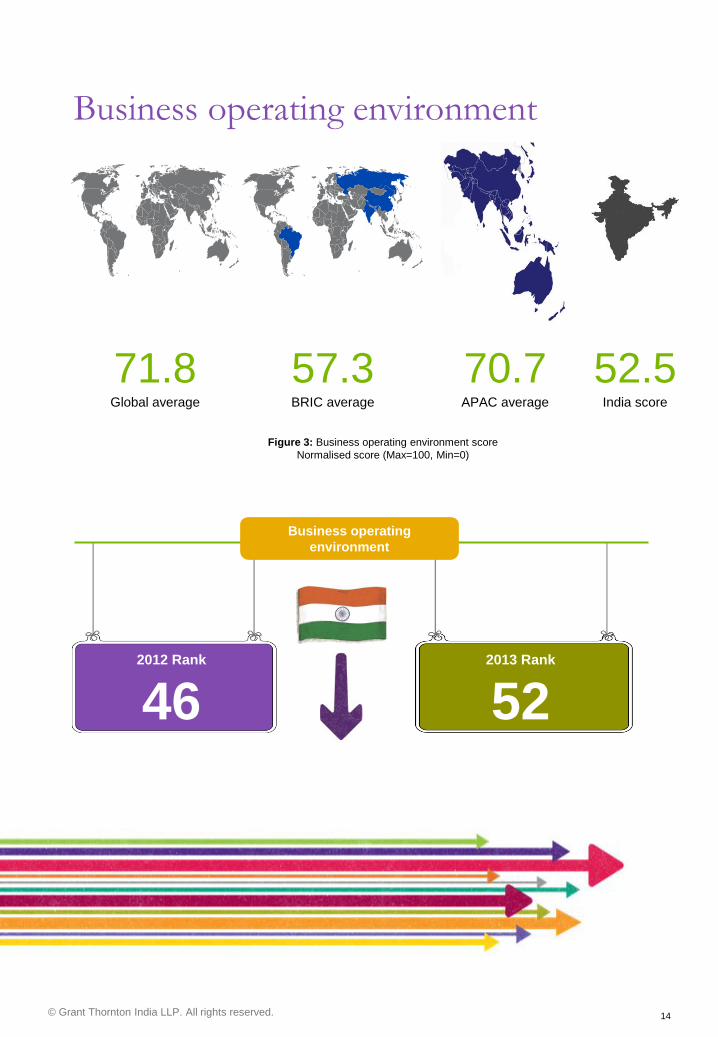
Business operating environment
Figure 3: Business operating environment score
Normalised score (Max=100, Min=0)
57.3 BRIC average
70.7 APAC average
52.5 India score
71.8 Global average
Business operating
environment
2012 Rank
46
2013 Rank
52
© Grant Thornton India LLP. All rights reserved. 15
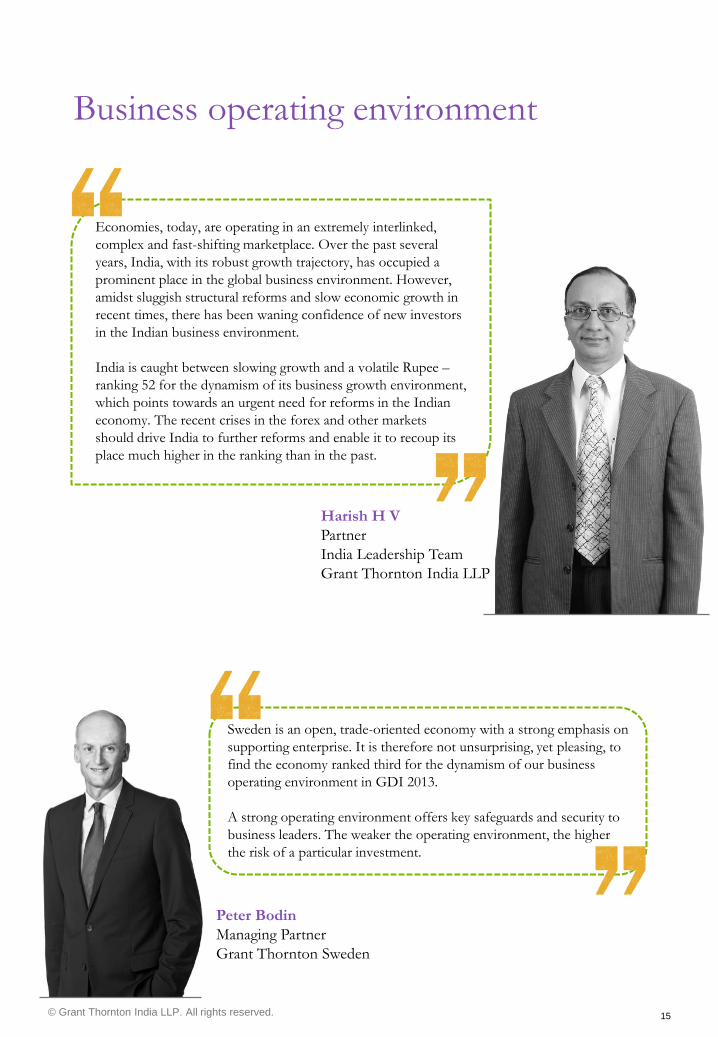
Business operating environment
Harish H V
Partner
India Leadership Team
Grant Thornton India LLP
Economies, today, are operating in an extremely interlinked,
complex and fast-shifting marketplace. Over the past several
years, India, with its robust growth trajectory, has occupied a
prominent place in the global business environment. However,
amidst sluggish structural reforms and slow economic growth in
recent times, there has been waning confidence of new investors
in the Indian business environment.
India is caught between slowing growth and a volatile Rupee –
ranking 52 for the dynamism of its business growth environment,
which points towards an urgent need for reforms in the Indian
economy. The recent crises in the forex and other markets
should drive India to further reforms and enable it to recoup its
place much higher in the ranking than in the past.
Sweden is an open, trade-oriented economy with a strong emphasis on
supporting enterprise. It is therefore not unsurprising, yet pleasing, to
find the economy ranked third for the dynamism of our business
operating environment in GDI 2013.
A strong operating environment offers key safeguards and security to
business leaders. The weaker the operating environment, the higher
the risk of a particular investment.
Peter Bodin
Managing Partner
Grant Thornton Sweden
© Grant Thornton India LLP. All rights reserved. 16
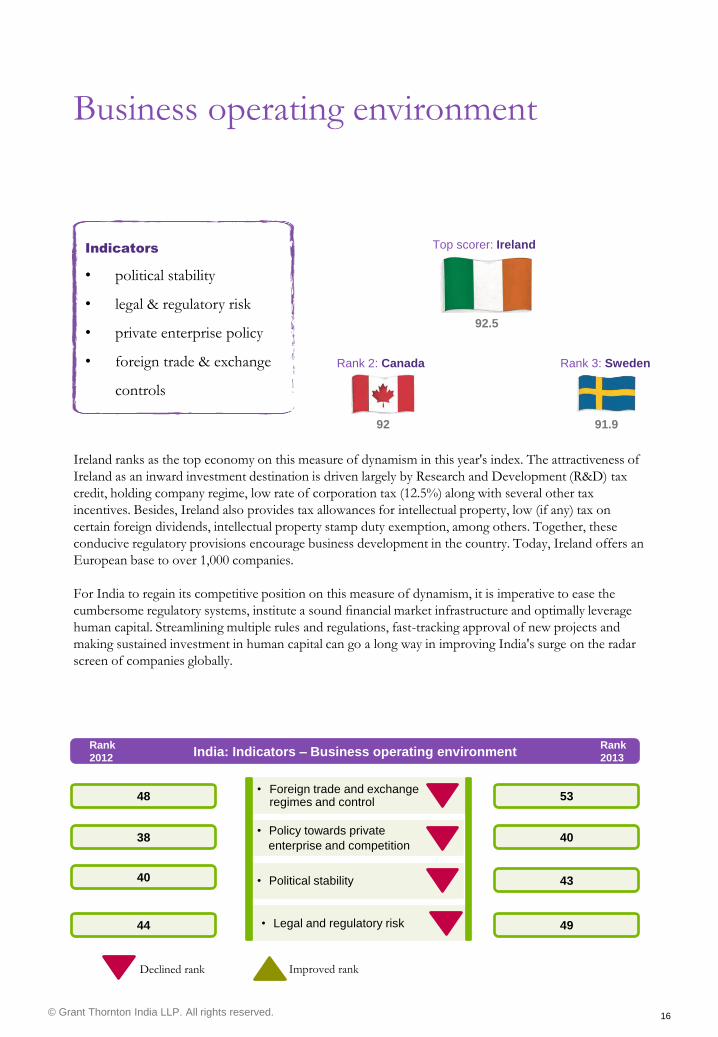
Business operating environment
Indicators
• political stability
• legal & regulatory risk
• private enterprise policy
• foreign trade & exchange
controls
Ireland ranks as the top economy on this measure of dynamism in this year's index. The attractiveness of
Ireland as an inward investment destination is driven largely by Research and Development (R&D) tax
credit, holding company regime, low rate of corporation tax (12.5%) along with several other tax
incentives. Besides, Ireland also provides tax allowances for intellectual property, low (if any) tax on
certain foreign dividends, intellectual property stamp duty exemption, among others. Together, these
conducive regulatory provisions encourage business development in the country. Today, Ireland offers an
European base to over 1,000 companies.
For India to regain its competitive position on this measure of dynamism, it is imperative to ease the
cumbersome regulatory systems, institute a sound financial market infrastructure and optimally leverage
human capital. Streamlining multiple rules and regulations, fast-tracking approval of new projects and
making sustained investment in human capital can go a long way in improving India's surge on the radar
screen of companies globally.
Top scorer: Ireland
92.5
Rank 2: Canada
92
Rank 3: Sweden
91.9
• Legal and regulatory risk
• Political stability
• Policy towards private
enterprise and competition
• Foreign trade and exchange regimes and control
India: Indicators – Business operating environment Rank
2012
Rank
2013
48 53
38 40
40 43
44 49
Improved rank Declined rank
© Grant Thornton India LLP. All rights reserved. 17
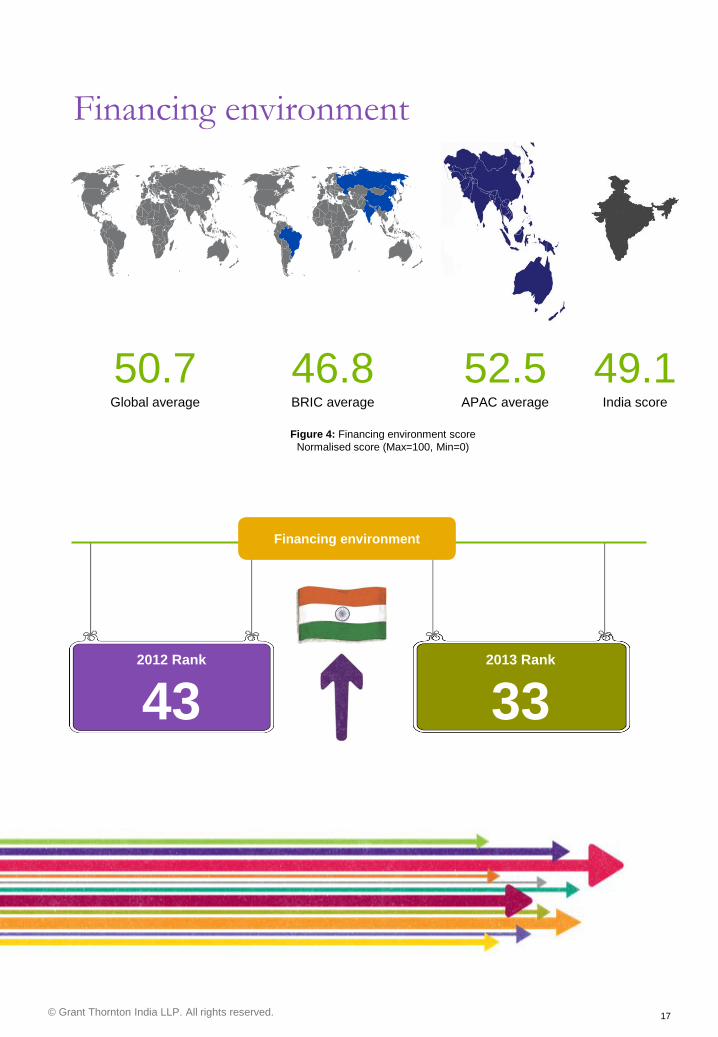
Figure 4: Financing environment score
Normalised score (Max=100, Min=0)
Financing environment
46.8 BRIC average
52.5 APAC average
49.1 India score
2012 Rank
43
Financing environment
2013 Rank
33
50.7 Global average
© Grant Thornton India LLP. All rights reserved. 18
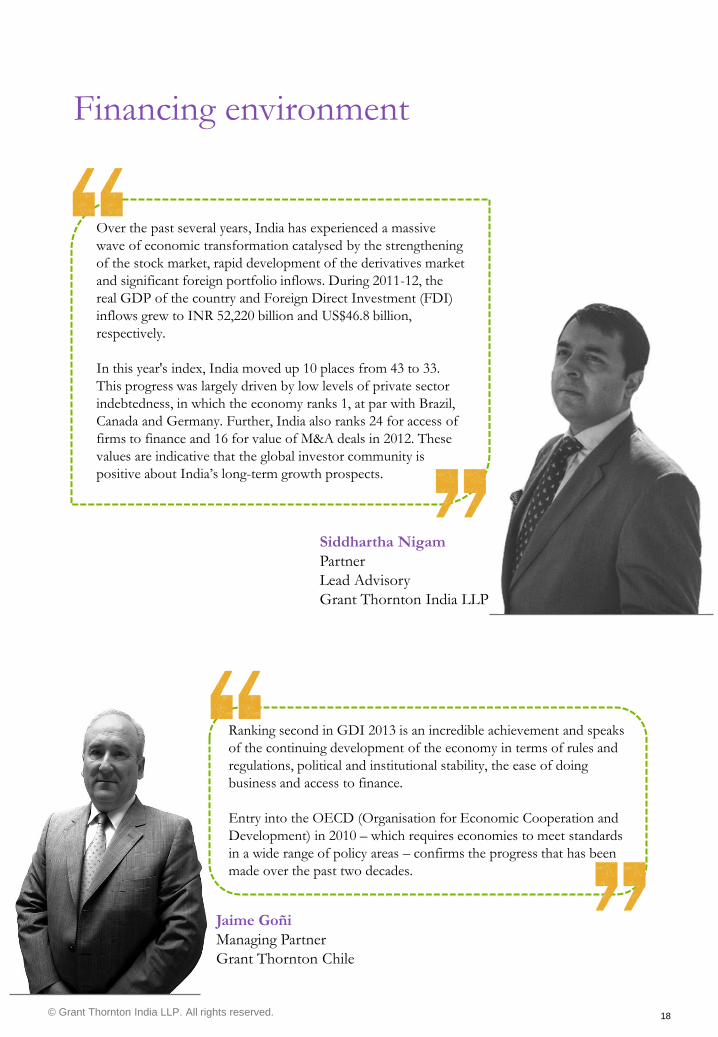
Financing environment
Siddhartha Nigam
Partner
Lead Advisory
Grant Thornton India LLP
Over the past several years, India has experienced a massive
wave of economic transformation catalysed by the strengthening
of the stock market, rapid development of the derivatives market
and significant foreign portfolio inflows. During 2011-12, the
real GDP of the country and Foreign Direct Investment (FDI)
inflows grew to INR 52,220 billion and US$46.8 billion,
respectively.
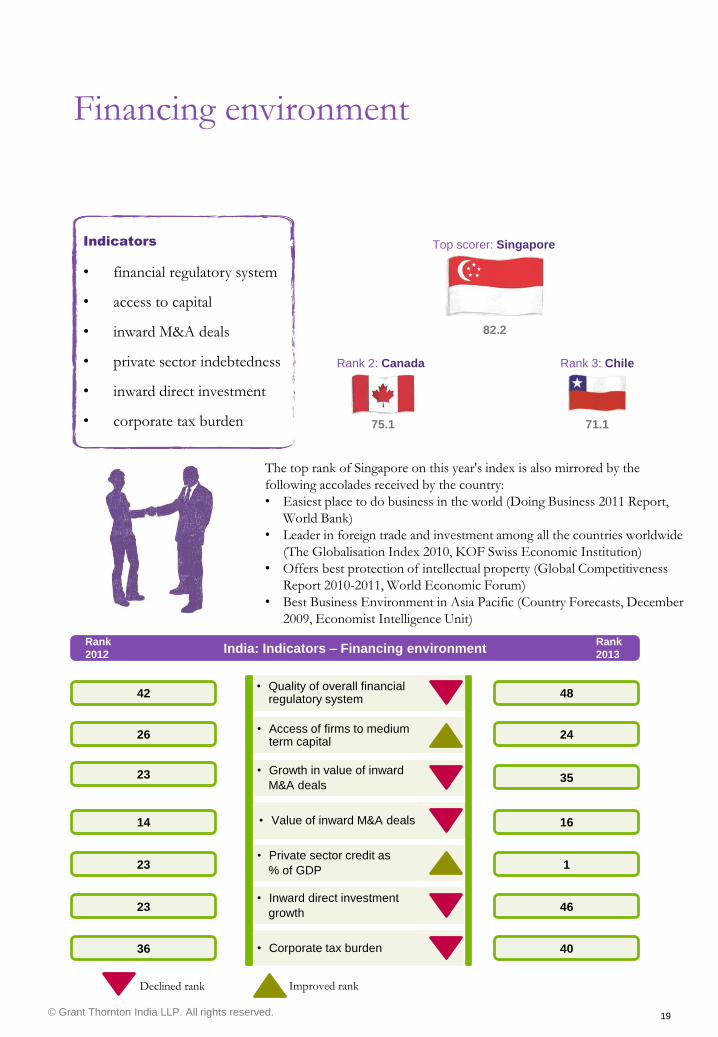
In this year's index, India moved up 10 places from 43 to 33.
This progress was largely driven by low levels of private sector
indebtedness, in which the economy ranks 1, at par with Brazil,
Canada and Germany. Further, India also ranks 24 for access of
firms to finance and 16 for value of M&A deals in 2012. These
values are indicative that the global investor community is
positive about India’s long-term growth prospects.
Ranking second in GDI 2013 is an incredible achievement and speaks
of the continuing development of the economy in terms of rules and
regulations, political and institutional stability, the ease of doing
business and access to finance.
Entry into the OECD (Organisation for Economic Cooperation and
Development) in 2010 – which requires economies to meet standards
in a wide range of policy areas – confirms the progress that has been
made over the past two decades.
Jaime Goñi
Managing Partner
Grant Thornton Chile
© Grant Thornton India LLP. All rights reserved. 19
• Corporate tax burden
• Inward direct investment
growth
• Private sector credit as
% of GDP
• Value of inward M&A deals
• Growth in value of inward
M&A deals
• Access of firms to medium term capital
• Quality of overall financial regulatory system
Top scorer: Singapore
82.2
Financing environment
Indicators
• financial regulatory system
• access to capital
• inward M&A deals
• private sector indebtedness
• inward direct investment
• corporate tax burden
India: Indicators – Financing environment Rank
2012
Rank
2013
42 48
26 24
23 35
14 16
23 1
23 46
The top rank of Singapore on this year's index is also mirrored by the
following accolades received by the country:
• Easiest place to do business in the world (Doing Business 2011 Report,
World Bank)
• Leader in foreign trade and investment among all the countries worldwide
(The Globalisation Index 2010, KOF Swiss Economic Institution)
• Offers best protection of intellectual property (Global Competitiveness
Report 2010-2011, World Economic Forum)
• Best Business Environment in Asia Pacific (Country Forecasts, December
2009, Economist Intelligence Unit)
36 40
Rank 2: Canada
75.1
Rank 3: Chile
71.1
Improved rank Declined rank

© Grant Thornton India LLP. All rights reserved. 20
Labour & human capital
Figure 5: Labour & human capital score
Normalised score (Max=100, Min=0)
56.9 BRIC average
59.5 APAC average
46.6 India score
53 Global average
Labour & human capital
2012 Rank
33
2013 Rank
46

© Grant Thornton India LLP. All rights reserved. 21
Labour & human capital
Vinamra Shastri
Partner and Practice Leader
Business Advisory Services
Grant Thornton India LLP
Human capital is India’s greatest asset. The fall in rankings raises
pertinent questions about the lack of dynamism on offer to our
workforce, and by virtue of the same on the growth outcomes of the
Indian economy. The slowdown of the economy, and more
importantly the deceleration of the industrial activity has been the chief
cause of this decline.
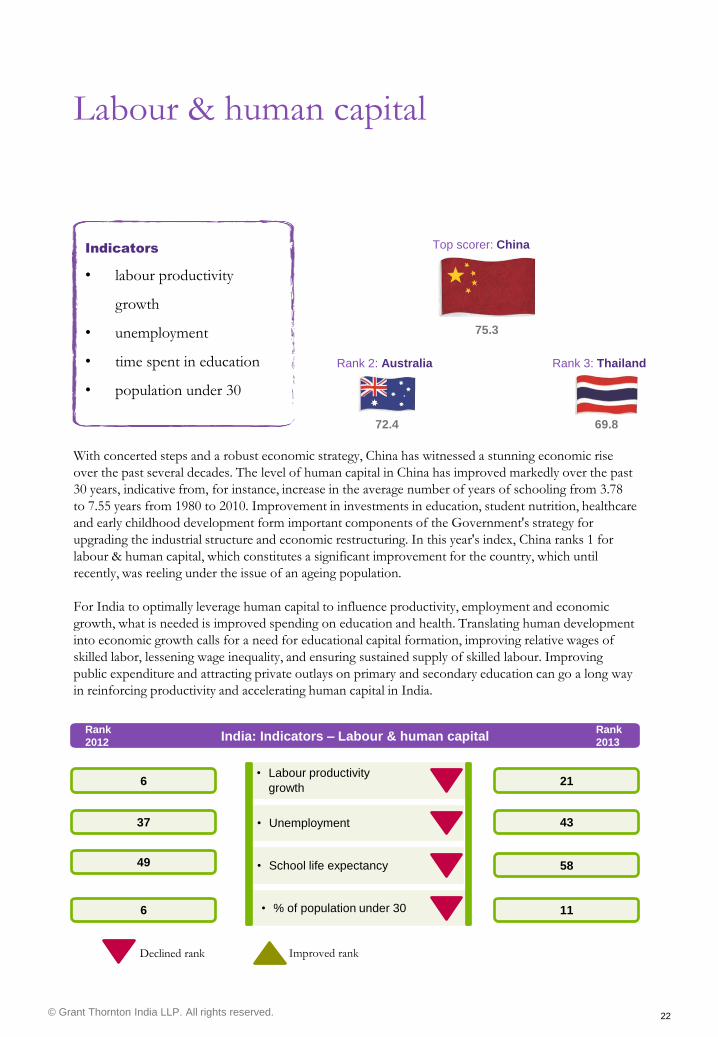
In this year's index, India dropped 13 places, from 33 to 46. Besides,
the economy that ranked 6 for labour productivity growth in 2012,
dropped to 21 this year. What is particularly alarming is that the
economy ranks only above Nigeria and Pakistan among all the 60
economies in terms of the time spent in education. We can only hope
that with the measures being taken by the government, the Central
Bank and the private sector, the policy roadblocks and capital
constraints get removed to create the desired environment for India to
revive its growth and dynamism again.
The Philippine economy is growing fast. Output expanded by 6.8%
in 2012 and whilst remittances climbed to a record high of US$23.8
billion in 2012, their share of GDP actually dropped to 8.5%, down
from 9% in 2011. The key point here is that the Philippines is
starting to realise its potential domestically.
This underlines the meteoric rise of the Philippines on GDI 2013.
We climbed 25 places to rank 21 on the index this year. This means
our business growth environment improved faster than any other
in 2012.
Marivic Españo
Chair and CEO
Punongbayan & Araullo Grant Thornton – The Philippines
© Grant Thornton India LLP. All rights reserved. 22
Indicators
• labour productivity
growth
• unemployment
• time spent in education
• population under 30
Labour & human capital
• % of population under 30
• School life expectancy
• Unemployment
• Labour productivity
growth
India: Indicators – Labour & human capital Rank
2012
Rank
2013
6 21
37 43
49 58
6 11
With concerted steps and a robust economic strategy, China has witnessed a stunning economic rise
over the past several decades. The level of human capital in China has improved markedly over the past
30 years, indicative from, for instance, increase in the average number of years of schooling from 3.78
to 7.55 years from 1980 to 2010. Improvement in investments in education, student nutrition, healthcare
and early childhood development form important components of the Government's strategy for
upgrading the industrial structure and economic restructuring. In this year's index, China ranks 1 for
labour & human capital, which constitutes a significant improvement for the country, which until
recently, was reeling under the issue of an ageing population.
For India to optimally leverage human capital to influence productivity, employment and economic
growth, what is needed is improved spending on education and health. Translating human development
into economic growth calls for a need for educational capital formation, improving relative wages of
skilled labor, lessening wage inequality, and ensuring sustained supply of skilled labour. Improving
public expenditure and attracting private outlays on primary and secondary education can go a long way
in reinforcing productivity and accelerating human capital in India.
Top scorer: China
75.3
Rank 2: Australia
72.4
Rank 3: Thailand
69.8
Improved rank Declined rank
© Grant Thornton India LLP. All rights reserved. 23
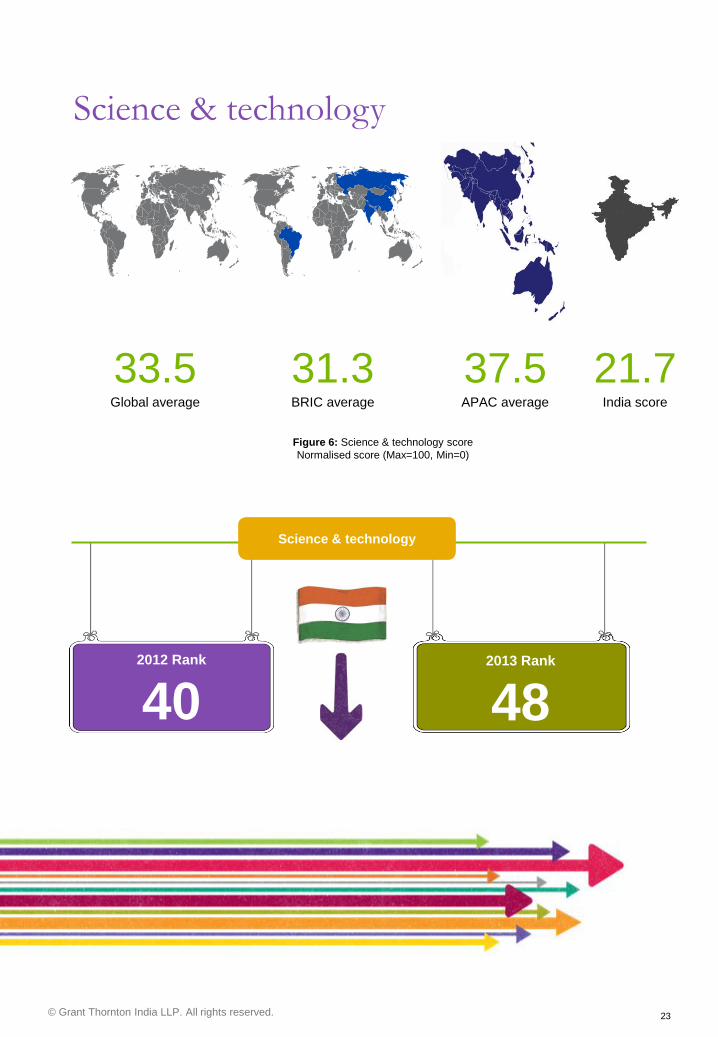
Science & technology
Figure 6: Science & technology score
Normalised score (Max=100, Min=0)
31.3 BRIC average
37.5 APAC average
21.7 India score
33.5 Global average
Science & technology
2012 Rank
40
2013 Rank
48

© Grant Thornton India LLP. All rights reserved. 24
Science & technology
Raja Lahiri
Partner
Transaction Advisory Services
Grant Thornton India LLP
Science & technology is a measure of the ability of an economy’s
infrastructure to support the growth of dynamic businesses. Investment
in science & technology indicates whether an economy's infrastructure
can keep pace with dynamic business growth needs.
Taking cue from South Korea, the top scorer in this year's index, India
needs to improve its investment in R&D, build its technological
competence across sectors, do away with obsolete technologies in many
industries, and take comprehensive steps to promote industry-academia
interaction.
While India has positioned itself as a global leader in the Information
Technology (IT) as well as knowledge services industries, driven mainly
by its education system, skilled workforce and increasing collaboration
with the Western markets, the economy now needs to enhance its focus
on building innovation and information technology products to
enhance its technological and scientific capability.
Israel is a major player in science & technological innovation. In fact,
perhaps only the United States is more prominent globally.
Did you know, for example, Israel has the highest concentration of hi-
tech companies in the world outside of Silicon Valley? Or that Israel
has more scientists and technicians per capita than any other
economy?
Ilanit Halperin
Partner
Grant Thornton Israel
© Grant Thornton India LLP. All rights reserved. 25
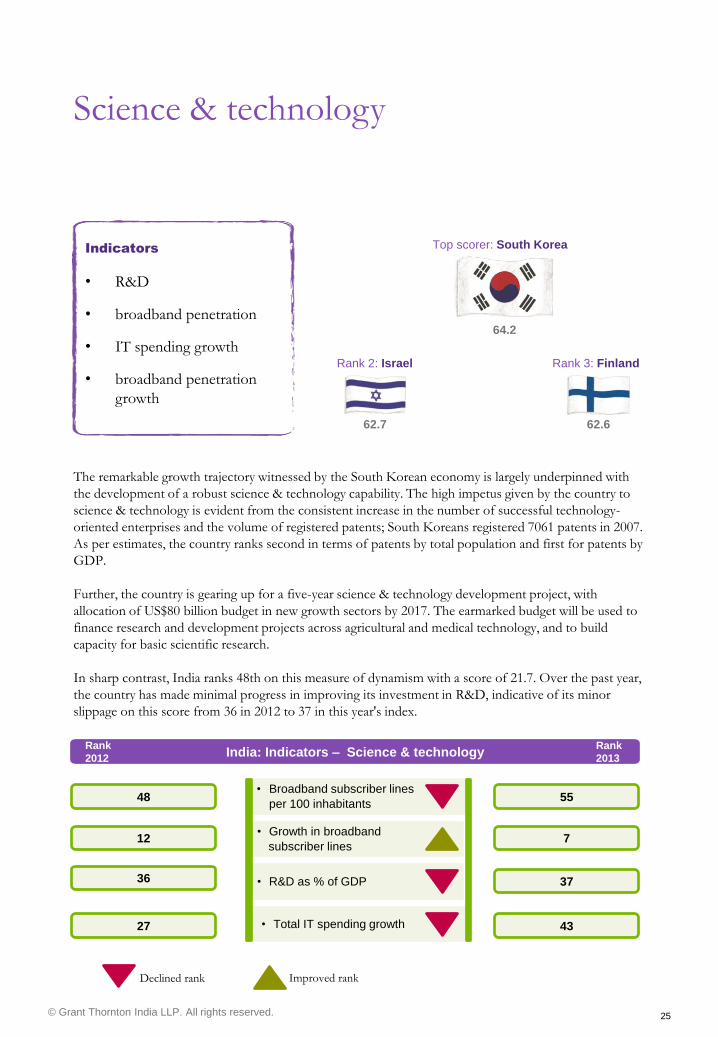
Indicators
• R&D
• broadband penetration
• IT spending growth
• broadband penetration
growth
Science & technology
• Total IT spending growth
• R&D as % of GDP
• Growth in broadband
subscriber lines
• Broadband subscriber lines
per 100 inhabitants
India: Indicators – Science & technology Rank
2012
Rank
2013
48 55
12 7
36 37
27 43
The remarkable growth trajectory witnessed by the South Korean economy is largely underpinned with
the development of a robust science & technology capability. The high impetus given by the country to
science & technology is evident from the consistent increase in the number of successful technology-
oriented enterprises and the volume of registered patents; South Koreans registered 7061 patents in 2007.
As per estimates, the country ranks second in terms of patents by total population and first for patents by
GDP.
Further, the country is gearing up for a five-year science & technology development project, with
allocation of US$80 billion budget in new growth sectors by 2017. The earmarked budget will be used to
finance research and development projects across agricultural and medical technology, and to build
capacity for basic scientific research.
In sharp contrast, India ranks 48th on this measure of dynamism with a score of 21.7. Over the past year,
the country has made minimal progress in improving its investment in R&D, indicative of its minor
slippage on this score from 36 in 2012 to 37 in this year's index.
Top scorer: South Korea
64.2
Rank 2: Israel
62.7
Rank 3: Finland
62.6
Improved rank Declined rank

© Grant Thornton India LLP. All rights reserved. 26
© 2013 Grant Thornton India LLP. All rights reserved.
Grant Thornton International and the member firms are not a worldwide partnership. Services are delivered independently by member firms.
.
Full disclaimer available on www.gti.org.
© Grant Thornton India LLP. All rights reserved. 27
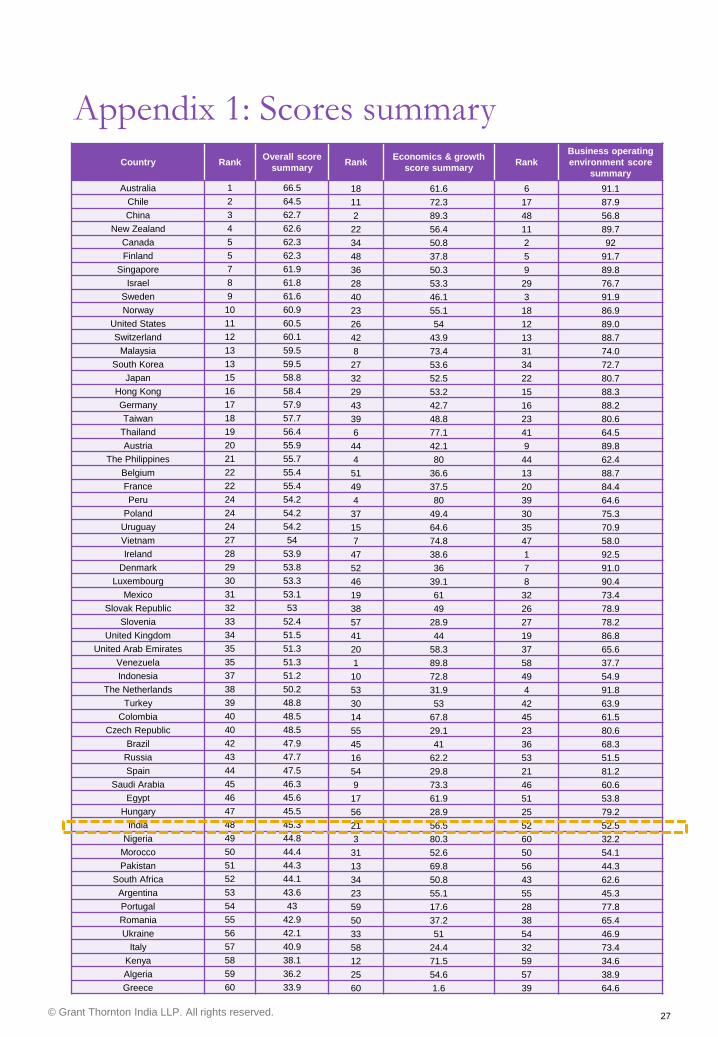
Appendix 1: Scores summary
Country Rank Overall score
summary Rank
Economics & growth
score summary Rank
Business operating
environment score
summary
Australia 1 66.5 18 61.6 6 91.1
Chile 2 64.5 11 72.3 17 87.9
China 3 62.7 2 89.3 48 56.8
New Zealand 4 62.6 22 56.4 11 89.7
Canada 5 62.3 34 50.8 2 92
Finland 5 62.3 48 37.8 5 91.7
Singapore 7 61.9 36 50.3 9 89.8
Israel 8 61.8 28 53.3 29 76.7
Sweden 9 61.6 40 46.1 3 91.9
Norway 10 60.9 23 55.1 18 86.9
United States 11 60.5 26 54 12 89.0
Switzerland 12 60.1 42 43.9 13 88.7
Malaysia 13 59.5 8 73.4 31 74.0
South Korea 13 59.5 27 53.6 34 72.7
Japan 15 58.8 32 52.5 22 80.7
Hong Kong 16 58.4 29 53.2 15 88.3
Germany 17 57.9 43 42.7 16 88.2
Taiwan 18 57.7 39 48.8 23 80.6
Thailand 19 56.4 6 77.1 41 64.5
Austria 20 55.9 44 42.1 9 89.8
The Philippines 21 55.7 4 80 44 62.4
Belgium 22 55.4 51 36.6 13 88.7
France 22 55.4 49 37.5 20 84.4
Peru 24 54.2 4 80 39 64.6
Poland 24 54.2 37 49.4 30 75.3
Uruguay 24 54.2 15 64.6 35 70.9
Vietnam 27 54 7 74.8 47 58.0
Ireland 28 53.9 47 38.6 1 92.5
Denmark 29 53.8 52 36 7 91.0
Luxembourg 30 53.3 46 39.1 8 90.4
Mexico 31 53.1 19 61 32 73.4
Slovak Republic 32 53 38 49 26 78.9
Slovenia 33 52.4 57 28.9 27 78.2
United Kingdom 34 51.5 41 44 19 86.8
United Arab Emirates 35 51.3 20 58.3 37 65.6
Venezuela 35 51.3 1 89.8 58 37.7
Indonesia 37 51.2 10 72.8 49 54.9
The Netherlands 38 50.2 53 31.9 4 91.8
Turkey 39 48.8 30 53 42 63.9
Colombia 40 48.5 14 67.8 45 61.5
Czech Republic 40 48.5 55 29.1 23 80.6
Brazil 42 47.9 45 41 36 68.3
Russia 43 47.7 16 62.2 53 51.5
Spain 44 47.5 54 29.8 21 81.2
Saudi Arabia 45 46.3 9 73.3 46 60.6
Egypt 46 45.6 17 61.9 51 53.8
Hungary 47 45.5 56 28.9 25 79.2
India 48 45.3 21 56.5 52 52.5
Nigeria 49 44.8 3 80.3 60 32.2
Morocco 50 44.4 31 52.6 50 54.1
Pakistan 51 44.3 13 69.8 56 44.3
South Africa 52 44.1 34 50.8 43 62.6
Argentina 53 43.6 23 55.1 55 45.3
Portugal 54 43 59 17.6 28 77.8
Romania 55 42.9 50 37.2 38 65.4
Ukraine 56 42.1 33 51 54 46.9
Italy 57 40.9 58 24.4 32 73.4
Kenya 58 38.1 12 71.5 59 34.6
Algeria 59 36.2 25 54.6 57 38.9
Greece 60 33.9 60 1.6 39 64.6
© Grant Thornton India LLP. All rights reserved. 28
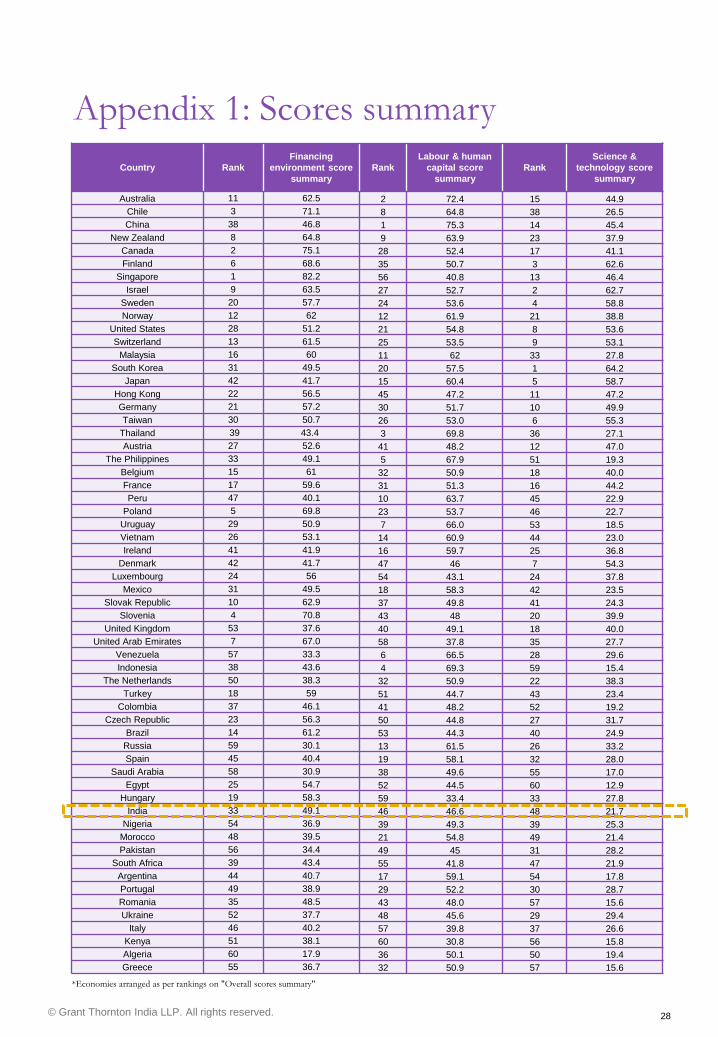
Appendix 1: Scores summary
Country Rank
Financing
environment score
summary
Rank
Labour & human
capital score
summary
Rank
Science &
technology score
summary
Australia 11 62.5 2 72.4 15 44.9
Chile 3 71.1 8 64.8 38 26.5
China 38 46.8 1 75.3 14 45.4
New Zealand 8 64.8 9 63.9 23 37.9
Canada 2 75.1 28 52.4 17 41.1
Finland 6 68.6 35 50.7 3 62.6
Singapore 1 82.2 56 40.8 13 46.4
Israel 9 63.5 27 52.7 2 62.7
Sweden 20 57.7 24 53.6 4 58.8
Norway 12 62 12 61.9 21 38.8
United States 28 51.2 21 54.8 8 53.6
Switzerland 13 61.5 25 53.5 9 53.1
Malaysia 16 60 11 62 33 27.8
South Korea 31 49.5 20 57.5 1 64.2
Japan 42 41.7 15 60.4 5 58.7
Hong Kong 22 56.5 45 47.2 11 47.2
Germany 21 57.2 30 51.7 10 49.9
Taiwan 30 50.7 26 53.0 6 55.3
Thailand 39 43.4 3 69.8 36 27.1
Austria 27 52.6 41 48.2 12 47.0
The Philippines 33 49.1 5 67.9 51 19.3
Belgium 15 61 32 50.9 18 40.0
France 17 59.6 31 51.3 16 44.2
Peru 47 40.1 10 63.7 45 22.9
Poland 5 69.8 23 53.7 46 22.7
Uruguay 29 50.9 7 66.0 53 18.5
Vietnam 26 53.1 14 60.9 44 23.0
Ireland 41 41.9 16 59.7 25 36.8
Denmark 42 41.7 47 46 7 54.3
Luxembourg 24 56 54 43.1 24 37.8
Mexico 31 49.5 18 58.3 42 23.5
Slovak Republic 10 62.9 37 49.8 41 24.3
Slovenia 4 70.8 43 48 20 39.9
United Kingdom 53 37.6 40 49.1 18 40.0
United Arab Emirates 7 67.0 58 37.8 35 27.7
Venezuela 57 33.3 6 66.5 28 29.6
Indonesia 38 43.6 4 69.3 59 15.4
The Netherlands 50 38.3 32 50.9 22 38.3
Turkey 18 59 51 44.7 43 23.4
Colombia 37 46.1 41 48.2 52 19.2
Czech Republic 23 56.3 50 44.8 27 31.7
Brazil 14 61.2 53 44.3 40 24.9
Russia 59 30.1 13 61.5 26 33.2
Spain 45 40.4 19 58.1 32 28.0
Saudi Arabia 58 30.9 38 49.6 55 17.0
Egypt 25 54.7 52 44.5 60 12.9
Hungary 19 58.3 59 33.4 33 27.8
India 33 49.1 46 46.6 48 21.7
Nigeria 54 36.9 39 49.3 39 25.3
Morocco 48 39.5 21 54.8 49 21.4
Pakistan 56 34.4 49 45 31 28.2
South Africa 39 43.4 55 41.8 47 21.9
Argentina 44 40.7 17 59.1 54 17.8
Portugal 49 38.9 29 52.2 30 28.7
Romania 35 48.5 43 48.0 57 15.6
Ukraine 52 37.7 48 45.6 29 29.4
Italy 46 40.2 57 39.8 37 26.6
Kenya 51 38.1 60 30.8 56 15.8
Algeria 60 17.9 36 50.1 50 19.4
Greece 55 36.7 32 50.9 57 15.6
*Economies arranged as per rankings on "Overall scores summary"
© Grant Thornton India LLP. All rights reserved. 29
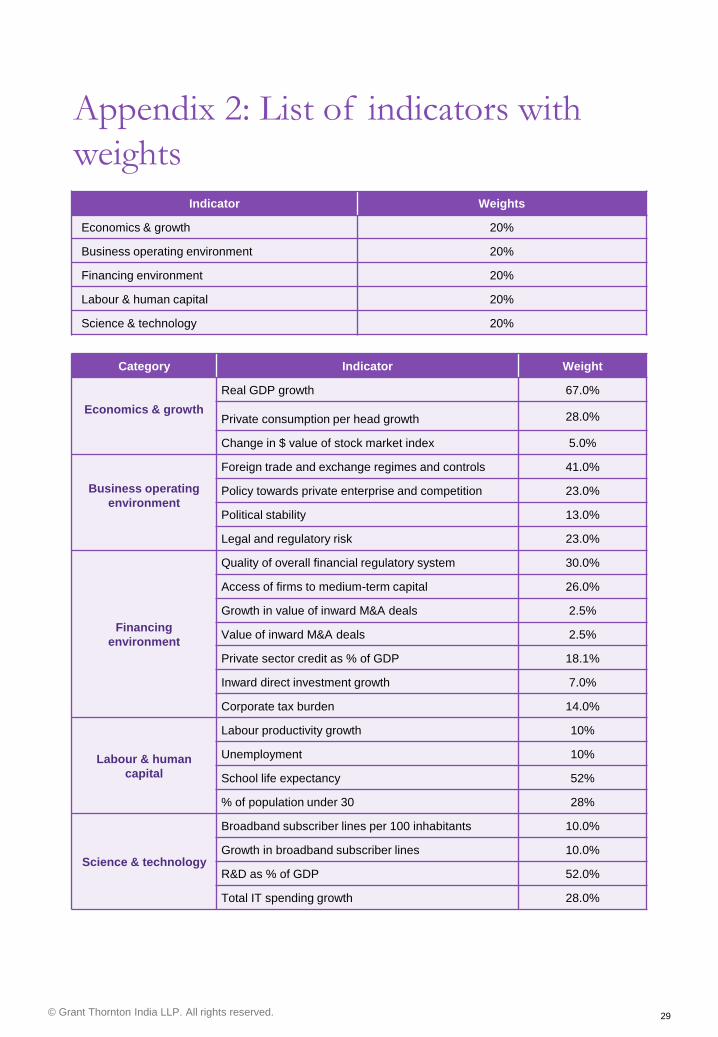
Appendix 2: List of indicators with
weights
Indicator Weights
Economics & growth 20%
Business operating environment 20%
Financing environment 20%
Labour & human capital 20%
Science & technology 20%
Category Indicator Weight
Economics & growth
Real GDP growth 67.0%
Private consumption per head growth 28.0%
Change in $ value of stock market index 5.0%
Business operating
environment
Foreign trade and exchange regimes and controls 41.0%
Policy towards private enterprise and competition 23.0%
Political stability 13.0%
Legal and regulatory risk 23.0%
Financing
environment
Quality of overall financial regulatory system 30.0%
Access of firms to medium-term capital 26.0%
Growth in value of inward M&A deals 2.5%
Value of inward M&A deals 2.5%
Private sector credit as % of GDP 18.1%
Inward direct investment growth 7.0%
Corporate tax burden 14.0%
Labour & human
capital
Labour productivity growth 10%
Unemployment 10%
School life expectancy 52%
% of population under 30 28%
Science & technology
Broadband subscriber lines per 100 inhabitants 10.0%
Growth in broadband subscriber lines 10.0%
R&D as % of GDP 52.0%
Total IT spending growth 28.0%
© Grant Thornton India LLP. All rights reserved. 30
About Grant Thornton
Grant Thornton International Ltd.
Grant Thornton is one of the world’s leading organisations of independent assurance, tax and
advisory firms. These firms help dynamic organisations unlock their potential for growth by
providing meaningful, forward looking advice. Proactive teams, led by approachable partners in
these firms, use insights, experience and instinct to understand complex issues for privately owned,
publicly listed and public sector clients and help them to find solutions. More than 35,000 Grant
Thornton people, across over 120 countries, are focused on making a difference to clients,
colleagues and the communities in which we live and work.
About Grant Thornton India LLP
Grant Thornton in India is a member firm within Grant Thornton International Ltd. The firm
has today grown to be one of the largest accountancy and advisory firms in India with over 1,500
staff in New Delhi, Bangalore, Chandigarh, Chennai, Gurgaon, Hyderabad, Kolkata, Mumbai,
Noida and Pune, and affiliate arrangements in most of the major towns and cities across the
country. The firm specialises in providing assurance, tax and advisory services to growth-oriented,
entrepreneurial companies.

© Grant Thornton India LLP. All rights reserved. 31
© Grant Thornton India LLP. All rights reserved.
Contact us
NEW DELHI National Office Outer Circle L 41 Connaught Circus New Delhi 110 001 T +91 11 4278 7070
CHENNAI Arihant Nitco Park, 6th Floor No.90, Dr. Radhakrishnan Salai Mylapore Chennai 600 004 T +91 44 4294 0000
KOLKATA 10C Hungerford Street 5th Floor Kolkata 700 017 T +91 33 4050 8000
NOIDA Plot No. 19A, 7th Floor Sector – 16A Noida 201301 T +91 120 7109001
GURGAON 21st Floor, DLF Square Jacaranda Marg DLF Phase II Gurgaon 122 002 T +91 124 462 8000
CHANDIGARH SCO 17 2nd Floor Sector 17 E Chandigarh 160 017 T +91 172 4338 000
MUMBAI 16th Floor, Tower II Indiabulls Finance Centre SB Marg, Elphinstone (W) Mumbai 400 013 T +91 22 6626 2600
HYDERABAD 7th Floor, Block III White House Kundan Bagh, Begumpet Hyderabad 500 016 T +91 40 6630 8200
BENGALURU “Wings”, 1st Floor 16/1 Cambridge Road Ulsoor Bengaluru 560 008 T +91 80 4243 0700
© Grant Thornton India LLP. All rights reserved.
Grant Thornton India LLP (formerly Grant Thornton India) is registered with limited liability with identity number AAA-
7677 and its registered office at L-41 Connaught Circus, New Delhi, 110001
Grant Thornton India LLP is a member firm within Grant Thornton International Ltd (Grant Thornton International).
Grant Thornton International and the member firms are not a worldwide partnership. Services are delivered by the
member firms independently.
For more information or for any queries, write to us at [email protected]
Disclaimer:
The information contained in this document has been compiled or arrived at from other sources believed to be reliable,
but no representation or warranty is made to its accuracy, completeness or correctness. The information contained in this
document is published for the knowledge of the recipient but is not to be relied upon as authoritative or taken in
substitution for the exercise of judgment by any recipient. This document is not intended to be a substitute for
professional, technical or legal advice or opinion and the contents in this document are subject to change without notice.
Whilst due care has been taken in the preparation of this report and information contained herein, Grant Thornton does
not take ownership of or endorse any findings or personal views expressed herein or accept any liability whatsoever, for
any direct or consequential loss howsoever arising from any use of this report or its contents or otherwise arising in
connection herewith.
www.grantthornton.in
PUNE 401 Century Arcade Narangi Baug Road Off Boat Club Road Pune 411 001 T +91 20 4105 7000
Design and production: Misbah Hussain