india solar analysis of utility scale solar decision brief ... · pdf fileanalysis of utility...
TRANSCRIPT

1© BRIDGE TO INDIA, 2017
Executive summaryIn the eighteen months from July 2015 to December 2016, India allocated 15.9 GW of solar projects. PPA based projects with no restriction on type of modules used accounted for 12.6 GW of this capacity.
These tenders have been very enthusiastically received by the private sector despite several operational and financial challenges (DISCOM credit risk, difficulties in land acquisition, grid connectivity problems). Almost all tenders have been oversubscribed and tariffs have been coming down resulting in concerns that the falling tariffs are unsustainable, even though some of these concerns have been mitigated post-facto by sharp decline in module prices (26% in 2016 alone, way ahead of the 5-7% industry consensus).
We have examined recent bidding history for all PPA-based, open category tendered projects to understand risk-return relationship and to delve deeper into competitive dynamics in the sector. We have harmonized the bid results to a 50 MW solar project in Andhra Pradesh commencing construction in Jan-2017. Results are shown in the chart below. Simple average of all harmonized tariffs is M 4.31 (¢ 6.3) / kWh excluding Uttar Pradesh state 215 MW tender result as an outlier.
Figure i. Harmonized tariff for all tenders considered in our study
Analysis of utility scale solar tenders in IndiaMarch 2017
Note: Average harmonized tariff is computed as simple average of all harmonized tariffs excluding Uttar Pradesh 215 MW tender result as an outlier.
India SolarDecision Brief
This report examines recent bidding history
for all PPA-based, open category tendered
projects to understand risk-return relationship and to delve deeper into competitive dynamics in
the sector
Report sponsors

2© BRIDGE TO INDIA, 2017
This chart shows that harmonized tariffs have oscillated around the average mark with no significant trend over time. NTPC harmonized tariffs are 13% below average harmonized tariff for other tenders, which is consistent with the company’s superior AAA credit rating (by ICRA) and strong market reputation. Its Rajasthan 420 MW tender in January 2016 received the lowest harmonized tariff of M 3.37 (¢ 5.0)/ kWh in our sample set.
There is no other consistent, meaningful correlation observed between offtake risk and tariff results except in some extreme cases – for example, Gujarat (credit rating of A+ by ICRA) received a tariff discount of M 0.32/kWh but Uttar Pradesh (credit rating of C by ICRA) had to pay a significant tariff premium of M 2.68/kWh. But on the other hand, Jharkhand’s 1,200 MW tender saw a relatively aggressive harmonized tariff of M 4.48/kWh despite very poor financial rating of the state DISCOMs (C+ by CARE).
The average harmonized tariff of M 4.31 (¢ 6.3)/ kWh gives us an equity IRR of 14.20%, significantly below the benchmark expectation of 18%. This is a clear demonstration of aggressive bidding in the sector and we believe that the developers are bridging the gap in two ways. First, by focusing relentlessly on optimization of technical and financial project parameters, they can push up the IRR by 200–300 basis points. Second, the developers are making speculative favourable assumptions on future equipment prices, land sale values, debt refinancing, salvage value etc. to defend project returns.
Overall, contrary to general perception, adjusted for changes in project costs and other factors, solar tariffs in India haven’t trended down in the last eighteen months. The tariff pattern is affected by many variables but most importantly, by falling equipment costs and competitive bidding dynamics. Low equity IRRs suggest that the Indian developers, in particular, are not pricing risks fully and too much faith is being placed on an optimistic future scenario. The sector has been very lucky with rapid falls in solar module prices easing most of the financial and execution challenges. Any dislocation in module sourcing or even a price stabilization will spell trouble for winning bidders.
STOP PRESS – Rewa 750 MW tender results
As we finalized this report, Rewa tender results were announced with a record low levelized tariff of M 3.29 (¢ 4.8)/ kWh, equivalent to a harmonized tariff of M 3.85/ kWh, comparable to average of previous NTPC tenders asshown here.
Our modeling suggests that bidding in the sector has been very aggressive
forcing developers to drive costs down and build optimistic base
case scenarios
The sector has been very lucky with rapid falls in solar module
prices easing most of the financial and
execution challenges. Any dislocation in module
sourcing or even a price stabilization will spell
trouble for winning bidders
Figure ii. Rewa tender harmonized tariff in comparison to NTPC tender results

3© BRIDGE TO INDIA, 2017
AcronymsAPGENCO Andhra Pradesh Power Generation Corporation
CUF Capacity Utilization Factor
DCR Domestic Content Requirement
DISCOM Distribution Company
EPC Engineering, Procurement and Construction
FiT Feed in Tariff
IPP Independent Power Producer
IREDA Indian Renewable Energy Development Agency
NTPC National Thermal Power Corporation
O&M Operation and Maintenance
PE Private Equity
PPA Power Purchase Agreement
SECI Solar Energy Corporation of India
SPV Special Purpose Vehicle
VGF Viability Gap Funding
WTO World Trade Organization

Harnessing the power of the sun Harnessing the power of the sun
cc 14-3-2017 solar ad.indd 1 14-03-2017 13:49:35

6© BRIDGE TO INDIA, 2017
1. IntroductionIndia has been a pioneer in allocating utility scale solar projects through competitive tender process. In contrast to most other large solar markets around the world (China, US, Germany, Japan), which have been allocating projects on a preferential basis by offering attractive feed-in-tariffs (FITs), India started using the auction route for project allocations back in 2010.
1.1 Solar tenders in India
The pace of solar tenders picked up sharply after the announcement of 100 GW solar capacity addition target for 2022. From July 2015 to December 2016, India allocated 15.9 GW of solar projects.
Figure 1: Solar project capacity allocated and installed
Note: Tamil Nadu state allocation of 1,400 MW in H2-2015 was made on a preferential basis.
These 15.9 GW of project allocations are split regionally and by allocation authority as shown in the following chart.

7© BRIDGE TO INDIA, 2017
Figure 2: 15.9 GW of project allocations in eighteen months ending December 2016

8© BRIDGE TO INDIA, 2017
1.2 Segmentation of tenders
Utility scale solar tenders can be segmented in two categories – PPA and EPC. PPA based tenders – where successful bidders, usually private sector developers finance, own, build and operate projects and sell entire power output for a fixed tariff - comprise 82 percent (13.1 GW) of the 15.9 GW tendered capacity. EPC tenders, issued by central public sector undertakings such as Coal India, National Thermal Power Corporation (NTPC), IREDA, APGENCO and Neyveli Lignite, account for remaining 18 percent (2.8 GW) of total tendered capacity.
Figure 3: Tender split by contractual structure, module type and tendering authority (in MW)
12,625 MW (96%) of PPA based tendered capacity falls under open category with no restriction on source of modules. The World Trade Organization (WTO) has already ruled against domestic content requirement (DCR) use. Therefore, this report focuses on PPA tenders under open category only. We have further eliminated following project allocations from our analysis: • 170 MW in Uttarakhand – very small projects, typically less than
10 MW;• 200 MW in Jharkhand – very small projects, typically less than
10 MW; and• 1,400 MW in Tamil Nadu as this was allocated on a preferential basis.
Our final analysis therefore considers 23 tenders with a total capacity of 10.9 GW. Central government policy projects with NTPC or Solar Energy Corporation of India (SECI) intermediating power offtake on behalf of distribution companies (DISCOMs) account for 16 of these tenders. Balance 7 tenders were issued under state government policies with state DISCOMs acting as offtakers. The capacity tendered was distributed almost equally between central and state projects as seen from the chart above.
About 24 percent of selected projects are proposed to be constructed in government-provided solar parks. Such tenders usually see greater bidding interest from international developers and PE backed IPPs as land and transmission infrastructure is provided to them on a plug-and-play basis. But the cost of using these solar parks is substantially higher than respective
Our study considers 23 tenders with a total
capacity of 10.9 GW split almost equally between central and state policy
projects
9© BRIDGE TO INDIA, 2017
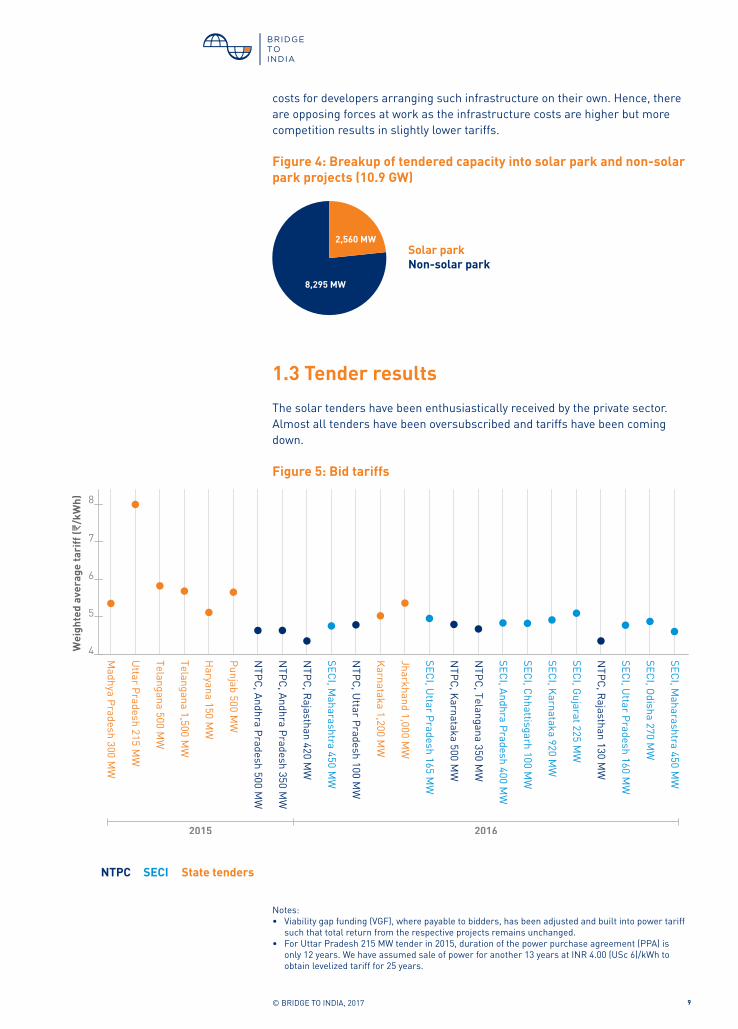
costs for developers arranging such infrastructure on their own. Hence, there are opposing forces at work as the infrastructure costs are higher but more competition results in slightly lower tariffs.
Figure 4: Breakup of tendered capacity into solar park and non-solar park projects (10.9 GW)
1.3 Tender results
The solar tenders have been enthusiastically received by the private sector. Almost all tenders have been oversubscribed and tariffs have been coming down.
Figure 5: Bid tariffs
Notes: • Viability gap funding (VGF), where payable to bidders, has been adjusted and built into power tariff such that total return from the respective projects remains unchanged. • For Uttar Pradesh 215 MW tender in 2015, duration of the power purchase agreement (PPA) is only 12 years. We have assumed sale of power for another 13 years at INR 4.00 (USc 6)/kWh to obtain levelized tariff for 25 years.
10© BRIDGE TO INDIA, 2017
While developers remain bullish about the market prospects, there have been widespread concerns that the falling tariffs are unsustainable, even though some of these concerns have been mitigated post-facto because of sharp decline in module prices (fall of 26% in 2016 alone, way ahead of the 5-7% annual decline projection by most industry experts). What is driving the movement and variation in tariffs? How are project developers pricing risk? Can they raise capital to implement the projects? We have seen in other sectors, most notably thermal power and roads, that many projects have either not been implemented because of viability concerns or have been implemented but have ended up subsequently in financial distress.
There are multiple variables which affects bid tariffs such as location, size and timing of tender, design of tender (simple tariff vs VGF bidding, availability of solar park and its charges. We have examined recent bidding history for solar projects to understand impact of these variables and delve deeper into underlying trends.
11© BRIDGE TO INDIA, 2017
Standard Project Assumption Variables impacted
Location Andhra Pradesh DC:AC overloading ratio of 1.15x (CUF of 21%);
Land and transmission cost - M 3 million/MW
Irradiance or power output;
Land and transmission cost
Solar park availability
None Grid availability – 99% Land and transmission cost; Grid availability
Average project size; project timeline
50 MW; Bid submission - Q3 2016;Equipment procurement - Q1 2017
Capital expenditure - M 42 million/ MW;
O&M cost – M 0.4 million/MW;
Cost of debt - 10.50% pa
Capital expenditure;
O&M cost;
Cost of debt
Unit Base case assumption
Variation Change in tariff to maintain equity IRR
EPC cost (module cost)
M million/MW(¢/W)
42 (34)
± 5% ± 4.1%
Land and transmission cost
M million/MW 3 ± 20% ±1.1%
Irradiance DC:AC overloading 1.15x (21% CUF) ± 0.05x ± 2.7%
Cost of debt % p.a. 10.5% ± 1% p.a. ± 3.4%
O&M cost M million/MW 0.4 ± 5% ± 0.3%
Grid availability - 99% ±0.5% ± 0.2%
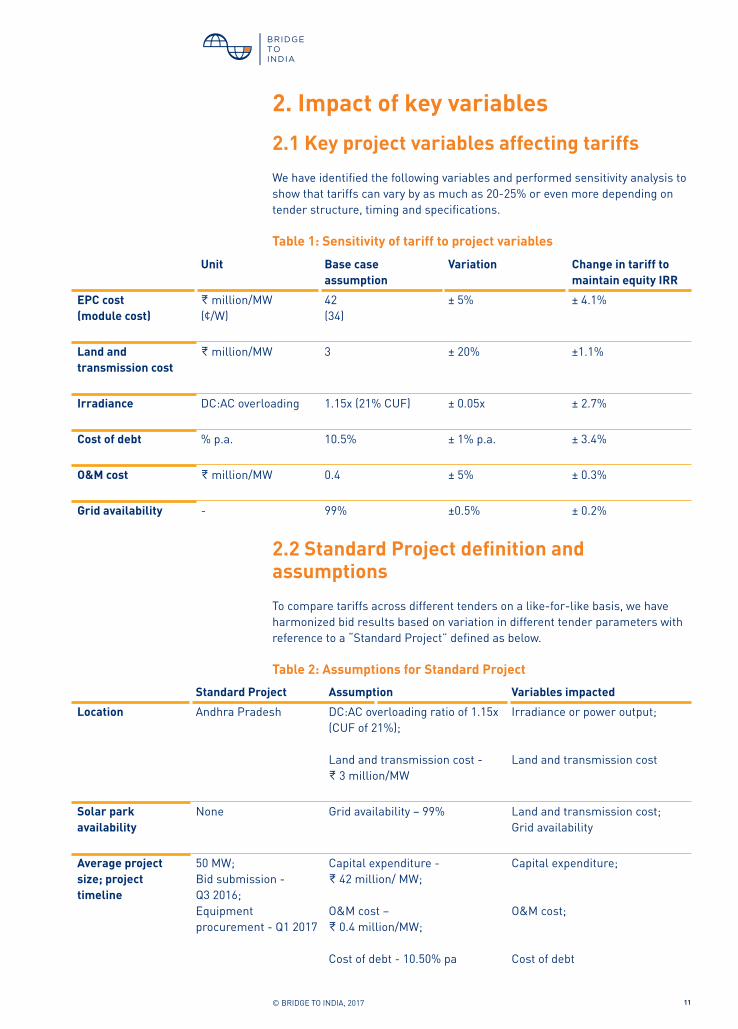
2. Impact of key variables
2.1 Key project variables affecting tariffs
We have identified the following variables and performed sensitivity analysis to show that tariffs can vary by as much as 20-25% or even more depending on tender structure, timing and specifications.
Table 1: Sensitivity of tariff to project variables
2.2 Standard Project definition and assumptions
To compare tariffs across different tenders on a like-for-like basis, we have harmonized bid results based on variation in different tender parameters with reference to a “Standard Project” defined as below.
Table 2: Assumptions for Standard Project

12© BRIDGE TO INDIA, 2017
We have not harmonized tariffs purposefully for offtake risk because developers have varying risk appetite and they model offtake risk in different ways. This approach allows us to correlate tariff results with offtaker risk profile.
Project location, land and transmission cost and grid availability
We have assumed 21% Capacity Utilization Factor (CUF) for each project and altered DC:AC overloading ratio for different states to account for variation in irradiance. Where solar parks are not available, land and transmission cost has been assumed in line with prevailing market rates.
Figure 6: Infrastructure cost and DC:AC overloading ratio assumptions across states (non-solar park)
Solar park charges have been assumed, where applicable, on the basis of actual charges for different solar parks.
Figure 7: Solar park charges (excluding service tax)

13© BRIDGE TO INDIA, 2017
We have assumed grid availability factor of 99.5% for projects located in solar parks and 99% for projects located outside solar parks.
Capital expenditure, O&M and other project SPV costs
Larger project sizes allow developers to optimize and negotiate lower equipment prices. We have assumed capital expenditure (EPC and all pre-operative costs) as below for different project sizes.
Figure 8: Capital expenditure assumption across equipment procurement timeframe
Annual O&M cost has been assumed as M 500,000, M 400,000 and M 350,000 per MW for project sizes of less than 20 MW, between 20 – 150 MW and over 150 MW respectively. Similarly, SPV administrative costs have been assumed as M 5 million, M 7 million and M 9 million per annum for the three project sizes respectively. Annual inflation in O&M and administrative costs has been assumed as 5.72%.
Cost of debt financing
Cost of debt financing has been coming down in India recently due to a falling interest rate regime. We have accordingly assumed project financing interest rates as shown below.
Figure 9: Cost of debt financing
14© BRIDGE TO INDIA, 2017
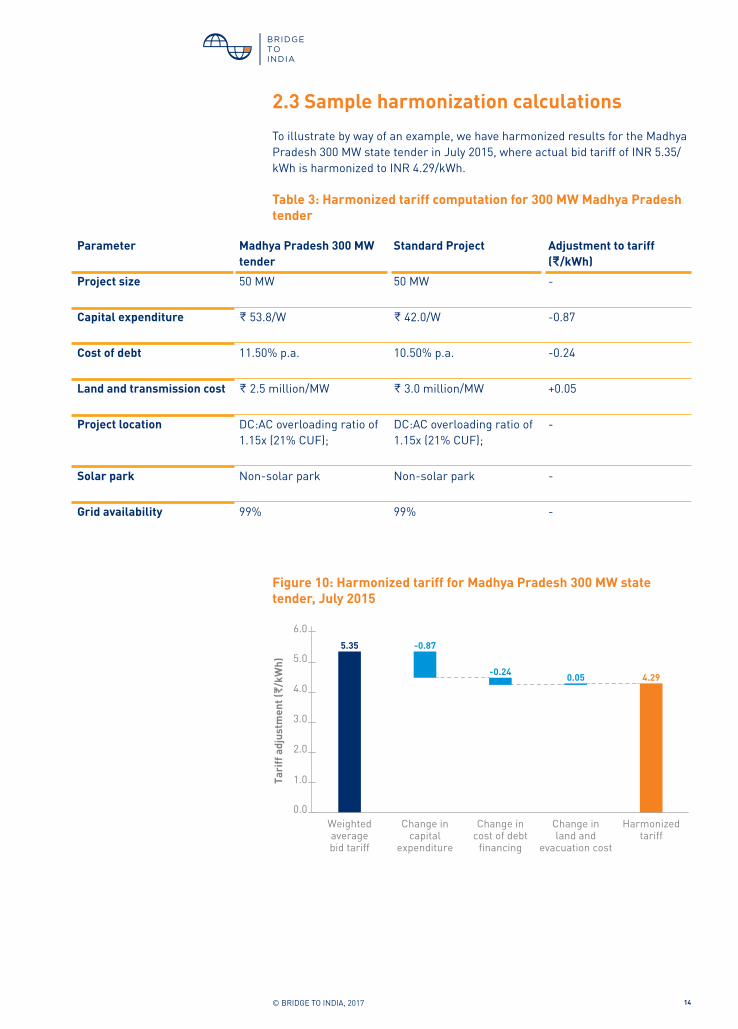
2.3 Sample harmonization calculations
To illustrate by way of an example, we have harmonized results for the Madhya Pradesh 300 MW state tender in July 2015, where actual bid tariff of INR 5.35/ kWh is harmonized to INR 4.29/kWh.
Table 3: Harmonized tariff computation for 300 MW Madhya Pradesh tender
Figure 10: Harmonized tariff for Madhya Pradesh 300 MW state tender, July 2015
Parameter Madhya Pradesh 300 MW tender
Standard Project Adjustment to tariff (M/kWh)
Project size 50 MW 50 MW -
Capital expenditure M 53.8/W M 42.0/W -0.87
Cost of debt 11.50% p.a. 10.50% p.a. -0.24
Land and transmission cost M 2.5 million/MW M 3.0 million/MW +0.05
Project location DC:AC overloading ratio of 1.15x (21% CUF);
DC:AC overloading ratio of 1.15x (21% CUF);
-
Solar park Non-solar park Non-solar park -
Grid availability 99% 99% -

15© BRIDGE TO INDIA, 2017
2.4 Harmonized results for all tenders
Harmonized and actual tariffs for the 23 selected tenders are shown below. The simple average of all harmonized tariffs (excluding Uttar Pradesh state tender) is M 4.31/kWh.
Figure 11: Actual and harmonized tariff for all tenders considered in the analysis
Note: Average harmonized tariff is computed as simple average of all harmonized tariffs excluding Uttar Pradesh 215 MW tender result as an outlier.
This chart shows that harmonized tariffs have oscillated around the average tariff mark with no significant trend seen over time.
Harmonized tariffs by offtaker profile
NTPC harmonized tariffs are below average harmonized tariff which is consistent with the company’s AAA credit rating and strong market reputation. NTPC clearly offers the best offtake risk profile in the Indian solar market. • Bidding for first NTPC tenders started on a very enthusiastic note with
harmonized tariffs for two Andhra Pradesh tenders (500 MW and 350 MW in November and December 2015 respectively) of M 3.71/kWh and M 3.72/kWh respectively;
• NTPC’s Rajasthan 420 MW tender in January 2016 received the lowest harmonized tariff of M 3.37/kWh in our sample set;
• Subsequent NTPC tenders have seen harmonized tariffs increasing to average of our entire sample set of M 4.42/ kWh despite common perception that tariffs have kept coming down progressively over time.
NTPC harmonized tariffs are below average
harmonized tariff which is consistent with the company’s AAA credit
rating and strong market reputation

16© BRIDGE TO INDIA, 2017
There is no consistent, meaningful trend observed for SECI and state tenders, which is surprising as the credit profile of offtaking DISCOMs varies highly and chart 12 seems to suggest that this risk is not appropriately factored into the bids. More importantly, despite being a central government owned company and offering an additional layer of payment security, SECI has not received any notable price discount from developers. Some state tenders have seen surprisingly competitive bidding interest despite very poor DISCOM credit profile. For example, Haryana state tender received harmonized tariff of M 3.95/kWh (rated B by CARE) and Jharkhand received average harmonized tariff of M 4.48/kWh (rated C+ by CARE).
Figure 12: Harmonized tariffs across different offtakers
But the effect of offtake profile can be clearly seen in some extreme cases:• Gujarat DISCOMs are rated the best in the country (A+ by ICRA) and SECI’s
225 MW Gujarat tender in June 2016 saw the lowest harmonized tariff of M 3.99/kWh among all SECI tenders;
• Uttar Pradesh’s 215 MW state tender received exceptionally high harmonized tariff of M 6.99/kWh (average DISCOM rating of C+ by CARE);
• Similarly, Tamil Nadu had to offer a very high FIT of M 7.10/kWh to attract developers as the state DISCOMs are rated poorly (B by ICRA).
Telangana (2,000 MW) and Karnataka (1,200 MW) tenders had relatively higher average harmonized tariffs arguably because of large tender sizes.
There is no consistent, meaningful trend
observed for SECI and state tenders, which is
surprising as the credit profile of offtaking
DISCOMs varies highly

17© BRIDGE TO INDIA, 2017
Figure 13: Harmonized tariffs by credit rating of offtakers
Notes:1. Credit ratings for DISCOMs are taken from Ministry of Power’s report titled, “State Distribution Utilities Fourth Annual Integrated Rating” June 2016.2. NTPC and SECI have been assigned rating equivalent to their credit rating as of October 2016.3. For Rewa 750 MW tender, we have assigned a rating of A+ because of strong offtake by Delhi Metro and Madhya Pradesh government.4. JH - Jharkhand, UP - Uttar Pradesh, HAR - Haryana, MP - Madhya Pradesh, TEL - Telangana, PUN - Punjab, KAR - Karnataka, AP - Andhra Pradesh, OD - Odisha, MH - Maharashtra, CH - Chhattisgarh, GUJ - Gujarat, RAJ - Rajasthan.
Harmonized tariffs by solar park availability
Splitting the results by solar park and non-solar park based tenders shows that:• Average harmonized tariff for solar park projects is 13% lower than that
of non-solar park projects suggesting that solar park availability attracts greater bidding interest. However, this may be simply due to overly aggressive bidding in the first few NTPC solar park tenders.
• Within non-solar park tenders, there is no major trend seen over time or by offtake. NTPC and state tenders received bids close to the average harmonized tariff. However, SECI tenders had a slightly higher than average harmonized tariff with a premium of M 0.27/kWh, which is difficult to explain.

18© BRIDGE TO INDIA, 2017
Figure 14: Harmonized tariffs for solar park and non-solar park based tenders
Note: Average harmonized tariff for non-solar park projects is computed by excluding Uttar Pradesh 215 MW tender result as an outlier.

19© BRIDGE TO INDIA, 2017
3. Project returnsExcluding Uttar Pradesh tender result as an outlier, average harmonized tariff for our sample set is M 4.31/kWh. If we consider a six-month cash reserve in the model to address delayed payment risk of DISCOMs, we get an equity IRR of 14.20%, significantly below the benchmark expectation of around 18%. We believe that the difference is explained by two main factors:
Developers are further optimizing their business and financial models
There is substantial scope to optimize and refine most project parameters beyond our high-level assumptions. In particular, there is a relentless focus on driving costs down even if it means assuming EPC risks. Trackers are becoming increasingly common. There is also constant improvement in project design, data analytics and project monitoring capabilities resulting in higher power output. Financing costs can be optimized by availing low cost supplier credit and delaying equity injection. We believe that all these factors can account for a combined equity IRR uplift of about 200 basis points.
Some developers are making aggressive assumptions
Increasing competition is forcing developers to be innovative and even adventurous with their business cases. It is now common practice to build a forward-looking assumption for solar module prices based on past trends and project execution period. We are aware of several instances of developers making further aggressive assumptions on future land sale values, debt refinancing, salvage value etc. and not building sufficient risk buffers.
It is clear that project risks are not being priced fully and base cases are being modelled optimistically. A good example is grid curtailment, which is a major risk for renewable projects in India as it is in most other countries around the world including in US, Germany and China. Indian developers typically model grid availability around 99.0-99.5% in the base case leaving no room for underperformance. But if grid availability goes down to say, 90%, equity IRR goes down from 14.20% in our Standard Project base case to 10.50%. It is worth noting here that average grid availability in China for solar projects in 2016 was 89%.

20© BRIDGE TO INDIA, 2017
4. ConclusionWe summarise below our key observations and conclusions from the analysis:
Bids have stayed relatively stable around the harmonized tariff mark
Contrary to general perception, adjusted for changes in capital costs and other parameters, bids in India haven’t trended down in the last eighteen months. As we see from figure 12, harmonized tariffs have stayed reasonably stable around the average level.
NTPC’s strong credit rating has resulted in a 13.5% tariff discount in relation to SECI and state tenders
Projects tendered by NTPC and located inside the solar park were highly oversubscribed and subsequently had lowest tariffs. Setting aside these limited tenders, we see no material relationship between offtake risk and bid results except in some extreme cases – Gujarat (credit rating of A+ by ICRA → tariff discount of M 0.32/kWh) or Uttar Pradesh (credit rating of C by CARE → tariff premium of M 2.68/kWh).
One possible explanation for lack of any coherent or consistent trend in bid results by location, availability of solar park or offtake risk is that the industry is still in an early stage of maturation. Many new developers have entered the market in this time. At the same time, there have been many instances of developers making aggressive bids in one-off tenders based possibly on their internal targets, fund raising status, land availability, relationship with local government etc. Examples of this include Jharkhand 1,200 MW tender, where ReNew won 500 MW with relatively aggressive harmonized tariffs of M 4.20 – 4.59/kWh despite very poor financial rating of the state DISCOMs (C+ by CARE) and Haryana 150 MW tender, where the harmonized tariff was M 3.95/kWh (DISCOM credit rating of B by CARE).
Indian developers are keen to scale up and willing to accept higher risk
Indian project developers have been more aggressive than their international counterparts. They have won bulk of the these projects as shown below. This reflects greater risk appetite for DISCOM offtake, land acquisition, execution period and power evacuation.

21© BRIDGE TO INDIA, 2017
Figure 14: Capacity won by different developer segments
Overall, we believe that bidding in the sector has been fairly aggressive. Risk pricing, particularly for capital cost, offtake and transmission risks, appears inadequate.
The sector has been lucky with rapid falls in solar module prices significantly easing financial and execution challenges. Nonetheless, capital raising remains difficult for many small- and medium-sized developers as evident from significant lag in tendered capacity and installed capacity.
BRIDGE TO INDIA is a consulting and knowledge services provider in the Indian cleantech market. We use our strong multi-functional expertise combined with comprehensive in-house research capability to develop insightful industry analyses. Our overarching goal is to provide customised cleantech solutions and enable innovative business models in India. We work actively with all leading stakeholders including project developers and investors, energy customers, equipment suppliers, regulators, policy makers and development institutions.
AuthorsMudit Jain, BRIDGE TO INDIAVInay Rustagi, BRIDGE TO INDIA
Disclaimer© 2017 BRIDGE TO INDIA Energy Private LimitedAll rights reserved. March 2017, New Delhi
No part of this report may be used or reproduced in any manner or in any form or by any means without mentioning its original source.
BRIDGE TO INDIA is not herein engaged in rendering professional advice and services to you. BRIDGE TO INDIA makes no warranties, expressed or implied, as to the ownership, accuracy, or adequacy of the content of this report. BRIDGE TO INDIA shall not be liable for any indirect, incidental, consequential, or punitive damages or for lost revenues or profits, whether or not advised of the possibility of such damages or losses and regardless of the theory of liability.
C 8/5, DLF Phase 1, Gurgaon 122 001, Haryana, INDIATel: +91 124 420 4003
www.bridgetoindia.com
Follow us on facebook.com/bridgetoindia
www.bridgetoindia.com/blog
