indian capital market: global context - national priorities
TRANSCRIPT
Indian Capital Market Global Context - National
PrioritiesDr Satyendra S Nayak
Independent Consultant
Seminar on Monetary Policy and Industrial Growth
Organized by Bombay Chamber of Commerce April 16,2015

Global Context
• India is the ninth biggest in the world in terms of market cap of $1.66 trillion (Rs.100 Lakh crores), behind Germany with $1.9 trillion.• India's market capitalization is now 80 % of GDP of $2
trillion.• NYSE has $ 17.6 trillion and NASDAQ $ 6 trillion. • Among the emerging markets, it is next to China with
$5.4 trillion, ranking fifth 60% of GDP of $9 trillion.• India has largest number of 5000+ listed companies in
the world overtaking the USA.• Emerging markets form 85% of global population, but
forms only 13% of market capitalization.

• Capital market is only one segment of the economy, but very critical segment.• If economy is an engine then capital market is its
heart.• Economy’s growth is inextricably linked to the
resources it pumps for building productive capacities.• Capital market comprises of risk-return matrix, both
actual and expected, the crux of investment.• In addition to historicals the expectations of return and
estimates of risk are more important and critical.• Hence, capital markets are governed by sentiments.• Since the election of Prime Minister Mody’s
government, his leadership and actions on fast track liberalization of the economy in several sectors have galvanized the capital market.
Monetary Policy and Capital Market: Global Context• Liberal monetary policy is always conducive to healthy growth of
capital market.• After the global financial crisis of 2008, ultra liberal monetary
policy of near zero interest rate and QE by Federal Reserve, ECB, Bank of England and Bank of Japan has set new chapter in global financial history.• In 2007, the Fed’s balance sheet was less than $1 trillion. Today, it
is nearly $4.5 trillion, from 7% to 25% of GDP.• Bank of England has increased its assets size similar to USA. • Although ECB has recorded moderate increase from 18% of GDP
to 21%, Bank of Japan has marked a record rise from 20% to 52%.• India recorded a decline from 24% to 21%.• Since 2007, global central bank balance sheets have nearly
tripled from $8trillion to more than $22 trillion as of mid-2014. And, the increase is split evenly between advanced and emerging market economies

• There is record growth in liquidity of $14 trillion world over in the last six years.• Global economy is virtually awash in liquidity.• This has not created any abnormal increase in money
supply, since reserves of banks with the Fed have increased.• It is also not inflationary in the developed world since
in these mature economies, consumption growth is not fast and excess capacities take care rising demand. • In fact Eurozone and Japan is facing deflation in prices
and want to reach 2% inflation to drive growth.• Extra liquidity has gone in deleveraging of the
economies and in raising asset prices in developed as well as emerging market economies.
• The effect of asset price inflation is more pronounced in the emerging market economies.• India has been in high impact zone due to its relatively
large capital market and high interest rates.

Global Interest Rates central bank interest rate region percentage date
FED interest rate United States 0.250 % 12-16-2008
RBA interest rate Australia 2.250 % 02-03-2015
BACEN interest rate Brazil 12.750 % 03-04-2015
BoE interest rate Great Britain 0.500 % 03-05-2009
BOC interest rate Canada 0.750 % 01-21-2015
PBC interest rate China 5.350 % 02-28-2015
ECB interest rate Europe 0.050 % 09-04-2014
BoJ interest rate Japan 0.100 % 10-05-2010
CBR interest rate Russia 14.000 % 03-13-2015
SARB interest rate South Africa 5.750 % 07-17-2014

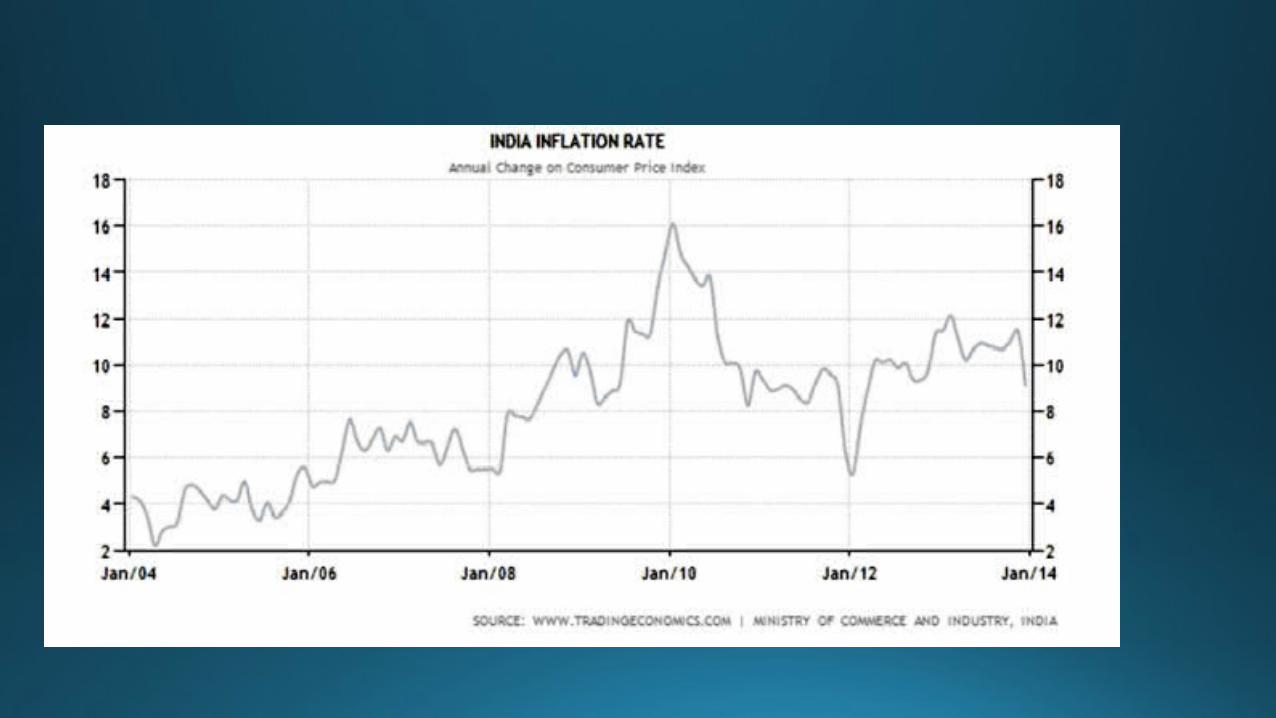
RBI Policy and its Effect• After the global crisis RBI also lowered interest rates in line with other central banks.• Repo rate was lowered gradually from 9% in 2008 to 4.75% in 2009.• Inflation remained low with average of 4.6% in 2000-07.• In 2008 CPI inflation rose to 9% and reached high of 12.2% in 2009.• Repo rate was gradually raised to 8% in 2011.• Interbank Rate in India which was a record low of 3.10 percent in June 2009 increased to 8.39 percent by 2015. This compares with interbank rate in China of 4.85%.

RBI’s Repo Rate

• CRR was lowered from 9 % in 2008 to 4 % in 2013.• SLR was reduced from 25% in 2009 to 23% in 2012,
and 21.5% in Feb., 2015

• Capital formation in the economy which rose from 23 % of GDP in 2000-01 to record high of 33.6% in 2011-12, decline to low of 29.6% in 2013-14.• High interest rates have slowed the growth rate of the economy.• Overall savings rate also fell from 33.7% to 30.6% in
the same period.• Household savings rate also declined from 25.2% to
18.2%. Household savings account for 60% of total savings. • Ratio of household savings in financial and physical
assets which was 54:46 in 2000-01 declined to 32:68 in 2013-14.• Real estate and gold attracted more household
investment.
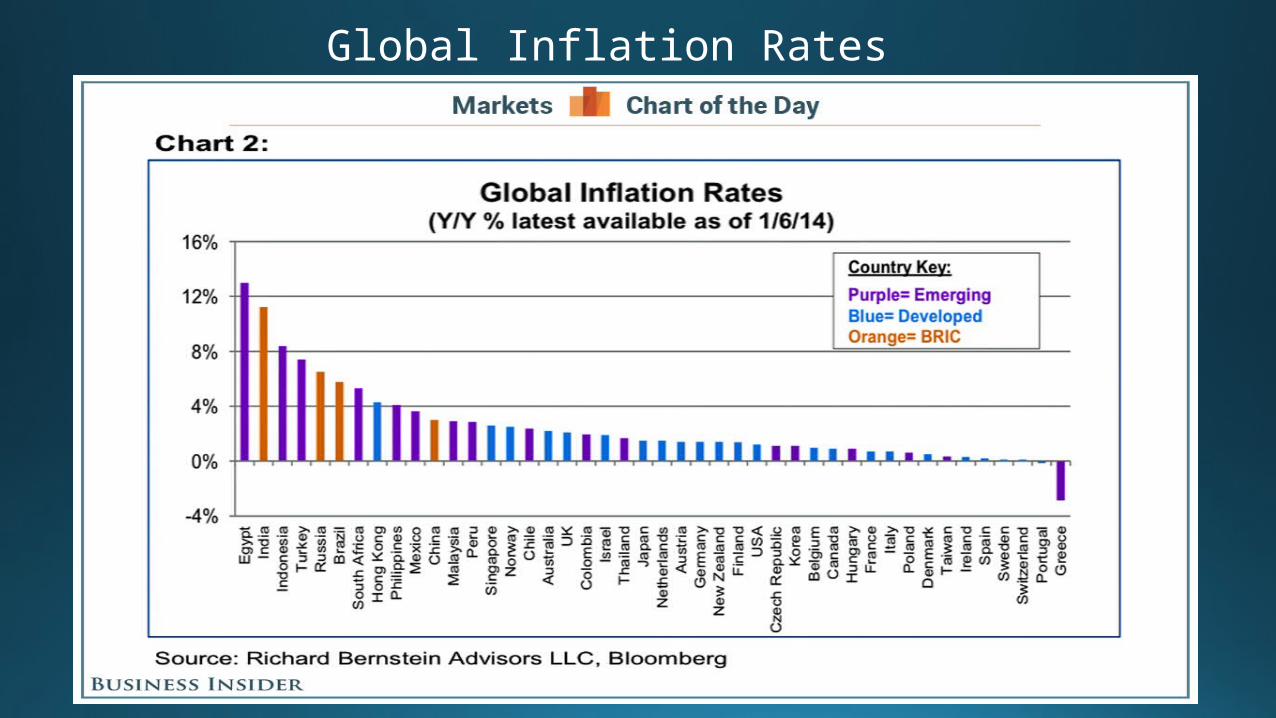
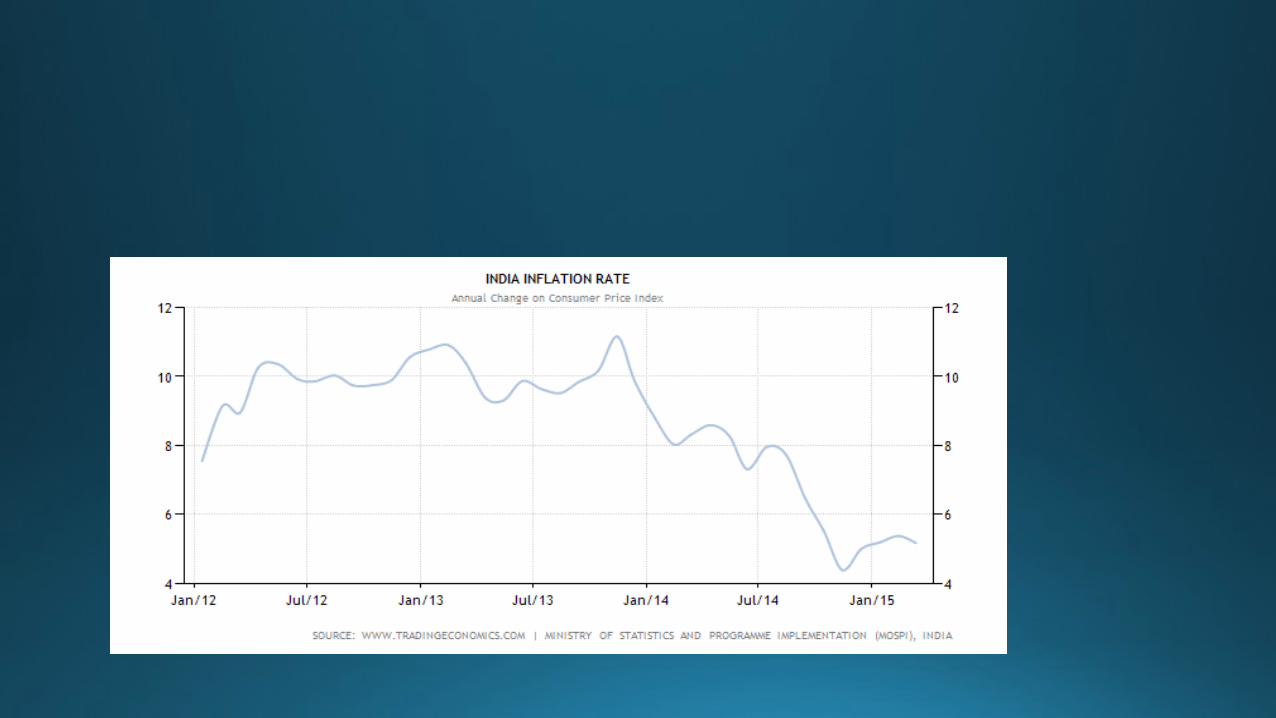
Global Inflation Rates
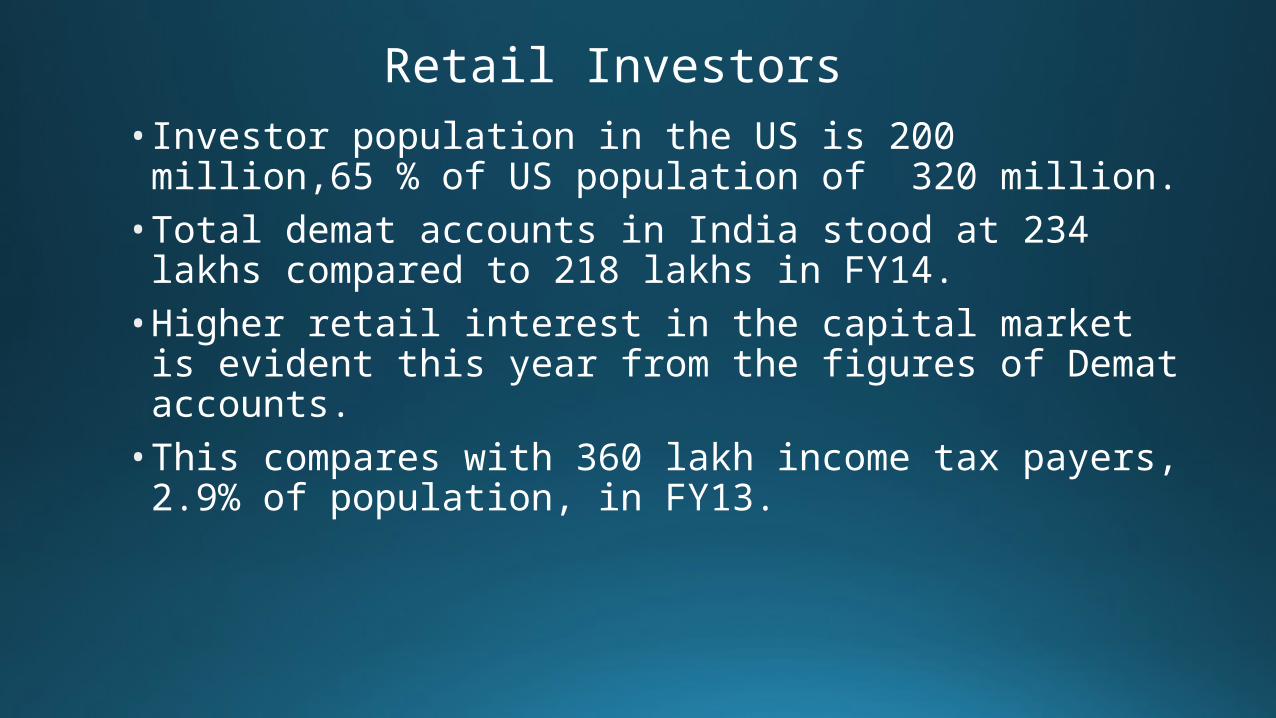
Retail Investors• Investor population in the US is 200 million,65 % of US
population of 320 million.• Total demat accounts in India stood at 234 lakhs
compared to 218 lakhs in FY14. • Higher retail interest in the capital market is evident
this year from the figures of Demat accounts.• This compares with 360 lakh income tax payers, 2.9%
of population, in FY13.

Why has stock market in India gone up?
• Equity valuations are governed by demand and supply of stocks in the market which in turn are determined by the market perception on valuation of equities.• When demand overpowers supply of equity, prices go
up, and supply overpowers demand, prices go down.• Factors that determine equity valuations are :
expected earnings growth, replacement cost, PE ratio and P/BV ratio.• Equity valuations get adjusted on the market
perception of these factors.• FIIs have become a dominant player in the India
capital market.
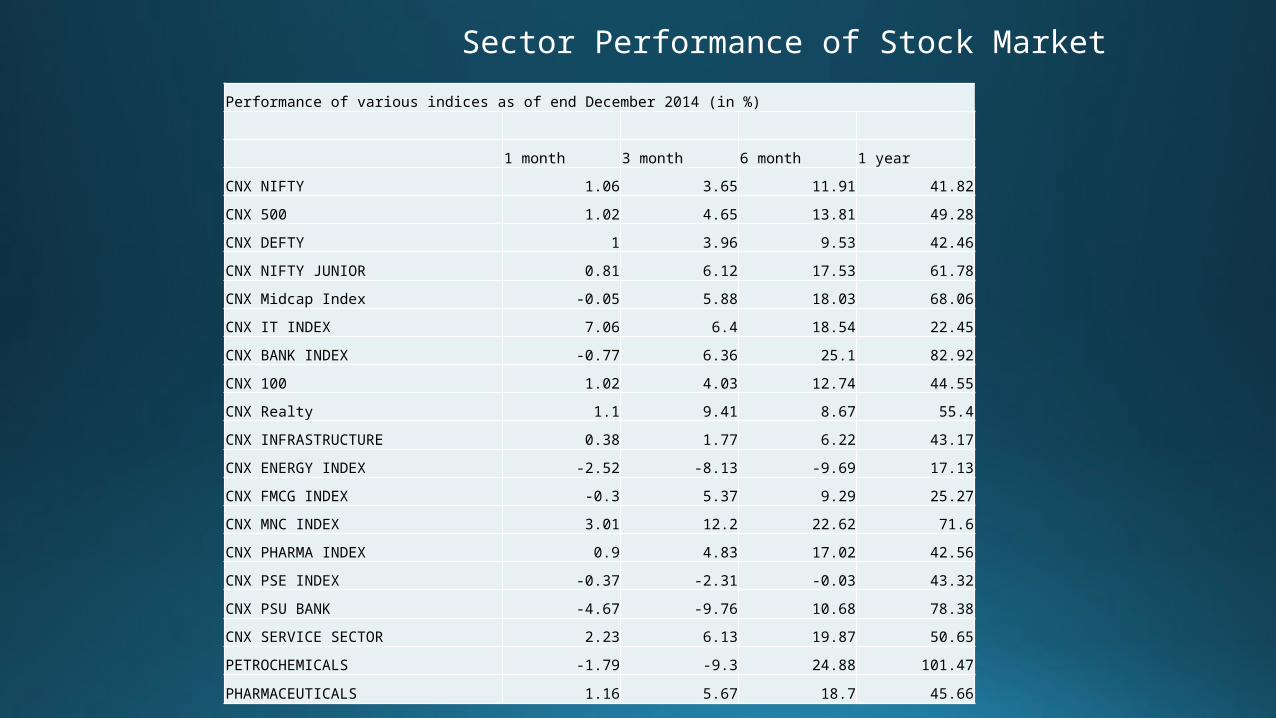
Sector Performance of Stock MarketPerformance of various indices as of end December 2014 (in %)
1 month 3 month 6 month 1 year
CNX NIFTY 1.06 3.65 11.91 41.82
CNX 500 1.02 4.65 13.81 49.28
CNX DEFTY 1 3.96 9.53 42.46
CNX NIFTY JUNIOR 0.81 6.12 17.53 61.78
CNX Midcap Index -0.05 5.88 18.03 68.06
CNX IT INDEX 7.06 6.4 18.54 22.45
CNX BANK INDEX -0.77 6.36 25.1 82.92
CNX 100 1.02 4.03 12.74 44.55
CNX Realty 1.1 9.41 8.67 55.4
CNX INFRASTRUCTURE 0.38 1.77 6.22 43.17
CNX ENERGY INDEX -2.52 -8.13 -9.69 17.13
CNX FMCG INDEX -0.3 5.37 9.29 25.27
CNX MNC INDEX 3.01 12.2 22.62 71.6
CNX PHARMA INDEX 0.9 4.83 17.02 42.56
CNX PSE INDEX -0.37 -2.31 -0.03 43.32
CNX PSU BANK -4.67 -9.76 10.68 78.38
CNX SERVICE SECTOR 2.23 6.13 19.87 50.65
PETROCHEMICALS -1.79 -9.3 24.88 101.47
PHARMACEUTICALS 1.16 5.67 18.7 45.66

Indian PE Ratio
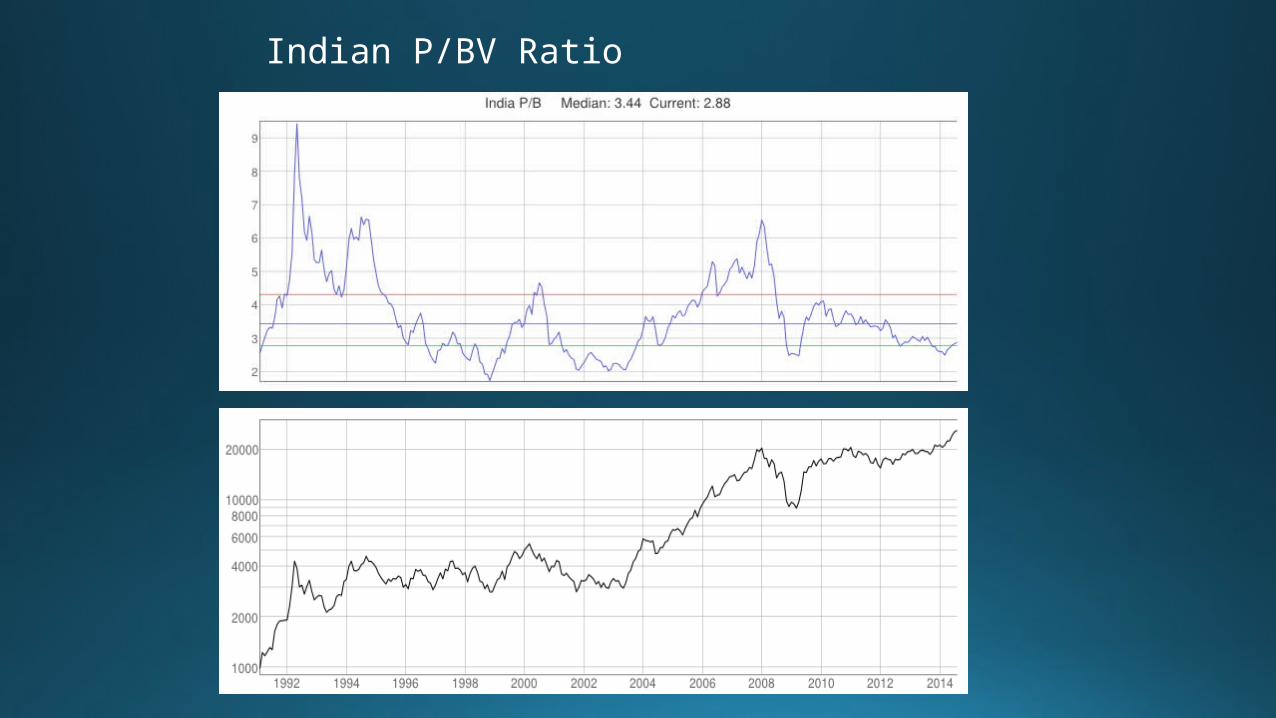
Indian P/BV Ratio

Indian Dividend Yield


Gold and Real Estate • In the last 10 years, gold has offered 17%
compounded annual growth rate (CAGR) returns.• Gold imports in the fiscal year 2014/15 ended March
31 jumped to 900 tonnes, Rs 2,34, 000 crs., $ 38 billion, 8% of total imports, up 36 per cent from a year ago. • That amounts to 29% of accretion in bank deposits
and 8 times investment in primary market issues.• Estimated 8% of savings are estimated to have been
gone into gold. • Sale of gold in coin and other forms by banks was not
a healthy policy and encouraged investment unproductive assets.• In the last seven years real estate investment also
gave double digit annual returns touching 12-13%

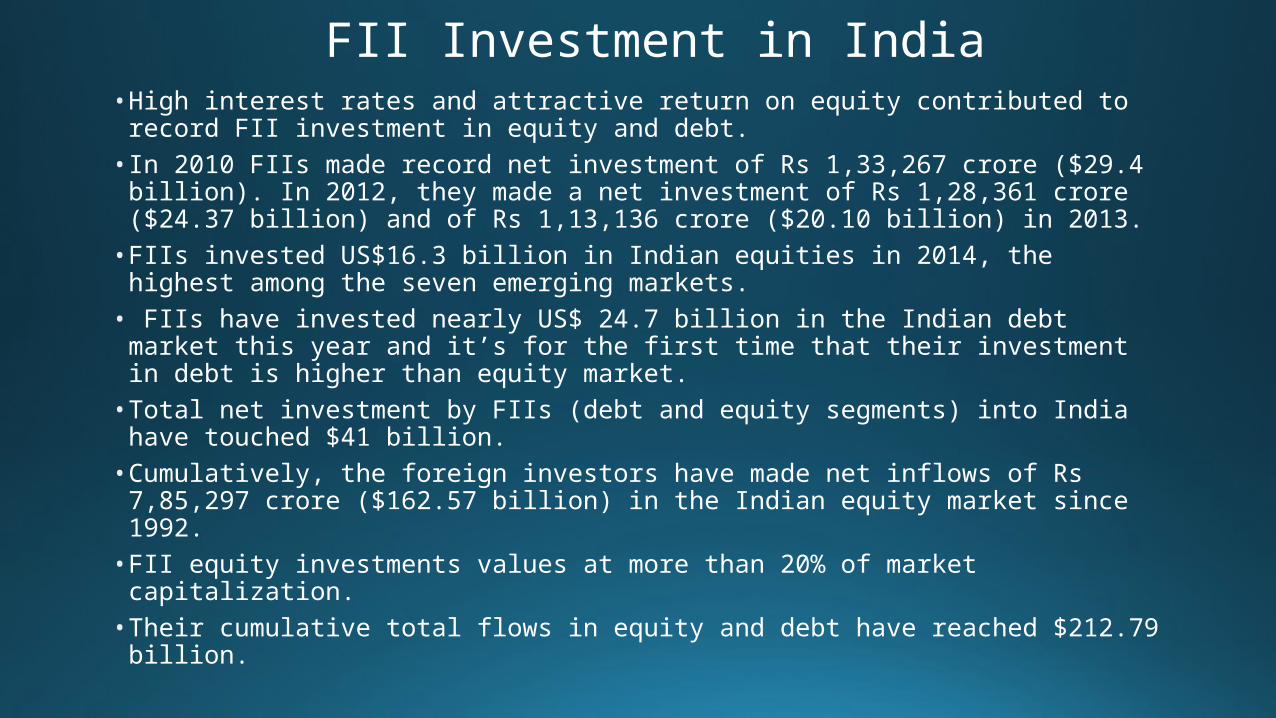
FII Investment in India• High interest rates and attractive return on equity contributed to
record FII investment in equity and debt.• In 2010 FIIs made record net investment of Rs 1,33,267 crore ($29.4
billion). In 2012, they made a net investment of Rs 1,28,361 crore ($24.37 billion) and of Rs 1,13,136 crore ($20.10 billion) in 2013.• FIIs invested US$16.3 billion in Indian equities in 2014, the highest
among the seven emerging markets.• FIIs have invested nearly US$ 24.7 billion in the Indian debt market
this year and it’s for the first time that their investment in debt is higher than equity market. • Total net investment by FIIs (debt and equity segments) into India
have touched $41 billion.• Cumulatively, the foreign investors have made net inflows of Rs
7,85,297 crore ($162.57 billion) in the Indian equity market since 1992.• FII equity investments values at more than 20% of market
capitalization.• Their cumulative total flows in equity and debt have reached $212.79
billion.

Mutual Fund Industry
• Mutual Fund industry has shown very positive trends with net investment of Rs 1,03,000 crs in 2014-15 compared to Rs 54,000 crs earlier year with equity investment accounting for 72% net investments.• Investment in equity mutual funds was Rs. 73,000 crs.
compared to outflow of Rs. 9,000 crs in earlier year.• The asset base of equity mutual funds has almost doubled to
more than Rs 3 lakh crs. on investment by retail investors. • Total mutual fund accounts stand at 4 crores which is close to
total number income tax payers.• Mutual fund industry has performed well by giving better than
index returns in equity as well as debt.

Budget and Capital Market• FDI limit of 26% in insurance sector has been increased to
49%. Expected Rs60,000 crs of investment.• Despite pressure for raising tax revenue FM kept income
tax rates stable.• To abolish wealth tax. Replaces wealth tax with additional 2
% surcharge on super rich• Rate of corporate tax will be reduced from 30% to 25%
over next four years.• Tax-free bonds for projects in rail road and irrigation• Proposes to rationalize capital gains tax regime for real
estate investment trusts.• Limit on deduction for contributions to pension fund and
new pension scheme increased to 150,000 rupees from 100,000 rupees
.

• PPP model for infrastructure development to be revitalized and govt. to bear majority of the risk.• The government will introduce gold deposit accounts
to utilize the 20,000 tonnes available within the country and launch a sovereign gold bond.• New scheme for depositors of gold to earn interest
and jewelers to obtain loans on their metal accounts.• To develop an Indian gold coin, which will carry the
Ashok Chakra on its face, to reduce the demand for foreign coins and recycle the gold available in the country. • Govt. to use Rs. 9,000 crores unclaimed funds in
PPF/EPF for Senior Citizens Fund.
Problems and Solutions• Inflation is the biggest enemy of capital market.• Since Central bank reacts to inflation by raising the
cost of money, it damages the capital market.• Risk free rate of 8.25% as exists now in India
considerably reduces the risk premium for equity investment and hence makes it less attractive. • On the other hand lower and declining risk free rate
boosts both equity and bond markets by raising the risk premium.• Since 2008 near zero interest rates in the developed
world have boosted equity and debt markets. • Bond values are determined by risk free rate,
expected future risk free rate and riskiness of bond.
How can capital market contribute to growth?• PSU form about more than one thirds of market capitalization, but
only about 10 % is held by institutions and public.• Recent move by SEBI to raise minimum public holding of PSUs
from 10% to 25% can galvanize the market.• This offers tremendous scope for capital market growth. Although
this contributes to lower fiscal deficit, many PSUs that have large investment plans can make public issues and thereby dilute Government equity. • In either way of public issues pricing of issues is the most critical
element of congenial investor sentiment.• Of late large number of issues are so heavily priced that offer little
scope for reasonable investor return and thereby damage new issues as well as secondary markets. Pricing is very crucial to attract retail investors.
• Inflation in India was fuelled energy cost and supply bottlenecks in essential commodities.• There was less inflation in prices of manufactured
goods. • While energy costs have come down, it is necessary to
improve market efficiency in essential commodities. • Rates of interest need to come down to boost risk
taking by industry as well as retail investors.• Demographic dividend has to be encashed to get
younger generation into equity. Demat accounts and mutual fund account have to double in next five years to capture younger investors.

• Infrastructure bonds and convertible debentures by infrastructure and housing construction companies offers tremendous potential for both the corporates as well as investors.• Exiting companies can also reduce debt by offering
right issues with attractive pricing.• Outlook for the market remains positive with expected
18% earnings growth and relatively low PE of 18.