indian consumer durables dcic april2011 - …€¦ · confidential indian consumer durables...
TRANSCRIPT

Confidential
INDIAN CONSUMER DURABLES Independent Equity Research
DC INDIA RESEARCH LLP
April, 2011
Confidential – April, 2011 Indian Consumer Durables
DC India Research LLP Page 1
TTK Prestige Limited
Confidential – April, 2011 Indian Consumer Durables
DC India Research LLP Page 2
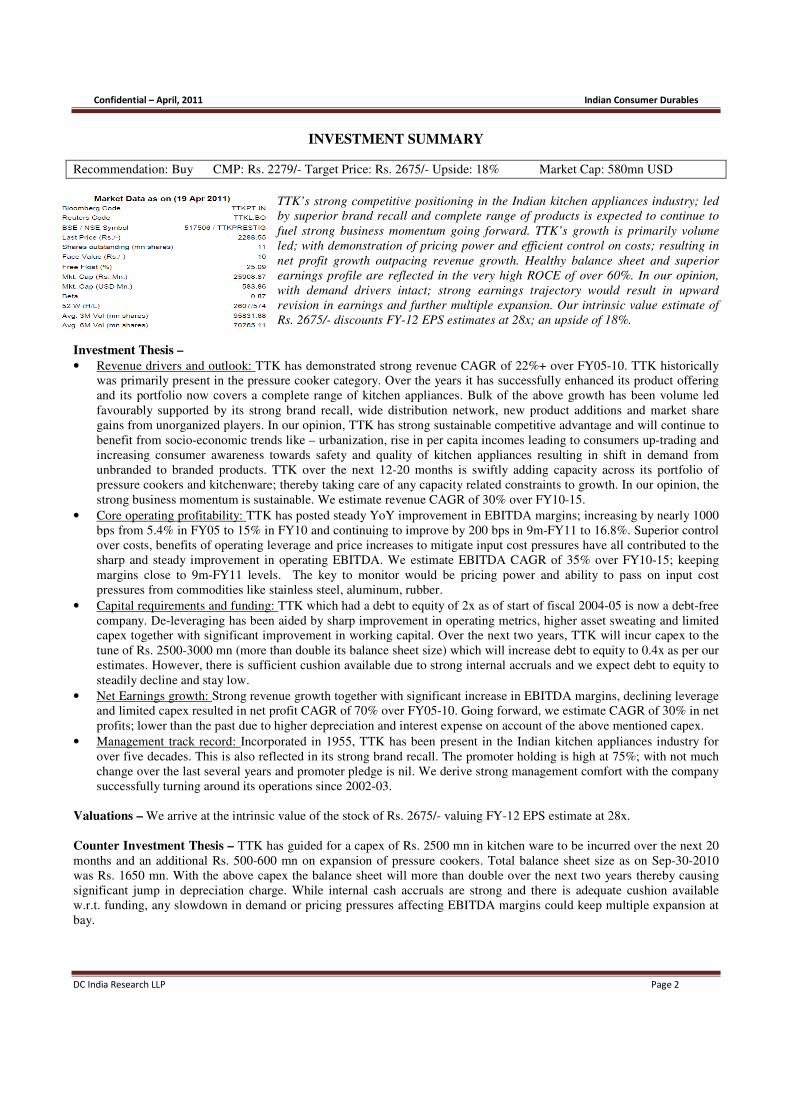
INVESTMENT SUMMARY
Recommendation: Buy CMP: Rs. 2279/- Target Price: Rs. 2675/- Upside: 18% Market Cap: 580mn USD
TTK’s strong competitive positioning in the Indian kitchen appliances industry; led
by superior brand recall and complete range of products is expected to continue to
fuel strong business momentum going forward. TTK’s growth is primarily volume
led; with demonstration of pricing power and efficient control on costs; resulting in
net profit growth outpacing revenue growth. Healthy balance sheet and superior
earnings profile are reflected in the very high ROCE of over 60%. In our opinion,
with demand drivers intact; strong earnings trajectory would result in upward
revision in earnings and further multiple expansion. Our intrinsic value estimate of
Rs. 2675/- discounts FY-12 EPS estimates at 28x; an upside of 18%.
Investment Thesis –
• Revenue drivers and outlook: TTK has demonstrated strong revenue CAGR of 22%+ over FY05-10. TTK historically
was primarily present in the pressure cooker category. Over the years it has successfully enhanced its product offering
and its portfolio now covers a complete range of kitchen appliances. Bulk of the above growth has been volume led
favourably supported by its strong brand recall, wide distribution network, new product additions and market share
gains from unorganized players. In our opinion, TTK has strong sustainable competitive advantage and will continue to
benefit from socio-economic trends like – urbanization, rise in per capita incomes leading to consumers up-trading and
increasing consumer awareness towards safety and quality of kitchen appliances resulting in shift in demand from
unbranded to branded products. TTK over the next 12-20 months is swiftly adding capacity across its portfolio of
pressure cookers and kitchenware; thereby taking care of any capacity related constraints to growth. In our opinion, the
strong business momentum is sustainable. We estimate revenue CAGR of 30% over FY10-15.
• Core operating profitability: TTK has posted steady YoY improvement in EBITDA margins; increasing by nearly 1000
bps from 5.4% in FY05 to 15% in FY10 and continuing to improve by 200 bps in 9m-FY11 to 16.8%. Superior control
over costs, benefits of operating leverage and price increases to mitigate input cost pressures have all contributed to the
sharp and steady improvement in operating EBITDA. We estimate EBITDA CAGR of 35% over FY10-15; keeping
margins close to 9m-FY11 levels. The key to monitor would be pricing power and ability to pass on input cost
pressures from commodities like stainless steel, aluminum, rubber.
• Capital requirements and funding: TTK which had a debt to equity of 2x as of start of fiscal 2004-05 is now a debt-free
company. De-leveraging has been aided by sharp improvement in operating metrics, higher asset sweating and limited
capex together with significant improvement in working capital. Over the next two years, TTK will incur capex to the
tune of Rs. 2500-3000 mn (more than double its balance sheet size) which will increase debt to equity to 0.4x as per our
estimates. However, there is sufficient cushion available due to strong internal accruals and we expect debt to equity to
steadily decline and stay low.
• Net Earnings growth: Strong revenue growth together with significant increase in EBITDA margins, declining leverage
and limited capex resulted in net profit CAGR of 70% over FY05-10. Going forward, we estimate CAGR of 30% in net
profits; lower than the past due to higher depreciation and interest expense on account of the above mentioned capex.
• Management track record: Incorporated in 1955, TTK has been present in the Indian kitchen appliances industry for
over five decades. This is also reflected in its strong brand recall. The promoter holding is high at 75%; with not much
change over the last several years and promoter pledge is nil. We derive strong management comfort with the company
successfully turning around its operations since 2002-03.
Valuations – We arrive at the intrinsic value of the stock of Rs. 2675/- valuing FY-12 EPS estimate at 28x.
Counter Investment Thesis – TTK has guided for a capex of Rs. 2500 mn in kitchen ware to be incurred over the next 20
months and an additional Rs. 500-600 mn on expansion of pressure cookers. Total balance sheet size as on Sep-30-2010
was Rs. 1650 mn. With the above capex the balance sheet will more than double over the next two years thereby causing
significant jump in depreciation charge. While internal cash accruals are strong and there is adequate cushion available
w.r.t. funding, any slowdown in demand or pricing pressures affecting EBITDA margins could keep multiple expansion at
bay.

Confidential – April, 2011
DC India Research LLP
Financial Summary –
(INR mn) FY
Revenue 2,810
YoY EBITDA
YoY EBITDA margins
Reported PAT
YoY PAT margins
FCFF
Debt:equity
Asset turns
ROCE 21.14%
RoE 24.50%
Net working capital/Net sales 25.2%
Capex/Net sales
EBIT/Gross Interest Expense
shares o/s (mn) 11.35
EPS 10.37
P/E EV: - M. cap - Add: debt - Less: cash and cash
equivalents EV/EBITDA BVPS
P/BV Dividend payout 33.86%
FY-07 FY-08 FY-09 FY-10 FY-11e FY-12e FY
2,810 3,259 4,013 5,079 7,580 10,303 13,200
16.0% 23.1% 26.6% 49.2% 35.9% 28.1%
262 117 393 771 1,286 1,766 2,263
-55.2% 235.0% 96.3% 66.9% 37.3% 28.1%
9.3% 3.6% 9.8% 15.2% 17.0% 17.1% 17.1%
118 207 224 524 883 1,086 1,335
75.6% 8.3% 134.3% 68.4% 23.0% 22.9%
4.2% 6.3% 5.6% 10.3% 11.7% 10.5% 10.1%
-122 69 382 627 307 -850
1.42 0.70 0.25 0.02 -0.04 0.40
4.60 4.99 5.47 6.24 8.30 3.73
21.14% 6.59% 33.01% 64.46% 81.34% 58.45% 45.34%
24.50% 34.83% 29.99% 51.28% 56.93% 47.44% 41.75%
25.2% 15.7% 9.4% 4.3% 9.5% 9.5%
4.5% 7.1% 1.6% 1.6% 1.3% 18.0% 11.0%
2.98 0.85 4.91 21.15 172.14 19.00 16.21
11.35 11.32 11.32 11.32 11.32 11.32 11.32
10.37 18.26 19.77 46.32 78.02 95.97 117.96
49.20 29.21 23.75 19.32
25,387 25,279 26,433 26,944
25,798 25,798 25,798 25,798
28 -84 1,071 1,582
440 436 436
32.93 19.65 14.97 11.91
46 59 73 108 166 238
21.14 13.70 9.56
33.86% 22.49% 29.59% 25.17% 25.00% 25.00% 25.00%
Indian Consumer Durables
Page 3
FY-13e CAGR (FY10-13)
13,200 37.5%
28.1%
2,263 43.2%
28.1%
17.1%
1,335 36.6%
22.9%
10.1%
-117 -157.2%
0.43
3.13
45.34%
41.75%
9.5%
11.0%
16.21
11.32
117.96 36.6%
19.32
26,944
25,798
1,582
436
11.91
327 44.7%
6.97
25.00%
Confidential – April, 2011 Indian Consumer Durables
DC India Research LLP Page 4
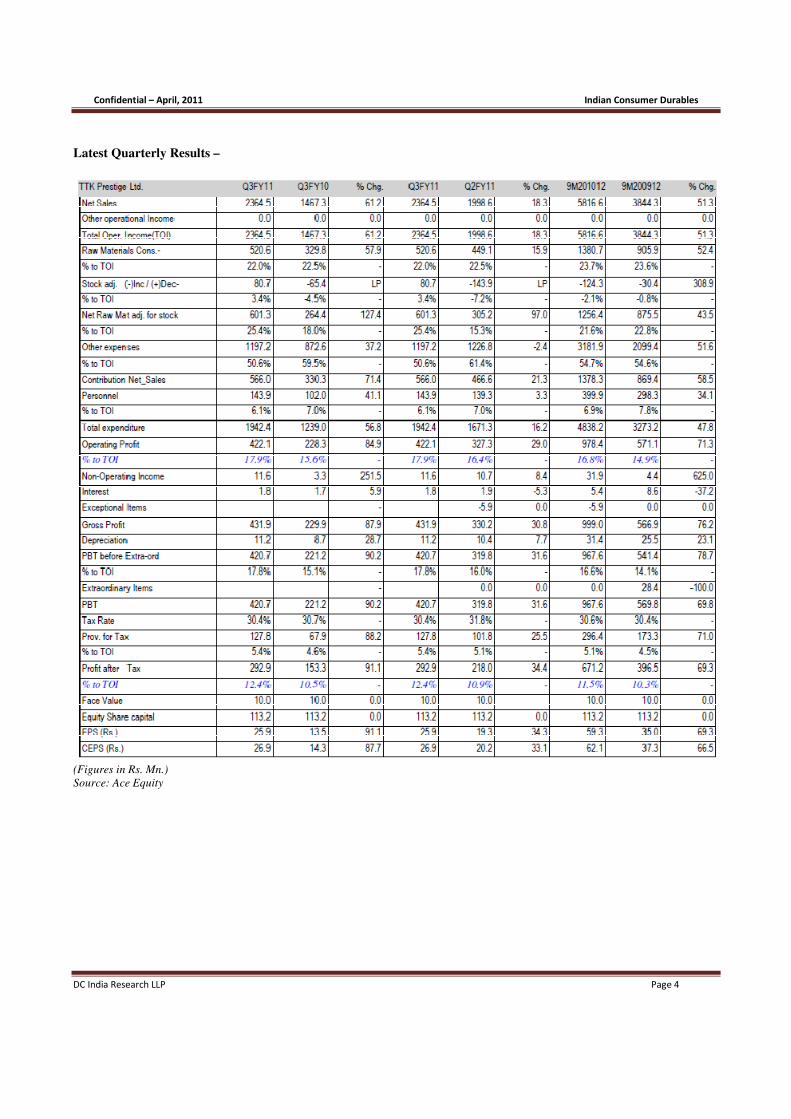
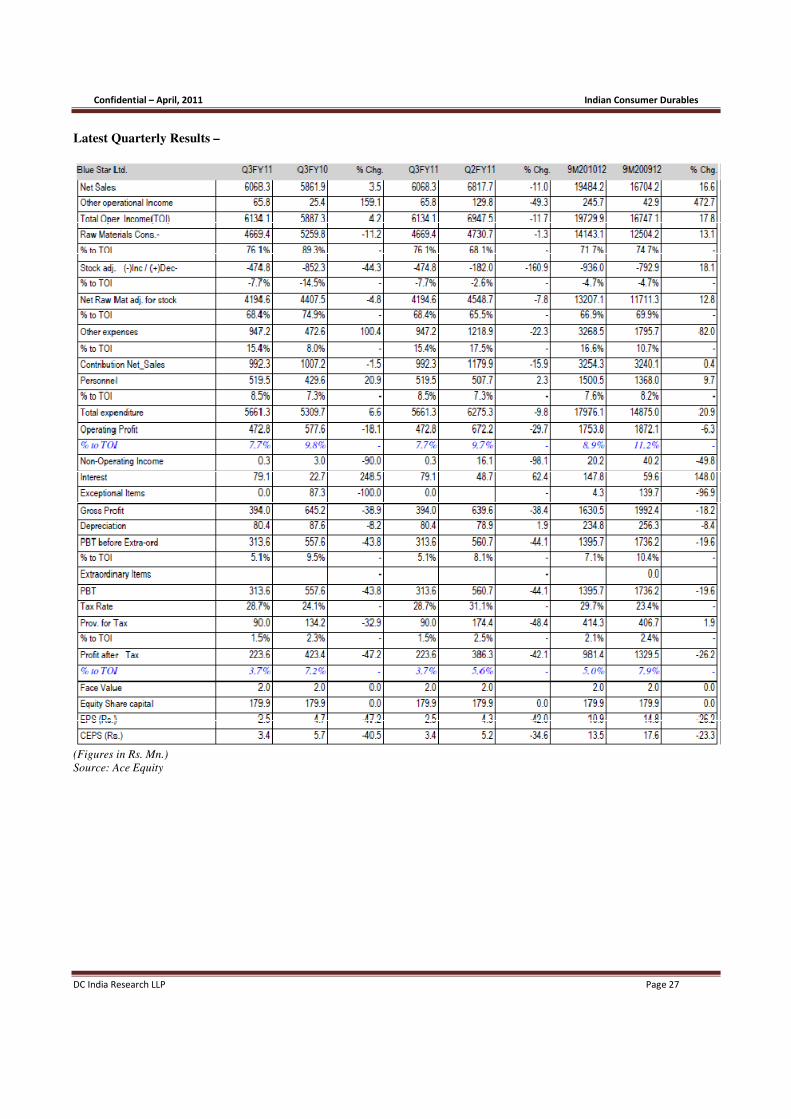
Latest Quarterly Results –
(Figures in Rs. Mn.)
Source: Ace Equity

Confidential – April, 2011 Indian Consumer Durables
DC India Research LLP Page 5
Quarter – Segment Analysis –
(Figures in Rs. Mn.)
Source: Ace Equity

Confidential – April, 2011 Indian Consumer Durables
DC India Research LLP Page 6
BUSINESS & FINANCIAL OVERVIEW
Business Model: TTK is one of the largest organized sector players in the Indian kitchen appliances industry. From
historically being more dominant in the pressure cooker category, TTK over the years has enhanced its portfolio and now
offers a wide range of products. On an annual basis it reports its revenue across the following product categories - a)
Pressure Cookers (50% of revenue), b) Cookware (16% of revenue), c) Kitchen electrical appliances (23% of revenue), d)
Gas stoves (9% of revenue) and e) Other kitchenware (3% of revenue). In terms of geographic exposure, domestic sales
account for the majority at over 95% in FY10. While domestic sales grew at 26.4% in this period, exports declined by 20%
due to slowdown in its key markets of Middle East and Srilanka.
Management background and interests: Incorporated in 1955, TTK has been present in the Indian kitchen appliances
industry for over five decades. This is also reflected in its strong brand recall. The promoter holding is high at 75%; with not
much change over the last several years and promoter pledge is nil. We derive strong management comfort with the
company successfully turning around its operations since 2002-03. The share holding pattern for TTK as on 31 December
2010 is as follows: a) promoter holding - 75% (no material change in past five years), b) institutional holding – 10%
(foreign – 4.54%, domestic – 7%) , c) public - 15%. The management has been consistent in payment of dividend with a
payout ratio of around 25% in the past three years.
Revenue drivers & competitive positioning:
% Revenue FY10
Volume CAGR FY05-10
ASP CAGR FY05-10
Volume CAGR FY10-15
ASP CAGR FY10-15
Pressure Cookers 47.4% 13.0% 1.4% 30.4% 4.9%
Cookware 17.2% 17.1% 9.9% 23.7% 4.9%
Kitchen electrical appliances* 20.4% 61.1% 14.4% 23.1% 5.0%
Gas stoves* 12.0% 15.0% 16.0% 12.0% 5.0%
Other kitchenware 3.0% 59.6% 20.7% 3.0% 5.0%
Note: CAGR over the period from where data in Annual Report is available
TTK has demonstrated strong revenue CAGR of 22%+ over FY05-10. TTK historically was primarily present in the
pressure cooker category. Over the years it has successfully leveraged on its key strengths which are – superior brand recall
with over five decades of presence, design and manufacturing capabilities and extensive distribution reach. TTK has
enhanced its product offering and its portfolio now covers a complete range of kitchen appliances. Bulk of the above growth
has been volume led favourably supported by its strong brand recall, wide distribution network, new product additions and
market share gains from unorganized players. Besides the traditional retail channel; TTK also distributes through its
exclusive retail chain outlets under its brand “Prestige Smart Kitchen”. The number of outlets as at 31.3.2010 was 228. The
network now covers 19 States and 136 towns.
In our opinion, TTK has strong sustainable competitive advantage and will continue to benefit from socio-economic trends
like – urbanization, rise in per capita incomes leading to consumers up-trading and increasing consumer awareness towards
safety and quality of kitchen appliances resulting in shift in demand from unbranded to branded products. TTK over the
next 12-20 months is swiftly adding capacity across its portfolio of pressure cookers and kitchenware; thereby taking care of
any capacity related constraints to growth. In our opinion, the strong business momentum is sustainable. We estimate
revenue CAGR of 30% over FY10-15.
Operating cost structure analysis: The total operating costs of TTK account for nearly 83% of revenues. Off this - Raw
materials at 55% constitute the majority, followed by selling and distribution expenses at nearly 20% and employee cost at
7%. In the current 9m period ending Dec-31-2010, raw material costs increased by over 300 bps due to input cost inflation
but was compensated by 400 bps reduction in other operating costs, thereby leading to 200 bps expansion in EBITDA
margins. Ability of TTK to pass on raw material cost increase would be the single most important driver to sustaining
current levels of EBITDA margins.

Confidential – April, 2011 Indian Consumer Durables
DC India Research LLP Page 7
Core operating profit and margins: TTK has posted steady YoY improvement in EBITDA margins; increasing by nearly
1000 bps from 5.4% in FY05 to 15% in FY10 and continuing to improve by 200 bps in 9m-FY11 to 16.8%. Superior
control over costs, benefits of operating leverage and price increases to mitigate input cost pressures have all contributed to
the sharp and steady improvement in operating EBITDA. We estimate EBITDA CAGR of 35% over FY10-15; keeping
margins close to 9m-FY11 levels. The key to monitor would be pricing power and ability to pass on input cost pressures
from commodities like stainless steel, aluminum, rubber.
Non-operating items: We do not expect non-operating items to be material in nature. In the past the same has been around
less than1% of revenues comprising of interest income and dividend income.
Capital Expenditure: The last big round of capex happened in FY08 when TTK doubled its pressure cooker manufacturing
capacity and capex was 7% of FY08 revenue. Thereafter capex was nominal and hovered around 1.5% of revenues in FY09
and FY10. Over the next two years, TTK will incur capex to the tune of Rs. 2500-3000 mn which is more than double its
current balance sheet size. While we do estimate debt to equity to increase to 0.4x; however, there is sufficient cushion
available due to strong internal accruals and we expect debt to equity to steadily decline thereafter.
Working Capital Intensity: Over the past five years, TTK has been successful in significantly reducing its working capital
requirement. This has been aided by sharp reduction in debtor days and inventory days. Working capital intensity at around
5% of FY10 revenues is a sharp contrast to the 30%+ levels of FY05. Going forward we have built in marginal increase in
working capital requirement.
Depreciation: In the past five years the depreciation rate has been less than 1% of revenues. With sharp increase in capex
over the next two years, we expect depreciation charge to increase going forward.
Interest Expenses: Deleveraging through the last couple of years has resulted in steady decline in interest expense.
However, over the next two years, interest expense could inch up on back of the aforementioned capex.
Taxation: Marginal tax rates have fluctuated over the years but on average are 30% of EBT. This tax rate is expected to
continue over the coming years.
Profit after tax and net margins: Strong revenue growth together with significant increase in EBITDA margins, declining
leverage and limited capex resulted in net profit CAGR of 70% over FY05-10. Going forward, we estimate CAGR of 30%
in net profits; lower than the past due to higher depreciation and interest expense on account of the above mentioned capex.
Cap-structure analysis: There was no equity dilution for TTK in the past five years. TTK which had a debt to equity of 2x
as of start of fiscal 2004-05 is now a debt-free company. De-leveraging has been aided by sharp improvement in operating
metrics, higher asset sweating and limited capex together with significant improvement in working capital.
Over the next two years, TTK will incur capex to the tune of Rs. 2500-3000 mn (more than double its balance sheet size)
which will increase debt to equity to 0.4x as per our estimates. However, there is sufficient cushion available due to strong
internal accruals and we expect debt to equity to steadily decline and stay low.
Capex and asset turns: TTK’ 22%+ CAGR in revenues in the past five years and low capex outlay is visible in the asset
turnover ratio, with asset sweating increasing from 3.4x in FY-05 to 6.2x in FY-10. This efficient deployment of capital has
led to a healthy ROCE of 65% and ROE of 45% in FY10. We expect strong return ratios to continue going forward.
Investment portfolio (liquid and group company): There are no meaningful investments in any subsidiary or group
companies. Investments form less than a percent of total balance sheet size. TTK has close to 6.5 acres of land at Bangalore
whose possession it had granted to a developer for the purpose of development at end of FY08. The original plan was to
develop a Mall which would give recurring income stream of rentals. Due to change in market conditions the developer has
suggested a mixed development of residential and office space. As per Annual Report 2009-10, the management has
mentioned that – “The developer has informed us that they are in the advanced stage of getting sanctions for the revised
plans and that the construction can commence during the first half of the financial year 2010-11. Based on the revised plans
for development the company expects to have both lump sum as well as recurring rent as and when the project is complete.
The developer has estimated that the project can be completed within a period of 30 months from the date of
commencement of construction.”
Confidential – April, 2011 Indian Consumer Durables
DC India Research LLP Page 8
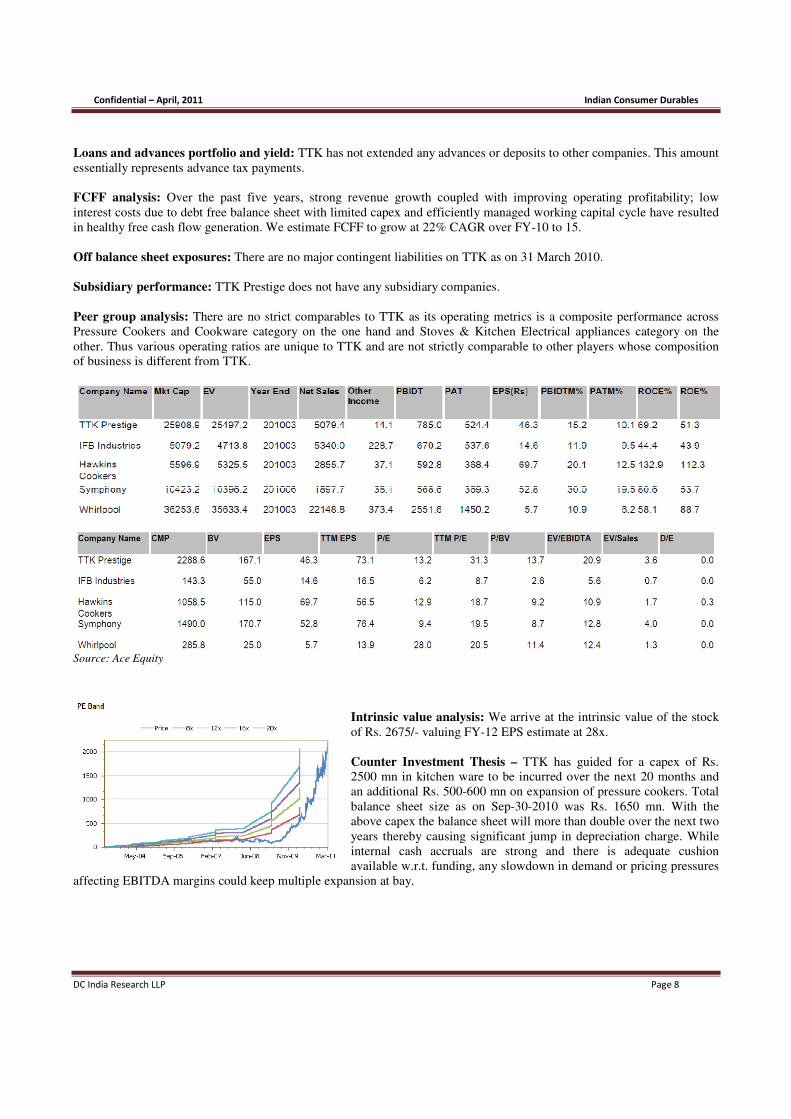
Loans and advances portfolio and yield: TTK has not extended any advances or deposits to other companies. This amount
essentially represents advance tax payments.
FCFF analysis: Over the past five years, strong revenue growth coupled with improving operating profitability; low
interest costs due to debt free balance sheet with limited capex and efficiently managed working capital cycle have resulted
in healthy free cash flow generation. We estimate FCFF to grow at 22% CAGR over FY-10 to 15.
Off balance sheet exposures: There are no major contingent liabilities on TTK as on 31 March 2010.
Subsidiary performance: TTK Prestige does not have any subsidiary companies.
Peer group analysis: There are no strict comparables to TTK as its operating metrics is a composite performance across
Pressure Cookers and Cookware category on the one hand and Stoves & Kitchen Electrical appliances category on the
other. Thus various operating ratios are unique to TTK and are not strictly comparable to other players whose composition
of business is different from TTK.
Source: Ace Equity
Intrinsic value analysis: We arrive at the intrinsic value of the stock
of Rs. 2675/- valuing FY-12 EPS estimate at 28x.
Counter Investment Thesis – TTK has guided for a capex of Rs.
2500 mn in kitchen ware to be incurred over the next 20 months and
an additional Rs. 500-600 mn on expansion of pressure cookers. Total
balance sheet size as on Sep-30-2010 was Rs. 1650 mn. With the
above capex the balance sheet will more than double over the next two
years thereby causing significant jump in depreciation charge. While
internal cash accruals are strong and there is adequate cushion
available w.r.t. funding, any slowdown in demand or pricing pressures
affecting EBITDA margins could keep multiple expansion at bay.

Confidential – April, 2011 Indian Consumer Durables
DC India Research LLP Page 9
WHIRLPOOL OF INDIA LIMITED
Confidential – April, 2011 Indian Consumer Durables
DC India Research LLP Page 10
INVESTMENT SUMMARY
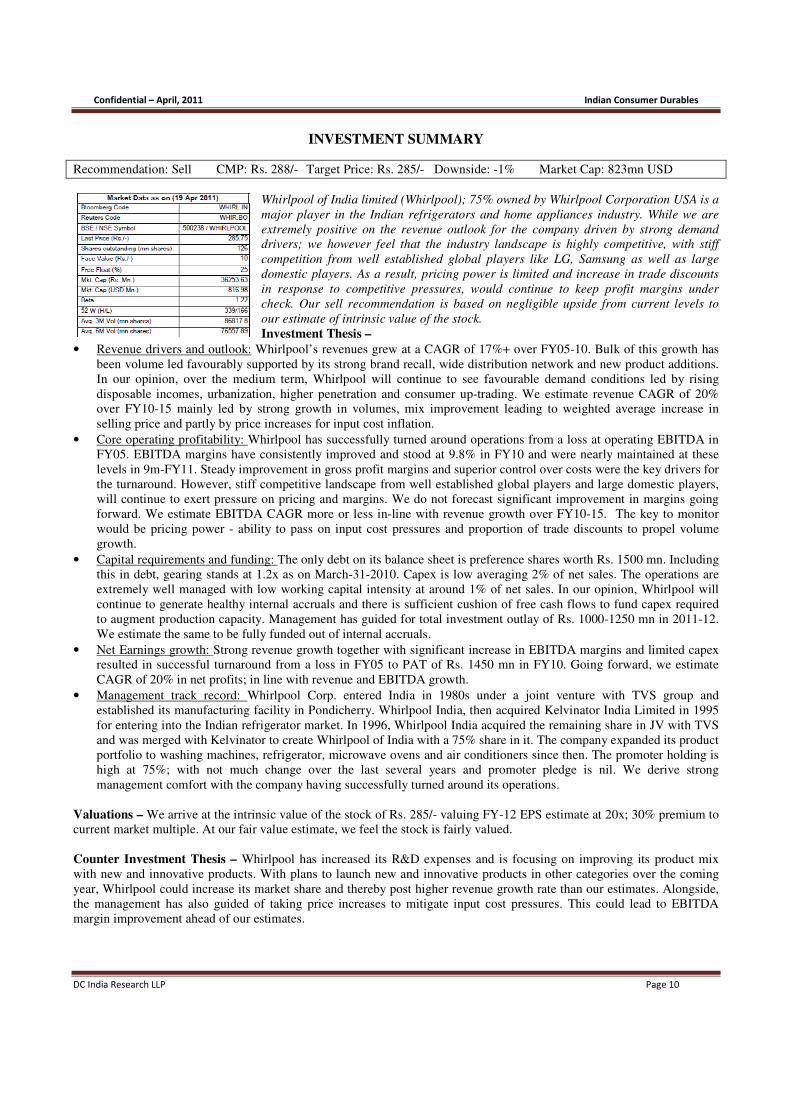
Recommendation: Sell CMP: Rs. 288/- Target Price: Rs. 285/- Downside: -1% Market Cap: 823mn USD
Whirlpool of India limited (Whirlpool); 75% owned by Whirlpool Corporation USA is a
major player in the Indian refrigerators and home appliances industry. While we are
extremely positive on the revenue outlook for the company driven by strong demand
drivers; we however feel that the industry landscape is highly competitive, with stiff
competition from well established global players like LG, Samsung as well as large
domestic players. As a result, pricing power is limited and increase in trade discounts
in response to competitive pressures, would continue to keep profit margins under
check. Our sell recommendation is based on negligible upside from current levels to
our estimate of intrinsic value of the stock.
Investment Thesis –
• Revenue drivers and outlook: Whirlpool’s revenues grew at a CAGR of 17%+ over FY05-10. Bulk of this growth has
been volume led favourably supported by its strong brand recall, wide distribution network and new product additions.
In our opinion, over the medium term, Whirlpool will continue to see favourable demand conditions led by rising
disposable incomes, urbanization, higher penetration and consumer up-trading. We estimate revenue CAGR of 20%
over FY10-15 mainly led by strong growth in volumes, mix improvement leading to weighted average increase in
selling price and partly by price increases for input cost inflation.
• Core operating profitability: Whirlpool has successfully turned around operations from a loss at operating EBITDA in
FY05. EBITDA margins have consistently improved and stood at 9.8% in FY10 and were nearly maintained at these
levels in 9m-FY11. Steady improvement in gross profit margins and superior control over costs were the key drivers for
the turnaround. However, stiff competitive landscape from well established global players and large domestic players,
will continue to exert pressure on pricing and margins. We do not forecast significant improvement in margins going
forward. We estimate EBITDA CAGR more or less in-line with revenue growth over FY10-15. The key to monitor
would be pricing power - ability to pass on input cost pressures and proportion of trade discounts to propel volume
growth.
• Capital requirements and funding: The only debt on its balance sheet is preference shares worth Rs. 1500 mn. Including
this in debt, gearing stands at 1.2x as on March-31-2010. Capex is low averaging 2% of net sales. The operations are
extremely well managed with low working capital intensity at around 1% of net sales. In our opinion, Whirlpool will
continue to generate healthy internal accruals and there is sufficient cushion of free cash flows to fund capex required
to augment production capacity. Management has guided for total investment outlay of Rs. 1000-1250 mn in 2011-12.
We estimate the same to be fully funded out of internal accruals.
• Net Earnings growth: Strong revenue growth together with significant increase in EBITDA margins and limited capex
resulted in successful turnaround from a loss in FY05 to PAT of Rs. 1450 mn in FY10. Going forward, we estimate
CAGR of 20% in net profits; in line with revenue and EBITDA growth.
• Management track record: Whirlpool Corp. entered India in 1980s under a joint venture with TVS group and
established its manufacturing facility in Pondicherry. Whirlpool India, then acquired Kelvinator India Limited in 1995
for entering into the Indian refrigerator market. In 1996, Whirlpool India acquired the remaining share in JV with TVS
and was merged with Kelvinator to create Whirlpool of India with a 75% share in it. The company expanded its product
portfolio to washing machines, refrigerator, microwave ovens and air conditioners since then. The promoter holding is
high at 75%; with not much change over the last several years and promoter pledge is nil. We derive strong
management comfort with the company having successfully turned around its operations.
Valuations – We arrive at the intrinsic value of the stock of Rs. 285/- valuing FY-12 EPS estimate at 20x; 30% premium to
current market multiple. At our fair value estimate, we feel the stock is fairly valued.
Counter Investment Thesis – Whirlpool has increased its R&D expenses and is focusing on improving its product mix
with new and innovative products. With plans to launch new and innovative products in other categories over the coming
year, Whirlpool could increase its market share and thereby post higher revenue growth rate than our estimates. Alongside,
the management has also guided of taking price increases to mitigate input cost pressures. This could lead to EBITDA
margin improvement ahead of our estimates.

Confidential – April, 2011 Indian Consumer Durables
DC India Research LLP Page 11
Financial Summary –
(INR mn) FY-07 FY-08 FY-09 FY-10 FY-11e FY-12e FY-13e CAGR
(FY10-13)
Revenue 14,806 15,645 17,192 22,149 27,560 33,110 39,757 21.5%
YoY
5.7% 9.9% 28.8% 24.4% 20.1% 20.1%
EBITDA 226 398 1,068 2,178 2,511 3,019 3,738 19.7%
YoY
75.8% 168.4% 103.9% 15.3% 20.2% 23.8%
EBITDA margins 1.5% 2.5% 6.2% 9.8% 9.1% 9.1% 9.4%
Reported PAT -53 323 705 1,450 1,543 1,809 2,208 15.0%
YoY
-707.9% 118.2% 105.7% 6.4% 17.3% 22.0%
PAT margins -0.4% 2.1% 4.1% 6.5% 5.6% 5.5% 5.6%
FCFF 248 -163 1,038 535 1,058 898 2,412 65.2%
Debt:equity -28.55 18.99 1.92 1.20 1.20 1.20 1.20
Asset turns 2.41 2.40 2.51 3.12 3.73 3.83 4.40
ROCE -3.12% 0.65% 17.41% 47.41% 49.50% 43.70% 41.10%
RoE -3.75% 20.82% 30.63% 45.24% 36.70% 31.74% 29.32%
Net working capital/Net sales -2.3% -1.1% -2.9% -0.4% 1.3% 1.1% 0.6%
Capex/Net sales 1.7% 2.4% 1.3% 1.6% 1.1% 3.8% 1.0%
EBIT/Gross Interest Expense -0.75 0.14 3.92 1.92 11.67 13.97 17.35
shares o/s (mn) 126.87 126.87 126.87 126.87 126.87 126.87 126.87
EPS -0.42 2.55 5.56 11.43 12.16 14.26 17.40 15.0%
P/E
25.24 23.73 20.23 16.58
EV:
37,505 36,461 35,577 33,178
- M. cap
36,602 36,602 36,602 36,602
- Add: debt
1,525 1,525 1,525 1,525
- Less: cash and cash equivalents
622 1,666 2,550 4,949
EV/EBITDA
17.22 14.52 11.79 8.88
BVPS -1 1 11 16 26 39 55 52.1%
P/BV
18.33 10.89 7.33 5.21
Dividend payout 0.00% 0.00% 0.00% 0.00% 0.00% 0.00% 0.00%

Confidential – April, 2011 Indian Consumer Durables
DC India Research LLP Page 12
Latest Quarterly Results –
(Figures in Rs. Mn.)
Source: Ace Equity
Confidential – April, 2011 Indian Consumer Durables
DC India Research LLP Page 13
BUSINESS & FINANCIAL OVERVIEW
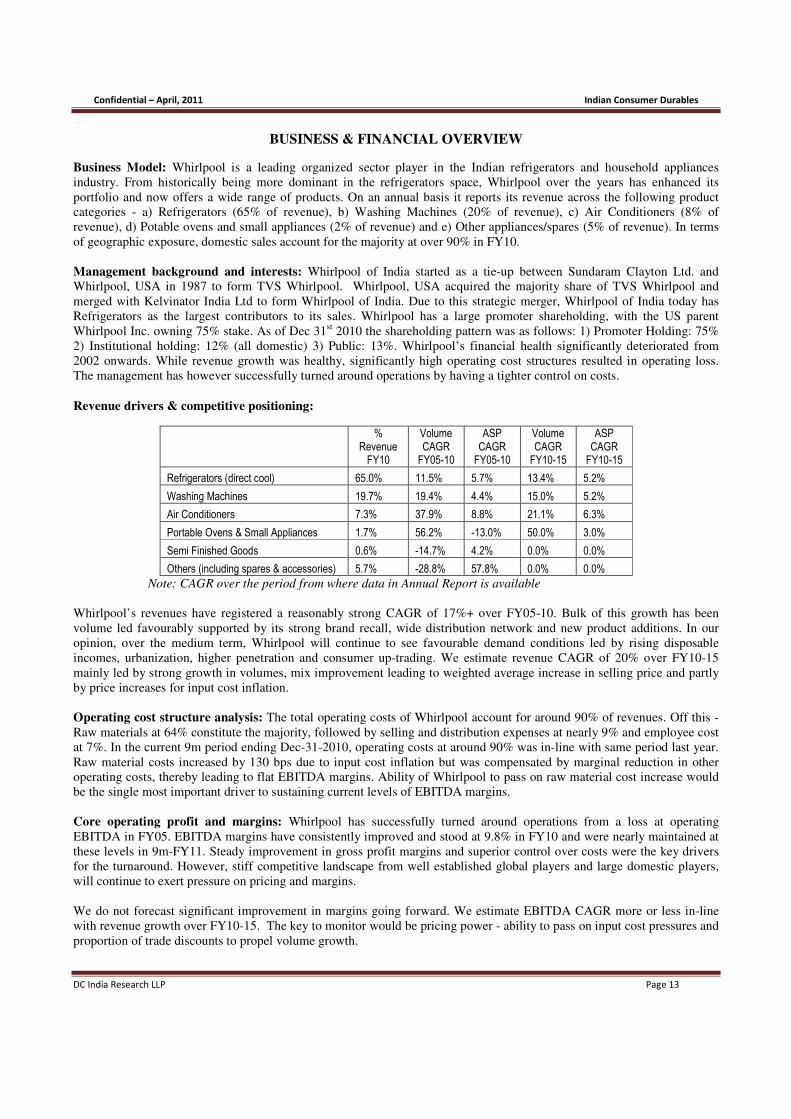
Business Model: Whirlpool is a leading organized sector player in the Indian refrigerators and household appliances
industry. From historically being more dominant in the refrigerators space, Whirlpool over the years has enhanced its
portfolio and now offers a wide range of products. On an annual basis it reports its revenue across the following product
categories - a) Refrigerators (65% of revenue), b) Washing Machines (20% of revenue), c) Air Conditioners (8% of
revenue), d) Potable ovens and small appliances (2% of revenue) and e) Other appliances/spares (5% of revenue). In terms
of geographic exposure, domestic sales account for the majority at over 90% in FY10.
Management background and interests: Whirlpool of India started as a tie-up between Sundaram Clayton Ltd. and
Whirlpool, USA in 1987 to form TVS Whirlpool. Whirlpool, USA acquired the majority share of TVS Whirlpool and
merged with Kelvinator India Ltd to form Whirlpool of India. Due to this strategic merger, Whirlpool of India today has
Refrigerators as the largest contributors to its sales. Whirlpool has a large promoter shareholding, with the US parent
Whirlpool Inc. owning 75% stake. As of Dec 31st 2010 the shareholding pattern was as follows: 1) Promoter Holding: 75%
2) Institutional holding: 12% (all domestic) 3) Public: 13%. Whirlpool’s financial health significantly deteriorated from
2002 onwards. While revenue growth was healthy, significantly high operating cost structures resulted in operating loss.
The management has however successfully turned around operations by having a tighter control on costs.
Revenue drivers & competitive positioning:
% Revenue FY10
Volume CAGR FY05-10
ASP CAGR FY05-10
Volume CAGR FY10-15
ASP CAGR FY10-15
Refrigerators (direct cool) 65.0% 11.5% 5.7% 13.4% 5.2%
Washing Machines 19.7% 19.4% 4.4% 15.0% 5.2%
Air Conditioners 7.3% 37.9% 8.8% 21.1% 6.3%
Portable Ovens & Small Appliances 1.7% 56.2% -13.0% 50.0% 3.0%
Semi Finished Goods 0.6% -14.7% 4.2% 0.0% 0.0%
Others (including spares & accessories) 5.7% -28.8% 57.8% 0.0% 0.0%
Note: CAGR over the period from where data in Annual Report is available
Whirlpool’s revenues have registered a reasonably strong CAGR of 17%+ over FY05-10. Bulk of this growth has been
volume led favourably supported by its strong brand recall, wide distribution network and new product additions. In our
opinion, over the medium term, Whirlpool will continue to see favourable demand conditions led by rising disposable
incomes, urbanization, higher penetration and consumer up-trading. We estimate revenue CAGR of 20% over FY10-15
mainly led by strong growth in volumes, mix improvement leading to weighted average increase in selling price and partly
by price increases for input cost inflation.
Operating cost structure analysis: The total operating costs of Whirlpool account for around 90% of revenues. Off this -
Raw materials at 64% constitute the majority, followed by selling and distribution expenses at nearly 9% and employee cost
at 7%. In the current 9m period ending Dec-31-2010, operating costs at around 90% was in-line with same period last year.
Raw material costs increased by 130 bps due to input cost inflation but was compensated by marginal reduction in other
operating costs, thereby leading to flat EBITDA margins. Ability of Whirlpool to pass on raw material cost increase would
be the single most important driver to sustaining current levels of EBITDA margins.
Core operating profit and margins: Whirlpool has successfully turned around operations from a loss at operating
EBITDA in FY05. EBITDA margins have consistently improved and stood at 9.8% in FY10 and were nearly maintained at
these levels in 9m-FY11. Steady improvement in gross profit margins and superior control over costs were the key drivers
for the turnaround. However, stiff competitive landscape from well established global players and large domestic players,
will continue to exert pressure on pricing and margins.
We do not forecast significant improvement in margins going forward. We estimate EBITDA CAGR more or less in-line
with revenue growth over FY10-15. The key to monitor would be pricing power - ability to pass on input cost pressures and
proportion of trade discounts to propel volume growth.

Confidential – April, 2011 Indian Consumer Durables
DC India Research LLP Page 14
Non-operating items: We do not expect non-operating items to be material in nature. In the past the same has been around
less than1% of revenues comprising of interest income and dividend income.
Capital expenditure and working capital intensity:
Capital Expenditure: Whirlpool’s capex has been nominal averaging Rs. 300 mn p.a. in the past five years; less than 2%
of net sales. Going forward in 2011-12, the management has guided for total investments of Rs. 1000-1250 mn on new
product development, enhancing infrastructure and marketing and to expand its retail space. Whirlpool is planning to
increase its number of exclusive retail outlets to around 150 by the next financial year from 65 currently. The company's
brand shops are mostly in the northern region, now it is planning to expand it to the pan India basis. We estimate internal
accruals to be sufficient to fully fund the above capex.
Working Capital Intensity: The operations are extremely well managed with Whirlpool consistently demonstrating low
working capital intensity; at around 1% of net sales. Going forward we expect the trend to continue.
Depreciation and Interest expense: Depreciation: In the past five years the depreciation rate has averaged 1-2% of revenues. We expect it to remain at these
levels going forward.
Interest Expenses: Interest Expense has been reducing as Whirlpool has been deleveraging its balance sheet which now is
virtually debt free; with there being no debt, besides the preference shares issued to the parent Whirlpool Canada.
Deleveraging through the last couple of years has resulted in steady decline in interest expense.
Taxation: Marginal tax rates have fluctuated over the years but on average are 30% of EBT. We estimate full tax rate in our
forecasts.
Profit after tax and net margins: Strong revenue growth together with significant increase in EBITDA margins and
limited capex resulted in successful turnaround from a loss in FY05 to PAT of Rs. 1450 mn in FY10. Going forward, we
estimate CAGR of 20% in net profits; in line with revenue and EBITDA growth.
Cap-structure analysis: Whirlpool has not had any equity dilution over the last 5 years and is expected to continue. Debt to
equity which was significantly high at 13.7x in FY05 has steadily declined and currently Whirlpool is virtually debt-free.
There has been an issue of Preference Shares with a value of Rs.1532 million in FY’06. As a result the capital structure is
composed of 41% of preference shares, 58.5% common shares and the remaining debt. We feel internal cash generation will
be sufficient to fund capex to sustain strong volume led growth and any increase in working capital requirements. We do not
estimate any dilution or sharp jump in leverage over the medium term.
Capex and asset turns: Whirlpools revenue growth coupled with low cap-ex has almost tripled Asset turnover from 2.23 in
FY’05 to 6.29 in FY’10. In line with the turnaround in operations, ROCE and ROE have also steadily increased and stood at
47% and 16% respectively as on March-31-2010.
Investment portfolio (liquid and group company): There are no material investments in liquid instruments and/or group
companies.
FCFF analysis: Over the past five years, sharp turnaround in operations aided by strong revenue growth coupled with
improving operating profitability; declining interest costs due to deleveraging and limited capex and efficiently managed
working capital cycle have resulted in healthy free cash flow generation. We estimate FCFF to grow at 45% CAGR over
FY-10 to 15.
Off balance sheet exposures: There are no major contingent liabilities as on 31 March 2010.
Subsidiary performance: Whirlpool does not have any subsidiary companies.
Peer group analysis: There are no strict comparables to Whirlpool as its operating metrics is a composite performance
across refrigerators, washing machines, air-conditioners and other home appliances. Thus various operating ratios are
unique to Whirlpool and are not strictly comparable to other players whose composition of business is different from
Whirlpool.

Confidential – April, 2011 Indian Consumer Durables
DC India Research LLP Page 15
Source: Ace Equity
Intrinsic value analysis: We arrive at the intrinsic value of
the stock of Rs. 285/- valuing FY-12 EPS estimate at 20x;
30% premium to current market multiple. At our fair value
estimate, we feel the stock is fairly valued.
Risks to thesis: Whirlpool has increased its R&D expenses
and is focusing on improving its product mix with new and
innovative products. Its air conditioner category is showing
phenomenal growth due to such innovations. With plans to
launch new and innovative products in other categories over
the coming year, Whirlpool could increase its market share
and thereby post higher revenue growth rate than our
estimates. Alongside, the management has also guided of
taking price increases to mitigate input cost pressures. This
could lead to EBITDA margin improvement ahead of our estimates.

Confidential – April, 2011 Indian Consumer Durables
DC India Research LLP Page 16
Hitachi Home & Life Solutions India Limited
Confidential – April, 2011 Indian Consumer Durables
DC India Research LLP Page 17
INVESTMENT SUMMARY
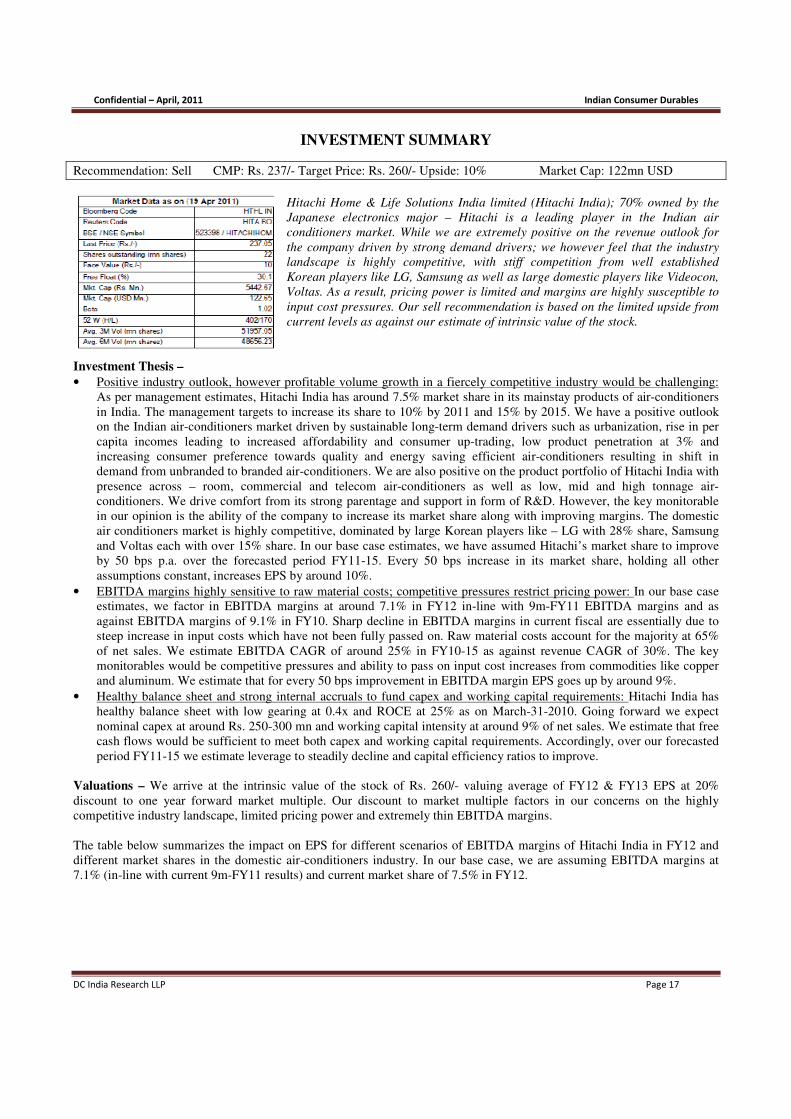
Recommendation: Sell CMP: Rs. 237/- Target Price: Rs. 260/- Upside: 10% Market Cap: 122mn USD
Hitachi Home & Life Solutions India limited (Hitachi India); 70% owned by the
Japanese electronics major – Hitachi is a leading player in the Indian air
conditioners market. While we are extremely positive on the revenue outlook for
the company driven by strong demand drivers; we however feel that the industry
landscape is highly competitive, with stiff competition from well established
Korean players like LG, Samsung as well as large domestic players like Videocon,
Voltas. As a result, pricing power is limited and margins are highly susceptible to
input cost pressures. Our sell recommendation is based on the limited upside from
current levels as against our estimate of intrinsic value of the stock.
Investment Thesis –
• Positive industry outlook, however profitable volume growth in a fiercely competitive industry would be challenging:
As per management estimates, Hitachi India has around 7.5% market share in its mainstay products of air-conditioners
in India. The management targets to increase its share to 10% by 2011 and 15% by 2015. We have a positive outlook
on the Indian air-conditioners market driven by sustainable long-term demand drivers such as urbanization, rise in per
capita incomes leading to increased affordability and consumer up-trading, low product penetration at 3% and
increasing consumer preference towards quality and energy saving efficient air-conditioners resulting in shift in
demand from unbranded to branded air-conditioners. We are also positive on the product portfolio of Hitachi India with
presence across – room, commercial and telecom air-conditioners as well as low, mid and high tonnage air-
conditioners. We drive comfort from its strong parentage and support in form of R&D. However, the key monitorable
in our opinion is the ability of the company to increase its market share along with improving margins. The domestic
air conditioners market is highly competitive, dominated by large Korean players like – LG with 28% share, Samsung
and Voltas each with over 15% share. In our base case estimates, we have assumed Hitachi’s market share to improve
by 50 bps p.a. over the forecasted period FY11-15. Every 50 bps increase in its market share, holding all other
assumptions constant, increases EPS by around 10%.
• EBITDA margins highly sensitive to raw material costs; competitive pressures restrict pricing power: In our base case
estimates, we factor in EBITDA margins at around 7.1% in FY12 in-line with 9m-FY11 EBITDA margins and as
against EBITDA margins of 9.1% in FY10. Sharp decline in EBITDA margins in current fiscal are essentially due to
steep increase in input costs which have not been fully passed on. Raw material costs account for the majority at 65%
of net sales. We estimate EBITDA CAGR of around 25% in FY10-15 as against revenue CAGR of 30%. The key
monitorables would be competitive pressures and ability to pass on input cost increases from commodities like copper
and aluminum. We estimate that for every 50 bps improvement in EBITDA margin EPS goes up by around 9%.
• Healthy balance sheet and strong internal accruals to fund capex and working capital requirements: Hitachi India has
healthy balance sheet with low gearing at 0.4x and ROCE at 25% as on March-31-2010. Going forward we expect
nominal capex at around Rs. 250-300 mn and working capital intensity at around 9% of net sales. We estimate that free
cash flows would be sufficient to meet both capex and working capital requirements. Accordingly, over our forecasted
period FY11-15 we estimate leverage to steadily decline and capital efficiency ratios to improve.
Valuations – We arrive at the intrinsic value of the stock of Rs. 260/- valuing average of FY12 & FY13 EPS at 20%
discount to one year forward market multiple. Our discount to market multiple factors in our concerns on the highly
competitive industry landscape, limited pricing power and extremely thin EBITDA margins.
The table below summarizes the impact on EPS for different scenarios of EBITDA margins of Hitachi India in FY12 and
different market shares in the domestic air-conditioners industry. In our base case, we are assuming EBITDA margins at
7.1% (in-line with current 9m-FY11 results) and current market share of 7.5% in FY12.

Confidential – April, 2011 Indian Consumer Durables
DC India Research LLP Page 18
Hitachi - EBITDA Margins - FY12e
16.46 7.00% 7.13% 8.00% 8.50% 9.00% 9.50% 10.00%
Hitachi - AC mkt sha
re, vol - FY12e
6.50% 11.79 12.29 15.66 17.59 19.53 21.46 23.39
7.00% 13.76 14.30 17.91 19.99 22.06 24.14 26.21
7.21% 14.58 15.14 18.85 20.98 23.12 25.25 27.38
7.54% 15.88 16.46 20.33 22.56 24.79 27.01 29.24
8.00% 17.71 18.32 22.43 24.78 27.14 29.50 31.85
8.50% 19.69 20.33 24.68 27.18 29.68 32.18 34.67
9.00% 21.66 22.35 26.94 29.58 32.22 34.85 37.49
9.50% 23.63 24.36 29.19 31.97 34.75 37.53 40.31
10.00% 25.61 26.37 31.45 34.37 37.29 40.21 43.13
Upside? If Hitachi India improves its market share to 8.5% in FY12 (100 bps higher than our estimates) at same levels of
EBITDA margins, EPS would be higher by 24% to Rs. 20.33/-. Valuing it at 15.5x in-line with current market multiple,
would yield a fair value estimate of Rs. 315, implying 33% upside. If Hitachi India manages to increase its market share to
10% in-line with management guidance, then the fair value estimate valuing it at current market multiple of 15.5x would be
Rs. 408/- an upside of over 70%.
Counter Investment Thesis –
• Significant increase in market share in the air-conditioners market as explained above.
• Successful foray in other home appliances such as refrigerators and washing machines.
• Improvement in EBITDA margins as against our estimates.
Confidential – April, 2011 Indian Consumer Durables
DC India Research LLP Page 19
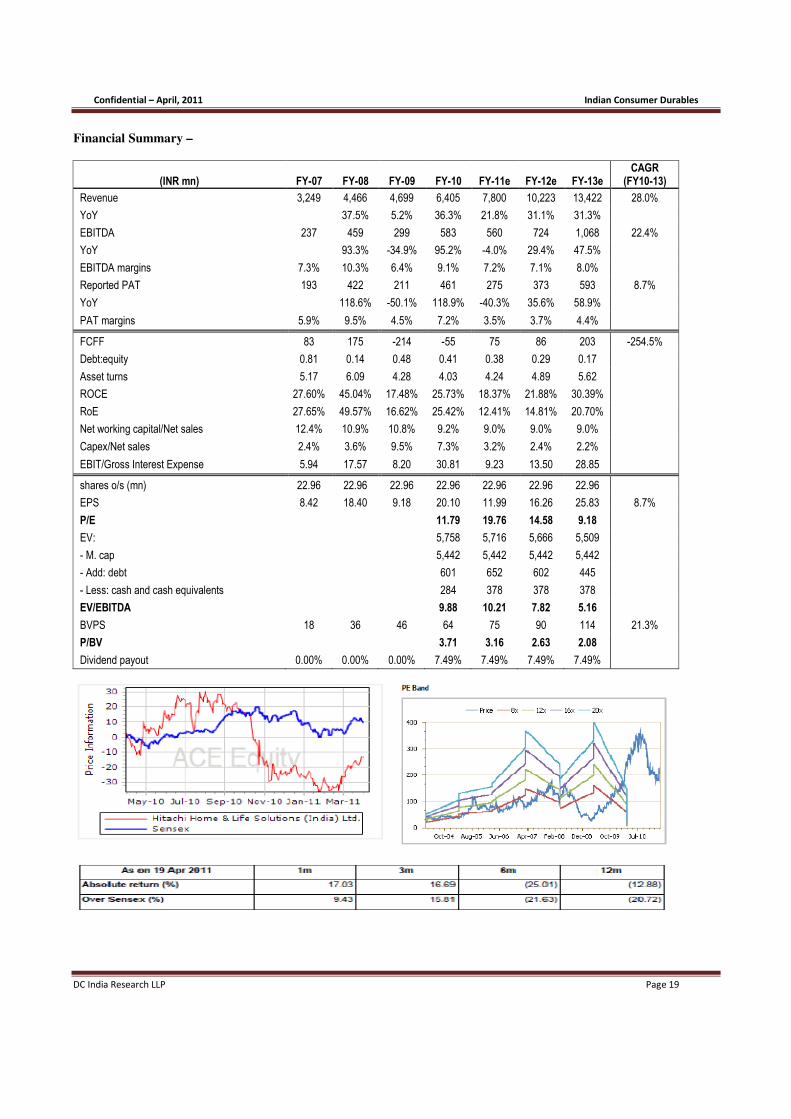
Financial Summary –
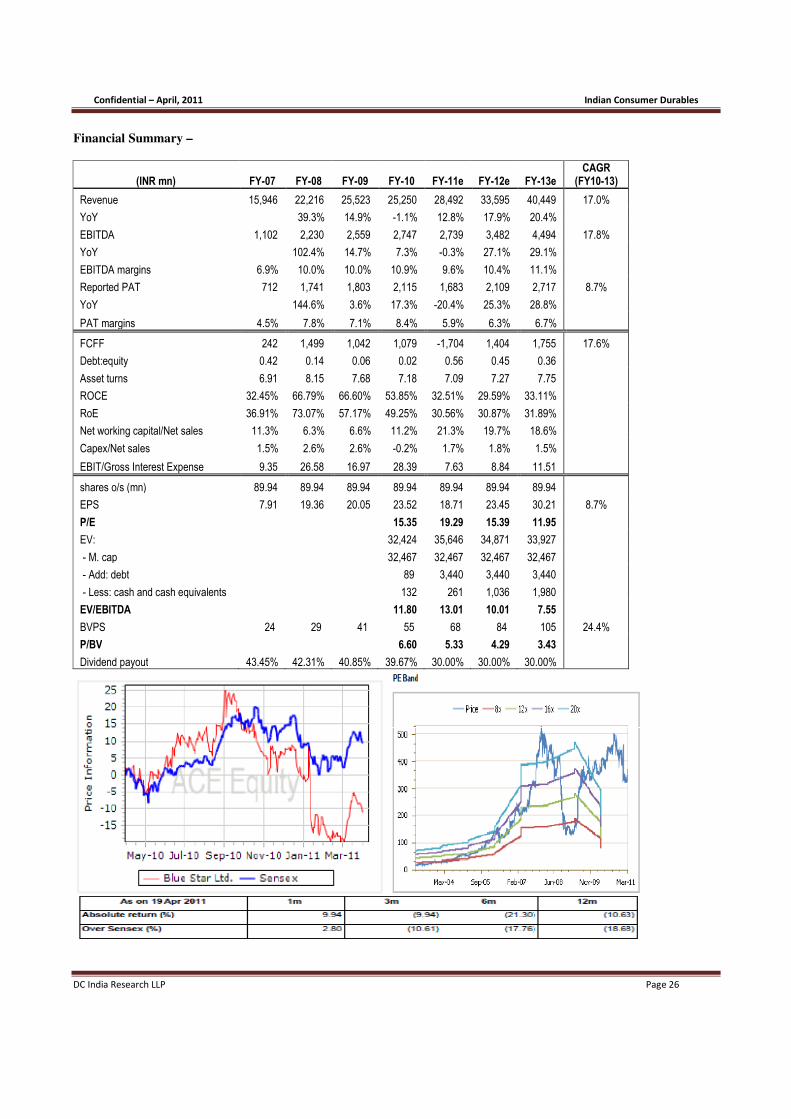
(INR mn) FY-07 FY-08 FY-09 FY-10 FY-11e FY-12e FY-13e CAGR
(FY10-13)
Revenue 3,249 4,466 4,699 6,405 7,800 10,223 13,422 28.0%
YoY
37.5% 5.2% 36.3% 21.8% 31.1% 31.3%
EBITDA 237 459 299 583 560 724 1,068 22.4%
YoY
93.3% -34.9% 95.2% -4.0% 29.4% 47.5%
EBITDA margins 7.3% 10.3% 6.4% 9.1% 7.2% 7.1% 8.0%
Reported PAT 193 422 211 461 275 373 593 8.7%
YoY
118.6% -50.1% 118.9% -40.3% 35.6% 58.9%
PAT margins 5.9% 9.5% 4.5% 7.2% 3.5% 3.7% 4.4%
FCFF 83 175 -214 -55 75 86 203 -254.5%
Debt:equity 0.81 0.14 0.48 0.41 0.38 0.29 0.17
Asset turns 5.17 6.09 4.28 4.03 4.24 4.89 5.62
ROCE 27.60% 45.04% 17.48% 25.73% 18.37% 21.88% 30.39%
RoE 27.65% 49.57% 16.62% 25.42% 12.41% 14.81% 20.70%
Net working capital/Net sales 12.4% 10.9% 10.8% 9.2% 9.0% 9.0% 9.0%
Capex/Net sales 2.4% 3.6% 9.5% 7.3% 3.2% 2.4% 2.2%
EBIT/Gross Interest Expense 5.94 17.57 8.20 30.81 9.23 13.50 28.85
shares o/s (mn) 22.96 22.96 22.96 22.96 22.96 22.96 22.96
EPS 8.42 18.40 9.18 20.10 11.99 16.26 25.83 8.7%
P/E
11.79 19.76 14.58 9.18
EV:
5,758 5,716 5,666 5,509
- M. cap
5,442 5,442 5,442 5,442
- Add: debt
601 652 602 445
- Less: cash and cash equivalents
284 378 378 378
EV/EBITDA
9.88 10.21 7.82 5.16
BVPS 18 36 46 64 75 90 114 21.3%
P/BV
3.71 3.16 2.63 2.08
Dividend payout 0.00% 0.00% 0.00% 7.49% 7.49% 7.49% 7.49%
Confidential – April, 2011 Indian Consumer Durables
DC India Research LLP Page 20
Latest Quarterly Results –
(Figures in Rs. Mn.)
Source: Ace Equity
Confidential – April, 2011 Indian Consumer Durables
DC India Research LLP Page 21
BUSINESS & FINANCIAL OVERVIEW
Business Model: Hitachi India, part of the Japanese major Hitachi, is a large organized company involved in the
manufacture and marketing of a number of home appliances, which include (1) Air Conditioners (2) Refrigerators (3)
Washing Machines (4) Air Cooling Systems (5) Stabilizers (6) Others. Air-conditioners form over 90% of its revenues.
Hitachi India has a large and diversified range of air conditioners across – room, commercial and telecom segments as well
as across tonnage of low, medium and high. Room air conditioner penetration is low at 3% in India, and Hitachi India plans
to exploit the robust demand that will be generated over time, by devising air conditioners to be marketed in tier-ii and tier-
iii cities. Hitachi India commands a premium price on most of their models, which are built for consumers concerned about
looks and energy conservation.
Management Background and interests: Hitachi India was incorporated in India as Hitachi Home and Life Solutions
(India) Limited in 1984. Hitachi India has been associated as a premium air conditioner company, producing air
conditioners of superior quality at premium prices. Promoter shareholding is high at 69.9% with no significant change and
the promoter pledge at nil. Strong management has led to recent increase in profitability and cost containment, thereby
turning around the company. The shareholding pattern as of Dec 31st 2010 is as follows (1) Promoter Group: 69.9% (2)
Domestic Corporate 5.39% (3) Indian Public 21.82%. FY10 has been the first year of dividend pay-out at 7.5% of reported
profits. No dividend was paid in prior years due to losses until FY04 and thereafter extremely low single-digit operating
margins.
Revenue Drivers and competitive position:
% revenue FY10
Volume CAGR FY05-10
ASP CAGR FY05-10
Volume CAGR FY10-15
ASP CAGR FY10-15
Air Conditioners 87.47% 23% 7.02% 28% 3%
Refrigerators 5.77% Nm Nm Nm Nm
Washing Machines 0.02% -84% Nm Nm Nm
Air Cooling Systems 0.64% 40% Nm Nm Nm
Stabilizers 0.25% Nm Nm Nm Nm
Others 4.51% Nm Nm Nm Nm
Source: Company Annual Reports
Hitachi has shown strong revenue growth over FY05-10 with a CAGR of 22%. Hitachi derives most of its revenues, close
to 90%, from room air conditioners. The portfolio of extensive air conditioners comprises of both split and window variants.
Most of the air conditioner revenues can be attributed to the split variant. Hitachi boasts of silent and environmentally
superior split air conditioners, which we believe will be a key revenue driver. We expect Hitachi’s air conditioners to
capture more share and increase volume growth simultaneously, thereby increasing the top line.
The Indian air-conditioners market is estimated at around Rs. 60,000mn growing at over 20% p.a. Rising per capita incomes
along with increase in temperature levels across the country and increasing affordability are expected to drive up demand
for air-conditioners in India. India’s room air-conditioners market is expected to touch 3.6 mn units in 2011 from 3 mn units
in 2010, is dominated by split air-conditioners that account for two-thirds of the market.
In terms of the industry evolution, the Korean majors – LG and Samsung priced their products aggressively in the 1990s and
outsmart their Japanese counterparts. However, presently the Japanese players such as Hitachi and Daikin have bridged the
price gap, through domestic manufacturing and efficient sourcing of inputs and logistics. Currently the price gap between
Korean and Japanese make air-conditioners is down to 7-10% from as high as 30% in earlier years.
Hitachi also deals in trading of refrigerators and washing machines, which contribute a small amount to the total top line
(6%). In our opinion, Hitachi has a strong competitive advantage by catering to an increasing number of premium customers
who are concerned with product features, appearance and environmental superiority. This advantage is expected to show in
future revenue growth; which will be attributed to both an increase in share and volume. Revenue growth is estimated to
grow at a CAGR of 30% over FY10-15, provided underlying demand due to increasing per capita income remains intact.
Confidential – April, 2011 Indian Consumer Durables
DC India Research LLP Page 22
Opex and EBITDA margins Analysis: Over the last five years, Hitachi India has steadily improved its operating cost
structure with operating costs declining from 97% of net sales in FY05 to 91% in FY10 achieved by tighter control over all
manufacturing, selling and general expenses. Gross profit margins (defined as net sales less raw material costs) have been in
the range of 34-36% over the same period.
In our base case estimates, we factor in EBITDA margins at around 7.1% in FY12 in-line with 9m-FY11 EBITDA margins
and as against EBITDA margins of 9.1% in FY10. Sharp decline in EBITDA margins in current fiscal are essentially due to
steep increase in input costs which have not been fully passed on. Raw material costs account for the majority at 65% of net
sales. We estimate EBITDA CAGR of around 25% in FY10-15 as against revenue CAGR of 30%. The key monitorables
would be competitive pressures and ability to pass on input cost increases from commodities like copper and aluminum. We
estimate that for every 50 bps improvement in EBITDA margin EPS goes up by 9%.
Non-operating items: We do not expect non-operating items to be material in nature. Historically the same has been
around less than 1.5% of revenues comprising of interest income and dividend income, with occasional foreign exchange
gains.
Capex and working capital: Hitachi India has healthy balance sheet with low gearing at 0.4x and ROCE at 25% as on
March-31-2010. Going forward we expect nominal capex at around Rs. 250-300 mn and working capital intensity at around
9% of net sales. We estimate that free cash flows would be sufficient to meet both capex and working capital requirements.
Accordingly, over our forecasted period FY11-15 we estimate leverage to steadily decline and capital efficiency ratios to
improve.
Depreciation: Hitachi’s depreciation expense has averaged at around 2% of sales. Going forward with no significant
increase in capex we expect depreciation to be at similar levels.
Interest Expense: With turnaround in financial performance post FY05, gearing has steadily declined and with it the
interest expense. As explained earlier, we estimate free cash flows to be sufficient to fund capex and working capital
requirements. We do not estimate any meaningful increase in interest expense over our forecasted period FY11-15.
Taxation: Tax as % of PBT has increased to 30% in 9m-FY11 as against 15% in same period last year. Going forward we
estimate a 100 bps increase in tax rates p.a.
Profit after tax and net margins: Profits after tax registered a CAGR of over 50% over FY05-10. Going forward we
expect the same to grow at a CAGR of 18% over FY10-15. This is lower than the revenue CAGr of 30% and EBITDA
CAGR of 25% mainly due to our assumption of steady increase in tax rates over the forecasted period.
Capital efficiency ratios and Asset Turns: Hitachi’s strong revenue CAGR of 22% and minimal capital expenditure has
resulted in high return ratios and asset sweating. ROCE and ROE stood at 26% and 25% respectively at the end of FY10.
Going forward the key monitorable would be any improvement in EBITDA margins, which would result in sharp
improvement in ROCE and ROE.
Investment Portfolio: Hitachi has not had any investments over the last five years and we expect this to continue over the
forecast horizon.
Off Balance Sheet Exposures: Hitachi does not have any meaningful off balance sheet liabilities.
Subsidiary Performance: Hitachi does not have any subsidiary companies.
Peer Group Analysis: Hitachi has a number of organized competitors in the air conditioner sector. Most of these
competitors are global players with large market shares and diversified product portfolios of all home appliances. Most of
these companies are not listed in India. In terms of the key domestic players like Voltas, Blue Star and Videocon, they too
are present across many home appliances, thereby rendering like-to-like comparison difficult.

Confidential – April, 2011 Indian Consumer Durables
DC India Research LLP Page 23
Source: Ace Equity
Valuations – We arrive at the intrinsic value of the stock
of Rs. 260/- valuing average of FY12 & FY13 EPS at
20% discount to one year forward market multiple. Our
discount to market multiple factors in our concerns on the
highly competitive industry landscape, limited pricing
power and extremely thin EBITDA margins.
The table below summarizes the impact on EPS for
different scenarios of EBITDA margins of Hitachi India
in FY12 and different market shares in the domestic air-conditioners industry. In our base case, we are assuming EBITDA
margins at 7.1% (in-line with current 9m-FY11 results) and current market share of 7.5% in FY12.
Hitachi - EBITDA Margins - FY12e
16.46 7.00% 7.13% 8.00% 8.50% 9.00% 9.50% 10.00%
Hitachi - AC mkt share, vol - FY12e
6.50% 11.79 12.29 15.66 17.59 19.53 21.46 23.39
7.00% 13.76 14.30 17.91 19.99 22.06 24.14 26.21
7.21% 14.58 15.14 18.85 20.98 23.12 25.25 27.38
7.54% 15.88 16.46 20.33 22.56 24.79 27.01 29.24
8.00% 17.71 18.32 22.43 24.78 27.14 29.50 31.85
8.50% 19.69 20.33 24.68 27.18 29.68 32.18 34.67
9.00% 21.66 22.35 26.94 29.58 32.22 34.85 37.49
9.50% 23.63 24.36 29.19 31.97 34.75 37.53 40.31
10.00% 25.61 26.37 31.45 34.37 37.29 40.21 43.13
Upside? If Hitachi India improves its market share to 8.5% in FY12 (100 bps higher than our estimates) at same levels of
EBITDA margins, EPS would be higher by 24% to Rs. 20.33/-. Valuing it at 15.5x in-line with current market multiple,
would yield a fair value estimate of Rs. 315, implying 33% upside. If Hitachi India manages to increase its market share to
10% in-line with management guidance, then the fair value estimate valuing it at current market multiple of 15.5x would be
Rs. 408/- an upside of over 70%.
Counter Investment Thesis –
• Significant increase in market share in the air-conditioners market as explained above.
• Successful foray in other home appliances such as refrigerators and washing machines.
• Improvement in EBITDA margins as against our estimates.

Confidential – April, 2011 Indian Consumer Durables
DC India Research LLP Page 24
Blue Star Limited

Confidential – April, 2011 Indian Consumer Durables
DC India Research LLP Page 25
INVESTMENT SUMMARY
Recommendation: Buy CMP: Rs. 331/-Target Price: Rs. 390/- Upside: 18% Market Cap: 600mn USD
Recent stock correction on the back of weak Dec quarter results, led by
sluggishness in revenue booking and margin compression offers an
attractive entry point. In our opinion, Blue Star is a play on the Indian IIP
story. We expect end-user demand conditions to improve sequentially
along with EBITDA margins seeing an uptick with management emphasis
towards profitable growth. The twin factors could result in upward
revision in earnings and multiple re-rating. Our intrinsic value estimate of
Rs. 390/- discounts FY-12 EPS estimates at 16x; an upside of 18%.
Investment Thesis –
• Revenue drivers and outlook: Blue Star is a play on the Indian IIP story. Revival in demand from sectors like -
healthcare, telecom, IT/ITES, organized retail; metro rail projects, airports would offer strong business momentum and
revenue growth outlook going forward. Blue Star with its strong positioning across projects business led by EMP
(electro-mechanical-plumbing), cooling products (centralized air-conditioning and refrigeration) and electronics and
industrial systems; is likely to benefit from the demand revival. Over FY05-10 revenues have posted a healthy CAGR
of 22% primarily organic led; with practically minimal exports. We estimate revenue CAGR of 18% over FY10-15
with an upward bias. Current o/s order book as at Dec-31-2010 of Rs. 20700 mn (YoY growth of 10%) is 0.82x FY-10
revenues.
• Core operating profitability: 9m-FY11 core EBITDA has witnessed steep margin erosion of over 450 bps. This is
mainly due to sharp rise in input costs without commensurate price increases and some amount of slowdown in billing
in q-3 FY-11 resulting in lower operating leverage. Going forward we expect some uptick in profitability aided by
rebound in revenue growth which will lead to operating leverage benefit and more importantly improvement in gross
profit margins (already reflected in q-3 FY-11 results) due to recent price hikes taken by the company and
managements focus on profitable growth not at risk of margins. We have factored some improvement in EBITDA
margins from the current lows of 9%. We estimate them to be in the range of 10-11.5% over FY10-15. Until FY-08, the
company reported single digit EBITDA margins. However, with shift of business towards EMP, EBITDA margins
improved and have hovered around 10-11%.
• Capital requirements and funding: Over the last several years, Blue Star has been virtually debt-free. As on March-31-
2010, debt-equity was 0.02x. As at Sep-30-2010; leverage has increased to 0.61x; led by an increase in working capital
requirements due to extended collection cycle (Rs. 1200 mn approx.) and funds raised to acquire D.S. Gupta
Construction Pvt. Ltd in q-1 FY-11 (Rs. 1000 mn approx.). Going forward, we expect the business model to remain
more working capital intensive, driven by EMP even after we factor in the capex requirement to set up the new air-
conditioning unit to meet the retail demand. Debt-equity is estimated to decline to 0.25x by FY-15, resulting in healthy
free cash flow generation.
• Net Earnings growth: Over FY10-15 we forecast EPS growth of 14%; lower than the EBITDA growth of 19% due to
steady increase in tax rate.
• Management track record: Incorporated in 1943, promoters of Blue Star; the Advani family own approx. 40% with no
major change in their shareholding. Promoter pledge is low at 1.6%. The operations are well-managed with no
significant dilutions in the past, low gearing and healthy free cash flow generation; resulting in high dividend payout
averaging 45% over FY-05 to 10.
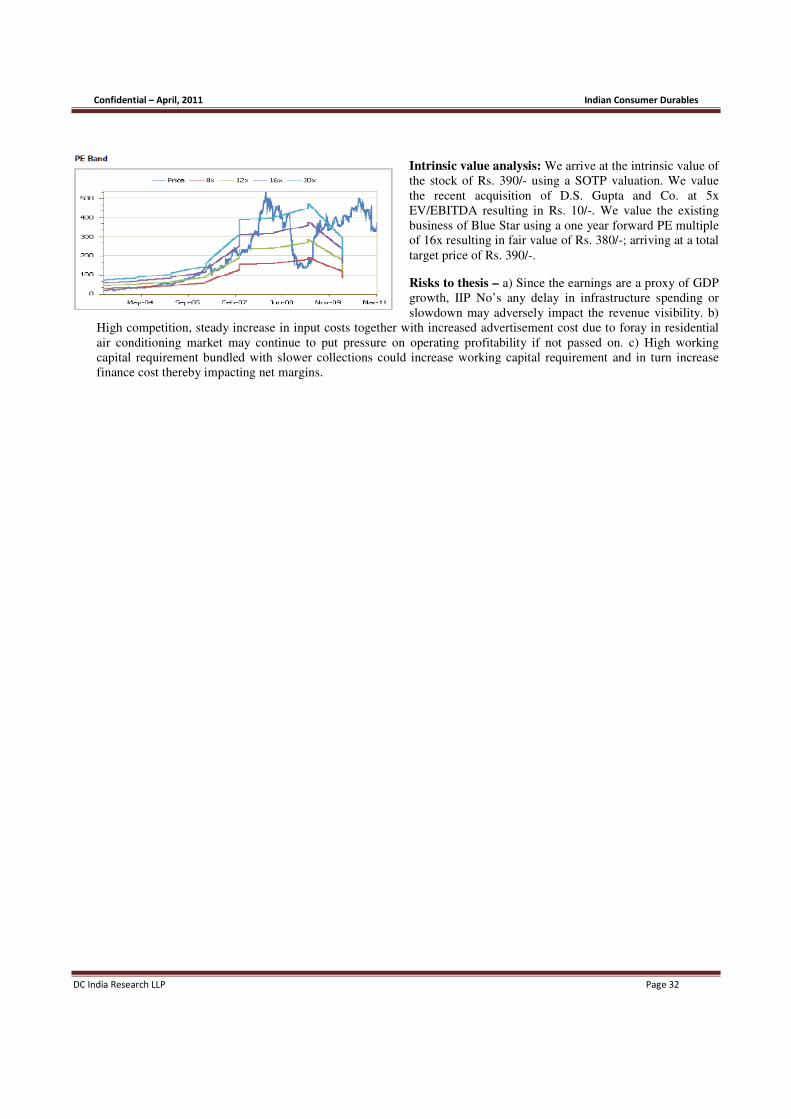
Valuations – We arrive at the intrinsic value of the stock of Rs. 390/- using a SOTP valuation. We value the recent
acquisition of D.S. Gupta and Co. at 5x EV/EBITDA resulting in Rs. 10/-. We value the existing business of Blue Star using
a one year forward PE multiple of 16x resulting in fair value of Rs. 380/-; arriving at a total target price of Rs. 390/-
Counter Investment Thesis – a) Since the earnings are a proxy of GDP growth, IIP No’s any delay in infrastructure
spending or slowdown may adversely impact the revenue visibility. b) High competition, steady increase in input costs
together with increased advertisement cost due to foray in residential air conditioning market may continue to put pressure
on operating profitability if not passed on. c) High working capital requirement bundled with slower collections could
increase working capital requirement and in turn increase finance cost thereby impacting net margins.
Confidential – April, 2011 Indian Consumer Durables
DC India Research LLP Page 26
Financial Summary –
(INR mn) FY-07 FY-08 FY-09 FY-10 FY-11e FY-12e FY-13e CAGR
(FY10-13)
Revenue 15,946 22,216 25,523 25,250 28,492 33,595 40,449 17.0%
YoY
39.3% 14.9% -1.1% 12.8% 17.9% 20.4%
EBITDA 1,102 2,230 2,559 2,747 2,739 3,482 4,494 17.8%
YoY
102.4% 14.7% 7.3% -0.3% 27.1% 29.1%
EBITDA margins 6.9% 10.0% 10.0% 10.9% 9.6% 10.4% 11.1%
Reported PAT 712 1,741 1,803 2,115 1,683 2,109 2,717 8.7%
YoY
144.6% 3.6% 17.3% -20.4% 25.3% 28.8%
PAT margins 4.5% 7.8% 7.1% 8.4% 5.9% 6.3% 6.7%
FCFF 242 1,499 1,042 1,079 -1,704 1,404 1,755 17.6%
Debt:equity 0.42 0.14 0.06 0.02 0.56 0.45 0.36
Asset turns 6.91 8.15 7.68 7.18 7.09 7.27 7.75
ROCE 32.45% 66.79% 66.60% 53.85% 32.51% 29.59% 33.11%
RoE 36.91% 73.07% 57.17% 49.25% 30.56% 30.87% 31.89%
Net working capital/Net sales 11.3% 6.3% 6.6% 11.2% 21.3% 19.7% 18.6%
Capex/Net sales 1.5% 2.6% 2.6% -0.2% 1.7% 1.8% 1.5%
EBIT/Gross Interest Expense 9.35 26.58 16.97 28.39 7.63 8.84 11.51
shares o/s (mn) 89.94 89.94 89.94 89.94 89.94 89.94 89.94
EPS 7.91 19.36 20.05 23.52 18.71 23.45 30.21 8.7%
P/E
15.35 19.29 15.39 11.95
EV:
32,424 35,646 34,871 33,927
- M. cap
32,467 32,467 32,467 32,467
- Add: debt
89 3,440 3,440 3,440
- Less: cash and cash equivalents
132 261 1,036 1,980
EV/EBITDA
11.80 13.01 10.01 7.55
BVPS 24 29 41 55 68 84 105 24.4%
P/BV
6.60 5.33 4.29 3.43
Dividend payout 43.45% 42.31% 40.85% 39.67% 30.00% 30.00% 30.00%
Confidential – April, 2011 Indian Consumer Durables
DC India Research LLP Page 27
Latest Quarterly Results –
(Figures in Rs. Mn.)
Source: Ace Equity
Confidential – April, 2011 Indian Consumer Durables
DC India Research LLP Page 28
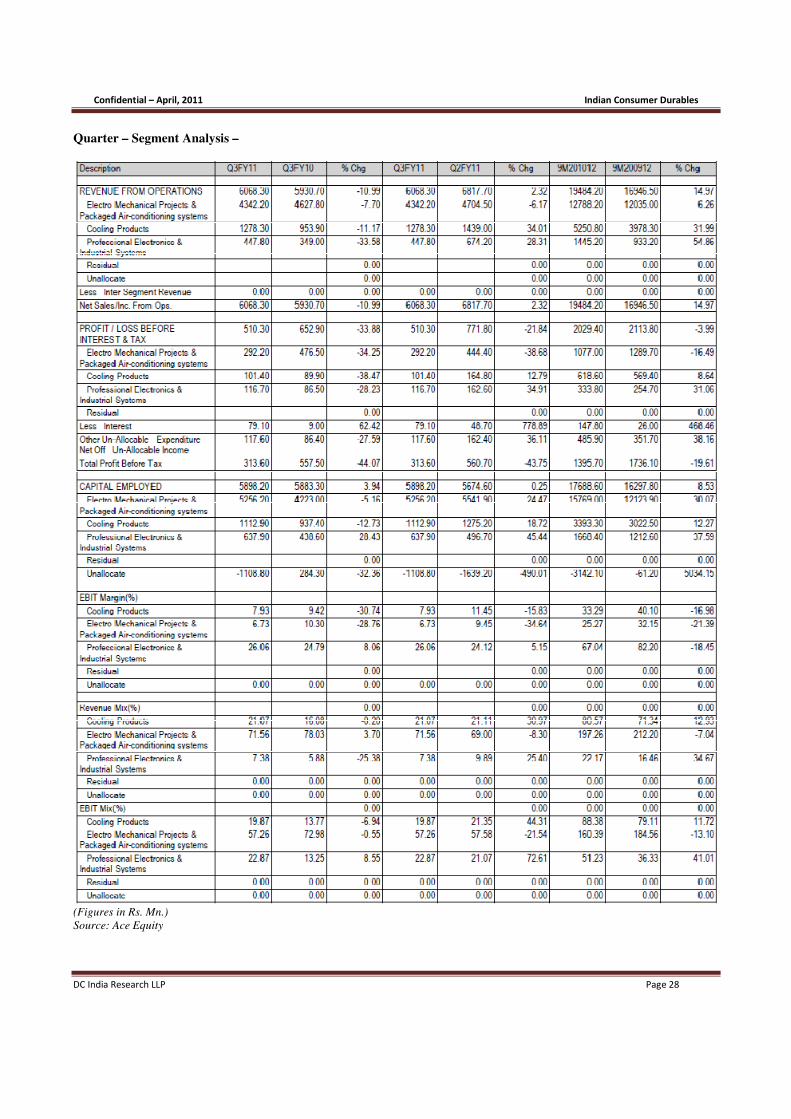
Quarter – Segment Analysis –
(Figures in Rs. Mn.)
Source: Ace Equity

Confidential – April, 2011 Indian Consumer Durables
DC India Research LLP Page 29
BUSINESS & FINANCIAL OVERVIEW
Business Model: Blue Star predominantly operates in the air cooling solutions industry. On a quarterly basis it reports its
numbers in three different segments - a) Electromechanical projects (EMP) and packaged air conditioning systems (71% of
revenue and 55% of EBIT), b) Cooling products (23% of revenue and 30% of EBIT), c) Professional electronics and
industrial systems (6% of revenue and 16% of EBIT). In terms of geographic exposure, 95% of its revenues are domestic,
while 5% are from exports.
Management background and interests: Blue Star was formed in the year 1943 by Mr. Mohan T Advani and is now run
by his sons – Mr. Ashok M Advani - Executive Chairman and Mr. Suneel M Advani - Vice Chairman and Managing
Director. The share holding pattern for Blue Star as on 31 December 2010 is as follows: a) promoter holding - 40.12% (no
material change in past five years), b) institutional holding - 19.2% (foreign - 8.23%, domestic – 10.97%) , c) non-
institutional - 40.68%. The major domestic institutional share holders are HDFC Mutual Fund – 4.99%, SBI Mutual Fund –
2.17%, and ICICI Prudential – 1.17%. The management has been consistent in payment of dividend with a payout ratio of
around 45% in the past five years.
Revenue drivers & competitive positioning:
Segment Product Industry Size Target Audience Outlook
Electro Mechanical
Projects (EMP) and
Packaged Air Conditioning
Systems
Bundled commercial
electrical, plumbing, and
fire fighting projects
solutions. Central and
packaged air conditioners
Commercial air
conditioning market at Rs
52,500 Mn
Commercial builders,
IT/ITES, schools,
hospitals, hotels and
infrastructure
segments such as
airports, metro rail,
power and steel
industry
Aggressively targeting
opportunities in metro rail
(est. at Rs 12,000 –
13,000 Mn), steel and
power industry. Expects
demand revival from
IT/ITES and continued
growth from hotels,
schools, hospitals
Cooling Products Room air conditioners,
commercial refrigeration
and cold storage solutions
Residential air
conditioning market at Rs
87,000 Mn
Corporate and retail
customers, ice cream
manufacturers, small
retailers, State Agro
Boards, cold storage
operators
Targets 9% market share
and expects 30-40%
market growth for next
three years
Professional Electronics
and Industrial Systems
Exclusive distributor in
India of global hi-tech
professional equipment
manufacturers
Fragmented (no est.
available)
Steel, automobile,
pipes and allied
industries
Witnessing increased
demand as Blue Star has
migrated from being a
reseller to being a system
integrator too
Note - Current o/s order book as at Dec-31-2010 of Rs. 20700 mn (YoY growth of 10%) is 0.82x FY-10 revenues.
Operating cost structure analysis: The total operating costs of Blue Star account for nearly 90% of revenues. Off this
- Raw materials at 75% constitute the majority, followed by employee cost at 7%, general & administrative expenses at
4% and selling & distribution expenses at 3%. In the current 9m period ending Dec-31-2010, raw material costs
increased by over 200 bps due to input cost inflation, rupee depreciation and increase in competitive intensity which
kept pricing under pressure. Ability of Blue Star to pass on raw material cost increase would be the single most
important driver to improvement in EBITDA margins.
Core operating profit and margins: 9m-FY11 core EBITDA has witnessed steep margin erosion of over 450 bps.
This is mainly due to sharp rise in input costs without commensurate price increases and some amount of slowdown in
billing in q-3 FY-11 resulting in lower operating leverage. Going forward we expect some uptick in profitability aided
by rebound in revenue growth which will lead to operating leverage benefit and more importantly improvement in
gross profit margins (already reflected in q-3 FY-11 results) due to recent price hikes taken by the company and
managements focus on profitable growth not at risk of margins.

Confidential – April, 2011 Indian Consumer Durables
DC India Research LLP Page 30
We have factored some improvement in EBITDA margins from the current lows of 9%. We estimate them to be in the
range of 10-11.5% over FY10-15. Until FY-08, the company reported single digit EBITDA margins. However, with
shift of business towards EMP, EBITDA margins improved and have hovered around 10-11%.
Non-operating items: We do not expect non-operating items to be material in nature. In the past the same has been
around 1% of revenues comprising of interest income, dividend income, write backs.
Capital expenditure and working capital intensity: Capital Expenditure: In the past five years capex has been in the range of 1.5-3% of the revenue. Going ahead
management has guided towards a capex of Rs 500 – 600 Mn in FY-12 to support the foray in the retail air conditioning
segment. Going forward we estimate capex in the range of 2% of revenues.
Working Capital Intensity: In the past five years working capital requirement has been at 12% of revenues, with
exceptional years FY08 and FY09 where it reduced to around 7%. As at Sep-30-2010, the working capital intensity
inched higher to 20% of revenues, due to slower collections and also due to larger WIP on account of slower moving
jobs in infrastructure, hospitals, hotels, which by nature are longer lead times. In the coming years, due to managements
increased focus on exposure in EMP segment, we believe that working capital requirement should be around 19% of
revenues.
Depreciation and Interest expense:
Depreciation: In the past five years the depreciation rate has been in the range of 1-1.3% of revenues. We do not
anticipate sharp jump in depreciation charge.
Interest Expenses: From FY06-10 the interest costs had been in the range of around 0.5% of the revenue. However,
for the nine months ended December 2010 the interest cost increased significantly to 0.76% of the revenue as the
company had borrow funds for working capital requirements and to fund the acquisition of D S Gupta Construction
Ltd. Going forward, we estimate Blue Star to generate healthy free cash flows which would result in lowering the
gearing from current levels. Accordingly, we do not expect interest costs to go up significantly.
Taxation: We anticipate the tax rate to rise to full tax rate over the next three years from the level of 24% in FY09/10
mainly because the plant in Himachal comes out of exemption.
Profit after tax and net margins: The PAT margin for FY10 stood at 8.4% however, for the nine months ended
December 2010 the net margins declined to 5% (400 bps decline) mainly due to steep decline in EBITDA margins,
higher interest expense and increase in tax rate. Going ahead management feels that margins will improve due the
effect of price hikes, better billing and cost control initiatives improvement in PAT margins over the next 3 years.
Cap-structure analysis: There was no equity dilution for Blue Star in the past five years and it has been virtually debt
free with a low debt-equity ratio for FY10 at 0.02x. As at Sep-30-2010; leverage has increased to 0.61x; led by an
increase in working capital requirements due to extended collection cycle (Rs. 1200 mn approx.) and funds raised to
acquire D.S. Gupta Construction Pvt. Ltd in q-1 FY-11 (Rs. 1000 mn approx.). Going forward, we expect the business
model to remain more working capital intensive, driven by EMP even after we factor in the capex requirement to set up
the new air-conditioning unit. Debt-equity is estimated to decline to 0.25x by FY-15, resulting in healthy free cash flow
generation.
Capex and asset turns: Blue Stars’ 22%+ CAGR in revenues in the past five years and low capex outlay is visible in
the asset turnover ratio, with asset sweating increasing from 5.5x in FY-05 to 7x in FY-10. This efficient deployment of
capital has led to a healthy ROCE - 54% and ROE – 50% in FY10. Though we anticipate the EBITDA margins to
improve over FY11-13, ROCE is likely to reduce to around 35% due to higher working capital intensity and increase in
tax rates built in our model.
Investment portfolio (liquid and group company): As on 31 March 2010 Blue Star had an investment of Rs. 42.03
Mn in its associates. Out of Rs 42.033 mn the company has made investment of Rs 29.82 mn for 31% stake in Blue Star
Infotech Ltd. The market value of this investment as on 3 February 2011 is Rs 360 mn. The company in the current
year received a dividend of Rs 5 per share on the said investment. There are no other investments.

Confidential – April, 2011 Indian Consumer Durables
DC India Research LLP Page 31
Loans and advances portfolio and yield: This represents deposits with government authorities, loans to subsidiaries
and advances given for value to be received. In FY10 the company earned an interest income of Rs. 35.68 mn on loans
and advances of Rs. 1,324.42 mn, a yield of 2.7%. In our opinion we do not feel this amount to be significant in future.
FCFF analysis: Over the past five years, strong revenue growth coupled with improving operating profitability; low
interest costs due to debt free balance sheet with limited capex and efficiently managed working capital cycle; low tax
rates due to exemptions at manufacturing locations have resulted in healthy free cash flow generation; resulting in high
dividend payout. Going forward, the key monitorable to FCFF would be the working capital requirement. We estimate
FCFF to grow at 22% CAGR over FY-10 to 15.
Off balance sheet exposures: There are no major contingent liabilities on Blue Star as on 31 March 2010.
Subsidiary performance: Blue Star in Q1 FY11 acquired D S Gupta Construction Pvt. Ltd for Rs. 976 mn through its
100% subsidiary Blue Star Electro Mechanical Ltd. and will consolidate results from FY11 year end. For FY-10, D S
Gupta Constructions had a turnover of Rs. 1,300 mn and an outstanding order book of Rs. 3000 mn. The management
expects its revenue to be around Rs. 1500-1600 mn for FY11 with EBITDA margins at 11% and 20-25% revenue
growth going forward. Going ahead we believe that management will look at acquiring smaller businesses to expand its
market positioning in the EMP Segment.
Peer group analysis: The closest competitor of Blue Star is Voltas. Voltas for FY10 had revenues of Rs. 48,059 mn
(Electro Mechanical Projects – 65%, Engineering Products – 10%, Unitary cooling products – 25%). Voltas has
considerable presence in Middle East with almost 40% of the revenue coming from this region; international operations
account for 60% of total sales. In FY-10 Voltas reported an EBITDA margin of 9.6% and PAT margins of 8%. In the
past five years Voltas has grown in revenues at rate of 21% CAGR and had an order book of Rs. 46,780 mn as on 31
March 2010. For the nine months ended December 2010 Voltas had an order book of Rs. 46,970 mn (overseas Rs
31,000 mn) for the EMP segment. The sales for nine months ended December 2010 stood at Rs. 35,060 mn up 6%
compared to the same period last year with EBITDA margins at 8.97%.
Source: Ace Equity
Confidential – April, 2011 Indian Consumer Durables
DC India Research LLP Page 32
Intrinsic value analysis: We arrive at the intrinsic value of
the stock of Rs. 390/- using a SOTP valuation. We value
the recent acquisition of D.S. Gupta and Co. at 5x
EV/EBITDA resulting in Rs. 10/-. We value the existing
business of Blue Star using a one year forward PE multiple
of 16x resulting in fair value of Rs. 380/-; arriving at a total
target price of Rs. 390/-.
Risks to thesis – a) Since the earnings are a proxy of GDP
growth, IIP No’s any delay in infrastructure spending or
slowdown may adversely impact the revenue visibility. b)
High competition, steady increase in input costs together with increased advertisement cost due to foray in residential
air conditioning market may continue to put pressure on operating profitability if not passed on. c) High working
capital requirement bundled with slower collections could increase working capital requirement and in turn increase
finance cost thereby impacting net margins.
Confidential – April, 2011 Indian Consumer Durables
DC India Research LLP Page 33
DISCLAIMER:
This document is prepared by the research team of DC INDIA RESEARCH LLP circulated for purely information purpose to the
authorized recipient and should not be replicated or quoted or circulated to any person in any form.
This document should not be interpreted as an Investment / taxation/ legal advice. While the information contained in the report
has been procured in good faith, from sources considered to be reliable, no statement in the report should be considered to be
complete or accurate. Therefore, it should only be relied upon at one’s own risk.
DC INDIA RESEARCH LLP is not soliciting any action based on the report. No indication is intended from the report that the
transaction undertaken based on the information contained in this report will be profitable or that they will not result in losses.
Investors must make their own investment decisions based on their specific investment objectives and financial position and
using such independent advisors, as they believe necessary.
Opinions expressed are our current opinions as of the date appearing on this material only. While we endeavor to update on a
reasonable basis the information discussed in this material, there may be regulatory, compliance or other reasons that may
prevent us from doing so. Prospective investors and others are cautioned that any forward-looking statements are not predictions
and may be subject to change without notice.
We and our officers and employees, including persons involved in the preparation or issuance of this material may: (a) from time
to time, have long or short positions in, and buy or sell the securities thereof, of company (ies) mentioned herein or (b) be
engaged in any other transaction involving such securities and earn brokerage or other compensation or have other potential
conflict of interest with respect to any recommendation and related information and opinions. The same persons may have acted
upon the information contained here.
Neither the Firm, nor its directors, employees, agents, representatives shall be liable for any damages whether direct or indirect,
incidental, special or consequential including lost revenue or lost profits that may arise from or in connection with the use of the
information.