indian economy: a snapshotdnb.co.in/fesconftool/uploads\downloads\90\indian e… · ·...
TRANSCRIPT

Indian Economy: A Snapshot
“For its first 45 years, Indians had abundant political freedom, but limited economic freedom. (Wealthy Indians could have any car they wanted, so long as it was a white Ambassador).” –International Herald Tribune.
India always held great promise. Soon after independence, in 1947, its foreign reserves were among the worlds largest, at US $2.1 billion in 1950. It accounted for 2.4 percent of global trade. It was one of the prosperous countries in terms of growth in GDP and overall economic activity; certainly ahead of China. However, fallout of certain policy measures such as over-emphasis on agriculture, excessive government intervention and two oil-shocks moderated the pace of economic growth. Rupee started depreciating, fiscal deficit widened, expanding trade deficit depleted the foreign reserves and gradually country was left to pledge its gold with the foreign central bank to mobilise the resources. The rescue operation by IMF urged the government to liberalise the economy. Slowly and steadily economy was put on the path of liberalisation (Exhibit 1).
Exhibit 1. Moving towards new growth trajectory
9.0
5.84.7
3.7
5.6
4.1
0
2
4
6
8
10
1960s 1970s 1980s 1990s FY00-04 FY05-07
Real GDP, period avg. growth (percent) Source: GOI Traditionally agriculture has remained the backbone of India’s
economic growth. The weather related crisis such as drought, flood and cyclone has affected the agriculture production and ultimately the growth in overall economic activities. In 60s, the contribution of agriculture to GDP was around 50-55 percent. Over the period, the share of agriculture to GDP has declined drastically to around 20 percent. The share of industry has improved marginally. The share of services sector to GDP has increased significantly. However, it must be noted that agriculture still employs almost 60 percent of the

2
population. Besides, social problems such as poverty, inequality are widespread in rural areas. The benefits of ‘Green revolution’ have been limited to certain areas and there is an urgent need to innovate and implement the new techniques of farming in both existing and new areas (Exhibit 2).
Exhibit 2 : Services and industry driving the growth process
10
20
30
40
50
60
FY 60 FY 66 FY 72 FY 78 FY 84 FY 90 FY 96 FY 02
(Sha
re in
real
GD
P, p
erce
nt)
Industry Services Agriculture Source: GOI
"I put India on the top priority market among emerging markets."- Yuanquing Yang, Chairman, Lenovo
The gradual opening of the economy has definitely helped the Indian economy to mark its presence in the global growth map. In Asia, both India and China account for almost 60 percent of the growth. Since FY04 India has witnessed real growth above 8 percent, thus taking India to a new growth trajectory. During FY 07, India’s economy expanded by 9.4 percent. Globally, India is now the fastest growing economy after China. According to IMF estimates, India would clock a growth of 8.5 percent in 2007 far above the world growth of 5 percent. In fact, in terms of PPP (Purchasing Power Parity), India has overtaken Japan to become the third largest economy after China and US (Exhibit 3)

3
Exhibit 3: India- fastest growing country after China
0
2
4
6
8
10
12
World G-7 countries NewlyIndustrialised
Asia
China
(Rea
l GD
P gr
owth
, per
cent
)
2006 2007E 2008E Source: IMF
The New Economic Policy of 1991 included standard structural adjustment measures including the devaluation of the rupee, increase in interest rates, reduction in public investment and expenditure, reduction in public sector food and fertilizer subsidies, increase in imports and foreign investment in capital-intensive and high-tech activities, and abolition of the cash compensatory support for exports. Slowly but steadily India’s share in global merchandise trade has improved from meagre 0.5 percent (in early 1990s) to 1 percent (2005). The share of merchandise trade to GDP has increased substantially to almost 35 percent. In early 1990s, India had foreign reserves for hardly 3 months. The outward looking policy has accentuated the foreign reserves to US$ 170 bn in 2006 from US$ 5 bn in 1993. The huge pool of foreign reserves would help to manage not only rising imports but also external debt (Exhibit 4).

4
Exhibit 4: Rising foreign reserves
0
5
10
15
20
Dec
-92
Feb-
94
Apr
-95
Jun-
96
Aug
-97
Oct
-98
Dec
-99
Feb-
01
Apr
-02
Jun-
03
Aug
-04
Oct
-05
Dec
-06
0
55
110
165
220
Import cover of foreign reserves (# months) (LHS)
Foreign reserves (US $ bn) (RHS) Source: RBI
“23% of the Global workforce addition over the next five years will be from India” - Economist
Traditional emphasis on education, high skills and young population has given tremendous comparative advantage to make India powerhouse in IT and ITES. According to Science and Engineering Report 2006, 20,382 Indians received doctorate during 1983-2003 in United States. Annually, around 50,000 engineers are generated in India’s education system. Such a pool of talent, available both domestically as well as internationally, has been a source of both visibility and financial assets in terms of NRI deposits and private remittances. With increasing participation of working population, India would be one of the fastest growing young countries (Exhibit 5).

5
Exhibit 5: Fastest growing young country
10
25
40
55
70
1950 1960 1970 1980 1990 2000 2010 2020 2030 2040 2050
(Sha
re o
f wor
king
pop
ulat
ion
to to
tal p
opul
atio
n, p
erce
nt)
Source: UN
China
US
India
“FDI will continue to be encouraged and actively sought, particularly in the areas of infrastructure, high technology and exports”- P. Chidambaram, Finance Minister
The development of infrastructure is critical to keep the Indian economy on new growth trajectory. This is one area where there is a need for private sector and foreign investment to come in. Because of the long gestation period, and many social implications, the infrastructure sector competes unfavourably with manufacturing and many other sectors. For this, specific policies in this area are needed to make infrastructure attractive. Clearly, there is a wide gap between the potential demand for infrastructure for high growth and the available supply. This is the challenge placed before the economy, i.e. before the public and private sector and foreign investors. This can also be seen as an opportunity for a widening market and enhanced production.

6
Exhibit 6: Investment avenues in infrastructure
Sectoral Investments (Rs.bn)
Power generation,
4,100
Urban Infrastructure,
1,974
Railways, 3,000
Energy, 2,120
Airports, 400
Ports, 500
Highways, 2,200
Source: Planning Commision
“Finance is, as it were, the stomach of the country, from which all the other organs take their tone.”- William Gladstone, Former British PM
A well-developed financial system should improve the efficiency of financing decisions, favouring a better allocation of resources and thereby economic growth. The financial system is also particularly important in reallocating capital and thus providing the basis for the continuous restructuring of the economy that is needed to support growth. In recognition of the critical role of the financial markets, the initiation of the structural reforms in the early 1990s in India also encompassed a process of phased and coordinated deregulation and liberalisation of financial markets. Financial markets in India in the period before the early 1990s were characterised by administered interest rates, quantitative ceilings, statutory pre-emptions, captive market for government securities, and excessive reliance on central bank financing, pegged exchange rate, and current and capital account restrictions. As a result of various reforms, the financial markets have transited to a regime characterised by market-determined interest and exchange rates, price-based instruments of monetary policy, current account convertibility, phased capital account liberalisation and an auction-based system in the government securities market. Furthermore, various measures are underway to bring efficiency in the various aspects of financial market such as capital account convertibility, IPO grading, risk management, market for credit default swap.

7
Key Indicators of Financial Market Development
Price Stability
4
8
12
16
20
FY 9
2FY
93
FY 9
4FY
95
FY 9
6FY
97
FY 9
8FY
99
FY 0
0FY
01
FY 0
2FY
03
FY 0
4FY
05
FY 0
6FY
07
(per
cent
)
0
4
8
12
16
Bank Rate PLR (Max) Inflation (RHS) Source: GOI
PLR
Bank Rate
Inflation
Interest rate mechanism supported by price stability management has created investment friendly environment
Sound banking system
0
2
4
6
8
FY 00 FY 01 FY 02 FY 03 FY 04 FY 05 FY 06Non-performing assets (% to total assets) Source: RBI
India has one of the lowest NPAs among BRIC countries
8
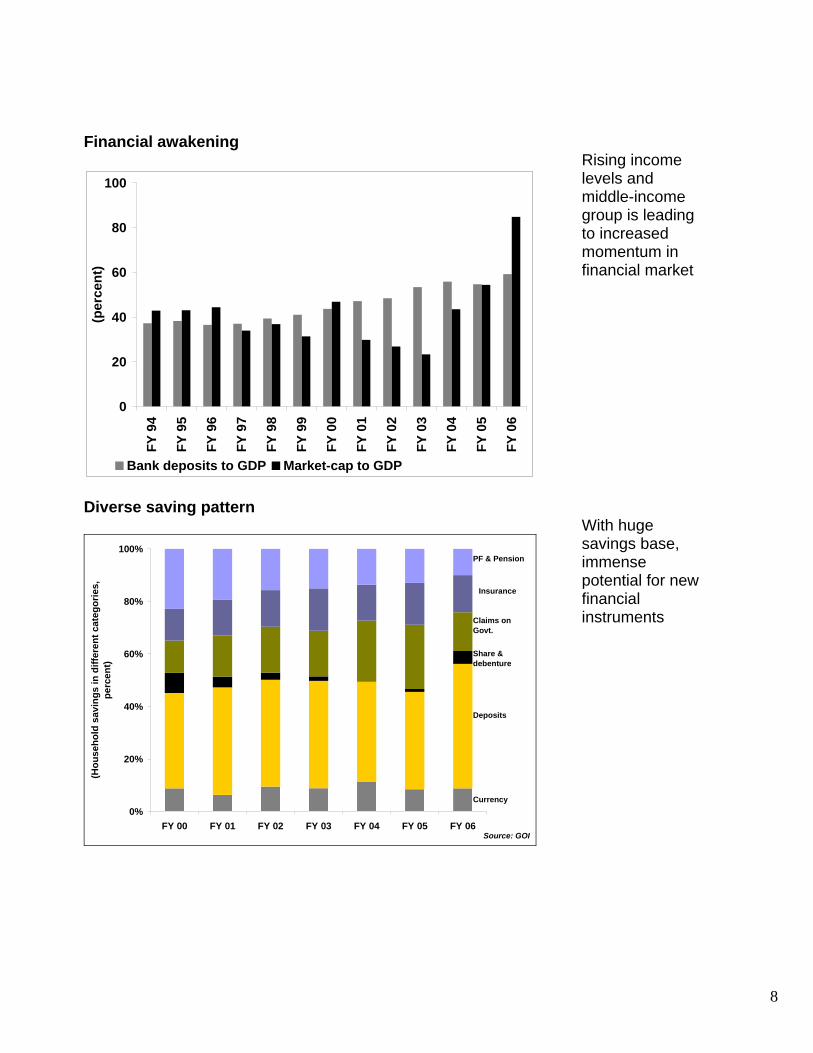
Financial awakening
0
20
40
60
80
100
FY 9
4
FY 9
5
FY 9
6
FY 9
7
FY 9
8
FY 9
9
FY 0
0
FY 0
1
FY 0
2
FY 0
3
FY 0
4
FY 0
5
FY 0
6
(per
cent
)
Bank deposits to GDP Market-cap to GDP
Rising income levels and middle-income group is leading to increased momentum in financial market
Diverse saving pattern
0%
20%
40%
60%
80%
100%
FY 00 FY 01 FY 02 FY 03 FY 04 FY 05 FY 06
(Hou
seho
ld s
avin
gs in
diff
eren
t cat
egor
ies,
pe
rcen
t)
Source: GOI
Currency
Deposits
Share & debenture
Claims on Govt.
Insurance
PF & Pension
With huge savings base, immense potential for new financial instruments

9
Growing penetration of MF industry The mutual fund industry’s contribution to the nation’s GDP (in terms of AUM) is on the rise. In 2006, Rs. 1 lakh crore was added to the total asset base. The current figure stands at Rs. 4.85 lakh crore or thereabouts. However, the asset under management for India is a mere 0.36% of the total world assets as on 31st march 2007.
Gross resource mobilisation by MFs
0%
20%
40%
60%
80%
100%
1999-00 2000-01 2001-02 2002-03 2003-04 2004-05 2005-06
Pvt Public UTISource: NSE
Public
Pvt
UTI
There is huge potential to enhance equity ownership
Growing middle class
14,958
16,130
17,258
18,742
19,512
21,357
22,487
25,046
0 5,000 10,000 15,000 20,000 25,000
FY 01
FY 00
FY 01
FY 02
FY 03
FY 04
FY 05
FY 06
Per capital personal disposable income (Rs) Source: GOI
Surveys indicate sharp increase in the rise of middle-high income group population

10
Foreign investors are bullish on Indian equity market
50
70
90
110
130
150
170
190
Jan-
05
May
-05
Sep-
05
Jan-
06
May
-06
Sep-
06
Jan-
07
May
-07
0
4
8
12
16
20
24
28
Average market turnover, Rs.billion (LHS)Share of FII activity in market turnover, percent (RHS) Source: SEBI
Underlying fundamentals of Indian economy makes India a preferred investment destination
Bond market yet to develop
0
1
2
3
4
5
6
Apr
-01
Dec
-01
Aug
-02
Apr
-03
Dec
-03
Aug
-04
Apr
-05
Dec
-05
Aug
-06
Apr
-07
4
5
6
7
8
9
10
Turnover in G-sec mkt (Rs.trn)-LHS 10 Yr yield - RHS Source: RBI
G-sec still remains under RBI’s control thus leading to task management at interest rate level
11
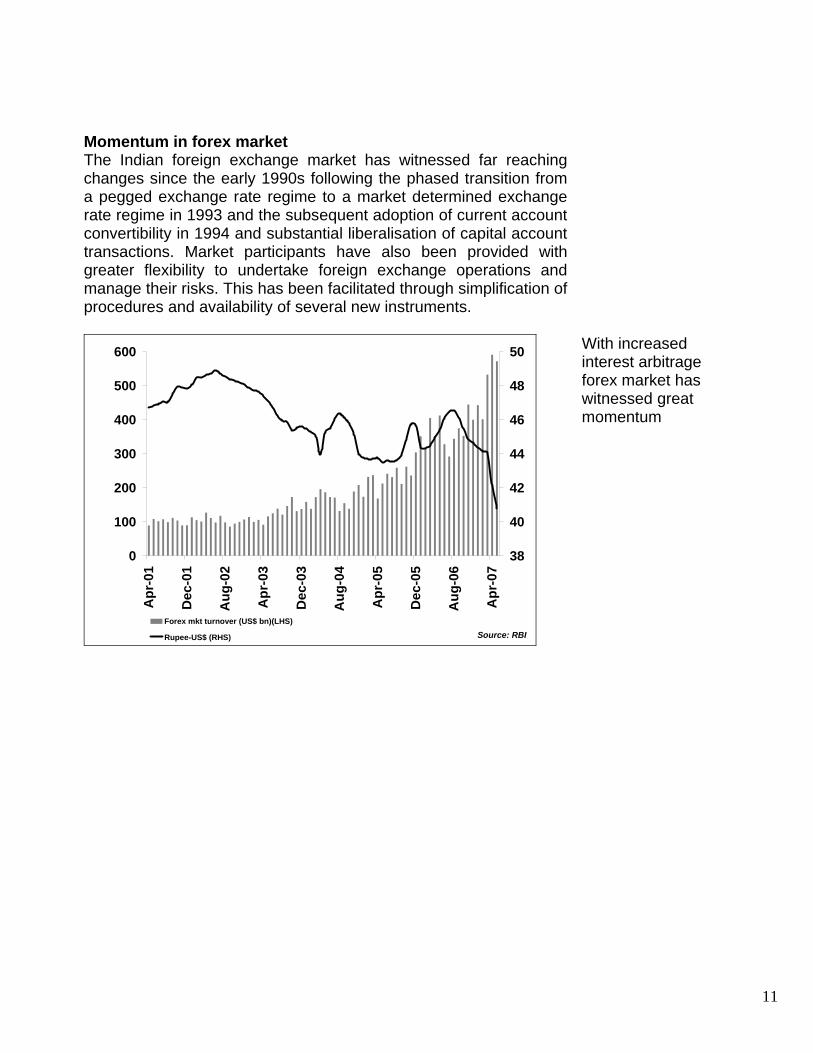
Momentum in forex market The Indian foreign exchange market has witnessed far reaching changes since the early 1990s following the phased transition from a pegged exchange rate regime to a market determined exchange rate regime in 1993 and the subsequent adoption of current account convertibility in 1994 and substantial liberalisation of capital account transactions. Market participants have also been provided with greater flexibility to undertake foreign exchange operations and manage their risks. This has been facilitated through simplification of procedures and availability of several new instruments.
0
100
200
300
400
500
600
Apr
-01
Dec
-01
Aug
-02
Apr
-03
Dec
-03
Aug
-04
Apr
-05
Dec
-05
Aug
-06
Apr
-07
38
40
42
44
46
48
50
Forex mkt turnover (US$ bn)(LHS)
Rupee-US$ (RHS) Source: RBI
With increased interest arbitrage forex market has witnessed great momentum

12
New areas of investment
0
100
200
300
400
500
Apr
-04
Aug
-04
Dec
-04
Apr
-05
Aug
-05
Dec
-05
Apr
-06
Aug
-06
Dec
-06
Apr
-07
Average daily turnover in derivative market (Rs.bn) Source: NSE
• One of the highest returns in derivatives market globally.
• Trading in
commodities is also picking up substantially.The MCX volumes grew 123% in 2006.
Corporate on roll
2
4
6
8
10
12
Mar
-01
Nov
-01
Jul-0
2
Mar
-03
Nov
-03
Jul-0
4
Mar
-05
Nov
-05
Jul-0
6
Mar
-07
Profit Margins (%) (a sample of ~ 4000 cos.)
Better corporate governance, best management practices are helping India Inc to improve the margins

13
Increased M & A activities
100
600
1100
1600
FY 04 FY 05 FY 06 FY 070
800
1600
2400
Mergers & acquisitions (number) (LHS) Acquisition (Rs. Bn) (RHS) Source: CMIE
Backed by better financial performance, Indian companies are not only acquiring domestic companies but overseas companies too. This necessitates strong banking system
Significant rise in FDI inflows
0
5
10
15
20
FY 9
1FY
92
FY 9
3FY
94
FY 9
5FY
96
FY 9
7FY
98
FY 9
9FY
00
FY 0
1FY
02
FY 0
3FY
04
FY 0
5FY
06
FY 0
7
FDI inflows, gross (US $ bn) Source: GOI
Strong economic fundamentals and better corporate performance is attracting huge foreign investments

14
Financial market integration Financial market reforms in India have enabled a greater integration of various segments of the financial market, reducing arbitrage opportunities, achieving higher level of efficiency in market operation of intermediaries and increasing efficacy of monetary policy in the economy. Growing integration of financial markets beginning 2000 could be gauged from cross correlation among various market interest rates. The correlation structure of interest rates reveals several notable features of integration of specific market segments.

15
Competing for future!
• Globally, India’s FDI attractiveness is the highest across the sectors
• Innovation-another factor, where India has advantage over its peers
• However, socio-political structure blocks Ease of Doing Business in India

16
India: In juxtapose
Gross Domestic Savings (as % of GDP)
43.0
32.4
31.7
28.7
18.3
17.0
13.7
47.3China
Malaysia
India
South Korea
Indonesia
Philippines
Sri Lanka
Pakistan
44.9
33.8
29.8
28.4
24.6
21.8
20.7
14.3
0 10 20 30 40 50
China
India
South Korea
Sri Lanka
Indonesia
Pakistan
Malaysia
Philippines
Capital formation (as % of GDP)
Merchandise Exports (FOB) (% growth) 2006
24.7
17.5
15.4
14.4
13.9
12.3
10.3
27.2China
India
Indonesia
Pakistan
South Korea
Philippines
Sri Lanka
Malaysia
5.9
8.6
10.8
18.4
19.7
19.9
31.5
39.4
0 10 20 30 40
Indonesia
Philippines
Malaysia
South Korea
Sri Lanka
China
India
Pakistan
Merchandise Imports CIF (growth %)-2006
17
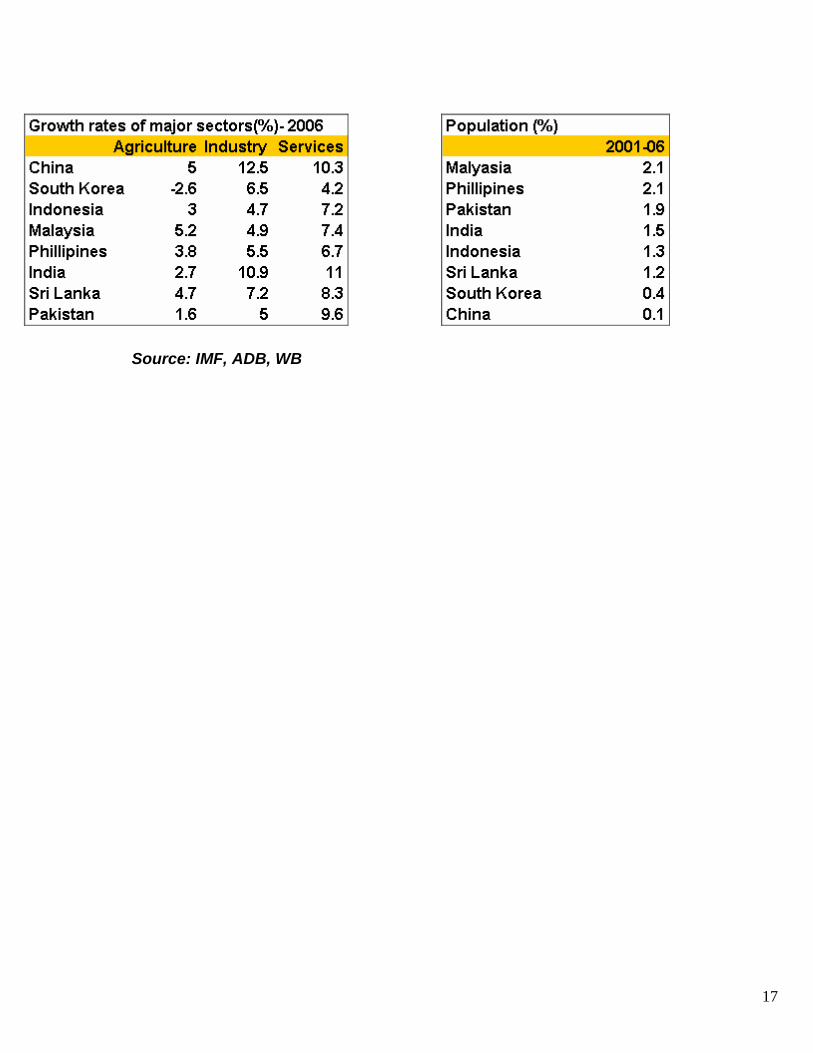
Source: IMF, ADB, WB

18
Major Economic Indicators
1990 2000 2001 2002 2003 2004 2005 2006 2007E 2008E Real GDP Growth-(%) Brazil -4.20 4.30 1.30 2.70 1.10 5.70 2.90 3.70 4.40 4.20 China 3.80 8.40 8.30 9.10 10.00 10.10 10.40 10.70 10.00 9.50 India 6.00 5.30 4.10 4.30 7.30 7.80 9.20 9.20 8.40 7.80 Indonesia 7.20 5.40 3.60 4.50 4.80 5.00 5.70 5.50 6.00 6.30 Japan 5.20 2.90 0.20 0.30 1.40 2.70 1.90 2.20 2.30 1.90 Korea 9.20 8.50 3.80 7.00 3.10 4.70 4.20 5.00 4.40 4.40 Pakistan 4.50 4.30 2.00 3.20 4.90 7.40 8.00 6.20 6.50 6.50 Phillipines 3.00 6.00 1.80 4.40 4.90 6.20 5.00 5.40 5.80 5.80 Russia n/a 10.00 5.10 4.70 7.30 7.20 6.40 6.70 6.40 5.90 Singapore 9.20 10.10 -2.40 4.20 3.10 8.80 6.60 7.90 5.50 5.70 South Africa
-0.30 4.20 2.70 3.70 3.10 4.80 5.10 5.00 4.70 4.50
Sri Lanka 6.20 6.00 -1.50 4.00 6.00 5.40 6.00 7.50 7.00 7.00 Turkey 9.30 7.40 -7.50 7.90 5.80 8.90 7.40 5.50 5.00 6.00 United Kingdom
0.70 3.80 2.40 2.10 2.70 3.30 1.90 2.70 2.90 2.70
United States
1.90 3.70 0.80 1.60 2.50 3.90 3.20 3.30 2.20 2.80
GDP Per capita –Current prices(US $) Brazil 3,464 3,762 3,190 2,867 3,085 3,654 4,789 5,717 6,220 6,523 China 339 946 1,038 1,132 1,270 1,486 1,716 2,001 2,310 2,574 India 378 455 461 473 543 618 712 797 871 942 Indonesia 699 807 773 928 1,100 1,188 1,309 1,640 1,812 1,950 Japan 24,560 36,811 32,234 30,809 33,180 36,076 35,672 34,188 33,668 34,865 Korea 6,154 10,891 10,177 11,504 12,711 14,181 16,444 18,392 19,485 20,634 Pakistan 443 539 509 502 563 655 728 830 893 960 Phillipines 718 994 914 966 982 1,038 1,154 1,345 1,503 1,591 Russia n/a 1,768 2,096 2,379 2,975 4,104 5,323 6,856 8,209 9,508 Singapore 12,091 23,077 20,692 21,113 22,066 25,330 26,879 29,917 32,506 34,461 South Africa
3,039 2,986 2,633 2,440 3,622 4,666 5,160 5,384 5,680 6,036
Sri Lanka 494 884 841 870 949 1,031 1,200 1,355 1,549 1,704 Turkey 2,698 2,995 2,126 2,675 3,463 4,289 5,062 5,408 5,882 6,113 United Kingdom
17,404 24,542 24,286 26,541 30,470 36,019 37,042 39,213 43,735 46,259
United States
23,208 34,771 35,491 36,311 37,641 39,841 41,960 44,190 45,490 47,160

19
1990 2000 2001 2002 2003 2004 2005 2006 2007E 2008E
GDP-PPP based (US $ billion) Brazil 797 1,269 1,317 1,366 1,402 1,513 1,594 1,701 1,805 1,912 China 1,507 4,960 5,500 6,106 6,859 7,766 8,817 9,984 11,207 12,518 India 1,148 2,427 2,587 2,744 3,004 3,337 3,730 4,159 4,555 4,973 Indonesia 346 625 663 705 754 815 886 960 1,038 1,129 Japan 2,351 3,259 3,350 3,413 3,548 3,732 3,946 4,171 4,346 4,519 Korea 344 761 809 880 927 998 1,069 1,156 1,229 1,307 Pakistan 149 268 280 294 315 348 387 423 462 502 Phillipines 184 305 318 338 362 395 428 462 497 537 Russia n/a 1,038 1,117 1,190 1,304 1,438 1,576 1,727 1,877 2,032 Singapore 38 97 97 102 108 120 132 145 155 164 South Africa
284 417 439 463 487 523 566 606 644 683
Sri Lanka 34 70 71 75 81 88 96 104 113 122 Turkey 252 439 416 457 493 553 611 661 708 758 United Kingdom
1,013 1,578 1,653 1,717 1,800 1,912 2,006 2,122 2,225 2,327
United States
5,698 9,638 9,944 10,279 10,761 11,499 12,229 13,021 13,675 14,385
GDP-(PPP based) share in world total (%) Brazil 2.97 2.82 2.79 2.76 2.67 2.67 2.60 2.57 2.55 2.53 China 5.61 11.02 11.65 12.34 13.06 13.68 14.39 15.08 15.83 16.55 India 4.27 5.39 5.48 5.55 5.72 5.88 6.09 6.28 6.43 6.58 Indonesia 1.29 1.39 1.40 1.42 1.44 1.44 1.45 1.45 1.47 1.49 Japan 8.75 7.24 7.09 6.90 6.76 6.57 6.44 6.30 6.14 5.98 Korea 1.28 1.69 1.71 1.78 1.77 1.76 1.75 1.75 1.74 1.73 Pakistan 0.55 0.60 0.59 0.60 0.60 0.61 0.63 0.64 0.65 0.66 Philippines 0.69 0.68 0.67 0.68 0.69 0.70 0.70 0.70 0.70 0.71 Russia n/a 2.31 2.37 2.41 2.48 2.53 2.57 2.61 2.65 2.69 Singapore 0.14 0.22 0.21 0.21 0.21 0.21 0.22 0.22 0.22 0.22 South Africa
1.06 0.93 0.93 0.94 0.93 0.92 0.92 0.92 0.91 0.90
Sri Lanka 0.13 0.16 0.15 0.15 0.15 0.16 0.16 0.16 0.16 0.16 Turkey 0.94 0.98 0.88 0.92 0.94 0.97 1.00 1.00 1.00 1.00 United Kingdom
3.77 3.51 3.50 3.47 3.43 3.37 3.28 3.20 3.14 3.08
United States
21.20 21.41 21.06 20.78 20.49 20.25 19.96 19.66 19.31 19.02

20
1990 2000 2001 2002 2003 2004 2005 2006 2007E 2008E
Current account balance (US $ bn) Brazil -3.79 -24.23 -23.22 -7.64 4.18 11.68 14.19 13.65 8.94 3.26 China 12.00 20.52 17.41 35.42 45.88 68.66 160.82 238.54 303.65 358.62 India -7.89 -4.60 1.41 7.06 8.77 0.78 -6.85 -19.30 -23.77 -24.57 Indonesia -3.20 7.99 6.90 7.82 8.11 1.56 0.31 9.73 7.51 5.67 Japan 43.94 119.61 87.79 112.61 136.24 172.07 165.69 170.36 166.59 159.14 Korea -2.01 12.25 8.03 5.39 11.95 28.17 14.98 6.09 3.08 -0.17 Pakistan -1.38 -0.22 0.33 2.83 4.06 1.81 -1.53 -5.00 -5.64 -5.60 Philippines -2.69 -2.23 -1.76 -0.35 0.28 1.63 1.96 3.35 2.83 2.68 Russia n/a 46.84 33.94 29.12 35.41 58.59 83.35 95.60 72.90 67.80 Singapore 3.12 10.72 12.00 12.09 22.33 21.54 28.61 36.29 39.64 41.94 South Africa
1.55 -0.17 0.33 0.92 -1.81 -6.92 -9.18 -16.42 -17.42 -17.39
Sri Lanka -0.38 -1.07 -0.18 -0.24 -0.07 -0.64 -0.66 -1.10 -1.48 -1.75 Turkey -2.56 -9.82 3.39 -1.52 -8.04 -15.60 -22.71 -31.46 -31.39 -30.83 United Kingdom
-39.77 -37.65 -31.51 -24.79 -24.39 -35.41 -53.73 -68.12 -81.40 -87.98
United States
-78.97 -415.15 -388.96 -472.44 -527.52 -665.29 -791.50 -856.66 -834.62 -866.15

21
Current account balance (% of GDP) Brazil -0.70 -3.80 -4.20 -1.50 0.80 1.80 1.60 1.30 0.80 0.30 China 3.10 1.70 1.30 2.40 2.80 3.60 7.20 9.10 10.00 10.50 India -2.50 -1.00 0.30 1.40 1.50 0.10 -0.90 -2.20 -2.40 -2.30 Indonesia -2.50 4.80 4.30 4.00 3.50 0.60 0.10 2.70 1.80 1.30 Japan 1.40 2.60 2.10 2.90 3.20 3.70 3.60 3.90 3.90 3.60 Korea -0.80 2.40 1.70 1.00 2.00 4.10 1.90 0.70 0.30 0.00 Pakistan -2.90 -0.30 0.50 3.90 4.90 1.80 -1.40 -3.90 -4.00 -3.60 Philippines -6.10 -2.90 -2.50 -0.50 0.40 1.90 2.00 2.90 2.10 1.90 Russia n/a 18.00 11.10 8.40 8.20 9.90 10.90 9.80 6.20 5.00 Singapore 8.50 11.60 14.00 13.70 24.20 20.10 24.50 27.50 27.10 26.60 South Africa
1.40 -0.10 0.30 0.80 -1.10 -3.20 -3.80 -6.40 -6.40 -6.00
Sri Lanka -4.70 -6.50 -1.10 -1.40 -0.40 -3.20 -2.80 -4.10 -4.80 -5.10 Turkey -1.70 -5.00 2.40 -0.80 -3.30 -5.20 -6.30 -8.00 -7.30 -6.80 United Kingdom
-4.00 -2.60 -2.20 -1.60 -1.30 -1.60 -2.40 -2.90 -3.10 -3.10
United States
-1.40 -4.20 -3.80 -4.50 -4.80 -5.70 -6.40 -6.50 -6.10 -6.00
1990 2000 2001 2002 2003 2004 2005 2006 2007E 2008E Population (Persons millions) Brazil 147 171 174 176 179 182 184 187 189 192 China 1,143 1,267 1,276 1,285 1,292 1,300 1,308 1,314 1,321 1,327 India 835 1,015 1,029 1,046 1,062 1,079 1,096 1,113 1,130 1,147 Indonesia 180 205 208 211 214 216 219 222 225 228 Japan 123 127 127 127 128 128 128 128 128 128 Korea 43 47 47 48 48 48 48 48 48 48 Pakistan 108 138 140 143 147 150 153 155 158 161 Philippines 62 76 78 80 81 84 85 87 89 90 Russia 148 147 146 145 145 144 144 143 142 141 Singapore 3 4 4 4 4 4 4 4 4 5 South Africa
37 45 45 46 46 46 47 47 48 48
Sri Lanka 16 18 19 19 19 19 20 20 20 20 Turkey 55 66 67 68 69 71 72 73 74 75 United Kingdom
57 59 59 59 60 60 60 61 61 61
United States
250 282 285 288 291 294 297 300 303 306
Source: IMF